Lessons learnt in Saudi Arabia with Solar PV...
38
Lessons learnt in Saudi Arabia with Solar PV system performance under desert conditions
-
Upload
truongtuyen -
Category
Documents
-
view
216 -
download
0
Transcript of Lessons learnt in Saudi Arabia with Solar PV...

Lessons learnt in Saudi Arabia with Solar
PV system performance under desert
conditions

Campus Solar Roof Top
2
Solar PV
Solar Thermal

Campus Solar Roof Top 2MWp PV
3
• Mono Crystalline Silicon cells (Efficiency ~18.4 %)
• Simulated annual generation of 3,281 MWh
• First large scale grid-connected, roof top, solar power plant in Saudi Arabia
• Special Operating conditions
• Mono-crystalline performance in High Temperature environment
• 9,300 modules 215 Wp modules over 11,600 m2
• Saves 1,700 tonne of carbon emissions annually

KAUST - CMOR Solar Roof Top 320KW PV
4
• 320 KW Power Generation facility
• 1,072 300 Wp modules over
1,950 m2

KAUST - Campus Solar Roof Top 2MW PV
5


2012 Campus PV
Energy
Generation
566.9
MWH
567.5
MWH
Building 4
Building
3
65 MWH
CMOR 1020
92.8 101.2
130.8 145.8
148.1
180.9 169.6
156.4 142.1 136.7
117.0 111.6
0
20
40
60
80
100
120
140
160
180
200
Me
ga
wa
tt H
ou
rs
2013 Building 4 PV Energy Generation (1633.0 MWh)
92.3 101.7
129.9 144.0
145.1
180.7 170.0
156.6 140.0 137.7
116.5 112.0
0
20
40
60
80
100
120
140
160
180
200
Me
ga
wa
tt H
ou
rs
2013 Building 3 PV Energy Generation (1626.3 MWh)
4,393.8 Megawatt Hours of
supplemental energy has been
added to the Campus Electrical
power grid with the
implementation of the Campus
PV Energy Generation Program
in 2012
A purchased energy cost
avoidance of $175,760 over 17
months, assuming 15 Halala per
KWh
Campus PV Energy Generation

124
147
261
290 293
362
340
313
282 274
235
259
244 244
100
150
200
250
300
350
400
January Febuary March April May June July August September October November December
Onsite Renewable Energy (MWh) - Campus 2013
Onsite Renewable Energy - Campus 2013 Onsite Renewable Energy - Campus 2014 Onsite Renewable Energy - Campus 2015
Onsite Renewable Energy (MWh) - Campus 2013

PV Plant O&M in Desert Areas

• Analyze site location (Need for cleaning)
• (Starts before system design)
• Soiling rate and content
• Wind, Temperature, Irradiation, Humidity
• Nearby pollution (traffic, construction, industry, agricultural
activities)
• System Characteristics
• (e.g. roof vs. ground, size, technology, configuration, tilt,
height, trackers, surface material)
• Number of arrays, meters, inverters
• Evaluation of available technical support from suppliers
Steps for Devising and O&M Plan

• Logistical challenges
• Analyze cost of energy, contractual obligations
• Warranty terms and conditions
• Desired level of monitoring
• Analyze cleaning frequency, cleaning method and
cost of cleaning
• Resources allocation and budgeting
• Define Key Performance Indicators (KPI’s)
• Implement Monitoring
• Contingency plans
Steps for Devising and O&M Plan

• Key Performance Indicators (KPI’s)
• Performance Ratio (PR)
• Plant Availability
• Actual Generation vs. Predicted
• Energy losses
• Unscheduled Outages
What defines a successful O&M plan

Optimized Cleaning Frequency and
Procedure (Manual)
• Finding the optimal cleaning
frequency and method
• Finding the optimal cleaning
procedure
• Reduce the O&M costs of running
the system and the overall LCOE
for a faster ROI
KAUST King Abdullah
University of Science and
Technology 15

O&M Study Case – KAUST 2MWp system
• The operating team consists of one technician/supervisor and 4
workers
• Cleaned once every 6 days
• Cleaning Procedure:
• The roof top is divided into 6 sections
• Each day one section is cleaned,
• Cleaning is done by a water hose, first cleaning round with soap
(first 6 days), and the next with water only
16
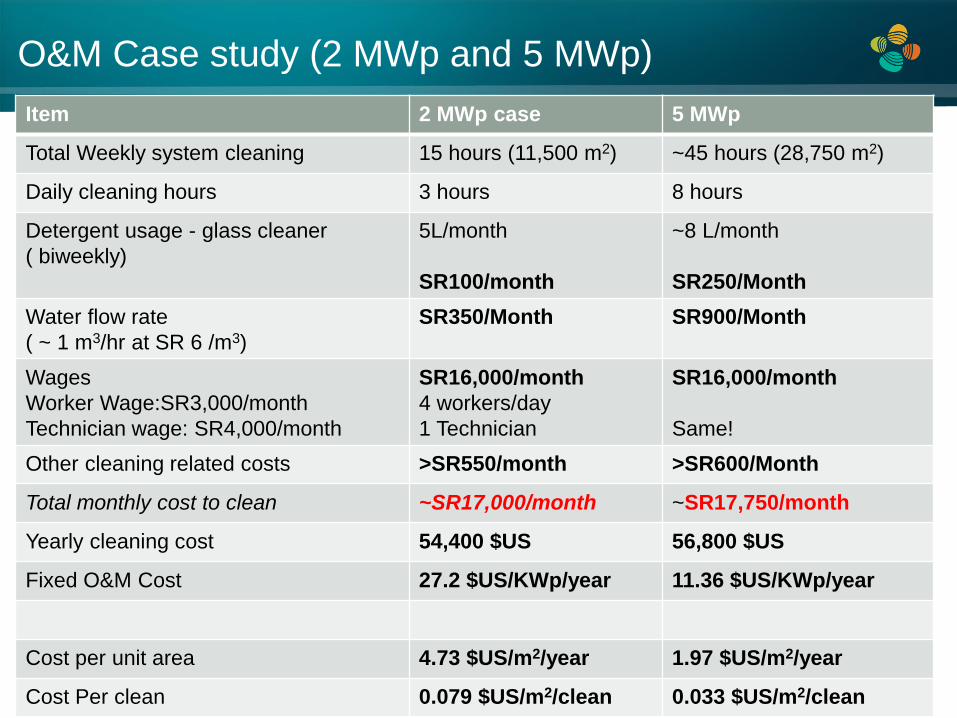
Item 2 MWp case 5 MWp
Total Weekly system cleaning 15 hours (11,500 m2) ~45 hours (28,750 m2)
Daily cleaning hours 3 hours 8 hours
Detergent usage - glass cleaner
( biweekly)
5L/month
SR100/month
~8 L/month
SR250/Month
Water flow rate
( ~ 1 m3/hr at SR 6 /m3)
SR350/Month SR900/Month
Wages
Worker Wage:SR3,000/month
Technician wage: SR4,000/month
SR16,000/month
4 workers/day
1 Technician
SR16,000/month
Same!
Other cleaning related costs >SR550/month >SR600/Month
Total monthly cost to clean ~SR17,000/month ~SR17,750/month
Yearly cleaning cost 54,400 $US 56,800 $US
Fixed O&M Cost 27.2 $US/KWp/year 11.36 $US/KWp/year
Cost per unit area 4.73 $US/m2/year 1.97 $US/m2/year
Cost Per clean 0.079 $US/m2/clean 0.033 $US/m2/clean
O&M Case study (2 MWp and 5 MWp)

• Cleaning brushes and other consumables (SR500/year)
• Pyranometers and instruments calibration (??)
• Replacement of damaged parts (??)
• Monitoring and data connectivity (SR300/Month)
• Other O&M activities:
• Electrical testing
• Monitoring, networking and data administration
• Ground maintenance
• Rack, foundations, and solar equipment inspections
Other O&M related costs

PV O&M
Preventative Maintenance:
- Panel Cleaning
- Ground Management
- Wildlife prevention
- Water Drainage
- Retro-commissioning
- Data collection and
monitoring maintenance
- Power conversion system
maintenance
- Annual inspection may
suffice for warrantee and
insurance compliance
Corrective Maintenance:
- On-site monitoring
- Incident/performance driven
(critical and non-critical)
- Warranty enforcement
Predictive Maintenance
- Spare parts
- Planned equipment
replacement
- Weather forecasting

O&M Costs for different Technologies
O&M Cost ($/KW/Year) Fixed Tiled C-Si Fixed Tilt CdTe Fixed-Tilt a-Si Tilted Single-Axis Tracking c-Si Singled-Axis Tracking C-Si
Scheduled Maintenance/Cleaning 20$ 25$ 25$ 30$ 30$
Unscheduled Maintenance 2$ 2$ 2$ 5$ 5$
Inverter replacement Reserve 10$ 10$ 10$ 10$ 10$
Subtotal O&M 32$ 37$ 37$ 45$ 45$
Insurance, Property Taxes, Owner's Costs 15$ 15$ 15$ 15$ 15$
Total O&M 47$ 52$ 52$ 60$ 60$
0
10
20
30
40
50
60
70
Fixed Tiled C-Si Fixed Tilt CdTe Fixed-Tilt a-Si Tilted Single-AxisTracking c-Si
Singled-AxisTracking C-Si
O&
M C
ost
($/K
W/Y
ear)
System Type
O&M costs for different system types
Insurance, Property Taxes, Owner's Costs
Inverter replacement Reserve
Unscheduled Maintenance
Scheduled Maintenance/Cleaning
Source: Addressing Solar PV O&M Challenges, NREL

PV Plant Monitoring

Field Performance Indicators
• Efficiency = Energy out / Energy in
• Device
• Area
• The solar resources
• Maximum Power point Pmax
• Performance Ratio (Actual vs. Simulated)
• Specific Yield (Energy Generated/ P max)
Measurement Challenges!!

Plant Monitoring
• Important for high performance
• Immediate detection of plant issues
• Affected by:
• The atmosphere
• Geographical location
• Altitude
• Sources of errors:
• Total Irradiance
• Spectral Irradiance
• Spatial Uniformity
• Temporal Instability
Monitoring is instrumental!
Need Continuous Measurements over extended periods of time before construction

Another way to monitor soiling

Performance degradation due to Soiling

How big is the dust problem?
26
• Technology specific
• Location specific
• 10-15% efficiency loss in one month of no
cleaning
• 5-7.5% unavoidable energy loss of power
plant
• The decrease in solar energy efficiency due
to dust storms was measured to be 60%.
• Dust effect on performance varies per
location and per technology
• Needed models for recommended frequency
of cleaning

• Incident Driven:
• Immediately after dust episodes (dust
storms, dusty weather, light rain)
• Regular Cleaning
• Frequency: Every 1-3 weeks (depending
on the case)
• No necessarily uniform across the
power plant
Cleaning Scheduling
• Cleaning Frequency calculation
• Site Specific
• Technology Specific
• Plant Specific (Tilt angle, orientation)
• Non-uniformity across the plant
• Seasonal change
• Based on cost of cleaning
• Cost of Energy
• Accepted tolerance to loss

Effect of efficiency on Cleaning cost
• Dust accumulation is a surface property
• For the same peak power lower efficiency modules will require
more cleaning
• Efficiency affects on LCOE:
• Higher efficiency lower BOS cost (Not the scope of this study)
• Higher efficiency lower O&M cost

Plant O&M Cost Optimization
0
5
10
15
20
25
30
35
0 5 10 15 20 25 30 35
LC
OE
($cen
t/K
wh
)
Cleaning Cycle (Days) 5MWp System
Effect of Cleaning Frequency on LCOE
$1
2$
3$
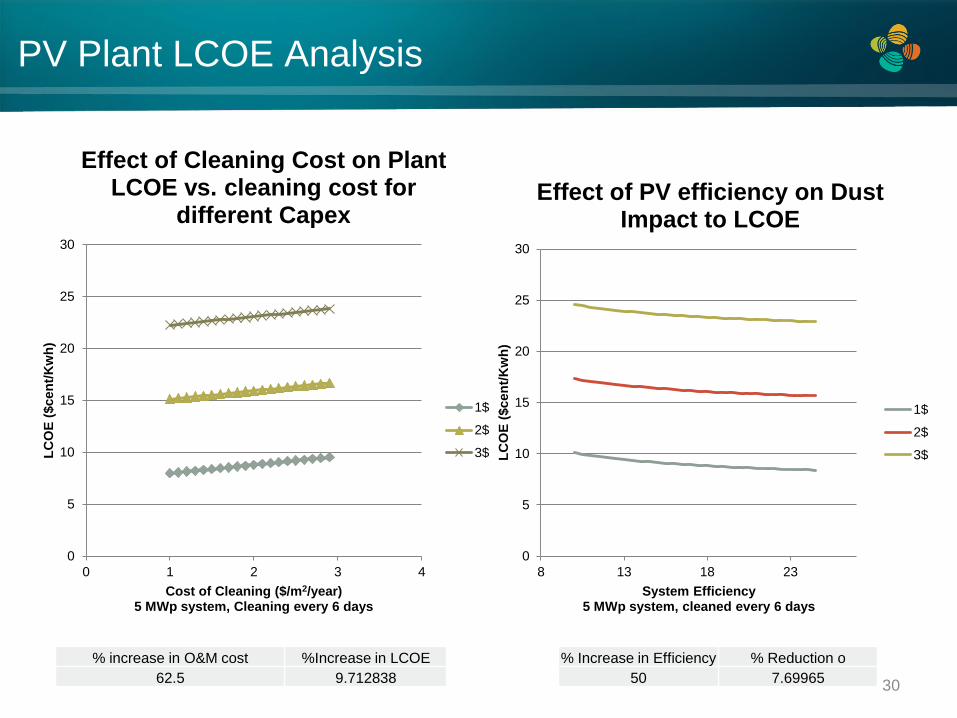
PV Plant LCOE Analysis
30
0
5
10
15
20
25
30
0 1 2 3 4
LC
OE
($cen
t/K
wh
)
Cost of Cleaning ($/m2/year) 5 MWp system, Cleaning every 6 days
Effect of Cleaning Cost on Plant LCOE vs. cleaning cost for
different Capex
1$
2$
3$
% increase in O&M cost %Increase in LCOE
62.5 9.712838
0
5
10
15
20
25
30
8 13 18 23
LC
OE
($cen
t/K
wh
)
System Efficiency 5 MWp system, cleaned every 6 days
Effect of PV efficiency on Dust Impact to LCOE
1$
2$
3$
% Increase in Efficiency % Reduction o
50 7.69965

• 60% losses were recorded after a sand storm incident
• Translates to a 30% energy production loss for a week
• Results in 21 MWh loss (e.g.. in case of October for the 2MWp system)
• Frequency of dust storms needs to be predicted and considered
in the financial model
• Plant must be cleaned directly after dust storm incident
What about Dust Storms?

• Dust Particles natural
• Dust particles due to human activities (traffic, agricultural and
construction activities)
• Salt Particulates
• Pollen from Plants and traffic
• Dirt from birds
• Main Ingredients of Dust:
• Oxide metals: SiO2, Al2O3, FeO, CaO
• Carbonates: CaCO3, MgCO3
• Heavy metals: Lead, Iron, Arsenic, Manganese, Vanadium,
Nickel, Chromium, etc.
Potential surface impurities

PV plant Cleaning Methods
KAUST King Abdullah University of Science and Technology 33

Cleaning device (Robotic)
KAUST King Abdullah University of Science and Technology 34
• Emerging Dry-type cleaning/dusting robot for PV panels
• Using minimal amounts of water for cleaning PV panels
• Aimed for high reliability long life operation
• with minimal maintenance
• Reduces the O&M costs

O&M Plan goes wrong!
35

Safety and Personnel Protective
Equipment (PPE)
• Specialized killed labor is needed
• Proper training should be provided
• Workers should use all appropriate PPE:
• Gloves
• Sun caps/Helmets
• Sunglasses
• Face covers for blocking the sun
• Anti-slip shoes
• Safety Harness for working at heights
King Abdullah University of Science and Technology 36

King Abdullah University of Science and Technology 37
THANK YOU!
Tamer Shahin
Project Engineer
Economic and Technology Development - KAUST

References
• http://nextphasesolar.com/wp-content/uploads/2011/12/NREL-epri-OM-best-practices.pdf
• http://alectris.com/implementing-a-successful-om-strategy-for-solar-pv-2/
• http://nextphasesolar.com/wp-content/uploads/2011/12/NREL-epri-OM-best-practices.pdf
• http://www.nrel.gov/analysis/tech_lcoe.html
• Impact of dust on solar photovoltaic (PV) Performance: Research Status, Challenges and
recommendations, Monto Mani, Rohti Pillai
• On-site PV characterization and the effect of soiling on their performance, Soteris A. Kalogirou, Rafaela
Agathokleous, Gregoris Panayiotou
• Best Practices for Mitigating Soiling Risk on PV Power Plants, A. AlDowsari, R. Bkayrat, H. AlZain, T.
Shahin
• Effect of soiling on Photovoltaic modules, Reinhart Appels, Buvaneshwari Lefevre
• Impact of cleaning using water and surfactants on the performance of Photovoltaic Panels, K.A.
Moharram, M.S. Abd-Elhady, H.A. Kandil, H. El-Sherif
• Review of Self-cleaning method for solar cell array, Gaofa He, Chuande Zhou, Zelun Li
• Addressing Solar PV O&M Challenges, NREL
• RISKS AND OPPORTUNITIES IN THE OPERATION OF LARGE SOLAR PLANTS, Solar POWER-
GEN 2013
King Abdullah University of Science and Technology 38