Adding Photovoltaics to the Saudi Power … Photovoltaics to the Saudi Power System: What are the...
28
Adding Photovoltaics to the Saudi Power System: What are the Costs of Intermittency? Amro M. Elshurafa and Walid Matar November 2016/ KS-1660-DP54A
Transcript of Adding Photovoltaics to the Saudi Power … Photovoltaics to the Saudi Power System: What are the...

1Adding Photovoltaics to the Saudi Power System: What are the Costs of Intermittency?
Adding Photovoltaics to the Saudi Power System: What are the Costs of Intermittency?
Amro M. Elshurafa and Walid MatarNovember 2016/ KS-1660-DP54A

2Adding Photovoltaics to the Saudi Power System: What are the Costs of Intermittency? 2
About KAPSARC
Legal Notice
The King Abdullah Petroleum Studies and Research Center (KAPSARC) is a non-profit global institution dedicated to independent research into energy economics, policy, technology, and the environment across all types of energy. KAPSARC’s mandate is to advance the understanding of energy challenges and opportunities facing the world today and tomorrow, through unbiased, independent, and high-caliber research for the benefit of society. KAPSARC is located in Riyadh, Saudi Arabia.
© Copyright 2016 King Abdullah Petroleum Studies and Research Center (KAPSARC). No portion of this document may be reproduced or utilized without the proper attribution to KAPSARC.

3Adding Photovoltaics to the Saudi Power System: What are the Costs of Intermittency?
Intermittent generation from wind or photovoltaics (PV) imposes a cost on the power systems in which they are deployed. These costs vary regionally due to different fuel costs and ramping flexibility of existing grid capacities. With 2015 as a reference year, we examine the costs of PV intermittency and
costs of integration to power utilities in Saudi Arabia, using a least-cost approach for the power utilities. The operational facets of PV integration to grid operators will be more pronounced with higher PV penetration, so, to focus on system operation, we exclude the capital costs. The excess of the price paid to new PV generators over the current average consumer tariff would also have to be covered by the utility, and will depend on the details of the power purchase contracts.
We define intermittency costs as the costs of ramping and maintaining spinning reserves. Integration costs are the sum of intermittency costs, plus the costs of grid upgrades that are needed when renewable deployment exceeds existing grid capacity.
The gross cost of intermittency, excluding any benefits attained from PV operation, rises to approximately 1.3 cents per kilowatt-hour (¢/kWh) of energy provided by PV when 20 GW of PV capacity are installed.
At low levels of penetration, renewables may impose negligible cost or even confer net benefits. However, above a certain level, the costs will outweigh the benefits – what we term the ‘‘Operational Blend Wall.’’
Adding up to 11 GW of PV generation capacity in some regions achieves lower system operating costs compared to a case without PV addition. Beyond 11 GW, costs begin to outweigh benefits, and the net cost to the power system increases by 0.04 ¢/kWh at 20 GW of PV deployment. This compares to an average cost of supply in the current power system of 1.61 ¢/kWh.
This operational blend wall of 11 GW is a function of overall system demand and the price of fuels displaced by PV electricity. If electricity prices were to rise to cover the integration costs, any resulting reduction in electricity use would reduce the blend wall. Similarly, increasing fuel prices would increase the blend wall.
Key Points

4Adding Photovoltaics to the Saudi Power System: What are the Costs of Intermittency?
Executive Summary
All utilities experience costs of intermittency when non-dispatchable resources (particularly wind and PV) are incorporated
into their power systems. However, the specifics of these costs depend on the regional generation mix and its ramping flexibility, load profile and natural resources. In this paper, we explore the costs associated with PV intermittency in Saudi Arabia.
To do this, we apply the KAPSARC Energy Model (KEM) for Saudi Arabia for a long-run 2015 year (KAPSARC 2016 and Matar et al. 2015). Long-run means we take annualized capital costs for investment and consider that the power sector is able to make investment decisions by taking a long-term view. KEM is a bottom-up model covering six supply-side sectors in the Saudi energy economy and, within these, the electricity sector works toward minimizing its total system cost. The model considers the low fuel prices paid by Saudi utilities and the characteristics of existing power capacity while, simultaneously, accounting for the activities of the other sectors modeled.
We have incorporated in the model the costs of ramping existing thermal power plants, as well as the costs of fuel and operation that are attributed to maintaining up-spinning reserves. Ramping refers to changing a plant’s output to satisfy load and spinning reserves are available capacity that is on-standby, which can come online quickly to mitigate the effects of, for example, cloud cover. We define the sum of these as the cost of intermittency. The cost of integration comprises the cost of intermittency and any transmission additions that are required to accommodate the deployment of renewables.
PV capital costs have been following a downward trajectory and this trend is expected to continue
(International Energy Agency 2016. As such, the investment costs are becoming less of a hindrance to its deployment. The operational aspects of its integration to grid operators are consequently becoming more pronounced. We therefore focus on the operational details to the power system.
Ramping costs are found to be small relative to the total cost of intermittency, which is dominated by the cost of spinning reserves. Together, these costs rise to 1.3 ¢/kWh of electricity generated from PV when 20 GW of PV are installed (or 0.20 ¢/ kWh when averaged across the total system load, representing 11 percent of system cost). However, incorporating PV into the system allows some offsetting savings in the operation of the plants that are displaced. These benefits are derived from higher efficiencies and reduced operating costs of thermal generation.
Depending on regional deployment levels, between 8 and 11 GW of PV capacity can achieve a slightly lower total power system cost than a case without additional PV. We term the point at which the costs of intermittency exceed the benefits as the ‘‘Operational Blend Wall.’’ The range of estimates of this blend wall is well within the Kingdom’s 9.5 GW target stated in its Vision 2030. Beyond that point, based on current domestic fuel prices, we find that the costs incurred in having PV in the system outweigh the benefits realized. Raising the price of crude oil paid by power producers increases the additional PV capacity that yields lower power system operating costs.
The cost of integration, which includes both the costs of intermittency and transmission investment but not PV investment, adds only 0.04 ¢/kWh to the average cost of supply at 20 GW

5Adding Photovoltaics to the Saudi Power System: What are the Costs of Intermittency?
Executive Summary
of installed PV. The excess of the tariff paid per unit of PV electricity delivered above the average market price is also a cost of incorporating PV, but is not a cost of integration and depends on the specifics of the power purchase agreements.
Moreover, the impact of regional PV capacity placement is not substantial on the total system cost. This indicates that many different geographical capacity allocations can achieve a near least-cost scenario.

6Adding Photovoltaics to the Saudi Power System: What are the Costs of Intermittency?
Cost Implications of Introducing Renewables to the Mix
Many countries have plans to build substantial amounts of renewable and nuclear power generation. Their motivations
vary: for some, it is to lower dependence on natural gas and coal imports, while for others it is to maintain COP21 carbon emissions pledges. In 2015, there were about 2 terawatt (TW) of renewable capacity globally (IRENA 2016), with the majority being hydro plants. PVs, however, are becoming more attractive to utilities as their costs continue to fall. China, for example, recently announced plans to have 143 GW of PV generation capacity by 2020 (Bloomberg 2016). Investment in solar and wind in the United States is outstripping those in conventional power generation (Public Broadcasting Service 2016). Saudi Arabia also announced a 9.5 GW renewable capacity target by 2030 (Vision 2030 2016).
PV and wind power technologies are intermittent and fossil fuel-fired generation is typically used to fill in for times of cloud cover or when it’s not windy. Having a large share of intermittent generation means potentially higher ramping magnitudes of dispatchable power plants. Adding to the argument by Joskow (2011) that the levelized cost of electricity (LCOE) in itself is not sufficient for comparing intermittent technologies with dispatchable ones, there are additional costs incurred when renewables technologies are added to the mix and not captured by the LCOE – part of these costs is referred to as the cost of intermittency. This cost of intermittency has been discussed in meetings and forums and not surprisingly has caused controversy (e.g., MIT Energy Initiative 2015, Gross and Heptonstall 2008 and Gross et al. 2006).
With increased penetration of renewable generation worldwide, concerns about the additional costs that have to be borne for accommodating these
intermittent technologies are rising (Bunn and Muñoz 2016 and Narbel 2014). Generation costs of different technologies on a LCOE basis are easy to find, but these figures represent the generation cost of each technology in isolation. When technologies are integrated into a system, the LCOE is unable to capture the ‘‘real’’ costs of the overall system and the interaction among generators to maintain stability and reliability. This concept of system cost is not new; utilities have been dealing with several generation mixes for decades. However, the accumulated experience is mostly related to dispatchable generation technologies only (i.e., not intermittent sources).
Literature explains the power system’s cost implications that stem from introducing a renewable source into the generation mix (e.g., MIT Energy Initiative 2015, Hirth 2013 and Gross et al. 2006). The additional costs are mainly due to back up requirement to cover for reduced output from renewables during cloud cover, for example, and more frequent or larger ramping flexibility of dispatchable technologies. Although the latter description of intermittency cost is relatively easy to understand qualitatively, the specificity of each country or region hinders generalizing a single figure for this cost.
Some countries have liberalized power markets, where the price of electricity is determined by the technology with the highest marginal generation cost. In other countries, the sector is owned by the government and electricity prices are administered and/or subsidized. Irrespective of the prevailing pricing mechanism, renewable penetration results in intermittency costs and generally reduces returns or leads to higher-than-anticipated prices for customers. With that in mind, understanding the quantum of intermittency costs can avoid

7Adding Photovoltaics to the Saudi Power System: What are the Costs of Intermittency?
Cost Implications of Introducing Renewables to the Mix
unexpected burdens on government budget or force abrupt rises in the price of electricity.
Electricity prices in Saudi Arabia are administered and are significantly lower than international averages, even after prices were raised at the start of 2016. Recently, Saudi Arabia announced its 2030 vision in which the general theme was to reduce the reliance on oil revenues. A combined renewable target of 9.5 GW was set in that vision, but without indication as to the types of technologies that would be used (Vision 2030, 2016). As mentioned above, when solar technology penetrates the power system, additional costs will be incurred. For the Saudi case, where the power sector is primarily state-owned, the government can choose to either cover this cost or carry it over to the consumer fully or partially. Between the recently announced vision and expected future electricity price increases, modeling this cost will aid policymakers in devising suitable
energy policies that minimize costs to society. It will identify one of the key elements of any tariff increase required by the utility to avoid a shortfall in receipts from customers to cover its outlays.
When discussing the introduction of intermittent sources to the power mix, it is only the costs that are often mentioned without recognizing that there are cost-saving opportunities. Explicitly, solar in particular can provide energy during the afternoon peak periods and avoid starting expensive and inefficient generators, a process usually referred to as peak-shaving. Depending on the magnitude of the intermittency costs and the costs avoided through peak-shaving, the net effect of introducing renewables into the generation mix could be a reduction in the overall power system cost. At low levels of penetration, renewable technologies may not consistently result in an additional net cost to the operation.

8Adding Photovoltaics to the Saudi Power System: What are the Costs of Intermittency?
The Costs of PV Integration to the Power Utilities
There are two types of reserves that we consider in our energy economy model:
The planning reserve margin: defined as the capacity installed on top of the expected system peak load. Adding PV capacity does not typically contribute to the planning reserve margin.
Up-spinning reserves: defined as idling turbines that can react within minutes to a sudden drop in renewable generation. These reserves are more relevant to renewable penetration compared to the planning margin. The costs of maintaining spinning reserves comprise fuel costs and operation and maintenance costs.
With the introduction of PV, the system has to provide backup for unexpected periods of cloud cover or dust. Also, depending on the magnitude of
installed capacity, thermal plants have to be shut down when the sun is shining and restart when it is not; this is known as ramping.
We define the cost of intermittency as the cost of operating up-spinning reserves and the cost of ramping existing power plants. The cost of PV integration, on the other hand, is the cost of intermittency plus the cost of building transmission capacity as a result of PV deployment. These costs are shouldered by the power system (not necessarily the PV operator) to ensure system reliability when an intermittent PV plant is operating. This is illustrated in Figure 1. Additional back-up generation may be built when a certain level of PV penetration is reached. If this is the case, significant costs will be borne. Note that this paper does not consider any social costs or externalities, such as the value of pollution, but rather focuses on operational costs only.
Cost of Integration
Ramping Costs Spinning-ReservesCosts
Cost of Intermittency Grid Upgrade Costs
Figure 1. Costs of intermittency and integration.
Source: KAPSARC.

9Adding Photovoltaics to the Saudi Power System: What are the Costs of Intermittency?
Table 1. Ramping costs for existing power plant technologies in Saudi Arabia.
Source: Van den Bergh and Delarue, 2015
The Costs of PV Integration to the Power Utilities
We examine the integration of up to 20 GW of national PV capacity, which represents a 25 percent penetration of generation capacity. The current Saudi power system possesses around 60 GW of thermal capacity, and an additional 20 GW of solar will bring the total capacity to 80 GW with a quarter represented by solar. The capacity limit is also much higher than the renewables target of 9.5 GW set for the country under its Vision 2030 plan.
As there are four regions in KEM for Saudi Arabia, we also test their regional breakdowns. In addition to the base case in which solar is not present, we explore various regional placement cases for PV for every 1 GW of capacity increment; A1 to A15, as the cases are called, are detailed in Table A1 in Appendix A, and may establish a range for the integration costs. For example, A1 describes a scenario where the solar PV capacity is equally distributed in the eastern, central and southern regions, whereas A6 describes a scenario where all the capacity is added in the western region. Note that we dictate the PV capacity additions and placements, and then we let the model arrive at the optimal operation to meet demand.
This analysis could be carried out by specifying the national capacity and then having the model optimize for the regional placements. However, there are near-optimal solutions that may become optimal
when considering a more disaggregate regional analysis or other costs that we may be missing. So we wanted to test different cases. Providing a range of solutions also allows policymakers to consider other costs and benefits that could be attained from solar deployment.
The costs of ramping up and down in KEM We have also added the costs of ramping dispatchable power plants to KEM for Saudi Arabia. Ramping involves higher maintenance costs due to the fatigue of mechanical equipment. It is important to note that power plants ramp up or down regardless of renewables, so the incremental cost of ramping is relevant when assessing the costs of PV integration. The costs of ramping are derived from Van den Bergh and Delarue (2015), as shown in Table 1.
KEM for Saudi Arabia represents electricity demand in the form of hourly load segments. The 24-hour day is broken into eight load time segments to ensure model tractability, so the change of operation would be taken every two to four hours. We also make the assumption in this analysis that 20 percent of existing open-cycle gas turbines can be converted to combined-cycle plants in the long run framework.
Power plant technology Ramping cost ($/∆MW)
Oil- or gas-fired steam turbines 1.61
Open-cycle gas turbines 0.92
Combined-cycle gas turbines 0.58

10Adding Photovoltaics to the Saudi Power System: What are the Costs of Intermittency?
The Costs of PV Integration to the Power Utilities
The costs of maintaining spinning reserves for the power sectorGas turbines are used as potential backup since they make up the majority of existing capacity in Saudi Arabia. The contribution of spinning reserves is a share of the power being generated by PV in each load segment, which is approximated to be
20 percent. Although these gas turbines would not be generating electricity as reserves, there are fixed operation and maintenance (O&M) costs associated with them. Further, they consume fuel at a fraction of a fully generating turbine. The fuel costs are summarized in Table 2. We know PV investments would not be made at these regulated prices (e.g., Matar et al. 2015), so we explore the operability of the system by considering the PV capacity as already existing – i.e., without considering its investment cost.
Fuel Prices in 2015 Prices in 2016
Natural gas 0.75 $/MMBtu 1.25 $/MMBtu
Crude oil 4.24 $/bbl 6.35 $/bbl
Diesel 0.67 $/MMBtu 2.41 $/MMBtu
Heavy fuel oil 0.43 $/MMBtu 0.60 $/MMBtu
Table 2. Administered fuel prices for utilities in Saudi Arabia.
Source: KAPSARC analysis, Council of Ministers Resolution No. 55, Electricity & Co-generation Regulatory Authority (ECRA) 2015 and Alriyadh 2015.

11Adding Photovoltaics to the Saudi Power System: What are the Costs of Intermittency?
Results
Effects of increasing PV capacity on the Saudi electricity systemWe show in Figure 2 the electricity generation share by technology in steps of 10 GW of PV. At 20 GW of capacity, PV’s average share in generation is 17 percent. As seen, generation of electricity is only slightly sensitive to regional placement and varies because of the different solar radiation levels regionally. Since demand varies by region,
additional transmission lines may be required to transport electricity from one region to another, based on where PV is deployed. In the base case 38.3 TWh of electricity is transmitted between regions. If for example, 20 GW of PV is installed in the southern region then 74.5 TWh would be transmitted inter-regionally, which would require 12.9 GW of additional transmission capacity to the western and central regions. The costs associated with the additional transmission lines and extra generation due to losses contribute to the total power system cost.
Figure 2. Annual generation (TWh) shares by technology in the power sector as PV capacity is increased (A1 to A15 are the regional placement cases we examine, detailed in Appendix A).
Source: KAPSARC.
Elec
trici
ty g
ener
atio
n sh
are
No additional PV capacity
10 GW of additional PV capacity
20 GW of additional PV capacity
PV regional placement cases
PV regional placement cases
PV regional placement cases
Elec
trici
ty g
ener
atio
n sh
are
Elec
trici
ty g
ener
atio
n sh
are
0%
20%
40%
60%
80%
100%
A15A14A13A12A11A10A9A8A7A6A5A4A3A2A1
0%
20%
40%
60%
80%
100%
A15A14A13A12A11A10A9A8A7A6A5A4A3A2A1
0%
20%
40%
60%
80%
100%
A15A14A13A12A11A10A9A8A7A6A5A4A3A2A1
Steam GT CC PV

12Adding Photovoltaics to the Saudi Power System: What are the Costs of Intermittency?
Introducing solar capacity can increase the total ramping required from the system. As more PV capacity is built, additional thermal capacity is likely to be shut down in the morning, or at least operate at a lower output, and started up again in the evening. Figure 3 shows the incremental ramping costs in relation to a case where no additional PV capacity is deployed. The cost of ramping in the base case is around $5.5 million, which is small compared to the total system costs. The increase is largest with PV capacity installed in the south and least when installed in the central region.
Results
Costs of PV intermittency and its effects on the operation of conventional power plantsAdditional ramping costs are a small fraction of the intermittency costs where the majority comes from maintaining spinning reserves. Figure 4 shows the costs attributed to spinning reserves and ramping as installed PV capacity is raised. The cost of intermittency is near zero in the base case and rises to around $600 million when 20 GW of PV is added.
0
2
4
6
8
10
12
201612840
A8
A8
A6 A9A7
A7
A10
A3A1 A4A2 A5
A13
A13
A11 A14A12 A15
Incr
emen
tal r
ampi
ng c
ost o
f the
rmal
pow
er p
lant
s (M
illio
ns o
f dol
lars
)
Capacity of PV in the system (GW)
Figure 3. Incremental ramping costs of thermal power plants with increasing PV capacity (A1 to A15 are the regional placement cases we examine, detailed in Appendix A).
Source: KAPSARC.

13Adding Photovoltaics to the Saudi Power System: What are the Costs of Intermittency?
Results
0
100
200
300
400
500
600
700
201612840
A8
A9
A6 A9A7 A10
A3A1 A4A2 A5
A13
A7
A11 A14A12 A15
Syst
em c
ost o
f PV
inte
rmitt
ency
(M
illio
ns o
f dol
lars
)
Capacity of PV in the system (GW)
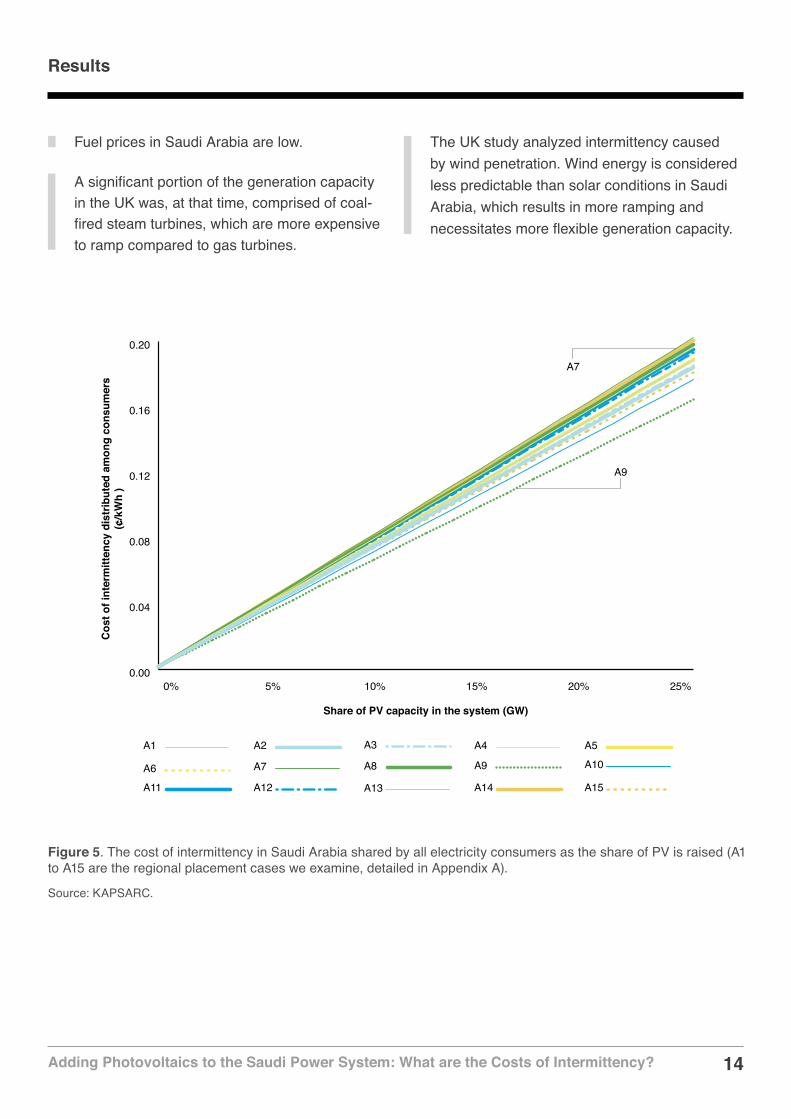
This cost of intermittency to the power utilities would range from near zero ¢/kWh without new PV capacity, to just over 0.20 ¢/kWh with 20 GW of PV if shared by all consumers or 1.3 ¢/kWh for each unit generated by PV; this range is illustrated in Figure 5. The cost specific to electricity generated from PV plants would be neglected in a typical LCOE calculation.
Because no two countries have identical installed power systems, comparing costs of intermittency
between countries should be undertaken with caution. This is illustrated in a study conducted by the United Kingdom Energy Research Center (UKERC). It found that, if the share of wind turbine capacity in the UK is capped at 20 percent and the costs of intermittency were shared by all consumers, the impact on UK electricity prices would be in the range of 0.10 to 0.15 pence per kWh, or 0.18 to 0.27 ¢/kWh in 2006 dollars (Gross et al. 2006).Comparing the Saudi and British power systems, it is worth noting that:
Figure 4. Overall cost of intermittency, i.e., costs of ramping dispatchable plants and maintaining spinning reserves as a result of increasing PV capacity but excluding added transmission (A1 to A15 are the regional placement cases we examine, detailed in Appendix A).
Source: KAPSARC.
14Adding Photovoltaics to the Saudi Power System: What are the Costs of Intermittency?
0.00
0.04
0.08
0.12
0.16
0.20
25%20%15%10%5%0%
A8
A9
A6 A9A7 A10
A3A1 A4A2 A5
A13
A7
A11 A14A12 A15
Cos
t of i
nter
mitt
ency
dis
trib
uted
am
ong
cons
umer
s (¢
/kW
h )
Share of PV capacity in the system (GW)
Fuel prices in Saudi Arabia are low.
A significant portion of the generation capacity in the UK was, at that time, comprised of coal-fired steam turbines, which are more expensive to ramp compared to gas turbines.
The UK study analyzed intermittency caused by wind penetration. Wind energy is considered less predictable than solar conditions in Saudi Arabia, which results in more ramping and necessitates more flexible generation capacity.
Figure 5. The cost of intermittency in Saudi Arabia shared by all electricity consumers as the share of PV is raised (A1 to A15 are the regional placement cases we examine, detailed in Appendix A).
Source: KAPSARC.
Results
15Adding Photovoltaics to the Saudi Power System: What are the Costs of Intermittency?
Results
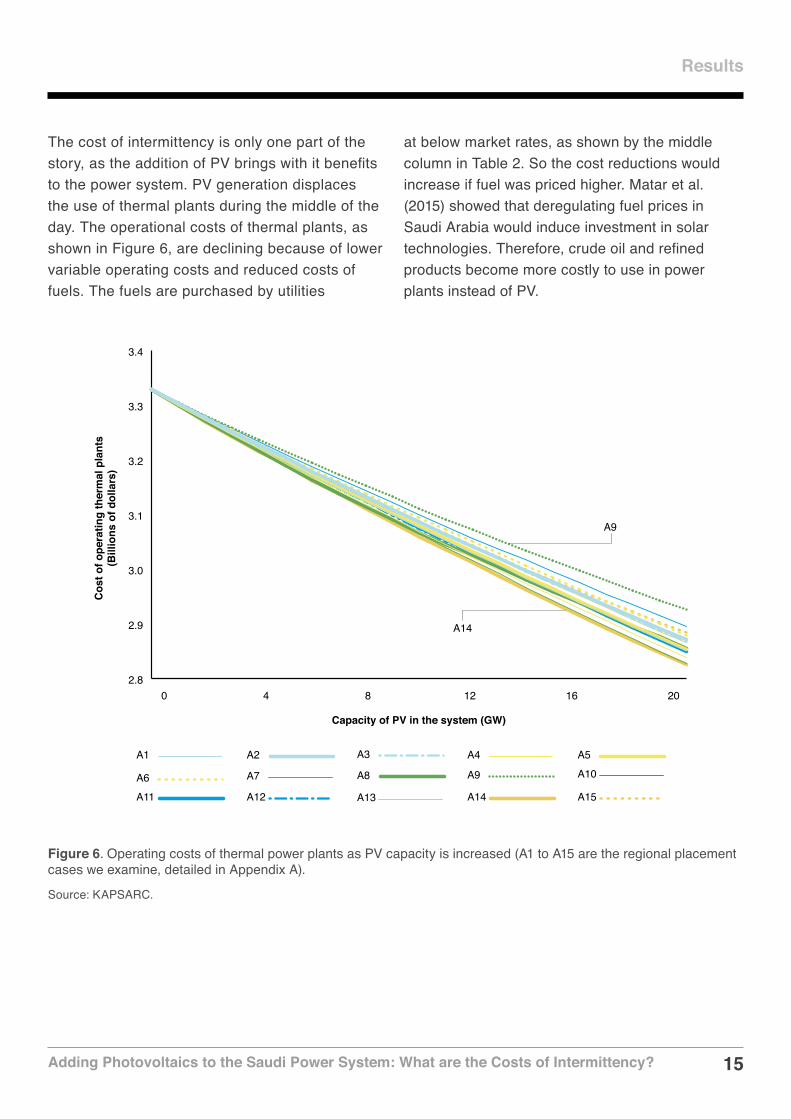
The cost of intermittency is only one part of the story, as the addition of PV brings with it benefits to the power system. PV generation displaces the use of thermal plants during the middle of the day. The operational costs of thermal plants, as shown in Figure 6, are declining because of lower variable operating costs and reduced costs of fuels. The fuels are purchased by utilities
at below market rates, as shown by the middle column in Table 2. So the cost reductions would increase if fuel was priced higher. Matar et al. (2015) showed that deregulating fuel prices in Saudi Arabia would induce investment in solar technologies. Therefore, crude oil and refined products become more costly to use in power plants instead of PV.
2.8
2.9
3.0
3.1
3.2
3.3
3.4
201612840
A8
A9
A6 A9A7 A10
A3A1 A4A2 A5
A13
A14
A11 A14A12 A15
Cos
t of o
pera
ting
ther
mal
pla
nts
(Bill
ions
of d
olla
rs)
Capacity of PV in the system (GW)
Figure 6. Operating costs of thermal power plants as PV capacity is increased (A1 to A15 are the regional placement cases we examine, detailed in Appendix A).
Source: KAPSARC.

16Adding Photovoltaics to the Saudi Power System: What are the Costs of Intermittency?
The change in operation of existing thermal generators would also alter the thermal efficiency of generating plants, as highlighted in Figure 7. Due to investments in converting gas turbines to combined-cycle plants, and building new combined-cycle plants, the long-run efficiency of generating plants increases to around 43.7 percent; this is mainly due to meeting reserve margin requirement, which is the same through the cases as PV does not contribute toward the requirement. Typically, the least efficient turbines would operate in the middle of the day in the summer, and by displacing them, the overall
efficiency increases. As more capacity is introduced, more of the lower efficiency gas turbines would no longer operate.
The one outlier is building the capacity in the central region. Initially efficiency is increased as gas turbines are forgone. At about 8 GW of added PV capacity, the more efficient combined-cycle turbines in the day time begin to be removed from operation; this is made apparent in Figure 7. The same is true for other regional placements, but occurs at higher PV capacity additions.
Results
43.4
43.6
43.8
44.0
44.2
44.4
44.6
44.8
45.0
201612840
A8A6 A9A7 A10
A3A1 A4A2 A5
A13A11 A14A12 A15
Net
ther
mal
effi
cien
cy (%
)
Capacity of PV in the system (GW)
A8
A13
A10
Figure 7. Efficiency of generating thermal plants with increasing integration of PV (A1 to A15 are the regional placement cases we examine, detailed in Appendix A).
Source: KAPSARC.
17Adding Photovoltaics to the Saudi Power System: What are the Costs of Intermittency?
Results
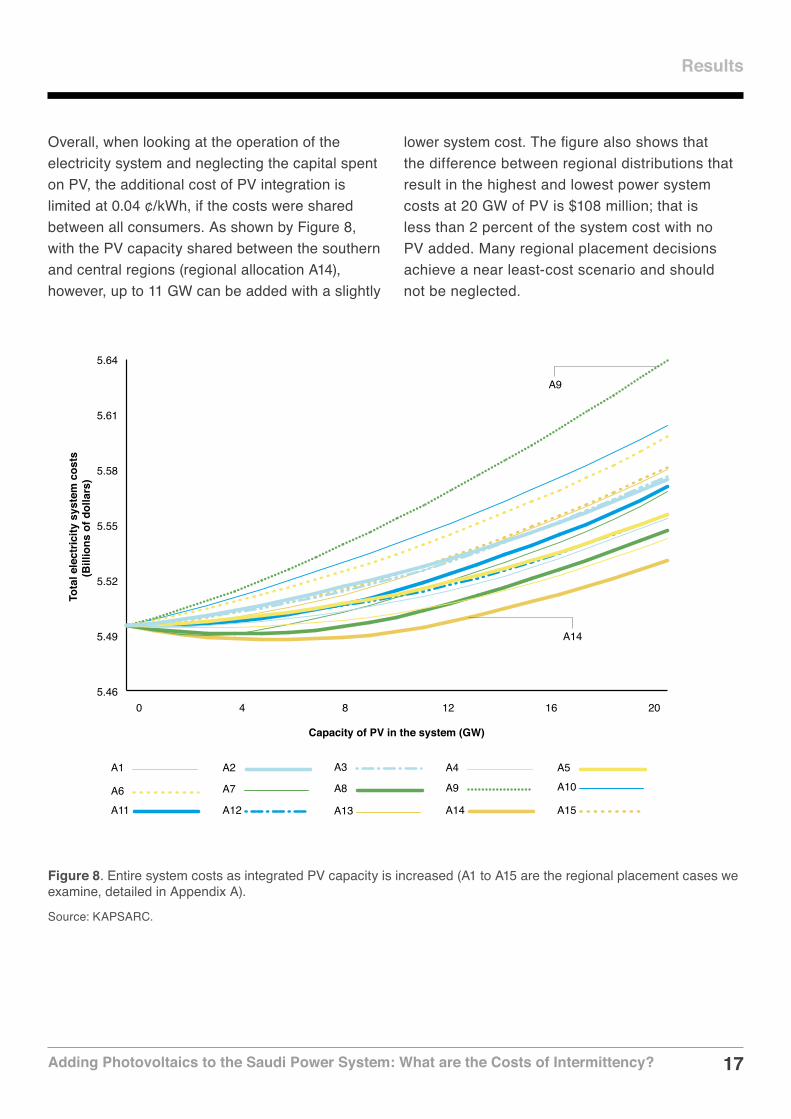
Overall, when looking at the operation of the electricity system and neglecting the capital spent on PV, the additional cost of PV integration is limited at 0.04 ¢/kWh, if the costs were shared between all consumers. As shown by Figure 8, with the PV capacity shared between the southern and central regions (regional allocation A14), however, up to 11 GW can be added with a slightly
lower system cost. The figure also shows that the difference between regional distributions that result in the highest and lowest power system costs at 20 GW of PV is $108 million; that is less than 2 percent of the system cost with no PV added. Many regional placement decisions achieve a near least-cost scenario and should not be neglected.
5.46
5.49
5.52
5.55
5.58
5.61
5.64
201612840
A8A6 A9A7 A10
A3A1 A4A2 A5
A13A11 A14A12 A15
Tot
al e
lect
ricity
sys
tem
cos
ts
(Bill
ions
of d
olla
rs)
Capacity of PV in the system (GW)
A9
A14
Figure 8. Entire system costs as integrated PV capacity is increased (A1 to A15 are the regional placement cases we examine, detailed in Appendix A).
Source: KAPSARC.

18Adding Photovoltaics to the Saudi Power System: What are the Costs of Intermittency?
The Economic Limit of Adding PV Capacity – ‘Operational Blend Wall’
We have established that this cost of intermittency is dependent on region-specific attributes, including the flexibility
of existing power generation mix. It is found that up to a certain level of PV capacity addition, the total costs of operating the generators and the grid begin to outstrip the benefits for the power sector. That point in our analysis for Saudi Arabia thus far is 11 GW based on the current power system.
To explore this issue further, we look at this ‘Operational Blend Wall’ for crude oil prices that range from the 2015 administered price of $4.24/bbl to $7/bbl (2016 price was $6.35/bbl). We want to avoid a potential price response by the power utilities in the form of investment in new technologies, so we cap the increase of the oil price to a modest value. We ensure that any built capacity
without an oil price change is maintained until $7/bbl is reached. Moreover, that is the only price we adjust, as we would like to maintain the relative order of fuel use; crude oil is the last fuel of choice due to its price and lower thermal efficiency.
Figure 9 shows the maximum capacity addition that results in lower overall power system costs than a case with no addition for a given administered crude oil price. Under the current crude oil price, the grid operator would have a lower total cost than a case without PV with 11 GW of installed PV capacity. As the price of the fuel rises, so does the maximum capacity that achieves a lower cost to the system. At $7/bbl crude oil, this capacity addition reaches 52 GW, which is sufficiently high for our analysis. These optimal capacities are not distributed the same way regionally as you change the oil price.
0
10
20
30
40
50
60
7.126.545.975.394.824.24Crude oil price offered to the power utilities ($/bbl)
Max
imum
PV
capa
city
in th
e sy
stem
that
achi
eves
a lo
wer
pow
er s
yste
m c
ost t
han
a ca
se w
ithou
t PV
(GW
)
With a 10 percent reductionin electricity demand
Figure 9. Maximum PV capacity addition that yields lower operational power system costs than a case without PV for a range of crude oil prices.
Source: KAPSARC.

19Adding Photovoltaics to the Saudi Power System: What are the Costs of Intermittency?
This specific blend wall applies to the Saudi power sector as a whole. It is valid for the prevailing capacity and electricity market situation in Saudi Arabia, and is strictly operational, i.e., no PV capital costs are included. As part of the power sector, the utility may bear the investment cost, or a power purchase agreement (PPA) may be established between it and a solar PV developer. In such a scenario, the excess of the price paid to the new PV generators over the average consumer tariff would also have to be covered by the utility and will depend on the details of the PPA.
A rise in the cost to power system would likely bring about an increase in the electricity price. Furthermore, customers in aggregate would react by reducing their consumption. Without making assumptions as to the price elasticity of demand in Saudi Arabia, we reduce electricity use by 10 percent to observe how this PV integration wall changes following a change in demand. Shown in Figure 9, the economic limit would be reached at lower PV capacity additions. This relationship is somewhat intuitive, as the operation costs of thermal plants are lower without the introduction of PV capacity.
The Economic Limit of Adding PV Capacity – ‘Operational Blend Wall’

20Adding Photovoltaics to the Saudi Power System: What are the Costs of Intermittency?
Conclusion
The additional power system cost of introducing PV technology into the generation mix, part of which is referred to as the
cost of intermittency, has been incorporated and quantified in the KEM for Saudi Arabia. It is the cost of maintaining a reliable grid with an intermittent renewable technology in the mix. In this analysis, a total PV capacity of 20 GW was deployed in 1 GW increments into the current Saudi generation mix, in various regional placements.
Essentially, the cost of intermittency entails two types of costs to the power utilities: additional ramping costs and spinning reserve costs. Without renewables, generators ramp only to deal with load fluctuations. However, as renewables penetrate the system, these dispatchable generators have to now address supply and demand variability simultaneously. Although ramping incidents may increase in number or magnitude when renewables are introduced, this addition does not have significant financial implications. The cost of intermittency is mainly attributed to maintaining spinning reserves.
On the cost saving side, introducing PV capacity means that inefficient generators would not be started, and the effective efficiency of the generating plants would thus improve. However, beyond a
certain PV capacity, the avoided costs of operating inefficient plants and the higher generating efficiency begin to pale in comparison to the costs incurred.
When considering total electricity system cost, which includes the cost of intermittency plus any required grid upgrades or additional generation capacity to maintain the planning reserve margin but not PV investments, the generation costs would increase by a net of 0.04 ¢/kWh at most; this value occurs at an installation of 20 GW in the eastern region. The least cost scenario would yield lower generation costs than the base case, and would occur at an addition of 5 GW shared evenly between the central and southern regions.
Up to 11 GW of capacity, which includes the target of 9.5 GW announced by vision 2030, can be introduced evenly between the southern and central regions with lower power system cost. This PV integration wall rises as the price of crude oil offered to the utilities increases, reaching 52 GW of PV capacity at $7/bbl. The integration wall drops as the demand for electricity declines due to lower costs of thermal plants in initial operation. The relationship between the cost of generation, its potential effect on price and therefore demand, and the integration wall can be further studied.

21Adding Photovoltaics to the Saudi Power System: What are the Costs of Intermittency?
References
Alriyadh. “مجلس الوزراء یرفع أسعار الطاقة.”
Dec. 28, 2015. Last accessed Dec. 29, 2015.
Bloomberg. “China to More Than Triple Solar Power Capacity in Five Years.” Bloomberg. Accessed May 8, 2016 (2016) http://www.bloomberg.com/news/articles/2016-03-21/china-to-more-than-triple-solar-power-capacity-in-five-years.
Bunn, Derek W., and José I. Muñoz. “Supporting the externality of intermittency in policies for renewable energy.” Energy Policy 88 (2016): 594-602.
ECRA. “Activities and Achievements of the Authority in 2014.” (2015): 110.
Gross, Robert and Philip Heptonstall. “The costs and impacts of intermittency: An ongoing debate:” East is East, and West is West, and never the twain shall meet.” Energy Policy 36(10) (2008): 4005-4007.
Gross, Robert, Philip Heptonstall, Dennis Anderson, Tim Green, Matthew Leach and Jim Skea. “The Costs and Impacts of Intermittency: An assessment of the evidence on the costs and impacts of intermittent generation on the British electricity network.” UKERC, ISBN 1903144043 (2006).
Hirth, Lion. “The market value of variable renewables: The effect of solar wind power variability on their relative price.” Energy Economics 38 (2013): 218-236.
IEA. “Power Generation in the New Policies and 450 Scenarios.” World Energy Outlook 2014. Last accessed” Oct. 26, 2016: http://www.worldenergyoutlook.org/media/weowebsite/2014/weio/WEIO2014PGAssumptions.xlsx, 2016.
IRENA. “Renewable Capacity Statistics 2016.” International Renewable Energy Agency (2016).
Jordan, Dirk C., and Sarah R. Kurtz. “Photovoltaic Degradation Rates – An Analytical Review.” NREL/JA-5200-51664 (2012): 14.
Joskow, Paul L. “Comparing the Costs of Intermittent and Dispatchable Electricity Generating Technologies.” American Economic Review: Papers & Proceedings (2011): 238-241.
Matar, Walid, Frederic Murphy, Axel Pierru, Bertrand Rioux and David Wogan. “Efficient Industrial Energy Use: The First Step in Transitioning Saudi Arabia’s Energy Mix.” KAPSARC Discussion paper KS-1519-DP013A (2015).
KAPSARC. “The KAPSARC Energy Model for Saudi Arabia: Documentation of the model build called “KEM-SA_v9.16”.” Last accessed Nov. 17th, 2016: https://www.kapsarc.org/wp-content/uploads/2016/11/KEM-SA_documentation_v9.16.pdf, 2016.
MIT Energy Initiative. “The Future of Solar Energy: An Interdisciplinary MIT Study.” MIT Energy Initiative (2015).
Narbel, Patrick A. “Rethinking how to support intermittent renewables.” Energy 77 (2014): 414-421.
Public Broadcasting Service. “U.S. investment in renewable energy outpaces fossil fuels.” Accessed May 8, 2016 (2016) http://www.pbs.org/newshour/rundown/u-s-investment-in-renewable-energy-outpaces-fossil-fuels/.
SAMA. “SAMA Annual Statistics.” (2015).
Saudi Aramco. “Saudi Aramco Annual Review 2014.” (2015): 82-83.
Van den Bergh, Kenneth and Erik Delarue. “Cycling of conventional power plants: Technical limits and actual costs.” Energy Conversion and Management 97 (2015): 70-77.
Vision 2030. “Vision 2030: Kingdom of Saudi Arabia.” (2016): 49.
http://www.bloomberg.com/news/articles/2016-03-21/china-to-more-than-triple-solar-power-capacity-in-
http://www.bloomberg.com/news/articles/2016-03-21/china-to-more-than-triple-solar-power-capacity-in-

22Adding Photovoltaics to the Saudi Power System: What are the Costs of Intermittency?
Appendix A — Regional Placement Cases
The 15 placement cases examine a wide range of regional deployment scenarios, as highlighted in Table A1. We steadily add 1
GW to the national PV capacity from 0 to 20 GW. The first four look at deployment of all the capacity in different combinations of three regions. The fifth
Cases Western Southern Central Eastern
A1 • • •A2 • • •A3 • • •A4 • • •A5 • • • •A6 •A7 •A8 •A9 •A10 • •A11 • •A12 • •A13 • •A14 • •A15 • •
Table A1. Regional PV placement cases in our analysis.
Source: KAPSARC.
scenario distributes the national capacity evenly across all the regions. Cases A6 to A9 stipulate capacities are installed in one of the four regions. Lastly, capacities in the remaining five cases are evenly deployed in different combinations of two regions. This produces 300 cases.
Adding Photovoltaics to the Saudi Power System: What are the Costs of Intermittency? 22
23Adding Photovoltaics to the Saudi Power System: What are the Costs of Intermittency?
Appendix B — Updating the KAPSARC Energy Model for Saudi Arabia
We updated KEM to account for recent activity as much as possible. We describe here the steps taken to
update the model calibration to 2015. Power load demands were calculated for all combinations of region, season and type of day using 2015 hourly load profiles obtained from the Saudi Electricity Company (SEC). 2015 power generation capacities are sourced from ECRA and correspondence with SEC.
In the upstream sector, updated production values for crude oil, methane, ethane and other natural gas liquids were taken from Saudi Aramco (2015). International market prices for Arabian crude grades were taken from the Saudi Arabian Monetary Agency (2015) and the Middle East Economic Survey. Those 2014 values were then adjusted to 2015 by growth rates in Oxford Economics’ Global Economic Model projections (using the January 2016 database). The administered naphtha and propane prices offered to petrochemicals firms in Saudi Arabia are calculated relative to the 2015 naphtha cost and freight price in Japan.
We updated the refining capacities in Saudi Arabia using the IHS Midstream database. In 2015, the YASREF refinery was added to the western region’s aggregate capacity. The 2013 demand for cement, petrochemicals and refined products were scaled up to 2015 by the gross domestic product growth and elasticities used by Matar et al (2015). The exports of those products are the sectors’ gross output minus domestic demand; the 2015 gross outputs for those exporting sectors are taken from Oxford Economics’ Global Industry Model (using the November 2015 database). Municipal water demand is scaled by population growth.
Photovoltaics experience degradation over time. Similar to annualizing capital costs over their lifetime, we have to also annualize their output. This is done by taking the effective degradation throughout their life and applying it to the capacity in which the power sector makes the initial investment. We consider up to a 1 percent per year reduction in output following Jordan and Kurtz (2012) for crystalline silicon PV in desert climates.
Adding Photovoltaics to the Saudi Power System: What are the Costs of Intermittency? 23
24Adding Photovoltaics to the Saudi Power System: What are the Costs of Intermittency?
Appendix C — Cost of Ramping Up and Down in KEM
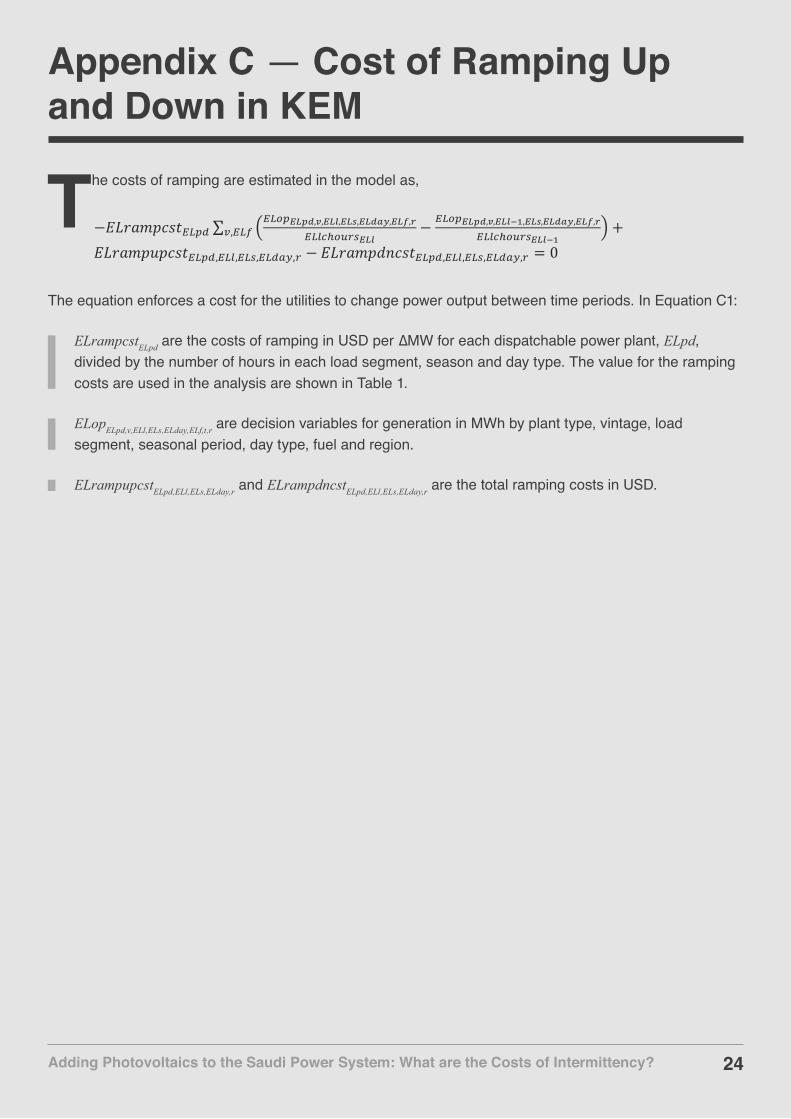
The costs of ramping are estimated in the model as,
−𝐸𝐸𝐿𝐿𝑟𝑟𝑎𝑎𝑚𝑚𝑝𝑝𝑐𝑐𝑠𝑠𝑡𝑡+,-. ∑ 0+,1-2345,7,238,239,235:;,23<,=+,>?@1ABC238
− +,1-2345,7,238DE,239,235:;,23<,=+,>?@1ABC238DE
FG,+,H +𝐸𝐸𝐿𝐿𝑟𝑟𝑎𝑎𝑚𝑚𝑝𝑝𝑢𝑢𝑝𝑝𝑐𝑐𝑠𝑠𝑡𝑡+,-.,+,>,+,C,+,.KL,B − 𝐸𝐸𝐿𝐿𝑟𝑟𝑎𝑎𝑚𝑚𝑝𝑝𝑑𝑑𝑛𝑛𝑐𝑐𝑠𝑠𝑡𝑡+,-.,+,>,+,C,+,.KL,B = 0
The equation enforces a cost for the utilities to change power output between time periods. In Equation C1:
ELrampcstELpd are the costs of ramping in USD per ∆MW for each dispatchable power plant, ELpd, divided by the number of hours in each load segment, season and day type. The value for the ramping costs are used in the analysis are shown in Table 1.
ELopELpd,v,ELl,ELs,ELday,ELf,t,r are decision variables for generation in MWh by plant type, vintage, load segment, seasonal period, day type, fuel and region.
ELrampupcstELpd,ELl,ELs,ELday,r and ELrampdncstELpd,ELl,ELs,ELday,r are the total ramping costs in USD.
Adding Photovoltaics to the Saudi Power System: What are the Costs of Intermittency? 24

25Adding Photovoltaics to the Saudi Power System: What are the Costs of Intermittency?
Notes

26Adding Photovoltaics to the Saudi Power System: What are the Costs of Intermittency?
Notes

27Adding Photovoltaics to the Saudi Power System: What are the Costs of Intermittency?
Amro M. Elshurafa
Amro is a senior research associate with research interests in energy transitions and modeling. Credited with 35+ publications and several patents, he holds a PhD in Engineering and an MBA in Finance.
Walid Matar
Walid is a senior research associate developing energy systems models. He holds a Master in Mechanical Engineering from North Carolina State University.
About the Team
About the Project
We developed the KAPSARC Energy Model (KEM) for Saudi Arabia to understand the dynamics of the country’s energy system. It is a partial equilibrium model formulated as a mixed complementarity problem to capture the administered prices that permeate the local economy. KEM for Saudi Arabia has been previously used to study the impacts of various industrial fuel pricing policies, improved residential energy efficiency on the energy economy, and the feasibility of installing coal-fired power plants in Saudi Arabia. In the present paper, we use it to assess the intermittency and integration costs of photovoltaics in the Saudi power system. Ongoing work revolves around CO2 emissions in the cement industry in KEM for Saudi Arabia, and generalizing the main results of this paper.

28Adding Photovoltaics to the Saudi Power System: What are the Costs of Intermittency?
www.kapsarc.org