Lerøy Seafood Group 3rd quarter 2002 · Lerøy Seafood Group’s focus and strategy!Product- and...
34
Lerøy Seafood Group 3 rd quarter 2002
Transcript of Lerøy Seafood Group 3rd quarter 2002 · Lerøy Seafood Group’s focus and strategy!Product- and...

Lerøy Seafood Group
3rd quarter 2002

Contents
I Considerations 3II Key financial figures Q3 2002 6III Lerøy at a glance 12IV Lerøy Seafood Group - Company profile 17V Market glance 28
Sections Page

3
Internal considerations year 2002
!New equity of NOK 320 million! Well positioned for future strategic growth
!Quoted on OSE 03.06.2002
! 1.406 shareholders
!Acquired well established business in Sweden in 2002! Lerøy Smøgen Seafood AB
!TiMar Seafood AS activity allocated to Hallvard Lerøy AS

4
External considerations year 2002
!Weak salmon and trout prices! Price increase weaker than expected! Still weak in Q4 per date! Uncertainty in price development rest of Q4
!Difficult market situation in both pelagic and white fish sectors
!Strong krone! Norwegian export – less competitive
!Political issues / trade barriers! EU – agreement prolonged into 28.02.2003! Uncertainty regarding regulation of future market access for non-EU
producers

Contents
II Key financial figures Q3 2002 6
Sections Page

Resultatregnskap / Income Statement
Mill. NOK
Q3 - 2002 Q3 - 2001 YTD 2002 YTD 2001 2 001
Salgsinntekter / Operating revenues 611 405 560 286 1 771 711 1 820 241 2 530 457
Vareforbruk / Cost of goods sold 554 768 517 497 1 614 927 1 703 640 2 332 845 Lønn oa personalk. / Sal. and other pers. ex 25 839 15 483 64 864 40 769 67 563 Andre driftskostnader / Other op. exp. 20 214 14 424 50 687 37 865 58 258 Ord. avskrivninger / Ord. Depr. and amort. 3 134 1 804 7 546 5 392 7 006
Driftsresultat / Operating profit 7 450 11 078 33 687 32 575 64 785
Inntekt tilkn. selskap / Inc.from aff. Comp. -3 405 1 408 -6 734 7 846 -1 643 Netto finansposter / Net financial items 996 -2 466 -3 649 -2 383 -6 512
Resultat før skattekostnad / Profit before 5 041 10 020 23 304 38 038 56 630
Sum skattekostnad / Taxation -1 846 -3 134 -6 959 -9 288 -15 753
Periodens resultat / Profit for the period 3 195 6 886 16 345 28 750 40 877

7
Balanse / Balance Sheet
1) Tall som inngår i beregningen av netto rentebærende gjeld / Figures used in calculation of net interest bearing debt
Mill. NOK
30.09.02 30.09.01 31.12.2001
Immaterielle eiendeler / Intangible assets 21 864 5 848 16 052 Varige driftsmidler / Tangible fixed assets 62 153 37 282 43 616 Finans. anleggsmidler / Financ. fixed assets 302 120 315 956 307 646 Sum anleggsmidler / Total fixed assets 386 137 359 086 367 314 Varer / Inventories 54 751 39 515 44 805 Fordringer / Receivables 312 756 320 793 342 748 Betalingsmidler / Cash and equivalents 1) 340 227 39 737 24 479 Sum omløpsmidler / Total current assets 707 734 400 045 412 031
Sum eiendeler / Total assets 1 093 871 759 131 779 345

8
forts./cont.
1) Tall som inngår i beregningen av netto rentebærende gjeld / Figures used in calculation of net interest bearing debt
Balanse / Balance Sheet
Mill. NOK
30.09.02 30.09.01 31.12.2001
Innskutt egenkapital / Equity contributions 505 298 204 939 203 314 Opptjent egenkapital / Earned equity 118 715 101 210 109 201 Minoritetsinteresser / Minority interests 21 119 2 861 9 442 Sum egenkapital / Total equity 645 132 309 010 321 957
Avsetning for forpliktelser / Accrued liab. 793 953 793 Langsiktig gjeld / Long-term liabilities 1) 183 990 172 471 178 132 Kortsiktige kreditter / Short-term loans 1) 3 991 36 253 12 058 Annen kortsiktig gjeld / Other short-term liab. 259 965 240 444 266 406 Sum gjeld / Total liabilities 448 739 450 121 457 389
Sum egenkap. og gjeld / Total equity and lia 1 093 871 759 131 779 345
9
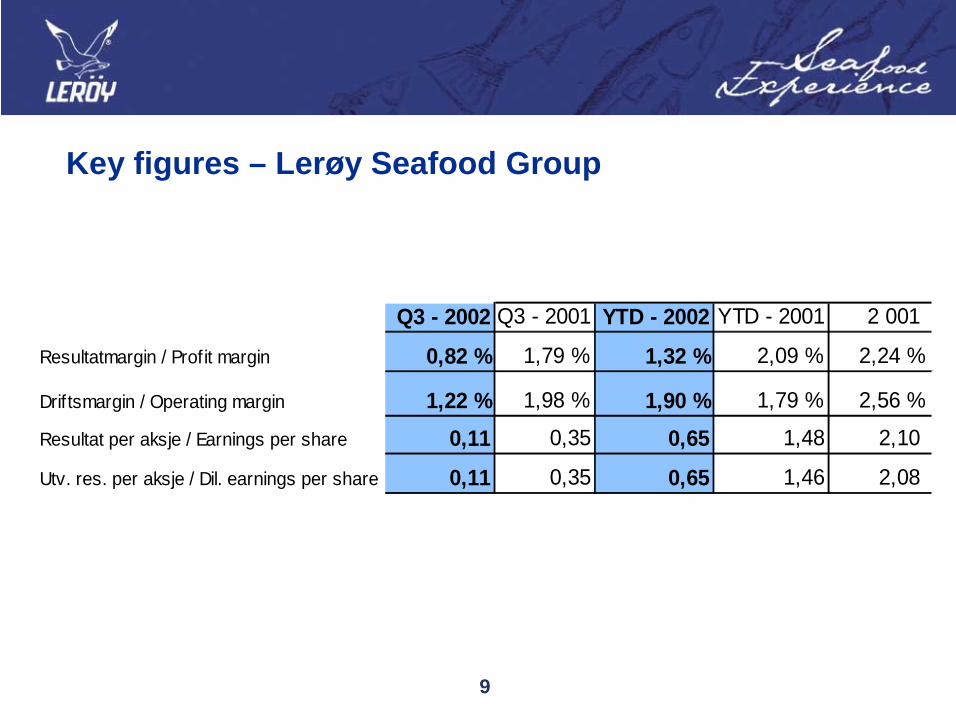
Key figures – Lerøy Seafood Group
Q3 - 2002 Q3 - 2001 YTD - 2002 YTD - 2001 2 001
Resultatmargin / Profit margin 0,82 % 1,79 % 1,32 % 2,09 % 2,24 %
Driftsmargin / Operating margin 1,22 % 1,98 % 1,90 % 1,79 % 2,56 %
Resultat per aksje / Earnings per share 0,11 0,35 0,65 1,48 2,10
Utv. res. per aksje / Dil. earnings per share 0,11 0,35 0,65 1,46 2,08

10
Key figures – Lerøy Seafood Group
Lerøy Seafood Group’s long-term financial goals:• ROCE before tax > 18 %
• Equity ratio > 25 %
Delårstall er ikke revidert / Quarterly figures have not been audited
Q3 - 2002 Q3 - 2001 YTD - 2002 YTD - 2001 2 001
Avk på syssels kapital / ROCE 2) 3,30 % 14,42 % 7,72 % 15,61 % 15,89 %
Egenkapitalandel / Equity ratio 58,98 % 40,71 % 41,31 %
Netto renteb gjeld / Net int bearing debt - 169 940 165 711
2) Annualisert / annualized

Contents
III Lerøy at a glance 12
Sections Page

12
Lerøy Seafood Group
! Norway’s largest seafood exporter! 7,5% market share of Norwegian Seafood total exports (by value)! 15% of Norwegian salmon export in 2001! Japan single largest market, EU most important region overall
! Global distribution network! Global distribution from Head Office in Bergen! Acquired well established business in Sweden in 2001 and 2002! Local representative offices in some key markets
(France, Spain, Japan, China, USA)
! Major shareholder in fish farming operations! 2nd largest Scottish salmon producer (50%)! Hydrotech-Gruppen AS (39%)
! Steady growth in profits and strong balance sheet! Excellent track record ! Stable earnings despite turbulence in the salmon industry! Growth potential within recently acquired businesses ! Private and public placement successfully completed
! Professional and highly educated employees

13
Lerøy Seafood Group’s focus and strategy
!Product- and market development
! Focus on fresh seafood products! Maintain a wide product range! Utilize differentiation and segmentation opportunities combined with
focus on own brands! Concentrate on “private brands” in a long term and committing
cooperation! Strong and increasing focus on value-added products

14
Key Success Factors going forward
! Wide and attractive seafood product range ! Competence and market knowledge! Strong marketing and brand-building! Continuity in deliveries
! Logistics and distribution ! Wide sourcing base of seafood products
! Strong partners and partnerships! With producers to further strengthen product quality and deliveries! With end users (supermarkets/catering etc) to achieve stronger position in the “value
added product” segment! Cost efficiency in all areas! Risk management in all areas! Quality control systems

The company has by Nov. 22nd a total of 1.406 shareholders who owns a minimum of one trading lot (200)
Shareholders 22.11.02
Shareholder No. of shares Ownership share
Ferd Private Equity 5 781 307 19,64 %Ole-Eirik Lerøy 4 685 000 15,91 %Hallvard Lerøy Jr. 1 690 900 5,74 %SND Invest AS 1 296 118 4,40 %Knut Hallvard Lerøy 1 253 210 4,26 %Bremnes Fryseri AS 1 124 669 3,82 %Skagen Vekst 1 119 400 3,80 %Tine Pensjonskasse 889 300 3,02 %Dnb Markets, Aksjehandel/Analyse 757 200 2,57 %Aksjefondet Gambak 700 000 2,38 %Alsaker Fjordbruk A/S* 683 240 2,32 %George Harald Lerøy 475 000 1,61 %Inma AS** 400 000 1,36 %SalMar AS 386 826 1,31 %Lime AS** 310 573 1,05 %Mowinckel Management AS 243 800 0,83 %Vesta Liv AS 243 800 0,83 %Gjensidige Nor Spareforsikring 238 300 0,81 %Statoils Pensjonskasse 236 000 0,80 %Total 20 largest share owners 22 514 643 76,48 %Others 6 925 724 23,52 %
Total shares 29 440 367 100,00 %*Incl Sunnhordland Fjordbruk AS, **controlled by Ole-Eirik Lerøy

Contents
lV Lerøy Seafood Group - Company profile 17
Sections Page

Lerøy Seafood Group ASA
Hallvard Lerøy AS100%
Nordvik SA80%
Fiskets Fryserieri Gøteborg AB
80%
NorskottHavbruk AS
50%Hydrotech
Gruppen AS39%
SigerfjordAqua AS
46%Egersund Fisk AS *
27%Hjaltland
11%
Sales & Distribution Farming/other
*) Pelagic related activities
Associated companies
Lerøy SmøgenSeafood AB
51%
Sales and distribution ww
Local representation:USA, France, SpainUK, Japan, China
Sales and distribution inFrance
Strong position towards Hyper- and super markets
Sales and distributionIn Sweden
Strong position towards catering and super-markets
Sales and production
Cold and hot smokedSea-food products,Salads and shell fishIn brine.

18
Sales per market Lerøy Seafood Group Q3 2002
Europe59 %
Eastern Europe7 %
USA and Canada
6 %
Asia Pacific19 %
Norway8 %
Others1 %

19
Sales per product Lerøy Seafood Group Q3 2002
Whole salmon40 %
Processed salmon
20 %
Pelagic fish8 %
White fish14 %
Other species14 %
Other products4 %
20
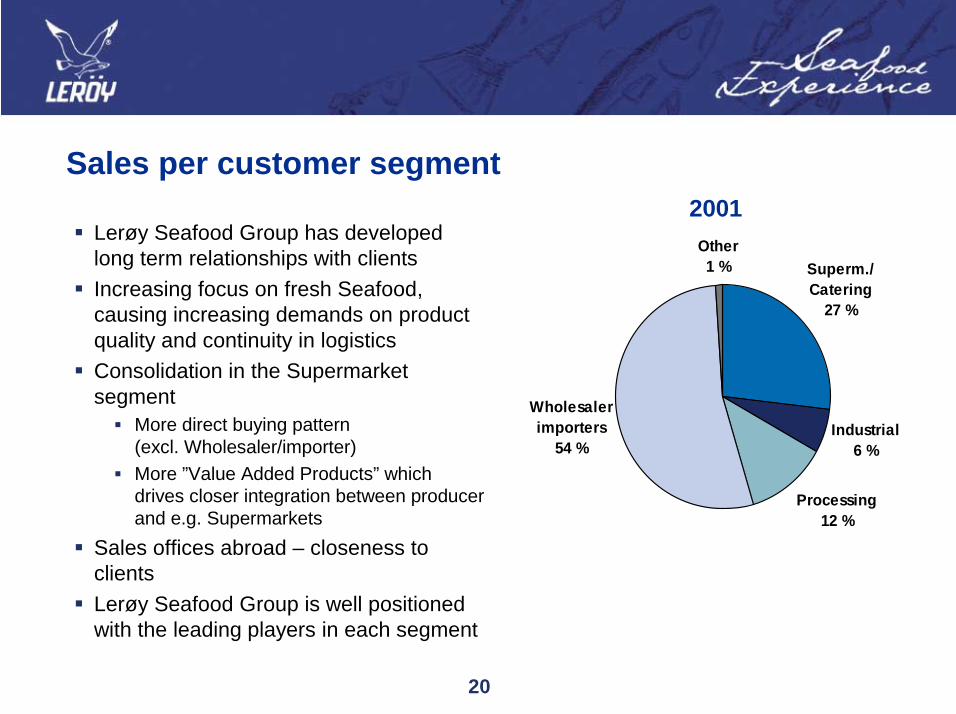
Sales per customer segment
! Lerøy Seafood Group has developed long term relationships with clients
! Increasing focus on fresh Seafood, causing increasing demands on product quality and continuity in logistics
! Consolidation in the Supermarket segment
! More direct buying pattern (excl. Wholesaler/importer)
! More ”Value Added Products” whichdrives closer integration between producer and e.g. Supermarkets
! Sales offices abroad – closeness to clients
! Lerøy Seafood Group is well positioned with the leading players in each segment
Industrial6 %
Processing12 %
Other1 %
Wholesaler importers
54 %
Superm./ Catering
27 %
2001

Lerøy Smøgen Seafood AB (51%)
! Shareholder structure! Lerøy Seafood Group ASA 51%! Lars Stranne (Man. Dir.) 49%
! Acquisition price NOK 16 million! Core business
! Production of smoked seafood products! Seafood salads! Shellfish in brine
! Part ownership acquired in Q 3 2002, consolidated from 01.07.02
5,8Net interest bearing debt
18,9Total equity
34,9Total equities and liabilities
4,26,5Pre tax profits
4,56,8EBIT
53,264,7Turnover
20002001Mill 100%

22
! Norskott Havbruk owns 100% of Scottish Sea Farms! 50% owned by Lerøy Seafood Group ASA! 50% owned by SalMar AS
! Wholly integrated fish farms in Scotland and Shetland.! Production capacity: 25,000 – 30,000 gwt! Volume sold 2001: 21,000 gwt! Estimated sales volume 2002: 19,000 – 21,000 gwt! 2 slaughteries! Other
! Label Rouge! ISO 9002 and 14 001! ”Investor in people”! Environmental price ”VIBES of Scotland”
Norskott Havbruk (50%)

23
Norskott Havbruk Company incorporated August 1. 2001
NOKm Q3 - 2002 Q2 - 2002 Q1 - 2002 YTD 2002 Aug-Dec 2001Revenues 155,3 120,7 134 410,0 294,7EBITDA 13,5 12,9 8,7 35,1 32,1EBIT 3 2,2 -0,6 4,6 13,1Pre tax -5 -3,9 -7,8 -16,7 -0,5
Volume gw (t) 4,5 3,5 5,3 13,3 12
Balance sheet 30.09.2001 30.09.2002 31.12.2001Licences, Goodwill 397,6 383,2 387,5Fixed assets 113,3 80,7 109,7Inventories 342,9 345,4 332,9Other current assets 117,9 75,3 124,6Cash 3,1 1,0 5,1Total assets 974,8 885,6 959,8
Equity 325,7 310,0 325,7Interest bearing debt 500,2 446,7 480,7Non interest bearing debt 148,9 128,9 153,4Total equity and debt 974,8 885,6 959,8

24
Hydrotech Gruppen AS (39%)
! Ownership! 39% owned by Lerøy Seafood Group ASA! 57.3% owned by L & K Karlsen Holding AS! 3.7% owned by others
! Wholly integrated fish farms in Norway! 18 licenses
! Yearly production :! Salmon and trout 15,000 gwt
! Smolt production: appr. 5 mill! Wellboat shipping co.! Slaughtery! Processing plant

Hydrotech Gruppen NOK Q3 - 2002 Q2 - 2002 Q1 - 2002 YTD 2002 2001Revenues 155,7 66,1 61,6 283,4 350EBITDA 15,4 6,4 0,2 22,0 47,7EBIT 9,8 0,8 -5,4 5,2 25,4Pre tax 0,3 -5,2 15,6 10,7 1
Balance sheet 30.09.2001 30.09.2002 31.12.2001Licences / Goodwill 139,5 138,2 143,2Fixed assets 153,1 166,3 164,6Inventories 188,8 232,0 170,1Current assets 39,7 61,4 67,0Total assets 521,1 597,9 544,9
Equity 150,6 133,7 128,6Debt 370,5 464,2 416,3Total equity and debt 521,1 597,9 544,9Net interest bearing debt 251,9 342,2 342,6

26
Egersund Fisk AS (27%)
! Shareholder structure! Lerøy 27%! SalMar 27%! Egersund Fiskeriinvestering 9%! Others 37%
(less than 4% each)! Pelagic activity
! Fish oil, fish meal! Pelagic fish for consumption! Ownership in vessels for wild catch! Production of ice
! Part ownership acquired in 2001
Egersund Fisk 100% YTD 2002 YTD2001 2001! Turnover 289,7 145,9 340,6! EBIT 11,0 9,4 15,5! Pre tax profits 5,7 4,0 8,7
Contents
V Market glance 28
Sections Page

28
0
50
100
150
200
250
1970 1975 1980 1985 1990 1995 2000 2005 2010 2015 2020 2025 20300
1
2
3
4
5
6
7
8
9
Wor
ld p
opul
atio
n (b
illio
ns)
Wild catch - fishmeal Wild catch - food Aquaculture Population
The increase in demand for seafood will have to comefrom aquaculture

29
’000 tonnes Prognosis Growth2001 2002 2001-02E
Norway 418 440-460 5 - 10%Chile 245 280-290 14- 18%UK 149 140-145 -6 - -3%Canada 86 90-100 5 - 16%Faroe Islands 41 40-45 0 - 10%Irland 23 20-25 -13 - 9%USA 24 20-25 -17 - 4%Others 17 20-22 -18 - 29%
In total 1003 1 050-1 102 5 - 10%
Atlantic salmon – Supply side

30
Atlantic salmon – Demand side
Market Volume Volume Change2001 2002E (y/y)
EU 500 000 500 000 +0%USA 255 000 300 900 +18%Japan 65 000 61 750 -5%E Europa 35 000 47 000 +34%S E Asia 30 000 36 000 +20%Other 115 000 138 000 +20%
Total 1 000 000 1 085 000 +8,5%

31
Fresh Atlantic Salmon Norway (4-5 kgs)– price development 1997 - YTD (FNL)
NOK / Kg
Source: FHL/SSB
05
10152025303540
1997
-119
97-12
1997
-2319
97-34
1997
-4519
98-4
1998
-1519
98-26
1998
-3719
98-48
1999
-619
99-17
1999
-2819
99-39
1999
-5020
00-9
2000
-2020
00-31
2000
-4220
01-1
2001
-1220
01-23
2001
-3420
01-45
2002
-420
02-15
2002
-2620
02-37
2002
-48

32
14,00
16,00
18,00
20,00
22,00
24,00
26,00
28,00
Week40-01
Week44-01
Week48-01
Week52-01
Week4-02
Week8-02
Week12-02
Week16-02
Week20-02
Week24-02
Week28-02
Week32-02
Week36-02
Week40-02
Week44-02
Week46-02
Average price on gutted weight superior salmon, fob packing station Source: FHL
Q1-02 Q2-02 Q4-02Q3-02Average 17,57 Average 21,31 Average 19,67 Average 20,54
NOK / kg Q4-01Average 16,70

33