
Léon van Berlo / Jos van Leeuwen
33
Léon van Berlo / Jos van Leeuwen The Neighbourhood Wizard Cause and effect of changes in urban neighbourhoods
-
Upload
socrates-flavian -
Category
Documents
-
view
32 -
download
4
description
The Neighbourhood Wizard Cause and effect of changes in urban neighbourhoods. Léon van Berlo / Jos van Leeuwen. Agenda. Introduction Objective Approach (Experiencing) Liveability Data Collection Knowledge representation Prototype Evaluation and testing Conclusions and future work - PowerPoint PPT Presentation
Transcript of Léon van Berlo / Jos van Leeuwen
Léon van Berlo / Jos van Leeuwen
The Neighbourhood Wizard
Cause and effect of changes in urban neighbourhoods
05 July 2006 2
Agenda
• Introduction• Objective• Approach• (Experiencing) Liveability• Data Collection• Knowledge representation• Prototype• Evaluation and testing• Conclusions and future work• Coffee break
05 July 2006 3
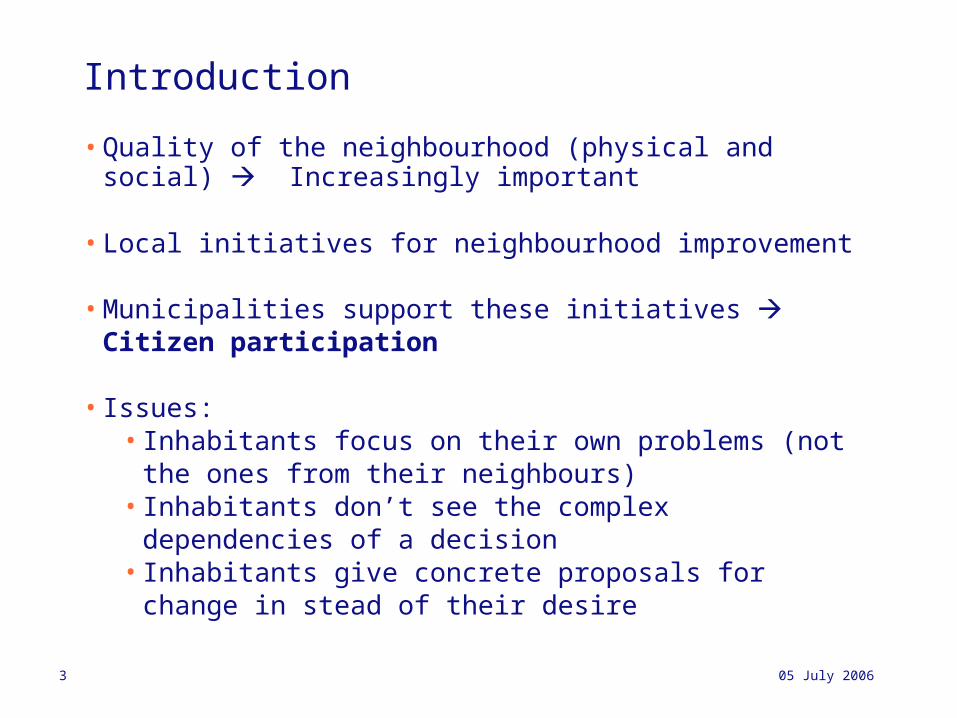
Introduction
• Quality of the neighbourhood (physical and social) Increasingly important
• Local initiatives for neighbourhood improvement
• Municipalities support these initiatives Citizen participation
• Issues: • Inhabitants focus on their own problems (not the ones from
their neighbours)• Inhabitants don’t see the complex dependencies of a decision• Inhabitants give concrete proposals for change in stead of
their desire
05 July 2006 4
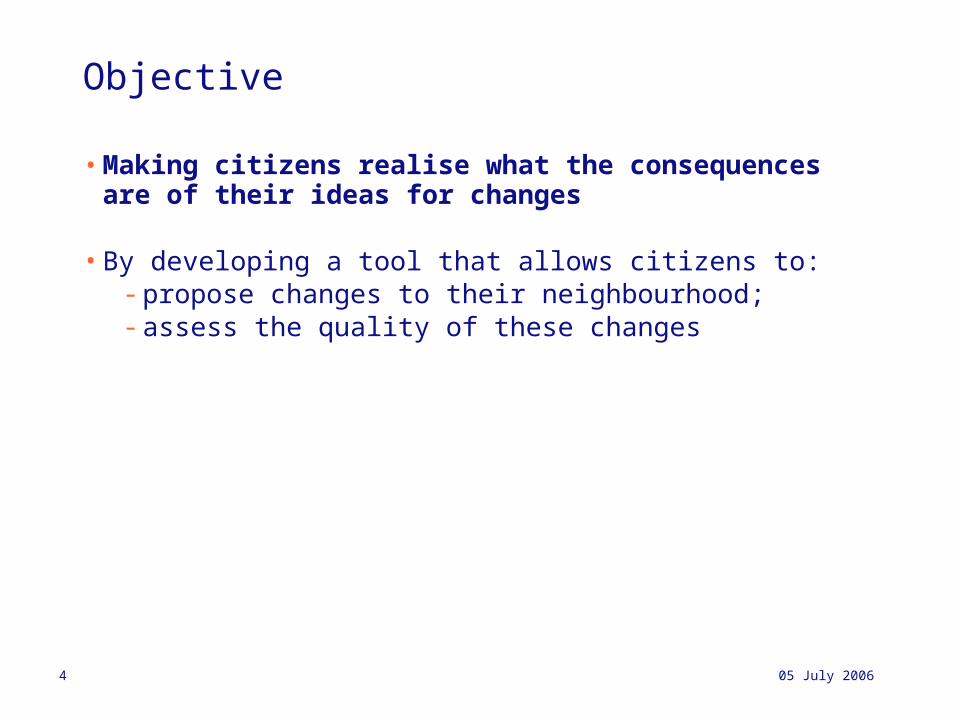
Objective
• Making citizens realise what the consequences are of their ideas for changes
• By developing a tool that allows citizens to:- propose changes to their neighbourhood;- assess the quality of these changes
05 July 2006 5
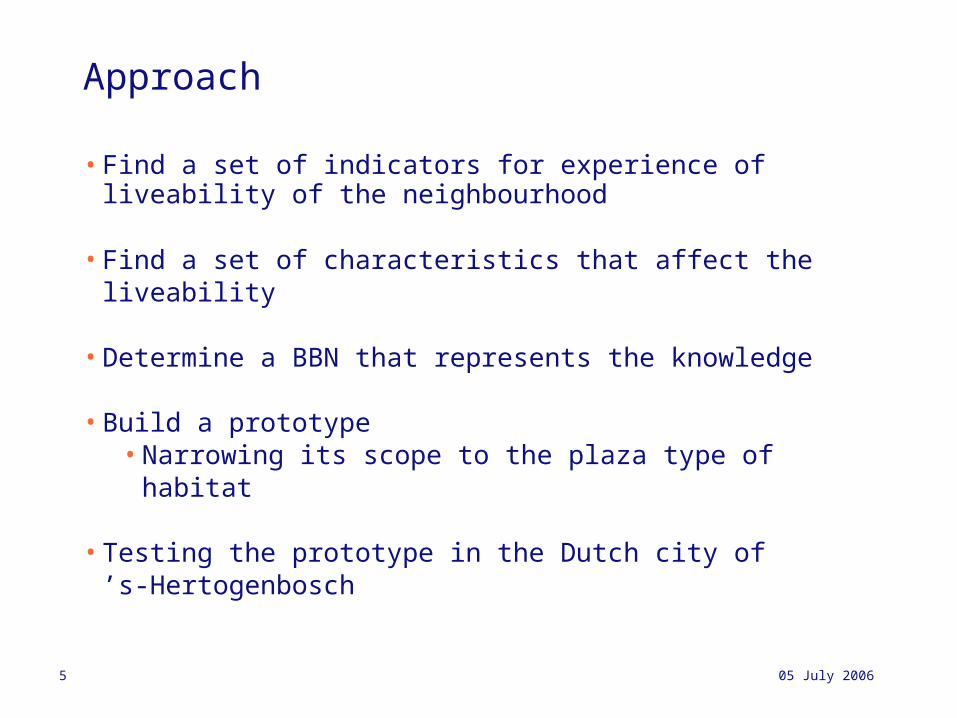
Approach
• Find a set of indicators for experience of liveability of the neighbourhood
• Find a set of characteristics that affect the liveability
• Determine a BBN that represents the knowledge
• Build a prototype • Narrowing its scope to the plaza type of habitat
• Testing the prototype in the Dutch city of ’s‑Hertogenbosch
05 July 2006 6
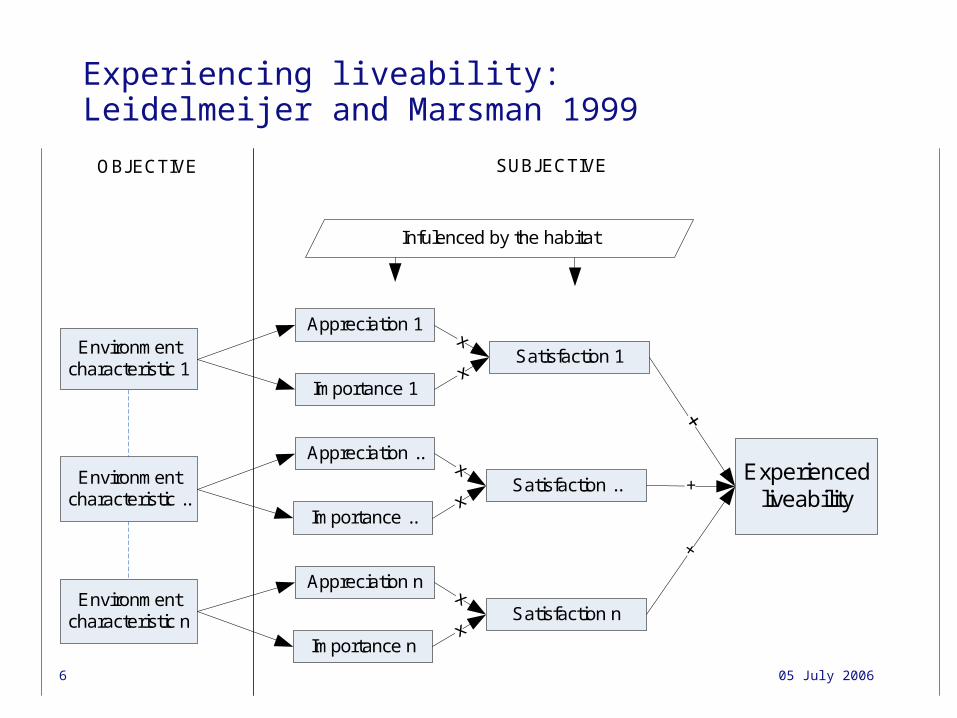
Experiencing liveability:Leidelmeijer and Marsman 1999
Environment characteristic 1
Environment characteristic ..
Environment characteristic n
Appreciation 1
Appreciation n
Importance ..
Appreciation ..
Importance 1
Importance n
Satisfaction 1
Satisfaction ..
Satisfaction n
Experienced liveability
x
x
x
x
x
x
+
+
Infulenced by the habitat
OBJECTIVE SUBJECTIVE
05 July 2006 7
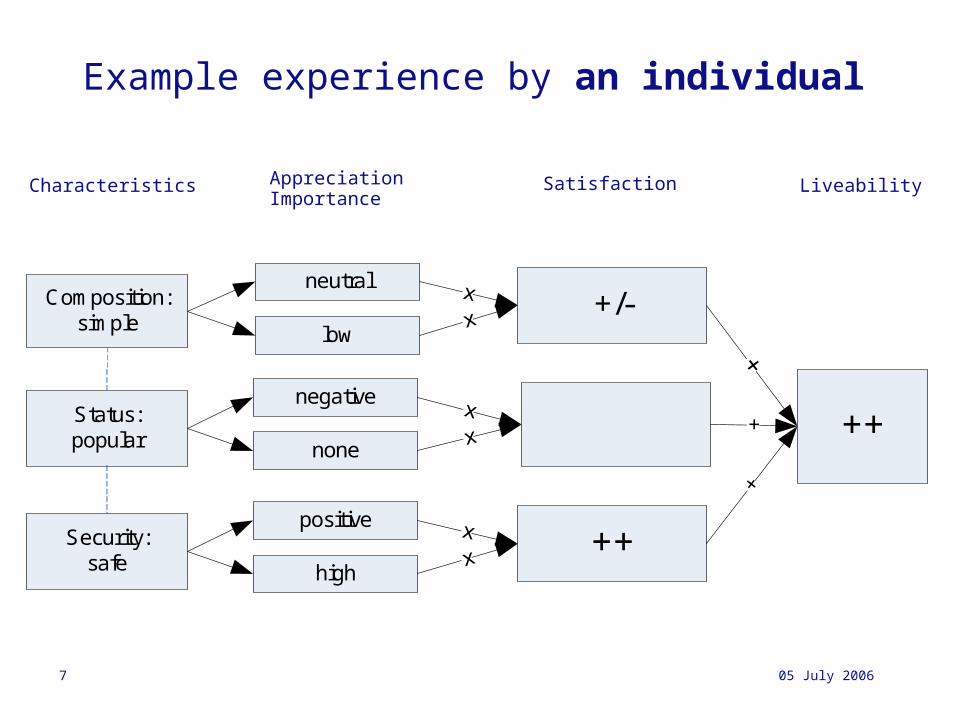
Example experience by an individual
Composition:simple
Status:popular
Security:safe
neutral
positive
none
negative
low+/-
++
++
xx
xx
xx
+
+
+
high
AppreciationImportance
Satisfaction LiveabilityCharacteristics
05 July 2006 8
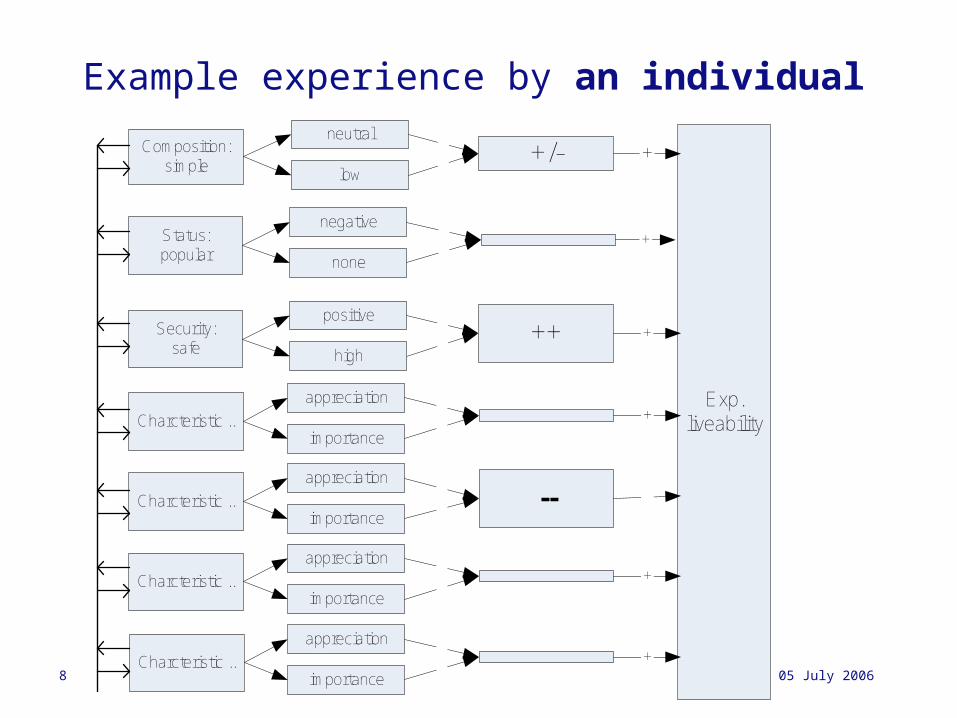
Example experience by an individual
Composition:simple
Status:popular
Security:safe
neutral
positive
none
negative
low+/-
++
Exp.liveability
+
+
+
high
Charcteristic ..importance
appreciation+
Charcteristic ..importance
appreciation
--
Charcteristic ..importance
appreciation+
Charcteristic ..importance
appreciation+
05 July 2006 9
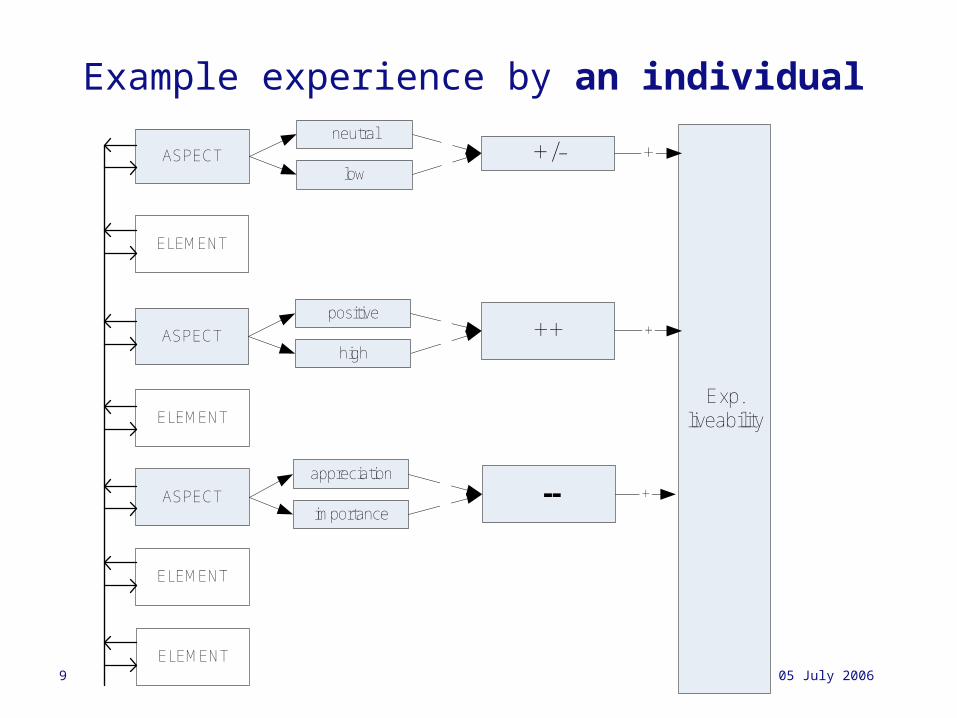
Example experience by an individual
ASPECT
ELEMENT
ASPECT
neutral
positive
low+/-
++
Exp.liveability
+
+
high
ELEMENT
ASPECTimportance
appreciation
-- +
ELEMENT
ELEMENT
05 July 2006 10
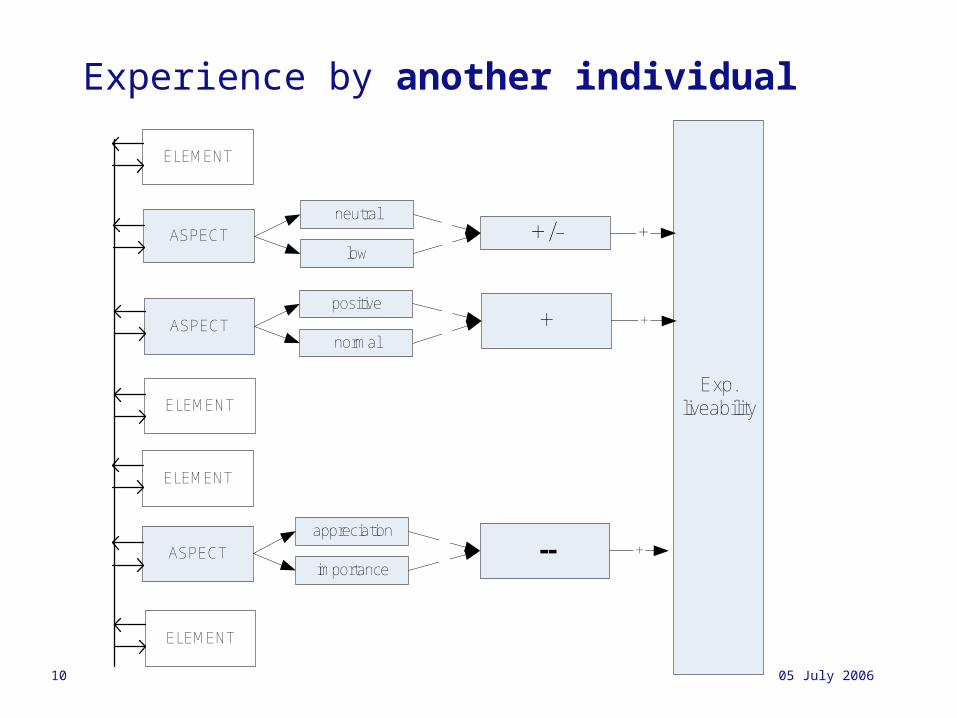
Experience by another individual
ASPECT
ELEMENT
ASPECT
neutral
positive
low+/-
+
Exp.liveability
+
+
normal
ELEMENT
ASPECTimportance
appreciation
-- +
ELEMENT
ELEMENT
05 July 2006 11
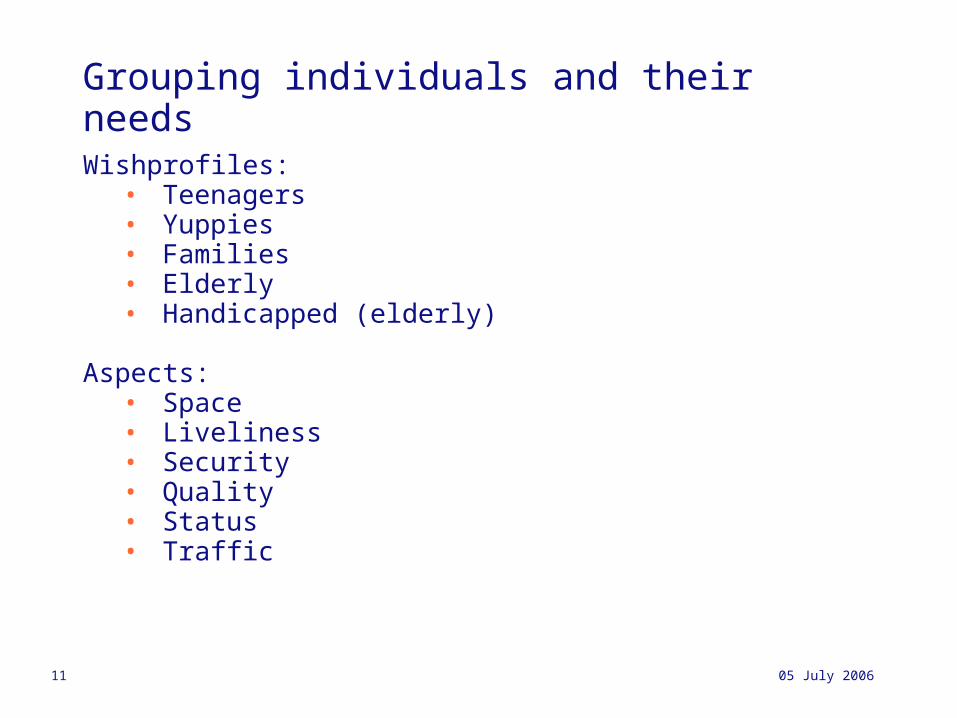
Grouping individuals and their needs
Wishprofiles:• Teenagers• Yuppies• Families• Elderly• Handicapped (elderly)
Aspects:• Space• Liveliness• Security• Quality• Status• Traffic
05 July 2006 12
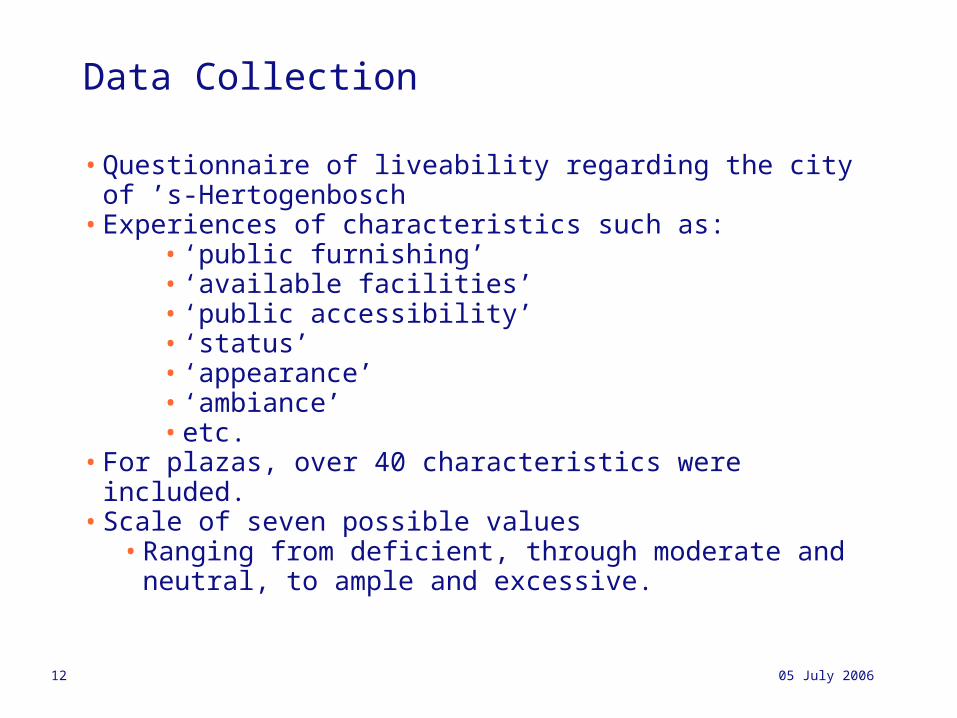
Data Collection
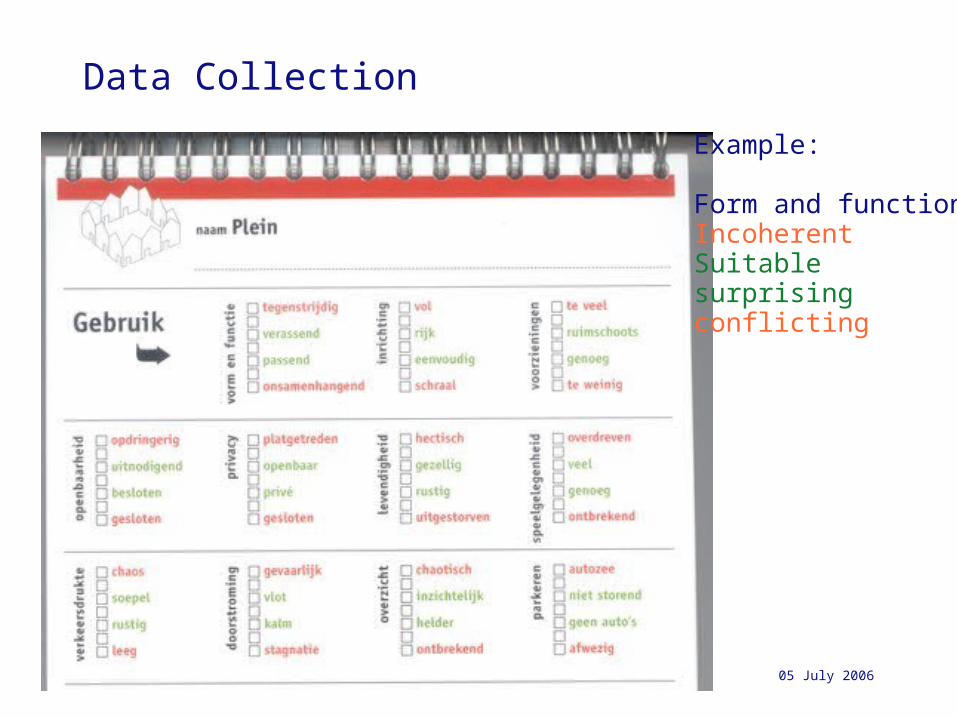
• Questionnaire of liveability regarding the city of ’s‑Hertogenbosch • Experiences of characteristics such as:
• ‘public furnishing’• ‘available facilities’• ‘public accessibility’• ‘status’• ‘appearance’• ‘ambiance’• etc.
• For plazas, over 40 characteristics were included. • Scale of seven possible values
• Ranging from deficient, through moderate and neutral, to ample and excessive.
05 July 2006 13
Data Collection
Example:
Form and function:IncoherentSuitablesurprising conflicting
05 July 2006 14
Knowledge Representation
• Bayesian Network: • Can deal with uncertainty and interdependent variables
• Determining the structure of a BN:• 1) Knowledge expert who constructs a network • 2) Examining data from the particular domain
• In this project 2 is used to come to a base network which was refined by 1.
05 July 2006 15
Structural Learning
• Hugin (www.hugin.com) was used with:• PC algorithm (Peter & Clark)
• NPC algorithm (Necessary Path Condition)
• Constraint-based learning algorithms
• Derive conditional independence and dependence statements by performing statistical tests on pairs of variables in the data set
05 July 2006 16
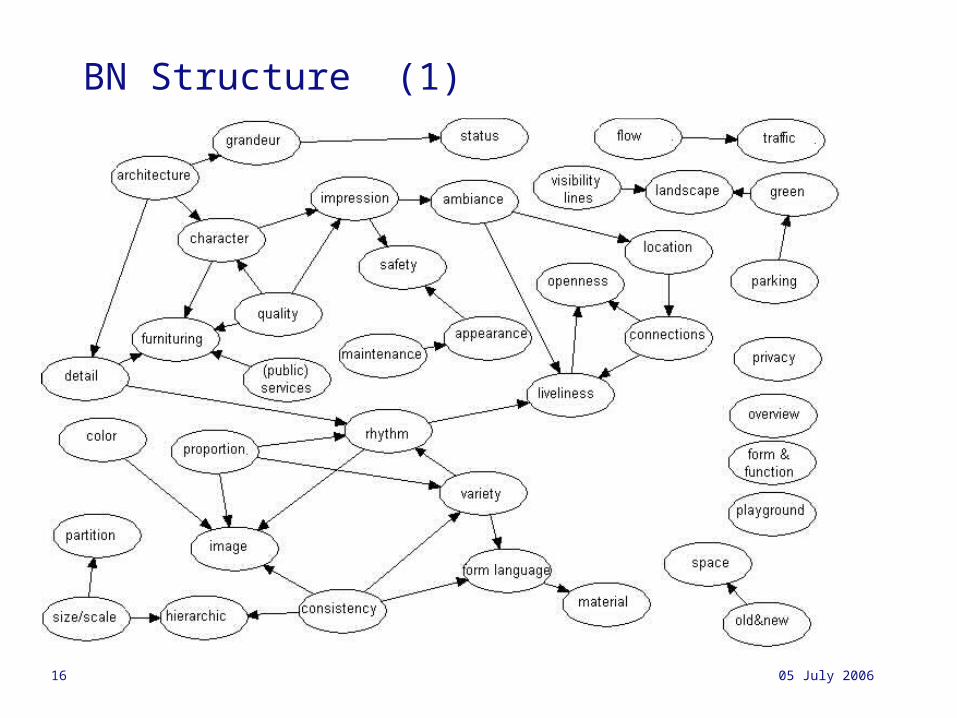
BN Structure (1)
05 July 2006 17
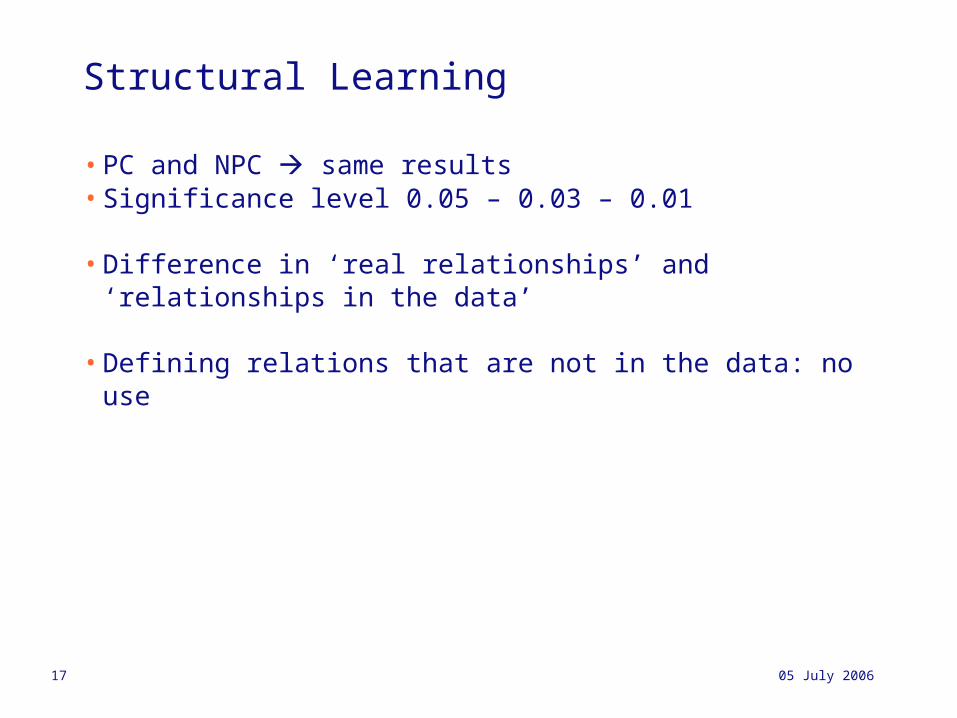
Structural Learning
• PC and NPC same results• Significance level 0.05 – 0.03 – 0.01
• Difference in ‘real relationships’ and ‘relationships in the data’
• Defining relations that are not in the data: no use
05 July 2006 18
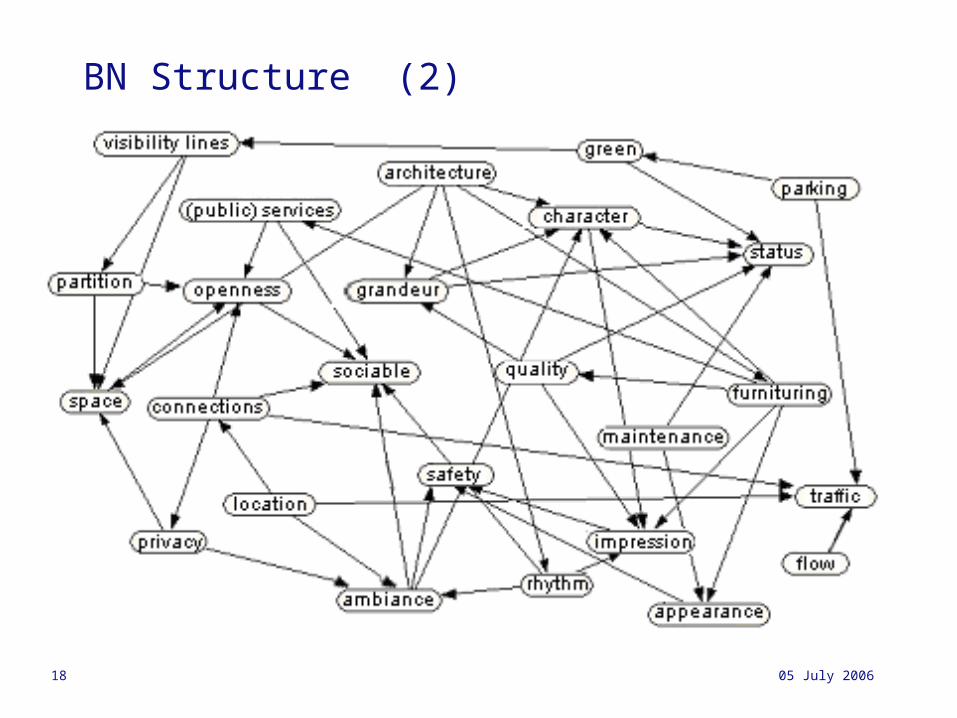
BN Structure (2)
05 July 2006 19
Prototype
• User-interaction focused on a task assigned to the user• Users can experience this like a game
• Representing the effects of changes
• Representing the desired states of the aspects for different sections of the population
• Availability of the system on Internet
• Easy to use interface and obvious navigation
05 July 2006 20
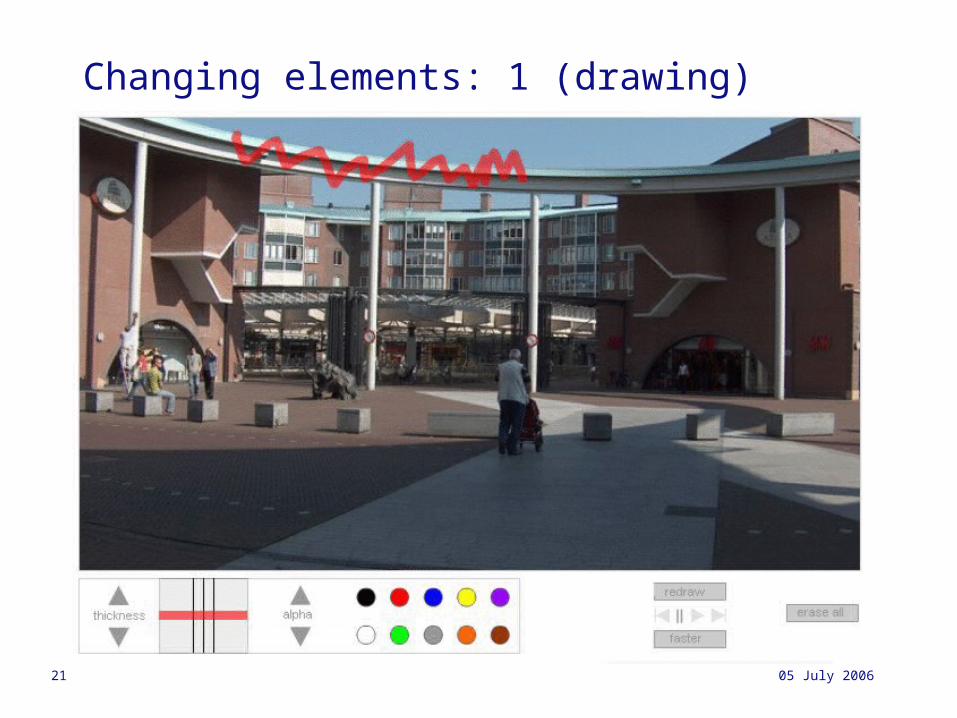
Changing elements:
• Three ways:• 1) Drawing• 2) Picking from a list• 3) Cheating
05 July 2006 21
Changing elements: 1 (drawing)
05 July 2006 22
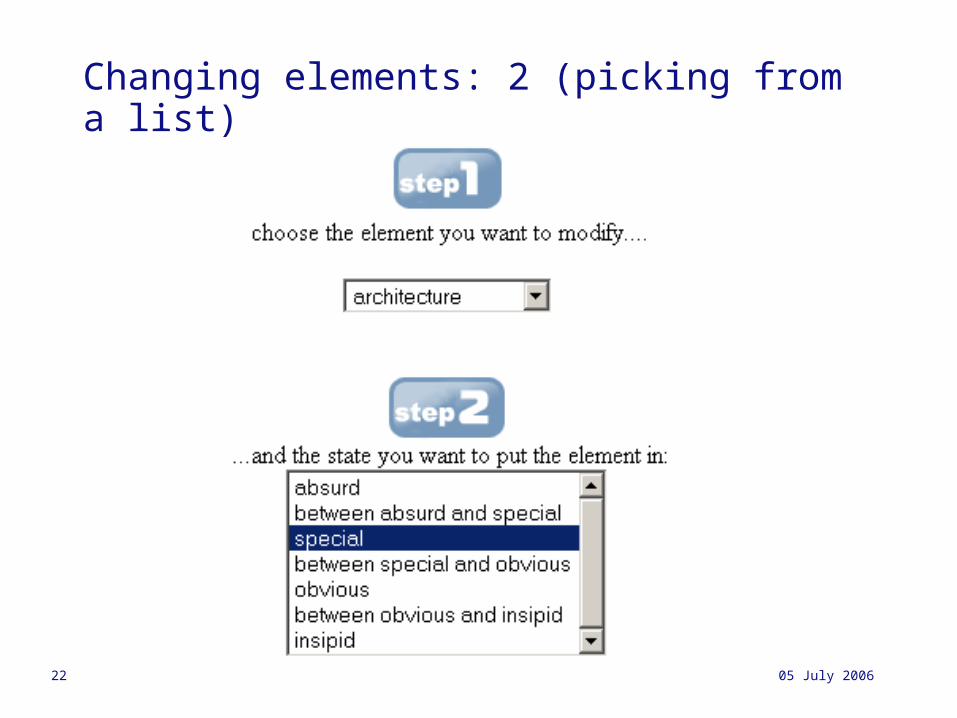
Changing elements: 2 (picking from a list)
05 July 2006 23
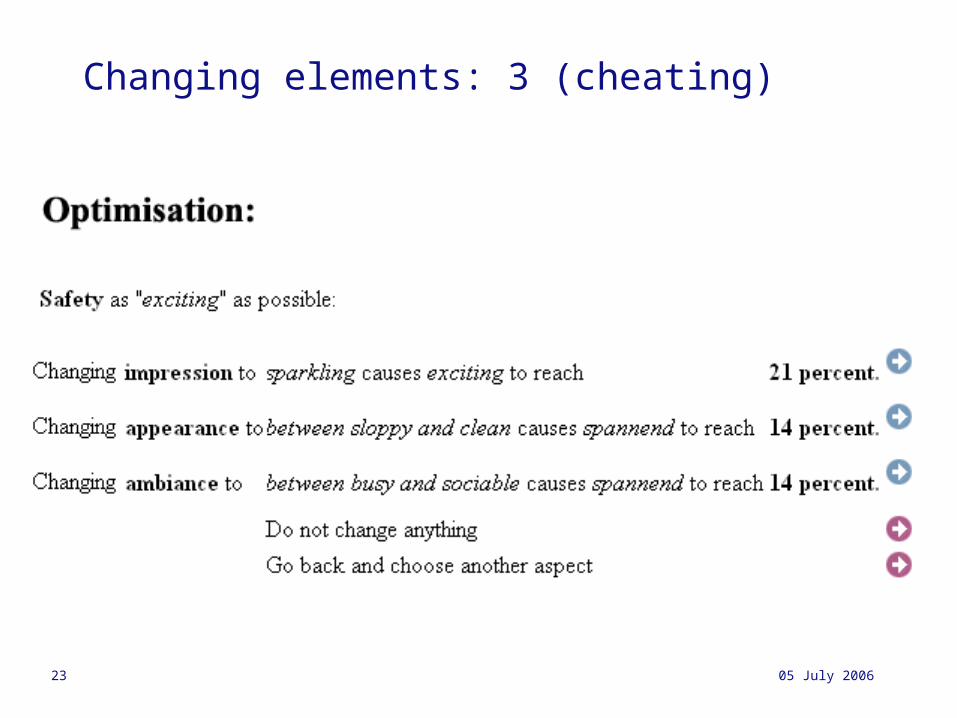
Changing elements: 3 (cheating)
05 July 2006 24
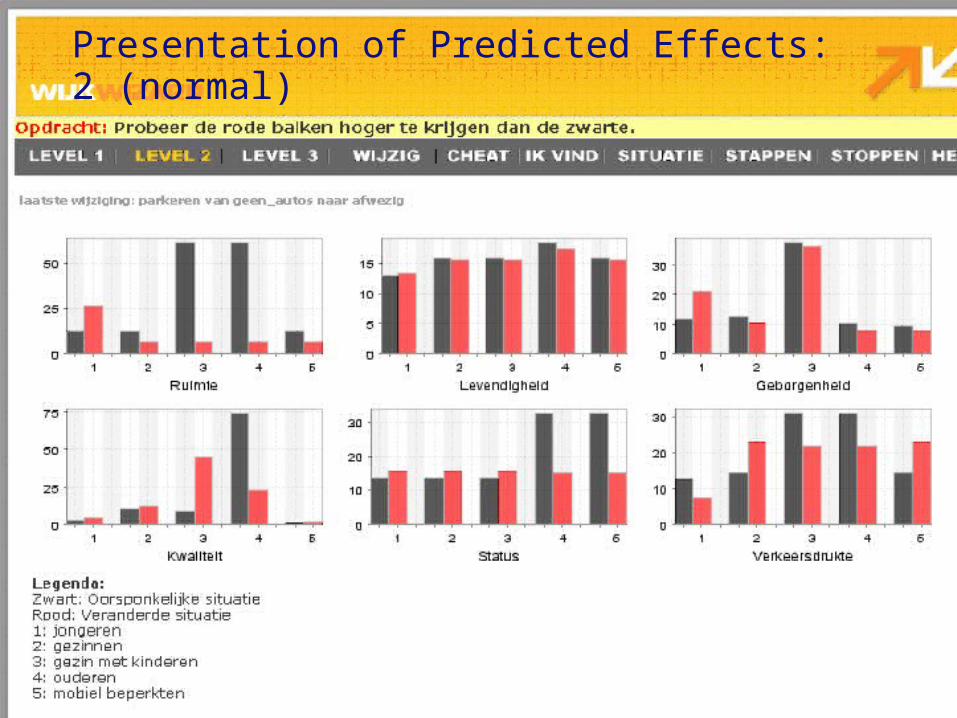
Presentation of Predicted Effects
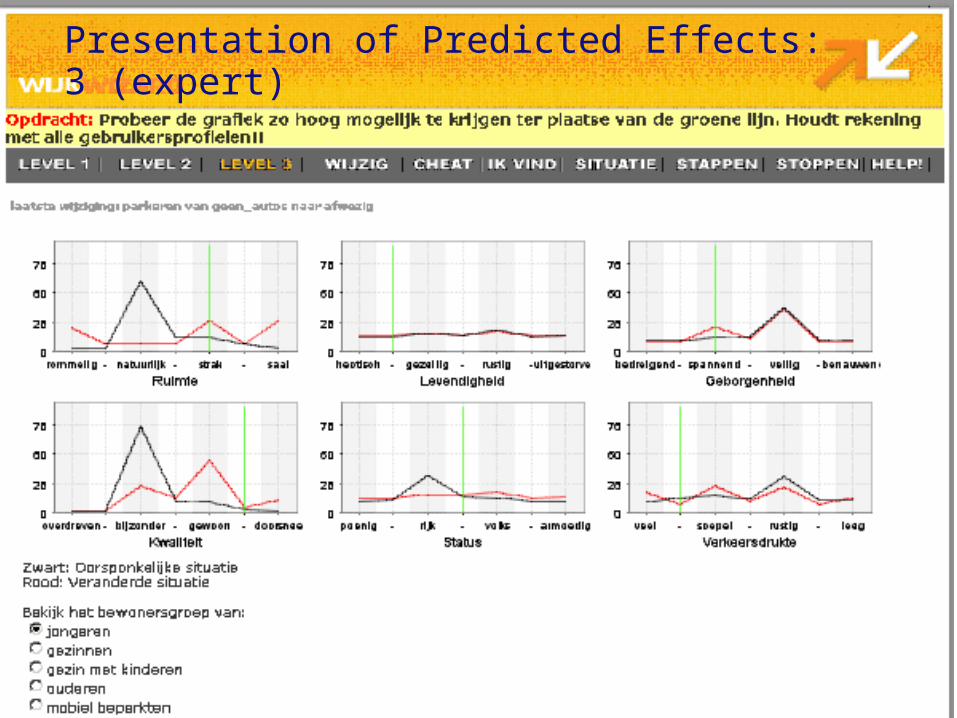
• Three levels:• 1) Simple does not give desired effect• 2) Normal• 3) Expert
05 July 2006 25
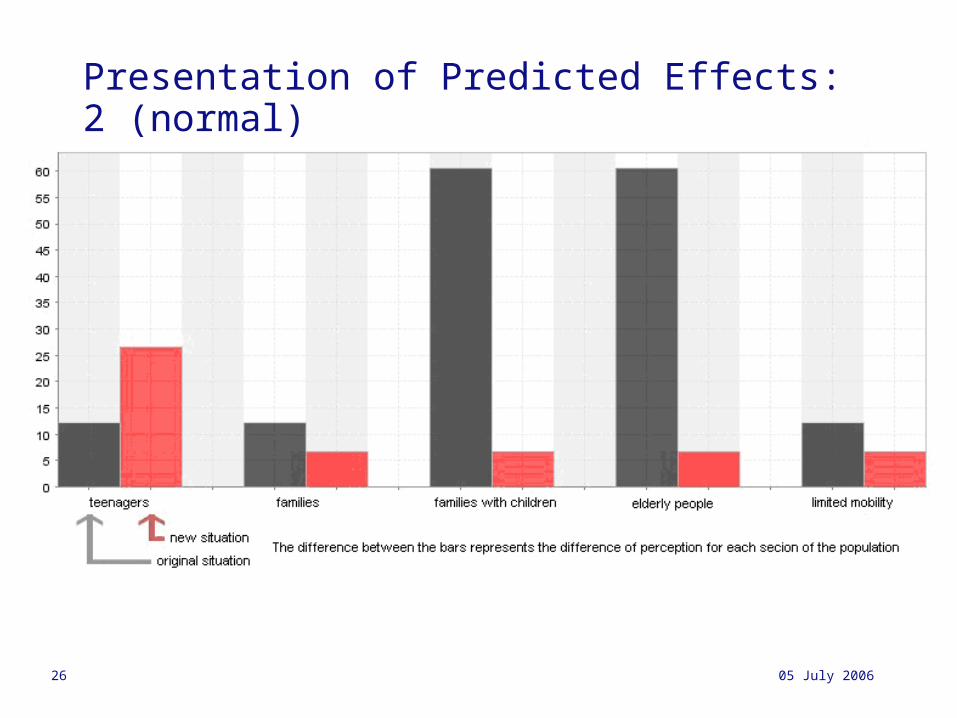
Presentation of Predicted Effects: 2 (normal)
05 July 2006 26
Presentation of Predicted Effects: 2 (normal)
05 July 2006 27
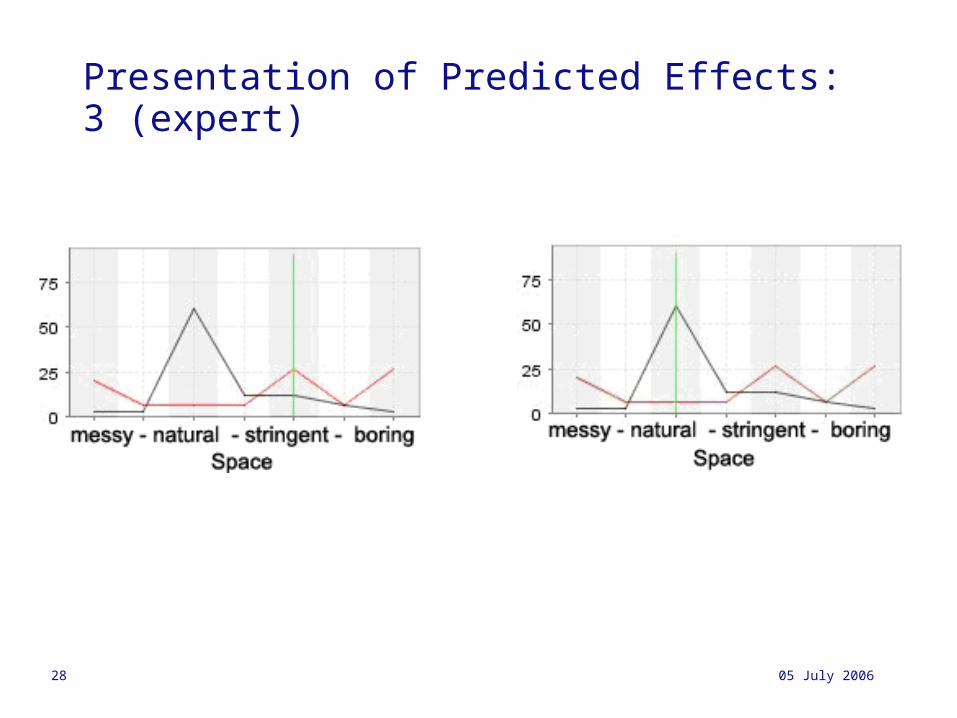
Presentation of Predicted Effects: 3 (expert)
05 July 2006 28
Presentation of Predicted Effects: 3 (expert)
05 July 2006 29
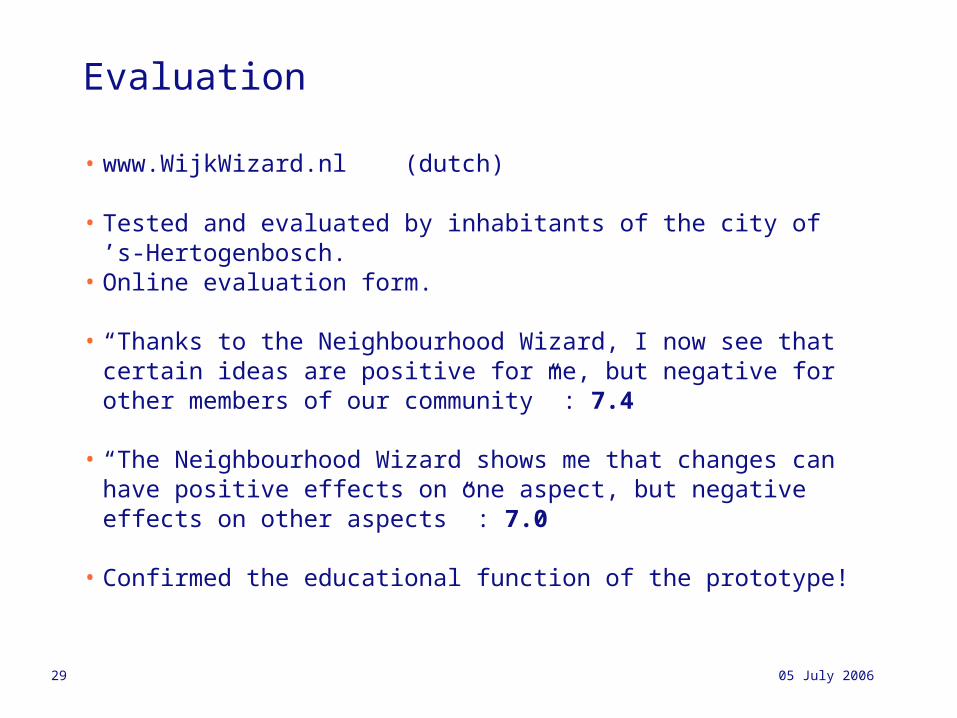
Evaluation
• www.WijkWizard.nl (dutch)
• Tested and evaluated by inhabitants of the city of ’s‑Hertogenbosch. • Online evaluation form.
• “Thanks to the Neighbourhood Wizard, I now see that certain ideas are positive for me, but negative for other members of our community” : 7.4
• “The Neighbourhood Wizard shows me that changes can have positive effects on one aspect, but negative effects on other aspects” : 7.0
• Confirmed the educational function of the prototype!
05 July 2006 30
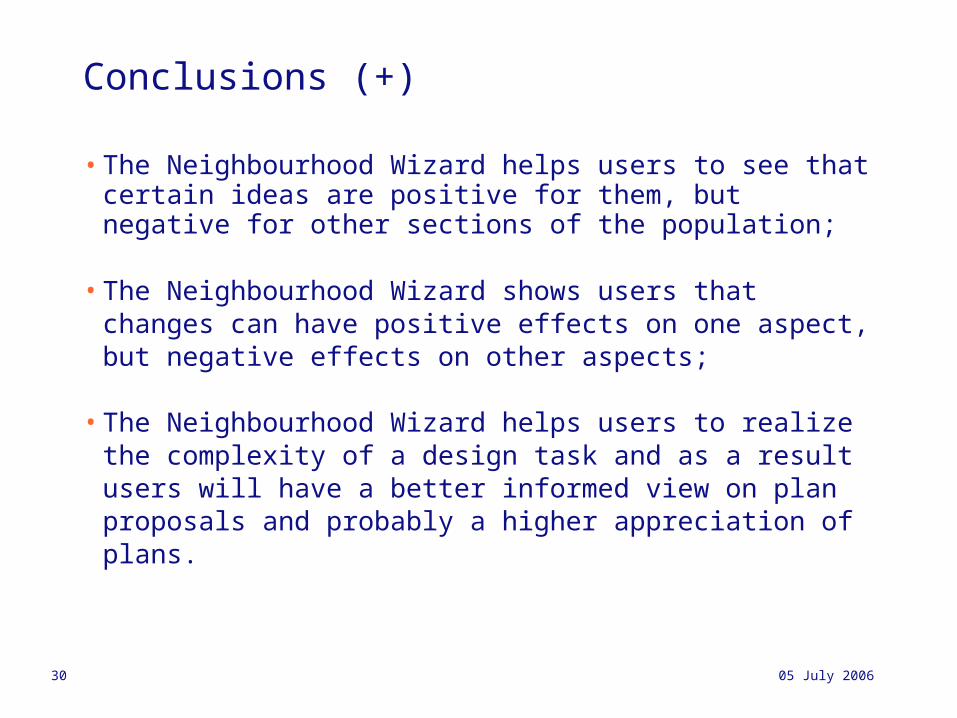
Conclusions (+)
• The Neighbourhood Wizard helps users to see that certain ideas are positive for them, but negative for other sections of the population;
• The Neighbourhood Wizard shows users that changes can have positive effects on one aspect, but negative effects on other aspects;
• The Neighbourhood Wizard helps users to realize the complexity of a design task and as a result users will have a better informed view on plan proposals and probably a higher appreciation of plans.
05 July 2006 31
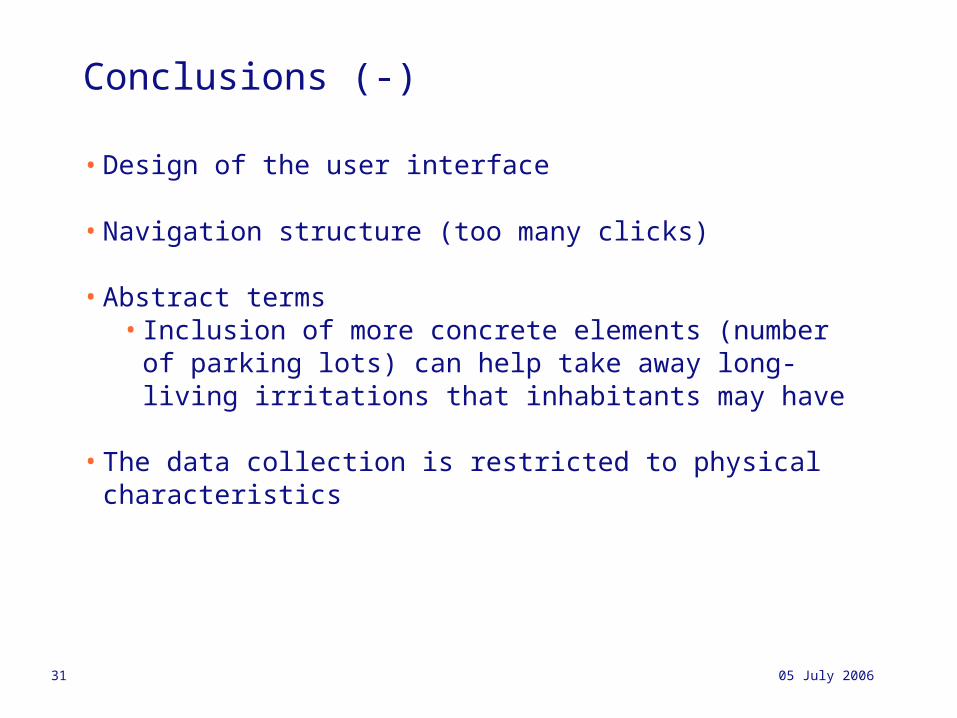
Conclusions (-)
• Design of the user interface
• Navigation structure (too many clicks)
• Abstract terms• Inclusion of more concrete elements (number of parking lots)
can help take away long-living irritations that inhabitants may have
• The data collection is restricted to physical characteristics
05 July 2006 32
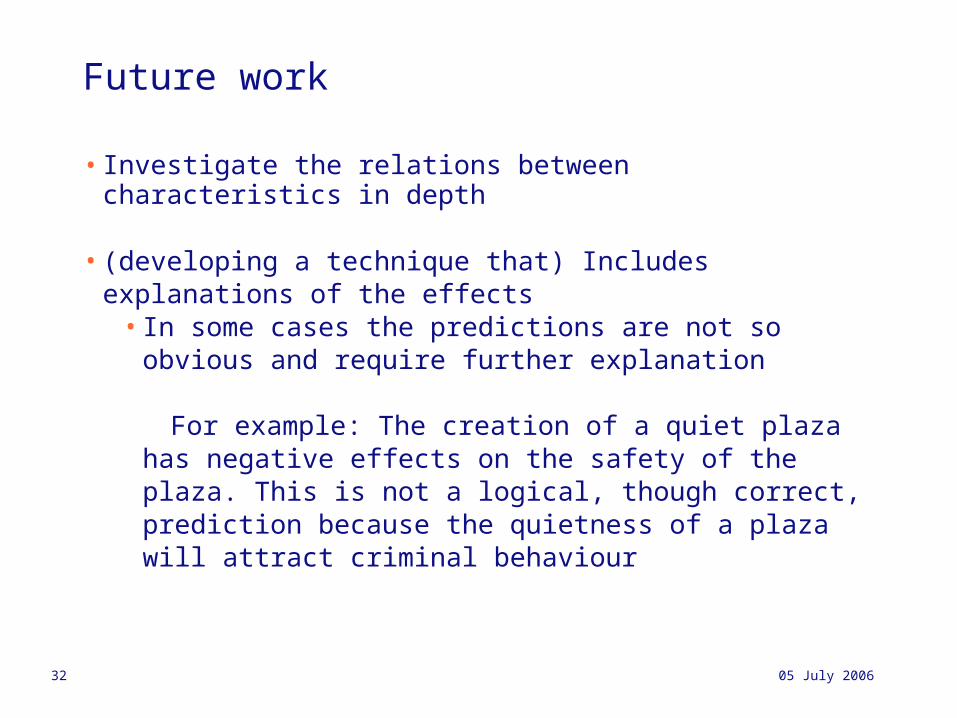
Future work
• Investigate the relations between characteristics in depth
• (developing a technique that) Includes explanations of the effects• In some cases the predictions are not so obvious and require
further explanation
For example: The creation of a quiet plaza has negative effects on the safety of the plaza. This is not a logical, though correct, prediction because the quietness of a plaza will attract criminal behaviour
05 July 2006 33
Thank you
• Questions or coffee break?
[email protected] / WijkWizard.nl [email protected] / www.ddss.nl


