Lending Standards Board Review of the Contingent ...
45
Lending Standards Board Review of the Contingent Reimbursement Model Code for Authorised Push Payment Scams Data analysis January 2021
Transcript of Lending Standards Board Review of the Contingent ...

Lending Standards Board
Review of the Contingent Reimbursement Model Code for Authorised Push Payment
Scams
Data analysis
January 2021

Review of the Contingent Reimbursement Model Code for Authorised Push Payment Scams: Data analysis
REPORT TO THE LENDING STANDARDS BOARD ANDREA FINNEY, SOCIAL RESEARCH AND STATISTICS DECEMBER 2020

i
Contents Acknowledgements......................................................................................................................................................ii
1 Introduction ........................................................................................................................................................ 1
1.1 Context ........................................................................................................................................................ 1
1.2 Scope of the data analysis....................................................................................................................... 1
1.3 Data limitations ......................................................................................................................................... 2
1.4 Purpose of the data analysis................................................................................................................... 2
2 The volume and nature of scams ................................................................................................................... 4
2.1 Volume of cases by customer type and payment channel .............................................................. 5
2.2 Volume of cases by firm .......................................................................................................................... 6
2.3 Case volume by case-value tier.............................................................................................................. 8
2.4 Payment volume ....................................................................................................................................... 9
3 The sums involved ........................................................................................................................................... 12
3.1 Total case value by firm ......................................................................................................................... 14
3.2 Case value by case-value tier................................................................................................................ 16
4 Decisions against scams.................................................................................................................................. 17
4.1 Decision volumes and values................................................................................................................ 17
4.2 Decision times.......................................................................................................................................... 22
5 Money returned ............................................................................................................................................... 25
5.1 Funds reimbursed ................................................................................................................................... 25
5.2 Funds repatriated ................................................................................................................................... 28
6 Preventing scams ............................................................................................................................................. 31
6.1 Transactions abandoned by customers ............................................................................................. 31
6.2 Transactions abandoned after PSP response.................................................................................... 32
7 Complaints......................................................................................................................................................... 33
7.1 Complaints received by firms ............................................................................................................... 33
7.2 Complaints referred to the Financial Ombudsman’s Service ........................................................ 35
8 Summary and conclusions ............................................................................................................................. 40

ii
Acknowledgements This report was prepared by Andrea Finney, who is an independent researcher with Social Research and Statistics. Andrea is also an Honorary Senior Research Fellow at the University of Bristol’s Personal Finance Research Centre and an Associate Researcher at Independent Social Research. The author would like to thank colleagues at the Lending Standards Board (LSB) for their help in shaping the scope of the work, managing the data requests from the signatory firms, advising on the interpretation of the data fields and input on the emerging findings.

1 Introduction Authorised Push Payments (APPs) are payments that customers request their bank or building society to make on their behalf, from their account to another account, and which normally occur instantly. In its role as an independent regulator of financial services, the Lending Standards Board (LSB) oversees the Contingent Reimbursement Model Code for APP scams (the CRM Code). 1
For the purpose of the Code, APP scams are defined as ‘a transfer of funds executed across Faster Payments, CHAPS or an internal book transfer, authorised by a Customer in accordance with regulation 67 of the PSRs, where (i) The Customer intended to transfer funds to another person, but was instead deceived into transferring the funds to a different person; or (ii) The Customer transferred funds to another person for what they believed were legitimate purposes but which were in fact fraudulent.’ 2
1.1 Context The CRM Code was launched in May 2019. Its objective is to ensure that signatory firms in the financial service sector take steps to protect customers from APP scams. There are currently nine UK banks and building societies which have signed up, voluntarily, to the Code: Barclays Bank, The Co-operative Bank, HSBC, Lloyds Banking Group, Metro Bank, Nationwide Building Society, NatWest (including Royal Bank of Scotland and Ulster Bank), Santander, and Starling Bank. As part of its governorship responsibility to the Code, the Lending Standards Board (LSB) is conducting a formal review of it, including a public consultation. The LSB also commissioned a data analysis exercise of early data from signatories to the Code to support the review, the subject of this report.
1.2 Scope of the data analysis The LSB requested summary data regarding APP scams which have been reported to the nine current signatories to the CRM Code and which fall within the scope of the Code. The period covered by the request was from the launch of the Code on 28 May 2019 to 01 July 2020.
The standardised request was divided into three summary data sheets per signatory, one for each of three case-value tiers (less than £1,000, £1,000 to £10,000 and more than £10,000). The request was further broken down by eight scam types: Invoice and Mandate Fraud; CEO Fraud; Impersonation: Police / Bank Staff; Impersonation: Other; Purchase; Investment; Romance; and Advance Fee. For each scam type (and the total for all APP scams) signatories were asked to complete 52 fields of information per case-value tier, relating to:
• Case volume • Case value • Payment volume • Repatriation of funds • General expectations • Prevention • Response volume • Decision volume • Decision value • Decision time • Complaints
1 See https://www.lendingstandardsboard.org.uk/wp-content/uploads/2019/05/CRM-code.pdf. 2 See section DS1(2) of the CRM Code.

2
1.3 Data limitations Perhaps the most important limitation of the data is that they cover a period of 13 months from the very start of the launch of the Code. We are aware that signatory firms were at different stages of development of their practices (including the recording and reporting of CRM Code cases) when the Code was first implemented. Some firms are understood to have experienced and corrected specific challenges early on and that others have continued to develop and improve their systems over the period for which the data has been requested. These developments are likely to have impacted the data, albeit in unknown ways. The data are not distinguishable (e.g. by quarter or month) across the period covered by the request and, as a result, it is not possible to identify how cases and their outcomes have varied in the more recent months.
There are also some small discrepancies that we have observed between the data from the nine voluntary signatory firms reported in the LSB data returns and those reported to UK Finance. 3 These relate specifically to the number and value of cases reported by firms and do not appear to affect the underlying patterning in the data (for example, by scam type and case tier). The differences are difficult to reconcile but may relate to when the timings of the data requests and the bedding-down of reporting systems within firms.
In addition, not all signatories were able to provide data for all fields within the timescale of the review, and not all signatories were able to provide data for the full period covered by the request for all fields. Due to the different ways in which individual firms capture, record and report data, it was also not possible for all firms to complete the data sheets to the precise definitions requested by the LSB against the specific fields. For example, it was not always possible for firms to distinguish charity customers from micro-enterprise customers, or mobile payments from other online payments. In one instance, a firm could not be sure that the split by customer type was 100% reliable and in another case a firm was unable to include all arms of their business in their data for one small set of fields.
Where data were incomplete or there were inconsistencies in the reporting these are noted against the individual analysis results reported in this document. It is important to bear these limitations in mind when interpreting the results of the data analysis. The data received from firms relating to general expectations (e.g. levels of media campaign activity) was not sufficiently comparable for inclusion in this round of data analysis.
Finally, the analysis reported here has explored patterns of findings and sought to explain these by reference to the key characteristics of firms. One such characteristic is firm size (for which the best available metric was CRM case volume). Although none of these metrics were ideal, categorising firms like this has enabled a comparison and analysis which does not identify firms individually. For each characteristic, at least two firms have been allocated to the categories reported in the analysis.
1.4 Purpose of the data analysis The aim of the data analysis exercise was to understand the impact of the Code on APP scams falling within the scope of the CRM and to support the LSB’s wider review of the Code.
This report describes the results of the analysis for all nine firms as a whole, overall and by scam type, and explores patterns and differences by case-value tier and firm. In particular, it categorises the firms by their size, measured principally by their overall APP CRM case volume (large, medium and small firms by this measure). Firms are also categorised based on other relevant measures as the report
3 https://www.ukfinance.org.uk/system/files/Fraud-The-Facts-2020-FINAL-ONLINE-11-June.pdf and https://www.ukfinance.org.uk/policy-and-guidance/reports-publications/2020-half-year-fraud-report.

3
progresses to explore and explain the apparent differences firms experience in their exposure to and outcomes from APP scams. While the report contains commentary on variation between firms, it does not contain data by individual firm. Where firms have been grouped into categories, the smallest reported category size is two firms.
Section 2 considers the volume and nature of scams under the CRM in the period covered (28 May 2019 to 01 July 2020). Section 3 examines the sums involved in these scams. Section 4 turns to how decisions against cases falling under the CRM had been taken and Section 5 considers the outcomes of the cases in terms of reimbursement and the repatriation of funds. Section 6 looks at the number of scams defined by the Code which appear to have been prevented through signatory action (both through automatic warnings and active intervention). Section 7 examines how many complaints were raised about how firms had dealt with scams under the Code. Section 8 summarises the findings in order to draw the main conclusions from the analysis.

4
2 The volume and nature of scams The analysis in this section explores the volume and nature of APP scams that have been reported by victims to the nine signatories to the CRM code, where the scams reported fall within the scope of the CRM Code. In this section we analyse data by both the volume of cases (the number of scams reported) and the volume of payments (the total number of payments made as part of these scams). The volume of payments is higher than the volume of cases as a customer may have made multiple APP payments as part of the same scam. For instance, in a romance scam, a customer may send money several times over a period of time at the request of the fraudster.
Across the nine signatories to the Code, firms recorded 123,066 APP scam cases falling within the scope of the CRM between 28 May 2019 and 01 July 2020. As we should expect, this is similar to the findings reported by UK Finance in their overview of payment industry fraud for a similar period, although the data reported here related to around an additional 12,000 cases. 4 This is difficult to account for but could relate to firms’ data reporting systems bedding down.
By far the largest share of the cases reported were from ‘purchase’ scams (59%; Figure 2:1), which numbered 73,024 reported cases. Cases relating to the impersonation of police or bank staff (12%) and others (9%) together made up 25,780 cases. Advance-fee scams made up a further 11,670 cases (9%). CEO fraud accounted for a very low proportion of CRM cases, making up only 0.2% of cases (269). Again, this is broadly in keeping with the data reported by UK Finance.
Figure 2:1 Volume of cases by scam type (%)
4 These relate to data from the nine signatory firms from 28 May 2019 to 30 June 2020 and are available across two reports: https://www.ukfinance.org.uk/system/files/Fraud-The-Facts-2020-FINAL-ONLINE-11-June.pdf and https://www.ukfinance.org.uk/policy-and-guidance/reports-publications/2020-half-year-fraud-report.

5
2.1 Volume of cases by customer type and payment channel The vast majority of cases were understood by firms to relate to personal accounts (96%), the rest relating to accounts held by micro-enterprise (4%) or charities (0.02%). Note, however, that this split may not be 100% reliable and that two firms were unable to distinguish charities from micro-enterprise; the true share of cases is likely to be bigger for charities in particular.
Similarly, by far the largest number of APP scams under the CRM Code were made online or by mobile payment (95%). A small number were made in branch (4%) and very few by telephone (1%, partly reflecting that some firms did not process APPs by telephone). Again, two firms were unable to provide the breakdown by channel, so this is based on data from seven firms only.
The profile of scams varied considerably depending on customer type (Figure 2.1:1).
Figure 2.1:1 Volume of cases by scam type (%), by customer type and channel
Notes: Two firms indicated that the breakdown by customer type may not be fully reliable. Two additional firms were unable to distinguish charity accounts from micro-enterprise and these are all counted as micro-enterprise. Two firms were unable to provide the breakdown by channel.
The large proportion of cases relating to purchase scams was especially pronounced for personal customers’ accounts (61%). In contrast, the share of cases which related to invoice and mandate fraud was high for small business accounts (30%) and especially among those known to be charities’ accounts (44%).
There was also variation in the profile of scams by channel (Figure 2.1:1). For online or mobile payments, cases were especially likely to relate to purchase scams (59%). Payments occurring in branch were slightly more likely than payments through other channels to relate to impersonation scams by someone other than police or bank staff (15%, compared with the average of 9%) or romance scams (7%, compared with the average of 2%). Although the difference was small, cases occurring by telephone were slightly more likely than average to relate to advance fee scams (12% compared with an average of 10% for firms able to break the data down by channel).

6
2.2 Volume of cases by firm The number of APP scam cases recorded overall varied substantially by individual firm. They ranged from around 300 in one firm to 40,000 to another, with a median of around 13,500 cases (chart not shown). Although the additional data were not available to verify this, the volume of cases by firm is expected to correlate broadly with firm size on other measures. However, other factors – such as firms’ approaches to the CRM Code over the course of the period covered by the data – are also likely to have influenced case volumes, and these are explored in later analysis.
The profile of scams by scam type also varied by firm, regardless of the number of cases they recorded (chart not shown). The variation was perhaps most notable for scams relating to impersonation of police or bank staff and purchases. Due to the variation in total cases firms recorded, a small number of individual firms accounted for large shares of these scam types by some margin. This reflects a natural bias in the data due to the size of some of the firms.
We should expect a variation in the number of cases and patterning of the cases by scam type for a range of reasons, including firm size. There are different ways that we can categorise firms by size. The first of these takes their total case volume (for which we have complete data for all firms) and categorises the three firms with the fewest cases as ‘small’ firms, the three firms with the most cases as ‘large’ firms and the remaining three as ‘medium’ firms. The small, medium and large firm groupings account for 3%, 29% and 69% of the cases by volume, respectively. Categorising firms in this way does not account completely for firm size, however it does enable a comparison and analysis based on firm size which does not identify individual firms (see Section 1.3 for more information).
Based on this grouping, there is a slight variation in the profile of case volume by scam type (Figure 2.2:1). Perhaps of most note is the slightly greater, relative share of purchase scams among small firms, invoice and mandate scams among medium firms, and police and bank staff impersonation scams (and to a lesser extent other impersonation scams) among the large firms.
Figure 2.2:1 Case volume by scam type (%), by firm size Firms are grouped by size based on total case volume

7
In further analysis, not shown, a similar pattern emerged when firm size was defined by payment volume (rather than case volume). Payment volume was only available for six firms. Nonetheless, purchase-related scams remained the most common for all firm types by size.
Advance fee scams were also proportionately greater among the larger firms than medium firms and (to a lesser extent small firms). Although it is difficult to see in the chart, there is some evidence that romance scams were proportionately more likely among medium firms than either the smaller or larger firms.
Another way to think about the volume of cases by firm is to consider the volume of CRM cases as a proportion of all APPs covered by the scope of the Code. However, some data were missing on this measure. In the data that were available, the smallest firms (by case volume) had a high rate of CRM cases reported and larger firms all had a much lower rate of cases as a proportion of all APPs. This broadly tracks the finding for firm size by case volume. For this reason, firms are not analysed by case rate for the purposes of this report wherever analysis by the case volume grouping is described.
Finally, firms were grouped by the total number (i.e. volume) of transactions abandoned, as an experimental proxy for the preventative activity of firms (Figure 2.2:2). These findings should be treated with caution as, in addition to data being missing for three firms, the data received from firms able to supply data on transaction numbers were not always consistent. In particular, it should be noted that transactions may have been abandoned for a variety of reasons other than scam prevention. Firms with high levels of abandoned transactions recorded proportionately more invoice and mandate, police and bank staff impersonation and advance-fee scams than others, but fewer purchase-related scams (Figure 2.2:2). Firms with low levels of abandoned transactions saw a greater proportion of purchase, investment, and romance scams relative to other scam types and comparatively few of the other scam types. Although the data we were using were incomplete and not necessarily consistent, there could potentially be (or at some point since implementation of the Code have been) an issue with firms’ warnings for this second group of scams.
Figure 2.2:2 Case volume by scam type (%), by grouped firm Firms are grouped based on volume of abandoned transactions
Notes: Missing abandoned transactions data for three firms. There may be inconsistencies in firms’ data.

8
2.3 Case volume by case-value tier The data received by all nine firms was broken down by the value of the cases. The three tiers reported against are cases of less than £1,000, those £1,000 to £10,000 and those more than £10,000. Cases valued at less than £1,000 made up three quarters of all cases reported under the CRM Code (75%). A further one in five had a value of up to £10,000 (21%), with only one in twenty-five (4%) valued at over £10,000. This is very similar to the findings reported by UK Finance, mentioned above, for the similar period.
The profile of scams, by type, varied markedly by the value of the case (Figure 2.3:1).
For scams of less than £1,000, purchase-related scams dominated (making up 79% of scams recorded; Figure 2.3:1). Advance fee scams were also comparatively common for this tier (10%) and the middle tier (8%) when compared with cases valued at more than £10,000 (2%). Scams involving impersonation were considerably more likely in both the middle and top tiers when compared with scams valued at less than £1,000. Notably, in the top tier, invoice and mandate (14%) and investment scams (24%) each made up a disproportionately large share of cases. Although still making up only a small share of cases, CEO fraud (1.2%) and romance scams (5%) were also relatively more common for high-value cases than for lower-value cases.
Figure 2.3:1 Case volume by scam type (%), by case-value tier

9
2.4 Payment volume As set out at the beginning of this section, the data on the volume of payments captures the number of payments that took place as part of the APP scam cases reported by firms. Across all nine signatory firms, a little over 174,000 scam payments were recorded in their data returns (174,352). This is slightly higher than reported in the UK Finance data for the similar period, but it is in keeping with the slightly higher number of cases we saw earlier.
On average, there were just over 1.4 payments per case recorded by signatories to the Code in the period covered. The profile of the payments by scam type, shown in Figure 2.4:1, closely tracks the profile of cases (Figure 2:1, above). The most notable differences are the greater share of payments for impersonation of police or bank staff (14% of payments, up from 12% of cases), investment scams (7% up from 5%) and for romance scams (4% of payments compared with 2% of cases).
Figure 2.4:1 Payment volume by scam type (%)
The average number of payments per case for these three scam types were 1.7, 2.0 and 4.1 respectively (Figure 2.4:2). This indicates that, for romance scams in particular, it is common for such scammers to repeatedly target the same account holder, perhaps first testing and later escalating their payments as their confidence in the scam increases.
When related to the total number of payments firms recorded (i.e. all payments that would be protected by the CRM Code, not just those reported as being part of an APP scam), 5 there were an estimated 50 payments falling under scam cases for every one million APPs overall. (This data relates only to the six firms providing both CRM-payment and all-payment data.) This is from a total of 2.4 billion payments which were within the scope of the CRM.
More than half of these scam payments (26.7 payments per million APPs overall) involved purchase scams (Figure 2.4:3). Just over 11 APPs per million involved an impersonation scam (6.6 per million for police or bank staff impersonation and 4.6 per million for other impersonation).
5 All payments made via the FPS (Faster Payments System), CHAPS (Clearing House Automated Payment System) or internal transfers that would have otherwise been made that way.

10
Figure 2.4:2 Average number of payments per case by scam type
Figure 2.4:3 CRM payments per million of all payments, by scam type
Notes: Figures are from six firms only. There may be small inconsistencies in these firms’ data.
When the profile of scam payments is examined by case-value tier, Figure 2.4:4 looks very similar to Figure 2.3:1, above. However, one notable difference is that investment scam payments make up a comparatively large share of all payments where cases were valued at more than £10,000. Another is that the share of romance scam payments is also large in this tier, when compared to the lower tiers and the analysis by case volume in Figure 2.3:1. This confirms that, while romance scams are rare and may initially involve smaller amounts, the total sums involved across the multiple scammed payments are often substantial for these types of scams.

11
Figure 2.4:4 CRM payments per million of all payments by scam type, by case-value tier
Notes: Figures are from six firms only. There may be small inconsistencies in these firms’ data.
Moreover, although the majority of payments reported as being fraudulent had a value of less than £1,000, fraudulent payments were reported more frequently among higher value payments, with a much higher proportion of payments with a value greater than £10,000 reported as being fraudulent (Figure 2.4:5).
Figure 2.4:5 Comparison of volume and frequency of CRM payments, by tier
Notes: Figures for CRM payments per 1,000,000 of all payments are from six firms only. There may be small inconsistencies in these firms’ data.
In other words, scam payments were much more likely to occur where case values were smaller because smaller payments are made much more frequently. But higher value payments were far more likely to be part of a scam.

12
3 The sums involved The total value of CRM cases recorded by the nine signatories to the Code between 28 May 2019 and 01 July 2020 was almost £257 million (£256,951,055). As we saw in relation to total case volume, this is also slightly higher than reported by UK Finance, across their two reports, for the nine signatory firms (by around £30 million).
The profile of scams by scam type is very different when case value is considered (Figure 3:1) than when the volume of cases is considered (also shown in Figure 3:1 for comparison). The largest share by value (25%) came from scams involving impersonation of police or bank staff (valued at £64.3 million). The value of impersonation scams of any kind totalled 40% of the value of all scams, or £104 million. Investment scams comprised the second largest individual type of scam by value (£56.8 million), accounting for 22% of the value of all scams. This is in contrast to impersonation scams together making up 21% of the volume of cases and investment scams making up just 5% of cases.
Invoice and mandate scams (£34.7 million) and purchase scams (£37.2 million) each comprised 14% of the total value of cases in the period covered by the data (Figure 3:1). For invoice and mandate scams this represents a large increase in the proportion of scams when compared with case volumes (4%). In contrast, for purchase scams, this represents large decrease in the total share than for case volume (which comprised 59% of all cases by volume). The value of romance scams, at £9.9 million, also signified twice the share of the value of cases (at 4%) than the volume of cases (at 2%).
Figure 3:1 Total case value by scam type (%)
Based on this analysis, it is apparent that the average values of individual cases were very large for impersonation and especially investment scams when compared with other types of scams. As expected, investment cases were associated with the highest average sums, at £9,943 per case (Figure 3:2). At the other end of the range, purchase scams were valued at an average of £509. Scams involving impersonation of police or bank staff were in the middle with a case-average value of £4,424.

13
Figure 3:2 Average per-case value (£) by scam type
By channel, online and mobile payments accounted for 81% of the total value of CRM cases (we saw in Section 2.1 that they accounted for 95% of the volume of cases). Cases involving branch-based payments accounted for 15% of the total value (compared with 4% of the volume) and cases involving payments made by telephone accounted for 4% of the value (compared with 1% of the volume). Based on this we can infer the lower relative value of individual online and mobile cases than those involving payments via other channels.
The profile of the total value of cases also varied to some extent by payment channel (Figure 3:3). Impersonation and purchase scams each made up a comparatively large share of the total case value for cases involving online and mobile payments, while investment scams accounted for a large share of cases involving telephone payments. Invoice and mandate scams and advance fee scams each made up a slightly larger share of the value of cases involving branch payments than the other two channels.
Figure 3:3 Total case value by scam type (%), by channel

14
3.1 Total case value by firm While we saw previously that total case volume varied considerably by individual firm, so did the average per-case value of CRM cases, from around £820 in one firm to nearly £3,000 in another. The median average value per case by firm was just over £2,000. Given the number of cases firms recorded, three firms accounted for two-thirds of the total value of CRM cases from all nine firms.
When categorised by the volume of payments a firm processed, large firms recorded a particularly high proportion of case value from scams involving impersonation of police or bank staff (Figure 3.1:1; recalling that this breakdown in based on six firms only), accounting for 36% of the case value these firms recorded. Small firms recorded a large share of their case values as relating to purchase (26%). The largest single scam type by value among medium firms, however, was for investment scams (23%). When compared to large firms, small and medium firms recorded a fairly large share against invoice and mandate scams (16% in each case).
Figure 3.1:1 Case value by scam type (%), by grouped firm size Firms are grouped by size based on total volume of payments processed
Notes: Figures are from six firms only. There may be small inconsistencies in these firms’ data.
However, when firms are compared based on whether they have a relatively higher or lower frequency of payments being reported and assessed under the CRM Code, the case value associated with impersonation and, to a lesser extent, investment was proportionately larger among those firms with low rates of CRM cases (Figure 3.1:2). We know these firms to be the larger firms by case volume (discussed in Section 2.2). For firms with a higher frequency of CRM cases being reported and assessed under the CRM Code (generally smaller firms), the values associated with purchase scams were particularly large relative to other scam types. The values associated with romance scams were also disproportionately large for these firms.
Of the six firms recording full data on abandoned transactions (who together accounted for cases valued at £78 million), those categorised as having high levels of abandoned transactions accounted for 81% of the total case value (chart not shown). Those with low numbers of abandoned transactions accounted for only 19%. This might partly be an artefact of firm size, but it is not explained entirely by that.

15
Figure 3.1:2 Case value by scam type, by grouped firm Firms are grouped by size based on the rate of CRM cases to all payments
Notes: Missing rate of cases to all payments data for three firms.
Figure 3.1:3 Case value by scam type, by grouped firm Firms are grouped based on volume of abandoned transactions
Notes: Missing abandoned transactions data for three firms. There may be inconsistencies in firms’ data.

16
When examined by scam type, firms with lower volumes of abandoned transactions recorded substantially greater values of investment scams, relatively speaking (Figure 3.1:3).
In contrast, those with the higher numbers of abandoned transactions saw comparatively high invoice and mandate, impersonation and advance fee scams as a proportion of case value (Figure 3.1:3). Romance scams were comparatively high in value in firms with low levels of abandoned transactions. Purchase scams comprised a similar proportion of the value of cases in firms with both low (14%) and high (13%) levels of abandoned transactions.
3.2 Case value by case-value tier Although cases in the highest case-value tier (of over £10,000) made up only a small proportion of the volume of CRM cases, we might still expect that contributes much of the total value associated with CRM cases. This was indeed the case. Cases valued at more than £10,000 made up £61 in every £100 scammed, amounting to £157.2 million (chart not shown). Cases valued in the lowest tier, nonetheless, totalled 24.3 million and £9 in every £100 scammed. This indicates that, while it is justified to target high-value scams, there is still a case for targeting and preventing the smaller CRM cases (and this includes where lower-value cases may escalate to become higher-value cases, such as for romance and investment scams).
When looking at scam type as a proportion of the total case value, purchase scams again accounted for a large proportion, by value, of cases valued at less than £1,000 (57%; Figure 3.2:1). Compared with other tiers, advance fee scams also made up a large share of the value of smaller scams (11%). In fairly stark contrast, impersonation (police and bank staff) scams made up a large share of the value of middle-tier cases (35%), and CEO fraud scams are conspicuous in this tier too (albeit accounting for only just over 1% of the total value here). In the highest tier, in which individual cases were all more than £10,000, invoice and mandate scams (16%) and investment scams (33%) were proportionately larger; investment scams made up the single largest share in this tier overall and accounted for around a quarter (or £51.2 million) of the £257 million case value across all cases. The share of the total from romance scams increased steadily with each tier (from 1% to 3% to 5% in the highest tier).
Figure 3.2:1 Case value by scam type, by case-value tier

17
4 Decisions against scams The greatest volumes and values of CRM payments firms recorded attributed the customer, alone, as being liable, followed by decisions in which blame shared by more than one party (victim PSP, recipient PSP or the customer). 6 In the majority of cases, a decision was made quickly, within 15 days.
4.1 Decision volumes and values Decisions against scams are recorded by firms per individual CRM payment rather than for each case as a whole. Seven categories of decision are used:
• Victim PSP blame • Recipient PSP blame • Shared blame (between two or more of the victim PSP, victim PSP and customer) • Customer held liable • No blame • No blame vulnerability7 • Refunded without assessment
Please note that across all the analysis reported in this section the number of payments reported against decisions exceeded or understated total CRM payments for four firms, and in two of these firms by a large number. This is most likely to due to different reporting systems for different elements of the data request. The breakdown is therefore based solely on individual decision categories as a share of the total number of decisions provided by firms in the data and no attempt has been made to reconcile these against total CRM payments.
It is also worth noting that this is one of the areas within the data which we understand to have been particularly affected by changes in individual firms’ policies and practices, particularly given challenges some firms experienced shortly after implementing the Code. We understand that this may have resulted in higher rates of victim PSP and shared blame decisions than data for a more recent period, once implementation of the Code had bedded down, would have indicated.
Notwithstanding these data challenges, across all CRM payments, decisions resulting in the customer alone being deemed liable (60%) and attribution of blame shared by victim PSP, recipient PSP or customer (17%) made up the largest decisions categories (Figure 4.1:1). No blame was attributed against 11% of payments, including 3% where no blame was also associated with vulnerability. It was unusual for either victim or recipient PSPs to be recorded as being at sole blame (5% and 1% respectively).
6 Decisions are based on assessment of which parties, if any, did not meet their ‘requisite level of care’ as set out in the CRM Code. Decision outcomes are in turn important for the level of reimbursement customers should expect and which firm (victim, recipient, both of neither) should contribute (section ALL1, p15). 7 Where vulnerability to an APP Scam is defined in section R2(3) of the CRM Code as ‘if it would not be reasonable to expect that Customer to have protected themselves, at the time of becoming victim of an APP scam, against that particular APP scam, to the extent of the impact they suffered.’ p13.

18
Figure 4.1:1 CRM decision volumes and values (%)
Notes: The analysis is based solely on data provided against decision categories only.
The total value of CRM payment decisions firms provided data for was just over £264 million (£264,589,027). This is slightly higher than total case value due to, mostly minor, discrepancies in firms’ reporting systems. By value, the breakdown by decision type was broadly similar in pattern to the breakdown above for payment volume (Figure 4.1:1). However, by value, the share by decision type was slightly greater for victim PSP blame (8% compared with 5% above), shared blame (20%, from 17%), and no blame (11%, from 8%). There was a commensurate decrease in the proportion held liable to the customer alone (55%, from 60%). There was a more notable decrease in the proportion of value where the decision was to refund without assessment (from 7% above to 1%); this suggests that firms were tending to write off a high number of only very small payments in this way. Representing the largest proportion of all CRM payment decisions by value, customer-held-liable payments amounted to nearly £147 million, and the next largest category, shared blame, accounted for over £54 million.
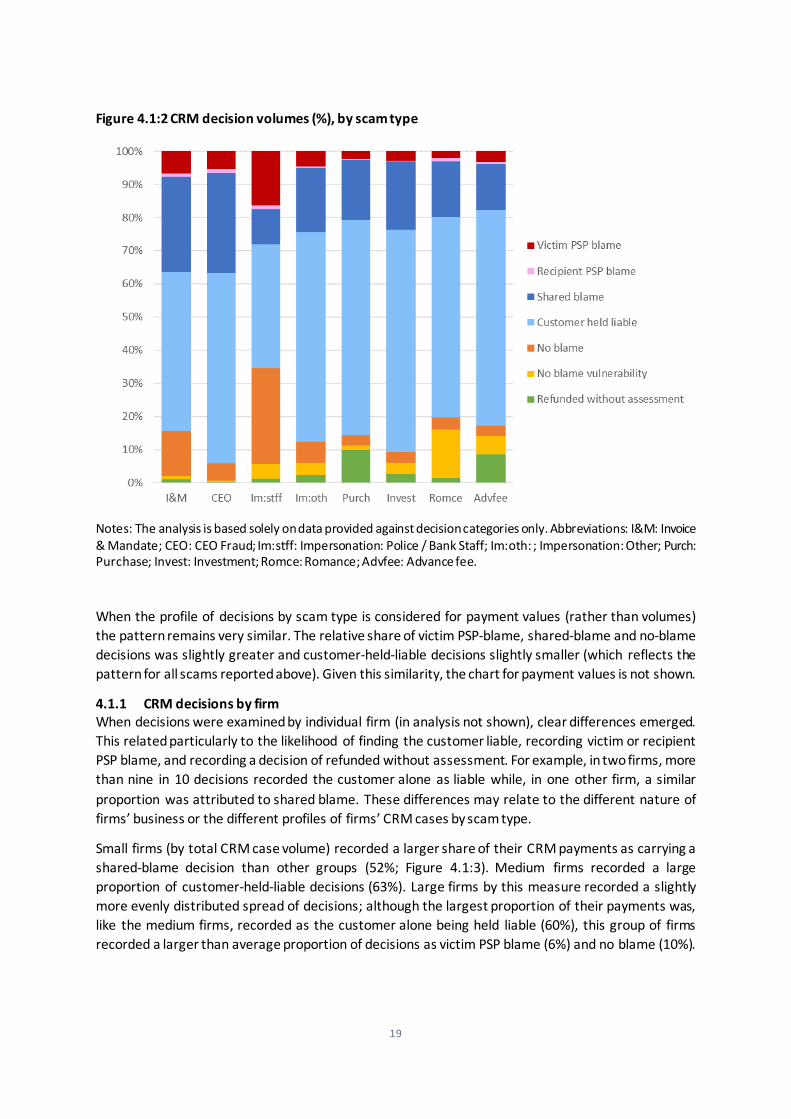
When compared by scam type (Figure 4.1:2), shared blame was particularly common in instances of CEO fraud (30%), invoice and mandate fraud (29%) and, to a lesser extent, payments involving investment scams (21%; which we saw earlier were less common than other scam types but often higher value). Around two-thirds of investment (67%), purchase (65%) and advance fee (65%) scams were deemed to hold the customer alone liable. This decision was also slightly more common than average in cases of impersonation-other (63%) and romance scams (61%). Romance scams also had a disproportionately high share of payments in which the decision was no blame vulnerability (15%). The largest proportion of no-blame decisions (29%) and victim PSP blame (16%) were recorded for scams involving the impersonation of police or bank staff.
19
Figure 4.1:2 CRM decision volumes (%), by scam type
Notes: The analysis is based solely on data provided against decision categories only. Abbreviations: I&M: Invoice & Mandate; CEO: CEO Fraud; Im:stff: Impersonation: Police / Bank Staff; Im:oth: ; Impersonation: Other; Purch: Purchase; Invest: Investment; Romce: Romance; Advfee: Advance fee.
When the profile of decisions by scam type is considered for payment values (rather than volumes) the pattern remains very similar. The relative share of victim PSP-blame, shared-blame and no-blame decisions was slightly greater and customer-held-liable decisions slightly smaller (which reflects the pattern for all scams reported above). Given this similarity, the chart for payment values is not shown.
4.1.1 CRM decisions by firm When decisions were examined by individual firm (in analysis not shown), clear differences emerged. This related particularly to the likelihood of finding the customer liable, recording victim or recipient PSP blame, and recording a decision of refunded without assessment. For example, in two firms, more than nine in 10 decisions recorded the customer alone as liable while, in one other firm, a similar proportion was attributed to shared blame. These differences may relate to the different nature of firms’ business or the different profiles of firms’ CRM cases by scam type.
Small firms (by total CRM case volume) recorded a larger share of their CRM payments as carrying a shared-blame decision than other groups (52%; Figure 4.1:3). Medium firms recorded a large proportion of customer-held-liable decisions (63%). Large firms by this measure recorded a slightly more evenly distributed spread of decisions; although the largest proportion of their payments was, like the medium firms, recorded as the customer alone being held liable (60%), this group of firms recorded a larger than average proportion of decisions as victim PSP blame (6%) and no blame (10%).

20
Similarly, a larger than average proportion of the decisions of large firms were refunded without assessment (9%), and we understand that this relates to policy decisions within individual firms to automatically refund customers below a certain case value. Compared with medium and especially small firms, shared blame was substantially less likely to be attributed (11%, compared with 31% and 52% respectively).
Figure 4.1:3 CRM decision volumes (%), by firm size Firms are grouped by size based on total case volume
Notes: The analysis is based solely on data provided against decision categories only.
In analysis which examined the same distribution of decisions, albeit in relation to the value (rather than volume) of payments, the picture was very similar (chart not shown). The share of the value of decisions recorded as shared blame or customer held liable were slightly smaller for all groups, but this reflects the picture for firms as a whole, discussed above.
The differences were apparently starker by the level of prevention activity undertaken by firms (as measured by abandoned transaction; Figure 4.1:4). Those with low absolute numbers of abandoned transactions were disproportionately more likely to decide that the customer alone was liable (91%). While firms with high numbers of abandoned transactions were still highly likely to decide that the customer alone was liable (in 50% of their decisions), they were somewhat more likely than low-prevention firms to record a decision of victim PSP blame (9% compared with 2%), shared blame (12% compared with 6%), no blame and no blame vulnerability (9% and 3% respectively). The finding that a large proportion of payments were refunded without assessment in firms with high numbers of abandoned transactions (17%) again reflects the clustering of individual firms within this category who have a policy to refund without assessment below a certain case value.

21
Figure 4.1:4 CRM decision volumes (%), by grouped firm Firms are grouped based on volume of abandoned transactions
Notes: The analysis is based solely on data provided against decision categories only. Missing abandoned transactions data for three firms. There may be inconsistencies in firms’ data.
In analysis not shown, the pattern by prevention activity was very similar when the value of payment decisions was considered. The main difference was that the proportion of the value of payments refunded without assessment reduced considerably among firms with high numbers of abandoned payments (to 1%, compared with 17% when decision volume was considered). This tends to suggest only that the firms with high numbers of abandoned transactions were tending to refund payments without assessment, not that the value of these were different from those of the firms with low numbers of abandoned transactions.
4.1.2 CRM decisions by case-value tier When the volume of CRM payment decisions is considered by case-value tier, there are some differences, which are mostly quite small (Figure 4.1:5).
Across the increasing tiers, the proportion of decisions recorded as victim PSP blame increased (from 3% in the lowest tier to 8% in each of the higher tiers) as did no blame vulnerability (from 2% to 5% in the middle and higher tiers; Figure 4.1:5). Payments given customer-held-liable decisions decreased very slightly across the tiers (from 62% to 54%). No-blame decisions were most likely in the middle tier (14% compared with 12% in the highest tier and 4% in the lowest). Very few payments were refunded without assessment in the middle and higher tiers (fewer than 1%), but for payments associated with cases valued at less than £1,000, 11% recorded this decision. This confirms the finding above that payments refunded without assessment were typically small in value and reflects individual firms’ policies, noted above, to refund automatically in these cases.

22
Figure 4.1:5 CRM decision volumes (%), by case-value tier
Notes: The analysis is based solely on data provided against decision categories only.
The pattern was very similar when decision values were considered, with no notable differences with the possible exception of a smaller proportion of value refunded without assessment in cases below £1,000 (from 11% of payment numbers to 4% of payment values; chart not shown).
4.2 Decision times The decision time is the total amount of time taken to make the final decision on the case. Firms were asked in the data request to provide a breakdown of the volume of CRM decisions meeting the criteria for three decision-time periods:
• 1 to 15 days • 16 to 35 days • Over 35 days.
In theory, the total number of decisions should be the same as total number of CRM cases. In practice, two firms under-represented their decision volumes slightly in their decision-time data return. This discrepancy was not explained by the finding that some firms had refunded cases without assessment and may instead be due to a lag in the data available from recording different systems or decisions that were still outstanding. This is not expected to affect the interpretation of the findings. However, we are aware that there may be differences in the approaches that firms use to conclude cases and notify customers. For instance, some firms may notify their customers of a decision within 15 days even though they may later find they are able to repatriate the funds to the customer, by comparison, a firms may first try to repatriate funds before notifying customers of their decision, while the final result may be the same for the customer, the latter may record a later decision time.

23
Across all CRM cases and all nine firms, a majority (59%) of decisions were provided within 15 days. Some may have been sooner than this (chart not shown), including perhaps where firms took the decision to refund without assessment. A further 24% were made within 35 days, with 17% taking longer for a decision to be made.
This pattern was broadly similar by scam type. Notably, however, purchase scams were disproportionately highly likely to have a decision reached on this quickly (65% were within 15 days; Figure 4.2:1). This might reflect the tendency for purchase scams to be smaller in value and small-value cases in some firms being automatically refunded without assessment. Decisions against CEO fraud scams were more likely than other scam types to take more than 35 days to be reached (40%).
Figure 4.2:1 CRM decision times (%), by scam type
Notes: Data relate to CRM payments. Data for two firms under-represent total CRM payments slightly.
4.2.1 CRM decision times by firm When examined by firm (in analysis not shown), some marked variations in the profile of decisions by decision time emerged. In particular, the proportion of cases in which a decision was reached within 15 days ranged from 40% in one firm to 74% in another, and one firm took over 35 days in a third of cases (33%). There was no clear relationship between refunding without assessment and a high proportion of cases being decided within 15 days.
Decision time did not appear to vary by firms’ total case volume greatly (Figure 4.2:2). In particular, the proportion of instances in which a decision was reached within 15 days was the same for all size of firm by this measure. Where there were differences, these related to a stepwise increase in the proportion of decisions taking over 35 days with each increasing size of firm. Among large firms, one in five decisions (19%) took more than 35 days compared with 8% in small firms and 13% in medium-sized firms.
When grouped by the number of abandoned transactions firms recorded, as a measure of prevention activity levels, firms with apparently high prevention levels were less likely to reach a decision within 15 days (20% compared with 40% in low-prevention firms; chart not shown).

24
Figure 4.2:2 CRM decision times (%), by firm size Firms are grouped by size based on total case volume
Notes: Data relate to CRM payments. Data for two firms under-represent total CRM payments slightly.
4.2.2 CRM decision times by case-value tier When decision times are analysed by case-value tier, clear differences emerge (Figure 4.2:3). The lowest value cases (less than £1,000) were substantially more likely to have decisions made on them within 15 days (64%) than those valued in the middle case-value tier (46%) and especially those valued at greater than £10,000 (31%). There is a commensurate stepwise increase across the tiers in the proportions taking over 35 days (from 13% to 26% and 42%). This pattern is intuitive if we assume that higher-value cases tend to be more complex, and it is understandable if firms undertake more enquiries where values are particularly high.
Figure 4.2:3 CRM decision times (%), by case-value tier
Notes: Data relate to CRM payments. Data for two firms under-represent total CRM payments slightly.
0%
10%
20%
30%
40%
50%
60%
70%
80%
90%
100%
Small Medium Large
1-15 days
16-35 days
Over 35 days

25
5 Money returned The data request covered funds returned to the customer under the CRM Code for two different measures. One related to the value of the original money identified and retained by the customer’s bank and which was returned to the customer (funds ‘repatriated’). The other related to the total value paid back to the customer to reimburse them for the fraud (funds ‘reimbursed’); this should include any funds that were repatriated as well as any further money refunded to the customer by the firm from the firm’s own funds.
In theory, it should be possible to relate the values from the two measures to each other. In practice, we understand that there are some inconsistencies in the way firms have interpreted the data request and these are subject to further investigation. As such, we are aware that there is some overlap between (and some potential additionally across) the two measures – reimbursement and repatriation – but we do not know by how much. Furthermore, the reference periods firms provided in their data returns for these measures were not always consistent. For the current report, therefore, we have considered the two measures separately in the analysis and readers should not seek to sum or subtract one set of figures to or from the other.
5.1 Funds reimbursed The data for funds reimbursed were completed by all nine signatory firms. Across all CRM cases recorded by firms, only just over a quarter were reimbursed in full (27%). A further 19% of cases were partially reimbursed. Altogether, 44% of cases were either fully or partially reimbursed. In terms of value, around 41% of funds were reimbursed, or £106.5 million from the total CRM case value of £257 million (chart not shown). This is equivalent to around £41 per £100 in total case value, across all firms. This is likely to be an under-count due to slight under-reporting of values by one firm. Even so, it is slightly higher than reported by UK Finance, in the reports noted earlier, in which 41% of funds were reimbursed in the first half of the period reducing to 38% in the second half.
The likelihood of full reimbursement and profile of reimbursement (full, partial or none), varied quite considerably by scam type (Figure 5.1:1). Cases involving impersonation of police or bank staff were most likely to fully reimbursed in full (52%) while cases involving investment or romance scams were least likely (19% of each). Cases involving impersonation of police or bank staff were also most likely of all the scam types to be fully or partially reimbursed (70%) and, as such, least likely of all the scam types not to be reimbursed at all (30%). Cases of CEO fraud and invoice and mandate fraud were almost as likely as these cases to result either in full or partial reimbursement (63% and 62% respectively).
Cases of purchase scams and romance scams, on the other hand, were most likely to not be reimbursed (60% for each of these categories; Figure 5.1:1). Given that purchase scams made up the largest share of all cases by volume, this accounts for a substantial proportion of all scam cases not reimbursed; over one third (35%; figure not shown). Advance-fee, investment and impersonation (other) scams were also likely to have resulted in no reimbursement, however (55%, 57% and 58% respectively).
When considered in terms of value, the proportion of total case value reimbursed varied considerably by scam type. CEO fraud had the highest percentage of funds reimbursed (at 93%; Figure 5.1:2). This was equivalent only to £2.1 million, however (from the total of £106.5 reimbursed). Around 57% of the value of cases involving the impersonation of police or bank staff was reimbursed, and this represented some £36.6 million of reimbursed funds. Investment scams had the lowest proportion of funds reimbursed by value of all the scam types (28%), but these cases still accounted for £16.2 million in reimbursed funds given the typically high value of individual APP investment scams.

26
Figure 5.1:1 Profile of case volume reimbursement (%), by scam type
Notes: The analysis is based solely on data provided against reimbursement categories only. This undercounts total case volume slightly due to discrepancies in the collation and reporting of different data fields by firms. Abbreviations: I&M: Invoice & Mandate; CEO: CEO Fraud; Im:stff: Impersonation: Police / Bank Staff; Im:oth: ; Impersonation: Other; Purch: Purchase; Invest: Investment; Romce: Romance; Advfee: Advance fee.
Figure 5.1:2 Total case value reimbursed (%), by scam type
Notes: These figures are likely to reflect an under-count due to slight under-reporting of reimbursement values by one firm.

27
5.1.1 Funds reimbursed by firm Cases recorded by large firms (by total CRM case volumes) were most likely to be fully reimbursed, though they were still in the minority (33%; Figure 5.1:3). Cases recorded by medium firms were most likely to result in no reimbursement (67%); this is in contrast to the finding for repatriation in which medium firms were moderately more likely to recover funds through repatriation (see Section 5.2). More than a half of cases recorded by small firms were partially reimbursed (53%) which, together with the small proportion of fully reimbursed cases (6%), meant than small firms were most likely to at least partially reimburse their customers (59%). This does not appear to relate to the profile of their CRM cases (which were disproportionately comprised of purchase and romance scams).
Figure 5.1:3 Profile of case volume reimbursement (%), by firm size Firms are grouped based on total case volume
Notes: The analysis is based solely on data provided against reimbursement categories only. This undercounts total case volume slightly due to discrepancies in the collation and reporting of different data fields by firms.
As would be expected, when firms are categorised by whether they have a low or high proportion of cases that were found to have the customer alone liable, further marked differences emerge (Figure 5.1:4). 8 In firms recording a low rate of decisions in which the customer was deemed to be liable, 72% of cases were reimbursed at least in part (including 45% which were reimbursed in full). In contrast, firms recording a high rate of customer-held-liable decisions 68% were not reimbursed at all and a further 14% were only partially reimbursed. The remaining 17% were reimbursed in full.
Moreover, firms with a low rate of customer-held-liable decisions reimbursed 51% of the funds associated with their cases, while those with a high rate of customer-held-liable decisions reimbursed only 36% of funds (chart not shown). Although we cannot relate individual reimbursement levels to
8 The firms were spread across these categories by firm size.

28
individual decision outcomes in the data we have available for the analysis, this is nonetheless again a reimbursement pattern that we should expect to see based on the firm’s decisions about customer liability. 9
Figure 5.1:4 Profile of case volume reimbursement (%), by grouped firm Firms are grouped based on the level of customer-held-liable decisions
5.1.2 Funds reimbursed by tier When analysed separately by case-value tier, there was very little difference in the profile of case reimbursement (full, partial or none), except that full reimbursement and any reimbursement (full or partial) were slightly more likely in the middle (£1,000-£10,000; 31% and 55%) and higher tiers (over £10,000; 32% and 58%) respectively (chart not shown). This compared with 25% which were fully reimbursed, and 42% which were fully or partially reimbursed, where individual cases were valued at less than £1,000. The proportion of the value reimbursed was highest for the middle tier (45%), compared with 42% in the high-value tier and 27% in the lowest tier.
5.2 Funds repatriated Unlike the funds reimbursed measure, only seven firms were able to provide data on funds repatriated. We understand that some firms do not record repatriation data at all. In addition, the point at which firms record repatriation data appears to vary, with some recording it after exhausting all attempts to repatriate, and others recording repatriation some time after closing the case, even recording repatriation twice (this relates to the inconsistencies already noted in relation to decision-
9 In instances where the customer was the only party found to have not met the requisite level of care, the customer should expect to receive 0% of funds by way of refund. Apart from any funds that were successfully repatriated, this reduces the amount customers could receive.

29
time reporting). It should therefore be assumed that there are inconsistencies in both the completeness and timing of repatriation in the data reported here.
Across the firms reporting data, funds were repatriated in a total of 22,209 cases to the sum of £30.4 million (£30,448,648). This looks to represent about one fifth of all CRM case numbers across those firms and around £1 in every £7 caught in APP scams; however, we cannot be precise about this because the repatriation data for one firm was limited to only a part of the period covered by the data request.
Recalling that repatriation (along with refunds) makes up the total funds that firms reimburse customers for, this figure should represent a distinct subset of the figures already reported for reimbursement. However, in the data we are reporting, we expect that this reflects a degree of additionality. 10
As a proportion of the total value of cases from the seven firms providing repatriation data, the scam types for which the greatest proportion of case value was recovered through repatriation was CEO fraud (36%) and invoice and mandate fraud (32%; Figure 5.2:1). Because the average value of invoice and mandate fraud cases was so large, this was equivalent to around £7.3 million repatriated for these scams (chart not shown). In contrast, for CEO fraud, the comparable value was only £0.5 million. Investment and romance scams were among the scam types recovering the smallest share of total case value (at 9% each), though this amounted to £4.2 million for the typically higher-value investment scams (and £0.7 million for romance scams).
Figure 5.2:1 Case value repatriated (%), by scam type
Notes: Missing data for two firms. Funds repatriated measure is only partial for one of the remaining seven firms and excludes a small number of cases for one firm which could not be categorised by scam type.
10 Due to the different sources of data, and inconsistencies in reporting, used, these figures should not be subtracted from the reimbursement figures already reported.

30
5.2.1 Funds repatriated by firm When analysed by firm size (measured by total CRM case volume) a broadly similar pattern in the proportion of the case value that was repatriated emerged. In particular, the largest proportion of case value was recovered through repatriation from CEO fraud cases for each group of firms, to the extent that some 59% of CEO fraud value in small firms and 100% in medium firms was repatriated. The proportion of case value repatriated remained the second largest of all the scam types for invoice and mandate for medium and large firms although for small firms the value of romance scams repatriated was higher, proportionately, than for scam types except CEO fraud. Also among small firms, the proportion of case value repatriated from impersonation (other) cases was higher than for most other scam types.
The percentage of funds repatriated across the scam types varied only slightly by firm size, with 13% repatriated in small and medium firms and 16% in large firms (chart not shown). However, the sums these were associated with varied quite considerably, from an average of £1.5 million per small firm, £22.6 million per medium firm and £50.8 million per large firm.
Figure 5.2:2 Percentage of case value repatriated by scam type, by firm size Firms are grouped based on total case volume
Notes: Missing data for two firms (one small and medium). Funds repatriated measure is only partial for one of the remaining seven firms (a large firm) and excludes a small number of cases for one firm which could not be categorised by scam type. The data may be volatile to small differences and inconsistencies, so should be treated with caution.
5.2.2 Funds repatriated by tier We find a very similar pattern across the scam types when examined by case-value tier (chart not shown). The exception was CEO fraud cases valued in the lowest tier (less than £1,000), for which only 1% of the total value was recovered through repatriation; however, we know that these cases were rare in the first place. Altogether, 10% of the total value of cases of less than £1,000 was repatriated, 15% was repatriated where individual cases were valued at more than £10,000, rising to 18% of the value of cases in the middle case-value tier (between £1,000 and £10,000).

31
6 Preventing scams As part of the request, signatory firms were asked to provide data against a series of fields by which to assess the level of APP scam prevention activity firms had undertaken. In part this was to try to help explain the patterns of scams occurring, including if this affected claim decisions and other outcomes. One such measure, of the number of transactions abandoned, has already been used in this way in this report to group firms in the analysis as a proxy for prevention levels. It is, however, an experimental measure, and transactions may have been abandoned for reasons other than the effectiveness of firms’ warnings or intervention. Therefore, while this section discusses abandoned transactions in a little more detail, it explores patterns in the data that may relate to APP scam prevention rather than seeking to draw firm conclusions about prevention per se.
The data request captured transactions abandoned by customers in reaction to a point warning, payee confirmation, or at the point of finalising the transaction in payments made online, by mobile or over the phone. Five of the nine firms were able to provide data for transactions abandoned by channel,11 although only four were able to also provide the breakdown by the transaction stage. Firms were also asked to complete information for transactions abandoned following targeted contacts with the customer by the bank or building society (‘PSP response’); only three firms were able to provide sufficient data to be included in the analysis of this measure. Data were reported for all case-value tiers combined and, due to the nature of the data, the findings cannot be reported by scam type.
The data request also asked for the number of media campaigns firms had undertaken between 28 May 2019 and 02 July 2020. These ranged from 11 to 178 across eight firms providing data but due to inconsistencies in the definitions that firms used the data are not analysed further here.
6.1 Transactions abandoned by customers Across the five firms providing complete or near-complete data, 15 million transactions (15,117,025) were reportedly abandoned during the course of payments made online, by mobile or over the phone. These may include transactions that were abandoned for reasons other than the warning messages customers saw and may be for reasons other than customer suspicion of scams. For one firm, the data were available only for part of the period covered by the data request.
The vast majority of these transactions were attempted via mobile banking (55%) or online (45%), with only a handful of transactions abandoned on the telephone (less than 1%).
For the two firms which also provided all-payments data, the number of transactions abandoned in this way represented 1% of all payments made. This varied substantially by the two firms and should be treated with caution. Conversely, based on a rough calculation, for every CRM case the five firms recorded, around 120 online, mobile or phone transactions were abandoned. In other words, although abandoned transactions reflected a small proportion of all payments, they may well have been responsible for preventing many more APP scams.
When examined by firm size (grouped here into small and medium and large firms by case volume), there was a slight bias towards transactions abandoned online in the large firms; the chart is not
11 The data by channel was used to define the abandoned transactions measure used as a category variable in the earlier analysis. PSP response was not included in that categorisation. It was possible to include one further firm in the categorisation; however, their data were not provided in sufficient detail for inclusion in the analysis here.

32
shown. Two-thirds (66%) of large firms’ abandoned transactions occurred online compared with 55% among small and medium firms. Based still on these five firms only, transactions abandoned on the telephone were limited to the small and medium firms. Due to the nature of the data, further breakdowns are not possible.
For the four firms able to break abandoned transactions down by the stage of the transaction at which they were abandoned, nearly a half of abandonments occurred when a point warning was provided (46%; Figure 6.1:1). The remainder were split equally by confirmation of payee (25%) and finalising the transaction (25%) stages. However, not all firms provided warnings at all stages and, due to the limitations of the data, these findings should be treated with caution. Further breakdowns are not possible.
Figure 6.1:1 Profile of transactions abandoned by customers (%) by transaction stage
Notes: Missing data for five firms. Not all of these firms provided warnings at all stages.
6.2 Transactions abandoned after PSP response Transactions abandoned after PSP response via a personal contact with the customer are analysed separately here. This is because only three firms were able to provide these data and one of these firms advised a different interpretation in returning their data request.
Across the three firms, there were nearly 9,000 transactions (8,810) abandoned by the customer following a PSP contact. This represented only a fraction of a percent of the total payments these firms recorded (less than 0.01%). In analysis not shown, the average volume of transactions abandoned this way was larger in the larger firms (when measured by case volume). This should be expected on the basis that firms with a high number of CRM cases are also typically the larger firms by payment volume. Unfortunately, we cannot separate out the effect of preventative activity per se by firms on the numbers of transactions abandoned or the volume of CRM cases. The finding should also be treated with caution due to the small number of firms with data. Further analysis is not possible given the limited data available.

33
7 Complaints Complaints received by the firm about CRM cases and complaints referred to the Financial Ombudsman’s Service (FOS) were included in the data request sent to all nine firms. The data for complaints received by firms were the most complete.
7.1 Complaints received by firms Data for the complaints firms themselves had received were completed by all nine signatories. For two of the firms, however, these related not just to APP scams and these have had to be excluded from the analysis. From the remaining seven firms, data were mostly completed consistently, although one firm could not provide the breakdown by tier, one could not supply data for one area of their business and one had data available only for about a half of their cases.
Based on data available from the seven firms, 6,709 complaints relating to APP scams were received by firms. This is equivalent to about 7.5% of the cases these firms recorded (this will be a slight underestimate due to the partially missing data for two firms).
A majority of the complaints related to purchase scams (43%; Figure 7.1:1). This reflects the large share of cases overall involving purchase scams (59%, reported in Section 2). In one in five cases (19%) complaints related to scams involving impersonation of police or bank staff. Complaints relating to CEO fraud (2%) and romance scams (also 2%) made up only a small proportion of all complaints. This disguises some interesting patterning, however, when the volume of cases by scam type are taken into account.
Figure 7.1:1 Volume of complaints received by firms by scam type (%)
Notes: Missing data from two firms. One firm could not supply data for one area of their business, and one had data available only for about a half of their cases.
Figure 7.1:2 confirms that purchase scams were under-represented in complaints. Compared with the overall average of 7.5% for CRM cases, only 5% of cases involving purchase scams resulted in

34
complaints being received by firms, and this was similar to the proportion of advance-fee cases resulting in complaints (also 5%). Over a half (57%) of cases involving CEO fraud scams, on the other hand, resulted in complaints. For all remaining scam types just over one in 10 cases resulted in complaints.
Figure 7.1:2 Volume of complaints received by firms (% of cases), by scam type
Notes: Missing data from two firms. One firm could not supply data for one area of their business, and one had data available only for about a half of their cases.
7.1.1 Complaints data by firm The number of complaints varied considerably by firm, ranging from fewer than 100 in two firms to over 2,000 in another (chart not shown). Notwithstanding the partial complaints data provided by two of the seven firms, there was a clear relationship between the number of cases resulting in complaints and firm size, when measured by total case volume; the two firms at the low end of the range were small, while the firm at the top end was one of the large ones. When expressed as a proportion of the total cases firms recorded, the relationship to firm size disappeared; for these same firms the figures were 4.3%, 28.2% and 11.2% respectively (chart not shown). In fact, complaints were less likely as a proportion of all cases among the medium firms (9%) than either the small or large firms (each 11%; chart not shown).
In contrast, there was a clear distinction in the proportion of complaints to all CRM cases by firms’ tendency to find customers liable. The figure was half as high again among firms with high rates of customer-held-liable decisions (8%; where a high rate is defined as 50% of more cases in which the customer alone was held liable) as low rates (5%; Figure 7.1:3). It was also somewhat higher among firms less likely to return a decision on cases within 15 days (9%) than those returning decisions within 15 days in more than a half of their cases (7%). Perhaps most marked of all, firms received a much higher proportion of complaints if they were unlikely to reimburse against cases at all (8%; based again on a threshold of 50% of cases unreimbursed) than if they were more likely to reimburse at least in part (2%). A comparison by prevention levels was not possible due to further missing data on this measure.

35
Figure 7.1:3 Volume of complaints received by firms (% of cases), by case outcomes Firms are grouped based on their ‘typical’ decisions and reimbursement profiles
Notes: Missing data from two firms. One firm could not supply data for one area of their business, and one had data available only for about a half of their cases. The dark columns indicate the category expected to be optimal for customer outcomes. For each measure ’low’ indicates fewer than 50% while ‘high’ indicates 50% or more.
7.1.2 Complaints to firms by tier Complaints as a proportion of all cases increased steadily with each increasing case-value tier. For cases valued at less than £1,000, complaints represented 5% of cases, rising to 14% for cases valued between £1,000 and £10,000 and again to 28% for cases valued at more than £10,000. This pattern is reasonable to expect, not least because CEO (and invoice and mandate and investment) fraud cases were more common with each increasing tier while purchase (and advance-fee) scams were less likely (see Section 2.3). This is despite fewer of the upper-tier cases resulting in a customer-held-liable decision (Section 4) or quick decision times (Section 4.2.2), or indeed of any of the funds being reimbursed (Section 5.1.2).
7.2 Complaints referred to the Financial Ombudsman’s Service Total FOS complaints relating to APP scams were reported by all nine signatories to the Code (although one of the firms was unable again to provide data for one area of the business). These complaints summed to just over 1,000 in number (1,086) in the period covered by the data request. For the seven firms providing comparable data, this represents around 12% of the complaints received by firms themselves. For all firms, it represents just less than 1% of CRM cases (0.9%).
Table 7.2:1 gives the breakdown in the number of FOS complaints by scam type and compares this against those for complaints to firms. Apart from CEO Fraud (for which there were no reported FOS complaints), it appears that FOS complaints – as a proportion of complaints to firms – fell away most sharply for purchase and romance scams. Conversely, complaints to firms about impersonation of police or bank staff and investment scams were most likely to be referred to the FOS. These data should be treated with caution, however, as truly comparable data were not available for all firms.

36
Table 7.2:1 Comparison of the number of complaints
Scam type Complaints to firms FOS complaints Invoice & mandate 448 92 CEO Fraud 130 0 Impersonation: Police / Bank Staff 1,268 268 Impersonation: Other 836 129 Purchase 2,862 324 Investment 559 119 Romance 143 17 Advance 408 57 Total 6,709 1,086
Notes: Complaints to firms: Missing data from two firms; one further firm could not supply data for one area of their business, and one had data available only for about a half of their cases. FOS Complaints: Missing data by scam type for one firm and one firm could not supply data for one area of their business.
Around a third of FOS complaints related to purchase scams (32%; Figure 7.2:1) and this is again a smaller share of complaints than their corresponding share of all cases (Section 2, and of complaints received by firms, above). More than a quarter of FOS complaints related to the impersonation of police or bank staff (27%), about double the share of cases for this scam type (and slightly more than for complaints received by firms). Investment scams were also over-represented in complaints to the FOS (12% compared with 5% of all cases and 9% of those resulting in complaints to the firm), as were invoice and mandate fraud scams (9% compared with 4% and 7%).
Figure 7.2:1 Volume of FOS complaints by scam type (%)
Notes: Missing data by scam type for one firm and one firm could not supply data for one area of their business.
This pattern is illustrated more clearly in Figure 7.2:2. Around 2% of all investment scams, invoice and mandate fraud and scams involving impersonation of police or bank staff were ultimately referred to the ombudsman. Only 0.4% of purchase cases and none at all relating to CEO fraud were referred on in the period covered by the data.

37
Figure 7.2:2 Volume of FOS complaints (% of cases), by scam type
Notes: Missing data by scam type for one firm and one firm could not supply data for one area of their business.
Data giving the reason for which a complaint was referred to the FOS (reimbursement decision, decision time or other) was provided by six of the firms. For these firms, an FOS referral was due most often due to reimbursement decisions (72%), and a quarter (25%) were referred due to decision times. Referrals based on reimbursement decisions appeared to be more likely in cases of advance-fee scams (94%) and impersonation (other; 82%). Decision-time referrals were comparatively more likely in the case of investment scams (40%; figures not shown).
7.2.1 Complaints to the FOS by firm While FOS complaints represented just 0.9% of cases across all firms, this varied considerably by individual firm: from 0.2% of cases in one firm to 1.9% of cases in another (chart not shown). As we might expect, the profile of FOS complaints by scam type also varied considerably by individual firm, although the figures were in some instances based on very small numbers and as few as one or two cases could change the picture considerably (chart not shown).
When considered by firm size, the percentage of cases resulting in FOS complaints were greater, relatively, as firm size decreased. Among large and medium firms, FOS referrals represented 1.1% and 1.2% of cases (Figure 7.2:3). In small firms, the corresponding figure was 3.7%. This is despite the fact that small firms were no more likely than large firms to receive complaints themselves. This might indicate that (some) small firms’ processes or decision-making when assessing complaints referred to them were not addressing customers’ concerns, rather than case handling and decision-making processes that lead to complaints in the first instance being problematic. Moreover, this does not appear to be explained by the typical profile of the case book of small firms by scam type or decision outcome or time nor the likelihood of reimbursement.
Perhaps more intuitively, firms with a high rate of prevention were less likely to see their cases referred to the FOS (0.9% compared with 1.9% of firms with low numbers of abandoned transactions; Figure 7.2:3). However, these figures may be volatile to firms missing data for abandoned transactions, so should be treated with considerable caution.

38
Figure 7.2:3 Volume of FOS complaints (% of cases), by grouped firm Firms are grouped based on total case volume and volume of abandoned transactions
Notes: Missing data for one firm in the comparison by abandoned transactions. The dark columns indicate the category expected to be optimal for customer outcomes.
Although the time firms took to take decisions on the original case did not appear to relate to the likelihood of a FOS complaint being raised, there were striking differences for the decision outcomes of firms and, in keeping with those, reimbursement. For firms with a low rate of cases in which the customer was deemed to be liable or which resulted in no reimbursement, complaints were less likely to result in FOS complaints (0.5% for each measure) than for firms finding the customer alone liable or not reimbursing at all in a large proportion of their cases (1.1% for each measure).
Figure 7.2:4 Volume of FOS complaints (% of cases), by case outcomes Firms are grouped based on their ‘typical’ decisions and reimbursement profiles
Notes: The darker columns indicate the category expected to be optimal for customer outcomes. For each measure ’low’ indicates fewer than 50% while ‘high’ indicates 50% or more.

39
7.2.2 Complaints to FOS by tier When analysed by the case-value tier, results were again striking (Figure 7.2:5). Only 0.3% of cases under £1,000 were referred to the FOS. However, this increased to 2.2% cases in the middle tier and more than doubled again for cases over £10,000 to 5.6%. This in part relates to the relatively high proportion of FOS complaints (compared with all cases) which related to invoice and mandate and investment fraud, themselves comparatively high-volume among FOS complaints (Figure 7.2:2) and carrying a high average value per case (Figure 3:2 above).
Figure 7.2:5 Volume of FOS complaints (% of cases) by tier

40
8 Summary and conclusions There were 123,000 authorised push payment (APP) scam cases defined by the Contingent Reimbursement Model (CRM) Code in the period covered by the data, valued at £257 million. The vast majority of scams related to personal accounts and payments made online.
Cases were dominated in number by purchase and low-value scams, although cases involving the impersonation of police or bank staff and investment scams made up the largest proportions of the value of scams. The scale and profile of APP scams captured by the current data request were in keeping with the data returns also reported by UK Finance, although it appears that slightly more cases in total (and hence a higher total value of cases) were reported in the LSB data compared with UK Finance.
The vast majority of all decisions against scam payments were assessed by firms as either having the customer alone held liable or with blame shared by more than one party. Perhaps more importantly, customer-held-liable decisions accounted for the largest share of decisions by value, at £147 million; given this it may be important to explore further with firms how they make their decisions. Just under six in 10 decisions were made within 15 days, although two in 10 took more than 35 days. This suggests some room for improvement and might again need to be explored further with firms, to understand why so many decisions are delayed beyond reasons that relate, for example, to case value and the profile of cases by scam type.
The value of funds that were repatriated were reported as being about £14 in every £100 scammed, while the total value of funds reimbursed to customers was reported at around £41 in every £100. In our data, some of the funds repatriated may have been additional to those reimbursed. Even so, funds were reimbursed in only two-fifths of cases. These findings are important because customer-held-liable decisions and non-reimbursement were implicated in complaints made to the FOS and longer decision times, in addition to complaints made to the firms themselves. Around 7.5% cases resulted in complaints being raised with the firm and fewer than 1% with the Financial Ombudsman Service (FOS). Complaints to the FOS were most often due, however, to reimbursement decisions.
When viewed by case-value, cases in the upper tier (over £10,000 per scam) comprised only four in every 100 cases but accounted for £61 in every £100 scammed. This underlines the importance of these cases for the sector and their customers as a whole. Low-tier cases (less than £1,000) were biased towards purchase and advance-fee scams, middle-tier cases (£1,000 to £10,000) were skewed towards impersonation and upper-tier cases were biased towards invoice and mandate fraud, investment fraud and romance scams. Liability was relatively more likely to be attributed to the victim firm or shared blame (which will include the victim PSP in many instances) in the middle and higher tiers and, commensurate with this, reimbursement was also slightly more likely. However, decision times were typically longer, and complaints were more likely to be raised both with the firm and the FOS, with the increasing value of cases across the three tiers.
When the size of firms, measured by case volume, is considered, purchase scams made up a smaller share of cases among larger firms, while scams involving the impersonation of police or bank staff comprised a larger share of cases (and case values) among these firms. Smaller firms were less likely to hold the customer solely liable than small firms and especially medium-sized firms, but larger firms were more likely to record no-blame decisions than other firms. Large firms also recorded a larger share than average of refunded-without-assessment decisions, and this appeared to be a deliberate strategy for some of these firms. Given the size of these firms, this will have a resulted in a positive outcome for a significant minority of all customers affected by scams.

41
Small firms were the most likely to reimburse their customers at all, but this was mostly by virtue of part-reimbursement. This did not appear to relate to the profile of cases small firms recorded. Medium firms, meanwhile, were the least likely to reimburse at all. Larger firms were more likely than their small or medium counterparts to reimburse in full (perhaps partly explained by the higher percentage of victim PSP and shared-blame decisions they recorded and the greater number they refunded without assessment); they also repatriated slightly more funds.
Perhaps counter-intuitively, therefore, it was the small- and large-sized firms that were slightly more likely to receive complaints. Moreover, the small firms were most likely of all to have complaints referred to the FOS, and this did not reflect the number of complaints they received themselves. It could potentially be explained by small firms’ typical handling of complaints they received.
The results tentatively suggest that firms’ prevention levels may be a particularly important indicator of cases and their outcomes. Measured using an experimental proxy that is based on the raw number of transactions abandoned by customers (in online, mobile or telephone banking in response to warnings given by the provider), firms with low levels of ‘prevention’ saw a greater proportion of investment and romance scams. Firms with a high level, meanwhile, recorded a greater proportion of their cases as coming from invoice and mandate, impersonation and advance-fee.
Although prevention levels by this measure will tend to conflate prevention activity with firm size, there were nonetheless some significant findings which might be explored further with firms and which did not emerge in the analysis by firm size. In firms with high levels of abandoned transactions, decisions were comparatively evenly spread across the categories, with greater relative proportion of cases resulting in blame attributed to the victim provider (i.e. themselves), shared blame (which in many instances will have included themselves), no blame and cases refunded without assessment (the latter being an artefact, however, of specific policies in some individual firms). They also returned a greater proportion of their decisions within 15 days. In contrast, the cases of firms with low numbers of abandoned transactions were dominated by customer-held-liable decisions and these firms, perhaps not surprisingly, saw a greater number of complaints referred to FOS as a percentage of their cases.
It may be that the different policies and practices of firms in relation to APP scams carry through from one part of their approach to APP scams to another. As such, it may be useful for firms to take a ‘whole-journey’ view when considering their approach to CRM cases under the Code.
Equally, there is scope for improving the data on which future analysis could be based. Firms’ prevention of scams is a case in point, as inconsistent reporting has limited the inferences it has been possible to draw across firms, not just in relation to levels of prevention per se, but in understanding their potential influence on case numbers and their outcomes. The analysis reported here has been limited somewhat by inconsistencies in the reporting of data against the data request and, in some cases, this derives from inconsistencies in the recording of data in firms’ own systems. The more these can be standardised the more powerful the resulting analysis, the fairer the comparisons and the more insightful interpretation of the data will be. In particular, it would be helpful to explore in more detail the definitions by which firms currently use in relation to specific measures, provide greater clarity of definition in future data requests and, collaboratively with and between firms, support a more standardised approach through all stages of data collection, from operational definitions, through internal recording systems to data reporting. Critical to this is the streamlining of data reporting to enable firms to report the same data in a standardised way for a variety of data needs.