Lender Presentation · Lender Presentation April 2017 . 78 73 116 166 166 166 35 18 95 18 62 95 31...
33
Lender Presentation April 2017
Transcript of Lender Presentation · Lender Presentation April 2017 . 78 73 116 166 166 166 35 18 95 18 62 95 31...

78 73 116
166 166 166
35 18 95
35 18 95
35 18 95
Lender Presentation
April 2017
78 73 116
166 166 166
35 18 95
18 62 95
31 108 165
Disclaimer Forward-Looking Statements; Non-GAAP Financial Measures
This presentation contains “forward-looking” statements within the meaning of Section 27A of the Securities Act of 1933, as amended (the “Securities Act”), Section 21E of the Securities Exchange Act of 1934, as amended (the “Exchange Act”), and the Private Securities Litigation Reform Act of 1995. From time to time, we also provide forward-looking statements in other materials we release to the public, as well as oral forward-looking statements. We have tried, wherever possible, to identify such statements by using words such as “anticipate,” “believe,” “expect,” “intend,” “estimate,” “project,” “may,” “should,” “will,” “likely,” “will likely result,” “will continue,” “future,” “plan,” “target,” “forecast,” “goal,” “observe,” “seek,” “strategy” and other words and terms of similar meaning.
Forward-looking statements are neither historical facts nor assurances of future performance. Instead, they are based only on our current beliefs, expectations and assumptions regarding the future of our business, future plans and strategies, projections, anticipated events and trends, the economy and other future conditions. Because forward-looking statements relate to the future, they are subject to inherent risks, uncertainties and change in circumstances that are often difficult to predict and many of which are beyond our control. Our actual results and financial condition may differ materially from those indicated in forward-looking statements. Important factors that could cause our actual results and financial condition to differ materially from those indicated in the forward-looking statements include, without limitation, our ability to generate profits in the future; our ability to execute on mergers, acquisitions and/or strategic alliances, including our ability to integrate and operate such acquisitions consistent with our forecasts; expectations regarding our existing and future installed base and win per day; expectations regarding development and placement fee arrangements; inaccuracies in underlying operating assumptions; expectations regarding customers’ preferences and demands for future gaming offerings; expectations regarding our product portfolio; the overall growth of the gaming industry, if any; our ability to replace revenue associated with terminated contracts; margin degradation from contract renewals; our ability to comply with the Europay, MasterCard and Visa global standard for cards equipped with security chip technology; our ability to introduce new products and services, including third-party licensed content; gaming establishment and patron preferences; expenditures and product development; anticipated sales performance; employee turnover; national and international economic conditions; changes in gaming regulatory, card association and statutory requirements; regulatory and licensing difficulties; competitive pressures; operational limitations; gaming market contraction; changes to tax laws; uncertainty of litigation outcomes; interest rate fluctuations; business prospects; unanticipated expenses or capital needs; technological obsolescence; and those other risks and uncertainties discussed in our most recent Annual Report on Form 10-K filed with the U.S. Securities and Exchange Commission. In light of these risks and uncertainties, there can be no assurance that the forward-looking information contained in this presentation will in fact transpire or prove to be accurate. Readers are cautioned to not to place undue reliance on the forward-looking statements contained herein, which are based only on information currently available to us and speak only as of the date hereof. Additional Notes This presentation contains industry market data, industry forecasts and other statistical information. Such information has been obtained from publicly available information and industry publications. Everi has not independently verified such information and makes no representations as to the accuracy of such information. Non-GAAP Financial Measures In order to enhance investor understanding of the underlying trends in our business and to provide for better comparability between periods in different years, we are providing in this presentation Adjusted EBITDA and Adjusted EBITDA Margin, which are not measures of our financial performance or position under United States Generally Accepted Accounting Principles (“GAAP”). Accordingly, these measures should not be considered in isolation or as a substitute for, and should be read in conjunction with, our net earnings (loss), operating income (loss), basic or diluted earnings (loss) per share and cash flow data prepared in accordance with GAAP. Everi defines Adjusted EBITDA as earnings (loss) before interest, taxes, depreciation and amortization, non-cash stock compensation expense, goodwill impairment charges, accretion of contract rights, write-down of note receivable and warrant, loss on the sale of the aircraft, acquisition and other costs related to mergers and purchase accounting adjustments, separation costs related to the Company’s former CEO, and manufacturing relocation costs less a benefit from one-time legal settlement proceeds. Everi presents Adjusted EBITDA as it uses this measure to manage its business and considers this measure to be supplemental to its operating performance. Everi also makes certain compensation decisions based, in part, on its operating performance, as measured by Adjusted EBITDA; and its credit facility, senior secured notes and senior unsecured notes require Everi to comply with a consolidated secured leverage ratio that includes performance metrics substantially similar to Adjusted EBITDA. We define Adjusted EBITDA Margin as Adjusted EBITDA divided by revenues. A reconciliation of Everi’s most directly comparable GAAP measure to Adjusted EBITDA and Adjusted EBITDA Margin is included in Everi’s earning releases located on Everi’s website at ir.everi.com. Additionally, a reconciliation of each segment’s operating income (loss) to Adjusted EBITDA is also included. On a segment level, operating income (loss) per GAAP, rather than net earnings (loss) per GAAP, is reconciled to Adjusted EBITDA as Everi does not report net earnings (loss) by segment. In addition, Adjusted EBITDA Margin is provided on a segment level. Management believes that this presentation is meaningful to investors in evaluating the performance of Everi’s segments.
2

78 73 116
166 166 166
35 18 95
18 62 95
31 108 165
Today’s Presenters and Agenda
Transaction Overview
Business Overview
Key Credit Highlights
Historical Financial Overview
Syndication Overview
Q&A
Michael D. Rumbolz President & Chief Executive Officer
Randy L. Taylor
Executive Vice President & Chief Financial Officer
Mark F. Labay
Senior Vice President, Strategic Development & Investor Relations
3
Presenters Agenda

78 73 116
166 166 166
35 18 95
35 18 95
35 18 95
Transaction Overview

78 73 116
166 166 166
35 18 95
18 62 95
31 108 165
Transaction Overview Everi Holdings Inc. (NYSE:EVRI) (“Everi” or the “Company”), a public company with a current market capitalization of $387(1) million, is a provider of video and mechanical reel gaming content and technology solutions, integrated gaming payment solutions, and compliance and efficiency software solutions
• Serves over 1,000 casinos and other gaming properties in the US, Canada, Europe, the Carribean, Central America and Asia
• Everi’s games segment (“Games”) provides electronic gaming machines to casino customers primarily through lease arrangements and direct sales of player terminals
• Leased or participation games provide significant recurring revenue and robust margins
• Everi’s payments segment (“Payments”) provides a comprehensive suite of cash access services at gaming facilities, including cash dispensing ATM transactions, credit and debit card cash access transactions, check cashing and warranty services, equipment sales and service and other software sales and services for AML and tax compliance
• Dominant provider of gaming payments solutions in North America
• For the LTM period ended March 31, 2017, Everi generated estimated consolidated revenue of $889.2(2) million and estimated Adjusted EBITDA of $205.3(2) million
• Everi has grown consolidated revenue and Adjusted EBITDA at 3.5% and 5.6% CAGRs, respectively, from 2012 to 2016
• Approximately 90% of Everi’s revenue is recurring in nature, as a result of the Company’s market dominance in the gaming cash access space and its installed base of over 13,000 gaming units
The Company is issuing a new $820 million First Lien Term Loan to refinance its existing First Lien Term Loan and Senior Secured Notes in their entirety
• Pro Forma for the transaction, secured net leverage(3) will be 3.4x and total net leverage(4) will be 5.1x based on LTM 1Q17E Adjusted EBITDA of $205.3 million
5
1) Based upon 66.1 million shares outstanding and $5.86 closing price as of 4/10/2017.
2) Adjusted EBITDA is a non-GAAP measure. LTM 1Q17E and 1Q17E amounts are based upon the midpoint of the preliminary 1Q17 management estimates of consolidated revenue of $233-$238 million ($53 - $55 million for the Games segment and $180 - $183 million for the Payments segment) and consolidated Adjusted EBITDA of $52.0 – $54.0 million ($29.5 - $30.5 million for the Games segment and $22.5 - $23.5 million for the Payments segment).
3) Pro Forma secured net leverage is computed as (total First Lien Term Loan outstanding minus Cash and Cash Equivalents) / LTM 1Q17E Adjusted EBITDA of $205.3 million.
4) Pro Forma total net leverage is computed as (total First Lien Term Loan outstanding plus total Senior Unsecured Notes outstanding minus Cash and Cash Equivalents) / LTM 1Q17E Adjusted EBITDA of $205.3 million.

78 73 116
166 166 166
35 18 95
18 62 95
31 108 165
Sources & Uses and Pro Forma Capitalization Sources and Uses ($ millions)
1) $35 million Revolving Credit Facility, undrawn at close.
2) Includes cash held on behalf of customers. The December 31, 2016 balance for cash and cash equivalents has been used for the expected balance of cash and cash equivalents Pro Forma at Close.
3) Based upon 66.1 million shares outstanding and $5.86 closing price as of 4/10/2017.
4) Adjusted EBITDA is a non-GAAP measure. See EBITDA Adjustment Detail on slide 27. LTM 1Q17E and 1Q17E amounts are based upon the midpoint of the preliminary 1Q17 management estimates of consolidated revenue of $233-$238 million ($53 - $55 million for the Games segment and $180 - $183 million for the Payments segment) and consolidated Adjusted EBITDA of $52.0 – $54.0 million ($29.5 - $30.5 million for the Games segment and $22.5 - $23.5 million for the Payments segment).
5) Interest expense includes cash paid for interest on outstanding debt obligations as well as the cash usage fees paid pursuant to the Contract Cash Solutions Agreement with Wells Fargo Bank, N.A.
Pro Forma Capitalization ($ millions) Pro Forma Credit Statistics ($ millions)
6
Sources of Funds
Revolving Credit Facility(1)$ -
First Lien Term Loan 820
Total Sources $820
Uses of Funds
Refinance Existing First Lien Term Loan $465
Refinance Existing Senior Secured Notes 335
Financing Fees 20
Total Uses $820
Current Pro Forma
12/31/2016 At Close
LTM 1Q17E Adjusted EBITDA(4)$205 $205
Interest Expense(5)$92 $84
Secured Net Leverage 3.3x 3.4x
Total Net Leverage 5.0x 5.1x
Adjusted EBITDA / PF Cash Interest Expense 2.2x 2.4x
Current Pro Forma
12/31/2016 At Close
Cash and Cash Equivalents(2)
$119 $119
Revolving Credit Facility(1)
- -
First Lien Term Loan 465 820
Senior Secured Notes 335 -
Secured Debt $800 $820
Senior Unsecured Notes 350 350
Total Debt $1,150 $1,170
Market Capitalization (4/10/2017)(3)387 387
Total Capitalization $1,537 $1,557
78 73 116
166 166 166
35 18 95
18 62 95
31 108 165
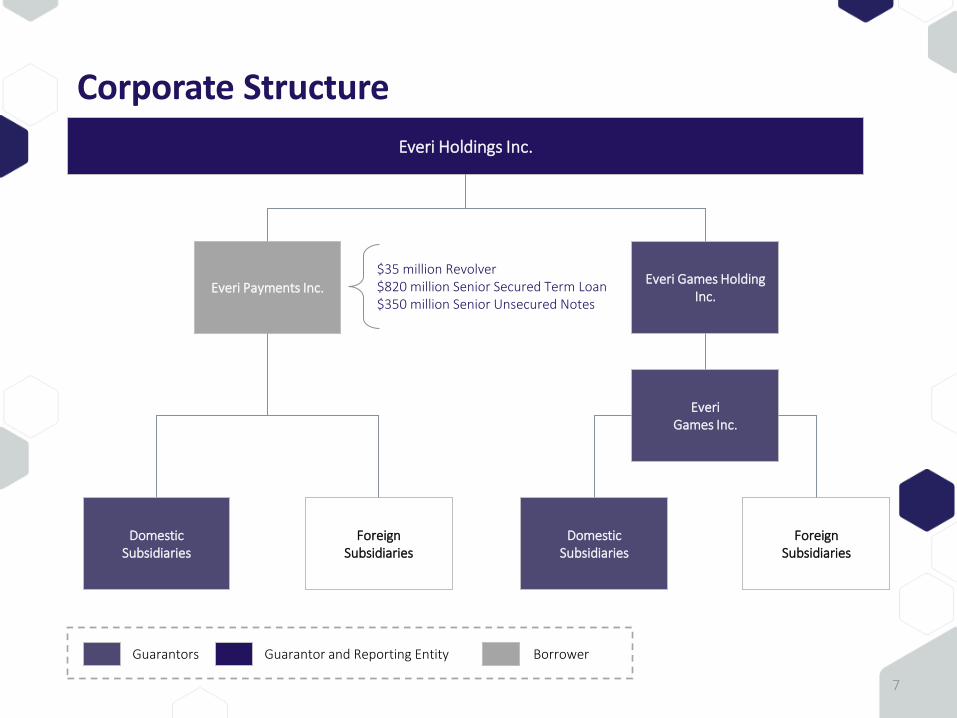
7
Everi Holdings Inc.
Everi Games Holding Inc.
Everi Games Inc.
Domestic Subsidiaries
Foreign Subsidiaries
Everi Payments Inc.
Domestic Subsidiaries
Foreign Subsidiaries
$35 million Revolver $820 million Senior Secured Term Loan $350 million Senior Unsecured Notes
Guarantors Borrower Guarantor and Reporting Entity
Corporate Structure

78 73 116
166 166 166
35 18 95
35 18 95
35 18 95
Business Overview
78 73 116
166 166 166
35 18 95
18 62 95
31 108 165
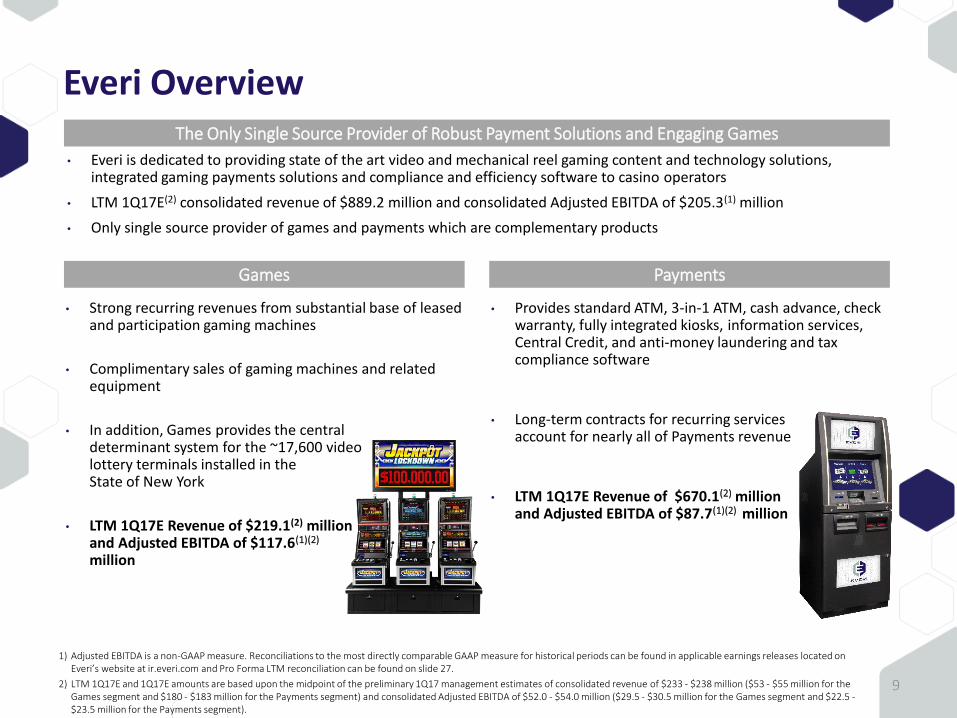
Everi Overview The Only Single Source Provider of Robust Payment Solutions and Engaging Games
1) Adjusted EBITDA is a non-GAAP measure. Reconciliations to the most directly comparable GAAP measure for historical periods can be found in applicable earnings releases located on Everi’s website at ir.everi.com and Pro Forma LTM reconciliation can be found on slide 27.
2) LTM 1Q17E and 1Q17E amounts are based upon the midpoint of the preliminary 1Q17 management estimates of consolidated revenue of $233 - $238 million ($53 - $55 million for the Games segment and $180 - $183 million for the Payments segment) and consolidated Adjusted EBITDA of $52.0 - $54.0 million ($29.5 - $30.5 million for the Games segment and $22.5 - $23.5 million for the Payments segment).
9
Games Payments
• Everi is dedicated to providing state of the art video and mechanical reel gaming content and technology solutions, integrated gaming payments solutions and compliance and efficiency software to casino operators
• LTM 1Q17E(2) consolidated revenue of $889.2 million and consolidated Adjusted EBITDA of $205.3(1) million
• Only single source provider of games and payments which are complementary products
• Strong recurring revenues from substantial base of leased and participation gaming machines
• Complimentary sales of gaming machines and related equipment
• In addition, Games provides the central determinant system for the ~17,600 video lottery terminals installed in the State of New York
• LTM 1Q17E Revenue of $219.1(2) million and Adjusted EBITDA of $117.6(1)(2)
million
• Provides standard ATM, 3-in-1 ATM, cash advance, check warranty, fully integrated kiosks, information services, Central Credit, and anti-money laundering and tax compliance software
• Long-term contracts for recurring services account for nearly all of Payments revenue
• LTM 1Q17E Revenue of $670.1(2) million and Adjusted EBITDA of $87.7(1)(2) million

78 73 116
166 166 166
35 18 95
18 62 95
31 108 165
Games Segment Overview Strong Recurring Revenue Base with Robust Margins
• 13,264 gaming units installed (8,234 Class II and 5,030 Class III) as of December 31, 2016
• Revenue derived from revenue-sharing arrangements or daily fixed lease fees on the installed base
• Supplies the central determinant system for approximately 17,600 video lottery terminals ("VLTs") in New York
• 54% Adjusted EBITDA Margin
Expanding Proprietary Class II and Class III Offerings
• Broad portfolio of gaming machine products including award-winning TournEvent slot tournament system and Wide-area Progressive (“WAP”) platform products
• Introduced new product segment at G2E 2016 with debut of seven new slot themes based on licensed, branded content
• Recently debuted Class II WAP
$165.7
$204.2 $207.0 $214.4 $213.3 $219.1
$0.0
$50.0
$100.0
$150.0
$200.0
$250.0
2012 2013 2014 2015 2016 LTM1Q17E
Revenue
Note: $ in millions; fiscal year ended December 31.
$79.9
$106.6 $110.9 $118.8
$116.0 $117.6
48.2% 52.2% 53.6% 57.3% 54.4% 53.7%
0.0%
20.0%
40.0%
60.0%
80.0%
100.0%
$0.0
$25.0
$50.0
$75.0
$100.0
$125.0
$150.0
2012 2013 2014 2015 2016 LTM1Q17E
Adjusted EBITDA(1)
Adjusted EBITDA Adjusted EBITDA Margin %
Premier Supplier of Exciting Games Across Multiple Platforms
1) Adjusted EBITDA and Adjusted EBITDA Margin are non-GAAP measures. Reconciliations to the most directly comparable GAAP measure for historical periods can be found in applicable earnings releases located on Everi’s website at ir.everi.com and Pro Forma LTM reconciliation can be found on slide 27.
2) LTM 1Q17E and 1Q17E amounts are based upon the midpoint of the preliminary 1Q17 management estimates of consolidated revenue of $233 - $238 million ($53 - $55 million for the Games segment and $180 - $183 million for the Payments segment) and consolidated Adjusted EBITDA of $52.0 - $54.0 million ($29.5 - $30.5 million for the Games segment and $22.5 - $23.5 million for the Payments segment).
3) Adjusted EBITDA for FY 2015 includes a gain of approximately $4.0 million from the sale of certain assets of PokerTek, an electronic table games manufacturing company purchased by Multimedia Games in 2014. Excluding this gain, Adjusted EBITDA would have been $118.8 million and Adjusted EBITDA Margin would have been 55.4%.
10
(2)
(2)
(1) (1)
Gaming Operations,
18%
Machine Sales, 7%
Payments Segment, 75%
2016 Consolidated Revenue $4.0 $122.8
(3)
78 73 116
166 166 166
35 18 95
18 62 95
31 108 165
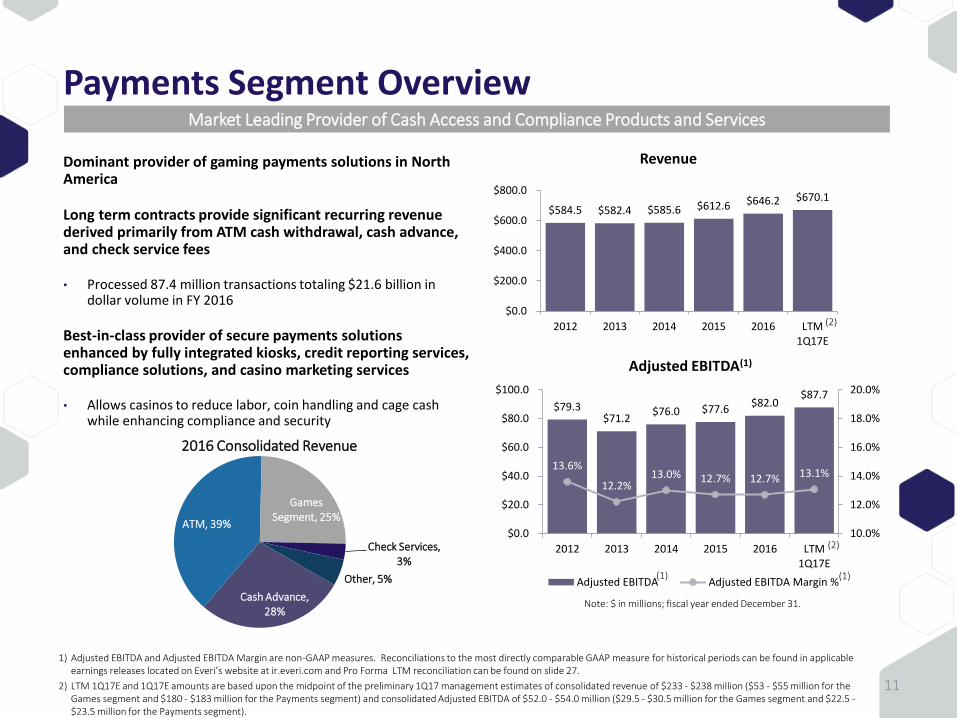
Payments Segment Overview
Dominant provider of gaming payments solutions in North America
Long term contracts provide significant recurring revenue derived primarily from ATM cash withdrawal, cash advance, and check service fees
• Processed 87.4 million transactions totaling $21.6 billion in dollar volume in FY 2016
Best-in-class provider of secure payments solutions enhanced by fully integrated kiosks, credit reporting services, compliance solutions, and casino marketing services
• Allows casinos to reduce labor, coin handling and cage cash while enhancing compliance and security
$584.5 $582.4 $585.6 $612.6 $646.2 $670.1
$0.0
$200.0
$400.0
$600.0
$800.0
2012 2013 2014 2015 2016 LTM1Q17E
Revenue
$79.3 $71.2
$76.0 $77.6 $82.0
$87.7
13.6%
12.2% 13.0% 12.7% 12.7% 13.1%
10.0%
12.0%
14.0%
16.0%
18.0%
20.0%
$0.0
$20.0
$40.0
$60.0
$80.0
$100.0
2012 2013 2014 2015 2016 LTM1Q17E
Adjusted EBITDA(1)
Adjusted EBITDA Adjusted EBITDA Margin %
Market Leading Provider of Cash Access and Compliance Products and Services
11
(2)
(2)
(1) (1)
Note: $ in millions; fiscal year ended December 31.
1) Adjusted EBITDA and Adjusted EBITDA Margin are non-GAAP measures. Reconciliations to the most directly comparable GAAP measure for historical periods can be found in applicable earnings releases located on Everi’s website at ir.everi.com and Pro Forma LTM reconciliation can be found on slide 27.
2) LTM 1Q17E and 1Q17E amounts are based upon the midpoint of the preliminary 1Q17 management estimates of consolidated revenue of $233 - $238 million ($53 - $55 million for the Games segment and $180 - $183 million for the Payments segment) and consolidated Adjusted EBITDA of $52.0 - $54.0 million ($29.5 - $30.5 million for the Games segment and $22.5 - $23.5 million for the Payments segment).
Cash Advance, 28%
ATM, 39%
Games Segment, 25%
Check Services, 3%
Other, 5%
2016 Consolidated Revenue

78 73 116
166 166 166
35 18 95
18 62 95
31 108 165
$26.5 $28.4
$19.4 $21.0
$45.9 $49.4
4Q15 4Q16
Payments Games
$28.4 $30.0
$17.3
$23.0
$45.7
$53.0
1Q16 1Q17E
$50.5 $54.6
$153.9 $162.9
$204.4 $217.5
4Q15 4Q16
Payments Games
Strong Recent Performance
12
Revenue Growth Recent Highlights / Wins
Adjusted EBITDA Growth(1)
$48.2 $54.0
$157.6 $181.5
$205.8
$235.5
1Q16 1Q17E
5.8% Y/Y Growth
8.1% Y/Y Growth
15.2% Y/Y Growth
12.0% Y/Y Growth
8.3% Y/Y Growth
7.2% Y/Y Growth
32.9% Y/Y Growth
5.6% Y/Y Growth
Note: $ in millions.
1) Adjusted EBITDA is a non-GAAP measure. Reconciliations to the most directly comparable GAAP measure for historical periods can be found in applicable earnings releases located on Everi’s website at ir.everi.com and Pro Forma LTM reconciliation can be found on slide 27.
2) LTM 1Q17E and 1Q17E amounts are based upon the midpoint of the preliminary 1Q17 management estimates of consolidated revenue of $233 - $238 million ($53 - $55 million for the Games segment and $180 - $183 million for the Payments segment) and consolidated Adjusted EBITDA of $52.0 - $54.0 million ($29.5 - $30.5 million for the Games segment and $22.5 - $23.5 million for the Payments segment).
• Sold 920 units in 4Q16, up 43% Y/Y; third consecutive quarter of Y/Y unit sales growth
• Went live for the first time with ATM services in Canada at 29 properties in 3 provinces
• Launched Jackpot Lockdown™ WAP link developed exclusively for Class II markets
• New Class II video reel WAP link featuring licensed brands expected to be introduced in early 2H17
• Newest Washington State casino, ilani, will feature Everi’s industry-leading fully integrated 3-in-1 kiosks and newest games on Core HDX® cabinet, including TournEvent®
• Won both Games and Payments contracts at new MGM National Harbor and del Lago Resort openings due to long standing customer relationships
• In 3Q16, entered Alberta market with largest-ever single quarter Games sale of new units to single customer (194 units) and 54 units placed on a lease arrangement
• Hired Dean Ehrlich, accomplished gaming industry executive, as Executive Vice President and Games Business Leader
• Added to Austin game development capabilities with new studios in Chicago and Reno
(2)
(2)

78 73 116
166 166 166
35 18 95
35 18 95
35 18 95
Key Credit Highlights

78 73 116
166 166 166
35 18 95
18 62 95
31 108 165
Credit Highlights
14
Extensive Reach and Scale 1
Stable and Diversified Recurring Revenue Business 2
Highly Differentiated, Complementary Products 3
Powerful, Long-Term Customer Relationships 4
Significant Barriers to Entry 5
Strong Track Record of Proprietary Technology and Innovation 6
Successfully Executing on Business Plan 7
Experienced and Seasoned Leadership 8

78 73 116
166 166 166
35 18 95
18 62 95
31 108 165
Standard ATM
3-in-1 ATM
Cash Advance
Check Warranty
Fully Integrated Kiosks
Reporting
Marketing
Central Credit
Marketing
Anti-Money Laundering and Tax Compliance Software
Everi Has Significantly Expanded its Footprint and Diversified its Geographic Reach
Extensive Reach and Scale
15
Gaming Segment
• Everi’s installed base of leased and participation games includes 13,264 units as of December 31, 2016
• Licensed in every material jurisdiction in North America
• In 2016, Company became licensed in Colorado, Missouri, West Virginia
• Recently expanded Games and Payments presence to multiple provinces in Canada
• Newer premium game installations have ramped to 14% of installed base
• New WAP platform expected to accelerate further premium installations
Payments Segment
• Dominant provider of gaming payments solutions in North America; In 2016, processed 87.4 million transactions totaling $21.6 billion in dollar volume
• Best-in-class provider of integrated gaming payments solutions
1
Everi is Now Licensed in Over 200 Jurisdictions and Serves Over 1,000 Gaming Properties Globally
Cash Access Services Kiosks Information Services
78 73 116
166 166 166
35 18 95
18 62 95
31 108 165
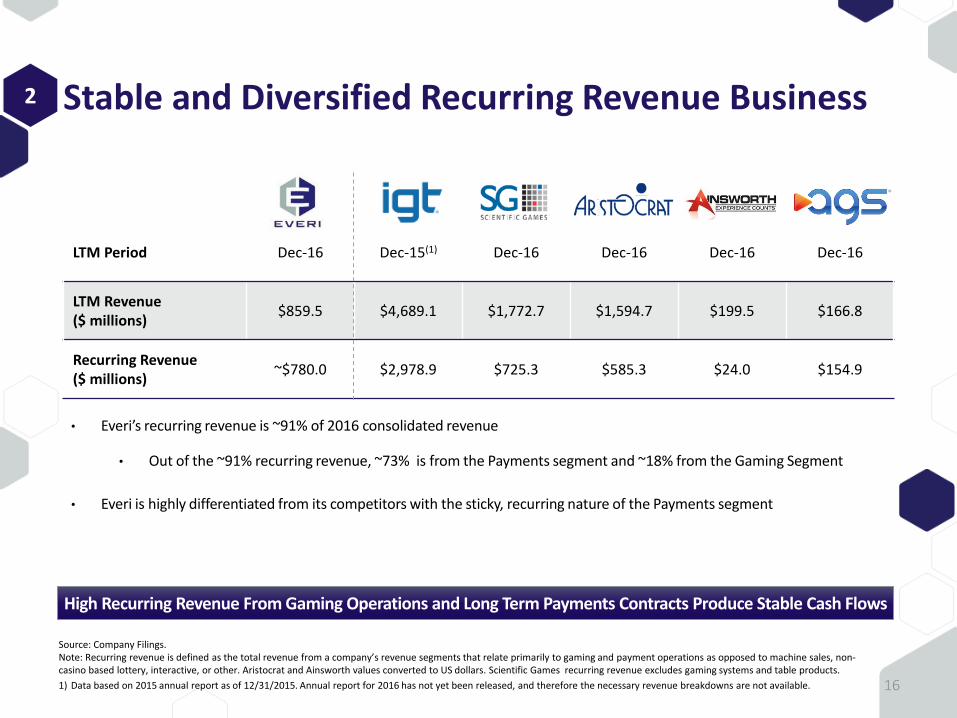
LTM Period Dec-16 Dec-15(1) Dec-16 Dec-16 Dec-16 Dec-16
LTM Revenue ($ millions)
$859.5 $4,689.1 $1,772.7 $1,594.7 $199.5 $166.8
Recurring Revenue ($ millions)
~$780.0 $2,978.9 $725.3 $585.3 $24.0 $154.9
Stable and Diversified Recurring Revenue Business
High Recurring Revenue From Gaming Operations and Long Term Payments Contracts Produce Stable Cash Flows
Source: Company Filings. Note: Recurring revenue is defined as the total revenue from a company’s revenue segments that relate primarily to gaming and payment operations as opposed to machine sales, non-casino based lottery, interactive, or other. Aristocrat and Ainsworth values converted to US dollars. Scientific Games recurring revenue excludes gaming systems and table products.
1) Data based on 2015 annual report as of 12/31/2015. Annual report for 2016 has not yet been released, and therefore the necessary revenue breakdowns are not available. 16
2 ~73% Payments; ~18% Games
• Everi’s recurring revenue is ~91% of 2016 consolidated revenue
• Out of the ~91% recurring revenue, ~73% is from the Payments segment and ~18% from the Gaming Segment
• Everi is highly differentiated from its competitors with the sticky, recurring nature of the Payments segment

Highly Differentiated, Complementary Products
17
TournEvent
Integrated Kiosk
Jackpot Kiosk ATM
Electronic Gaming
Machines
Premium Gaming Machines
Everi Has Multiple Touch Points Across Different Product Lines on the Casino Floor
Wide Area Progressive
3

78 73 116
166 166 166
35 18 95
18 62 95
31 108 165
Powerful, Long-Term Customer Relationships
Top Ten Customers ($ millions)
Everi has strong, Interconnected Customer Relationships Across both Games and Payments
18
• The company’s top 10 customers accounted for 38.8% of 2016 consolidated revenue
• Largest customer accounts for less than 10% of 2016 consolidated revenue
• Everi has an average customer relationship length of 18 years
4
1) The New York State Division of the Lottery does not directly contract for payments services. Individual casinos in NY contract for payments services directly with the payments vendors and any payments services provided in NY would be identified with that customer in this listing.
CustomerRelationship
(years)
FY 2016
Payments Revenue
FY 2016
Games Revenue
FY 2016
Total Revenue
%
Consolidated
Revenue
Customer A 12 $28.8 $39.9 $68.7 8.0%
Customer B 19 54.8 3.8 58.6 6.8%
Customer C 19 47.4 2.8 50.2 5.8%
Customer D 19 33.5 2.7 36.2 4.2%
Customer E 19 30.8 0.6 31.4 3.7%
Customer F 19 20.8 1.4 22.2 2.6%
New York Lottery(1) 15 - 18.1 18.1 2.1%
Customer H 19 15.2 1.8 17.0 2.0%
Customer I 19 14.3 1.4 15.7 1.8%
Customer J 16 13.0 2.2 15.2 1.8%
Top Ten Customers 18 $258.6 $74.7 $333.3 38.8%
Total US and Other Markets $646.2 $213.3 $859.5 100.0%

78 73 116
166 166 166
35 18 95
18 62 95
31 108 165
Significant Barriers to Entry
Extensive Regulation
• Gaming manufacturers are subject to rigorous licensing requirements on a jurisdiction-by-jurisdiction basis
• Typical licensing approval process in each jurisdiction can take many months to complete; certain larger commercial jurisdictions can take more than a year to complete
• Everi’s recent Missouri licensure took 16 months from initial submission until approval
• Everi has a presence in every material commercial and tribal jurisdiction in North America, and believes it has developed strong relationships with regulators in those markets
Economies of Scale
• Everi’s products and services can be found in nearly all major casino markets across the United States
• Everi’s size and scale across its Payments related services, in addition to a significant number of long term contracts in place, makes it difficult for smaller payment operators to gain significant market share
• Significant switching costs which casino operators are often reluctant to incur
• Expanded installed base with entry into new commercial and tribal markets as well as the development and placement of premium products
Compelling Intellectual Property and Content
Library
• IP is critical to success in the gaming industry
• Over 250 patents and trademarks
• Everi has been able to develop strong slot player loyalty due to its continued production of numerous "hit" titles such as Jackpot Inferno, High Voltage Blackout, Black Diamond, Golden Pig, Double Jackpot Gems, Mega Meltdown, Kingmaker, Blazin’ Gems, etc.
• Everi expects to spend in excess of $40 million in R&D (both capitalized and expensed software) per year to produce 80-90 proprietary titles per year
19
5

78 73 116
166 166 166
35 18 95
18 62 95
31 108 165
Strong Track Record of Proprietary Technology and Innovation
Games
20
6
1) EILERS-FANTINI Slot Survey – 4Q16.
TournEvent
• Everi’s industry leading, award-winning slot tournament technology was cited as the best slot tournament solution in the market with 61% share(1)
New York State VLT System
• Developed one-of-a-kind central determinant system for the NY Lottery, which has the ability to interface with, provide outcomes to, and manage over ~17,600 VLT’s
Wide-Area Progressive
• Development of WAP platform to support branded and proprietary game links in the Class II and Class III markets
New Game Development Studios
• New studios in Chicago and Reno in addition to Austin
• Strategically targeting third-party content such as Casablanca, Penn & Teller, and Fruit Ninja, which lend themselves to player appeal and innovative game play mechanics
Premium Products
• Introduced HD dual screens, LCD panels and new top box technology, growing premium cabinets to 14% of installed base
• Developed Everi Bet™, a new bet configuration software that was named to Casino Journal’s Most Innovative Gaming Technology Products for 2015

78 73 116
166 166 166
35 18 95
18 62 95
31 108 165
Strong Track Record of Proprietary Technology and Innovation
Payments
Dedication to Network Infrastructure and Security
• Strategic investments in infrastructure and security make Everi a best-in-class provider of secure payments solutions
• Everi was the first payments provider in the casino industry to be fully end-to-end Europay, MasterCard® and Visa® (“EMV”) compliant
Innovative Solutions & Enhancements
• Developed 3-in-1 Rollover ATM technology which drives incremental cash to the casino floor
• UniversalXchange with Universal Integrated Management provides an enhanced platform for Everi’s fully integrated kiosk solutions
• Jackpot Xpress™, recognized as one of Casino Journal’s Top 20 Most Innovative Technology Products for 2016, allows for efficient mobile-based slot jackpot processing
• CageXchange™ and RecyclerXchange™ cash management solutions designed to accelerate transaction speed and efficiency, improve cage count accuracy, and enhance the overall customer experience
• The Everi Cares™ Giving Module creates an opportunity for patrons to give to charities while also reducing coin handling on the casino floor
Evolving Digital Capacity
• CashClub Wallet™ decentralizes payments throughout the gaming enterprise and offers an enhanced, streamlined player experience and reduced cash footprint for operators
21
6

78 73 116
166 166 166
35 18 95
18 62 95
31 108 165
Leveraging Long-Term Customer Relationships Across Games and Payments Products
22
• Scarlett Pearl – New Customer
• 3Q15 Payments & Games
• Cash Access Product Suite
• 76 games sold and/or leased
• Desert Diamond Casinos & Entertainment
• 3Q15 Payments & Games
• Cash Access Product Suite
• 214 games sold and/or leased
• New Payments Customer / Existing Games Customer
• Alberta Gaming & Liquor Commission
• 3Q16 Add Games
• 248 games sold and/or leased
• New Games Customer/ Existing Payments Customer
• National Harbor – New Casino Existing Customer
• 3Q16 Payments & Games
• Cash Access Product Suite
• 80 games sold and/or leased
• Ilani – New Customer
• 1Q17 Payments & Games
• Cash Access Product Suite
• 150 games sold and/or leased
Expanding the Product Offering
• Expansion of Games offering to include new hardware options (e.g. Core HDX and Empire HDX cabinets), licensed and branded premium game content, WAP products, and digital & interactive offerings
• New Payments products to complement existing core cash access services: CageXchange™ and RecyclerXchange™ cash management solution, Jackpot XpressTM, CashClub WalletTM and the Everi Cares™ Giving Module
Successfully Executing on Business Plan 7
2015 2016 2017

78 73 116
166 166 166
35 18 95
18 62 95
31 108 165
4,561 3,825 3,304 2,554 1,333
6,627
8,832 9,983
10,786 11,931 11,188
12,657 13,287 13,340 13,264
2012 2013 2014 2015 2016
Proprietary Games 3rd Party Class III Games
23
Growth in the Installed Base while Reducing Third-Party Class III Unit Reliance
• Growing installed base contributes to the recurring revenue stream
• Total installed base has grown ~19% since 2012; proprietary units in the installed base have grown 80% since 2012
• Total concentration in third-party Class III games has decreased from 40% of total installed base to 10%
40%
10%
Focus on Cost Reductions and Containment
• Consolidation of Games warehouse and assembly functions in Austin, TX resulting in approximately $1 million in annual cost savings
• Executed upon integration efforts in connection with the Multimedia Games acquisition resulting in synergies and cost reductions related to overlapping corporate functions and overhead
Successfully Executing on Business Plan 7
80% Increase 16% CAGR

78 73 116
166 166 166
35 18 95
18 62 95
31 108 165
Experienced and Seasoned Leadership
24
• Our leadership team builds the framework for our success. With decades of gaming industry expertise and extensive management experiences, our executive team includes some of the industry’s top talent across segments
Michael D. Rumbolz
President & Chief Executive Officer
Juliet A. Lim
Executive Vice President and Payments Business Leader,
Chief Legal Officer, and Corporate Secretary
Dean A. Ehrlich
Executive Vice President and Games
Business Leader
David J. Lucchese
Executive Vice President, Digital and Interactive
Business Leader
Edward A. Peters
Executive Vice President of Sales and Marketing
Randy L. Taylor
Executive Vice President and Chief
Financial Officer
Richard P. Hallman
Executive Vice President and Chief Information Officer
Mark F. Labay
Senior Vice President, Strategic Development &
Investor Relations
8

78 73 116
166 166 166
35 18 95
35 18 95
35 18 95
Historical Financial Overview

78 73 116
166 166 166
35 18 95
18 62 95
31 108 165
$79.3 $71.2 $76.0 $77.6 $82.0 $87.7
$79.9 $106.6 $110.9 $118.8 $116.0 $117.6 $159.2 $177.8 $186.9
$200.4 $198.0 $205.3
21.2% 22.6% 23.6% 24.2% 23.0% 23.2%
2012A 2013A 2014A 2015A 2016A LTM 1Q17E
Margin
Historical Financial Performance
Capital Expenditures ($ millions)
Total Revenue ($ millions) Adjusted EBITDA(1) ($ millions)
$74.6 $74.5 $68.0 $77.0 $80.8
$15.6 $2.0
$0.8 $2.8
$11.3
$90.2
$76.5 $68.7
$79.8 $92.1
2012A 2013A 2014A 2015A 2016ACapex Placement Fees
$584.5 $582.4 $585.6 $612.6 $646.2 $670.1
$165.7 $204.2 $207.0 $214.1 $213.3 $219.1 $750.2 $786.6 $792.6 $826.7 $859.5 $889.2
2012A 2013A 2014A 2015A 2016A LTM 1Q17E
Payments Games
26
1) Adjusted EBITDA and Adjusted EBITDA Margin are non-GAAP measures. Reconciliations to the most directly comparable GAAP measure for historical periods can be found in applicable earnings releases located on Everi’s website at ir.everi.com and Pro Forma LTM reconciliation can be found on slide 27.
2) Historical periods for 2012 – 2014 reflect the combined operations of Multimedia Games and Everi Payments Inc. on a Pro Forma basis to reflect the combination of the companies that occurred in December 2014.
3) LTM 1Q17E and 1Q17E amounts are based upon the midpoint of the preliminary 1Q17 management estimates of consolidated revenue of $233-$238 million ($53 - $55 million for the Games segment and $180 - $183 million for the Payments segment) and consolidated Adjusted EBITDA of $52.0 – $54.0 million ($29.5 - $30.5 million for the Games segment and $22.5 - $23.5 million for the Payments segment).
4) Adjusted EBITDA for FY 2015 includes a gain of approximately $4.0 million from the sale of certain assets of PokerTek, an electronic table games manufacturing company purchased by Multimedia Games in 2014. Excluding this gain, consolidated Adjusted EBITDA would have been $196.4 million and consolidated Adjusted EBITDA Margin would have been 23.8%.
Payments Games
(3) (3)
$4.0
(4) (2) (2) (2) (2) (2) (2)
(2) (2) (2)
78 73 116
166 166 166
35 18 95
18 62 95
31 108 165
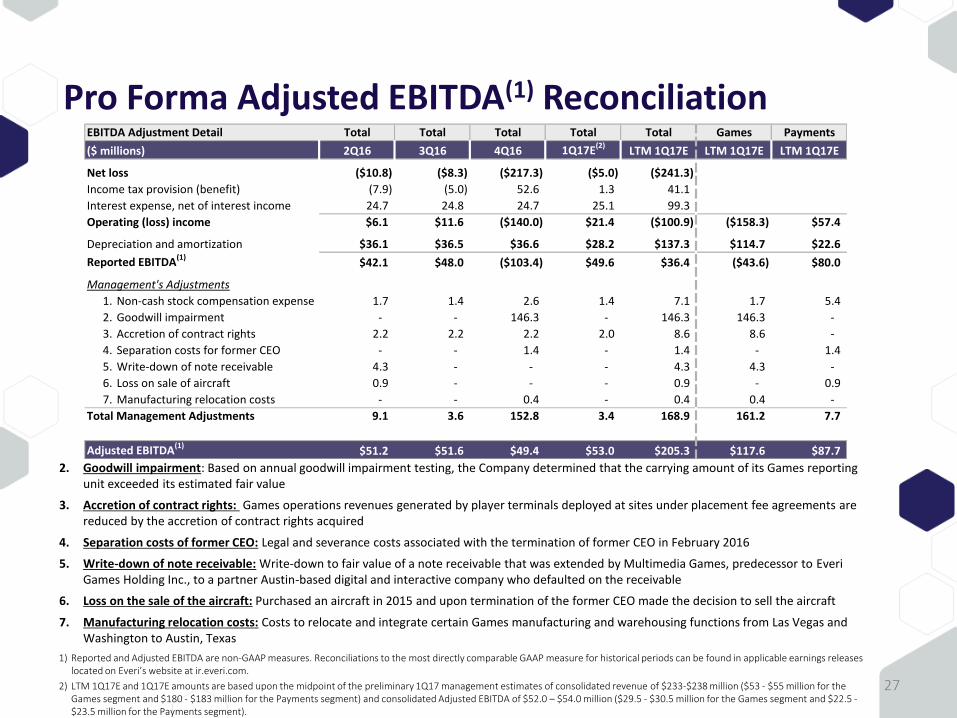
Pro Forma Adjusted EBITDA(1) Reconciliation
27
1) Reported and Adjusted EBITDA are non-GAAP measures. Reconciliations to the most directly comparable GAAP measure for historical periods can be found in applicable earnings releases located on Everi’s website at ir.everi.com.
2) LTM 1Q17E and 1Q17E amounts are based upon the midpoint of the preliminary 1Q17 management estimates of consolidated revenue of $233-$238 million ($53 - $55 million for the Games segment and $180 - $183 million for the Payments segment) and consolidated Adjusted EBITDA of $52.0 – $54.0 million ($29.5 - $30.5 million for the Games segment and $22.5 - $23.5 million for the Payments segment).
2. Goodwill impairment: Based on annual goodwill impairment testing, the Company determined that the carrying amount of its Games reporting unit exceeded its estimated fair value
3. Accretion of contract rights: Games operations revenues generated by player terminals deployed at sites under placement fee agreements are reduced by the accretion of contract rights acquired
4. Separation costs of former CEO: Legal and severance costs associated with the termination of former CEO in February 2016
5. Write-down of note receivable: Write-down to fair value of a note receivable that was extended by Multimedia Games, predecessor to Everi Games Holding Inc., to a partner Austin-based digital and interactive company who defaulted on the receivable
6. Loss on the sale of the aircraft: Purchased an aircraft in 2015 and upon termination of the former CEO made the decision to sell the aircraft
7. Manufacturing relocation costs: Costs to relocate and integrate certain Games manufacturing and warehousing functions from Las Vegas and Washington to Austin, Texas
(2) EBITDA Adjustment Detail Total Total Total Total Total Games Payments
($ millions) 2Q16 3Q16 4Q16 1Q17E(2)LTM 1Q17E LTM 1Q17E LTM 1Q17E
Net loss ($10.8) ($8.3) ($217.3) ($5.0) ($241.3)
Income tax provision (benefit) (7.9) (5.0) 52.6 1.3 41.1
Interest expense, net of interest income 24.7 24.8 24.7 25.1 99.3
Operating (loss) income $6.1 $11.6 ($140.0) $21.4 ($100.9) ($158.3) $57.4
Depreciation and amortization $36.1 $36.5 $36.6 $28.2 $137.3 $114.7 $22.6
Reported EBITDA(1)
$42.1 $48.0 ($103.4) $49.6 $36.4 ($43.6) $80.0
Management's Adjustments
1. Non-cash stock compensation expense 1.7 1.4 2.6 1.4 7.1 1.7 5.4
2. Goodwill impairment - - 146.3 - 146.3 146.3 -
3. Accretion of contract rights 2.2 2.2 2.2 2.0 8.6 8.6 -
4. Separation costs for former CEO - - 1.4 - 1.4 - 1.4
5. Write-down of note receivable 4.3 - - - 4.3 4.3 -
6. Loss on sale of aircraft 0.9 - - - 0.9 - 0.9
7. Manufacturing relocation costs - - 0.4 - 0.4 0.4 -
Total Management Adjustments 9.1 3.6 152.8 3.4 168.9 161.2 7.7
Adjusted EBITDA(1)
$51.2 $51.6 $49.4 $53.0 $205.3 $117.6 $87.7

78 73 116
166 166 166
35 18 95
18 62 95
31 108 165
Current 2017 Outlook • 2017 Adjusted EBITDA(1) expected to be $204 million - $209 million
• Factors in Company’s 2017(2) outlook include:
• FY 2017 unit sales expected to increase 10%+ Y/Y with 1Q17 unit sales comparable to 4Q16
• Installed base at December 31, 2017 is expected to grow Y/Y
• Expects removal of ~530 third-party Class III units in 1H17 with ~70% of removals replaced with proprietary Class II units; shift by certain California tribal customers moving to Class III units from Class II units estimated to result in loss of 100 - 300 units from installed base, primarily in 1H17
• Installed base to benefit from introduction of Class II mechanical reel WAP and pending introduction of Class II video reel WAP with licensed brands in 2H17
• Daily WPU in 1H17 expected to be below 1H16 with improvements beginning in 2H17
• Payments revenues and Adjusted EBITDA should benefit from continued improvement in cash to the floor and Company’s recent expansion of its cash access capabilities in Canada
• Sales of higher margin compliance products will offset flat to modestly lower kiosk sales
1) Adjusted EBITDA is a non-GAAP measure. Reconciliations to the most directly comparable GAAP measure for historical periods can be found in applicable earnings releases located on Everi’s website at ir.everi.com and Pro Forma LTM reconciliation can be found on slide 27.
2) The Company provided additional financial metrics for 2017 as part of the Fourth Quarter and Year End earnings press release, which is available on Everi’s website at ir.everi.com. 28

78 73 116
166 166 166
35 18 95
18 62 95
31 108 165
Credit Highlights
29
Extensive Reach and Scale 1
Stable and Diversified Recurring Revenue Business 2
Highly Differentiated, Complementary Products 3
Powerful, Long-Term Customer Relationships 4
Significant Barriers to Entry 5
Strong Track Record of Proprietary Technology and Innovation 6
Successfully Executing on Business Plan 7
Experienced and Seasoned Leadership 8

78 73 116
166 166 166
35 18 95
35 18 95
35 18 95
Syndication Overview

78 73 116
166 166 166
35 18 95
18 62 95
31 108 165
Transaction Timeline
Date Activity
April 13th Bank Meeting / Launch
April 27th Commitments due from Lenders
Early / Mid May Close and Fund Transaction
31
April May
S M T W T F S S M T W T F S
1 1 2 3 4 5 6
2 3 4 5 6 7 8 7 8 9 10 11 12 13
9 10 11 12 13 14 15 14 15 16 17 18 19 20
16 17 18 19 20 21 22 21 22 23 24 25 26 27
23 24 25 26 27 28 29 28 29 30 31 32 33 34
30 35
Denotes Holiday Key Transaction Date

78 73 116
166 166 166
35 18 95
18 62 95
31 108 165
Term Sheet - Senior Secured Credit Facilities Borrower Everi Payments Inc.
Facilities $855 million Senior Secured Credit Facilities consisting of: • $35 million Senior Secured Revolver (the “Revolver”) • $820 million Senior Secured First Lien Term Loan (the “1st Lien”)
Term • Revolver: 5 years (with a springing maturity 3 months inside the 1st Lien if the existing Senior Unsecured Notes if not refinanced)
• 1st Lien: 7 years (with a springing maturity 3 months inside of the existing Senior Unsecured Notes if not refinanced)
LIBOR Floor Revolver / 1st Lien: 1.0%
Amortization 1st Lien: 1% per annum
Mandatory Prepayments
1st Lien: Customary for the type of transaction proposed, including but not limited to a sweep of 50% of excess cash flow generated, with step-downs to 25% and 0% based on leverage levels to be agreed
Voluntary Prepayments
1st Lien: 101% soft call for 6 months; otherwise repayable at any time in whole or in part at par, subject to LIBOR breakage fees and the payment of accrued interest and fees
Security Secured by first lien security interest in substantially all assets of existing / future domestic subsidiaries
Guarantees Unconditionally guaranteed by each existing and subsequently acquired or organized wholly-owned subsidiary of the Company
Financial Covenants Maximum Secured Net Leverage
Affirmative and Negative Covenants
Customary for facilities of this type
32

78 73 116
166 166 166
35 18 95
35 18 95
35 18 95
Q&A