
LegislativeReference Library V HowardBick~~
28
This document is made available electronically by the Minnesota Legislative Reference Library as part of an ongoing digital archiving project. http://www.leg.state.mn.us/lrl/lrl.asp MINNESOTA STATE BOARD OF INVESTMENT 09 - 0097 DATE: TO: FROM: SUBJECT: January 15, 2009 Legislative"Reference Library 0 V Investment Consultant Report Board Members: Governor Tim Pawlenty State Auditor Rebecca Otto Secretary of State Mark Ritchie Attorney General Lori Swanson Executive Director: Howard J. Bicker 60 Empire Drive Suite 355 St. Paul, MN 55103 (65.1) 296-3328 FAX (651) 296-9572 E-mail: [email protected] www.sbi.state.mll.us An Equal Opportunity Employer As required by Laws of Minnesota 2007, Chapter 148, section 2, subdivision 7, attached is the State Board of Investment's Report on Investment Consultant Activities.
Transcript of LegislativeReference Library V HowardBick~~

This document is made available electronically by the Minnesota Legislative Reference Library as part of an ongoing digital archiving project. http://www.leg.state.mn.us/lrl/lrl.asp
MINNESOTASTATEBOARD OFINVESTMENT
09 - 0097
DATE:
TO:
FROM:
SUBJECT:
January 15, 2009
Legislative"Reference Library 0HowardBick~~ VInvestment Consultant Report
Board Members:
GovernorTim Pawlenty
State AuditorRebecca Otto
Secretary of StateMark Ritchie
Attorney GeneralLori Swanson
Executive Director:
Howard J. Bicker
60 Empire DriveSuite 355
St. Paul, MN 55103(65.1) 296-3328
FAX (651) 296-9572E-mail:
An Equal OpportunityEmployer
As required by Laws of Minnesota 2007, Chapter 148, section 2, subdivision 7,attached is the State Board of Investment's Report on Investment ConsultantActivities.

MINNESOTASTATEBOARD OFINVESTMENT
DATE: January 15,2009
Board Members:
GovernorTim Pawlenty
State AuditorRebecca Otto
Secretary of StateMark Ritchie
Attorney GeneralLori Swanson
Executive Director:
Howard J. Bicker
60 Empire DriveSuite 355
St. Paul, MN 55103(65.1) 296-3328
FAX (651) 296-9572E-mail:
An Equal OpportunityEmployer
FROM: State Board of Investment
SUBJECT: Report on Investment Consultant Activities
The provisions of Laws of Minnesota 2007, Chapter 148, section 2, subdivision 7require the State Board of Investment to file with the Legislative ReferenceLibrary a report on investment consultant activities.
The State Board of Investment (SBI) contracts with Richards & Tierney, Chicago,Illinois and PCA, Studio City, California for certain investment consultingservices. Richards & Tierney serves as the SBI's general consultant, and PCAserves as the SBI's special projects consultant. The current contracts with theseconsultants, effective July 1,2007 to June 30, 2012, call for payment of $370,000to Richard & Tierney annually and $40,000 to PCA annually.
During the period November 1, 2007 through October 31, 2008, Richards &Tierney was involved in the following projects:
• Asset allocation review for the combining of the Basic and Post Funds.• Availability to the Board, staff and Investment Advisory Council to
provide perspective, counsel and input on relevant investment relatedissues.
During the period November 1, 2007 through October 31, 2008, PCA wasinvolved in the following projects:
• Background information and alternative sources of information aboutmanagers in the SBI's alternative investment program.
Attached is an example of the work product provided.

dGC1222:WWZiZSWW! ==== iZ£iil -
Presentation to
Minnesota State Board of Investment
Investment Advisory Council
November 21, 2008
Richards & Tierney, Inc.
The information contained herein is proprietary and confidential. No distribution is permitted without the express written permission ofRichards & Tierney, Inc. (R&T). Although the information in this report has been based upon and obtained from sources which R&T believes
\0 be re\~ab\e,it&T does not guarantee its accuracy. Such information is of the date or dates set forth and subsequent events may affect thevalue of this information. Copyright © 2008 by Richards & Tierney, Inc:1 - Richards & Tierney, Inc.

Table of Contents - MNSBI Asset Liability Study
Section I:
Section II:
Section III:
Section IV:
Section V:
Background
Analytical Process
Deterministic Results
Stochastic Results
Discussion and Recommendation
Richards & Tierney, Inc.

MNSBI Asset Liability Study
Policies That Determine The Financial Health of Retirement Funds
.. Funding Policy - Cash flow into the Fund• Specification ofhow and when contributions are made to the fund
• Specification of amount and timing of contributions
.. Benefit Policy - Cash flow out of the Fund• Specification ofplan benefits
• Specification of eligibility requirements
.. Investment Policy - Level and type of investment risk• Financial status of the plan
• Financial strength of the plan sponsor
• Risk tolerance/preferences of the plan fiduciaries
. -3-Richards & Tierney, Inc.

MNSBI Asset Liability Study
... Objective -
• To observe a range of future financial outcomes, in context of economic and investment uncertainty
./ At current investment policy
./ At alternative investment policies
• To affirm or revise investment policy
... Examine the Financial Health of MN Retirement Plans in Aggregate• Within the context of Investment Policy decisions
• Within the context of existing Funding Policy
Within the context of existing Benefit Policy
... Conduct the analysis on a consolidated basis• Used largest 4 plans (Teachers Retirement Fund, Public Employees Retirement Fund, State Employees
Retirement Fund, Public Employees Police & Fire)
• Combine the Basics and the Post
• These plans accounted for approximately 98% of total SBI retirement assets at June 30, 2008
... Focus on Funded Ratio
• Actuarial Liabilities / Market value ofAssets
Year 2028 and 2033 (20 and 25 year projections)
-4 - Richards & Tierney, Inc.

MNSBI Asset Liability StudyMethodology
• Create actuarial model of MN Retirement Plans that is consistent with the valuations by planactuary (Segal)
• Load July 2007 census data, program plan provisions and enter actuarial assumptions
• Utilize all available financial information
• Run replication valuation to ensure results within 0-5% tolerance
• Scale results so starting values exactly match actuary's figures
• Reflect all new actuarial assumptions effective for July 2008 valuations
• Reflect merging ofPost plan .with respective active plans
• Create new entrant profiles
• Use an open group concept, where departing employees are replaced by presumed new hires
• Set experience assumptions equal to valuation assumptions (no built-in gains or losses)
• Achieve overall demographic stability in member counts, average ages, average service, etc.
• Establish separate profile for each of the four plans modeled
• Run 30-year core projection of liabilities
• Run Deterministic and Stochastic Forecasts
-5 - Richards & Tierney, Inc.

MNSBI Asset Liability StudyDeterministic versus Stochastic
==
.. Deterministic forecasts
• Set of financial outcomes over projection period, based on the premise that a set ofassumptions will be realized
• Set of assumptions could be variety of scenarios
.. Stochastic forecasts
• Set of several thousand deterministic forecasts chosen randomly based on the risk and returncharacteristics of the investment policy asset classes
• Distribution of financial outcomes over the projection period, based on the premise thatassumptions will rarely, if ever, be fully realized
• Measures the range or volatility of selected financial factors over the projection periods
• Measures the probability of a variety of financial outcomes
-6 - Richards & Tierney, Inc.

Deterministic Forecast8.50/0 Investment Return
, .
E •• i *'
Richards & Tierney, Inc.
ExpectedBOY Employer Employee
Actuarial Value of Market Value of Actuarial Funded Contributions Contributions Funding ExpectedYear Assets (AVA) Assets (MVA) Liability Ratio (% of payroll) (% of payroll) BftPymts
2007 46,113,586,941 48,694,008,834 53,810,046,281 0.90 6.30 4.55 2,867,447,173
2008 48,389,334,858 44,778,736,618 56,806,475,924 0.79 6.35 4.44 3,043,635,083
2009 49,933,604,802 46,924,757,387 59,412,133,897 0.79 6.45 4.46 3,229,549,232
2010 51,344,829,890 49,124,724,630 62,061,532,369 0.79 6.55 4.50 3,423,867,842
2011 52,670,463,929 51,374,018,287 64,752,561,165 0.79 6.55 4.54 3,623,351,786
2012 53,654,617,588 53,654,617,588 67,487,005,452 0.80 6.55 4.57 3,832,657,349
2013 55,961,615,892 55,961,615,892 70,259,815,347 0.80 6.55 4.61 4,050,353,022
2014 58,290,518,387 58,290,518,387 73,067,676,716 0.80 6.55 4.64 4,274,917,162
2015 60,638,137,822 60,638,137,822 75,907,648,238 0.80 6.55 4.67 4,505,476,814
2016 63,002,577,616 63,002,577,616 78,778,200,211 0.80 6.55 4.69 4,747,863,077
2017 65,374,779,456 65,374,779,456 81,666,445,605 0.80 6.55 4.72 4,980,771,415
2018 67,766,896,248 67,766,896,248 84,597,180,954 0.80 6.55 4.74 5,222,609,853
2019 70,173,624,077 70,173,624,077 87,566,773,464 0.80 6.55 4.75 5,479,380,684
2020 72,582,664,423 72,582,664,423 90,556,630,690 0.80 6.55 4.77 5,719,934,929
2028 92,811,153,957 92,811,153,957 116,210,113,051 0.80 6.55 4.86 7,721,618,708
2033 107,162,690,052 107,162,690,052 134,688,791,665 0.80 6.55 4.88 8,915,311,886
*Market Value ofAssets at 7/1/09 projected from 7/1/08 using expected 8.5% investment return**f()\iG)' full funding Test is determined at end of each plan year
-7 -

Richards & Tierney, Inc.
Deterministic Forecast8.50/0 Investment Return Adjusted for experience thru Oct 2008
-Expected
BOY Employer EmployeeActuarial Value Market Value of Actuarial Funded Contributions Contributions Funding Expected
Year of Assets (AVA) Assets (MVA) Liability Ratio (% of payroll) (% of payroll) BftPymts
2007 46,113,586,941 48,694,008,834 53,810,046,281 0.90 6.30 4.55 2,867,447,173
2008 48,389,334,858 44,778,736,618 56,806,475,924 0.79 6.35 4.44 3,043,635,083
2009 43,489,442,164 *36,241,201,803 59,412,133,897 0.61 6.45 4.46 3,229,549,232
2010 45,039,680,185 37,533,066,821 62,061,532,369 0.60 6.55 4.50 3,423,867,842
2011 44,366,937,440 38,797,069,564 64,752,561,165 0.60 6.55 4.54 3,623,351,786
2012 42,145,339,340 40,008,628,223 67,487,005,452 0.59 6.55 4.57 3,832,657,349
2013 41,155,717,431 41,155,717,431 70,259,815,347 0.59 6.55 4.61 4,050,353,022
2014 42,226,118,557 42,226,118,557 73,067,676,716 0.58 6.55 4.64 4,274,917,162
2015 43,208,264,006 43,208,264,006 75,907,648,238 0.57 6.55 4.67 4,505,476,814
2016 44,091,164,526 44,091,164,526 78,778,200,211 0.56 6.55 4.69 4,747,863,077
2017 44,855,896,253 44,855,896,253 81,666,445,605 0.55 6.55 4.72 4,980,771,415
2018 45,503,907,972 45,503,907,972 84,597,180,954 0.54 6.55 4.74 5,222,609,853
2019 46,018,281,798 46,018,281,798 87,566,773,464 0.53 6.55 4.75 5,479,380,684
2020 46,374,118,050 46,374,118,050 90,556,630,690 0.51 6.55 4.77 5,719,934,929
2028 42,474,906,097 42,474,906,097 116,210,133,051 0.37 6.55 4.86 7,721,618,708
2033 31,474,254,198 31,474,254,198 134,688,791,665 0.23 6.55 4.88 8,915,311,886
*Market Value of Assets at 7/1/09 based on actual returns for 6/30/08-9/30/08 and expected returns for 10108-7/1/09
**foliC)f I\uU Fundin~ Test is determined at end of each plan year-8 -

Deterministic Forecasts - Funded Status
= QL$
~
\ A A - A ~ A
"'" "'" "'" ..... '",..
"" "IT ,..
\\ - - - -A.
~-'~
~~
0.3
0.2
0.1
0.0
~ ~ ~ ~ ~ ~ ~ ~ ~ ~ w ~ ~ ~~ ~ ~ ~ ~ ~ ~ ~ ~ ~ ~ ~ ~ ~
1.0
0.9
0.8
0.7o+:: 0.6(}.'0 0.5G)'0§ 0.4u.
---.- With MVA Actuals through October 2008 -.- Without MVA Actuals through October 2008
-9 - Richards & Tierney, Inc.

Deterministic Forecasts - Funded StatusInvestment Return needed for Full Funded Status at 2028/2033
eWEiW f =
1.2
1.0 .~-----.,., ___ 1Ill---------0.8 1-",,", III IIll IIll
0+:i
11"'C 0.6Q)
"'Cs:::~
LL 0.4
0.2
0.0
<:;:)~ <:;:)OJ ,," ,,~ ,,<-.=> ,(\ "OJ ~" ~~ ~<-.=> i\ ~OJ c:>" O:J~f),<:;:) f),<:;:) f),<:) f),<:;:) f),<:;:) f),<:;:) f),<:;:) f),<:) ~ ~ ~ f),<:) ~ ~
___ Using Expected Return of9.3% since 7/1/08
Using Expected Return of 11.5% since 7/1/09
-10 - Richards & Tierney, Inc.

MNSBI Asset Liability StudyCapital Market Assumptions
Asset Classes Real Return (%) Nominal Return (%) Risk (Std Dev)
Domestic Equity 6.0 9.0 17.0
International Equity 6.0 9.0 18.0
Emerging Markets 8.0 11.0 25.0
Alternative Assets 8.5 11.5 20.0
Domestic Bonds 3.0 6.0 7.0
Cash Equivalents 1.0 4.0 2.0
Inflation 3.0 1.0
-11- Richards & Tierney, Inc.
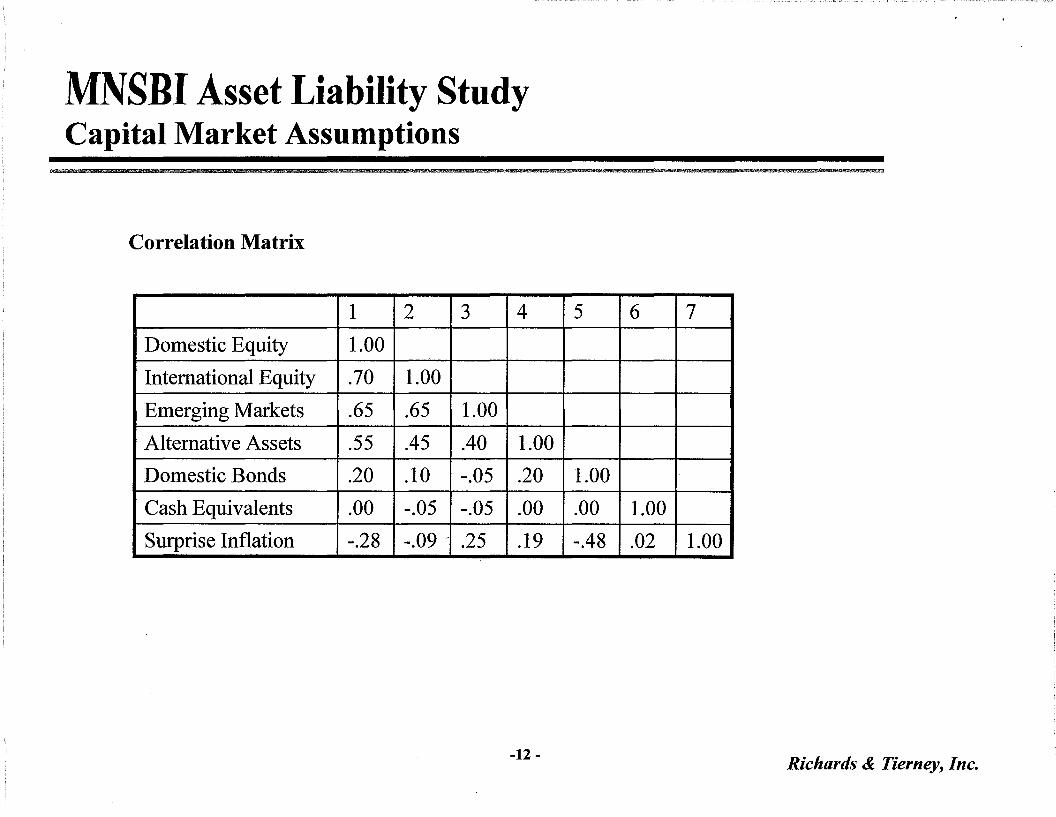
MNSBI Asset Liability StudyCapital Market Assumptions
Correlation Matrix
1 2 3 4 5 6 7
Domestic Equity 1.00
International Equity .70 1.00
Emerging Markets .65 .65 1.00
Alternative Assets .55 .45 .40 1.00
Domestic Bonds .20 .10 -.05 .20 1.00
Cash Equivalents .00 -.05 -.05 .00 .00 1.00
Surprise Inflation -.28 -.09 > .25 .19 -.48 .02 1.00
-12 - Richards & Tierney, Inc.

MNSBI Asset Liability StudyInvestment Options
J2Li£2iiLiZLJ2D :z:&2lljJ
Asset Class Current Policy Option 1 Option 2 Option 3 100% Equity
US Stocks 45.0% 45.0% 40.0% 40.0% 58.0%
International 12.0 12.0 16.0 16.0 16.0
Emerging Markets 3.0 3.0 4.0 4.0 4.0
Alternatives 16.0 20.0 18.0 20.0 20.0
US Bonds 22.0 18.0 20.0 18.0 0.0
Cash 2.0 2.0 2.0 2.0 2.0
Total 100.0% 100.0% 100.0% 100.0% 100.0%
Annual Exp 8.70 8.92 8.91 8.94 9.48Return (0..10)
Annual Exp Risk 12.30 12.81 12.79 12.75 15.35(Std Dev)
-13 - Richards & Tierney, Inc.

Stochastic Forecast - Funded RatioCurrent Investment Policy, Expected Returns since 7/1/08
ZC :R "mw 4G&' h!i
1.4 ---r-------------..,.-~-----------__"...-==---__.
1.2 --I-------~~-------_____:;>~~~------____1
1.0 +- L..-----:-;-~~------------------I
0.2 -r---------------------=-=~-----I
o.0 -+--,----,---,--,--,-,-,-,-r--I,------,---,---,--r-r-r----,-----,-----,-----r-.,----,-------,-------,------,.-~L1
~ ~ ~ ~ ~ ~ ~ ~ W ~ ~ ~ ~ ~~ ~ ~ ~ ~ ~ ~ ~ ~ ~ ~ ~ ~ ~
-+- 10th Percentile --- 25th Percentile~ 75th Percentile -*- 90th Percentile
-14 -
50th Percentile
Richards & Tierney, Inc.
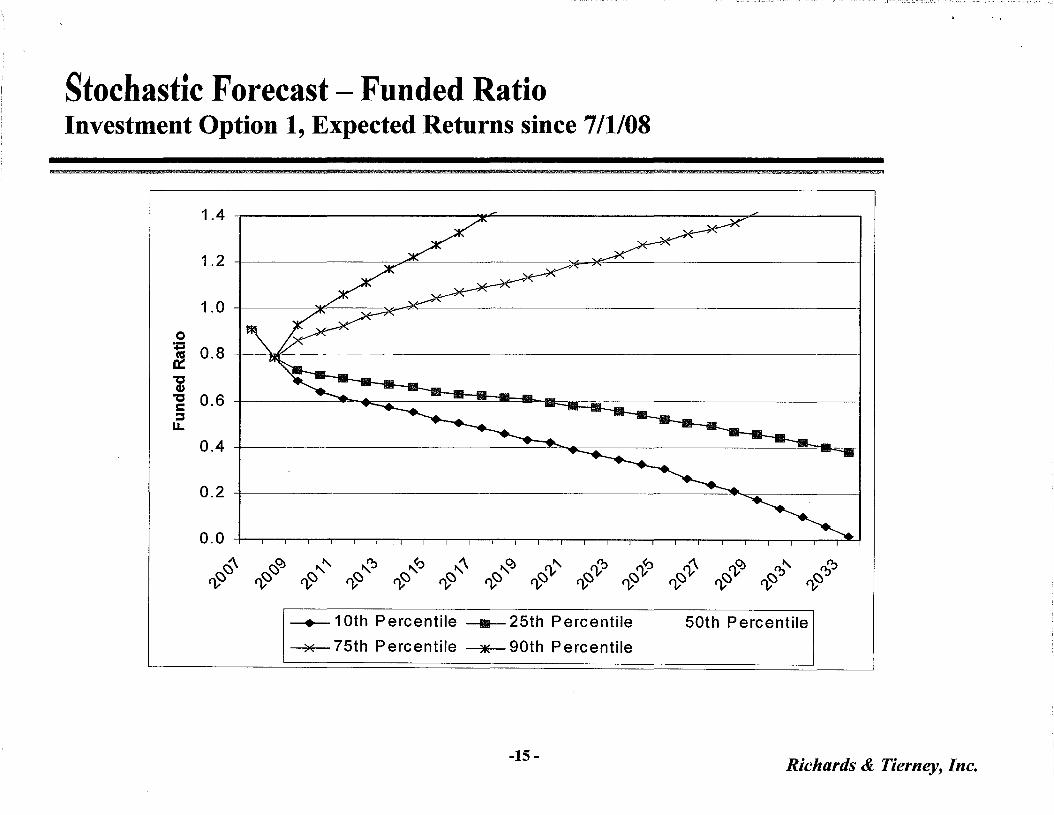
Stochastic Forecast - Funded RatioInvestment Option 1, Expected Returns since 7/1/08
1& If&SSM
1.4
1.2
1.0
0
~ 0.8
"CCI>
"C 0.6c:su.
0.4
0.2
0.0
~ \:)Q> ",'" "'~ "'~ ~ ",Q>~'" ~~ ~ ~ ~Oj 0.:>'" o.:>~
tl,.<;:) ~ tl,.<;:) tl,.<;:) tl,.<;:) tl,.<;:) tl,.<;:) tl,.<;:) tl,.<;:) tl,.<;:) tl,.<;:) tl,.<;:) tl,.<;:) tl,.<;:)
--+-10th Percentile 25th Percentile
~ 75th Percentile~ 90th Percentile
-15 -
50th Percentile
Richards & Tierney, Inc.

Stochastic Forecast - Funded RatioInvestment Option 2, Expected Returns since 7/1/08
ISWiSiiI2&l&\iM
1.4
1.2
1.0
0+:i 0.8a:sa::
"CD
" 0.6 -------t:::slL
0.4
0.2
o.0 +-,-,-,-,----r----r--,--,--,-,--,--,--,--,--,---,--,--,--,---,---,---,---,---,---,---,-JIL.j
~ ~ ~ ~ ~ ~ ~ ~ ~ ~ ~ ~ ~ ~~ ~ ~ ~ ~ ~ ~ ~ ~ ~ ~ ~ ~ ~
• 10th Percentile -IIlII-25th Percentile
~ 75th Percentile ~90th Percentile
-16 -
50th Percentile
Richards & Tierney, Inc.

Stochastic Forecast - Funded RatioInvestment Option 3, Expected Returns since 7/1/08
1.4 -,-- ~~---------~o:::..----_,
1.2 +---------,----;;..-<=---------""""'"~----------
1.0 +-------¥'-----~~-------------------~
0.4 +-------------~"'6;;::~--------~~1III___....
0.2 +---------------------=----=c~·~----1
o.0 -+--r--.,--;-,..--,..--,--,..--,..-,..-r--J---"l----r---r--r---,----,----,--r--r--r--r--r--,----,---,-C!~
~ ~ ~ ~ ~ ~ ~ ~ 0/ ~ ~ ~ ~ 0/~ ~ ~ ~ ~ ~ ~ ~ ~ ~ ~ ~ ~ ~
-.-- 10th Percentile --III- 25th Percentile
~ 75th Percentile ---.- 90th Percentile
-17 -
50th Percentile
Richards & Tierney, Inc.

Stochastic Forecast - Funded Ratio100% Equity, Expected Returns since 7/1/08
0.2 +-----------------------=-=~-----
o.0 --t--.,-.--..--r---r--r--r--r-r---,---.--,---,----,--...,.-.....---..,--r--r---1---r----.----r----,-~IE::::;=o4~
~ ~ ~ ~ ~ ~ ~ ~ p ~ ~ ~ ~ 0/~ ~ ~ ~ ~ ~ ~ ~ ~ ~ ~ ~ ~ ~
1.4
1.2
1.0 - --
0= 0.8~"CCI)
0.6"Cs::~
LL
0.4
• 10th Percentile 25th Percentile
~ 75th Percentile~ 90th Percentile
50th Percentile
-18 - Richards & Tierney, Inc.

Stochastic Forecast - Funded RatioCurrent Investment Policy, With Effect of 2008 Actual Returns
1.4 --,-----------------------------,
1.2 +-------------------~~"-----------\
1.0
0~
0.8l}."CCP
0.6"CC:::sLL
0.4
0.2
o. 0 -+---r-,---,r--T--,------r---r--,--r----;----r---r-,--r-,---,r-r----r-,-----?~~h_4....,.....:::::rIIt_-r-IIIH
~ ~ ~ ~ ~ ~ ~ ~ ~ ~ ~ ~ ~ 0/~ ~ ~ ~ ~ ~ ~ ~ ~ ~ ~ ~ ~ ~
• 10th Percentile 25th Percentile
)( 75th Percentile ---?IE- 90th Percentile
-19 -
50th Percentile
Richards & Tierney, Inc.
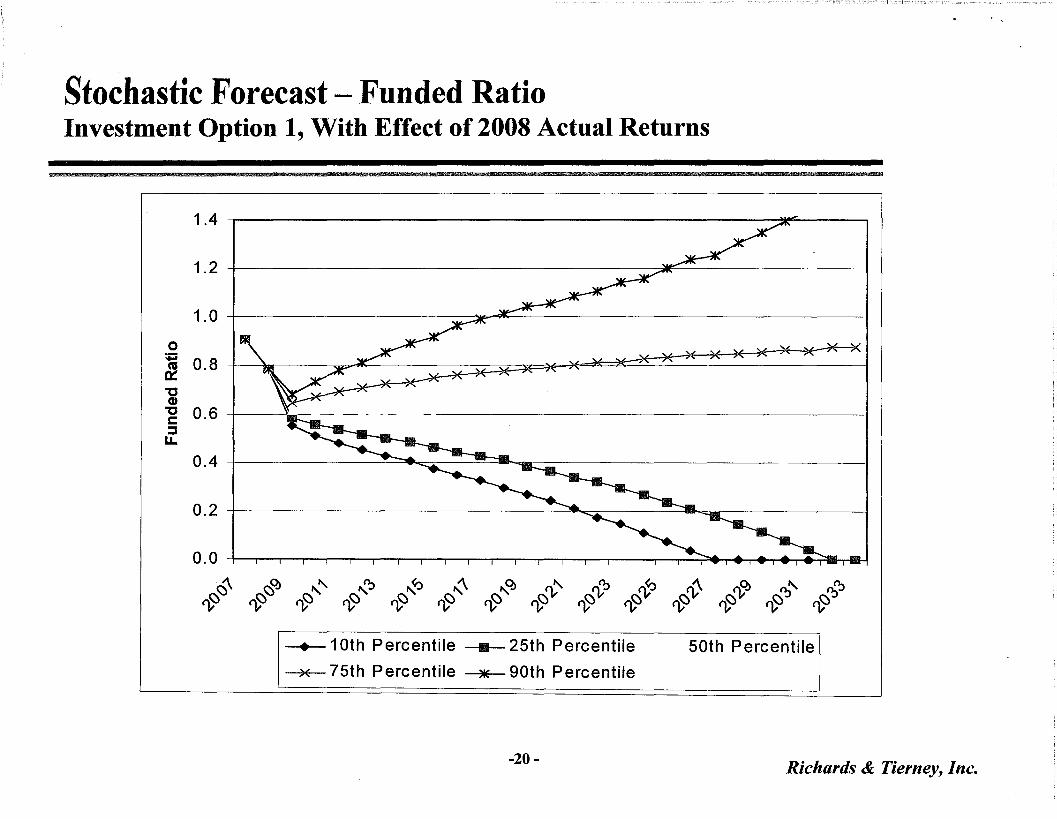
Stochastic Forecast - Funded RatioInvestment Option 1, With Effect of 2008 Actual Returns
lie:
1.4 .------------------------~------,
1.2 +-----------------~~------__l
0.4 +------~~=_--'~.......III___==__-------- ---I
0.2 +---------------.3I~---=--=---------~
o. 0 +-..,-r-,-,----r---,---,---,---,---,---r---r---.---,-~__;__r__...,___.,.._.:..::~._+_,_+_,...._...,.:.::;:::aIIh_~
~ ~ ~ ~ ~ ~ ~ ~ ~ ~ ~ ~ ~ 0/~ ~ ~ ~ ~ ~ ~ ~ ~ ~ ~ ~ ~ ~
1.0 +---------~~~--------------I
o~ 0.8 ~~-___:::JIF~~=-__==;z:~~~~~~~~~~==~=~=~"CCD-g 0.6 -f--........
:::::s11.
• 10th Percentile ____II_ 25th Percentile
~ 75th Percentile ----*'- 90th Percentile
50th Percentile
-20 - Richards & Tierney, Inc.

Stochastic Forecast - Funded RatioInvestment Option 2, With Effect of 2008 Actual Returns
..1.4
1.2
1.0
0+:l 0.8I}. -- -
"G)
" 0.6c:::::I
LL
0.4
0.2
0.0
~'\ ~Oj ~~ ~n;, ~~ ~ ~Oj ~l> ~n;, 1> ~ ~ ~~ ~n;,
~ ~ ~ C).,(:) C).,(:) C).,~ C).,(:) C).,(:) C).,(:) C).,(:) ~ C).,(:) C).,(:) C).,(:)
• 10th Percentile 25th Percentile
--*- 75th Percentile~ 90th Percentile
-21-
50th Percentile
Richards & Tierney, Inc.

Stochastic Forecast - Funded RatioInvestment Option 3, With Effect of 2008 Actual Returns
1.4 --.--------------------------.;:,.,e:---.,
1.2 --I-------------------=~"-'-----------~
1.0 --I----------~---------------I
o. 4 --I-,------------"--~=_----=-="1IIII__4lIIIIlc=---------- -----I
0.2 --I--------------~~-----1~_------
o. 0 -I-.,--.---;--,--r-r--r-r---1r---r-----r----,-----r--;-----,----.-'---.--,.-----.-~~~~~h==IIh-&-I
~ ~ ~ ~ ~ ~ ~ ~ ~ ~ ~ ~ ~ 0/~ ~ ~ ~ ~ ~ ~ ~ ~ ~ ~ ~ ~ ~
j 0.8 f~~~~~=~=***~~'*'"""-*=~~~~~~~=~~~"CCD-g 0 .6 -+---"'..:::s
LL
-+--10th Percentile 25th Percentile
~ 75th Percentile --.- 90th Percentile
50th Percentile
-22 - Richards & Tierney, Inc.

Stochastic Forecast - Funded Ratio100°A.Equity, With Effect of 2008 Actual Returns
0.2 +-----------~~---,-------"'=_-------I
o. 0 +-,.--r---r---r--r---,---r--,---r-.,.--r---r---r-.,..---,---r----.-~::r=+........,r_+_r.....,...~......~
~ ~ ~ ~ ~ ~ ~ ~ ~ p ~ ~ ~ 0/~ ~ ~ ~ ~ ~ ~ ~ ~ ~ ~ ~ ~ ~
""""'"
1.4
1.2
1.0
0..0.8caa::
"0CD
0.6"0s::::~u.
0.4 ---~
--+- 10th Percentile~ 25th Percentile
-*- 75th Percentile ---*- 90th Percentile
50th Percentile
-23 - Richards & Tierney, Inc.

Sample Table-.
Forecast Year: 2028
Funded RatioPV Contributions (MVAJAAL)
Mean Std Dev Mean Std Dev
Expected Returnssince 7/1/08
Current Portfolio 8,767,659,669 2,531,093,286 0.974 0.766
Option 1 8,571,418,346 2,629,430,318 1.050 0.854
Option 2 8,650,651,743 2,573,356,705 1.014 0.805
Option 3 8,557,180,165 2,617,640,410 1.053 0.850
100% Equity 8,131 ,909,113 2,989,825,786 1.327 1.291
With Effect of Actual2008 Returns
Current Portfolio 10,578,227,421 1,975,971,675 0.531 0.532
Option 1 10,462,645,189 2,085,014,597 0.586 0.591
Option 2 10,504,487,823 2,004,300,182 0.560 0.559
Option 3 10,445,515,340 2,062,030,064 0.588 0.589
100% Equity 10,458,807,261 2,737,726,785 0.703 0.830
-24 - Richards & Tierney, Inc.

Sample TableiN
Forecast Year: 2033
Funded RatioPV Contributions (MVAlAAL)
Mean Std Dev Mean Std Dev
Expected Returnssince 7/1/08
Current Portfolio 9,843,454,516 3,437,961,007 1.068 1.121
Option 1 9,596,690,351 3,554,688,616 1.186 1.281
Option 2 9,688,260,880 3,478,804,836 1.129 1.199
Option 3 9,570,246,607 3,531,024,067 1.190 1.283
100% Equity 9,124,415,721 4,044,685,828 1.641 2.122
With Effect of Actual2008 Returns
Current Portfolio 12,664,119,661 3,478,820,329 0.522 0.726
Option 1 12,443,043,024 3,589,050,335 0.560 0.833
Option 2 12,528,872,249 3,500,412,830 0.562 0.780
Option 3 12,417,537,358 3,557,838,245 0.603 0.836
100% Equity 12,481,107,386 4,386,189,331 0.803 1.299
-25 - Richards & Tierney, Inc.
....
MNSBI Asset Liability StudyDiscussion and Recommendations
i.
.. .
-26 - Richards & Tierney, Inc.
![The Library Associates [v. 7, no. 2]](https://static.fdocuments.in/doc/165x107/61b20d38338d474d4245187d/the-library-associates-v-7-no-2.jpg)

![The Library Associates [v. 2, no. 2]](https://static.fdocuments.in/doc/165x107/61cca42277d3f12ad152924e/the-library-associates-v-2-no-2.jpg)


![The Library Associates [v. 10, no. 2]](https://static.fdocuments.in/doc/165x107/61fa1f98696ad92ba86e94a7/the-library-associates-v-10-no-2.jpg)


![Library Notes: Donors [v. 5, no. 3]](https://static.fdocuments.in/doc/165x107/62a5296bbd231923397dc904/library-notes-donors-v-5-no-3.jpg)


