Leeway for the Loyal - Centre for Economic...
47
Manpower Human Resources Lab Leeway for the Loyal: A Model of Employee Discretion Francis Green MHRLdp002 April 2007
Transcript of Leeway for the Loyal - Centre for Economic...

Manpower Human Resources Lab
Leeway for the Loyal: AModel of EmployeeDiscretionFrancis Green
MHRLdp002April 2007

MANPOWER HUMAN RESOURCES LAB, CEP
As one of the world’s foremost employment agencies, Manpower is seeking to
contribute to the analysis of and policy debate around the issues of the
changing world of work. In May 2006 it therefore established with the Centre
for Economic Performance the Manpower Human Resources Lab at the
London School of Economics. The aim of the Lab is to become a leading
centre studying the impact of human resource decisions and labour market
trends on productivity at firm, national and global levels.
SENIOR STAFF Prof. Stephen Machin, FBA Director MHRL & Research Director, CEP
Alex Bryson Manpower Research Fellow, CEP
Professor Richard Freeman Director, Labour Studies Programme NBER & Senior
Research Fellow CEP
Tony Glassborow Human Resources Director, EMEA Manpower Inc
Prof. Alan Manning Director, Labour Markets Programme CEP
Prof. John Van Reenen Director, Centre for Economic Performance
Jo Cantlay Administrator
CONTACT US
Website: www.lse.ac.uk/manpower Postal address: Manpower Human Resources Lab Centre for Economic Performance London School of Economics Houghton Street London WC2A 2AE Email: [email protected] Telephone: +44 (0) 20 7955 7285

ABSTRACT
This paper examines the factors underlying task discretion from an economist’s
perspective. It argues that the key axis for understanding discretion is the trade-off
between the positive effects of discretion on potential output per employee and the
negative effects of greater leeway on work effort. In empirical analysis using
matched employer-employee data it is shown that discretion is strongly affected by
the level of employee commitment. In addition discretion is generally greater in high-
skilled jobs, though not without exceptions, and lower where employees are under-
skilled. Homeworking and flexitime policies raise employee discretion, while the
impact of teamworking is mixed, being negative in about half of cases, neutral or
positive for the rest. There are also significant and substantial unobserved
establishment-level factors which affect task discretion.

1 Introduction This paper examines the design of jobs from an economic perspective, with a focus
on employees’ autonomy. While worker autonomy has been central both to
sociology’s class-based analyses of work (Braverman, 1974), and to psychology’s
demand-control model of job satisfaction and stress (Karasek, 1979), neoclassical
economics traditionally placed no emphasis on the subject. Economics preferred to
leave issues of job design and work organisation to the “black box” of technical
processes taking place inside the workplace. Yet in recent decades the extent to
which employees are free to decide matters concerning their job tasks has come to
be seen as important in several strands of modern economic theory, which sees the
worker-boss relationship as an example of a principal-agent problem. The location of
influence over production decisions is an issue for the design of optimal incentive
structures (e.g. Athey and Roberts, 2001) or for the distribution of power (e.g. Guy
and Skott, 2005), depending on one’s perspective; it is an implicit or explicit
ingredient in efficiency-wage models. Workplace autonomy is also a highly valued
job feature in itself, being a major factor underpinning workers’ intrinsic job
satisfaction as proposed both in an earlier literature on job design (e.g. Davis, 1966;
Cooper 1973) and in more recent studies of job satisfaction (Harley, 2001; Green
and Tstitsianis, 2005). There is, moreover, indirect evidence of a high demand for
autonomy, in observed studies of the demand for self-employment status. Although
the latter is constrained by credit and cost restrictions, the desire for autonomy is
frequently given as a major reason for wanting self-employment (Taylor, 1996;
Clinton et al., 2006).
The particular aspect of autonomy upon which this paper concentrates is the level of
personal influence or discretion over the tasks that employees do in their own jobs,
referred to as “task discretion”. This aspect is distinct from any influence that might
be afforded to the teams in which employees might work, and from broader forms of
participation in organisation-wide decision making, whether through works councils,
trade unions or other communication channels.
The need for an understanding of task discretion is heightened by the discovery that
its average level fell considerably in Britain throughout the 1990s (and was probably
1

declining since at least the mid 1980s). By contrast, participation in decision-making
at establishment level, arguably less important than task discretion for employee
well-being, appears to have grown somewhat more widespread among British
establishments over this period (Felstead et al, 2002: 67-8; Gallie et al, 2004;
Millward et al., 2000). The 1990s fall in task discretion in Britain hardly conforms to
the paradigm of Post-Fordism and has yet to be adequately explained. The fall
contrasts with modest rises in workplace autonomy in Finland and in Norway during
both the 1980s and 1990s (Lehto and Sutela, 1999, 2005; Leiulfsrud and Dahl,
2005), while in Sweden there were increases from at least 1975 until the 1990s, at
the end of which some declines of decision latitude are reported (Theorell, 2004;
Vogel and Theorell, 2006). While comparisons of autonomy levels between nations
are subject to possible biases, in 2006 workers in the UK are reported to have an
average amount of autonomy, according to the European Working Conditions
Survey, while all the Scandinavian countries rank much more highly (European
Foundation for the Improvement of Living and Working Conditions, 2007).
Economists’ empirical investigations of efficiency wage models have focused on the
behavioural implications for productivity, wages, or work effort. Authors in this
tradition have not attempted to weave direct measures of workplace autonomy into
their tests of model predictions. Empirical research on job design, and attendant
studies of autonomy in jobs, have largely been carried out on small scale samples or
in single case studies, by occupational psychologists with rather different objectives
to those of economists. Consequently relatively little is known about the
characteristics of firms, jobs and workers that are associated with high or low levels
of autonomy – factors which might be thought relevant to a better understanding of
the formation of labour contracts. Moreover, the determination of autonomy has only
rarely been considered in the context of a profit-maximising model of the firm.
What, then, determines the amount of autonomy afforded to workers? The answer, I
propose in this paper, is derived from post-Fordism, and to the related issue of
workers’ commitment to the organisation. I use the term ‘post-Fordism’ here as a
short-hand for the proposition that, in contrast to the technologies and power
structures of earlier generations, prevailing modern technologies are such that
relatively dense local decision-making (by workers themselves, individually or in
2

teams) is efficient up to a point: it therefore profits employers to allow employees
some leeway in their jobs. But employers also face the fundamental post-Fordist
dilemma that leeway permits self-interested employees to take advantage and work
less hard.1 Autonomy can be more effectively granted, therefore, to those workers
that are less likely to behave opportunistically – that is, those whose preferences are
to identify with the company’s objectives, share its values, and to show loyalty.
Leeway is thus for the loyal, not for a purely self-interested homo economicus. The
centrality of a key role for affective commitment is this paper’s core hypothesis.
Recent large-scale empirical studies of worker autonomy have examined the roles of
collective bargaining, skill, technology, work organisation and sector. Harley (2001)
found, contrary to the expectations of high-performance management theorists, that
team production techniques had little or no effect on personal discretion. Batt (2004)
reports US evidence that self-managed teams enhance discretion somewhat for
workers, but decreases it for supervisors. Gallie et al (2004) also report a mixed
impact of teamworking, but they also found that neither technological/organisational
nor compositional changes in Britain’s labour market account for observed
movements in task discretion. They speculate that the decline may have been linked
to a growing culture of management by target-setting, and closer monitoring of work
as a response to greater international competition or to an increasingly controlling
regulatory framework. None of these studies have attempted to bring out a key role
for commitment in determining job design.
This paper proposes several advances in our understanding of task discretion. As a
preliminary, the determination of discretion is first set in a simplified theoretical
framework designed to bring out the role of affective commitment alongside skill. To
1 This dilemma (and associated class conflict) did not, of course, originate in the current era
(Braverman, 1974). However, a central tenet of the post-Fordist theory of production is that the
predominant technologies became more flexible and uncertain than in the Fordist era. The Second
Industrial Divide (with Charles Sabel,) Basic Books, Inc. 1984.
This change radically altered the trade-off between control and delegation of autonomy, so that the
granting of autonomy was to become no longer the exception, a privilege attained mainly by
professional workers and a managerial elite; rather, the ideal was one of flattened hierarchies and
devolved control.
3

set the empirical scene, it sheds some preliminary light on whether the 1990s decline
in British workers’ task discretion has continued in the present decade. I then make
use of matched employer-employee data to investigate the multiple determinants of
task discretion. The richness of the data permits an analysis of the impact of several
forms of work organisation including teamworking, home working and other forms of
flexible work practices, as well as an investigation of the effect of management by
target-setting and a focus on the role of worker’s commitment and skill. The paper
also explores for the first time the effect of skill mismatch on discretion, in particular
the impact on discretion of workers being under-skilled for their job. Finally, it
examines the extent to which there unknown establishment-specific effects are
having an effect on job design. The significance of this investigation is that any
establishment-fixed effects on job design are interpretable as potentially originating
from the particular management culture of the organisation.
The paper proceeds as follows. Section 2 sets out a simple model of the
determination of task discretion which highlights the role of worker commitment, and
derives a number of hypotheses for empirical testing. The model implies that
discretion is increased when workers have greater commitment, but that the
relationship with job-skill level is ambiguous and the link with skills mis-match is
asymmetric. Section 3 describes the data, and Section 4 follows with the reported
findings.
2 The Determination of Discretion: Theory and Model Specification The level of autonomy afforded to workers in their jobs can be viewed as a decision
about job design. The aim of this section is to describe a simplified model of the
determination of task discretion (representing autonomy) for a job, which will provide
the framework for the empirical investigation of hypotheses in Section 4. The
essence of the model is in part a trade-off between effort and efficiency. This part of
the theory is in the spirit of economic models in which the allocation of decision rights
is endogenously determined by the trade-off between the value (to principals)
derived from delegating authority and associated incentives to agents (in this case,
4

employees) and the costs of ceding control to agents whose interests differ from
those of principals (Aghion and Tirole, 1997; Dessein, 2002; Athey and Roberts,
2001). In this paper, however, I am not concerned not with the resulting interactions
between incentives structures and delegation. Quite simply, the decision about
discretion is assumed to be affected both by the extent to which discretion raises (or
lowers) productivity and by the impact of discretion on worker effort, which in turn
depends on workers’ commitment to the organisation.
In practice potential discretion ranges over many domains in any one job. Employees
might be able to decide the order of tasks, for example, without having any say over
which tasks are to be done. Some tasks may be left to employees’ decisions, while
others are closely controlled by managers. At any one time discretion can be
conceived as the proportion of feasible tasks among which the employee can decide
on a course of action. The average taken over a sufficient period constitutes the level
of discretion in the job. I postpone till the next section how this concept of discretion
can be operationalised and captured with survey items.
We can express the value of output per employee, q, as:
( , , ) ( , )q f s x g x cσ= (1)
where f() is the productivity of effective labour, and g() is the amount of effective
labour per employee (work effort); x is the level of employee discretion, � = h – s is
the difference between the own skill level (h) and the job-skill level (s), and c is the
level of affective organisational commitment (to be discussed below). Discretion may
raise productivity up to a point, but it may also diminish work effort – a standard
principal-agent issue. It is this form of the production function which generates the
fundamental post-Fordist trade-off in job design. Whereas, in traditional neoclassical
theory, it used to be assumed that the employer would choose to design jobs with
zero discretion, modern theory recognises that there are productive advantages to
granting employees freedom to make hard-to-anticipate daily decisions, or more
broadly to exercise creative powers on behalf of the employer. Some local task
discretion is productive because it makes better use of employee’s knowledge and
5

information that is frequently changing than is possible for distant managers. This
assumption reflects the idea of post-Taylorism in labour process theory, and
captures a substantial literature concerning functional flexibility in modern
organisations. Up to a point the marginal productivity of increased discretion is
assumed positive, though there will be diminishing returns as workers are
constrained by the limits of their own knowledge and skill.
More skilled jobs are more productive. Moreover, because decision-making and
creativity require the employee to have knowledge of existing production processes
and future possibilities, I expect high-skilled jobs, as long as they are matched by
higher-skilled workers, to benefit more than low-skilled jobs would from discretion.2
Complex production processes (giving more skilled jobs) are more likely to benefit
from dense optimal decision-making than simpler processes that can be coded in
informal, bureaucratic or software routines. The lowest amount of discretion is
needed for low-skilled routine jobs, where decision-making is thin. Where, by
contrast, there are many non-routine functions required, as can happen in some
service jobs that are nevertheless classified as low-skilled, there remains a
productive value to allowing such workers a measure of discretion. The post-Fordist
thesis stated in this and the previous paragraph is embodied in the assumptions
. 0,0,0,0 >><> xssxxx ffff
The match between the workers’ skills and the jobs they do is also important. With
frictions in the labour market, including hiring costs, workers can and often do persist
in jobs where they have too many or too few skills needed to do the job well. For any
given level of job skills a rise in own skills raises productivity when workers are
under-skilled but has little or no impact when workers are over-skilled. In addition the
marginal productivity of discretion is expected to be lower the more that employees
are under-skilled for the job, because the benefits of local decision-making are
reduced if some wrong decisions are made. On the other hand, if employees are
2 In certain strands of sociological theory, skill is defined as constituted partly by autonomy, and partly
by job complexity. See Spenner (1990) for a methodological review.
6
over-skilled for the job, one would not expect the marginal productivity of discretion
to be affected by further increments to the employee’s skill. Thus:
.00,000 ≥==<>> σσ σσσσ forffforfandf xx
Personal skill, however, is not the only factor constraining the level of afforded
discretion. The latter depends, also, on the fact that increased discretion gives more
scope for opportunistic behaviour, and so may lower work effort, other things equal.
The constraint on opportunistic behaviour is the threat of some penalty for those
caught taking advantage of this scope. I abstract from considering variations in
monitoring costs or in efficiency wages, either of which can play the central role in
determining discretion in standard models. Instead, despite its impact on effort non-
zero discretion is chosen because of its direct positive impact on productivity.
Formally, I assume . 0<xg
However, the potential losses from opportunistic behaviour depend on workers’
preferences – in this case, their disutility from effort on behalf of their employer.
Whereas economic theory typically takes workers’ preferences as given, here I draw
on psychological literature for a measurable construct, i.e. “organisational
commitment”. A substantial literature from psychology and from human resource
management analysts shows that employees are to different degrees committed to
their work organisation. A distinction is made between forms of commitment, the
most prominent categorisation being between “affective”, “continuance” and
“normative” commitment. A good part of the research programme of psychologists
working in this area has been trying to understand how the different states of mind
and preferences represented by these constructs relate to each other, and to other
psychological constructs. The constructs are also expected to be related to
behaviours such as turnover and effort, and these have been confirmed in many
studies (Mathieu and Zajac, 1990; Meyer et al, 2002). Of most relevance here is the
idea of affective commitment, associated with the work of Mowday et al (1979,
1982). From the economists’ perspective, affective organisational commitment can
be thought of as a proxy for the utility attached to working for the current employing
organisation, compared to a similar job working for the next best available
organisation. The worker experiences firm-specific utility from belonging to (being
7

employed by) the organisation, in so far as he/she shares the values of, and
identifies with, the organisation. Those with a greater affective commitment to their
organisation want to work harder, or are less averse to work effort, on behalf of the
organisation.3 Moreover, increased affective organisational commitment is expected
to raise the marginal impact of discretion on work effort (that is, to lower the negative
impact of discretion). Thus I assume . 0,0 >> xcc gg
Assuming a firm designs jobs with discretion levels to maximise output per employee
the first-order condition for an interior solution implies:
0=+ xx fggf (2)
Thus the optimal work design is set where the marginal productivity of an increase in
discretion is set equal to the marginal loss from lower effort. This is the fundamental
post-Taylorist trade-off in job design that I referred to above. It is a simple matter of
comparative statics to show that:
( xcxc fgfgcx
+Δ−
=∂∂ 1 ) (3)
( xsxs gfgfsx
+Δ−
=∂∂ 1 ) (4)
( xx gfgfxσσσ
+Δ−
=∂∂ 1 )
(5)
where by the 202 <++=Δ xxxxxx gffggf nd-order condition.
The level of discretion is thus unambiguously expected to increase in the level of
commitment. An employer whose workforce is more committed and loyal will choose
to grant greater autonomy to them, allowing them greater discretion to choose which
3 Both academic and popular management theorists urge employers to harness this commitment (e.g.
Walton, 1985; Peters, 1992). The net effect on output and labour turnover of firm-specific utility is the
same as that of firm-specific human capital, the only difference being that commitment affects effort
while firm-specific human capital is normally conceived as raising output per unit of effort.
8

tasks to do, how and when to do them, how well to do each of them and how hard to
work at them.
The effect of job-skill level on discretion is, however, ambiguous. A rise in job-skill
level increases the marginal impact of discretion on output (the first term in (4));
while the second term shows that in a high-skilled job there is more value at stake
from opportunistic behaviour. If the first term prevails, we expect to see discretion
associated with high-skilled jobs, which is the conventional presumption in
sociological accounts of discretion in its relation to social class. The second term
shows the possibility that there may be some highly skilled jobs, however, which
managers choose to monitor closely and allow little discretion. The cost to the
employer of self-interested employee behaviour is raised if the job-skill is raised.4, 5.
The effect on discretion of a rise in own skill level is predicted to be zero, when skill
is above the matched level for the job. When own skill is below the matched level,
the impact of own skill is ambiguous. In that circumstance the first term in (5) is
positive, reflecting the fact that more skill raises the marginal productivity of
discretion, and hence the demand for discretion. The second term is negative,
however, reflecting again the fact that the stakes are raised when skill is increased.
Thus the discretion function can be written:
( , , , )x x c s σ= Μ (6)
with 0>cx , xs ambiguous and x� either zero if σ is non-negative or ambiguous
otherwise; M is included in order to represent the different production functions that
prevail in each establishment. M can be seen as capturing either different
technologies that require varying levels of local decision-making, or more generally 4 High-skilled professional occupations (e.g. doctors and academics) typically advocate their own
autonomy, referring to its productive value for their employers. The potential downside of such
autonomy normally has to be pointed out by others. 5 The alternative in this context might be to link performance with pay, if suitable instruments are
available to employers to measure performance; but to keep things simple I have abstracted from
other forms of motivation
9

establishment-specific management policies. Some of the latter will be observable
practices and policies, while others may by unobserved cultures that entail certain
beliefs about the productiveness of discretion. M thus allows for the possibility that
there will be establishment-wide attitudes to job design that are not related to job or
personal characteristics.
Assuming a linear specification we may write the following equation to be estimated:
ij ij ij ij i j j ijx c s X Zα β χσ φ θ μ ε= + + + + + + (6/)
Subscripts ij refer to employee i in establishment j; is a vector of controls for
personal and job characteristics; are controls for observed establishment policies
and practices;
iX
jZ
jμ captures the unobserved establishment-fixed effects, and ijε
random error.
Equation (6/) is a structural equation determining the level of discretion, and it might
be thought of as part of a wider model of determination within an organisation, that
encompasses job design, other elements of work organisation, skill, wages and
broader strategies and technology. In principle, the way to analyse firm behaviour
should be through a multi-variable model that treats firm behaviour in a system
context, in which all but a few variables are seen as endogenous outcomes of the
managerial system. Yet no empirical studies of work organisation have been
couched in such a systemic way, owing to the twin problems of scarce data and the
difficulties of identifying structural relationships from observed behaviour. The typical
approach is to specify single-equation relationships in linear or easy-to-estimate
forms, and treat all RHS variables as exogenous; or else to limit the aim to capturing
conditional correlations which may or may not be indicative of causation. Studies of
discretion are also like this (Harley, 2001; Gallie et al, 2004). Arguably single-
equation OLS studies do pick up much that is sensible about real-world
relationships. Yet unobserved heterogeneity is a ubiquitous issue throughout
quantitative industrial relations research. In this case, a potential problem arises in
that a key RHS variable, commitment, is a measure of self-reported preferences,
while the dependent variable is a self-reported measure of work design. If both self-
10

reports are affected by unobserved personality traits, which could increase the
likelihood of more positive responses to both commitment and discretion, the
estimate of � will be upward biased. The risk of bias is compounded by the
possibility that reverse causation is also present. Designing jobs with high levels of
discretion may be one way of generating affective organisational commitment
(Lincoln and Kalleberg, 1990), since worker autonomy is a major determinant of job
satisfaction. A more satisfied worker is more likely to develop preferences favourable
to the organisation, and indeed several studies report correlations between job
satisfaction and organisational commitment (Cohen and Gattiker, 1994). It will
therefore be necessary to account for potential biases in the estimates of α , through
the use of suitable instruments to be discussed in the next section.
The assumptions of the model imply the following hypotheses: ^ ^ ^ ^
1: 0; 2 : ; 3 : 0, 0H H ambiguous H ambiguous for otherwiseα β χ σ χ> ≤ =
These hypotheses can be tested using a variety of assumptions about the
covariance of the error structures. In addition, I shall also consider in Section 5
whether certain management policies or technological/organisational characteristics
captured in or job characteristics captured in , have the expected association
with task discretion – these include teamworking, homeworking, Just-In-Time
production systems, flexible work practices, forms of work monitoring, and trade
union membership.
jZ iX
3 Data
To investigate these issues I make use of a recent matched establishment-employee
data set, the Workplace Employment Relations Survey, 2004 (WERS 2004), which is
a nationally representative, multi-part, survey of people at work. WERS2004
represents a continuation of earlier surveys of British industrial relations, though only
the 1998 and 2004 surveys have contained surveys of matched employees. The
survey series provides a mapping of employment relations practices across
11

establishments and time. The management survey in WERS2004 gives measures of
workplace characteristics, as well as rich details of human resource practices, and
representation and communication mechanisms. In 2004, the sample was drawn
from establishments with 5 or more workers. A stratified sampling strategy was
pursued, in order to obtain sufficient cases of establishments with many employees.
Accordingly analyses are normally weighted by the sampling weights provided
(which also take account of non-response biases) in order to obtain unbiased
estimates of the target population across Britain. The true response rate among
eligible establishments was 64%.
For the survey of employees, questionnaires were distributed by management to up
to 25 potential respondents in each establishment. In the case of establishments with
between 5 and 25 employees, all employees received a questionnaire; for larger
establishments, employees were chosen using a random selection process. In about
14% of establishments where a manager was interviewed, no employee
questionnaires were returned, largely because the forms failed to be distributed.
Among those where at least one questionnaire was returned, the employee
response rate was 61%. The non-response, together with the survey-design
selection probabilities, was used to generate appropriate weights for use in analyses.
Details of the differential non-response rates can be found in the Technical Report
along with the data at the UK Data Archive (Department of Trade and Industry.
Employment Markets Analysis and Research et al., 2005). In what follows, it is
implicitly assumed that any unobserved factors affecting response propensities are
not correlated with the variables of interest in the analyses. Use is also made of the
equivalent employee survey in WERS98 to examine the most recent trends in
discretion and commitment. In what follows, the analysis is confined to the private
sector.6
6 This restriction follows from the paper’s focus on organisational commitment, in respect of which
respondents are questioned about the loyalty to the organisation they work for. The potential
ambiguity as to what is meant by the organisation they work for is of possible concern in the case of
public sector workers.
12

4 Findings
Measuring task discretion and organisational commitment
The measure of task discretion was derived from responses to five questions that
began with the common stem: “In general, how much influence do you have over the
following?”. The questions then referred to what tasks were done, the pace of work,
how the work was done, the order in which tasks were done, and the timing of the
start and finish of the working day. Against each of these domains of control,
respondents replied on a 4-point scale.
Their responses are shown in Table 1. It can be seen that a substantial majority of
respondents perceived that they had at least some influence in four of the domains;
but that only a half of respondents felt that they had at least some control of when
they started and finished work. A third were completely constrained in the latter
regard, experiencing no control at all.
For the subsequent analysis I computed a single measure capturing the overall level
of task discretion in the job. Assigning cardinal values 1-4 respectively to the
responses “none” to “a lot”, an additive scale is obtained, entitled the Task Discretion
Index (TDI), by averaging the values of all five variables, yielding a range 1 to 4 and
a mean of 3.002. Cronbach’s alpha statistic measuring scale reliability for this
measure is 0.815, which implies a good level of reliability. Alternative indices can
also be used, in order to test the robustness of the findings. One alternative is to
generate scores from a factor analysis. The principal factor method was used, and
this extracted only one factor. In another alternative, the fifth domain was excluded
from the scale (for both the additive scale and the factor score), since its correlation
with the other domains was the lowest. In what follows, a broadly similar pattern of
findings emerges from using any of these alternatives, so only the findings from the
additive scale are presented.
13

Complementing employees’ estimates of their own task discretion, managers’ were
also asked three questions about the individual task discretion involved in the jobs of
employees. Managers were asked “to what extent would you say that individuals (in
the largest non-managerial occupational group in the establishment) have discretion
over how they do their work”. Subsequent questions asked about having “control
over the pace at which they do their work” and “involvement in decisions over how
their work is organised”. Respondents could answer “a lot”, “some”, “little” or “none”.
The responses to these questions were averaged to generate a separate additive
scale (Cronbach’s alpha = 0.723), to be entitled the “Task Discretion Index,
Managers’ Perception” (TDIMP), again ranging from 1 to 4. Earlier studies have
found that there tends not to be a high correlation between managers’ and
employees’ perceptions of task discretion; nevertheless it is of interest to examine
the extent to which the the TDI and the TDIMP scales are correlated in the WERS04
data. For this purpose, I computed the mean TDI at establishment level, for only
those employees who belonged to the largest occupational group.7 The correlation
coefficient between the mean establishment-level TDI and the TDIMP was 0.210,
significantly positive with a p-value of 0.00.
Table 2 shows the variation in task discretion across major occupational groups and
across the education levels of the employee respondents. As the table shows, the
TDI and TDIMP are both broadly related as one would expect with the major
occupational groups: Managers and Professionals and Associate Professionals,
typically seen as the high-skilled groups, report above-average levels of discretion.
Nevertheless, aside from these groups there is less of a gradient of the TDI between
traditional conceptions of occupational skill level and discretion. The table also brings
out that there is a positive association between employee discretion and education
levels. Nevertheless, this association is shown only to apply within the upper levels
of the education spectrum. At level 3 and below there is essentially no relationship
between education and task discretion; but there is a clear upward gradient between
levels 3 and 5.
7 The mean establishment-level estimate of the employees’ perception of discretion is measured
imprecisely, because of limited numbers in each establishment.
14

Particular cases at the 2-digit level also serve to make the point that the TDI is
broadly in line with prior expectations. Marketing and sales managers, for example,
have high levels of discretion (mean value 3.59) as do production, works and
maintenance managers (3.46). By contrast, examples of occupations with low levels
of discretion include call centre operators (2.31) and bus, van and coach drivers
(2.57). One reason why Elementary Occupations do not all show especially low
discretion levels, despite their low-skilled tag, is that this group embraces
occupations that nevertheless require non-routine processes. Cleaners and
domestics, for example, have slightly above-average discretion (3.05), despite being
classed as low-skilled.
Task discretion has been found in detailed case studies and in earlier empirical work
to be related strongly to job satisfaction (e.g. Green and Tsitsianis, 2005). WERS04
asks employees about seven separate domains of job satisfaction. Four of these
domains pertain to intrinsic aspects of the job (sense of achievement, scope for
initiative, amount of influence, the work itself) while the remaining three tap extrinsic
aspects (pay, security and training). I generated an additive index of intrinsic job
satisfaction (Cronbach’s alpha = 0.849 ). The individual-level correlation between this
intrinsic job satisfaction index and the TDI was 0.371. Some validation of the
discretion data is evident in this strong correlation.8
To measure organisational commitment, WERS04 asks three items drawn from the
Organizational Commitment Questionnaire (Mowday et al. 1982). The questions
asked respondents how far they agreed with the statements: “I share many of the
values of my organisation”, “I feel loyal to my organisation” and “I am proud to tell
people who I work for”. While this number of items is less than desirable, they form
the core of the notion of affective commitment, essentially a measure of employee
preferences concerning working for their employer.9 The responses from these three
items were averaged to generate an additive scale of Organisational Commitment
ranging from 1 to 5, with a Cronbach’s scale reliability coefficient of 0.850. 8 In a multi-variate analysis, including all variables normally included in such an analysis, discretion
was also by far the most important variable to have an association with job satisfaction. 9 The full Organizational Commitment Questionnaire, which is a 15-item scale, correlates highly with
the Affective Commitment Scale (Allen and Meyer, 1990).
15

Table 1 Distribution of Domains of Task Discretion, 2004
Domains of Control What tasks Pace at
which work done
How tasks done
Order of tasks
Time of start and finish of work day
A lot 37.6 39.4 51.6 49.8 25.6 Some 36.4 34.6 32.7 33.0 23.6 A little 14.4 15.1 11.3 10.8 16.3 None 11.6 10.8 4.4 6.3 34.5 Task Discretion Index (see text): Mean 3.002 Range 1-4 Standard Deviation 0.752 Estimates weighted by probability of employee selection. A small number of cases with missing values is excluded. Table 2 Task Discretion Indices by Major Occupation Group
Occupation
TDI TDIMP
Managers 3.46 n.a. Professionals 3.16 3.30 Associate Professionals 3.13 3.14 Administrative & Secretarial 2.99 2.98 Skilled Trades 2.97 2.83 Personal Services 2.84 2.79 Sales 2.74 2.70 Plant & Machine Operatives 2.73 2.43 Elementary 2.84 2.42
Education Level (Equivalences)
No qualifications 2.95 - GCSE grade D-G 2.92 - GCSE grade A-C 2.88 - 2 or more A-Levels 2.97 - Batchelor’s degree 3.11 - Higher degree 3.21 -
Estimates weighted by probability of employee selection. A small number of cases with missing values is excluded.
16

The change in task discretion and organisational commitment, 1998-2004 Did the decline in Task Discretion through the 1990s identified by Gallie et al (2004)
persist in the present decade? Table 4 presents some initial suggestive evidence to
emerge on this issue. It compares responses to identical questions on task direction
in WERS98 and WERS04. Only two domains are available for this exercise: control
over the pace of work and over how tasks are done. To ensure comparability of the
sample base, those working in establishments with less than 10 employees were
excluded from the WERS04 data. The comparison is reliable to the extent that the
employee samples are representative of the population in each year; to help ensure
this, the responses have been weighted.10
As can be seen, there has been little change in the extent of discretion over the
period. If anything, there appears to have been a small increase in the proportions of
employees experiencing “a lot” of control over the pace of work, and over how the
work is done. However, these differences are not statistically significant, and
according to the managers’ reports for the largest occupational group in the
establishments there has been a small decrease in discretion. This stability
contrasts with the earlier decline in discretion.11
In a similar way, Table 5 compares organisational commitment over the two surveys.
According to Gallie et al (2001) there was little change during the 1990s in the extent
of organisational commitment in the British workforce, a somewhat surprising finding
in light of much rhetoric concerning the growth of the high-commitment work
organisation. Looking over the more recent period, Table 5 shows that there were
small increases in each component of organisational commitment; and the mean
level of the Organisational Commitment index increased significantly between 1998
and 2004.
10 The weights do not account for the possibility that the propensity to participate in the survey is
related in unknown ways to workplace discretion. 11 The 2006 Skills Survey, now in the field, will afford an opportunity for a comprehensive confirmation
or refutation of this finding.
17

Table 4 Task Discretion, 1998-2004. Employees’ reports Control over pace of
work Discretion over how
work is done % of employees % of employees 1998 2004 1998 2004 A lot 35.4 38.7 48.8 51.2 Some 36.5 34.6 33.6 32.9 A little 16.1 15.3 11.5 11.4 None 13.5 11.4 6.1 4.6 Managers’ reports for largest occupational group
Control over pace of work
Discretion over how work is done
% of establishments % of establishments 1998 2004 1998 2004 A lot 25.7 23.0 28.8 23.7 Some 38.9 41.2 41.6 41.0 A little 25.1 26.1 20.7 26.0 None 10.4 9.7 9.0 9.3 The base is all private sector employees in establishments with at least 10 workers. Table 5 Organisational Commitment, 1998 and 2004. Shares values Feels loyalty Proud to tell 1998 2004 1998 2004 1998 2004 Strongly agree
7.5 10.8 16.2 20.1 16.7 20.0
Agree
41.6 41.7 49.0 49.6 39.8 39.7
Neither agree nor disagree
34.8 34.5 23.7 19.9 31.5 29.1
Disagree
12.2 9.9 7.7 7.4 7.9 7.5
Strongly disagree
3.8 3.1 3.6 3.0 4.1 3.6
The base is all private sector employees in establishments with at least 10 workers. OC Index in 1998: Mean 3.539 S.E. 0.006 OC Index in 2004: Mean 3.630 S.E. 0.007
18

Estimating the model of task discretion Tables 6 and 7 present estimates of the impact of organisational commitment and of
other variables on task discretion, with Table 6 giving the results for the employee-
level measure of discretion (TDI) and Table 7 for the establishment-level measure
(TDIMP). In order to be able to compare better the findings from the two levels of
analysis, the analysis in Table 6 is based only on employees in the non-managerial
occupation groups.
Column (1) of Table 6 gives the OLS estimates, while column (2) presents estimates
using instruments for organisational commitment, and column (3) presents fixed-
effects estimates which control for establishment-wide unobserved effects on job
design.
Variables used as instruments for organisational commitment in column (2) are as
follows. First, two variables are included which capture management’s report on
whether employees in the establishment are “led to expect long-term employment in
this organisation”. One dummy variable is included for “strongly agree”; another
dummy represents “disagree” or “strongly disagree”. Second, two variables are
included which capture whether, in the management’s view, “employees here are
fully committed to the values of the organisation”. Again, one dummy variable
captures “strongly agree”, while another represents “disagree” or “strongly disagree”.
By using variables taken from the management questionnaire, one can avoid
potential common method bias, that is, the bias due to unobserved heterogeneity
associated with personal traits affecting both dependent and independent variables,
since presumably judgements made by manager respondents are not correlated with
those made by individual employees. Using these variables as instruments depends
on the assumption that they do not themselves affect job design for individual
employees in the establishment except via the effect that they may have on the
organisational commitment of individuals. Moreover, in order to provide well-defined
instrumental variable estimates, the instruments should also have a strong
association with organisational commitment.
19

As usual in such cases these assumptions could be questioned. For example, even
though the expectation of long-term employment is not obviously connected directly
to autonomy in the workplace other than through commitment, it would not be hard to
manufacture a possible explanation. Accordingly, diagnostics tests are needed to
examine whether the instrumental variable assumptions are satisfied in practice. The
Hansen J statistic for overidentification is computed to be 2.486, which implies that
one cannot reject the null hypothesis that the instruments are uncorrelated with the
error term in the equation estimating task discretion ( ; P-value = 0.478).
In that sense, they are correctly excluded from the specification.
3.1123,01.0 =χ
3.1324,01.0 =χ
To test for whether the task discretion is under-identified, the Anderson canonical
correlation LR statistic is computed to be 209.21, which implies that the null
hypothesis that the equation is not identified (the instruments not correlated with
commitment) can be rejected ( ; P-value=0.000). There is sufficient
correlation between the instruments and employee organisational commitment.
However, it could still be the case that instruments are “weak”, which would mean
that the estimates are biased (usually downwards) in finite samples and that the
significance level is higher than implied by the reported t-statistics (Murray, 2006).
The test for weak instruments is the first-stage F statistic, which is computed to be
52.54; this implies that the true significance level is below 10% when the nominal
level is 5% (critical value 19.93). Thus the instruments are not weak.
Consider now the findings from Table 6. Do they support the hypotheses proposed in
Section 2?
An initial striking finding is that task discretion, as predicted (H1), is positively and
strongly affected by workers’ organisational commitment. This conclusion emerges
first in the OLS estimate shown in column (1), but it is supported by the IV estimate
shown in column (2), the latter showing only a slightly lower coefficient, not
significantly different. I conclude that jobs for workers with greater commitment are
indeed afforded greater discretion. Moreover, the direct impact is substantial: using
the IV estimate, a one standard deviation increase in commitment raises task
discretion by 0.182, which is 24% of the standard deviation of task discretion.
20

Put another way, if we compare the job designs of workers who on average “neither
agree nor disagree” with the three organisational commitment items with otherwise
similar workers who “strongly agree” with the items, the effect on discretion of the
raised commitment would be 0.44, more than the equivalent of switching from a
customer service occupation to a science and technology professional occupation
which would normally be considered to be much more skilled. The link between task
discretion and skill (H2) is investigated first by including 24 2-digit occupational
dummies, on the presumption that higher level occupations require greater skills.
The least discretion is generally afforded to some of the lowest-ranking occupations
(e.g. customer services, comprising call centre operators and other customer care
occupations). Yet there are exceptions, with, for example, health professionals also
showing low task discretion. Closer inspection reveals that this low-discretion finding
for health professionals is mainly driven by pharmacists/pharmacologists in large
workplaces. In all lines of work those in supervisory positions have, as expected and
noted above, substantively greater levels of discretion.
Another way of investigating H2 is through the link with computer usage. Jobs with a
greater range of computer usages can be seen as loosely linked with skill and, as
can be seen, the estimated impact of this variable is positive and significant. Thus
the link with skill is weak though broadly positive, in line with prior information about
labour processes in specific occupations, and in line with the normal expectation in
sociological literature. Nevertheless, there are groups of workers with relatively low
discretion despite their high skill levels. The mixed picture is consistent with the
ambiguous story implied by (4). For such high-skill/low discretion occupations the
explanation is that any extra productivity that might be obtained from giving them
more discretion than less-skilled workers is more than outweighed by the loss of
output from potentially lower effort levels that might accompany greater discretion.
H3 concerns the link between the person-job skills match and discretion.
Respondents were asked “How well do the work skills you personally have match
the skills you need to do your present job?”, and could answer on a five point scale
(Much higher/ a bit higher/ about the same/ a bit lower/ much lower). Table 6 shows
that, for a given job skill level, workers who perceive that their skills match the
required job skills are afforded more discretion than those who were under-skilled for
21

the job. For this group of under-skilled (only about 5 % of the sample), employers
have granted them less leeway because discretion for them would be less productive
or even of negative value if it raised the frequency of inefficient actions. By contrast,
those who thought that they had more skills than needed (55% of the sample) were
afforded neither more nor less than the discretion allowed for those whose skills
were matched.
Consider now the additional variables included because they carry information about
the technology or work organisation that may independently affect the discretion that
workers experience (thus affecting the production function). First I included an
indicator of the use of a Just-In-Time inventory control system on the grounds that
this system requires less individual freedom to alter the pace and timing work. Some
34% of private sector employees work in establishments deploying a JIT system in
Britain (see Appendix, Table A1). While the estimated effect on their discretion has a
negative coefficient, it is not statistically different from zero in either the OLS or IV
specifications. Thus, the one included establishment-level technical characteristic of
production has a negligible association with discretion.
Aspects of work organisation, however, are important. Home working, in particular, is
expected to be associated with greater discretion, since for home workers
managerial supervision of the labour process is restricted to problematic
technologies of distance surveillance, uneasy home visits and the setting of
behaviour-distorting targets (Felstead et al., 2003). The survey does not record
whether individual workers are home workers, but it does report the proportion of
employees who are working largely from home during working hours. Consistent with
this expectation, workers in establishments with a larger proportion of home workers
experience on average greater task discretion.
The effect of teamworking, as a distinct form of work organisation, on task discretion
has been investigated by Harley (2001) using data from WERS98. As Harley
describes, two distinct hypotheses have been posed regarding the role of
teamworking in shaping the design of individual jobs. Optimistic perspectives
associated with HRM (Harley cites, among others, Katzenbach and Smith (1993))
have expected teams to raise employee discretion. By contrast critical accounts, for
22

example that by Marchington (2000), have held that teamworking’s putative
liberating effect on job design was illusory and that teams instead led to new forms of
control, to work intensification and to limited, rather than enhanced, discretion.
Harley’s paper constitutes an advance in our understanding of the effect of teams on
employees. Using the nationally representative data available in WERS98 he finds
that on average teams neither raise nor lower discretion significantly. Harley argues
that the introduction of teams has had little or no effect because teams are
managerially driven, and/or teams do not constitute a major change in hierarchical
work organisation. His analysis, however, is confined to establishments where either
none or all of the establishment’s largest occupation group (LOG) are in a team, and
with further restrictions this means that only a minority of employees in WERS98 are
included in the analysis. Moreover, Harley includes only one category of team in his
analysis. Here I include both teams that appoint their own leaders and those that do
not; and both teams which, according to managers, “jointly decide how work is done”
and those that do not. These two variables are each interacted with an index of the
proportion of the largest group that is working in teams.
It can be seen from Table 6 that the impact of team working on discretion is
significant but differentiated. Consider, first, teams where members do not jointly
decide how work is done. Comparing establishments with no teamworking in the
largest occupational group with establishments where there is 100% teamworking,
discretion is 0.65 lower, consistent with the critical accounts of teamwork. However,
for those teams where team members jointly decide about work (covering
establishments with 49% of employees), the negative impact of teams is almost
exactly neutralised: the joint impact is -0.002 and statistically insignificant. For these
employees the essence of Harley’s neutral finding is reproduced here. Finally,
whether the team is self-led or otherwise appears to have no significant effect on
whether the team enhances or diminishes employee discretion. These findings imply
that, while the critical accounts of teamwork’s effect on employees find support for
about half of employees, there is a need to distinguish between team types in order
to capture heterogeneity in their effects on work organisation.
Also expected to have a positive association with individual discretion is where the
firm introduces various flexible hours policies. One can sometimes distinguish
23

between whether the policy is there to serve the flexibility needs of the employee
(e.g. “flexitime”) and whether its function is mainly to provide flexibility for the
employer (e.g. zero hours working). I expected the former to be associated with
higher perceived discretion. The data allow us to identify whether each flexible
working time arrangement is applied to some workers in the establishment, and not
whether any given employee can access that arrangement. Nevertheless, it might be
presumed that in many establishments the policies are generalised to all or most
workers.
The pattern of coefficient estimates implies that task discretion for employees is
raised where there is a “flexitime” policy in place (no set starting and finishing times,
though set overall hours). This finding is as expected, and serves if nothing else to
confirm the reliability of workers’ perceptions of discretion. Conversely, discretion is
lowered in establishments where there are flexible shifts; and the coefficient
estimates for a zero hours policy and for annualised work hours are negative though
insignificant. These types of flexibility policies help employers to call on workers to
work when employers want them to.
Also on the negative side as expected is where establishments have direct systems
of quality monitoring. Managers were asked how they monitored the performance of
employees, and allowed to state as many methods as they used, including direct
supervisor/manager monitoring, monitoring by a separate inspectors, self-monitoring,
records of faults and complaints, customer surveys, and other unspecified methods.
Most establishments (82%) use managers and supervisors to directly monitor
quality, and this form of monitoring carries a negative coefficient. However, with a p-
value of 0.16 the coefficient is not quite significant at conventional levels. The
impacts on discretion of other forms of monitoring were negligible.
A further set of establishment characteristics concerns the use of targets. It was
hypothesised by Gallie et al. (2004) that the growing use of targets to control
production may have been one of the causes of the observed reductions in
employee discretion during the 1990s. The idea is that where targets are in force line
managers might need to control work more closely to achieve them, but it is also
possible that some targets could be imposed for employees precisely in situations
24

where monitoring is costly. Responding managers were asked to state whether they
had to meet any targets over a range of input and performance variables (profits,
labour costs, sales, absenteeism and so on). A dummy variable was constructed to
indicate whether or not any targets were used in the establishment. Only 12% of
employees worked in establishments with no targets. While the point estimate on the
dummy variable for “No Targets” is positive it is not statistically significant. This
finding suggests that a rising use of targets is unlikely to have been a major
explanation for declining discretion during the 1990s, though it is conceivable the
explanation would be more relevant in the public sector.
Person-level and establishment-level controls were also added, to account for
otherwise unspecified factors. that might influence job design. It is found that
discretion is greater for older workers, and for non-whites. Discretion is set
significantly lower for trade union members, a finding which has a straightforward
interpretation. If employers fear that trade union members are more likely to behave
in their own interests or those of the union, rather than the employer, they are likely
to design jobs that afford workers less control over their actions.
While the estimates given in columns (1) and (2) have included standard errors
adjusted for clustering within establishments, they do not allow for the possible
unobserved effects of establishment characteristics on individual job design, some of
which might be correlated with individual characteristics and hence generating
biased estimates. By definition these establishment-specific characteristics are
unobserved, but I take them to include both the effects of management culture and
the particular production function of the establishment, both of which might be
correlated with variables that are observed. The estimation shown in column (3)
seeks to address this possibility. It shows the establishment fixed-effects estimates.
As can be seen, there is little change from the magnitude of the coefficients given in
columns (1) and (2), which implies that any unobserved fixed effects are largely
orthogonal to the individual observed effects. Nevertheless, it is also the case that
the R2 value is raised quite substantially from 0.18 to 0.32, suggesting that a notable
amount of the variance of discretion can be accounted for by between-establishment
variance. The test of the null hypothesis that the additions of establishment fixed
25
effects does not account for additional variance is rejected at the level p=0.000, with
F-statistic 1.882, critical value 1.000.
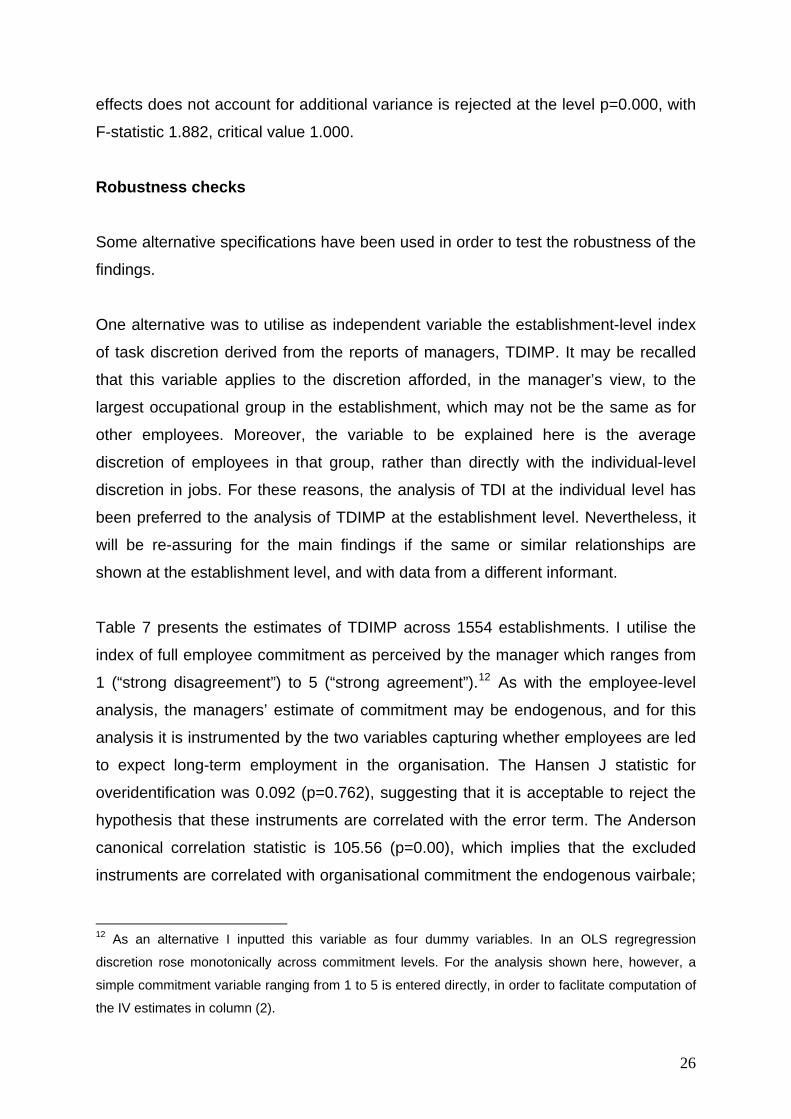
Robustness checks Some alternative specifications have been used in order to test the robustness of the
findings.
One alternative was to utilise as independent variable the establishment-level index
of task discretion derived from the reports of managers, TDIMP. It may be recalled
that this variable applies to the discretion afforded, in the manager’s view, to the
largest occupational group in the establishment, which may not be the same as for
other employees. Moreover, the variable to be explained here is the average
discretion of employees in that group, rather than directly with the individual-level
discretion in jobs. For these reasons, the analysis of TDI at the individual level has
been preferred to the analysis of TDIMP at the establishment level. Nevertheless, it
will be re-assuring for the main findings if the same or similar relationships are
shown at the establishment level, and with data from a different informant.
Table 7 presents the estimates of TDIMP across 1554 establishments. I utilise the
index of full employee commitment as perceived by the manager which ranges from
1 (“strong disagreement”) to 5 (“strong agreement”).12 As with the employee-level
analysis, the managers’ estimate of commitment may be endogenous, and for this
analysis it is instrumented by the two variables capturing whether employees are led
to expect long-term employment in the organisation. The Hansen J statistic for
overidentification was 0.092 (p=0.762), suggesting that it is acceptable to reject the
hypothesis that these instruments are correlated with the error term. The Anderson
canonical correlation statistic is 105.56 (p=0.00), which implies that the excluded
instruments are correlated with organisational commitment the endogenous vairbale;
12 As an alternative I inputted this variable as four dummy variables. In an OLS regregression
discretion rose monotonically across commitment levels. For the analysis shown here, however, a
simple commitment variable ranging from 1 to 5 is entered directly, in order to faclitate computation of
the IV estimates in column (2).
26

in other words, the equation is identified. Finally, the Cragg-Donald F-statistic was
53.6 which implies that the instruments are not weak.
Table 7 shows that discretion is enhanced in establishments with home working
arrangements, and rises with the proportion of employees working at home. The
index of team use is negatively associated with employee discretion (consistent with
Table 6) but in establishments where teams are explicitly said to allow for teams to
jointly decide how work is to be done the teams are positively associated with
individual discretion as perceived managers: the coefficient for this group is
calculated as 0.426-0.106 = 0.320, which is also found to be statistically different
from zero (p=0.007). In contrast to Table 6, then, this finding implies that there are
some establishments (roughly half) where teams positively enhance discretion, in
line with the story told by the more optimistic perspective on teamworking. The
difference between this finding and the neutral finding using the individual-level data
may be due either to the differing level of analysis or to the differing informants about
discretion.13
Another distinctive finding from this establishment-level analysis is evidence that
employees in establishments with no targets are here estimated to have substantially
greater discretion than those in establishments where one or more targets are set.
The difference is estimated as 0.172 in the IV estimates, which amounts to just
under a quarter of one standard deviation in TDIMP. This finding contrasts with that
for the individual-level analysis which found only a small and insignificant effect.
While one cannot be confident about the reasons for this difference in findings, one
possibility is that managers in establishments that set targets feel at the same time
that they are limiting employees’ discretion, even if the employees do not experience
it as any more restrictive than a no-target regime, (and indeed the employees need
not be aware of the targets).
13 It is possible that managers who report that teams allow workers to jointly decide about work tasks
may have an upward biased view of the amount of individual discretion that workers have, or that they
might conflate individual and team discretion.
27

Turning again to the central hypothesis of this paper, this establishment-level
analysis confirms that there is a strong association of organisational commitment
with employee discretion. The IV estimate implies that moving from a state where
employee commitment is neither agreed nor disagreed with (16% of establishments),
to a state where the manager strongly agrees that the employees are fully committed
(19% of establishments), is associated with a rise in TDIMP by 0.520, which is 72%
of the latter’s standard deviation across establishments, and more than the average
difference in discretion associated with moving from an elementary occupation to a
professional occupation. The link with skill is also confirmed to be broadly positive,
as implied in the occupational rankings (though with this establishment-level analysis
there are no finer disaggregations of occupation than the 1-digit level).
Two further robustness checks were carried out. First, as an alternative to
occupation as a measure of skill, in the individual-level analysis I entered the
employees’ achieved qualification level. This analysis showed that, after conditioning
on all the other variables included hitherto in the analysis, the level of discretion
increases between qualification levels 4 and 5 (as with the raw data shown in Table
2); however, discretion is also higher at levels 0 and 1 than it is at levels 2, 3 and 4.
This finding re-affirms what the earlier analysis has shown, that the relationship
between discretion and skill (here loosely measured by the job-holder’s education
level) is not necessarily unambiguously positive as is often assumed. However, the
analysis also showed that the pattern of other findings was not substantially altered
by the inclusion of education rather than occupation in the analysis.
Second, in a further estimation the analysis was restricted to the employees who
belonged to the largest occupational group (LOG) in the establishment. This sample
restriction has the advantage that variables that were intended to apply to the LOG
would be in principle more accurately measured; the disadvantage is that the sample
size falls by more than half to 5,559. However, it is re-assuring to confirm that the
pattern of findings remains largely unchanged from those obtained with the full
sample of 11,845 employees. The central finding of a substantial impact of
commitment on discretion is again found, with a coefficient of 0.243 (0.014), which is
not much different from the coefficient estimates shown in Table 6. The other
conditioning variables follow the same pattern, but with one exception. For this
28

restricted sample, consistent with expectations the presence of a Just-In_Time
production system is negatively associated with discretion, and unlike for the full
sample this coefficient is statistically significant at the 10% level. The estimated
coefficient is -0.059 (0.031).14
5 Conclusion
This paper proposes the importance for labour economics to achieve a greater
understanding of autonomy in the workplace, and has developed an analysis of the
factors underlying task discretion. I argue that the key axis for understanding
discretion is the fundamental post-Fordist trade-off between the positive effects of
discretion on potential output per employee and the negative effects of greater
leeway on work effort. This contrasts with the more commonly posed trade-off (in
efficiency-wage theory) for employers, between the benefits of greater work effort
from close control and the increasing monitoring costs. The post-Fordist trade-off
leads to the hypothesis that the design of discretion into jobs is highly dependent on
workers’ preferences for supplying effort to the employer.
Using data from the Workplace Employee Relations Survey 2004, the paper finds
that, as expected, task discretion is strongly associated with affective organisational
commitment. The loyal workers are the ones with greater autonomy at work.
The paper also confirms that task discretion is associated with job skill. It finds that
discretion is lower, as expected, in the less skilled jobs. Managerial and professional
jobs have above-average discretion. However, there are some notable exceptions.
There are quite high-skilled jobs that do not have high levels of discretion, and some
low-skilled jobs where there appears to be some considerable autonomy. The formal
model has suggested an explanation for this ambiguity, namely that in some high-
skilled jobs the costs of lower effort may be high, and if in these jobs the benefits of
14 These latter alternative specifications are not reproduced in full here, to save space, but are
available on request to the author.
29

discretion are perceived to be limited employers may opt to design jobs with little
discretion. This is not, of course, the only possible explanation for exceptions to the
traditional association between discretion and skill. An alternative explanation is that
some traditionally-termed low-skilled jobs, which may require few or no
qualifications, may nevertheless entail largely non-routine activities: in such cases it
can be difficult for employers to closely specify work tasks. The paper has also
shown that it is important for the skills of the employee and the job to be well-
matched. Under-skilled workers, especially, need more supervision and report lower
levels of discretion.
Certain forms of work organisation have been shown to be associated significantly
with discretion. Most notably, and unsurprisingly, homeworking is found to permit
high levels of autonomy. Of especial interest is the impact of teamworking. It is
shown that, contrary to the earlier work of Harley (2001), teamworking has a
differentiated effect on task discretion. For just under half (47%) of the employees
who work in establishments where teams are prevalent, managers indicate that the
teams are not permitted to jointly decide how work is done. In those cases teams are
associated with a reduction in individual task discretion, consistent with the negative
perspective on teams advanced by some recent critical accounts. In the remaining
establishments, where managers see teams as having some leeway, employees
have neither high nor low levels of self-perceived discretion; however, in the
managers’ own perceptions, employees have higher levels of individual discretion
than where there are either teams that do not have joint decision-making powers or
where there are no teams at all.
Companies’ policies on flexible working also have an impact on workers’ task
discretion, but the direction of the impact depends on the form of flexibility, thus
demonstrating the need for care when discussing flexibility as a strategy. Where
flexibility is introduced as something to benefit employees (as with home-working or
flexitime schemes) it has, as expected, a positive effect on discretion. Where the
policies are to suit the employers’ needs (e.g. annualised hours contracts) this tends
to reduce discretion.
30

Other findings suggest that it is unlikely that the increased use of target-setting could
account for the decline of discretion observed in the 1990s. Although the absence of
targets is significantly associated (in the establishment level analysis) with greater
task discretion for workers, the magnitude of the coefficient is fairly small. A further
finding is that, at least in two domains, task discretion has remained fairly stable in
British workplaces between 1998 and 2004. This finding of stability is consistent with
recent findings from alternative individual-level survey data that task discretion
remained unchanged between 2001 and 2006 (Felstead et al., 2007).
It will be important in future work to further our understanding of autonomy in the
workplace, if only because of its large impact on employee well-being especially in
effort-intensive jobs. Moreover, following on from the finding of a large and significant
role for commitment in affecting the design of autonomy into jobs three further lines
of enquiry suggest themselves. First, if worker autonomy is assumed to be so
efficient in a flexible-specialisation productive environment, one can see more clearly
the rationale behind high-commitment strategies being deployed in many modern
workplaces. The question which remains is to what extent such high-commitment
policies are successful in generating commitment, and in what circumstances (Wood
and Albanese, 1995). Along parallel lines, Akerlof and Kranton (2005) summarise
findings on organisational behaviour from sociology in order to criticise the exclusive
focus of economics on monetary incentives; they advocate a research programme
for economists to elaborate the implications of identity-creating investments by firms
(for example, Green, 2000). Such a programme needs to recognise, however, that
investing in changing people’s preferences is not without limitations and
contradictions, as is recognised in both sociological and management literatures
(e.g. Argyris, 1998). and may involve unresolved normative dilemmas. Second, the
analysis here suggests that the relationship between organisational commitment and
worker well-being is mediated strongly by autonomy, and without this link it may be
questioned whether commitment should be seen as a positive element in worker
well-being. Third, following on from that, it is possible that the combination of
autonomy and commitment is, from the perspective of workers a mixed blessing.
Commitment, and its close relative workplace trust, can be misplaced if employers
are not seen to reciprocate the exchange that comes from workers identifying with
their employers’ beliefs. Moreover, both discretion and commitment are predicted by
31

competitive theory to have an impact on pay, since they can be regarded as
capturing important compensating differentials. The consequences for pay,
therefore, of high levels of commitment and autonomy deserve further empirical
investigation.
Table 6 Determinants of Employee Task Discretion (1) (2) (3) OLS IV Estab. FE Organisational commitment 0.226 0.219 0.224
(0.010)** (0.082)** (0.009)**
OCCUPATION, Ref: Sci&Tech Profs
Health Professionals -0.419 -0.422 -0.439
(0.251)+ (0.249)+ (0.146)**
Teaching & Research Professionals 0.043 0.045 0.011
(0.069) (0.073) (0.073)
Business & Public Service Profs -0.041 -0.039 0.073
(0.051) (0.055) (0.056)
Sci & Tech Associate Professionals -0.143 -0.143 -0.138
(0.058)* (0.058)* (0.053)**
Health & Soc. Welfare Ass. Profs 0.040 0.042 -0.053
(0.057) (0.061) (0.063)
Protective Service Occupations -0.088 -0.086 -0.195
(0.286) (0.288) (0.284)
Culture/Media/Sports Occupations 0.003 0.004 0.041
(0.054) (0.057) (0.072)
Business/Public Service Ass. Profs 0.067 0.068 0.115
(0.040)+ (0.043) (0.042)**
Administrative Occupations -0.082 -0.082 -0.045
(0.038)* (0.039)* (0.040)
Secretarial and Related -0.175 -0.173 -0.129
(0.053)** (0.058)** (0.051)*
Skilled Agricultural Trades -0.049 -0.048 -0.202
(0.099) (0.101) (0.143)
Skilled Metal & Electrical Trades -0.040 -0.040 -0.031
(0.047) (0.046) (0.047)
Skilled Construction & Building 0.051 0.052 -0.023
(0.056) (0.057) (0.073)
32

Textiles/Printing/Other Skilled 0.071 0.070 -0.009
(0.059) (0.059) (0.062)
Caring Personal Service -0.192 -0.190 -0.302
(0.059)** (0.065)** (0.065)**
Leisure/Other Personal Service -0.213 -0.210 -0.020
(0.073)** (0.080)** (0.072)
Sales -0.143 -0.142 -0.126
(0.044)** (0.045)** (0.049)*
Customer Service -0.360 -0.361 -0.252
(0.068)** (0.068)** (0.055)**
Process, Plant & Machine Operatives -0.166 -0.167 -0.136
(0.046)** (0.046)** (0.046)**
Transport Operatives -0.150 -0.149 -0.127
(0.056)** (0.056)** (0.055)*
Elementary Trade/Plant/Storage -0.071 -0.071 -0.052
(0.054) (0.054) (0.050)
Elementary Administrative/Service -0.037 -0.036 -0.107
(0.047) (0.048) (0.049)*
Supervisor 0.254 0.256 0.254
(0.017)** (0.022)** (0.016)**
Underskilled -0.172 -0.174 -0.162
(0.041)** (0.049)** (0.031)**
Overskilled -0.015 -0.016 -0.019
(0.015) (0.022) (0.014)
Technology and work organisation variables:
Number of uses of computer in job 0.029 0.029 0.033
(0.004)** (0.004)** (0.003)**
'Just-In-Time' Production -0.017 -0.017
(0.021) (0.021)
Proportion working at home 0.175 0.178
(0.103)+ (0.108)+
Index of team use in largest -0.066 -0.065
occupational group (0.028)* (0.028)*
Index of self-led team in largest 0.025 0.025
occupational group (0.052) (0.052)
Index of team discretion in 0.062 0.063
largest occupational group (0.023)** (0.023)**
33

Flexible Working Time Arrangements
Flexitime 0.079 0.079
(0.020)** (0.020)**
Flexible shifts -0.033 -0.033
(0.019)+ (0.019)+
Compressed-hours working -0.001 -0.001
(0.026) (0.026)
Annualised hours job -0.043 -0.043
(0.029) (0.029)
Zero hours work -0.039 -0.040
(0.040) (0.040)
Quality Monitoring Arrangements
Monitoring by Manager/Supervisor -0.041 -0.042
(0.026) (0.027)
Monitoring by Inspector(s) -0.002 -0.002
(0.020) (0.020)
Monitoring by Records of Faults -0.018 -0.018
(0.021) (0.021)
Monitoring by Customer Surveys -0.008 -0.007
(0.020) (0.021)
No Targets 0.023 0.023
(0.029) (0.029)
25 or more employees -0.000 -0.001
(0.023) (0.025)
Trade Union Member -0.090 -0.091 -0.047
(0.022)** (0.024)** (0.021)*
Age 0.018 0.018 0.015
(0.004)** (0.005)** (0.004)**
Age Squared -0.000 -0.000 -0.000
(0.000)** (0.000)** (0.000)**
Male -0.018 -0.019 -0.029
(0.019) (0.020) (0.017)+
White -0.080 -0.081 -0.075
(0.038)* (0.040)* (0.030)*
Constant 1.818 1.847 1.808
(0.115)** (0.342)** (0.090)**
Observations 11845 11845 11845
34

Mean (sd) of dependent variable 2.928
(0.752)
2.928
(0.752)
2.928
(0.752)
R2 0.18 0.32
Robust standard errors in parentheses; + significant at 10%; * significant at 5%; ** significant
at 1%. For columns (1) and (2) standard errors are also robust to clustering within
establishment. Weighted estimates. The sample is all non-managerial employees in the
private sector. Column 3 controls for 1200 establishment fixed effects.
35

Table 7 Determinants of Managers’ Estimates of Employee Task Discretion (1) (2)
OLS IV
Employee Commitment (Managers’ perception) 0.117 0.260
(0.037)** (0.124)*
OCCUPATION, Ref: Professional Occupations
Associate Professionals 0.088 0.094
(0.102) (0.103)
Administrative & Secretarial -0.031 -0.022
(0.110) (0.109)
Skilled Trades 0.029 0.054
(0.111) (0.109)
Personal Service -0.142 -0.150
(0.126) (0.124)
Sales -0.173 -0.141
(0.111) (0.111)
Plant & Machine Operatives -0.285 -0.243
(0.108)** (0.112)*
Elementary -0.488 -0.465
(0.112)** (0.110)**
Technology and work organisation variables:
'Just-In-Time' Production 0.026 0.040
(0.063) (0.065)
Arrangement to work from home in normal hours 0.246 0.231
(0.066)** (0.067)**
Proportion working at home (almost) always 0.599 0.484
(0.292)* (0.319)
Index of team use in largest -0.227 -0.225
occupational group
(0.082)** (0.084)**
Index of self-led team in largest 0.116 0.106
occupational group (0.137) (0.133)
36

Index of team discretion in 0.450 0.426
largest occupational group (0.081)** (0.084)**
Flexible Working Time Arrangements
Flexitime 0.038 0.031
(0.055) (0.056)
Flexible shifts -0.118 -0.091
(0.063)+ (0.067)
Compressed-hours working 0.040 0.021
(0.081) (0.082)
Annualised hours job -0.041 -0.082
(0.092) (0.101)
Zero hours work -0.001 0.018
(0.090) (0.096)
37

Quality Monitoring Arrangements
Monitoring by Manager/Supervisor -0.075 -0.081
(0.072) (0.071)
Monitoring by Inspector(s) -0.019 -0.014
(0.064) (0.064)
Monitoring by Records of Faults -0.105 -0.091
(0.064) (0.068)
Monitoring by Customer Surveys 0.028 0.023
(0.065) (0.066)
No targets 0.156 0.172
(0.073)* (0.074)*
25 or more employees -0.096 -0.077
(0.050)+ (0.056)
Percent union members in establishment -0.00124 -0.00102
(0.00113) (0.00119)
Constant 2.630 2.042
(0.193)** (0.520)**
Observations 1554 1554
Mean (sd) of dependent variable 2.894
(0.720)
2.894
(0.720)
R2 0.25
Robust standard errors in parentheses; + significant at 10%; * significant at 5%; ** significant
at 1%. The dependent variable is the index of managers’ estimate of individual employee
task discretion in largest occupational group. Weighted estimates.
38
References Aghion, P. and J. Tirole (1997). "Formal and Real Authority in Organizations."
Journal of Political Economy 105 (1): 1-29.
Akerlof, G. A. and R. E. Kranton (2005). "Identity and the economics of
organizations." Journal of Economic Perspectives 19 (1): 9-32.
Allen, N. J. and J. P. Meyer (1990). "The measurement and antecedents of affective,
continuance and normative commitment to the organization." Journal of
Occupational Psychology 63: 1-18.
Argyris, C. (1998). "Empowerment: The Emperor's New Clothes." Harvard Business
Review (May-June): 98-105.
Athey, S. and Roberts, J. (2001) Organizational Design: Decision Rights and
Incentive Contracts. American Economic Review, 91, 2, 200-205.
Braverman, H. (1974). Labor and monopoly capital. New York, Monthly Review
Press.
Clinton, M., P. Totterdell and S. Wood (2006). "A Grounded Theory of Portfolio
working." International Small Businness Journal 24 (2): 179-203.
Cohen, A. and U. E. Gattiker (1994). "Rewards and organizational commitment
across structural characteristics -- a meta-analysis." Journal of Business
Psychology 9 (2): 137-157.
Cooper, R. (1973). "How jobs motivate." Personnel Review 2 (2): 4-12.
Davis, L. E. (1966). "The Design of Jobs." Industrial Relations 6: 21-45.
Department of Trade and Industry. Employment Markets Analysis and Research et
al., Workplace Employee Relations Survey, 2004; Cross-section Survey, 2004 and
Panel Survey, 1998-2004: Wave 2 [computer file]. Colchester, Essex: UK Data
Archive [distributor], December 2005. SN: 5294.
Dessein, W. (2002). "Authority and Communication in Organizations." Review of
Economic Studies 69: 811-838.
European Foundation for the Improvement of Living and Working Conditions (2007).
Fourth European Working Conditions Survey. Luxembourg, Office for Official
Publications of the European Communities.
Felstead, A., D. Gallie and F. Green (2002). Work Skills In Britain 1986-2001.
Nottingham, DfES Publications.
39

Felstead, A., N. Jewson and S. Walters (2003). "Managerial control of employees
working at home." British Journal of Industrial Relations 41 (2): 241-264.
Felstead, A., D. Gallie, F. Green and Y. Zhou (2007). Skills At Work, 1986 to 2006.
University of Oxford, SKOPE.
Gallie, D., A. Felstead and F. Green (2001). "Employer Policies and Organisational
Commitment in Britain 1992-7." Journal of Management Studies 38 (8): 1081-1102.
Gallie, D., A. Felstead and F. Green (2004). "Changing Patterns of Task Discretion in
Britain." Work, Employment and Society 18 (2): 243-266.
Green, F. (2000). "The impact of company human resource policies on social skills:
Implications for training sponsorship, quit rates and efficiency wages." Scottish
Journal of Political Economy 47 (3): 251-272.
Green, F. and N. Tsitsianis (2005). "An Investigation of National Trends in Job
Satisfaction in Britain and Germany." British Journal of Industrial Relations 43 (3):
401-430.
Guy, F. and P. Skott (2005). Power-Biased Technological Change and the Rise in
Earnings Inequality, University of Massachusetts, mimeo.
Harley, B. (2001). "Team Membership and the Experience of Work in Britain: an
Analysis of the WERS98 Data." Work, Employment and Society 15 (4): 721-742.
Karasek, R.A. (1979) “Job demands, job decision latitude, and mental strain:
Implications for job redesign.” Administrative Science Quarterly, 24, 285-308.
Lehto, A.-M. and H. Sutela (1999). Efficient, More Efficient, Exhausted. Helsinki,
Statistics Finland.
Lehto, A.-M. and H. Sutela (2005). Threats and Opportunites. Findings of Finnish
Quality of Work Life Surveys 1977-2003. Helsinki, Statistics Finland.
Leiulfsrud, H. and O. Dahl (2005). "Democratization of work? Power, hierarchy and
work autonomy in Norway, 1982-1999." Tidsskrift For Samfunnforskning 46 (2):
159-186.
Lincoln, J. R. and A. L. Kalleberg (1990). Culture, Control and Commitment.
Cambridge, Cambridge University Press.
Mathieu, J. E. and D. M. Zajac (1990). "A review and meta-analysis of the
antecedents, correlates and consequences of organizational commitment."
Psychological Bulletin 80 (2): 171-194.
Meyer, J., D. Stanley, L. Herscovitch and L. Topolnytsky (2002). "Affective,
continuance, and normative commitment to the organization: A meta-analysis of
40

antecedents, correlates, and consequences." Journal of Vocational Behavior 61
(1): 20-52.
Millward, N., A. Bryson and J. Forth (2000). All Change At Work? London,
Routledge.
Mowday, R.T., Steers, R.M. and Porter, L.W. (1979) The measurement of
organizational commitment. Journal of Vocational Behavious 14, 224-247.
Mowday, R.T., Porter, L.W. & Steers, R.M. (1982). Employee-organization linkages:
The psychology of commitment, absenteeism, and turnover. New York: Academic
Press.
Murray, M. P. (2006). "Avoiding Invalid Instruments and Coping with Weak
Instruments." Journal of Economic Perspectives 20 (4): 111-132.
Peters, T. (1992) Liberation Management. London: Macmillan.
Spenner, K. I. (1990). "Skill. Meanings, Methods and Measures." Work And
Occupations 17 (4): 399-421.
Taylor, M. P. (1996). "Earnings, independence or unemployment: Why become self-
employed?"" Oxford Bulletin of Economics and Statistics 58 (2): 253-266.
Theorell, T. (2004). "Democracy at Work and its Relationship to Health". Emotional
and Physiological Processes and Positive Intervention Strategies, edited by P. L.
Perrewé and D. C. Ganster. Amsterdam, Elsevier.
Vogel, J. and T. Theorell (2006). "Social Welfare Models, Labor Markets, and Health
Outcomes". Healthier Societies. From Analysis to Action., edited by J. Heymann,
C. Hertzman, M. L. Barer and R. G. Evans. Oxford, Oxford University Press.
Walton, R. E. (1985) 'From control to commitment in the workplace', Harvard
Business Review, 85, 2: 77-84.
Wood, S. and M. T. Albanese (1995). "Can we speak of a high commitment
management on the shop floor?" Journal of Management Studies 32 (2): 215-247.
41

Appendix A Independent Variables: Descriptive Statistics
Variable Notes Weighted
Mean
(11,845
employees)
Weighted
Mean
(1554
establ-
ishments)
Organisational
Commitment
3-item average additive index – see
text
3.607 3.897
2-Digit SOC
22
Health Professionals 0.002
23 Teaching & Research Professionals 0.017
24 Business & Public Service Profs 0.032
31 Sci & Tech Associate Professionals 0.023
32 Health & Soc. Welfare Ass. Profs 0.025
33 Protective Service Occupations 0.001
34 Culture/Media/Sports Occupations 0.017
35 Business/Public Service Ass. Profs 0.085
41 Administrative Occupations 0.157
42 Secretarial and Related 0.046
51 Skilled Agricultural Trades 0.004
52 Skilled Metal & Electrical Trades 0.055
53 Skilled Construction & Building 0.019
54 Textiles/Printing/Other Skilled 0.022
61 Caring Personal Service 0.038
62 Leisure/Other Personal Service 0.018
71 Sales 0.102
72 Customer Service 0.039
42

81 Process, Plant & Machine
Operatives
0.069
82 Transport Operatives 0.049
91 Elementary Trade/Plant/Storage 0.047
92 Elementary Administrative/Service 0.090
Supervisor 0.270
Under-Skilled Skills “a bit lower” or “much lower”
than needed to do job 0.049
Over-skilled Skills “a bit higher” or “much higher” than needed to do job
0.547
Number of uses of computer in job
Up to twelve computer uses 2.937
'Just-In-Time' Production
0.342 0.240
Arrangement to work from home in normal hours
For some employees in establishment
0.222
Proportion working at home
0.019 0.019
Index of team use in LOG*.
Proportion of LOG working in teams 0.662 0.481
Self-led team use in LOG*.
Proportion in teams interacted with “team members are able to appoint their own team leaders
0.030 0.038
Index of team discretion in LOG*.
Proportion in teams interacted with dummy for “team members jointly decide how work is done”
0.322 0.296
Flexitime No set start or finish time but total hours set
0.391 0.333
Flexible shifts Ability to shift patterns 0.556
0.396
Compressed-hours working
e.g. 9-day fortnights 0.211 0.096
Annualised hours job Any annualised hours arrangements in workplace
0.112 0.026
Zero hours work Any zero hours arrangements in workplace
0.086 0.038
Monitoring by Manager/Supervisor
How work quality is monitored. 0.866 0.818
Monitoring by Inspector(s)
“ “ 0.397 0.229
Monitoring by Records of Faults
“ “ 0.634 0.424
Monitoring by Customer Surveys
“ “ 0.563 0.364
No Targets None of 11 possible targets 0.120 0.246
43
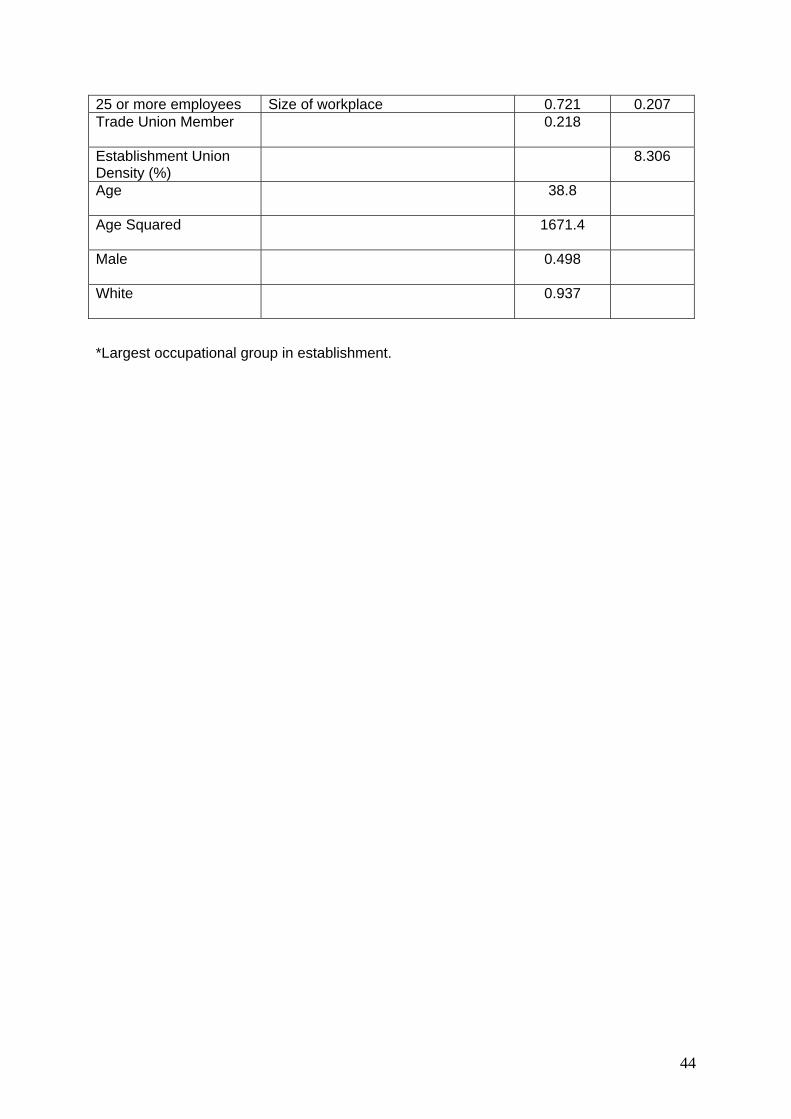
25 or more employees Size of workplace 0.721 0.207 Trade Union Member 0.218
Establishment Union Density (%)
8.306
Age 38.8
Age Squared 1671.4
Male 0.498
White 0.937
*Largest occupational group in establishment.
44