Lecture X.X1. 2 The informatics of SNPs and Haplotypes Gabor T. Marth Department of Biology, Boston...
38
Lecture X.X 1
-
date post
21-Dec-2015 -
Category
Documents
-
view
217 -
download
0
Transcript of Lecture X.X1. 2 The informatics of SNPs and Haplotypes Gabor T. Marth Department of Biology, Boston...

Lecture X.X 1

Lecture X.X 2
The informatics of SNPs and Haplotypes
Gabor T. Marth
Department of Biology, Boston [email protected]
Lecture X.X 3
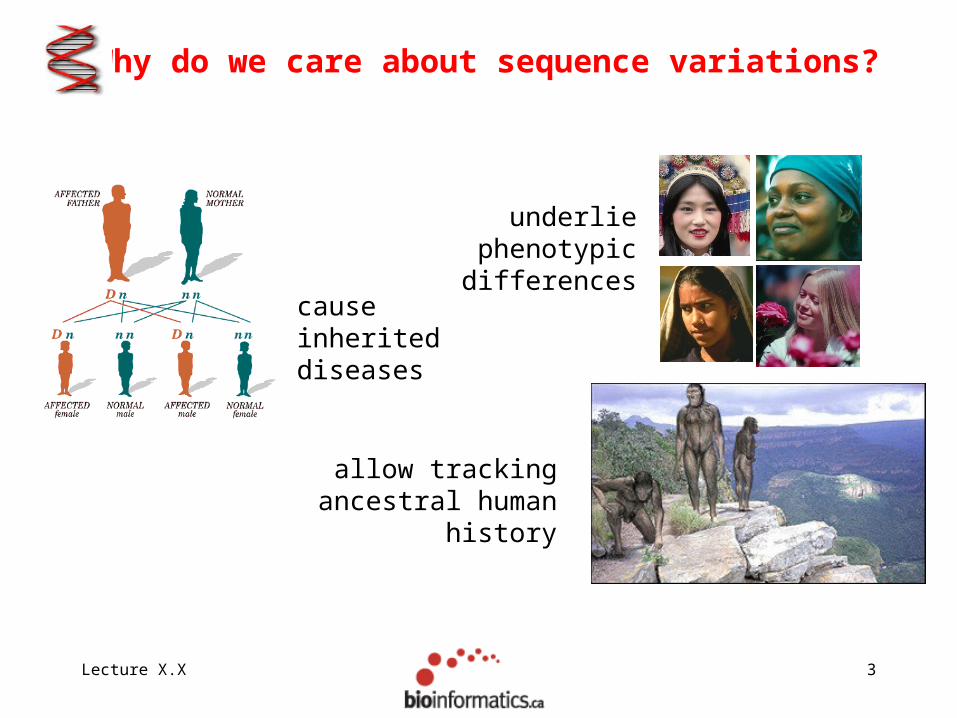
Why do we care about sequence variations?
underlie phenotypic differences
cause inherited diseases
allow tracking ancestral human history

Lecture X.X 4
How do we find sequence variations?
• look at multiple sequences from the same genome region
• use base quality values to decide if mismatches are true polymorphisms or sequencing errors

Lecture X.X 5
Automated polymorphism discovery
Siablevarall
]T,G,C,A[S ]T,G,C,A[SiiiorPr
iiorPr
i
iiorPr
i
NiorPrNiorPr
NN
iorPr
i Ni
N
N
N )S,...,S(P)S(P
)R|S(P...
)S(P
)R|S(P...
)S,...,S(P)S(P)R|S(P
...)S(P)R|S(P
)SNP(P
1
1
1
1 11
11
11
Marth et al. Nature Genetics 1999

Lecture X.X 6
Large SNP mining projects
Sachidanandam et al. Nature 2001
~ 8 million
EST
WGS
BAC
genome reference

Lecture X.X 7
How to use markers to find disease?
• problem: genotyping cost precludes using millions of markers simultaneously for an association study
genome-wide, dense SNP marker map
• depends on the patterns of allelic association in the human genome
• question: how to select from all available markers a subset that captures most mapping information (marker selection, marker prioritization)

Lecture X.X 8
Allelic association
• allelic association is the non-random assortment between alleles i.e. it measures how well knowledge of the allele state at one site permits prediction at another marker site functional site
• by necessity, the strength of allelic association is measured between markers
• significant allelic association between a marker and a functional site permits localization (mapping) even without having the functional site in our collection
• there are pair-wise and multi-locus measures of association

Lecture X.X 9
Linkage disequilibrium
• LD measures the deviation from random assortment of the alleles at a pair of polymorphic sites
D=f( ) – f( ) x f( )
• other measures of LD are derived from D, by e.g. normalizing according to allele frequencies (r2)
Lecture X.X 10
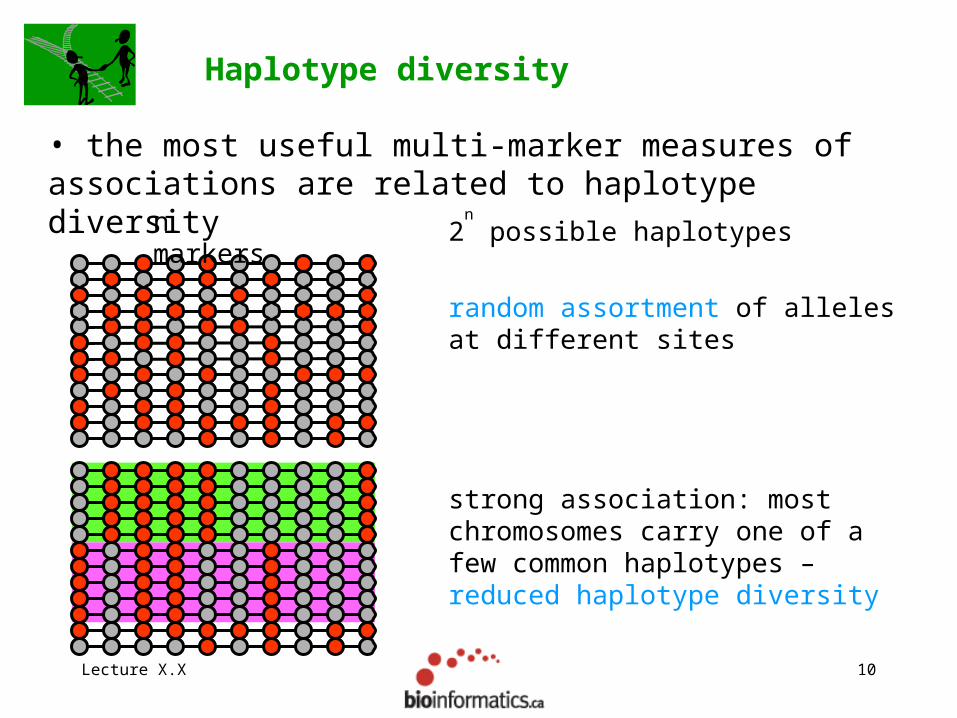
strong association: most chromosomes carry one of a few common haplotypes – reduced haplotype diversity
Haplotype diversity
• the most useful multi-marker measures of associations are related to haplotype diversity
2n possible haplotypesn
markers
random assortment of alleles at different sites

Lecture X.X 11
The determinants of allelic association
• recombination: breaks down allelic association by “randomizing” allele combinations
• demographic history of effective population size: bottlenecks increase allelic association by non-uniform re-sampling of allele combinations (haplotypes)
bottleneck

Lecture X.X 12
Strength of LD in the human genome
0
0.2
0.4
0.6
0.8
1.0E-06 3.0E-06 1.0E-05 3.0E-05 1.0E-04 3.0E-04 1.0E-03 3.0E-03 1.0E-02
Recombination Fraction
D2
Expansion
Bottleneck
• LD is stronger, extends longer than previously thought

Lecture X.X 13
Haplotype blocks
Daly et al. Nature Genetics 2001
• experimental evidence for reduced haplotype diversity (mainly in European samples)

Lecture X.X 14
The promise for medical genetics
CACTACCGACACGACTATTTGGCGTAT
• within blocks a small number of SNPs are sufficient to distinguish the few common haplotypes significant marker reduction is possible
• if the block structure is a general feature of human variation structure, whole-genome association studies will be possible at a reduced genotyping cost • this motivated the HapMap project
Gibbs et al. Nature 2003

Lecture X.X 15
The HapMap initiative
• goal: to map out human allele and association structure of at the kilobase scale
• deliverables: a set of physical and informational reagents

Lecture X.X 16
HapMap physical reagents
• reference samples: 4 world populations, ~100 independent chromosomes from each
• SNPs: computational candidates where both alleles were seen in multiple chromosomes
• genotypes: high-accuracy assays from various platforms; fast public data release
Lecture X.X 17
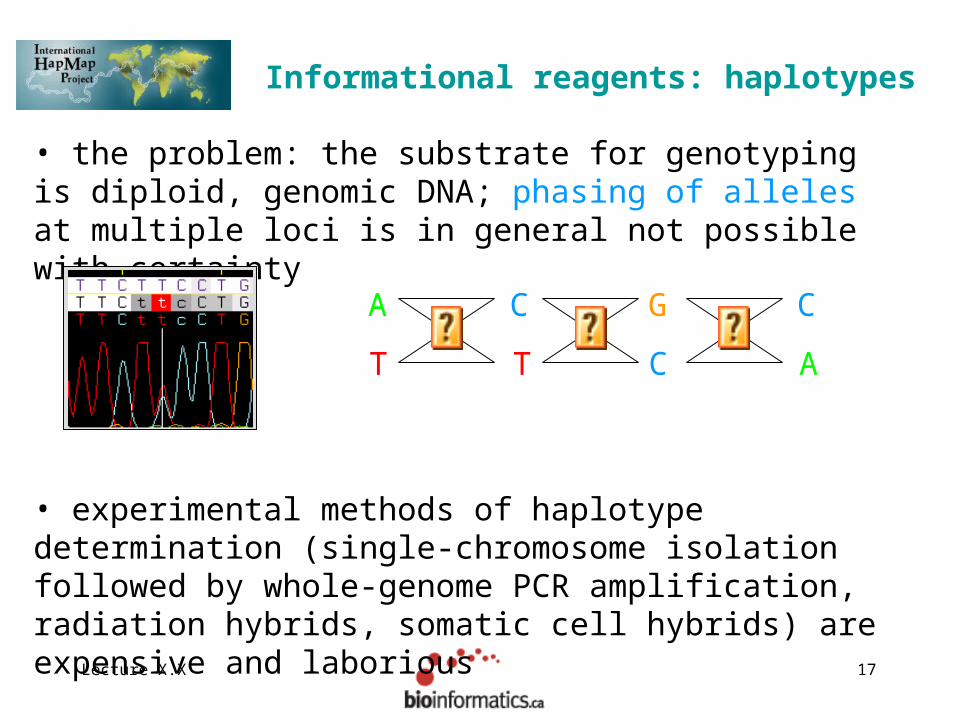
Informational reagents: haplotypes
• the problem: the substrate for genotyping is diploid, genomic DNA; phasing of alleles at multiple loci is in general not possible with certainty
• experimental methods of haplotype determination (single-chromosome isolation followed by whole-genome PCR amplification, radiation hybrids, somatic cell hybrids) are expensive and laborious
A
T
C
T
G
C
C
A

Lecture X.X 18
Computational haplotype inference
• Parsimony approach: minimize the number of different haplotypes that explains all diploid genotypes in the sampleClark
Mol Biol Evol 1990
• Maximum likelihood approach: estimate haplotype frequencies that are most likely to produce observed diploid genotypes Excoffier & Slatkin
Mol Biol Evol 1995
• Bayesian methods: estimate haplotypes based on the observed diploid genotypes and the a priori expectation of haplotype patterns informed by Population Genetics Stephens et al.
AJHG 2001

Lecture X.X 19
Haplotype inference
http://pga.gs.washington.edu/
Lecture X.X 20
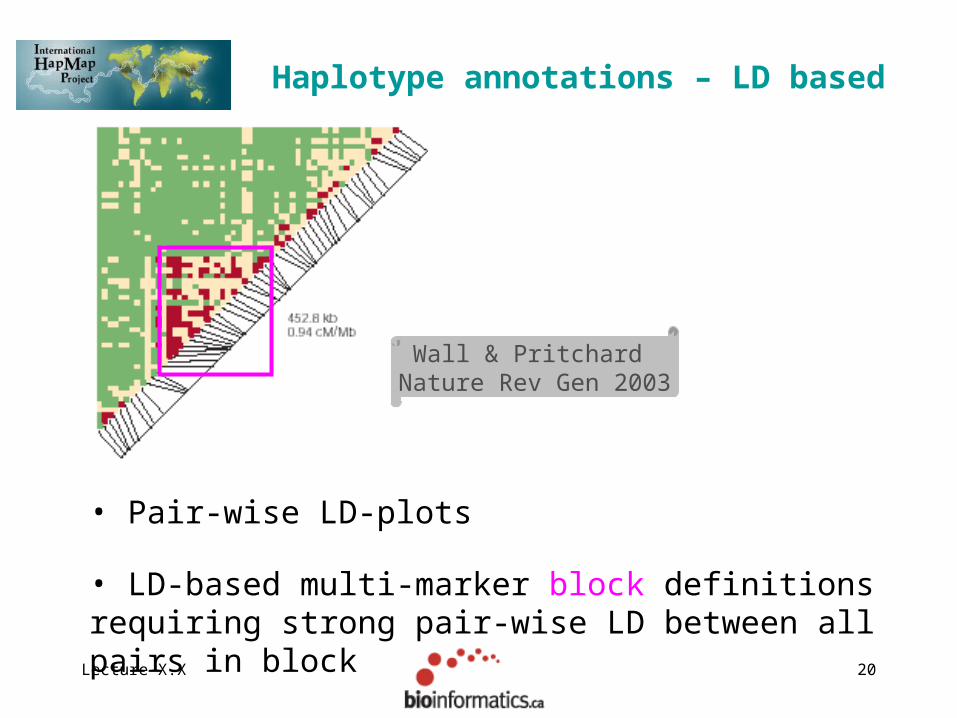
Haplotype annotations – LD based
• Pair-wise LD-plots
Wall & Pritchard Nature Rev Gen 2003
• LD-based multi-marker block definitions requiring strong pair-wise LD between all pairs in block
Lecture X.X 21
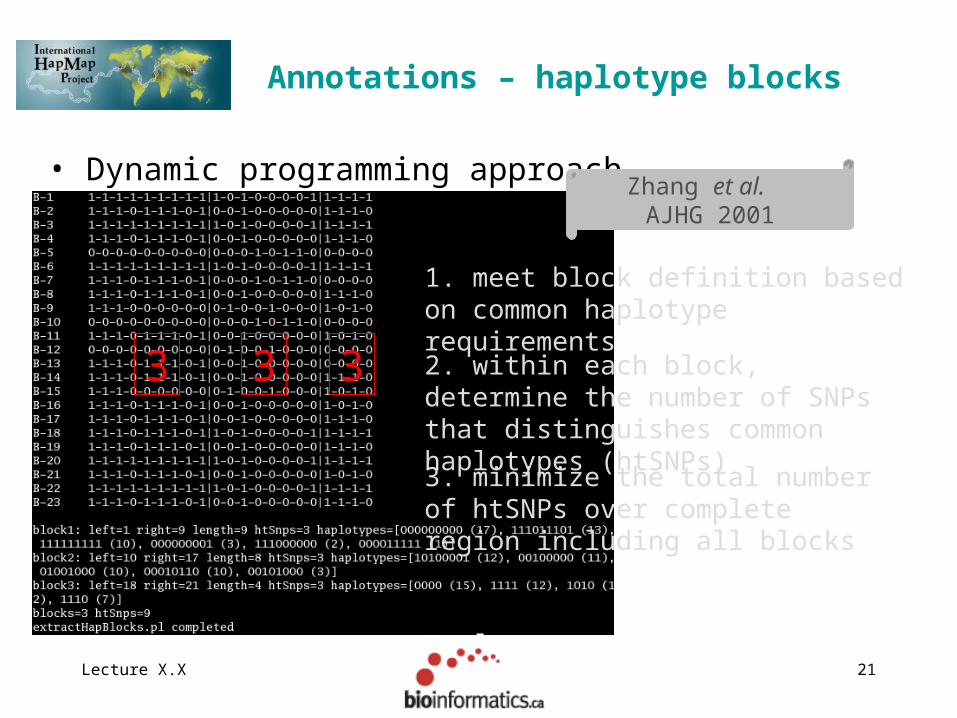
Annotations – haplotype blocks
• Dynamic programming approachZhang et al.
AJHG 2001
3 3 3
1. meet block definition based on common haplotype requirements
2. within each block, determine the number of SNPs that distinguishes common haplotypes (htSNPs)
3. minimize the total number of htSNPs over complete region including all blocks
Lecture X.X 22
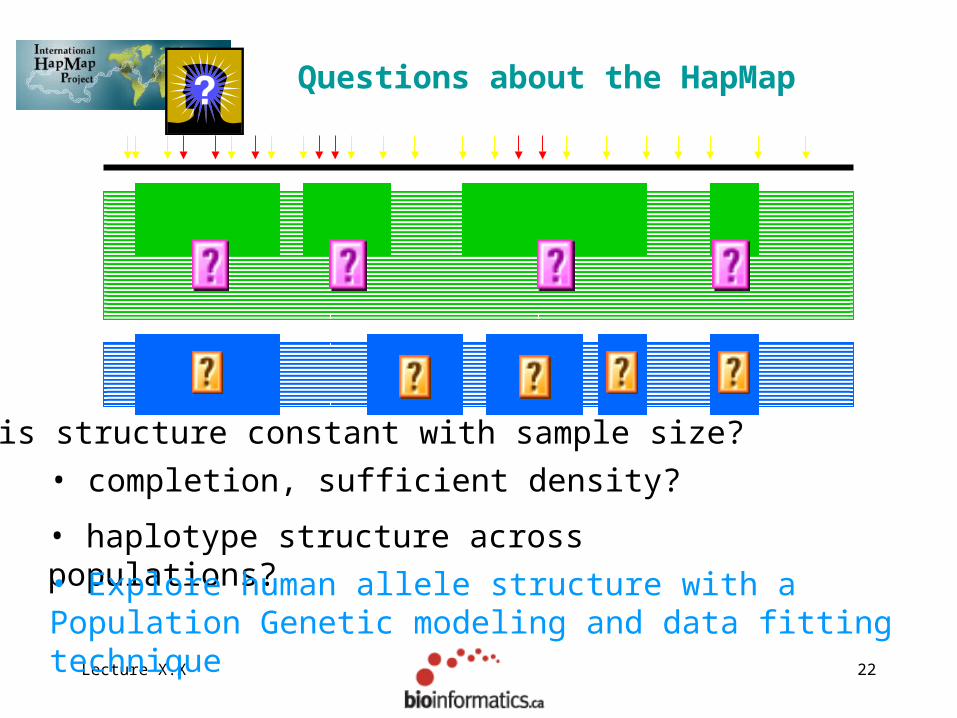
Questions about the HapMap
• completion, sufficient density?
• haplotype structure across populations?
• is structure constant with sample size?
• Explore human allele structure with a Population Genetic modeling and data fitting technique
Lecture X.X 23
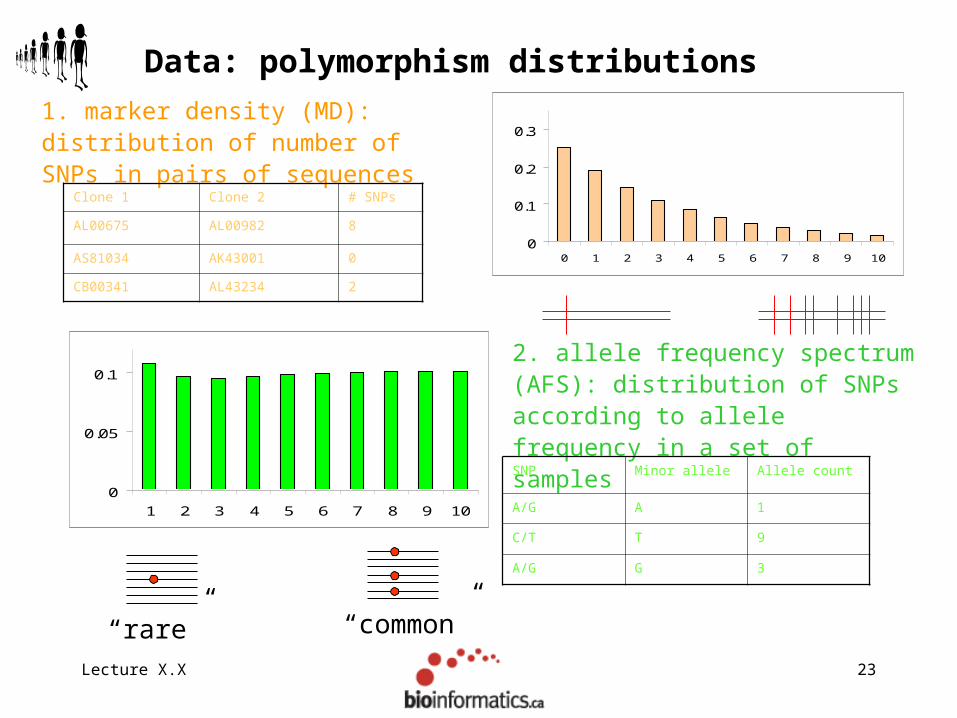
1. marker density (MD): distribution of number of SNPs in pairs of sequences
Data: polymorphism distributions
0
0.1
0.2
0.3
0 1 2 3 4 5 6 7 8 9 10
“rare” “common”
2. allele frequency spectrum (AFS): distribution of SNPs according to allele frequency in a set of samples
0
0.05
0.1
1 2 3 4 5 6 7 8 9 10
Clone 1 Clone 2 # SNPs
AL00675 AL00982 8
AS81034 AK43001 0
CB00341 AL43234 2
SNP Minor allele Allele count
A/G A 1
C/T T 9
A/G G 3

Lecture X.X 24
Model: processes that generate SNPs
k
ii
LLL
k
k
ii
LL
k
ii
LL
k
k
iiLL
k
i
ii
i
eL
L
L
eeL
L
L
eL
L
LkP
1!
111
3
3
3
1!
11
1!
11
2
2
2
1!
11
1
1
1
23
21
3
12
2211
212
12
221
2
12
11
1111
111
1
1111
1
1111
1
computable formulations
simulation procedures
3/5 1/5 2/5
Lecture X.X 25
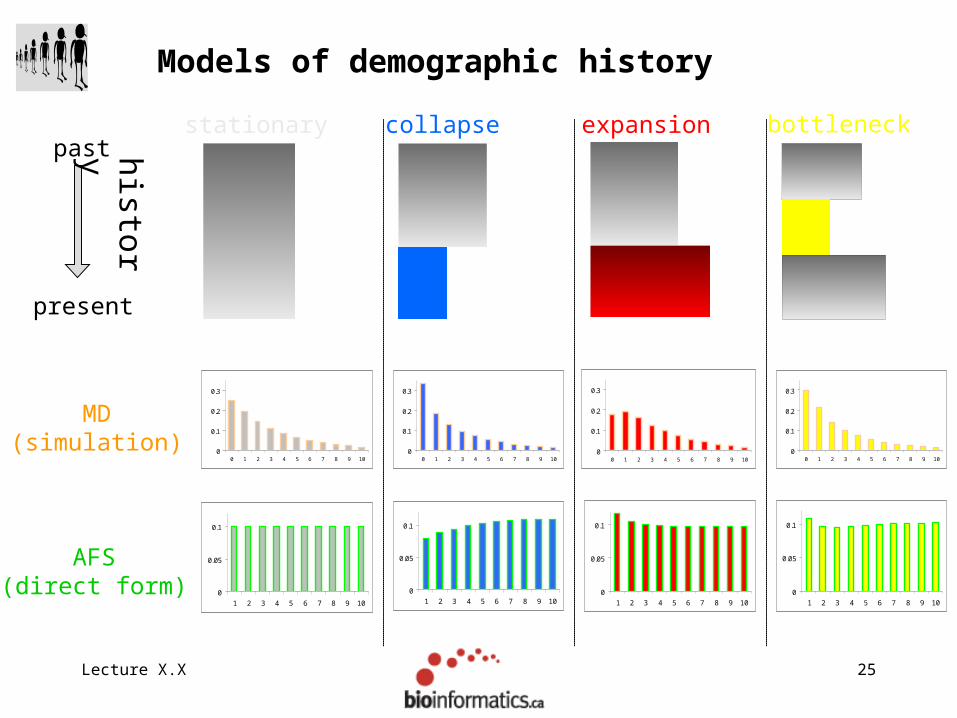
Models of demographic history
past
present
stationary expansioncollapse
MD(simulation)
AFS(direct form)
histo
ry
0
0.05
0.1
1 2 3 4 5 6 7 8 9 10
0
0.05
0.1
1 2 3 4 5 6 7 8 9 100
0.05
0.1
1 2 3 4 5 6 7 8 9 10
0
0.05
0.1
1 2 3 4 5 6 7 8 9 10
bottleneck
0
0.1
0.2
0.3
0 1 2 3 4 5 6 7 8 9 100
0.1
0.2
0.3
0 1 2 3 4 5 6 7 8 9 100
0.1
0.2
0.3
0 1 2 3 4 5 6 7 8 9 10
0
0.1
0.2
0.3
0 1 2 3 4 5 6 7 8 9 10

Lecture X.X 26
0.005.00
10.0015.00
20.0025.00
30.0035.00
40.00
4 kb4 kb
8 kb8kb
12 kb12 kb
16 kb16kb0
0.1
0.2
0.3
0.4
• best model is a bottleneck shaped population size history
presentN1=6,000T1=1,200 gen.
N2=5,000T2=400 gen.
N3=11,000
Data fitting: marker density
Marth et al. PNAS 2003
• our conclusions from the marker density data are confounded by the unknown ethnicity of the public genome sequence we looked at allele frequency data from ethnically defined samples

Lecture X.X 27
0
0.05
0.1
0.15
1 2 3 4 5 6 7 8 9 10
0
0.05
0.1
0.15
1 2 3 4 5 6 7 8 9 10
0
0.05
0.1
0.15
1 2 3 4 5 6 7 8 9 10
presentN1=20,000T1=3,000 gen.
N2=2,000T2=400 gen.
N3=10,000
model consensus: bottleneck
Data fitting: allele frequency
• Data from other populations?

Lecture X.X 28
Population specific demographic history
0
0.05
0.1
0.15
1 2 3 4 5 6 7 8 9 10
minor allele count
0
0.05
0.1
0.15
1 2 3 4 5 6 7 8 9 10
minor allele count
0
0.05
0.1
0.15
1 2 3 4 5 6 7 8 9 10
minor allele count
European data
African data
bottleneck
modest but uninterrupted
expansionMarth et al.
Genetics 2004

Lecture X.X 29
Model-based prediction
computational model encapsulating what we know about the processgenealogy + mutationsallele structure
arbitrary number of additional replicates

Lecture X.X 30
African dataEuropean data
1 2 3 4 5 6 7 8 9 10 11 12 13 14 15 16 17 18 19 200.00
0.01
0.02
0.03
0.04
0.05
0.06
0.07
Pro
port
ion
of A
FS
Mutational Size (i)1 2 3 4 5 6 7 8 9 10 11 12 13 14 15 16 17 18 19 20
0.00
0.01
0.02
0.03
0.04
0.05
0.06
0.07
Pro
port
ion
of A
FS
Mutational size (i)
contribution of the past to
alleles in various
frequency classes
1 2 3 4 5 6 7 8 9 10 11 12 13 14 15 16 17 18 19 200
20,000
40,000
60,000
80,000
Mut
atio
nal A
ge (
gene
ratio
ns)
Mutational Size (i)
1 2 3 4 5 6 7 8 9 10 11 12 13 14 15 16 17 18 19 200
20,000
40,000
60,000
80,000
Mut
atio
nal A
ge (
gener
atio
ns)
Mutational Size (i)
average age of
polymorphism
Prediction – allele frequency and age
Lecture X.X 31
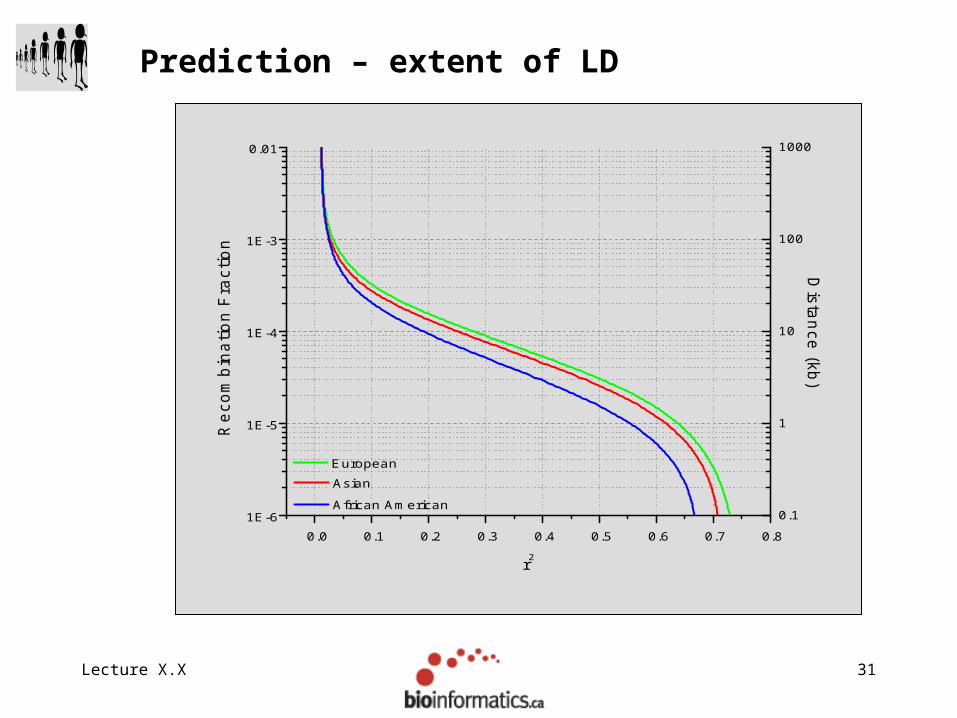
Prediction – extent of LD
0.0 0.1 0.2 0.3 0.4 0.5 0.6 0.7 0.81E-6
1E-5
1E-4
1E-3
0.01
0.1
1
10
100
1000
Reco
mbin
atio
n F
ract
ion
r2
European Asian
African American
Dista
nce
(kb)

Lecture X.X 32
Prediction – haplotype structure
0
200
400
600
800
1000
1200
1400
1600
1800
0 5 10 15 20 25
block length [kb]
co
un
t
• our models predict shorter blocks in African samples than in Europeans
• what is the spatial relationship between blocks?
• we must connect the polymorphism structure of different human populations

Lecture X.X 33
Modeling joint allele structure
• We study these relationships with models of population
subdivision
“African history” “European history”
“migration”
• The genealogy of samples from different populations are
connected through the shared part of our past
• Polymorphic markers (some shared, some population-specific)
and haplotypes are placed into a common frame of reference
• The “true” history of all human populations is interconnected
Lecture X.X 34
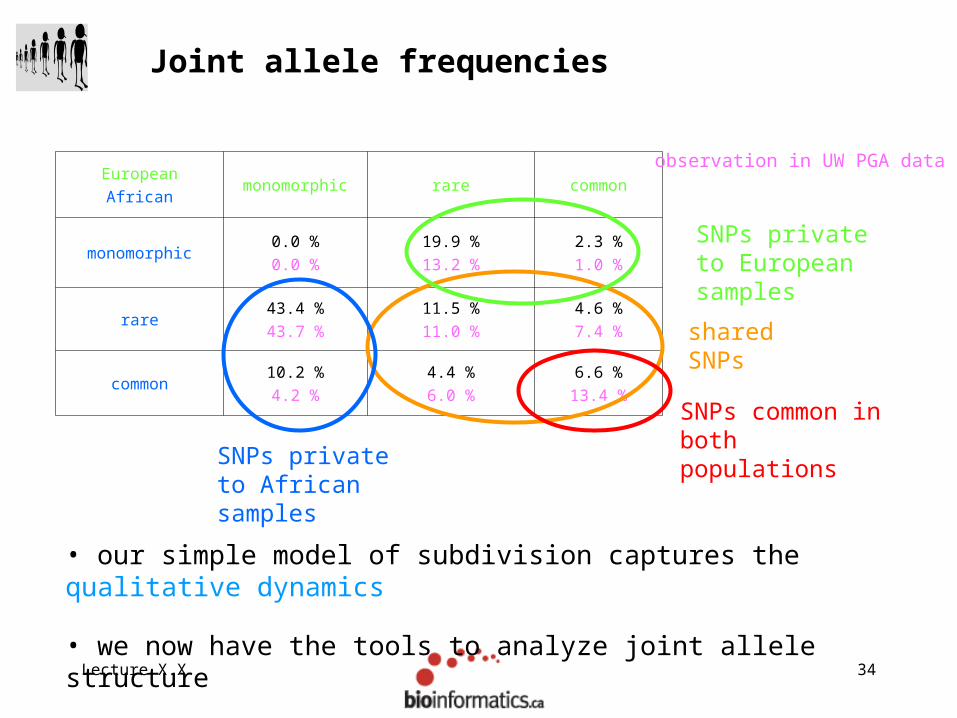
Joint allele frequencies
EuropeanAfrican
monomorphic rare common
monomorphic0.0 %0.0 %
19.9 %13.2 %
2.3 %1.0 %
rare43.4 %43.7 %
11.5 %11.0 %
4.6 %7.4 %
common10.2 %4.2 %
4.4 %6.0 %
6.6 %13.4 %
shared SNPs
observation in UW PGA data
SNPs private to African samples
SNPs private to European samples
SNPs common in both populations
• our simple model of subdivision captures the qualitative dynamics
• we now have the tools to analyze joint allele structure

Lecture X.X 35
Generality for future samples?
1. reference samples
3. blocks
4. list of haplotypes5. frequent haplotypes
• The haplotype map resource is a collection of reagents
• How relevant are the reference reagents to future clinical samples (drawn from the same or different population)?
2. common markers

Lecture X.X 36
Reference haplotypes
87.5%(74.9%, 65.0% at lower minimum marker allele frequency)
99.4%same populatio
n
different population
reference haplotypes
• these computational studies inform us about the global, genome-average properties of the HapMap reagents • what can we say about linkage in specific local regions?
Lecture X.X 37
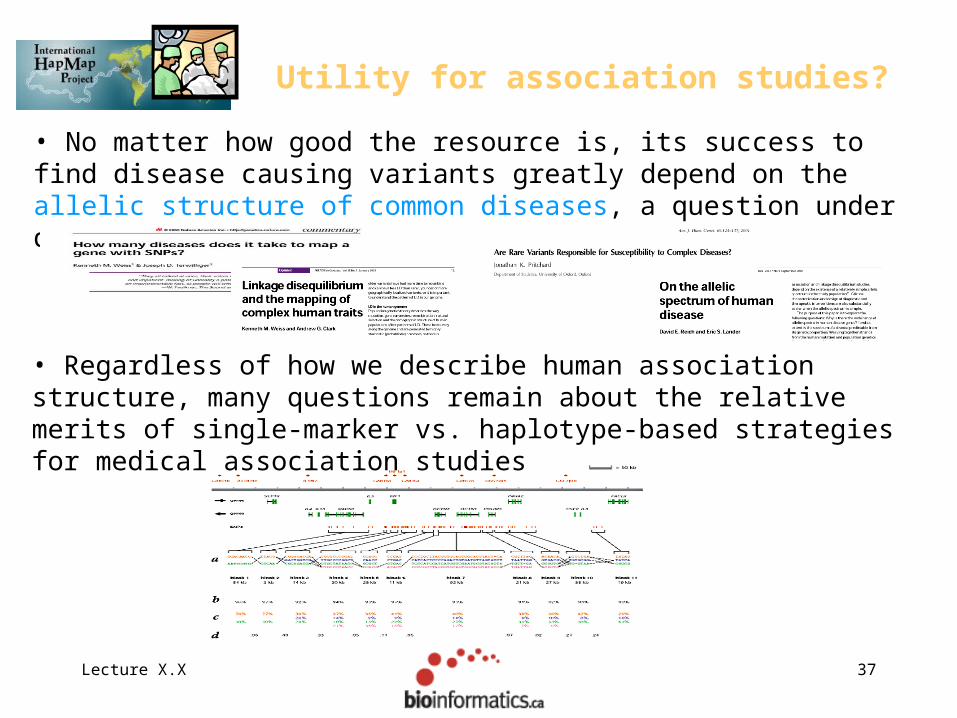
Utility for association studies?
• No matter how good the resource is, its success to find disease causing variants greatly depend on the allelic structure of common diseases, a question under debate
• Regardless of how we describe human association structure, many questions remain about the relative merits of single-marker vs. haplotype-based strategies for medical association studies

Lecture X.X 38
Steve SherryEva CzabarkaJanos MurvaiAlexey VinokurovGreg SchulerRicha AgarwalaStephen Altschul
Aravinda Chakravarti (Hopkins)Andy Clark (Cornell)Pui-Yan Kwok (UCSF)Henry Harpending (Utah)Jim Weber (Marshfield)
http://clavius.bc.edu/~marthlab/MarthLab
Acknowledgements
Eric Tsung