Lecture 5: Large-Scale Path Loss Chapter 4 – Mobile Radio Propagation: Large-Scale Path Loss.
57
Lecture 5: Large-Scale Path Loss Chapter 4 – Mobile Radio Pro pagation: Large-Scale Path L oss
-
date post
19-Dec-2015 -
Category
Documents
-
view
230 -
download
4
Transcript of Lecture 5: Large-Scale Path Loss Chapter 4 – Mobile Radio Propagation: Large-Scale Path Loss.

Lecture 5: Large-Scale Path Loss
Chapter 4 – Mobile Radio Propagation: Large-Scale Path Loss

2
Last two lectures: Properties of cellular radio systems Frequency reuse by using cells Clustering and system capacity System components - Mobile switching centers, base stations,
mobiles, PSTN Handoff strategies Handoff margin, guard channels Mobile Assisted Handoff Umbrella cells Hard and soft handoffs Co-Channel Interference Adjacent Channel Interference Trunking and grade of service (GOS) Cell splitting Sectoring

3
This lecture: Electromagnetic propagation properties and hindrances.
What are reasons why wireless signals are hard to send and receive?
4
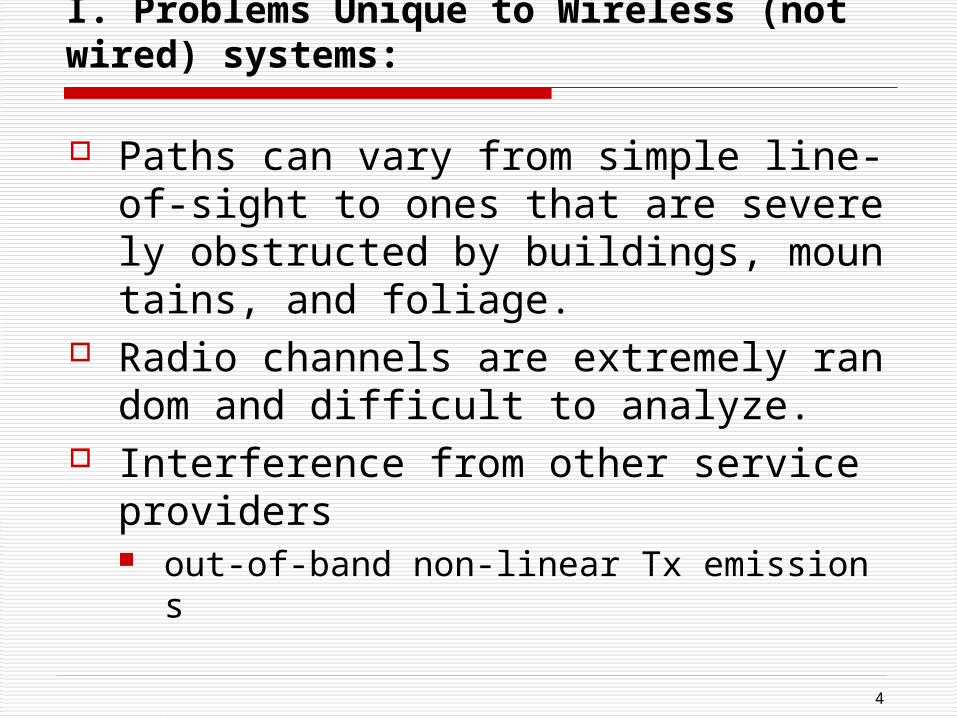
I. Problems Unique to Wireless (not wired) systems:
Paths can vary from simple line-of-sight to ones that are severely obstructed by buildings, mountains, and foliage.
Radio channels are extremely random and difficult to analyze.
Interference from other service providers out-of-band non-linear Tx emissions

5
Interference from other users (same network) CCI due to frequency reuse ACI due to Tx/Rx design limitations & large # user
s sharing finite BW Shadowing
Obstructions to line-of-sight paths cause areas of weak received signal strength
6
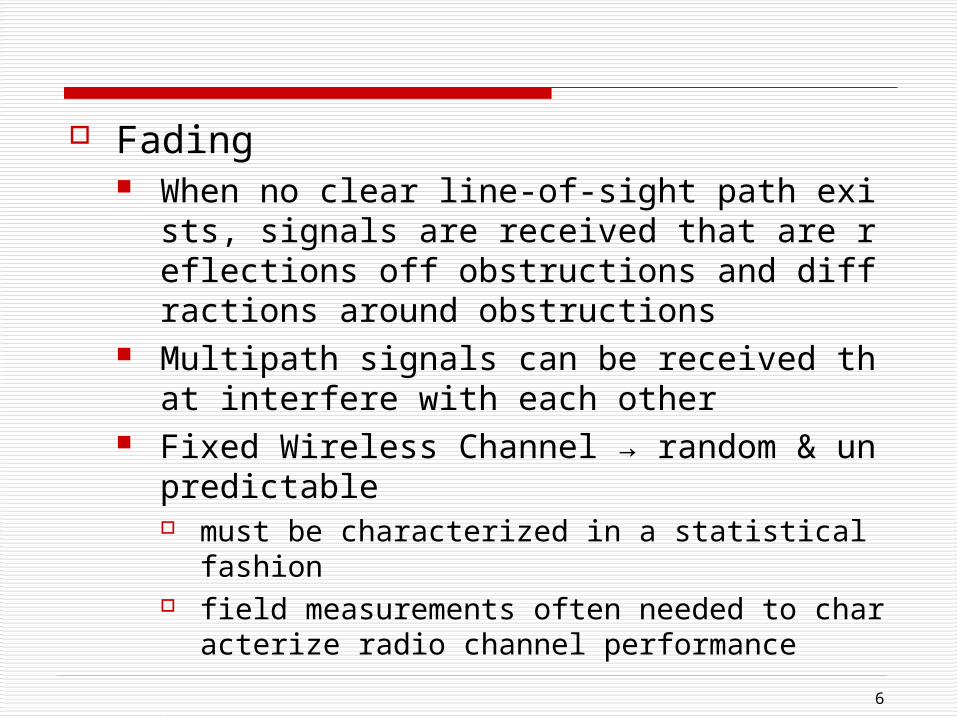
Fading When no clear line-of-sight path exists, signals are r
eceived that are reflections off obstructions and diffractions around obstructions
Multipath signals can be received that interfere with each other
Fixed Wireless Channel → random & unpredictable must be characterized in a statistical fashion field measurements often needed to characterize radio c
hannel performance

7
** The Mobile Radio Channel (MRC) has unique problems that limit performance ** A mobile Rx in motion influences rates of fadin
g the faster a mobile moves, the more quickly
characteristics change

8
II. Radio Signal Propagation
9
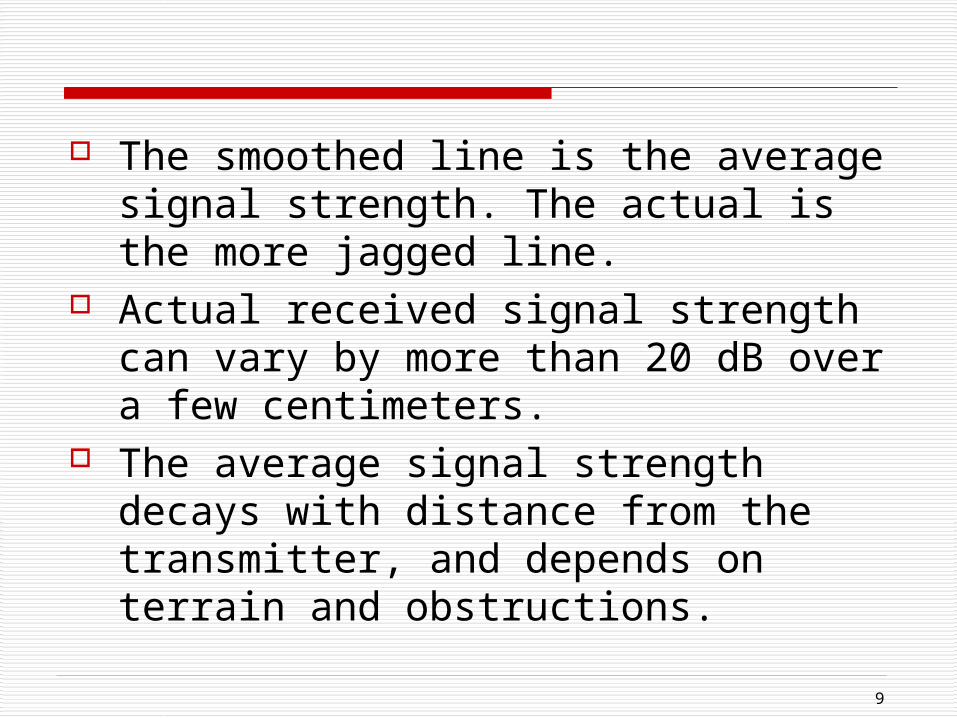
The smoothed line is the average signal strength. The actual is the more jagged line.
Actual received signal strength can vary by more than 20 dB over a few centimeters.
The average signal strength decays with distance from the transmitter, and depends on terrain and obstructions.
10
Two basic goals of propagation modeling:
1) Predict magnitude and rate (speed) of received signal strength fluctuations over short distances/time durations
“short” → typically a few wavelengths (λ) or seconds
at 1 Ghz, λ = c/f = 3x10⁸ / 1x109 = 0.3 meters received signal strength can vary drastically by 30 t
o 40 dB
11
small-scale fluctuations → called _____ (Chapter 5) caused by received signal coming from a sum of ma
ny signals coming together at a receiver multiple signals come from reflections and scatterin
g these signals can destructively add together by being
out-of-phase

12
2) Predict average received signal strength for given Tx/Rx separation characterize received signal strength over distances
from 20 m to 20 km Large-scale radio wave propagation model models needed to estimate coverage area of base station in general, large scale path loss decays gradually w
ith distance from the transmitter will also be affected by geographical features like h
ills and buildings
13
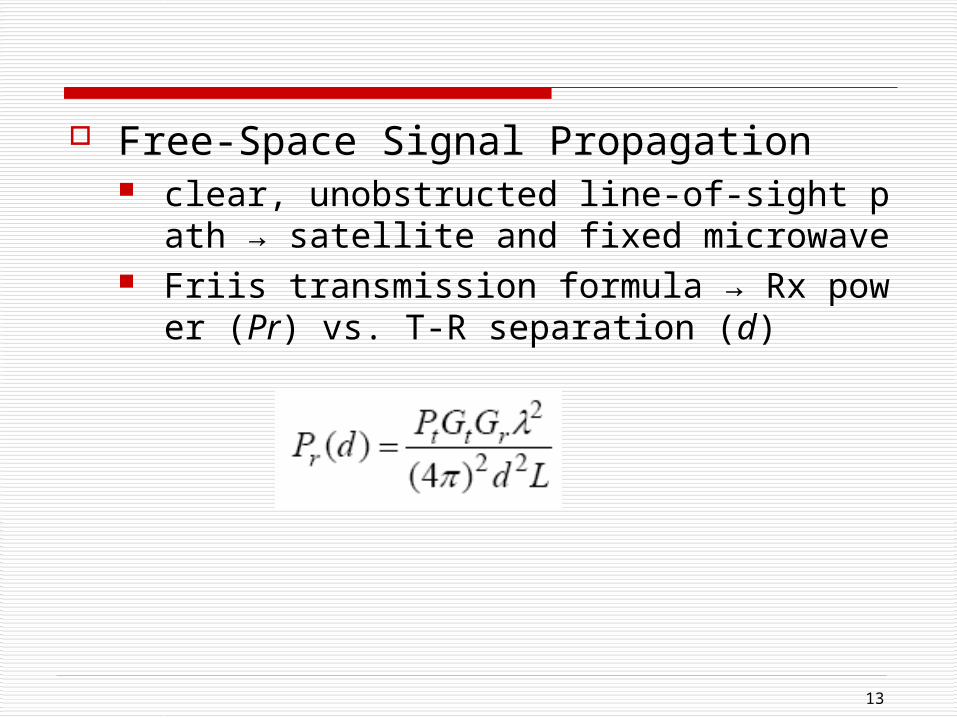
Free-Space Signal Propagation clear, unobstructed line-of-sight path → satellite and
fixed microwave Friis transmission formula → Rx power (Pr) vs. T-R
separation (d)

14
where Pt = Tx power (W) G = Tx or Rx antenna gain (unitless)
relative to isotropic source (ideal antenna which radiates power uniformly in all directions)
in the __________ of an antenna (beyond a few meters)
Effective Isotropic Radiated Power (EIRP)
EIRP = PtGt
Represents the max. radiated power available from a Tx in the direction of max. antenna gain, as compare to an isotropic radiator
15
λ = wavelength = c / f (m). A term is related to antenna gain.
So, as frequency increases, what happens to the propagation characteristics?
L = system losses (antennas, transmission lines betwee
n equipment and antennas, atmosphere, etc.) unitless L = 1 for zero loss L > 1 in general

16
d = T-R separation distance (m) Signal fades in proportion to d2
We can view signal strength as related to the density of the signal across a large sphere.
This is the surface area of a sphere with radius d. So, a term in the denominator is related to distance
and density of surface area across a sphere.

17
⇒ Path Loss (PL) in dB:

18
d2 → power law relationship Pr decreases at rate of proportional to d2
Pr decreases at rate of 20 dB/decade (for line-of-sight, even worse for other cases)
For example, path loses 20 dB from 100 m to 1 km Comes from the d2 relationship for surface area.
Note: Negative “loss” = “gain”

19
Example: Path loss can be computed in terms of a link
budget calculation. Compute path loss as a sum of dB terms for the
following: Unity gain transmission antenna. Unity gain receiving antenna. No system losses Carrier frequency of 3 GHz Distance = 2000 meters

20
Close in reference point (do) is used in large-scale models
do : known received power reference point - typically 100 m or 1 km for outdoor systems and 1 m for indoor systems
df : far-field distance of antenna, we will always work problems in the far-field
D: the largest physical linear dimension of antenna
22 f f f
Dd d D d

21
Reference Point Example: Given the following system characteristics for large-s
cale propagation, find the reference distance do. Received power at do = 20 W Received power at 5 km = 13 dBm
Using Watts:
Using dBm:

22
III. Reflections
There are three basic propagation mechanisms in addition to line-of-sight paths Reflection - Waves bouncing off of objects of large
dimensions Diffraction - Waves bending around sharp edges of
objects Scattering - Waves traveling through a medium
with small objects in it (foliage, street signs, lamp posts, etc.) or reflecting off rough surfaces

23
Reflection occurs when RF energy is incident upon a boundary between two materials (e.g air/ground) with different electrical characteristics Permittivity µ Permeability ε Conductance σ
Reflecting surface must be large relative to λ of RF energy
Reflecting surface must be smooth relative to λ of RF energy “specular” reflection

24
What are important reflecting surfaces for mobile radio?
Fresnel reflection coefficient → Γ describes the magnitude of reflected RF energy depends upon material properties, polarization, & a
ngle of incidence

25
IV. Ground Reflection (2-Ray) Model
Good for systems that use tall towers (over 50 m tall)
Good for line-of-sight microcell systems in urban environments

26
ETOT is the electric field that results from a combination of a direct line-of-sight path and a ground reflected path
is the amplitude of the electric field at distance d ωc = 2πfc where fc is the carrier frequency of the signal Notice at different distances d the wave is at a different phase becau
se of the form similar to

27
For the direct path let d = d’ ; for the reflected path
d = d” then
for large T−R separation : θi goes to 0 (angle of incidence to the ground of the reflected wave) and
Γ = −1 Phase difference can occur depending on the phase diffe
rence between direct and reflected E fields The phase difference is θ∆ due to Path difference , ∆
= d”− d’, between

28
From two triangles with sides d and (ht + hr) or (ht – hr)

29
∆ can be expanded using a Taylor series expansion

30
which works well for d >> (ht + hr), which means
and are small

31
the phase difference between the two arriving signals is
0 0
0 02
( ) 2 sin2
20.3 rad
22
( ) 2 V/m
TOT
r t
r tTOT
E dE t
d
h h
dE d h h k
E td d d

32
For d0=100meter, E0=1, fc=1 GHz, ht=50 meters, hr=1.5 meters, at t=0

33
note that the magnitude is with respect to a reference of E0=1 at d0=100 meters, so near 100 meters the signal can be stronger than E0=1 the second ray adds in energy that would have been
lost otherwise for large distances it can be shown
that

34

35
V. Diffraction
RF energy can propagate: around the curved surface of the Earth beyond the line-of-sight horizon Behind obstructions
Although EM field strength decays rapidly as Rx moves deeper into “shadowed” or obstructed (OBS) region
The diffraction field often has sufficient strength to produce a useful signal

36
Huygen’s principle says points on a wavefront can be considered sources for additional wavelets.

37
The wavefront on top of an obstruction generates secondary (weaker) waves.

38
The difference between the direct path and diffracted path, call excess path length
Fresnel-Kirchoff diffraction parameter
The corresponding phase difference

39

40
The excess total path length traversed by a ray passing through each circle is nλ/2

41
The diffraction gain due to the presence of a knife edge, as compared the the free space E-field

42

43

44

45

46

47

48

49
VI. Scattering
Received signal strength is often stronger than that predicted by reflection/diffraction models alone
The EM wave incident upon a rough or complex surface is scattered in many directions and provides more energy at a receiver energy that would have been absorbed is instead reflected to t
he Rx.
Scattering is caused by trees, lamp posts, towers, etc. flat surface → EM reflection (one direction) rough surface → EM scattering (many directions)

50

51
VII. Path Loss Models
We wish to predict large scale coverage using analytical and empirical (field data) methods
It has been repeatedly measured and found that Pr @ Rx decreases logarithmically with distance
∴ PL (d) = (d / do )n where n : path loss exponent or
PL (dB) = PL (do ) + 10 n log (d / do )

52
“bar” means the average of many PL values at a given value of d (T-R sep.)
n depends on the propagation environment “typical” values based on measured data

53
At any specific d the measured values vary drastically because of variations in the surrounding environment (obstructed vs. line-of-sight, scattering, reflections, etc.)
Some models can be used to describe a situation generally, but specific circumstances may need to be considered with detailed analysis and measurements.

54
Log-Normal Shadowing
PL (d) = PL (do ) + 10 n log (d / do ) + Xσ
describes how the path loss at any specific location may vary from the average value
has a the large-scale path loss component we have already seen plus a random amount Xσ.

55
Xσ : zero mean Gaussian random variable, a “bell curve”
σ is the standard deviation that provides the second parameter for the distribution
takes into account received signal strength variations due to shadowing measurements verify this distribution
n & σ are computed from measured data for different area types
any other path loss models are given in your book. That correlate field measurements with models for different t
ypes of environments.

56

57
HW-3
3-16, 3-17, 4-4, 4-14, 4-23(a)-(d)