
Lecture 3 Competitive Markets - Lakehead Universityflash.lakeheadu.ca/~kyu/B5017/B3.pdf · Quantity...
32
Lecture 3 Competitive Markets Business 5017 Managerial Economics Kam Yu Fall 2013
Transcript of Lecture 3 Competitive Markets - Lakehead Universityflash.lakeheadu.ca/~kyu/B5017/B3.pdf · Quantity...

Lecture 3 Competitive MarketsBusiness 5017 Managerial Economics
Kam Yu
Fall 2013

Outline
1 The Competitive Market Process
2 Supply and Demand
3 Market Equilibrium
4 Non-price Competition
5 Competitive Labour Markets
6 Efficiency Wage Hypothesis
Kam Yu (LU) Lecture 3 Competitive Markets Fall 2013 2 / 32

The Competitive Market Process
What Does a Market Do?
A product has many attributes or characteristics: colour, size,performance, style, taste, ease of use, durability, etc.
Buyers look for what they want at the cheapest price.
Sellers decide what to produce, how much to produce, and at thesame time try to maximize their profits.
The market process is constantly adjusting and self-correcting.
The key information both parties observe is the market price.
Kam Yu (LU) Lecture 3 Competitive Markets Fall 2013 3 / 32

The Competitive Market Process
Competition
Buyers compete among themselves. Examples: bidders try to outbideach other at an auction; employers compete to hire the new MBAgraduates.
Sellers compete among themselves in terms of price and othernon-price attributes of their products.
Non-price competition: unique taste, sex appeals, personal safety,conspicuous consumption, lifestyle, etc.
Most non-price competition activities are done through productdesign and marketing.
We shall start with a generic model called perfect competition. Thesellers compete in price only.
Kam Yu (LU) Lecture 3 Competitive Markets Fall 2013 4 / 32

The Competitive Market Process
Perfect Competition
A benchmark model with strict assumptions:
1 There are many sellers and buyers, trading an identical product(wheat, milk, eggs, crude oil).
2 Buyers and sellers are price takers, that is, no one has the power tocontrol the market price.
3 Everyone has perfect information and foresight. Therefore transactioncost is minimal.
4 All input factors are mobile in the long-run.
5 Sellers are free to enter and to exit the market.
We also assume that buyers and sellers are self-interested and behaveindependently. They observe the market price and make their individualdecisions.
Kam Yu (LU) Lecture 3 Competitive Markets Fall 2013 5 / 32

Supply and Demand
On the Demand Side
Consider the market for tomato. When the price of tomato goes up,
Consumers buy less tomato and substitute it with other vegetables(substitution effect).
Some consumers feel poorer because of the higher price and thereforebuy less tomato (income effect).
Overall, the quantity demanded for tomato goes down.
Price and quantity demanded for consumer goods and servicesgenerally have a negative relation. This property is called the law ofdemand.
Kam Yu (LU) Lecture 3 Competitive Markets Fall 2013 6 / 32

Supply and Demand
Market Demand
The price-quantity demanded relation can be presented by a formula, atable, or a graph:
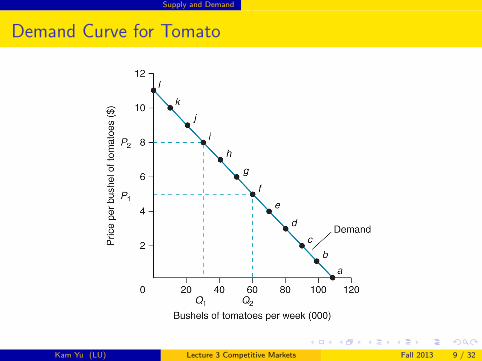
1 The relation can be expressed by a formula, called the demandfunction. For example,
P = 11 − 0.1Qd ,
where Qd is in thousands of bushels of tomato per week, and P is theprice per bushel.
2 The same information can be listed on a table, sometimes called ademand schedule (see Table 3.1).
3 Or by a graph with price on the vertical axis and quantity on thehorizontal axis. The graph is called the demand curve (see Figure3.1).
Kam Yu (LU) Lecture 3 Competitive Markets Fall 2013 7 / 32

Supply and Demand
Demand Schedule for Tomato
Kam Yu (LU) Lecture 3 Competitive Markets Fall 2013 8 / 32
Supply and Demand
Demand Curve for Tomato
Kam Yu (LU) Lecture 3 Competitive Markets Fall 2013 9 / 32

Supply and Demand
Determinants of Market Demand
When the price of a good changes, the quantity demanded changesalong the demand curve.
There are other factors that affect market demand. Changes in thesesituations shift the whole demand curve.
An increase in demand shifts the demand curve to the right (or up).At each and every price, the quantity demanded increases.
A decrease in demand shifts the demand curve to the left (or down).At each and every price, the quantity demanded decreases.
Kam Yu (LU) Lecture 3 Competitive Markets Fall 2013 10 / 32

Supply and Demand
Shifts in the Demand Curve
Kam Yu (LU) Lecture 3 Competitive Markets Fall 2013 11 / 32

Supply and Demand
What Factors Shift the Demand Curve?
Taste and preferences: fads, expectations, advertisements
Demography: population, age distribution, ethnic mix
Prices of substitute goods: rib steak for sirloin, music downloads forCDs
Prices of complementary goods: movie tickets and dining out, beerand chicken wings, computer software and hardware
Income: average income, income distribution, expected income
Expected future price: stock up when Campbell soup is on sale.
Environmental factor: rain, snow, heat wave
Kam Yu (LU) Lecture 3 Competitive Markets Fall 2013 12 / 32

Supply and Demand
On the Supply Side
In a typical production process, some input factors such as capital andland are fixed, while others such as labour, materials, and energy areflexible. When the price of output goes up:
A firm can produce more by increasing the quantities of the variableinputs.Because of the fixed input factors, the firm faces diminishing marginalreturns. For example, by putting more chefs in a fixed-size kitchen,the extra meals prepared by the additional chef is less than the lastone added.Implication: The marginal cost of production is increasing in outputquantity. That is, as output increases, the additional cost ofproducing the last unit is increasing.Consequence: To induce the firms to produce more, the market pricemust be higher in the short run.This positive relation between market price and quantity supplied iscalled the law of supply.
Kam Yu (LU) Lecture 3 Competitive Markets Fall 2013 13 / 32

Supply and Demand
Market Supply
The price-quantity supplied relation can be presented by a formula, atable, or a graph:
1 The relation can be expressed by a formula, called the supplyfunction. For example,
P = 0.1Qs ,
where Qs is in thousands of bushels of tomato per week, and P is theprice per bushel.
2 The same information can be listed on a table, sometimes called asupply schedule (see Table 3.2).
3 Or by a graph with price on the vertical axis and quantity on thehorizontal axis. The graph is called the supply curve (see Figure 3.3).
Kam Yu (LU) Lecture 3 Competitive Markets Fall 2013 14 / 32

Supply and Demand
Supply Schedule of Tomato
Kam Yu (LU) Lecture 3 Competitive Markets Fall 2013 15 / 32

Supply and Demand
Supply Curve of Tomato
Kam Yu (LU) Lecture 3 Competitive Markets Fall 2013 16 / 32

Supply and Demand
Determinants of Market Supply
When the price of a good changes, the quantity supplied changesalong the supply curve.
There are other factors that affect market supply. Changes in thesesituations shift the whole supply curve.
An increase in supply shifts the demand curve to the right (or down).At each and every price, the quantity supplied increases.
A decrease in supply shifts the supply curve to the left (or up). Ateach and every price, the quantity supplied decreases.
Kam Yu (LU) Lecture 3 Competitive Markets Fall 2013 17 / 32

Supply and Demand
Shifts in the Supply Curve
Kam Yu (LU) Lecture 3 Competitive Markets Fall 2013 18 / 32

Supply and Demand
What Factors Shift the Supply Curve?
Technology in production: R&D, knowledge transfer
Factor prices: current and expected prices
Inventory
Market structure and competition: M&A, supply chain, price collusion
Formal institution: Government laws and regulations
Environmental factors: weather
International trade
Kam Yu (LU) Lecture 3 Competitive Markets Fall 2013 19 / 32

Market Equilibrium
Market Surplus
A market equilibrium is where the supply curve and demand curve meet. Amarket surplus occurs when the market price is above the equilibrium price:
Kam Yu (LU) Lecture 3 Competitive Markets Fall 2013 20 / 32

Market Equilibrium
Market Shortages
Market shortages occurs when the market price is below the equilibriumprice. Quantity demanded exceeds quantity supplied:
Kam Yu (LU) Lecture 3 Competitive Markets Fall 2013 21 / 32

Market Equilibrium
Market Equilibrium
When there is a market surplus, firms cannot sell the quantities theyproduce at the current market price and inventory goes up. This putpressure for them to reduce prices.
When there is market shortages, consumers cannot get the quantitiesthey want at the current market price. They compete with each otherby bidding up the prices.
Only at the market equilibrium price and quantity, both the buyersand sellers have no incentive for further changes.
This is where the demand curve and the supply curve intersect.
Kam Yu (LU) Lecture 3 Competitive Markets Fall 2013 22 / 32

Market Equilibrium
When the Supply and Demand Curves Shift
Kam Yu (LU) Lecture 3 Competitive Markets Fall 2013 23 / 32

Market Equilibrium
The Invisible Hand
The demand curve can be interpreted as the maximumwillingness-to-pay at any particular quantity of consumption.
The supply curve can be interpreted as the minimumwillingness-to-accept at any particular quantity of production.
The difference between the demand curve and the supply curve is ameasure of net social surplus.
Without any market externality (e.g. pollution), the area between thetwo curves (where the demand curve is above the supply curve) is thetotal social surplus.
The social surplus is maximized at the market equilibrium price andquantity.
This is in essence Adam Smith’s idea of the invisible hand.
Kam Yu (LU) Lecture 3 Competitive Markets Fall 2013 24 / 32

Market Equilibrium
Efficiency of the Competitive Equilibrium
Note: The labels in Figure 3.8(c) in the book are incorrect.
Kam Yu (LU) Lecture 3 Competitive Markets Fall 2013 25 / 32

Non-price Competition
Product Differentiation
Homogeneous products such as milk and gasoline are quite rare.
Many products in the same market compete by a variety of productcharacteristics.
Consumers also differ in their tastes.
Each producer tries to find a market niche.
As the market size increases and consumer taste becomes moredispersed, more product varieties become available.
Hedonic analysis: economists use regression analysis to estimate theshadow price of each characteristic in a product.
AC Neilsen collects millions of scanner data on consumer goods. Thedata can be used in detailed consumer demand analyses.
Kam Yu (LU) Lecture 3 Competitive Markets Fall 2013 26 / 32

Competitive Labour Markets
Supply and Demand of Labour
Without government intervention or union, many labour markets canbe considered competitive.
The suppliers are the households, while the buyers are firms. Price ismeasured as wage rate.
The demand curve is downward sloping due to diminishing marginalproductivity of labour.
The supply curve is upward sloping. With a higher wage rate, theopportunity of cost leisure becomes higher.
The market equilibrium determines the wage rate and the hoursworked.
Kam Yu (LU) Lecture 3 Competitive Markets Fall 2013 27 / 32

Competitive Labour Markets
Competitive Labour Markets
Kam Yu (LU) Lecture 3 Competitive Markets Fall 2013 28 / 32

Competitive Labour Markets
International Comparison
Kam Yu (LU) Lecture 3 Competitive Markets Fall 2013 29 / 32

Efficiency Wage Hypothesis
Why Some Companies Overpay Their Workers?
In 1914, Henry Ford doubled the wage rate for workers on hisassembly lines.
He hired strong foremen to knock down workers found shirking.
After the change, productivity increased by 50%. Turnover rate ofworkers went down from 370% to 16% per year.
Job applicants lined up outside the plant trying to get hired.
Ford was a tough boss who changed the payoff matrix of theprisoners’ dilemma of shirking discussed in Chapter 2 (see page 68).
Economists call this practice the efficiency wage hypothesis.
The hypothesis implies that senior managers in a firm, who have morecontrol of the firm’s resources and are more difficult to monitor theirwork efforts, must be more overpaid than their staffs.
Kam Yu (LU) Lecture 3 Competitive Markets Fall 2013 30 / 32

Efficiency Wage Hypothesis
Life-Time Efficiency Wages
Some firms underpay their workers when they are young and overpay whenthey are old.
Kam Yu (LU) Lecture 3 Competitive Markets Fall 2013 31 / 32

Efficiency Wage Hypothesis
Reasons
New firms cannot afford to pay their workers at the market wage rate.The underpayment is a form of investment workers put into the firm.
The wage structure can also serve as a device to encourage workers toimprove their productivity over time.
It also ensures workers’ loyalty to the firm. The practice is common inSouth Korea and Japan. Job promotions are largely based on seniority.
Established firms must show that their commitments are credible.
Mandatory retirement is required for this kind of contracts.
Kam Yu (LU) Lecture 3 Competitive Markets Fall 2013 32 / 32


![[PPT]Electric Bus Management System - Lakehead Universityflash.lakeheadu.ca/~wchow/Degree Project/Proposal... · Web viewProblem Outline Public transportation faces problems with](https://static.fdocuments.in/doc/165x107/5aecac637f8b9ad73f8ff66f/pptelectric-bus-management-system-lakehead-wchowdegree-projectproposalweb.jpg)
