Lecture 2: Comparing GDP over Time - University of …wbrooks/Lecture2.pdfReal GDP values output...
43
Lecture 2: Comparing GDP over Time MEASURING A NATION’S INCOME 0 August 30, 2016 Prof. Wyatt Brooks
Transcript of Lecture 2: Comparing GDP over Time - University of …wbrooks/Lecture2.pdfReal GDP values output...

Lecture 2: Comparing GDP over Time
MEASURING A NATION’S INCOME 0
August 30, 2016
Prof. Wyatt Brooks
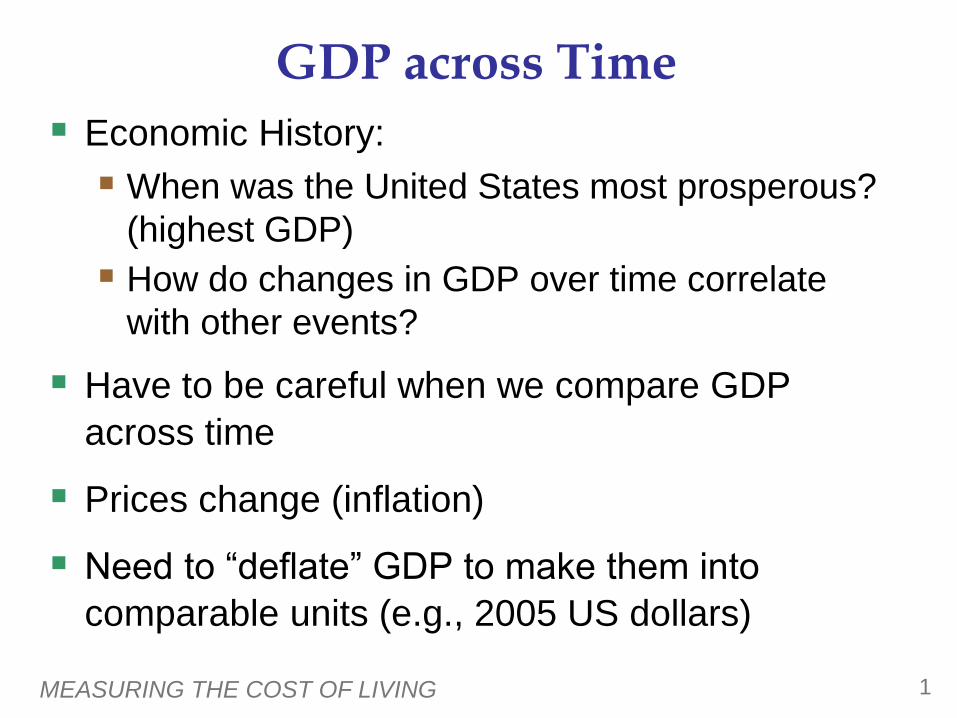
GDP across Time
Economic History:
When was the United States most prosperous?
(highest GDP)
How do changes in GDP over time correlate
with other events?
Have to be careful when we compare GDP
across time
Prices change (inflation)
Need to “deflate” GDP to make them into
comparable units (e.g., 2005 US dollars)
MEASURING THE COST OF LIVING 1

Prices
MEASURING THE COST OF LIVING 2
Prices change a lot over time
More subtle issues:
Not buying the same things at all times

MEASURING A NATION’S INCOME 3
Real versus Nominal GDP
Inflation is the reduction in the purchasing power
of the currency over time
Inflation can distort economic variables like GDP,
so we have two versions of GDP:
One is corrected for inflation, the other is not.
Nominal GDP values output using current prices.
It is not corrected for inflation.
Real GDP values output using the prices of
a base year. Real GDP is corrected for inflation.

MEASURING A NATION’S INCOME 4
The GDP Deflator
The GDP deflator is a measure of the overall
level of prices.
Definition:
One way to measure the economy’s inflation
rate is to compute the percentage increase in
the GDP deflator from one year to the next.
GDP deflator = 100 x nominal GDP
real GDP

A C T I V E L E A R N I N G 1
Computing GDP
5
Use the above data to solve these problems:
A. Compute nominal GDP in 2007.
B. Compute real GDP in 2008.
C. Compute the GDP deflator in 2009.
2007 (base yr) 2008 2009
P Q P Q P Q
Good A $30 900 $31 1,000 $36 1050
Good B $100 192 $102 200 $100 205

A C T I V E L E A R N I N G 1
Answers
6
A. Compute nominal GDP in 2007.
$30 x 900 + $100 x 192 = $46,200
B. Compute real GDP in 2008.
$30 x 1000 + $100 x 200 = $50,000
2007 (base yr) 2008 2009
P Q P Q P Q
Good A $30 900 $31 1,000 $36 1050
Good B $100 192 $102 200 $100 205
A C T I V E L E A R N I N G 1
Answers
7
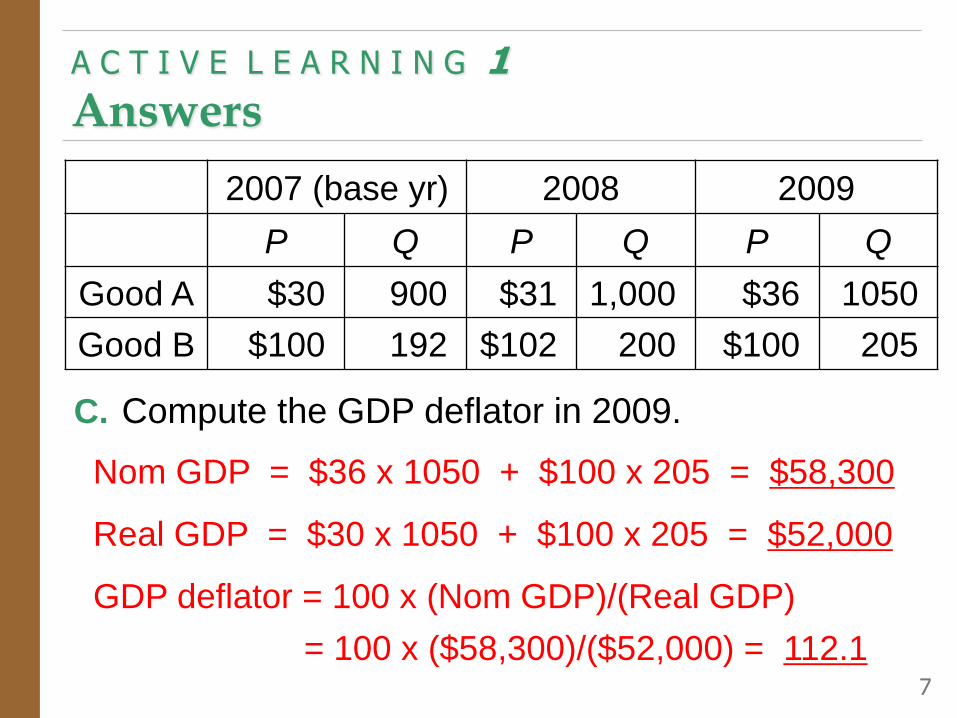
C. Compute the GDP deflator in 2009.
Nom GDP = $36 x 1050 + $100 x 205 = $58,300
Real GDP = $30 x 1050 + $100 x 205 = $52,000
GDP deflator = 100 x (Nom GDP)/(Real GDP)
= 100 x ($58,300)/($52,000) = 112.1
2007 (base yr) 2008 2009
P Q P Q P Q
Good A $30 900 $31 1,000 $36 1050
Good B $100 192 $102 200 $100 205

A C T I V E L E A R N I N G 1
Computing GDP
8
Use the above data to solve these problems:
A. Compute real GDP in 2012.
B. Compute real GDP in 2013.
C. Compute the GDP deflator in 2014.
2012 (base yr) 2013 2014
P Q P Q P Q
Good A $50 20 $60 20 $80 24
Good B $100 6 $100 8 $90 10
Good C $80 5 $75 6 $100 5

A C T I V E L E A R N I N G 1
Computing GDP
9
A. Compute real GDP in 2012.
$50 x 20 + $100 x 6 + $80 x 5 = $2000
B. Compute real GDP in 2013.
$50 x 20 + $100 x 8 + $80 x 6 = $2280
2012 (base yr) 2013 2014
P Q P Q P Q
Good A $50 20 $60 20 $80 24
Good B $100 6 $100 8 $90 10
Good C $80 5 $75 6 $100 5

A C T I V E L E A R N I N G 1
Computing GDP
10
C. Compute GDP deflator in 2014
Nominal: $80 x 24 + $90 x 10 + $86 x 5 = $3250
Real: $50 x 24 + $100 x 10 + $80 x 5 = $2600
GDP Deflator = 100 x Nominal / Real = 125
2012 (base yr) 2013 2014
P Q P Q P Q
Good A $50 20 $60 20 $80 24
Good B $100 6 $100 8 $90 10
Good C $80 5 $75 6 $86 5

MEASURING THE COST OF LIVING 11
The Consumer Price Index (CPI)
GDP Deflator includes the effect of investment
goods, imports, exports and so on…
Not closely tied to the prices that consumers face
Use the Consumer Price Index
A measure of how much it costs to maintain
your standard of living

MEASURING THE COST OF LIVING 12
How the CPI Is Calculated
1. Fix the “basket.”
The Bureau of Labor Statistics (BLS) surveys
consumers to determine what’s in the typical
consumer’s “shopping basket.”
2. Find the prices.
The BLS collects data on the prices of all the
goods in the basket.
3. Compute the basket’s cost.
Use the prices to compute the total cost of the
basket.

MEASURING THE COST OF LIVING 13
How the CPI Is Calculated
4. Choose a base year and compute the index.
The CPI in any year equals
5. Compute the inflation rate.
The percentage change in the CPI from the
preceding period.
100 x cost of basket in current year
cost of basket in base year
CPI this year – CPI last year
CPI last year
Inflation
rate x 100% =

MEASURING THE COST OF LIVING 14
What’s in the CPI Basket?
42.0%
16.7%
14.8%
6.5%
6.5%
6.4%
3.7% 3.5%
Housing
Transportation
Food & Beverages
Medical care
Recreation
Education andcommunication
Apparel
Other

MEASURING THE COST OF LIVING 15
Example: Compute CPI
2012 (base) 2013 2014
Beef $3 $2 $2
Corn $1 $2 $2
Rice $2 $2 $5
Basket: 5 units of beef, 15 of corn and 10 of rice
Compute CPI in each year
Compute the inflation rate in 2013 and 2014

MEASURING THE COST OF LIVING 16
Example: Compute CPI
2012 (base) 2013 2014
Beef $3 $2 $2
Corn $1 $2 $2
Rice $2 $2 $5
First, compute cost of basket in each year:
2012: $3 x 5 + $1 x 15 + $2 x 10 = $50
2013: $2 x 5 + $2 x 15 + $2 x 10 = $60
2014: $2 x 5 + $2 x 15 + $5 x 10 = $90
CPI:
2012: 100 (base), 2013: 100 x 60/50 = 120,
2014: 100 x 90/50 = 180

MEASURING THE COST OF LIVING 17
Example: Compute CPI
2012 (base) 2013 2014
Beef $3 $2 $2
Corn $1 $2 $2
Rice $2 $2 $5
CPI:
2012: 100
2013: 120
2014: 180
Inflation Rates:
2013: (120 – 100)/100 = 20%
2014: (180 – 120)/120 = 50%
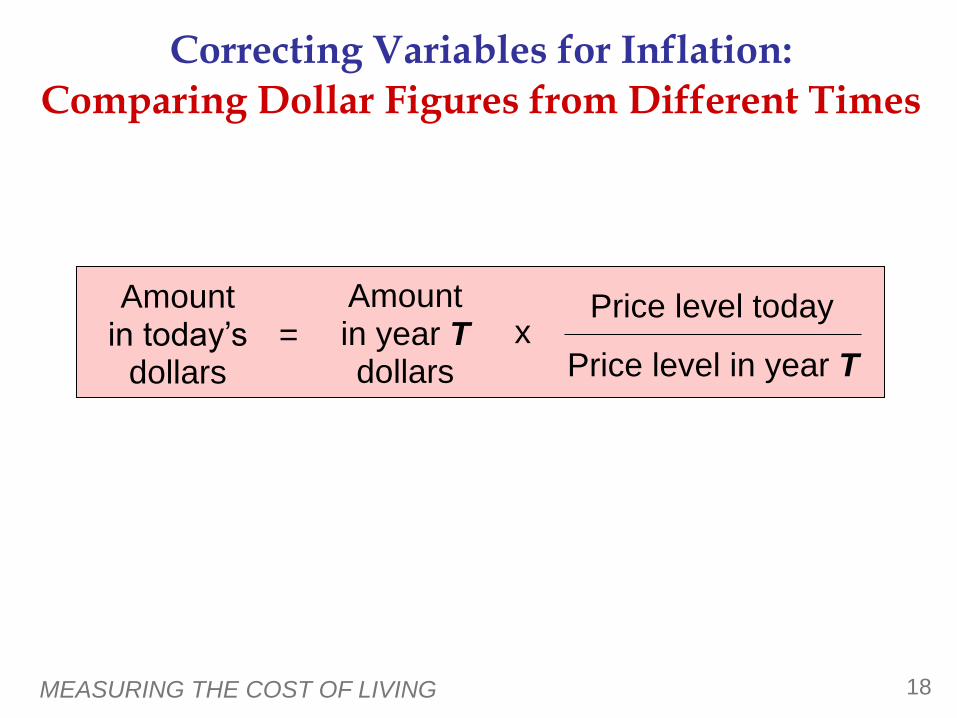
MEASURING THE COST OF LIVING 18
Correcting Variables for Inflation:
Comparing Dollar Figures from Different Times
Amount in today’s
dollars
Amount in year T dollars
Price level today
Price level in year T = x
MEASURING THE COST OF LIVING 19
Example: US GDP over time
https://research.stlouisfed.org/fred2/graph/?chart_type=lin
e&recession_bars=on&log_scales=&bgcolor=%23e1e9f0
&graph_bgcolor=%23ffffff&fo=verdana&ts=12&tts=12&txt
color=%23444444&show_legend=yes&show_axis_titles=
yes&drp=0&cosd=1947-01-01%2C1947-01-
01&coed=2015-04-01%2C2015-04-
01&height=445&stacking=&range=Max&mode=fred&id=G
DP%2CGDPC1&transformation=lin%2C&nd=%2C&ost=-
99999%2C&oet=99999%2C&lsv=%2C&lev=%2C&scale=
left%2C&line_color=%234572a7%2C&line_style=solid%2
C&lw=2%2C&mark_type=none&mw=2&mma=0%2C&fml
=a%2C&fgst=lin%2C&fgsnd=2007-12-
01%2C&fq=Quarterly%2C&fam=avg%2C&vintage_date=
%2C&revision_date=%2C&width=670

MEASURING THE COST OF LIVING 20
Comparing “Average Wealth” over Time
Want to eliminate two things that affect GDP to
make it a measure of “average wealth”
1) Inflation: use real variables instead of nominal
2) Population Growth: do everything in “per capita” terms
Even better than per capita is “per working age
person” for a measure of productivity

MEASURING THE COST OF LIVING 21
Brief Summary of World GDP Growth, pre-1850
400
800
1,600
3,200
0 500 1000 1500
UK
Italy
Japan
Iraq
Turkey
South Africa
Mexico
USA

MEASURING THE COST OF LIVING 22
Industrial Revolution
In the UK, change in industrial practice
Use machines, canals and replaceable parts to
speed up production
Industrialized manufacturing instead of artisan
manufacturing (“mass production”)
Adoption of these practices was very asymmetric
around the world

MEASURING THE COST OF LIVING 23
400
800
1,600
3,200
6,400
12,800
25,600
0 500 1000 1500 2000
UK
USA
France
Italy
Ireland
Japan
Iraq
Turkey
South Africa
Mexico
Post-Industrial Growth

MEASURING THE COST OF LIVING 24
What Caused US Growth?
US society changed over this long period of time
US government pursued many types of policies
What effect did they have on growth?

Female Labor Force Participation Rate
Definition: The fraction of the adult, female
population in the workforce.
Why might this matter?
Higher female labor force participation
means more people are working
More people working means more gets
produced

Female Labor Force Participation Rate

Government Spending as a Fraction of GDP
Why might this matter?
Governments are typically less efficient
producers of goods and services than private
entities
Less incentive to minimize costs

Government Spending as a Fraction of GDP

Fraction of US Labor Force in Manufacturing
Why might this matter?
Fewer tangible goods being produced
domestically
Huge inter-industry reallocation
People moving into other sectors
(services, information, etc.)

Fraction of US Labor Force in Manufacturing
Exports as a Fraction of GDP
Why might this matter?
Openness to trade is very important in many
countries
Running huge trade deficits with the rest of
the world
Has a direct, negative effect on GDP

Exports as a Fraction of GDP

Top Marginal Income Tax Rate
Marginal Income Tax: The federal income tax
rate on the income of the highest wage
earners
Why might this matter?
“Job Creators” argument
High income individuals are typically
business owners and investors who hire
the majority of the workforce
Higher tax rates reduce incentives to work

0%
10%
20%
30%
40%
50%
60%
70%
80%
90%
100%
1910 1920 1930 1940 1950 1960 1970 1980 1990 2000 2010
Today: 35%
Top Marginal Income Tax Rate

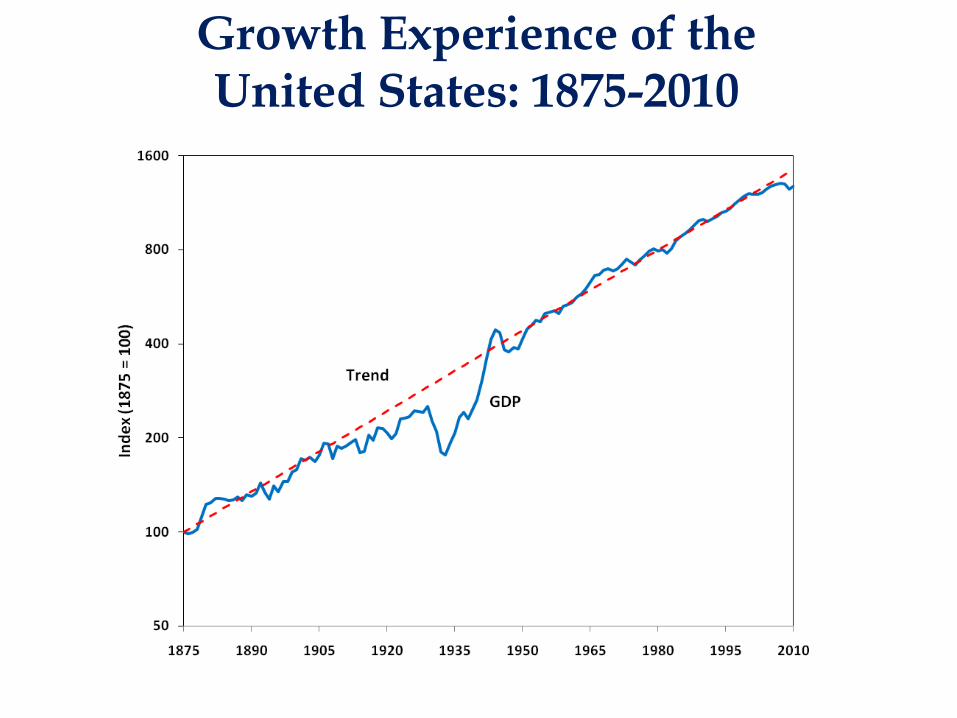
Growth Experience of the US
We see huge variation across time in all of these policies and outcomes (and many others) Prediction: US growth rates should move greatly with these things. Thought experiment: Suppose in 1875 someone was asked how US real GDP per working age person would evolve over time, and she guessed it would always grow by 2%. By how much would she be wrong?

Growth Experience of the United States: 1875-2010
Growth Experience of the United States: 1875-2010

Growth Experience of the US
In this part of the course (until Midterm 1) we will focus on long run growth In the second part we will focus on episodes of recessions and depressions

Note on the Severity of Recessions

Note on the Severity of Recessions
Of course, the effects of recessions vary widely across the population!
Summary
US economy has remarkably stable 2% real
per capita growth
Surprisingly invariant to policy
For this reason, US is a useful benchmark
to compare to other countries
Growth being stable is far from ordinary, as
we’ll see in many other examples

MEASURING THE COST OF LIVING 42
Next Class
Growth over the long run
Section 6.1 reading and homework