Lecture 13: Overview of Psychophysics, User Studies, and...
63
ME 327: Design and Control of Haptic Systems Spring 2019 Lecture 13: Overview of Psychophysics, User Studies, and Statistics Cara M. Nunez Stanford University
Transcript of Lecture 13: Overview of Psychophysics, User Studies, and...
ME 327: Design and Control of Haptic Systems Spring 2019
Lecture 13:Overview of Psychophysics, User
Studies, and Statistics
Cara M. NunezStanford University
Reminders
• Paper presentations begin on Thursday
• Attendance for paper presentations is MANDATORY
• Your team wiki page should be updated with checkpoint #1 by Friday, May 25th at 5:00 pm

psychophysics
the scientific study of the relation between stimulus and sensation
• fundamental to psychology• has become fundamental to understanding
haptic devices and virtual environments
More information & sources of figures in this section: Gescheider, “Psychophysics: Method, Theory and Application,” 1984
Stanford University ME 327: Design and Control of Haptic Systems © Allison M. Okamura, 2019

two principal functions
• Descriptive: Involves the specification of sensory capacities
• Analytical: Testing of hypothesis about the underlying biological mechanisms that determine human sensory capacity
Stanford University ME 327: Design and Control of Haptic Systems © Allison M. Okamura, 2019

history• 1879 Wundt (British empiricist) articulated the
idea of senses as key to human understanding
• Simultaneous advances in sensory physiology–Facilitated transition of psychology from a
philosophical to scientific discipline–1860: Fechner published “Elements of
Psychophysics”: techniques for measuring mental events
Stanford University ME 327: Design and Control of Haptic Systems © Allison M. Okamura, 2019

measurement thresholds• “sensory threshold” is a central idea• absolute threshold
–sensitivity–smallest amount of stimulus energy required to produce a sensation
• difference threshold–resolving power–amount of change in the stimulus required to produce a just noticeable difference (JND) in the sensation
Stanford University ME 327: Design and Control of Haptic Systems © Allison M. Okamura, 2019
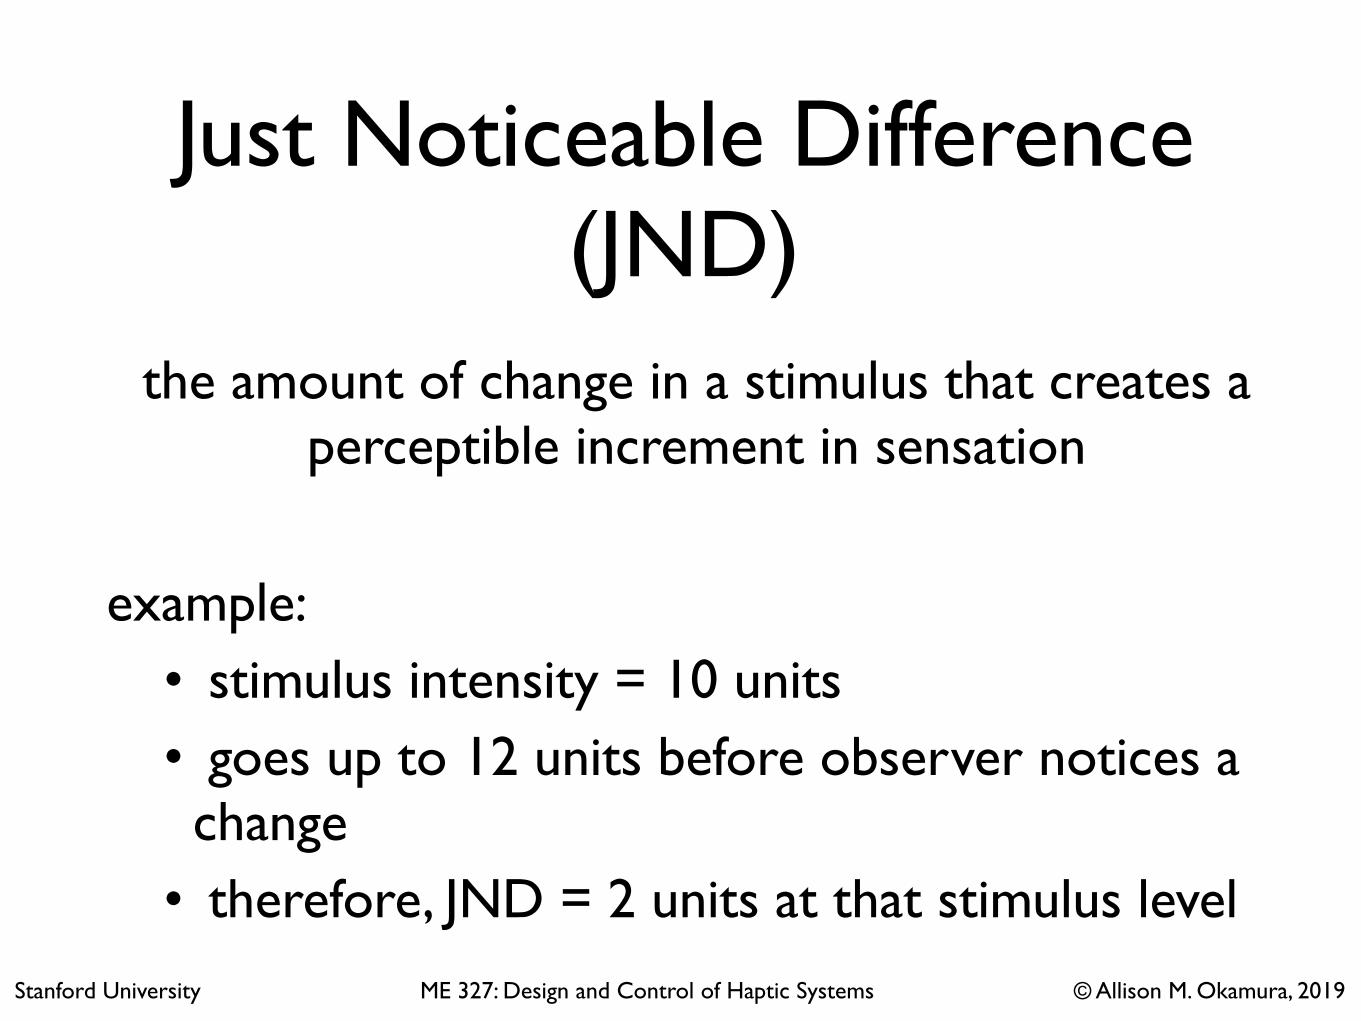
Just Noticeable Difference (JND)
the amount of change in a stimulus that creates a perceptible increment in sensation
example:• stimulus intensity = 10 units• goes up to 12 units before observer notices a change
• therefore, JND = 2 units at that stimulus level
Stanford University ME 327: Design and Control of Haptic Systems © Allison M. Okamura, 2019

sensory dimensions• intensity or magnitude
e.g., amplitude, frequency
• quality or sensory modalitye.g., visual or auditory stimulushaptic: vibration, force, movement
• extensione.g., size, location, separation haptic: bump width, space between bumps
• durationStanford University ME 327: Design and Control of Haptic Systems © Allison M. Okamura, 2019
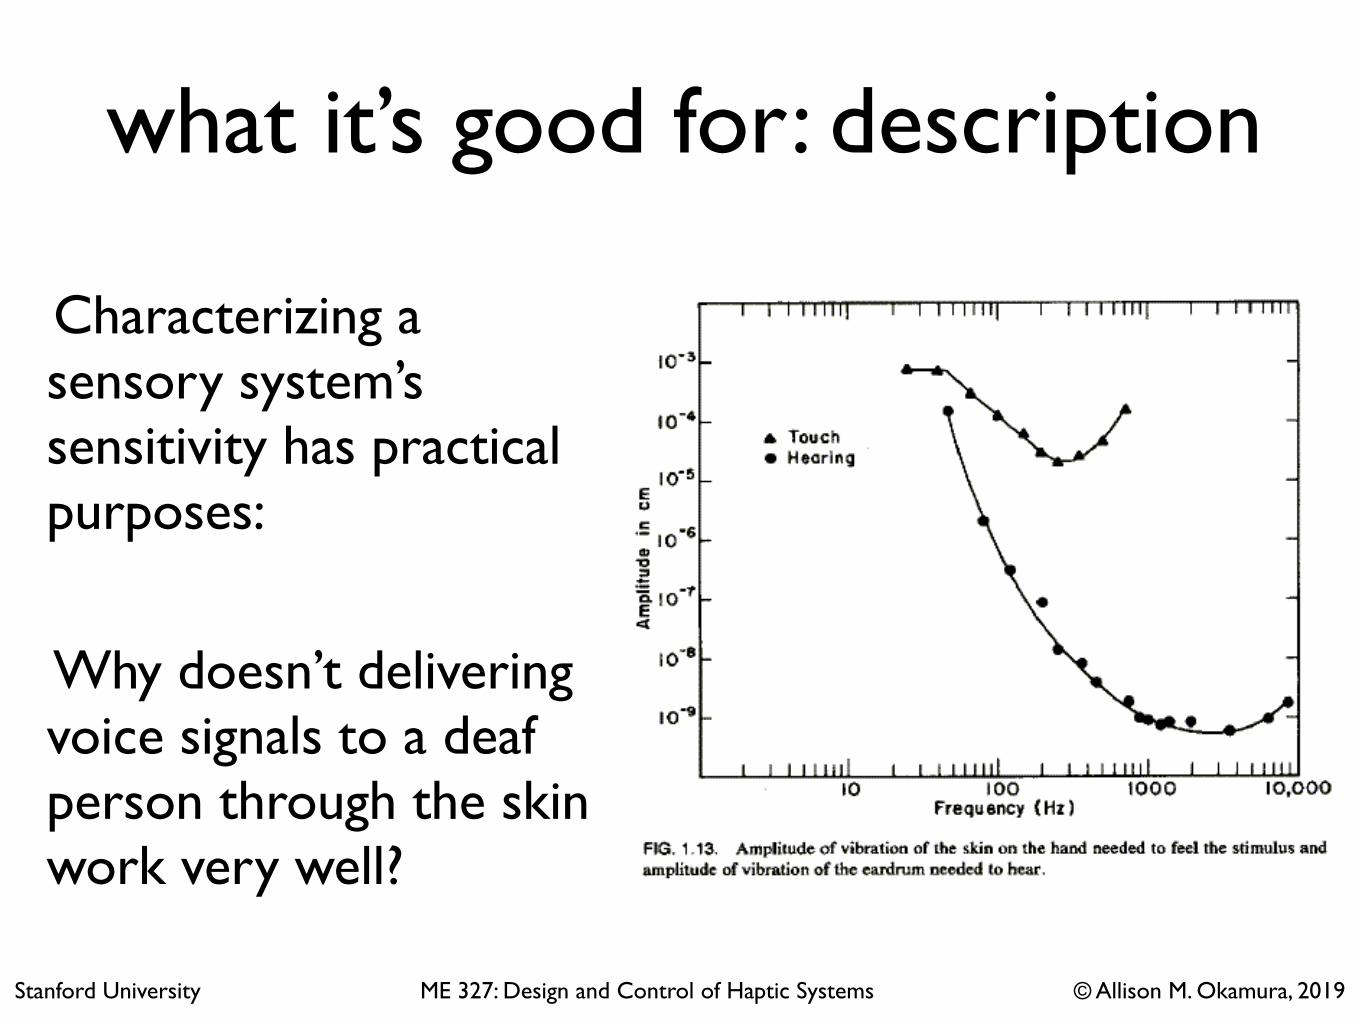
what it’s good for: description
Characterizing a sensory system’s sensitivity has practical purposes:
Why doesn’t delivering voice signals to a deaf person through the skin work very well?
Stanford University ME 327: Design and Control of Haptic Systems © Allison M. Okamura, 2019

psychophysical “laws”
• Empirically derived• Hold true across all senses in many situations
• Many such “laws” existOldest example still has experimental relevance (after almost 200 years!)
Stanford University ME 327: Design and Control of Haptic Systems © Allison M. Okamura, 2019

Weber’s Fraction, 1834 German Physiologist E. H. Weber
Gescheider, 1984
Linear relationship between differential threshold and stimulus intensity
For example: to feel different, 2 heavy weights must differ more than two light weights
Stanford University ME 327: Design and Control of Haptic Systems © Allison M. Okamura, 2019

Weber Fraction
• for weights placed on the skin, the Weber fraction is approximately 1/30
• this provides a useful index of sensory discrimination that can be compared across different conditions and modalities
• however, the WF “law” is not always perfect, especially near the absolute threshold (φ=0)
Stanford University ME 327: Design and Control of Haptic Systems © Allison M. Okamura, 2019

revised Weber’s Lawwhen φ is very close to the absolute threshold, Weber’s fraction increases
Stanford University ME 327: Design and Control of Haptic Systems © Allison M. Okamura, 2019

Gustav Fechner, 1801-1887
…there must be quantitative laws
governing the relations between mental
sensations and body stimuli such that changes
in one correspond to proportional changes in
the other
Stanford University ME 327: Design and Control of Haptic Systems © Allison M. Okamura, 2019

Fechner’s Law, 1860Assumption: All JND’s are equal psychological increments in sensation magnitude, regardless of the size of Δφ
Stanford University ME 327: Design and Control of Haptic Systems © Allison M. Okamura, 2019

Fitts’ Law
For a haptic virtual environment or teleoperation system, you often want to show that you can minimize difficulty via haptic feedback
Fitt’s Law states that the time to acquire a target (T) is a function of the distance to (D) and size (W) of the target
D
W
Stanford University ME 327: Design and Control of Haptic Systems © Allison M. Okamura, 2019
index of difficulty

psychophysical methods
methods for determining sensory thresholds:
• method of limits (and staircase method)• method of constant stimuli• method of adjustment
Stanford University ME 327: Design and Control of Haptic Systems © Allison M. Okamura, 2019
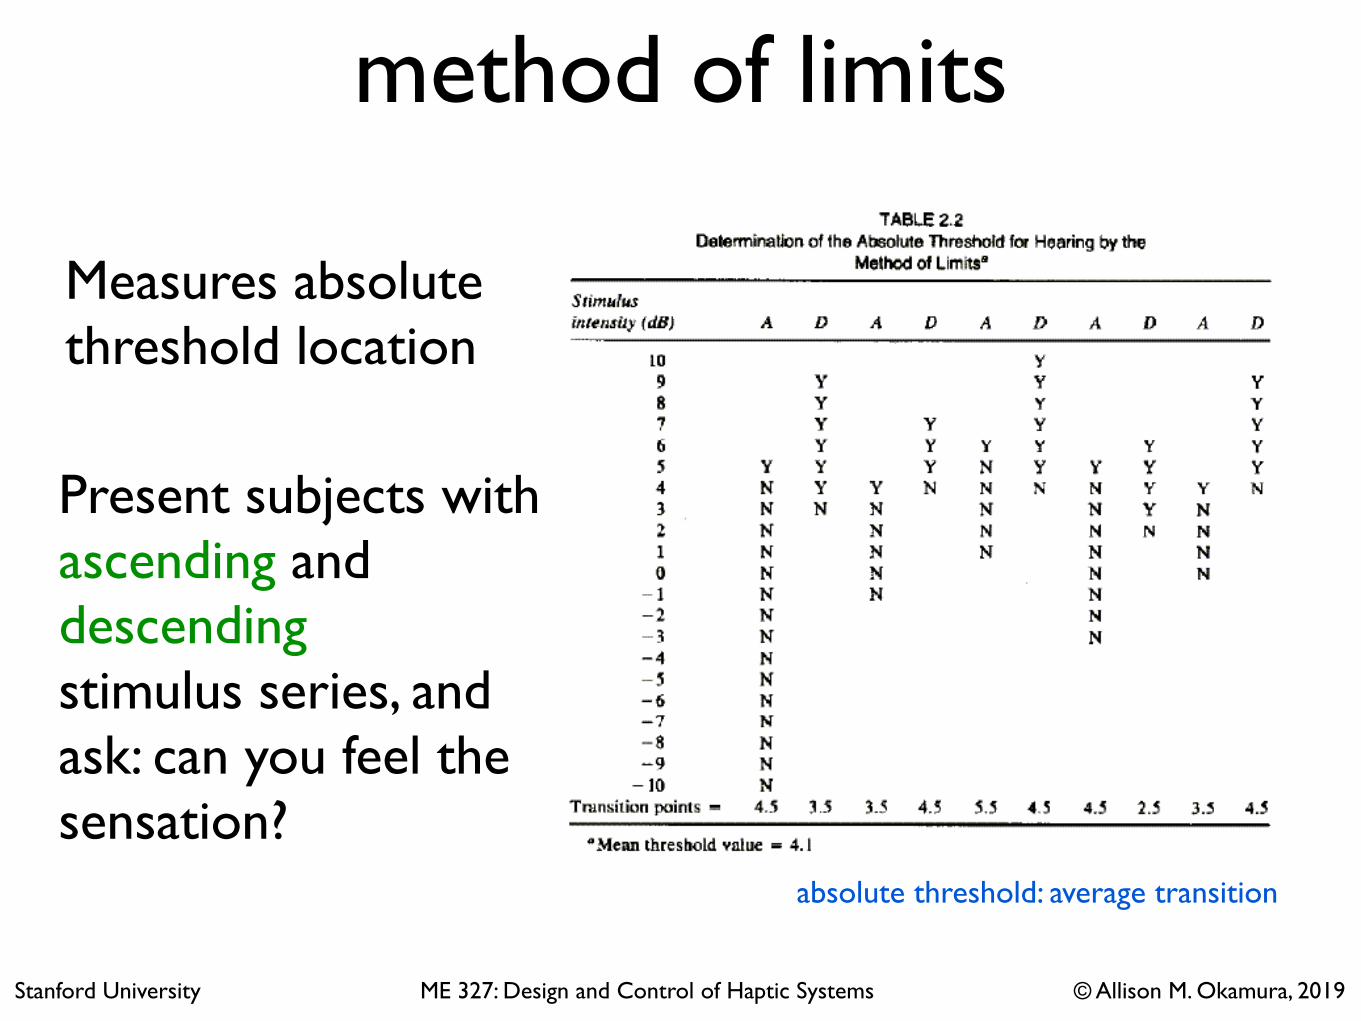
method of limits
Measures absolute threshold location
Present subjects with ascending and descendingstimulus series, and ask: can you feel the sensation?
Stanford University ME 327: Design and Control of Haptic Systems © Allison M. Okamura, 2019
absolute threshold: average transition
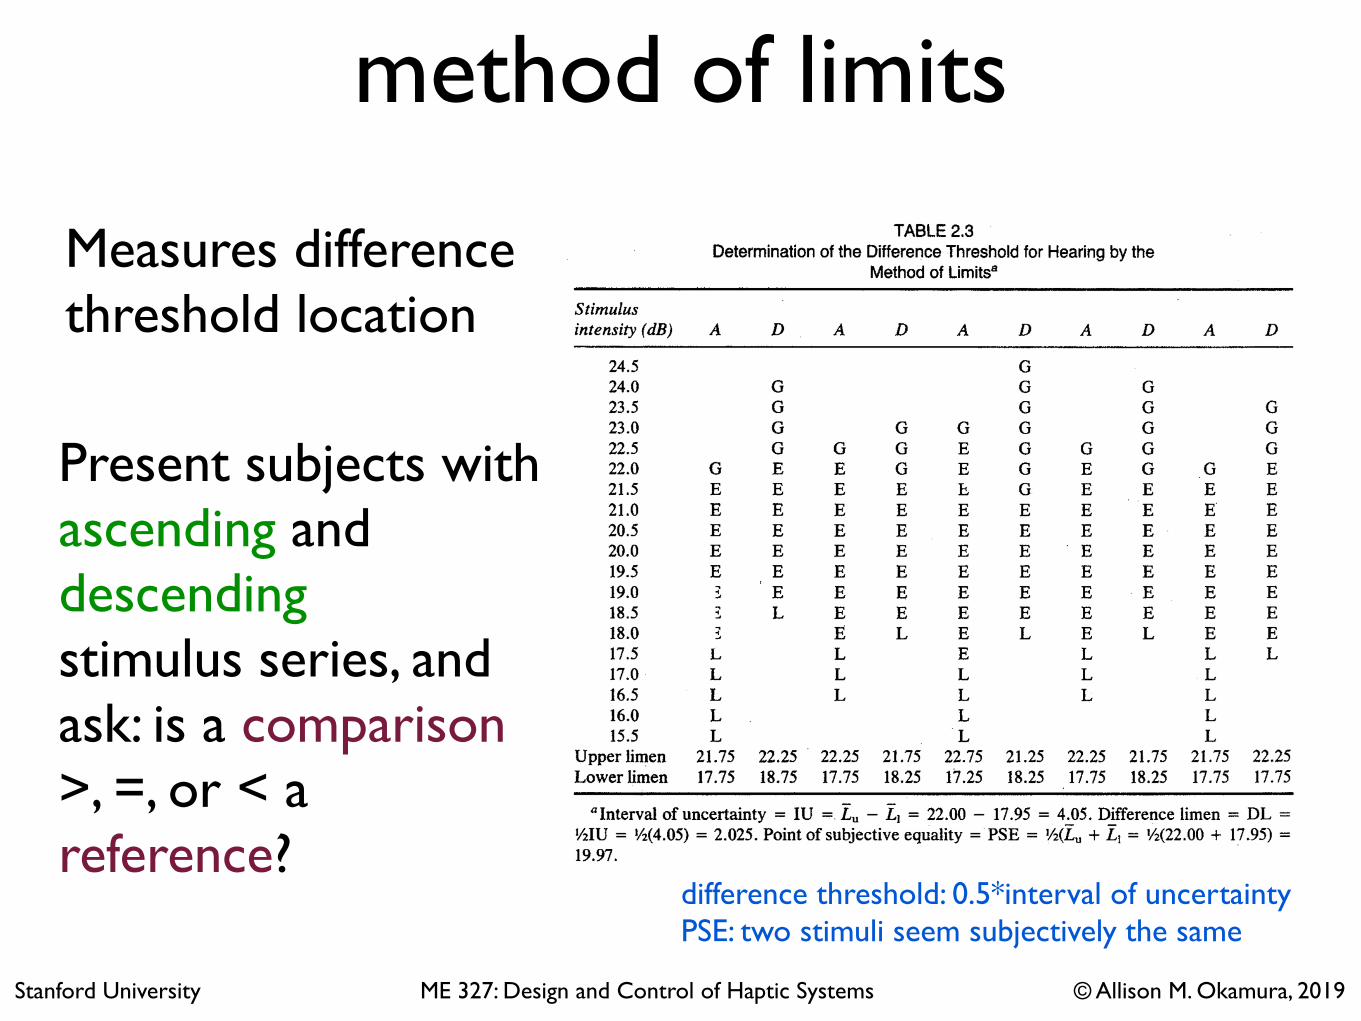
method of limits
Measures difference threshold location
Present subjects with ascending and descendingstimulus series, and ask: is a comparison >, =, or < a reference?
Stanford University ME 327: Design and Control of Haptic Systems © Allison M. Okamura, 2019
difference threshold: 0.5*interval of uncertaintyPSE: two stimuli seem subjectively the same

staircase method(Modified Method of Limits)
! Begin with high-intensity stimulus
! Intensity is reduced until observer makes error
! Stimulus intensity reverses until subject detects stimulus
! Reversal values averaged! Multiple staircase methods: step size up/down increments double staircase
H. Levitt, “Transformed Up-Down Methods in Psychoacoustics,” The Journal of the Acoustical Society of America, vol. 49, 1971, pp. 467-477.
Stanford University ME 327: Design and Control of Haptic Systems © Allison M. Okamura, 2019

example study
Yes No
X, Indentation depth (m
m)
1
2
3
4
n Reversal 1
Reversal 2
dB = 2 dB = 1 dB = 0.5
“Staircase” Tracking Algorithm
indentation depth defined by:
! subjects trained with 5 models! initial indentation is random, below threshold! trial ends when last 10 indentations are within 2 dB! indentation depth required for detection is mean of
last five indentation values
Finger fixed in placewith dental gum
Model held at target depth for 500 ms.
Stanford University ME 327: Design and Control of Haptic Systems © Allison M. Okamura, 2019

method of constant stimuli
• repeat same 5-9 stimuli• randomly present each ~100x• detect stimulus? (Y/N)• percent of positive responses calculated for each stimulus intensity• fit curve to get psychometric function (usually s-shaped)• advantage: subject can not predict level of next stimulus intensity
(removes errors of habituation and expectation)
Absolute threshold location at 50%
JND between 25% and 75%
Stanford University ME 327: Design and Control of Haptic Systems © Allison M. Okamura, 2019

method of adjustment
gives absolute and difference threshold
locations
! set stimulus intensity far above or below threshold! subject “tunes” stimulus intensity to:
! be perceptible (absolute threshold)! match a reference stimulus (difference threshold)
! mean = subjective equality! difference threshold = standard deviation
Stanford University ME 327: Design and Control of Haptic Systems © Allison M. Okamura, 2019
perceptual and performance experiments
not all haptic experiments are psychophysical experiments...
some are perceptual (i.e., they ask different questions about perception)
some are related to user performance
Stanford University ME 327: Design and Control of Haptic Systems © Allison M. Okamura, 2019

designing user studies
Stanford University ME 327: Design and Control of Haptic Systems © Allison M. Okamura, 2019

human subjects experiments
• types: - system performance- psychophysics- ergonomics
• experiment design considerations
• Institutional Review Board (IRB)
Stanford University ME 327: Design and Control of Haptic Systems © Allison M. Okamura, 2019

types of haptics human subjects experiments
• system performance: measures human-machine system performance, typically during execution of a specific task
• psychophysics: measures fundamental human capabilities
• ergonomics: measures comfort or effect of system on human health
Stanford University ME 327: Design and Control of Haptic Systems © Allison M. Okamura, 2019
experiment design considerations
• length of experiment/user fatigue
• location
• subject recruiting (payment?)
• statistical significance (number of users, groups)
• reliability of data; confounding factors
• what constitutes data you can “throw out”?Stanford University ME 327: Design and Control of Haptic Systems © Allison M. Okamura, 2019
consider the study you want to do and ask…
• who are your subjects and how would you recruit them?
• where would you perform the study?
• what do you want to discover? (what is the hypothesis or research question)?
• what would the protocol be?
• what would the performance metrics be?
• how would you acquire and analyze the data?
Stanford University ME 327: Design and Control of Haptic Systems © Allison M. Okamura, 2019

experiment procedure• develop a strict experimental procedure (called a
protocol)
• develop a very clear set of instructions for your subjects (written, oral, video)
• develop a questionnaire of relevant information about your subjects
• submit an IRB application; receive approval
• perform experiment and analyze data; document thoroughly (save records)
Stanford University ME 327: Design and Control of Haptic Systems © Allison M. Okamura, 2019

general experiment planning• 6 weeks or more before experiment:
- do human subjects training - write IRB application and edit
• 5 weeks (or more): - submit IRB application
• 2 weeks (or more): - have complete system working - go through procedure with "expert" subject - revise experiment (get pilot data and modify system parameters as needed)
• 1 week (or more): - end out recruitment notices and schedule subjects
Stanford University ME 327: Design and Control of Haptic Systems © Allison M. Okamura, 2019
experiment design
Stanford University ME 327: Design and Control of Haptic Systems © Allison M. Okamura, 2019

Main design types• Within Subjects: Each subject does each experimental
condition, in pseudo-random order. Because individuals vary significantly on their haptic capabilities, most haptic human factors experiments are done this way. Include a practice session to minimize effects of order.
• Between Subjects: Different subjects experience different conditions. This is often useful when novelty or experience are highly important, prohibiting subjects from doing the experiment more than once, or when each subject’s participation time is limited.
• Mixed: a combination of the above.
Stanford University ME 327: Design and Control of Haptic Systems © Allison M. Okamura, 2019
Also…
• After independent variables are selected, you need to select your dependent variables, the quantities you will measure.
• Look at both mean values and variations across trials and across subjects. Use statistics to determine the probability that observed trends were due to chance. We often say that a finding is significant if we find p < 0.05.
• Objective vs. Subjective: both are often used in haptics.
Stanford University ME 327: Design and Control of Haptic Systems © Allison M. Okamura, 2019

Design steps & considerations
1. Define hypothesis and objectives
2. Define factors to be studied
3. Define dependent variable
4. Define population and sampling method
Randomization
Non-representative population
Balanced vs. Unbalanced samples
5. Define appropriate approach for data analysis
Stanford University ME 327: Design and Control of Haptic Systems © Allison M. Okamura, 2019

statistical analysis
Stanford University ME 327: Design and Control of Haptic Systems © Allison M. Okamura, 2019
statistics topics
• basic statistics
• ANOVA
• post-hoc tests
• case studies
Stanford University ME 327: Design and Control of Haptic Systems © Allison M. Okamura, 2019

t-test
the t-test assesses whether the means of two groups are statistically different from each other
Stanford University ME 327: Design and Control of Haptic Systems © Allison M. Okamura, 2019
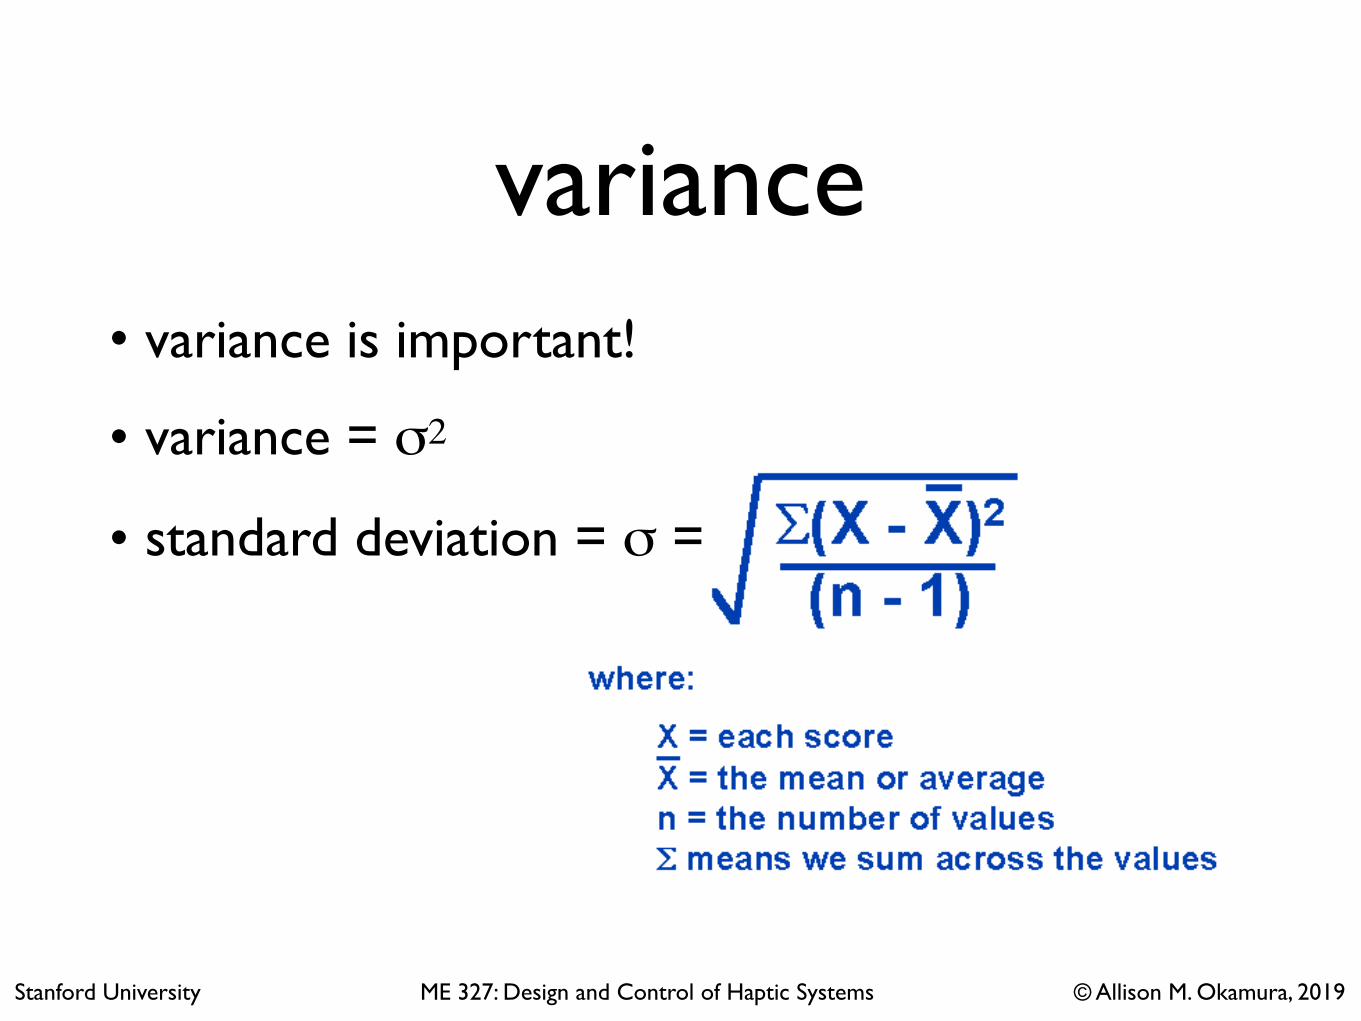
variance• variance is important!
• variance = σ2
• standard deviation = σ =
Stanford University ME 327: Design and Control of Haptic Systems © Allison M. Okamura, 2019

difference between means
it is easier to tell two groups apart when there is low variability
Stanford University ME 327: Design and Control of Haptic Systems © Allison M. Okamura, 2019
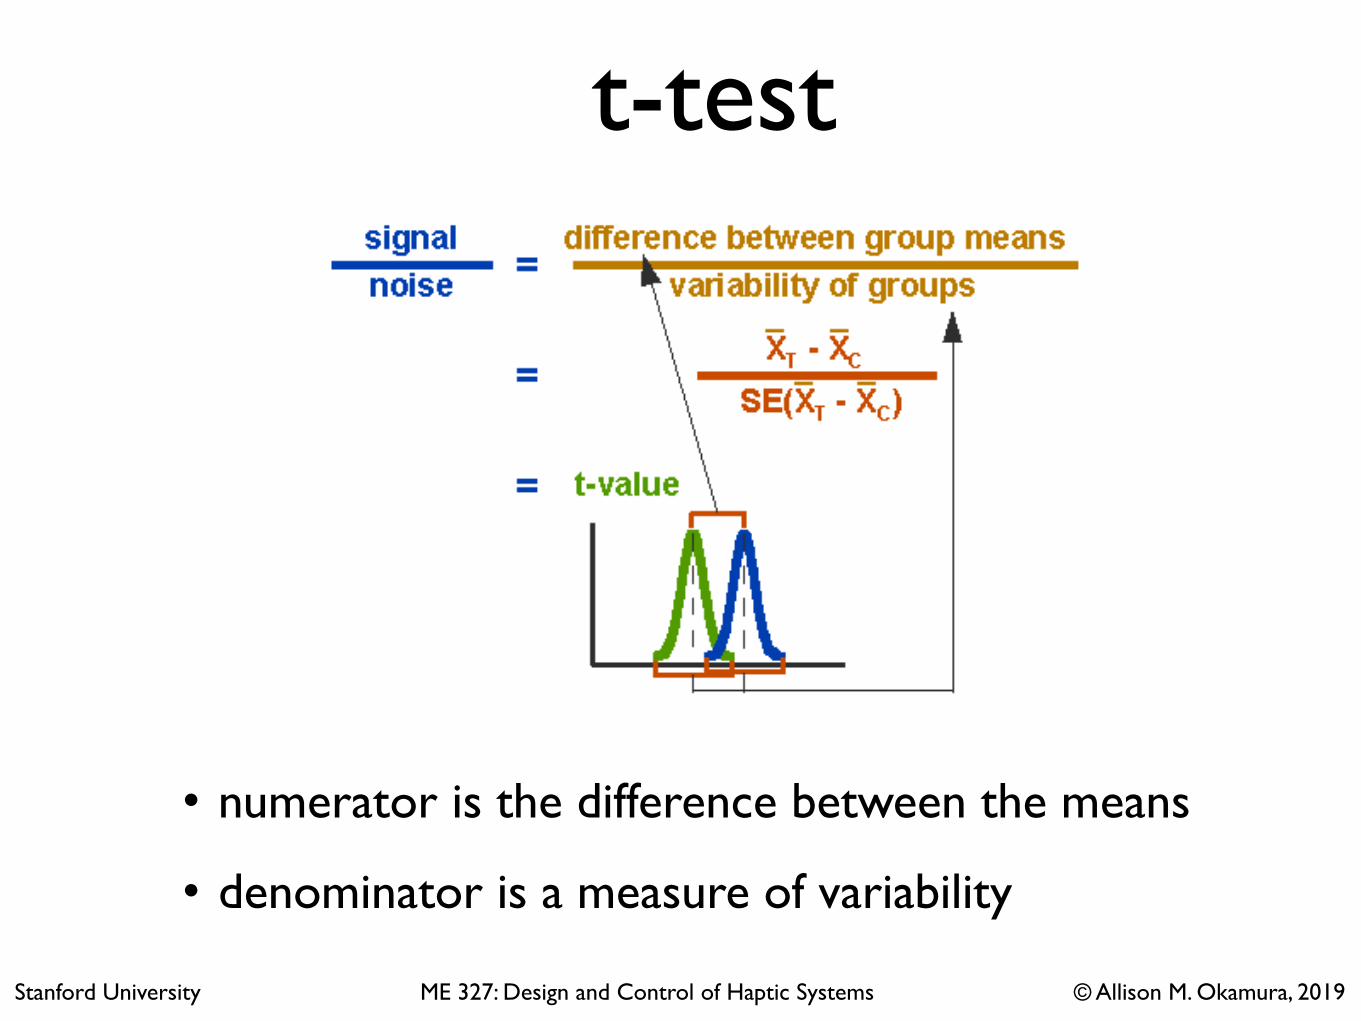
t-test
• numerator is the difference between the means
• denominator is a measure of variability
Stanford University ME 327: Design and Control of Haptic Systems © Allison M. Okamura, 2019
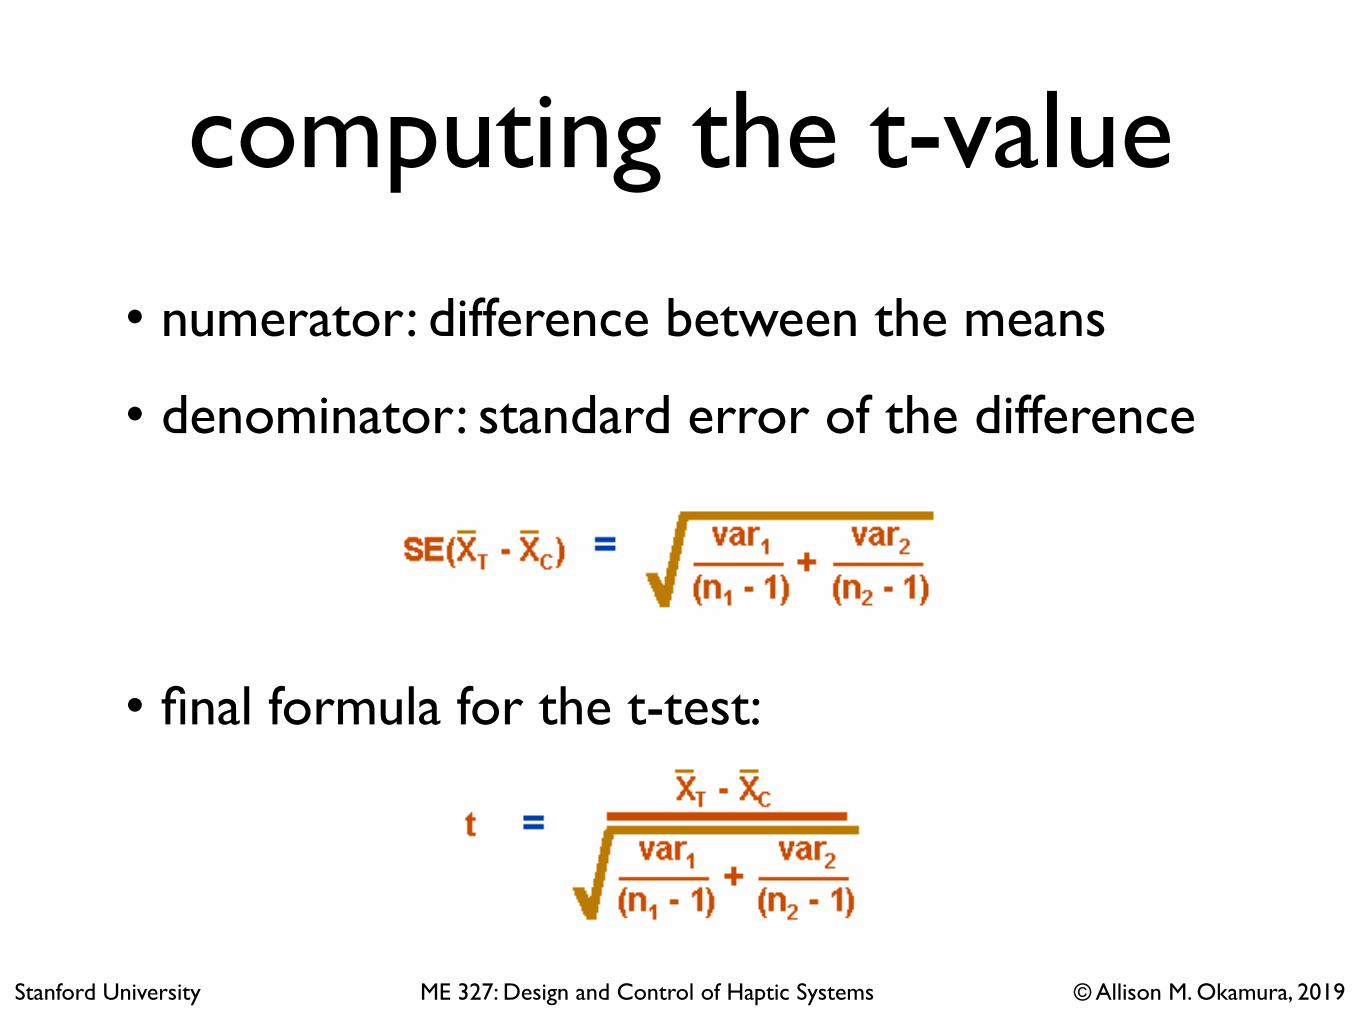
computing the t-value
• numerator: difference between the means
• denominator: standard error of the difference
• final formula for the t-test:
Stanford University ME 327: Design and Control of Haptic Systems © Allison M. Okamura, 2019

interpreting the results• the t-value will be positive or negative depending on which
mean is larger
• look up the t-value in a table of significance (if you don’t have a computer program that does this!)
– set a risk level (called alpha level or p-value, the rule of thumb is α = 5% or p-value = 0.05)
– need to know the degrees of freedom (e.g., sum of the persons in both groups minus 2)
• for significant difference, the absolute value of the calculated t-value must be greater than the one found from the table
Stanford University ME 327: Design and Control of Haptic Systems © Allison M. Okamura, 2019
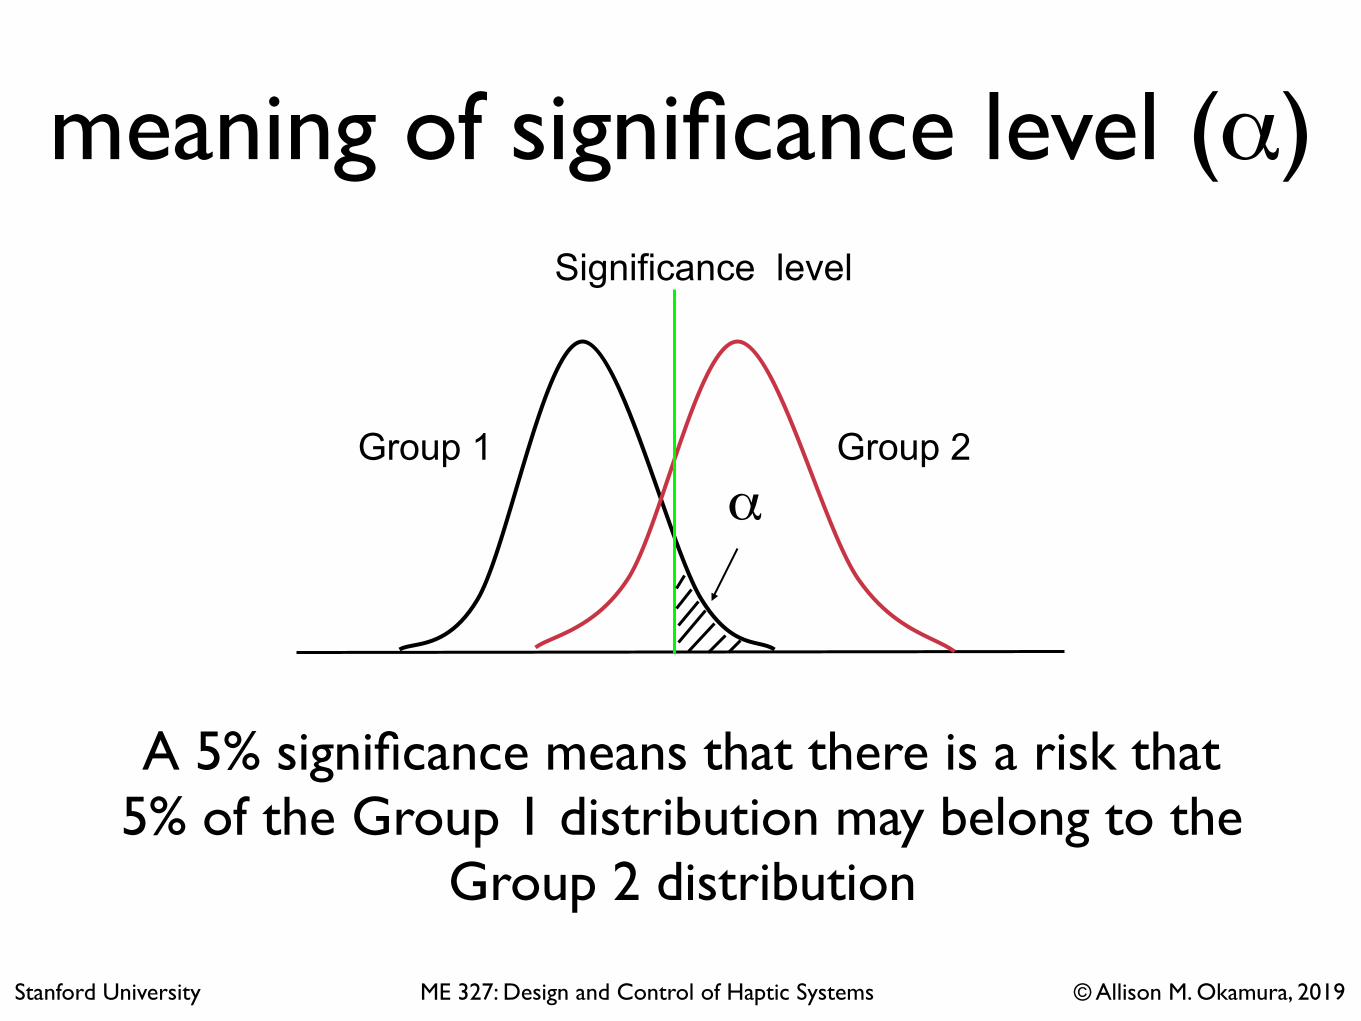
meaning of significance level (α)Significance level
αGroup 1 Group 2
A 5% significance means that there is a risk that 5% of the Group 1 distribution may belong to the
Group 2 distribution
Stanford University ME 327: Design and Control of Haptic Systems © Allison M. Okamura, 2019
ANOVA (analysis of variance)
• also known as F-test
• allows comparisons of the means of two or more groups (unlike only two in t-test)
• tells only that there is a significant difference within the groups but not which groups are significant different from one another
• needs post-hoc test for comparison between groups
Stanford University ME 327: Design and Control of Haptic Systems © Allison M. Okamura, 2019

ANOVA assumptions• Normal distributions and homogeneity of variance.
Therefore, in a one-factor ANOVA, it is assumed that each of the populations is normally distributed with the same variance (σ2).
• In between-subjects analyses, it is assumed that each score is sampled randomly and independently. Research has shown that ANOVA is "robust" to some violations of its assumptions.
• ANOVA tends to be conservative when its assumptions are violated.
Stanford University ME 327: Design and Control of Haptic Systems © Allison M. Okamura, 2019

ANOVA: Terminology• response variable (dependent variable): the primary variable of
interest measured in the experiment
• factor (independent variable, predictor variable): variable that has an effect on the measurement of the response variable
• factor levels (treatment level): the particular values that a factor can have
• two types of factors:
– fixed-effect: factor which its levels included in the study are the only levels of interest or maybe the only possible levels (ex. marital status)
– random-effect: factor which its levels included in the study are not the only ones we are interested in making inferences about (ex. users)
Stanford University ME 327: Design and Control of Haptic Systems © Allison M. Okamura, 2019

error types
Type I error (α error): Error of finding a significance by chance when there is no significance in the data
Type II error (β error): Error of rejecting a significance when in fact there is a significance in the data
Significance level
αGroup 1 Group 2
β
Stanford University ME 327: Design and Control of Haptic Systems © Allison M. Okamura, 2019
what are we testing?
• null Hypothesis
• similar to the t-value in t-test, in ANOVA we calculate an F-value
• the null hypothesis is rejected if the F-value is above the critical F-value at a chosen level of significance (p) => at least one mean is significantly different.
• we normally choose p = 0.05
Stanford University ME 327: Design and Control of Haptic Systems © Allison M. Okamura, 2019

what is the F-value?
Similar to t-value, F-value measures the signal-to-noise ratio in terms of variance
if the null hypothesis is true (no difference in the means), then F = 1
for significant difference, F > 1 F is always a positive number
Stanford University ME 327: Design and Control of Haptic Systems © Allison M. Okamura, 2019

statistics software
• S-Plus, SPSS
• Matlab (statistics toolbox)
• Excel (Additional installation may be required)
Stanford University ME 327: Design and Control of Haptic Systems © Allison M. Okamura, 2019

case study:Augmentation of Stiffness
Perception using Skin Stretch Feedback
Stanford University ME 327: Design and Control of Haptic Systems © Allison M. Okamura, 2019
Zhan Fan Quek, Samuel Schorr, Ilana Nisky, Allison Okamura (Stanford),
and William Provancher (Utah)
Z.F. Quek, S. B. Schorr, I. Nisky, A. M. Okamura and W. R. Provancher. Sensory Augmentation of Stiffness using Fingerpad Skin Stretch. In IEEE World Haptics Conference, pages 467-472, 2013.

Motivation
Interaction with objects of different stiffness using a stylus results in different amount of fingerpad skin stretch.
Can we increase the perception of stiffness of an object by rendering additional skin stretch cues?
Stanford University ME 327: Design and Control of Haptic Systems © Allison M. Okamura, 2019
Experiment 1
Hypothesis
Rendering skin stretch in conjunction with force feedback will increase the perception of rendered stiffness
Procedure
Method of Constant Stimuli
Stanford University ME 327: Design and Control of Haptic Systems © Allison M. Okamura, 2019

1-DoF Skin Stretch Device
Stanford University ME 327: Design and Control of Haptic Systems © Allison M. Okamura, 2019
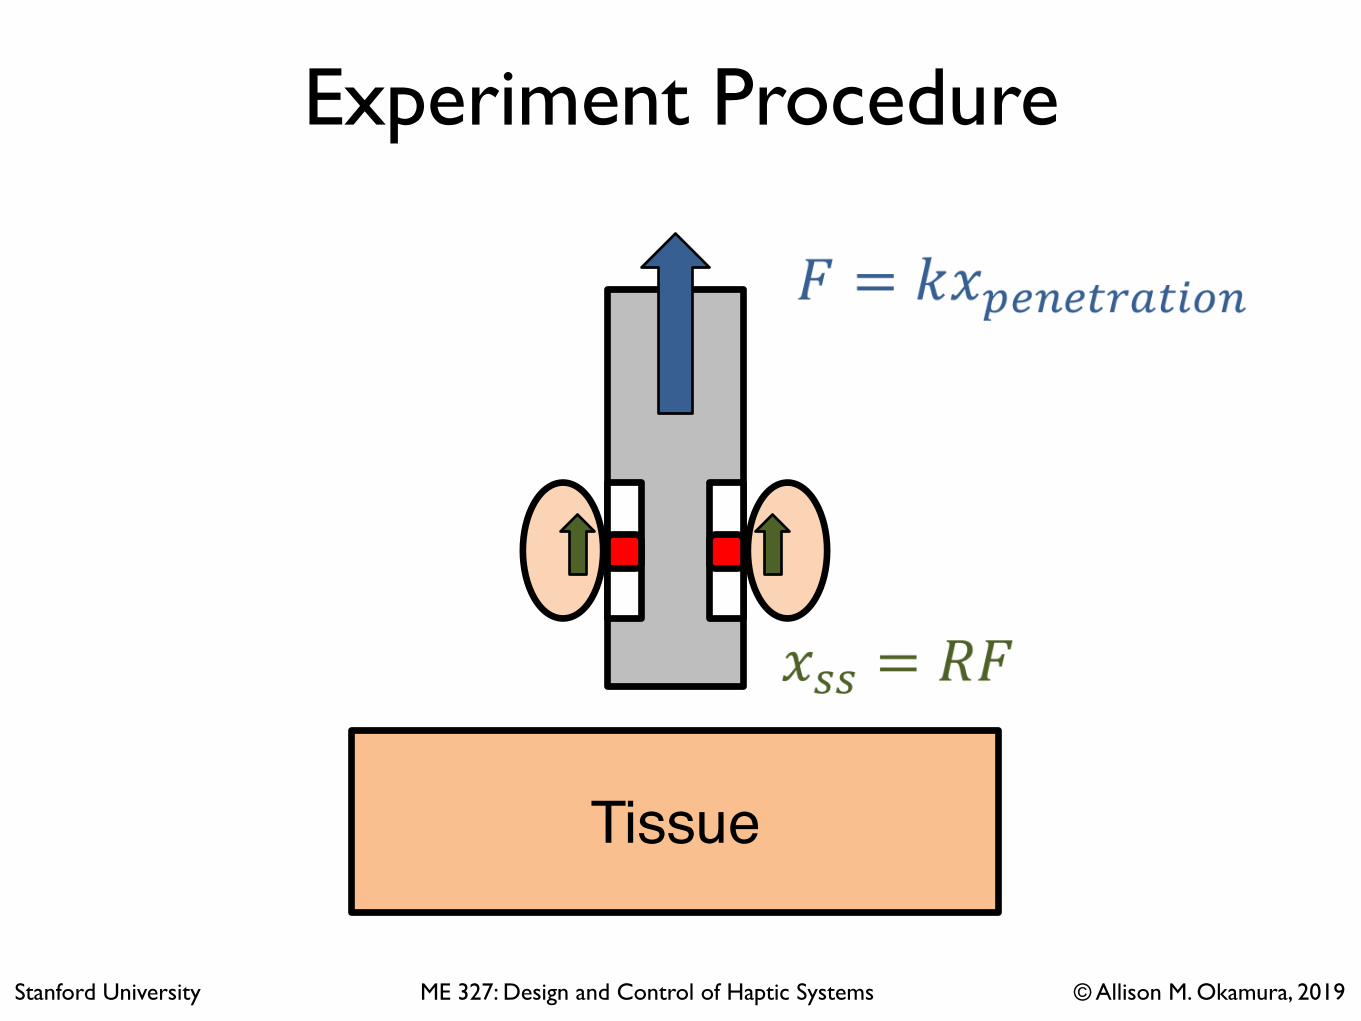
Experiment Procedure
Tissue
Stanford University ME 327: Design and Control of Haptic Systems © Allison M. Okamura, 2019
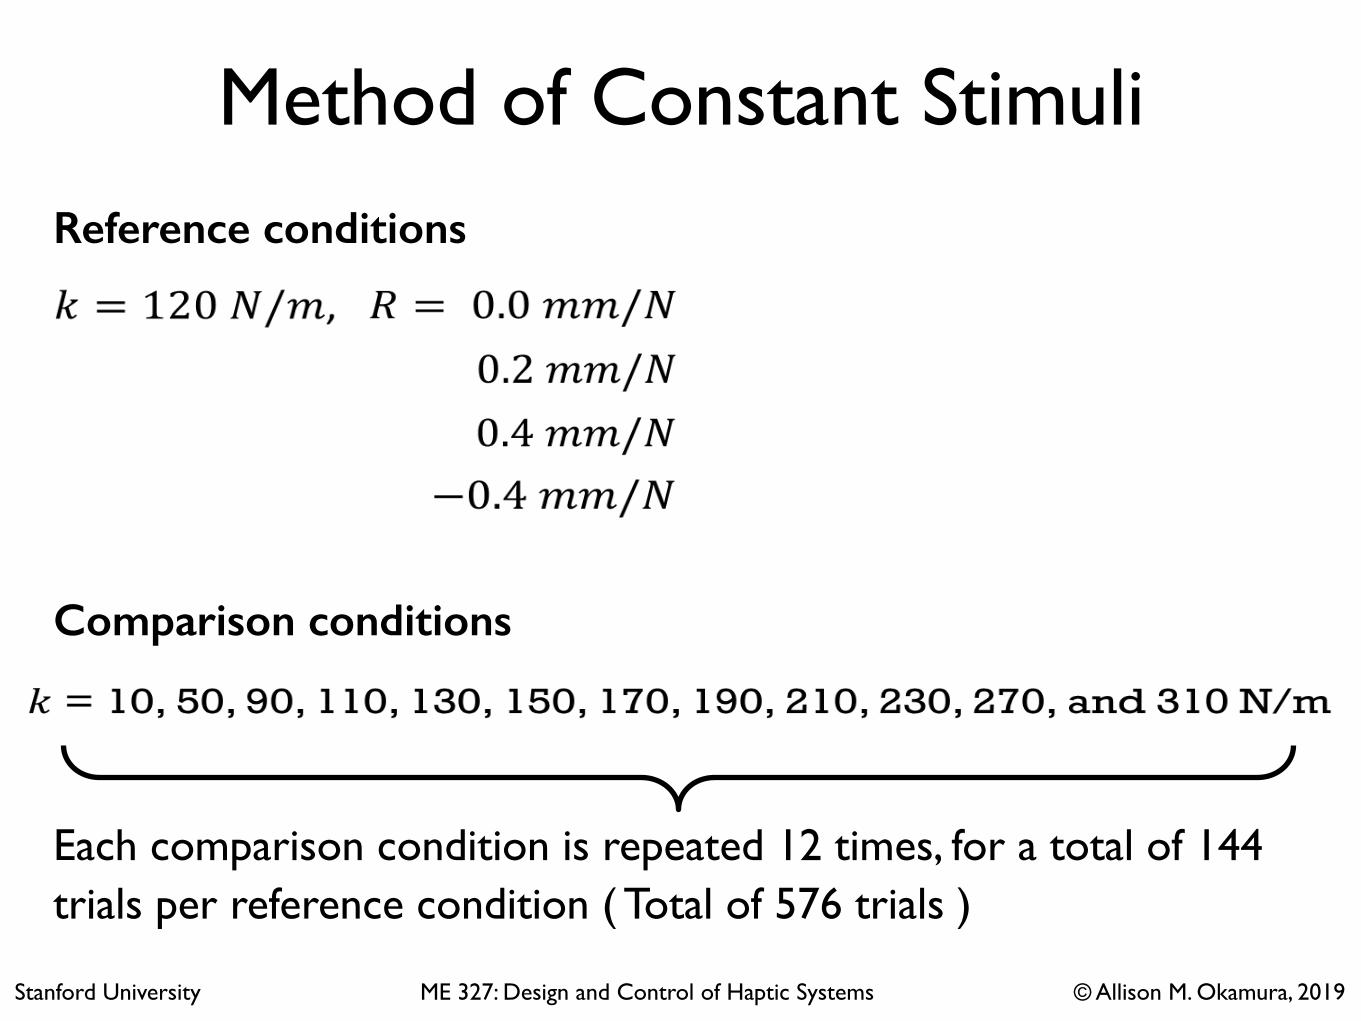
Method of Constant StimuliReference conditions
Comparison conditions
Each comparison condition is repeated 12 times, for a total of 144 trials per reference condition ( Total of 576 trials )
Stanford University ME 327: Design and Control of Haptic Systems © Allison M. Okamura, 2019

Method of Constant Stimuli
• Psignifit (an externally downloaded MATLAB toolbox) is used to generate the psychometric curve
• Point of Subjective Equality (PSE) is used to determine the shift in stiffness perception
Stanford University ME 327: Design and Control of Haptic Systems © Allison M. Okamura, 2019
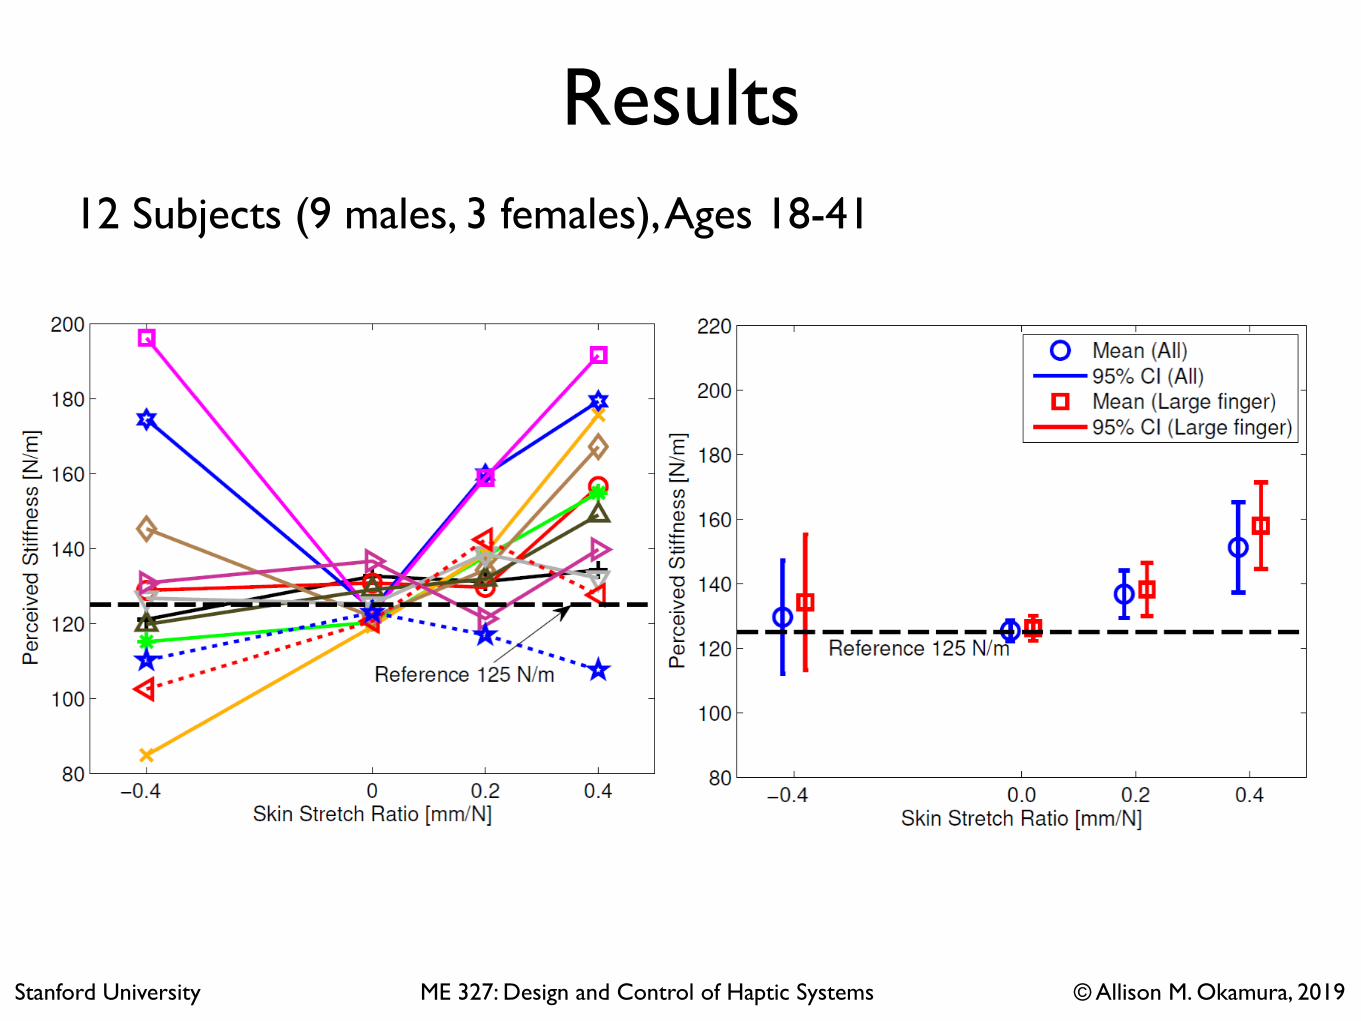
Results12 Subjects (9 males, 3 females), Ages 18-41
Stanford University ME 327: Design and Control of Haptic Systems © Allison M. Okamura, 2019

Results - Analysis
Stanford University ME 327: Design and Control of Haptic Systems © Allison M. Okamura, 2019
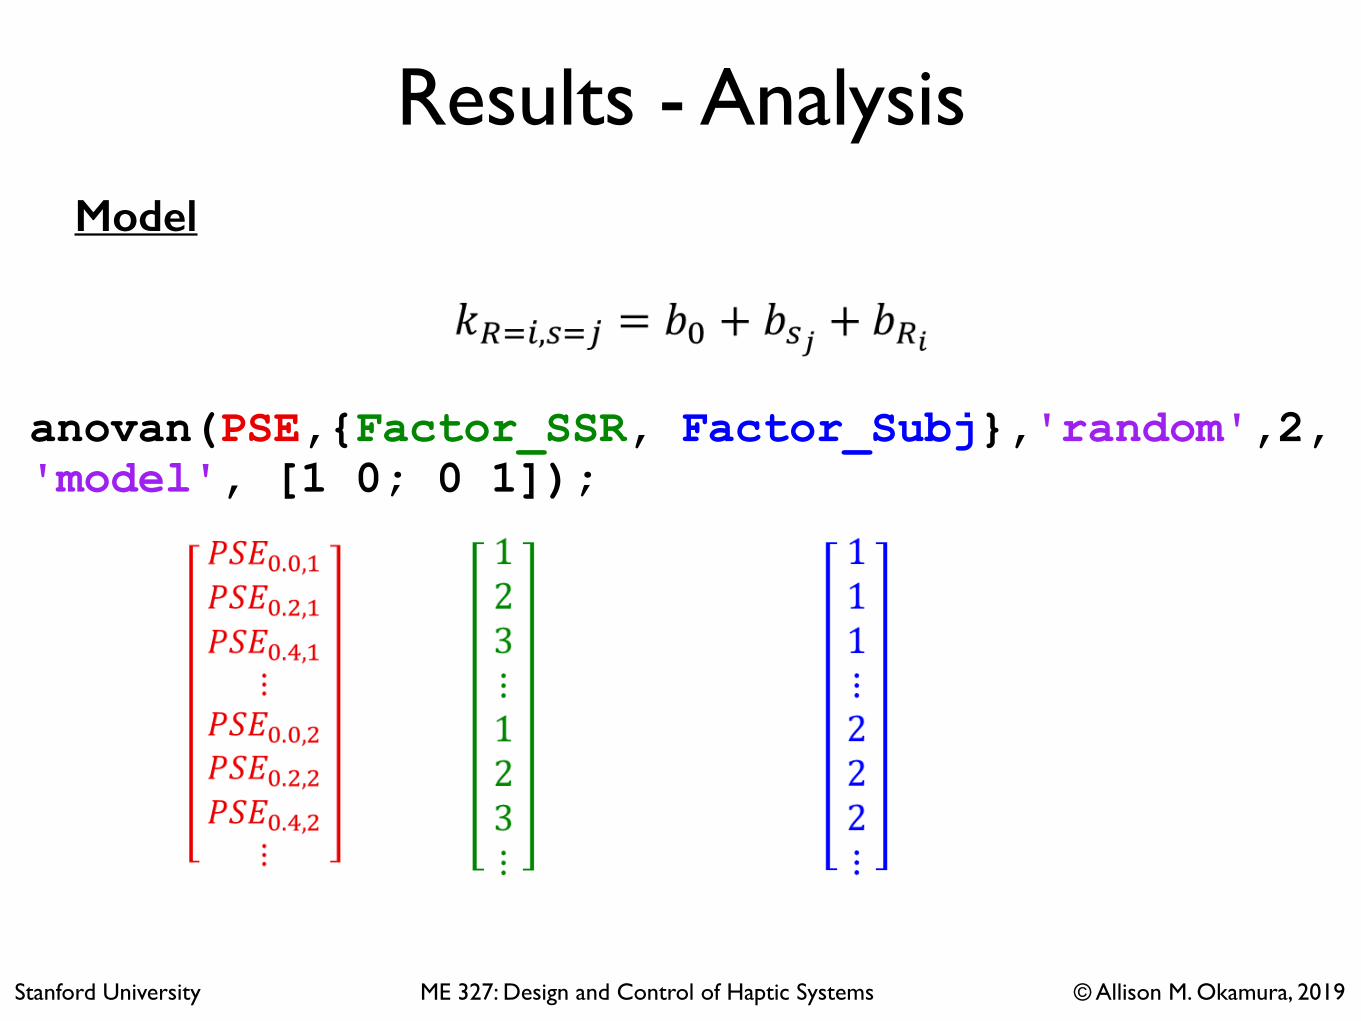
Results - Analysis
anovan(PSE,{Factor_SSR, Factor_Subj},'random',2, 'model', [1 0; 0 1]);
Model
Stanford University ME 327: Design and Control of Haptic Systems © Allison M. Okamura, 2019
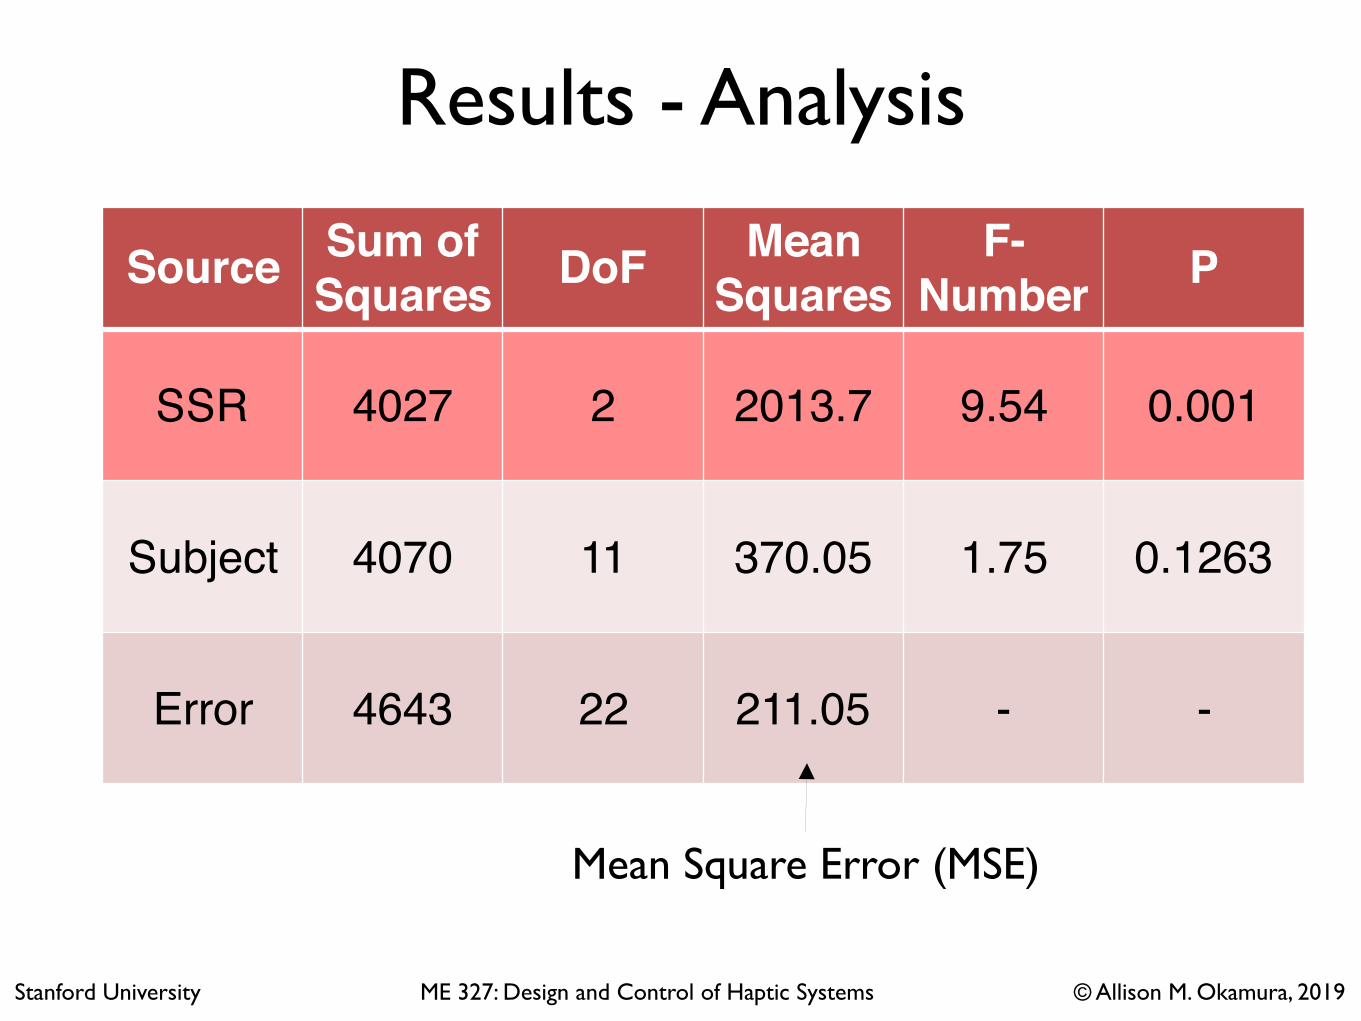
Results - Analysis
Source Sum of Squares DoF Mean
SquaresF-
Number P
SSR 4027 2 2013.7 9.54 0.001
Subject 4070 11 370.05 1.75 0.1263
Error 4643 22 211.05 - -
Mean Square Error (MSE)
Stanford University ME 327: Design and Control of Haptic Systems © Allison M. Okamura, 2019

Results - Analysis
MSE from ANOVA results
ME 327
Results - Analysis
• Performed post-hoc comparison of mean between groups
• Using Bonferroni correction - effect is significant if 𝑝𝑝 < 0.05𝑝𝑝
Post-hocanalysis Size of effect 𝒕𝒕𝟐𝟐𝟐𝟐 𝒑𝒑
𝜇𝜇0.2 > 𝜇𝜇0.0 11.33 2.7 0.0065𝜇𝜇0.4 > 𝜇𝜇0.2 14.52 3.5 0.0011𝜇𝜇0.4 > 𝜇𝜇0.0 25.84 6.2 < 0.001
𝑡𝑡0.2,0.0 =𝜇𝜇0.2 − 𝜇𝜇0.0
𝑀𝑀𝑆𝑆𝐸𝐸𝑛𝑛
MSE from ANOVA results
12
Stanford University ME 327: Design and Control of Haptic Systems © Allison M. Okamura, 2019