Leasing in Latin America - The Alta Group...76 71 5 Banco Supervielle Bank Argentina 133,291 $...
15
Rafael Castillo-Triana August 26, 2018 WLY 2018 Page 1 Leasing in Latin America Getting Ready to a New Normal
Transcript of Leasing in Latin America - The Alta Group...76 71 5 Banco Supervielle Bank Argentina 133,291 $...

Rafael Castillo-Triana August 26, 2018
WLY 2018 Page 1
Leasing in Latin America
Getting Ready to a New Normal

Rafael Castillo-Triana August 26, 2018
WLY 2018 Page 2
2017 in perspective The leasing industry grew 5 times more than the
Economy
As a maturing industry, Leasing in Latin America has managed to keep
growing over the whole Latin American economy. While the industry prepares to a
disruptive change fueled, among other things, by the new Lease Accounting
Standards, namely IFRS-16 and ASC-842 (for companies subjected to US GAAP),
most of the current players exhibit resiliency, in particular independent Lessors.
Table 1:Evolution of Leasing Portfolios in Latin America 2014-2017
Of course that not all countries have managed the same level of activity.
Clearly, leasing industries across the countries surveyed by The Alta Group, can be
differentiated: Honduras, Mexico and Colombia are certainly the stars. In other
countries, such as Chile and Peru, the industry is growing less but this is due to the
necessary shift from markets dominated by finance leases to emerging players in
COUNTRY/PAISUSD$000
PORTFOLIO 2014
USD$000
PORTFOLIO 2015
USD$000
PORTFOLIO 2016
USD$000
PORTFOLIO 2017
2017
MARKET
SHARE
GROWTH 17/16 GROWTH 16/15 GROWTH 15/14
Mexico $13,837,222.64 $13,474,671.33 $15,024,128.00 $21,381,475.00 32.23% 42.31% 11.50% -2.60%
Colombia $13,147,579.47 $12,963,375.27 $13,598,748.09 $15,818,784.00 23.85% 16.33% 4.90% -1.40%
Chile $10,135,241.41 $8,945,312.45 $10,470,480.60 $12,651,428.00 19.07% 20.83% 17.00% -11.70%
Brazil $9,765,994.06 $8,204,452.33 $7,324,131.62 $8,250,641.00 12.44% 12.65% -10.70% -16.00%
Peru $8,463,599.40 $6,656,347.06 $6,102,346.31 $6,031,735.00 9.09% -1.16% -8.30% -21.40%
Argentina $1,551,466.21 $1,242,237.55 $1,136,693.87 $903,930.00 1.36% -20.48% -8.50% -19.90%
Puerto Rico $599,286.18 $609,423.11 $730,925.53 $730,125.00 1.10% -0.11% 19.90% 1.70%
Costa Rica $698,715.51 $538,061.50 $584,355.46 $484,920.00 0.73% -17.02% 8.60% -23.00%
Guatemala $109,279.28 $128,784.85 $132,200.36 $86,601.00 0.13% -34.49% 2.70% 17.80%
Venezuela $329,990.76 $386,927.32 $286,590.67 $0.00 0.00% -100.00% -25.90% 17.30%
Ecuador $112,605.22 $89,187.81 $92,877.97 $0.00 0.00% -100.00% 4.10% -20.80%
Bolivia $69,895.49 $64,868.88 $80,067.81 $0.00 0.00% -100.00% 23.40% -7.20%
Honduras $ - $ - $22,027.90 $0.00 0.00% -100.00%
TOTAL $58,820,875.64 $53,303,649.48 $55,585,574.20 $66,339,639.00 100.00% 19.35% 4.28% -9.38%

Rafael Castillo-Triana August 26, 2018
WLY 2018 Page 3
operating leases. Brazil already made that transition and for that reason, it is
showing growth again. The transition in Brazil has shown the virtual abandonment
of finance and operating leasing banks, while commercial, operating lessors
(“Locadoras”) are gaining importance and growing in the marketplace.
Indeed, the leasing industry in general grew much faster than the national
economies measured by their corresponding Gross Domestic Product. Figure 2
illustrates that in each country.
Argentina is an interesting case of an emerging player. Its industry is
growing trying to catch up in terms of its penetration of leases over GDP. The
industry counts with first class leadership, but it is facing great macroeconomic
headwinds. However, its trend line is good.
Figure 1: What grows better: The Economy or Leasing within?
-15.6% 0.0% 15.6% 31.3% 46.9% 62.5%
Regional
Puerto Rico
Peru
Mexico
Honduras
Guatemala
Ecuador
Costa Rica
Colombia
Chile
Brazil
Bolivia
Argentina
2017 Leasing Portfolio Growth vs. GDP Growth
PORT.GROWTH
GDP GROWTH
Figure 2: Who grows better: The Economies or Leasing within them?

Rafael Castillo-Triana August 26, 2018
WLY 2018 Page 4
The Three Musketeers: Banks, Captives and Independent
Figure 2: Banks still dominate but losing ground
Banks kept losing ground on their former dominance amongst the players in
the leasing industry. While banks used to represent between 70% to 75%, their
market share is declining to 65%. Many factors explain this. First, strict regulations
that impose heavier capital requirements upon risk weighted assets, have led to a
risk adverse culture in the banks, where tangible assets and residual position taken
are virtually excluded from the bank’s business model. Second, capital is flowing
to independents because they are showing above average returns on equity, and
finally, because certain equipment manufacturers still need strong support from
their captives.
The aforementioned notwithstanding, captives are mainly present in the four
largest economies, namely, Mexico, Brazil, Argentina and Colombia. This has to
do with critical mass considerations. If the market size doesn’t justify establishing
presence in a given country, captives would not dare to open a subsidiary in such
country, rather outsource financing with existing domestic players, either banks or

Rafael Castillo-Triana August 26, 2018
WLY 2018 Page 5
independents. Such is the case in countries such as Chile, where no captives are
detected.
What the data and observed behavior of the market suggest is that as long as
the Latin American economies suffer transformation, the global drivers
(technologies and regulations) lead to forced changes in the business models of all
Lessors.
Demand for capital goods is changing, among other things because the sole
definitions of capital goods is also changing. At the same time when imports of
computers is declining in all countries, the demand for smart phones is
skyrocketing. These are not classified as capital goods, but they are. However, no
single lessor is currently Financing them.
While the Fourth Industrial Revolution is emerging, we do not see yet any of
these transformations in the composition of the portfolio of Latin American
Lessors. No drones, not too many electric vehicles, seldom use of the Internet of
Things, no 3-D printers financed, no “smart cities”, but instead, a large switch into
real estate leasing. A material component of the growth of the leasing industries in
Chile, Peru and Colombia come out of their originations in real estate leases.
Another interesting observation has to do with the profitability of the
surveyed Latin American Lessors. While the average return on equity of the whole
universe of Lessors reviewed was 10.8% in 2017, the 100 largest Lessors delivered
an average 12.7% return on equity in 2017.
The 20 most profitable LAR Lessors
Company Type Country
Ford Credit Captive Mexico 38.9%
RENTING COLOMBIA S.A. Bank Colombia 36.76%

Rafael Castillo-Triana August 26, 2018
WLY 2018 Page 6
The 20 most profitable LAR Lessors
Company Type Country
Banco de la Provincia de Buenos Aires (incl, Provincia Leasing)
Bank Argentina 36.46%
HP FINANCIAL SERVICES COLOMBIA LLC
Captive Colombia 32.47%
Banco Patagonia S,A, Bank Argentina 31.87%
John Deere Credit Captive Mexico 26.3%
Arrendadora Banregio Bank Mexico 25.9%
Comercial Administardora Independent Guatemala 23.95%
Unifin Financiera Independent Mexico 23.3%
Banco COMAFI (incl, The Capita Corp)
Bank Argentina 22.26%
Banco Credito del Peru Bank Peru 19.69%
Localiza Independent Brazil 19.44%
Banco de Galicia y Buenos Aires
Bank Argentina 19.30%
Interbank Bank Peru 18.96%
Hewlett Packard Financial Services
Captive Mexico 18.9%
Banco de Chile Bank Chile 18.55%
Banco Santander Chile Bank Chile 18.17%
BBVA -Banco Continental Bank Peru 18.11%

Rafael Castillo-Triana August 26, 2018
WLY 2018 Page 7
The 20 most profitable LAR Lessors
Company Type Country
Volkswagen Leasing Captive Mexico 17.6%
Caterpillar Crédito Captive Mexico 16.8%
Flyers and Divers: Who grew faster and who declined faster
There were interesting moves in the industry, we had some newcomers in
the list, these were the flyers:

Rafael Castillo-Triana August 26, 2018
WLY 2018 Page 8
Table 2: Flyers: Companies who grew faster than their peers
… while the divers were mostly banks that placed their leasing strategies in
the back burner, sometimes due to the fear to assume asset management risks, and
sometimes because they found alternative structures to perfect collateral, such as
security interests in the countries that have followed the UNCITRAL Model Law
Ranking
2016
Ranking
2017
Jump
2016-
2017 Company TYPE COUNTRY
Portfolio
USD(000
) 2017
Estimated
Volume
US$
(000)10 117 90 27 MAREAUTO COLOMBIA S A S Independent Colombia 82,805 56,245$
113 92 21 Banco de Lage Landen Brasil S/A Bank Brazil 76,484 49,295$
114 93 21 BV LEASING AM S A Bank Brazil 74,604 47,530$
115 96 19 CSILATINA A.M. S.A. Independent Brazil 69,371 42,296$
73 58 15 Value Arrendadora Independent Mexico 200,186 121,560$
21 10 11 Volkswagen Leasing Captive Mexico 1,932,240 830,804$
46 38 8 Locamerica Independent Brazil 483,423 297,615$
91 83 8 HP FINANCIAL SERVICES COLOMBIA LLC Captive Colombia 98,653 59,804$
74 67 7 Banco COMAFI (incl, The Capita Corp)Bank Argentina 148,762 113,286$
98 91 7 HP Financial Services Captive Argentina 77,454 47,311$
104 97 7 Banco de la Provincia de Buenos Aires (incl, Provincia Leasing)Bank Argentina 68,858 64,939$
13 7 6 Localiza Independent Brazil 2,273,658 1,035,190$
10 5 5 Arrendadora Inbursa Bank Mexico 2,308,925 1,139,017$
68 63 5 Daycoval Leasing - Banco Múltiplo S.ABank Brazil 159,861 73,938$
76 71 5 Banco Supervielle Bank Argentina 133,291 113,110$
37 33 4 Unidas Independent Brazil 636,622 331,554$
64 60 4 Operadora Mega Independent Mexico 177,754 65,208$
47 44 3 Mercader Financial Captive Mexico 377,256 191,998$
59 56 3 Financiera Bajio Bank Mexico 206,925 100,730$
87 84 3 AB&C Leasing Independent Mexico 98,006 46,881$
29 27 2 Popular Auto Bank Puerto Rico 730,125 319,295$
30 28 2 Banco Bice Bank Chile 681,676 241,891$
36 34 2 Paccar Arrendadora Captive Mexico 591,055 254,855$
70 68 2 John Deere Credit Captive Mexico 147,621 60,301$
78 76 2 CSI Leasing México Independent Mexico 118,660 54,191$
82 80 2 Arrendadora Afirme Bank Mexico 107,035 45,527$
84 82 2 Banco de Galicia y Buenos Aires Bank Argentina 99,079 51,535$
101 99 2 Servicios Financieros Progreso Independent Chile 63,008 26,598$
5 4 1 Banco Santander Chile Bank Chile 2,326,387 736,855$
16 15 1 BBVA COLOMBIA Bank Colombia 1,257,071 496,057$
19 18 1 Banco del Estado Bank Chile 1,226,055 476,669$
26 25 1 Movida Independent Brazil 850,536 404,372$
27 26 1 Banco Bilbao Vizcaya Argentaria Bank Chile 781,133 310,730$
32 31 1 Navistar Financial Captive Mexico 648,576 273,450$
33 32 1 Arrendadora Banregio Bank Mexico 648,020 280,261$
66 65 1 De Lage Landen Bank Mexico 150,630 56,845$
88 87 1 Arrendadora y Soluciones de NegocioIndependent Mexico 92,081 41,512$

Rafael Castillo-Triana August 26, 2018
WLY 2018 Page 9
and the suggestions of the International Finance Corporation, that albeit provide
priorities, still lack the strength of creditors rights that a lessor enjoys under
applicable law. Nonetheless, in practical terms is easier to perfect a secured
transaction and it represents less hassle in the front end. In Brazil, that still lacks a
secured transactions law, the guarantee trust (“alienação fiduciaria”) has displaced
leasing as the preferred form of asset based financing. For that reason the largest
diver is Banco Itaucard, one of the largest banks in Brazil.
The following list shows interesting lessons about going up and down:

Rafael Castillo-Triana August 26, 2018
WLY 2018 Page 10
Ranking
2016
Ranking
2017
Jump
2016-
2017 Company TYPE COUNTRY
Portfolio
USD(000)
2017
Estimated
Volume
US$ 35 51 -16 Banco Itaucard S/A Bank Brazil 255,942 (96,964)$
79 95 -16 Banco Patagonia S,A, Bank Argentina 72,184 36,589$
58 73 -15 CHG Meridian Mexico Independent Mexico 129,548 14,966$
61 74 -13 Banco Financiero Bank Peru 126,448 23,270$
71 81 -10 FINANDINA Bank Colombia 101,601 23,413$
57 66 -9
CARVAJAL PROPIEDADES E INVERSIONES
S.A. Independent Colombia 148,819 44,173$
31 39 -8 Banco Ibm S/A Arrendamento Mercantil Captive Brazil 443,442 77,551$
54 62 -8 Tanner Independent Chile 170,370 43,048$
62 70 -8 LEASING CORFICOLOMBIANA Bank Colombia 135,188 38,293$
67 75 -8 BBVA Banco Frances Bank Argentina 120,305 78,805$
92 100 -8 Banco Consorcio Bank Chile 62,856 21,299$
28 35 -7
Santander Brasil Arrendamento Mercantil,
Merging Santander Leasing Bank Brazil 573,716 149,863$
42 49 -7 Safra Leasing S/A Arrendamento Mercantil Bank Brazil 275,820 52,079$
23 29 -6
Bradesco Leasing S/A Arrendamento
Mercantil Bank Brazil 664,794 115,068$
40 46 -6 RENTING COLOMBIA S.A. Bank Colombia 347,308 100,861$
18 23 -5 BBVA Leasing Bank Mexico 900,276 172,407$
45 50 -5
SG Equipment Finance S.A. Arrendamento
Mercantil Bank Brazil 274,534 80,771$
50 55 -5 Cia. de Arrendamento Mercantil RCI Brasil Captive Brazil 215,364 55,531$
72 77 -5 EQUIRENT S.A. Captive Colombia 116,728 40,984$
83 88 -5 Alfa Arrendamento Mercantil S/A Bank Brazil 88,691 33,980$
8 12 -4 Unifin Financiera Independent Mexico 1,911,647 701,242$
9 13 -4 BANCO DE OCCIDENTE Bank Colombia 1,727,413 599,687$
15 19 -4 ITAU Bank Colombia 1,171,481 381,356$
38 42 -4 OuroVerde Independent Brazil 391,335 96,026$
43 47 -4
Hp Financial Services Arrendamento Merc.
S/A Captive Brazil 329,834 122,440$
65 69 -4 LEASING BANCOLDEX S.A. Bank Colombia 145,845 53,128$
75 79 -4
Banco de la Nacion Argentina (incl, Nacion
Leasing) Bank Argentina 109,924 59,046$
81 85 -4 BANCO POPULAR Bank Colombia 97,621 38,126$
90 94 -4 HSBC Bank Argentina S,A, Bank Argentina 74,074 71,429$
94 98 -4 Corporacion Cafsa Captive Costa Rica 68,228 30,368$
6 9 -3 Banco Itau Chile Bank Chile 1,960,986 510,204$
49 52 -3 Financiera Desyfin Independent Costa Rica 234,174 79,856$
51 54 -3 Arrendadora Actinver Bank Mexico 224,800 64,698$
56 59 -3 Grupo BNS Bank Costa Rica 182,517 71,153$
69 72 -3 Tattersal Independent Chile 132,267 40,601$
86 89 -3 Comercial Administradora Independent Guatemala 86,601 33,322$
4 6 -2 Banco Credito del Peru Bank Peru 2,285,676 576,205$
12 14 -2 BBVA -Banco Continental Bank Peru 1,427,330 346,896$
14 16 -2 Caterpillar Crédito Captive Mexico 1,235,613 371,804$
34 36 -2 Interbank Bank Peru 527,063 164,557$
55 57 -2 Banco Internacional Bank Chile 205,775 79,051$
7 8 -1 Banco de Chile Bank Chile 2,227,140 780,226$
39 40 -1 Banco Interamericano de Finanzas Bank Peru 424,620 134,588$
44 45 -1 COLPATRIA RED MULTIBANCA Bank Colombia 349,397 156,434$
63 64 -1 Arrendadora Ve Por Mas Bank Mexico 155,212 53,950$
77 78 -1 LEASEPLAN AM S.A. Independent Brazil 112,610 49,244$
85 86 -1 Corporación Financera Atlas Independent Mexico 92,354 37,190$

Rafael Castillo-Triana August 26, 2018
WLY 2018 Page 11
Other “divers”, who fell slightly less, were affected by the reduction in
capital investment that affected Latin American countries driven by election years
and the uncertainty generated by notorious corruption scandals such as the “Lava
Jato” scandal in Brazil that created collateral effects in other countries of Latin
America and led to the paralysis of large infrastructure projects that were driving
investments in countries such as Peru, Colombia, and even Mexico.
Who really own the Alta LAR 100 companies and from where:
Another interesting feature observed has to do with the ownership of the
largest lessors. Certainly, the United States of America has given up its control.
This country is no longer relevant for the leasing industry in Latin America. The
space left by the United States has been taken over by Japan, Spain, France,
Germany and Canada. Certainly, the United States is not great in Latin America, it
is becoming less and less influential in the equipment leasing and financing
industry in Latin America.
Rafael Castillo-Triana August 26, 2018
WLY 2018 Page 12
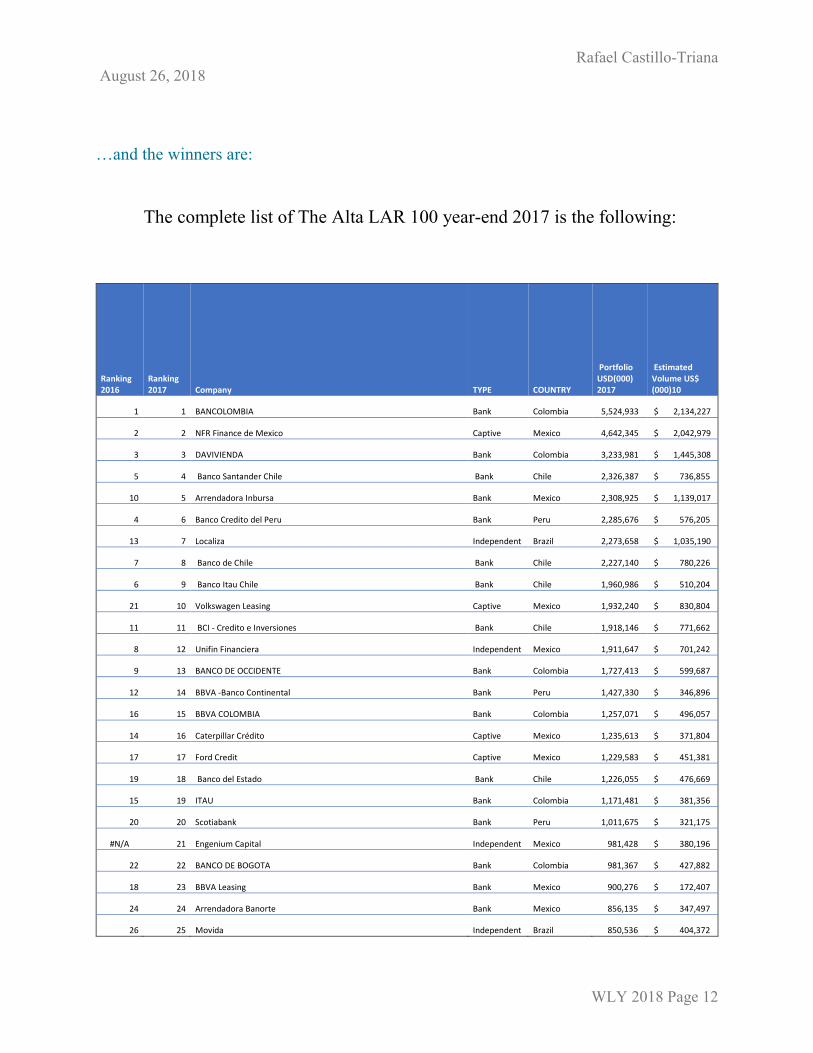
…and the winners are:
The complete list of The Alta LAR 100 year-end 2017 is the following:
Ranking 2016
Ranking 2017 Company TYPE COUNTRY
Portfolio USD(000) 2017
Estimated Volume US$ (000)10
1 1 BANCOLOMBIA Bank Colombia 5,524,933 $ 2,134,227
2 2 NFR Finance de Mexico Captive Mexico 4,642,345 $ 2,042,979
3 3 DAVIVIENDA Bank Colombia 3,233,981 $ 1,445,308
5 4 Banco Santander Chile Bank Chile 2,326,387 $ 736,855
10 5 Arrendadora Inbursa Bank Mexico 2,308,925 $ 1,139,017
4 6 Banco Credito del Peru Bank Peru 2,285,676 $ 576,205
13 7 Localiza Independent Brazil 2,273,658 $ 1,035,190
7 8 Banco de Chile Bank Chile 2,227,140 $ 780,226
6 9 Banco Itau Chile Bank Chile 1,960,986 $ 510,204
21 10 Volkswagen Leasing Captive Mexico 1,932,240 $ 830,804
11 11 BCI - Credito e Inversiones Bank Chile 1,918,146 $ 771,662
8 12 Unifin Financiera Independent Mexico 1,911,647 $ 701,242
9 13 BANCO DE OCCIDENTE Bank Colombia 1,727,413 $ 599,687
12 14 BBVA -Banco Continental Bank Peru 1,427,330 $ 346,896
16 15 BBVA COLOMBIA Bank Colombia 1,257,071 $ 496,057
14 16 Caterpillar Crédito Captive Mexico 1,235,613 $ 371,804
17 17 Ford Credit Captive Mexico 1,229,583 $ 451,381
19 18 Banco del Estado Bank Chile 1,226,055 $ 476,669
15 19 ITAU Bank Colombia 1,171,481 $ 381,356
20 20 Scotiabank Bank Peru 1,011,675 $ 321,175
#N/A 21 Engenium Capital Independent Mexico 981,428 $ 380,196
22 22 BANCO DE BOGOTA Bank Colombia 981,367 $ 427,882
18 23 BBVA Leasing Bank Mexico 900,276 $ 172,407
24 24 Arrendadora Banorte Bank Mexico 856,135 $ 347,497
26 25 Movida Independent Brazil 850,536 $ 404,372

Rafael Castillo-Triana August 26, 2018
WLY 2018 Page 13
Ranking 2016
Ranking 2017 Company TYPE COUNTRY
Portfolio USD(000) 2017
Estimated Volume US$ (000)10
27 26 Banco Bilbao Vizcaya Argentaria Bank Chile 781,133 $ 310,730
29 27 Popular Auto Bank Puerto Rico 730,125 $ 319,295
30 28 Banco Bice Bank Chile 681,676 $ 241,891
23 29 Bradesco Leasing S/A Arrendamento Mercantil Bank Brazil 664,794 $ 115,068
441 30 Hewlett Packard Financial Services Captive Mexico 657,589 $ 657,589
32 31 Navistar Financial Captive Mexico 648,576 $ 273,450
33 32 Arrendadora Banregio Bank Mexico 648,020 $ 280,261
37 33 Unidas Independent Brazil 636,622 $ 331,554
36 34 Paccar Arrendadora Captive Mexico 591,055 $ 254,855
28 35 Santander Brasil Arrendamento Mercantil, Merging Santander Leasing Bank Brazil 573,716 $ 149,863
34 36 Interbank Bank Peru 527,063 $ 164,557
442 37 Banco Security Bank Chile 497,056 $ 166,221
46 38 Locamerica Independent Brazil 483,423 $ 297,615
31 39 Banco Ibm S/A Arrendamento Mercantil Captive Brazil 443,442 $ 77,551
39 40 Banco Interamericano de Finanzas Bank Peru 424,620 $ 134,588
41 41 Scotiabank Sudamericano Bank Chile 398,573 $ 136,885
38 42 OuroVerde Independent Brazil 391,335 $ 96,026
#N/A 43 TIP De Mexico Independent Mexico 386,489 $ 142,836
47 44 Mercader Financial Captive Mexico 377,256 $ 191,998
44 45 COLPATRIA RED MULTIBANCA Bank Colombia 349,397 $ 156,434
40 46 RENTING COLOMBIA S.A. Bank Colombia 347,308 $ 100,861
43 47 Hp Financial Services Arrendamento Merc. S/A Captive Brazil 329,834 $ 122,440
48 48 ATC SITIOS DE COLOMBIA S.A.S Independent Colombia 298,574 $ 134,058
42 49 Safra Leasing S/A Arrendamento Mercantil Bank Brazil 275,820 $ 52,079
45 50 SG Equipment Finance S.A. Arrendamento Mercantil Bank Brazil 274,534 $ 80,771
35 51 Banco Itaucard S/A Bank Brazil 255,942 $ (96,964)
49 52 Financiera Desyfin Independent Costa Rica 234,174 $ 79,856
53 53 Santander Peru Bank Peru 228,924 $ 92,339
51 54 Arrendadora Actinver Bank Mexico 224,800 $ 64,698
50 55 Cia. de Arrendamento Mercantil RCI Brasil Captive Brazil 215,364 $ 55,531
59 56 Financiera Bajio Bank Mexico 206,925 $ 100,730

Rafael Castillo-Triana August 26, 2018
WLY 2018 Page 14
Ranking 2016
Ranking 2017 Company TYPE COUNTRY
Portfolio USD(000) 2017
Estimated Volume US$ (000)10
55 57 Banco Internacional Bank Chile 205,775 $ 79,051
73 58 Value Arrendadora Independent Mexico 200,186 $ 121,560
56 59 Grupo BNS Bank Costa Rica 182,517 $ 71,153
64 60 Operadora Mega Independent Mexico 177,754 $ 65,208
25 61 Docuformas Independent Mexico 173,488 $ 76,998
54 62 Tanner Independent Chile 170,370 $ 43,048
68 63 Daycoval Leasing - Banco Múltiplo S.A Bank Brazil 159,861 $ 73,938
63 64 Arrendadora Ve Por Mas Bank Mexico 155,212 $ 53,950
66 65 De Lage Landen Bank Mexico 150,630 $ 56,845
57 66 CARVAJAL PROPIEDADES E INVERSIONES S.A. Independent Colombia 148,819 $ 44,173
74 67 Banco COMAFI (incl, The Capita Corp) Bank Argentina 148,762 $ 113,286
70 68 John Deere Credit Captive Mexico 147,621 $ 60,301
65 69 LEASING BANCOLDEX S.A. Bank Colombia 145,845 $ 53,128
62 70 LEASING CORFICOLOMBIANA Bank Colombia 135,188 $ 38,293
76 71 Banco Supervielle Bank Argentina 133,291 $ 113,110
69 72 Tattersal Independent Chile 132,267 $ 40,601
58 73 CHG Meridian Mexico Independent Mexico 129,548 $ 14,966
61 74 Banco Financiero Bank Peru 126,448 $ 23,270
67 75 BBVA Banco Frances Bank Argentina 120,305 $ 78,805
78 76 CSI Leasing México Independent Mexico 118,660 $ 54,191
72 77 EQUIRENT S.A. Captive Colombia 116,728 $ 40,984
77 78 LEASEPLAN AM S.A. Independent Brazil 112,610 $ 49,244
75 79 Banco de la Nacion Argentina (incl, Nacion Leasing) Bank Argentina 109,924 $ 59,046
82 80 Arrendadora Afirme Bank Mexico 107,035 $ 45,527
71 81 FINANDINA Bank Colombia 101,601 $ 23,413
84 82 Banco de Galicia y Buenos Aires Bank Argentina 99,079 $ 51,535
91 83 HP FINANCIAL SERVICES COLOMBIA LLC Captive Colombia 98,653 $ 59,804

Rafael Castillo-Triana August 26, 2018
WLY 2018 Page 15
Ranking 2016
Ranking 2017 Company TYPE COUNTRY
Portfolio USD(000) 2017
Estimated Volume US$ (000)10
87 84 AB&C Leasing Independent Mexico 98,006 $ 46,881
81 85 BANCO POPULAR Bank Colombia 97,621 $ 38,126
85 86 Corporación Financera Atlas Independent Mexico 92,354 $ 37,190
88 87 Arrendadora y Soluciones de Negocio Independent Mexico 92,081 $ 41,512
83 88 Alfa Arrendamento Mercantil S/A Bank Brazil 88,691 $ 33,980
86 89 Comercial Administradora Independent Guatemala 86,601 $ 33,322
117 90 MAREAUTO COLOMBIA S A S Independent Colombia 82,805 $ 56,245
98 91 HP Financial Services Captive Argentina 77,454 $ 47,311
113 92 Banco de Lage Landen Brasil S/A Bank Brazil 76,484 $ 49,295
114 93 BV LEASING AM S A Bank Brazil 74,604 $ 47,530
90 94 HSBC Bank Argentina S,A, Bank Argentina 74,074 $ 71,429
79 95 Banco Patagonia S,A, Bank Argentina 72,184 $ 36,589
115 96 CSILATINA A.M. S.A. Independent Brazil 69,371 $ 42,296
104 97 Banco de la Provincia de Buenos Aires (incl, Provincia Leasing) Bank Argentina 68,858 $ 64,939
94 98 Corporacion Cafsa Captive Costa Rica 68,228 $ 30,368
101 99 Servicios Financieros Progreso Independent Chile 63,008 $ 26,598
92 100 Banco Consorcio Bank Chile 62,856 $ 21,299