Learning Information Literacy through Drawing Information Literacy through Drawing David James Brier...
27
1 Learning Information Literacy through Drawing David James Brier and Vickery Kaye Lebbin Introduction Close your eyes and picture a librarian. If you are like many university students, you will picture an older white lady with hair in a bun and glasses on her nose sitting behind a desk telling people to SSSHHH! Many of the words and terms used in information literacy instruction conjure pictures in students’ heads. Sometimes those pictures are concrete like a librarian, and sometimes they are vague, intangible, and abstract like the Dark Web. This paper invites readers to consider the images behind the words, arguing that the images are a missing dimension within our teaching and that drawing is an interesting and fun instruction method to think more explicitly about them. After establishing the case for drawing exercises in library instruction, the authors will discuss how students in English 100 (first-year composition) at the University of Hawaii at Manoa (UHM) used drawing to learn and reason about information literacy. The authors will examine examples of student drawings and discuss the benefits (and problems) of this teaching method. Literature review While a review of the literature did not reveal any articles on the use of drawing in information literacy workshops, researchers and instructors in other disciplines do offer insight on the use and value of drawing. Drawing helps foreign language students understand abstract concepts. Rathet (1994), a former instructor at the University of Washington, presents several drawing activities for teaching English as a Second Language students. Students listen to conversational English tapes and draw responses. She argues that drawing helps students understand and express subjective concepts that could differ by culture. Rathet also believes drawing makes for more active and memorable learning experiences (p. 22). Two research studies demonstrate how drawing encourages self-directed expression, aiding with assessment of ideas beyond the verbal level. The first by Smith and Hepworth (2012) from Loughborough University in Great Britain used drawing to examine how young people experience information. At the start of each interview, the researchers had students draw the first thing they thought of when they heard the word information (p. 159). The researchers felt the drawing activity at the beginning of the interview enabled students to create their own examples without prejudice of the interviewer. Additionally, they felt drawing was a useful tool because “drawings are a well-established medium for assessing thoughts and perceptions that may not be immediately accessible at the verbal level” (Tamm and Granqvist, cited in Smith and Hepworth, p. 159). The second research study by Ozden (2009) at Adiyaman University in Turkey, used drawing to measure the understanding and misconceptions of undergraduate student teachers’ ideas on atoms and
Transcript of Learning Information Literacy through Drawing Information Literacy through Drawing David James Brier...

1
Learning Information Literacy through Drawing
David James Brier and Vickery Kaye Lebbin
Introduction
Close your eyes and picture a librarian. If you are like many university students, you will
picture an older white lady with hair in a bun and glasses on her nose sitting behind a
desk telling people to SSSHHH! Many of the words and terms used in information
literacy instruction conjure pictures in students’ heads. Sometimes those pictures are
concrete like a librarian, and sometimes they are vague, intangible, and abstract like the
Dark Web. This paper invites readers to consider the images behind the words, arguing
that the images are a missing dimension within our teaching and that drawing is an
interesting and fun instruction method to think more explicitly about them. After
establishing the case for drawing exercises in library instruction, the authors will discuss
how students in English 100 (first-year composition) at the University of Hawaii at
Manoa (UHM) used drawing to learn and reason about information literacy. The authors
will examine examples of student drawings and discuss the benefits (and problems) of
this teaching method.
Literature review
While a review of the literature did not reveal any articles on the use of drawing in
information literacy workshops, researchers and instructors in other disciplines do offer
insight on the use and value of drawing.
Drawing helps foreign language students understand abstract concepts. Rathet (1994), a
former instructor at the University of Washington, presents several drawing activities for
teaching English as a Second Language students. Students listen to conversational
English tapes and draw responses. She argues that drawing helps students understand and
express subjective concepts that could differ by culture. Rathet also believes drawing
makes for more active and memorable learning experiences (p. 22).
Two research studies demonstrate how drawing encourages self-directed expression,
aiding with assessment of ideas beyond the verbal level. The first by Smith and Hepworth
(2012) from Loughborough University in Great Britain used drawing to examine how
young people experience information. At the start of each interview, the researchers had
students draw the first thing they thought of when they heard the word information (p.
159). The researchers felt the drawing activity at the beginning of the interview enabled
students to create their own examples without prejudice of the interviewer. Additionally,
they felt drawing was a useful tool because “drawings are a well-established medium for
assessing thoughts and perceptions that may not be immediately accessible at the verbal
level” (Tamm and Granqvist, cited in Smith and Hepworth, p. 159). The second research
study by Ozden (2009) at Adiyaman University in Turkey, used drawing to measure the
understanding and misconceptions of undergraduate student teachers’ ideas on atoms and

2
molecules. Building on previous research, Ozden selected drawing as an assessment
method because it was easy, quick, enjoyable, and an alternative form of expression. The
following drawing activities were used in the study: 1) student teachers exchanged
drawings with a partner who filled in the missing parts; 2) student teachers compared
their drawings with a ready-made drawing; and 3) student teachers completed a test by
drawing their answers. The study’s results showed that student teachers did not know the
concepts related to atoms and molecules; suggesting that more effective teaching
methods need to be developed.
Drawing requires a different type of thinking. Baldwin, a biology professor, and
Crawford, a visual arts instructor, describe their partnership teaching a botany lab at
Thompson Rivers University in Canada. The two collaborated on an illustrated learning
journal assignment and drawing tutorial with the goal of improving students’
observational skills of plant biology. The assignments were evaluated based on the
quality of observation and not artistic merit. Baldwin and Crawford (2010) felt drawing
offered them a different method to interpret what students were learning and encouraged
a different type of thinking (p. 27). Feedback from the students about the assignments
was positive with most expressing that it provided them with greater awareness to detail
(p. 29).
Finally, Kantrowitz (2012), an art instructor at Teachers College, Columbia University,
provides a theoretical paper from the study of cognitive science. Kantrowitz explains that
human cognitive abilities provide only a representation of the world; a representation that
is incomplete and at times inaccurate. While language offers a means of categorizing the
world it can bias one’s experiences. Kantrowitz believes, “drawing enables the drawer to
see and comprehend that which is beyond words” (p. 10). Kantrowitz’s ideas validate the
importance of supplementing text dominant instruction with visual activities.
The literature review indicates that material on learning information literacy through
drawing is lacking or non-existent. The authors seek to help fill this gap in the literature
by sharing their experience with drawing in information literacy workshops.
The case for drawing in information literacy instruction
Although academic librarians may associate drawing activities with children, the authors
have found that many university students are interested in and enjoy drawing. Despite the
authors’ initial concern that students routinely using high-tech devices to socialize and
learn would find drawing with magic markers or crayons boring, the authors’
observations have suggested the opposite. The majority of students (and their instructors)
welcomed the drawing exercises. In addition to students finding drawing fun, there are
numerous pedagogical advantages to support the use of drawing.
Drawing provides librarians with a practical way to diversify their teaching methods. By
supplementing text-dominated teaching methods with visual methods such as drawing,

3
librarians can mix methods and introduce students to a different way of knowing
information literacy.
Finding ways to engage students is an important step in connecting them with
information literacy. Detler et al. (2012) contend this is best done through active learning.
They conclude “that active ILI has a direct effect on yielding positive student learning
outcomes, while passive ILI does not” (p. 156). Francis (2012) also echoes this general
theme of engagement and active learning when she writes “humor, group work, and
games demonstrates how it is possible for librarians to incorporate fun into a rigorous
course of study” (p. 156). Drawing is a type of active instruction that, for many students,
is fun and highly collaborative. If the students are required to complete their drawings
within a few minutes, the method takes on a game-like quality as students rush to beat the
clock. Like speed chess, the action is fast and furious. Drawing engages students and
connects them to the lesson in a unique and active way.
Because drawing taps different cognitive skills than text learning, it offers students that
prefer visual ways of learning with an opportunity to shine. If the drawing exercise is
designed well, however, the quality of the drawing is not important. Thus those that do
not draw well can still participate and make meaningful contributions to class discussion.
Indeed, when sharing their drawings with the class, the unskilled drawers with their
simple renderings are often the source of good fun and supportive class laughter.
Another advantage of drawing assignments is that they provide students with a
kinesthetic and tactual element in their information literacy instruction. The feel of the
paper, the scent of the markers, the sight of color and visual images, the sounds of student
conversations, and standing and moving around the drawing (learning on one’s feet rather
than in one’s seat) combine to create a multisensory and kinesthetic experience. Findings
from neuroscience indicate that each sense has brain connections. Therefore the more
senses used in learning a subject, the greater likelihood of recall because the lesson can
be retrieved through multiple cues (scent, sight, sound, taste and touch) rather than just
one (Willis, 2012).
Drawing can be done on a shoestring. Without the need for expensive machines and
supplies, drawing is sustainable. For the cost of some paper and a few dozen crayons and
magic markers, librarians can supplement their lessons with drawing exercises. Further,
the absence of high-tech devices means that librarians do not have to install or update any
software or hardware. Since there are no prerequisite skills necessary, students can begin
a drawing within seconds after receiving the assignment. Moreover, technological
changes do not make the lessons obsolete. Therefore exercises can be seamlessly relayed
to other librarians in the future and, if necessary, lessons can be repurposed easily. Thus
drawing exercises are easy to maintain and operate.
The idea that images and words are linked is an old one that has been made by scholars in
numerous disciplines. Aristotle, for instance, argued that “the soul never thinks without
images” (Apostle, cited in Allen 2002, p. 4). A more recent example comes from

4
Professor of Cognitive Science and Linguistics George Lakoff (2004) when discussing
the study of cognitive framing: “every word…evokes a frame, which can be an image…”
(p. 3). And Professor of Written Communication Nancy Allen has edited a collection of
essays from scholars and professionals in various fields that explore the symbiotic
relationship between words and images (Allen, 2002). Drawing is an excellent method to
explore the visual understanding of what our students are thinking when we discuss the
terms of information literacy. Seeing the mental images drawn on paper offers librarians
a better sense of how or the extent to which students understand information literacy.
Conceptually, it encourages librarians and students to think about information literacy in
terms of vertical layers. The underlying layer being either the word or the image.
Drawing is useful because it helps students study and examine the layers between words
and images leading both to a richer appreciation and deeper comprehension of
information literacy concepts.
Some educators may frown at drawing because it is low-tech. Many accept, without
thinking, that high-tech instruction is good for students. An example of the high-tech
imperative comes from a recent article titled “Top 10 Technologies for Designing 21st
Century Instruction” by Professor of Education Lawrence A. Tomei (2013). He asserts “if
we aspire to prepare students for the future, teachers must seize every opportunity to
infuse the technologies their students will be using wherever possible” (p. 80). He points
to the following technologies: “interactive white boards, web cameras,
videoconferencing, iPods, digital cameras, digital video, wikis and blogs, social
networking, digital electronic books, and student response systems” (p. 80). He concludes
that these technologies “provide opportunities to enhance learning through increased
student participation, attention to learning styles, and the excitement that technology can
offer to millennials” (p. 92). Not surprisingly, markers, crayons, and paper did not make
it to Tomei’s list. Indeed, no low-tech alternatives were included in his article. For
Tomei, high-tech equals the future. Low-tech (or no-tech) equals the past. Teachers using
high-tech are creating superior teaching and learning experiences. Educators using low-
tech (or no-tech) are designing inferior teaching and learning experiences that do not
prepare students for the future. Through the high-tech imperative lens, drawing manually
on paper with markers is ineffective and irresponsible. Librarians that choose to use
drawing as an instruction method may experience similar reactions from colleagues or
administrators. Despite the availability of high-tech online drawing applications, the
authors’ decision to continue using low-tech manual drawing is based on their
observation that it outperforms the high-tech alternatives. The low-tech method is more
efficient for all the reasons listed in this article. Thus, rather than “seizing every
opportunity” to use high-tech, the authors contend that well designed instruction contains
a mix of methods featuring no-tech, low-tech, and high-tech tools. The authors’
experience with thousands of students and dozens of instructors indicates that low-tech
drawing in short bursts is as or more effective in engaging students, attending to learning
styles, and exciting millennials (as well as other cohorts) than any of the high-tech tools
Tomei lists.

5
High-tech discussions at information literacy conferences often focus on online tutorials.
The emergence and growth of online library tutorials has been fueled largely by library
budget cuts and staff shortages (Bracke, and Dickstein, 2002; Sult, Mery, Blakiston, and
Kline, 2013). Under pressure to process an increasing number of students with fewer
staff, the online tutorial has been the tool of choice for many libraries because of
economic labor efficiencies. Although some tutorials do result in labor savings for the
library, they do not necessarily lead to more informed or sophisticated students. As the
use of online library tutorials increases, so does the number of students demonstrating
their understanding and knowledge of information literacy by answering automated
multiple-choice questions. This process of high-tech learning, however, results in a
process of thinking that is different from the cognitive orientation used to grapple with
open-ended questions requiring the creation of a picture. Students literally must use
different parts of their brain and call upon different intellectual skills to complete drawing
assignments (Baldwin and Crawford, 2010 and Willis, 2007). Unlike many online
tutorials, learning information literacy through drawing encourages students to embrace
ambiguity and see information literacy as something more than a mechanical set of skills
wielded by individuals leading to a single, black-and-white, correct answer. Learning
information literacy through drawing encourages students to think and speak about
information literacy in terms of a social activity that is complex, interpretative, and
creative, often leading to many equally appropriate answers.
Despite the numerous advantages of learning information literacy through drawing, there
are some challenges. From an economic labor perspective, the activity is expensive
because, as described and practiced by the authors, it requires a person to deliver face-to-
face instruction. Further, it is not conducive to online instruction. Also, at times, students
draw something silly because they are unfamiliar with the topic or just do not take the
assignment seriously and behave frivolously. Yet another issue, if drawing groups exceed
two or three students, then some students will become passive or not participate because
the group is too large. Additionally, because drawing is rarely practiced in many of their
courses, the exercise is strange to some and the combination of thinking quickly and
creating pictures can be challenging. Assessment too can be problematic. And, depending
on the physical size and configuration of the instruction room, finding enough flat,
smooth surfaces to draw on may be difficult. Finally, students do not always achieve the
intellectual goals envisioned by the authors in the short time frames allowed to analyze
the drawings. That said, the authors’ experience suggests that the benefits of learning
information literacy through drawing outweigh the costs.
Background
The drawing activities described in this paper took place in the University of Hawaii at
Manoa Library’s Library Essentials program. Library Essentials is a collection of 50-
minute and 75-minute workshops for students enrolled in English 100 (first-year
composition) sections. These face-to-face workshops taught by librarians introduce

6
students to basic library services and sources and information literacy concepts. The
workshops were designed to help English instructors address the "information literacy"
requirement of their courses. The Library Essentials program included a menu of five
workshops. Instructors could register their classes for a single workshop or a combination
of several workshops (a maximum of three per class). The program has been in place
since 2007. In the fall 2013 and spring 2014, a total of 180 workshops were taught.
Classes were generally attended by 16 to 20 students per class.
The drawing activities – Collaborative Speed Drawing
The authors use the term Collaborative Speed Drawing to describe the instruction method
outlined here. Before the workshop, the librarians placed 10 blank sheets of 27 X 34 inch
paper on flat, smooth surfaces (a combination of easels, tables, walls, and floor). Three or
four dark-colored, broad-tipped, scented markers or crayons were placed by each paper.
Just before the assignment, the librarian quickly organized the students in pairs. In the
event the class had an odd number of students, one group got three students instead of
two. After the librarian separated the students into pairs, the librarian assigned them a
question. The students were instructed to quickly discuss and then draw an answer to the
question. Their drawings were to feature pictures rather than words. If they used words,
students were to do so sparingly. Each group was given five to seven minutes to draw.
Select groups of students were then asked to come to the front of class and explain their
drawings in less than one minute with the group as a whole. At times, this was twisted by
asking students from one group to interpret and explain the drawing a different group of
students made. The librarian and students were able to ask questions and make
comments. The entire drawing exercise took ten minutes in 50 minute workshops and
fifteen minutes in 75 minute workshops. When the sessions were over, the authors
collected the drawings for further study and examination.
Drawing quickly rather than beautifully
The authors are not arguing that librarians should teach drawing or art. Although some
may be well qualified to do so, the authors contend that drawing, even if it is crude and
quick, is a means to study and examine information literacy concepts. The beauty and
pictorial skill of the drawings is not important here. Developing and improving artistic
talent is not among the teaching objectives. Helping students visualize information
literacy concepts is the primary goal. Restricting the time students have to draw does not
impede this goal. Speed drawing fits well into the authors’ preference for designing
workshops that feature a variety of discrete 10 to 20 minutes exercises (or chunks).
Requiring students to draw quickly makes the exercise more game-like and fun. Students
are often fully engaged when drawing and racing to complete their pictures in the
required time. The authors contend that drawing and thinking pictorially should only
constitute a fraction of the class. No argument is made here for drawing to dominate or

7
take up the bulk of a library instruction or information literacy workshop. Table I
provides example workshop schedules using drawing.
Drawing questions framework
Drawing exercises have their origins in questions. Classifying the questions provides a
framework to think about what the librarian is trying to achieve with the drawing
activities. Each type of question serves as the foundation for a particular type of
discussion and important point. The authors have created four general categories of
drawing questions:
Definition (asks the student to draw the meaning of a word or concept in the context of
information literacy).
Exploration (invites the student to examine a subject in greater detail. The student is
encouraged to extend and sometimes combine concepts).
Affective (calls upon the student to share their feelings and emotions and to consider
different points of view).
Hypothetical (encourages students to imagine problems and propose solutions. These
questions typically start off with “if” and “when”).
So, for example, if the librarian wanted to introduce the Library of Congress
Classification (LCC) system in a lesson, they might ask a hypothetical question such as
“If you could arrange the books in the library any way you want, how would you do it
and why?” to draw at the beginning of the class. The drawings to this hypothetical
question are likely to offer the librarian numerous jumping off points for describing the
LCC. If, for instance, the instructor wanted to review a lesson on the differences between
primary and secondary sources, they would select a definition question such as “What are
the differences between a primary and secondary sources?” for students to draw towards
the end of class. If asked at the beginning of class, these questions probe student
assumptions and serve as a springboard to introduce topics. Asked towards the end of
class, the questions typically function as a review of important lesson points.
There are an infinite number and type of drawing questions librarians can ask students,
Below are some examples to consider:
What are the differences among popular, scholarly and trade sources?
What distinguishes primary from secondary sources?
What distinguishes the Surface Web from the Invisible Web?
What is information?
How do you define information literacy?
What are your research hang-ups?
When is (and isn’t) it appropriate to use information from the internet?
When do you need to cite sources?

8
What is common knowledge?
What distinguishes a search engine from a directory?
What do students gain by doing research?
How do you feel about your research skills?
What do you like and dislike about conducting research on the internet in
comparison to the library?
When you are considering using a website as a source in your paper, what factors
do you consider before using it?
How does the use and importance or primary sources vary with each discipline?
How does Google Search work?
How should you use Wikipedia for academic research?
What is plagiarism?
Who, if anyone, is injured by plagiarism?
How and when can you use social media in academic research?
What are the similarities and differences of Endnote, Zotero, and Mendely?
What can you do with Animoto?
Student drawings
The visualization of information literacy concepts can be seen in the exhibition of student
drawings here. Figure 1 shows images representing the unique nouns (teacher, spank,
children, school) from a research question that could be used in an effective search.
Because students frequently use too few or too many keywords in a search, and often
those keywords consist of articles, prepositions, and conjunctions, the exercise required
students to be focused and selective in their choice of keywords. They had to identify
three to four keywords in their research question. Ideally those words were nouns. If the
student could draw each word, then this was a sign they made a good keyword choice.
The exercise linked words and images in a way that helped students generate an initial set
of keywords.
In many drawings, students used images in a sequence and tell a story. Figure 2 illustrates
a depiction of plagiarism. Here the students drew a storyboard depicting what plagiarism
is and how one could be harmed by it. The drawing features the dominant ethical problem
associated with plagiarism: theft (as indicated by the police officer handcuffing the
plagiarizer). After sharing these drawings, students were asked if they could plagiarize
themselves. Many said “no.” This response should not be surprising if the image behind
the concept is theft. How can one steal from oneself? If, however, the student broadened
their image of plagiarism to include fraud rather than simply theft, then seeing
submission of the same paper for two courses without prior approval of the instructor as a
form of plagiarism became clearer.
Drawings on the same subject can be interpreted very differently. In Figure 3 we see a
rendering of patchwriting. The image demonstrates the students understanding of

9
borrowing from multiple sources (represented by a collage of pictograms of books and an
ideogram of arrows connecting the sources representing the copying) without citation.
With the accompanying narrative that followed the drawing, the students elaborated on
how the original author’s words were slightly altered. Figure 4 presents a more abstract
representation of patchwriting. A comparison of shapes in two documents portrays the
subtle changes made to the language in the original source made by the patchwriter.
Through drawing, students recognize that there are many ways to think about and
visualize the same information literacy concept.
A drawing exercise enables librarians to teach classic lessons in a new way. Figure 5
demonstrates this in an exercise using the SMELL, an acronym that stands for Source,
Motivation, Evidence, Logic, and Left Out (McManus 2009), framework in evaluating
the credibility of websites. When studying the risk of salmonella from eggs, students
compared the information from two .org sites (the Mayo Clinic and the Egg Safety
Center). The students juxtaposed both Web sites and situated each drawing within a
SMELL grid. Using their drawings, they had to explain to the class which site had more
reliable information and why. Although .org sites can provide reliable information that is
appropriate for academic writing, their motivation and biases are not always readily
apparent from their domain. Students were instructed to interrogate each Web site to
learn more about the organization behind the information. They discovered the author of
the Egg Safety Center Web page was the United Egg Producers, a cooperative of egg
farmers, represented by the image of a person with hearts in their eyes holding a carton of
eggs in the Source column. Learning the Web site had a strong commercial bias led the
students to argue the information in the Mayo Clinic was more reliable and appropriate
for academic writing. Evaluating information sources is one of ACRL’s core
competencies in information literacy. Performing that evaluation through pictures,
though, is an interesting twist on a standard exercise.
Another classic task in library and information literacy instruction includes introducing
students to subscription databases in order to find reliable information. After about
twenty minutes of hands-on searching, however, database fatigue sets in for many
students and all the databases begin to look alike. To help students remember some of the
salient features in the databases they just searched, they drew advertisement posters.
Figure 6 is a poster size ad for the LexisNexis Academic database. A computer and large
image of earth symbolize online access to international newspaper articles. Figure 7 is an
advertisement for the Alt-Press Watch database. A large marijuana leaf appears in the
center of the ad representing the alternative content found in the database. Again, we see
a new instruction method to supplement the traditional task of introducing students to
subscription databases.
In many drawings, students grappled with subjects they did not know and illustrated their
misconceptions. In an internet search workshop students were asked to draw “How does
the Google Search engine work?” In Figure 8 we see Google as an octopus reaching out
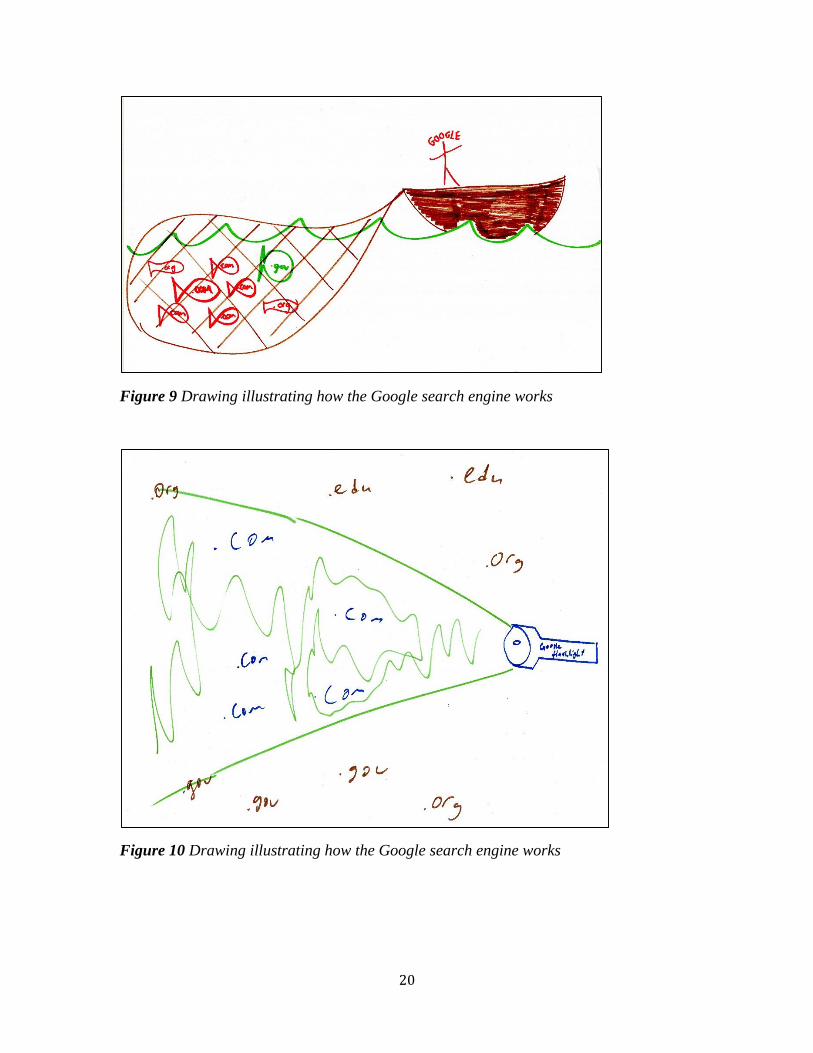
its tentacles to retrieve Web pages. In contrast, Figure 9 presents Google as a fisherman

10
throwing out a net and catching Web pages. In Figure 10 we see Google as a flashlight
providing illumination to sites in a dark internet. In Figure 11 Google is imagined as a net
and Web pages as butterflies to be caught. In Figure 12 Google is depicted as an arcade
claw game digging and picking up Web sites. Figure 13, though, expresses the way many
students think Google Search works: magic. The overwhelming majority of students had
no idea how the Google Search engine worked. Many believed Google searched the
internet directly and accessed all the sites on the internet. Many had never heard of the
“surface web” or the “invisible Web.” Many were unfamiliar with spiders crawling the
Web to build indexes. These drawings display ignorance with the rudimentary workings
of how the world’s most popular internet search engine works and this has important
consequences for those teaching students information literacy.
Drawing not only enables students to examine their assumptions and misconceptions,
they also provide librarians with a means to assess what students have learned. Before
and after drawings exemplify this. Figure 14 was drawn at the start of the class. Moving
back to the Google question in the paragraph above, we see a typical misconception of
how the Google Search engine works: Google searching the Internet directly represented
by the image of a claw directly picking up Internet sites. In contrast, Figure 15 was drawn
towards the end of class. We now see the same students breaking the search down into
three pictures: (1) spider programs gathering information from the Internet and following
links to other Web pages, (2) a Google index containing stored Web pages that students
actually search, and (3) the final results appearing on the researcher’s screen. The Step 2
drawing features the color red to indicate the keywords that were indexed in each Web
page. The arrows in Step 3 depict the same three Web pages from the Google index
appearing in the final search results. The matching colors in the documents appearing in
Step 2 and Step 3 along with the circles and arrows indicate the keyword match between
the query and the documents on the Google index. In the accompanying narrative the
students elaborated on the different types of questions the Google software asks before
displaying and sorting the final results. The other after drawings not shown included a
broad range of concrete and abstract images of spider programs, Googlebots, crawling,
indexing, keyword servers, and questions the Google software asks. This is important
because information literate students recognize that they should not rely on one search
engine and that they are only searching a fraction of the documents on the internet. The
drawings at the end of class clearly showed visual evidence of a more sophisticated
understanding of how the Google Search engine worked.
Finally, Figure 16 reverses the routine of having the students draw and then explain their
images to the class. This drawing was pre-drawn by a library staff member rather than by
students. The librarian posted the ready-made drawing on an easel at the start of class and
called upon students to decipher the meaning. Although few, if any, students could
accurately interpret the drawing, several created funny short stories to explain what was
going on in the picture. The staff made pre-drawings were useful in starting conversations
about the student’s visual understandings.

11
This select exhibition of drawings introduces librarians to the nature and possibility of
learning information literacy through drawing. The drawings provide a starting point for
an extended conversation on what students and librarians might do with this method.
Future directions
In the future, the authors would like to use Collaborative Speed Drawing in upper-level
undergraduate and graduate classes rather than exclusively freshmen-level introductory
courses. Moreover, the authors would like to improve the students’ impromptu
presentations on the drawings to their classmates as well as the audience’s reflection and
questions on the drawings. Additionally, to save paper and expand the social and
collaborative possibilities of drawing, the authors are investigating the feasibility of using
dry-erase paint such as IdeaPaint to transform the walls in their instruction rooms into
erasable surfaces. Further, the authors are interested in the possibility of combining
IdeaPaint with Evernote to enable librarians to take digital pictures of the drawings, email
them to all the students and instructor, and search the images for particular words.
Moving beyond instruction, the authors envision the library staff using erasable walls to
doodle and draw what they are talking about in meetings to articulate and solve problems
in the library.
Conclusion
For years librarians have been discussing information literacy. However, to date, they
have not paid much attention to the mental visual images underlying information literacy
concepts. The authors suggest that these images are not mere background, but that they
are the building blocks of understanding. They are core to information literacy’s
meanings. In this article, the authors introduce a teaching method called Collaborative
Speed Drawing to tap into the student’s visual world to illuminate the ways they use
these mental pictures to support and understand information literacy concepts. The
authors hope that other librarians will see the value of learning information literacy
through drawing and try it in their sessions.
References
Allen, N. (2002), Working with Words and Images: New Steps in an Old Dance, Ablex
Publishing, Westport, CT.
Baldwin, L. and Crawford, I. (2010), “Art instruction in the botany lab: A collaborative
approach”, Journal of College Science Teaching, Vol. 40 No. 2, pp. 26-31.
Bracke, P.J. and Dickstein, R. (2002), “Web tutorials and scalable instruction: Testing the
waters”, Reference Services Review, Vol.30, no.4, pp.330-337.

12
Detlor, B., Booker, L., Serenko, A. and Julien, H. (2012), “Student perceptions of
information literacy instruction: The importance of active learning”, Education for
Information, Vol. 29 No. 2, pp. 147-161.
Francis, M. (2012), “Using fun to teach rigorous content”, Communications in
Information Literacy, Vol. 6 No.2, pp. 151-159.
Kantrowitz, A. (2012), “The man behind the curtain: What cognitive science reveals
about drawing”, Journal of Aesthetic Education, Vol.46 No. 1, pp. 1-14.
Lakoff, G. (2004), Don't Think of an Elephant! Know Your Values and Frame the
Debate: The Essential Guide for Progressives, Chelsea Green Publishing Company,
White River Junction, VT.
McManus, J. (2009), Detecting Bull: How to Identify Bias and Junk Journalism in Print,
Broadcast and on the Wild Web, Unvarnished Press, Sunnyvale, CA.
Ozden, M. (2009), “Primary student teachers’ ideas of atoms and molecules: using
drawings as a research method”, Education, Vol. 129 No. 4, pp. 635-642.
Rathet, I. (1994), “English by drawing: Making the language lab a center for active
learning”, TESOL Journal, Vol. 3 No. 3, pp. 22-25.
Smith, M. and Hepworth, M. (2012), “Young people: A phenomenographic investigation
into the ways they experience information”, Libri, Vol.62 No.2, pp. 157-173.
Sult, L., Mery, Y., Blakiston, R. and Kline, E. (2013), “A new approach to online
database instruction: Developing the guide on the side”, Reference Services Review, Vol.
41 No.1, pp. 125-133.
Tomei, L.A. (2013), “Top 10 technologies for designing 21st century instruction”,
International Journal of Information and Communication Technology Education, Vol. 9
No. 3, pp. 80-93.
Willis, J. (2012), “Brain-based teaching strategies for improving students’ memory,
learning, and test-taking success”, Childhood Education, Vol. 18 No.23, pp. 310-315.

13
Figure 1 A drawing from a keyword selection exercise

14
Figure 2 A representation of plagiarism in an ethics workshop

15
Figure 3 An image of the common problem of patchwriting
Figure 4 An image of the common problem of patchwriting

16
Figure 5 A comparison of Web pages using the SMELL framework

17
Figure 6 An advertisement depicting the important features of a specific library database

18
Figure 7 An advertisement depicting the important features of a specific library database

19
Figure 8 Drawing illustrating how the Google search engine works
20
Figure 9 Drawing illustrating how the Google search engine works
Figure 10 Drawing illustrating how the Google search engine works

21
Figure 11 Drawing illustrating how the Google search engine works

22
Figure 12 Drawing illustrating how the Google search engine works

23
Figure 13 Drawing illustrating how the Google search engine works

24
Figure 14 Before drawing from “Before and After” exercise of how the Google search engine
works

25
Figure 15 After drawing from “Before and After” exercise of how the Google search engine
works

26
Figure 16 Drawing illustrating how the Google search engine works prepared before
class by library staff member Doug Gueco
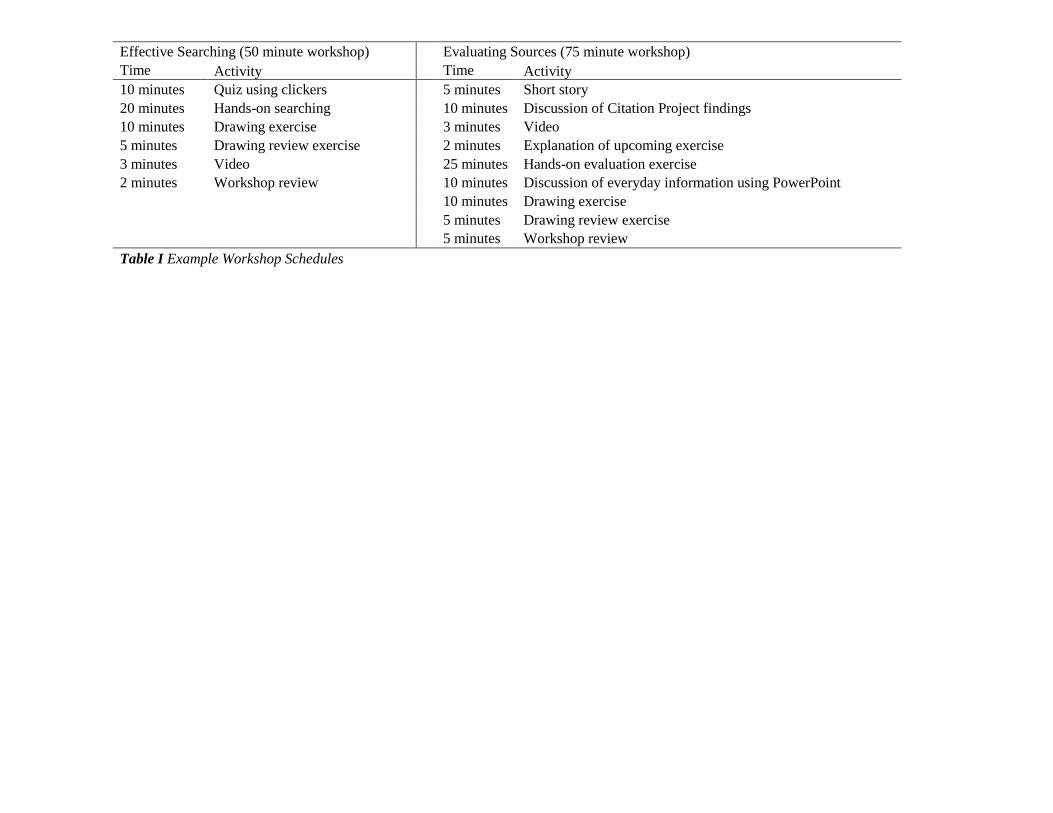
Effective Searching (50 minute workshop) Evaluating Sources (75 minute workshop)
Time Activity Time Activity
10 minutes Quiz using clickers 5 minutes Short story
20 minutes Hands-on searching 10 minutes Discussion of Citation Project findings
10 minutes Drawing exercise 3 minutes Video
5 minutes Drawing review exercise 2 minutes Explanation of upcoming exercise
3 minutes Video 25 minutes Hands-on evaluation exercise
2 minutes Workshop review 10 minutes Discussion of everyday information using PowerPoint
10 minutes Drawing exercise
5 minutes Drawing review exercise
5 minutes Workshop review
Table I Example Workshop Schedules