
Learning-induced Attentional Changes in Visual Search
167
Learning-induced Attentional Changes in Visual Search A Dissertation SUBMITTED TO THE FACULTY OF UNIVERSITY OF MINNESOTA BY Sha Li IN PARTIAL FULFILLMENT OF THE REQUIREMENTS FOR THE DEGREE OF DOCTOR OF PHILOSOPHY Advisor: Yuhong Jiang May 2019
Transcript of Learning-induced Attentional Changes in Visual Search
Learning-induced Attentional Changes in Visual Search
A Dissertation SUBMITTED TO THE FACULTY OF
UNIVERSITY OF MINNESOTA BY
Sha Li
IN PARTIAL FULFILLMENT OF THE REQUIREMENTS FOR THE DEGREE OF
DOCTOR OF PHILOSOPHY
Advisor: Yuhong Jiang
May 2019

© Sha Li 2019

i
Acknowledgements I want to express my deepest gratitude to my advisor, Prof. Yuhong Jiang, who makes me truly understand what a great scientist and advisor looks like. I thank Yuhong for listening to me when we had different opinions about research, understanding and supporting me when I made important decisions on my career, and helping me when I encountered difficulties in research and in life. She has helped me grow up and become a more independent researcher. I just feel so fortunate to have such an intelligent, hardworking, responsible, productive, patient, and considerate advisor. I hope, and believe, that we will make a lifelong friendship. I thank Prof. Roger Remington for working with me during the past five years. He has made not only insightful comments on my research, but also useful suggestions on my career development. I also thank Prof. Daniel Kersten for mentoring me during computational vision projects. Although these projects were not included in this dissertation, I gained rich experience in machine learning in his lab and this is necessary and important for my future career. Thank you to Profs. Wilma Koutstaal, Stephen Engel, and Nathaniel Helwig, for serving as my committee members and making suggestions on my research and dissertation. Thank you to all lab members, who have accompanied me in my journey as a graduate student. Douglas Addleman, Caitlin Sisk, and Nikita Salovich, thank you for proof reading my research manuscripts and dissertation. Deborah Tan, Jihyang Jun, and Yi Ni Toh, thank you for helping me in various ways. I also want to thank all my current and previous undergraduate research assistants for their help with data collection. Thanks to my dear friends in the United States and China for their support and encouragement, especially Yujia Peng and Weiqi Zhang for their great help. I also thank my mother for her unconditional love and attention. Although my work is far beyond her scope of understanding, she has always been supporting me in this endeavor. Finally, I want to thank my spouse, Yingchen He, for her respect, understanding, support, and love. Her company has made me a better person and unafraid of the difficulties and changes in life. This thesis research was supported by a seed grant from OFAA-Social Sciences (University of Minnesota, Twin Cities) to Prof. Yuhong Jiang and American Psychological Association Dissertation Research Award (2017) and the Doctoral Dissertation Fellowship (University of Minnesota, Twin Cities) to Sha Li. Trips to present the results were also supported by Vision Science Society Student Travel Award (2017) and Graduate Student Research and Travel Award (Department of Psychology, University of Minnesota, Twin Cities).

ii
Dedicated to my mother, Guichun Zhou, who gives me the opportunity to see this beautiful world and write this dissertation.

iii
Abstract
Extensive research has shown that prior experience and selection history modulate
visual selective attention. Humans are able to learn various types of statistical regularities
and use them to optimize allocation of attention. For example, people typically respond
faster to visual properties that are predictive of important stimuli (e.g., rewards and
search targets) in the past. However, much less is known about whether established
attentional modulation persists when the task or visual statistics change. This dissertation
aims to understand the effects of visual statistical learning on attention and how such
learning adapts to changes in the environment. The first study focuses on reward learning.
The results show that participants respond faster to targets that lead to higher reward. But
when presented as distractors in a subsequent task, previously high-reward targets do not
capture more attention. These findings suggest that monetary reward enhances attentional
priority for high-reward targets, but the enhancement dissipates when the prioritized
items become distractors in a different task. The second study shows that people are
sensitive to occurrence rates of visual features such as color. Participants respond faster
to colors that are more frequently associated with the target. However, when colors
become equally frequent, people do not always continue prioritizing the previously high-
frequency colors. Changes in attentional priority depend on the type of statistical
regularities people have learned. The third study examines transfer of the location
probability effect across different tasks. Behavioral and eye tracking data suggest that
participants prioritize spatial locations that are more likely to contain the target. However,

iv
established spatial priority does not transfer to a novel task that requires a different
oculomotor search procedure. This dissertation demonstrates that various types of
statistical learning affect visual selective attention. However, constraints exist in whether
the learning-induced attentional modulation persists in a dynamic environment.
v
Table of Contents
1.OVERVIEW...........................................................................................................................................1
1.1.VISUALSELECTIVEATTENTION......................................................................................................................2
1.1.1.Goal-directedandstimulus-drivenattention...............................................................................2
1.1.2.Theroleofselectionhistoryinattention........................................................................................4
1.2.STATISTICALLEARNING...................................................................................................................................7
1.2.1.Statisticallearningofvarioustypesofinformation..................................................................7
1.2.2.Interactionbetweenstatisticallearningandattention........................................................10
1.2.3.Constraintsofstatisticallearning..................................................................................................12
1.3.SUMMARY........................................................................................................................................................14
2.STUDY1:COMPONENTSOFREWARD-DRIVENATTENTIONALCAPTURE...................16
PREFACE...................................................................................................................................................................16
INTRODUCTION.......................................................................................................................................................17
EXPERIMENT1........................................................................................................................................................23
Method....................................................................................................................................................................24
Results.....................................................................................................................................................................27
Discussion..............................................................................................................................................................28
EXPERIMENT2........................................................................................................................................................30
Method....................................................................................................................................................................32
Results.....................................................................................................................................................................34
Roleofexplicitawareness..............................................................................................................................40
Discussion..............................................................................................................................................................41
GENERALDISCUSSION...........................................................................................................................................43

vi
CONCLUSION............................................................................................................................................................47
INTRODUCTIONTOSTUDY2.................................................................................................................................48
3.STUDY2:SHORT-TERMANDLONG-TERMATTENTIONALBIASESTOFREQUENTLY
ENCOUNTEREDTARGETFEATURES.............................................................................................49
PREFACE...................................................................................................................................................................49
INTRODUCTION.......................................................................................................................................................51
EXPERIMENT1........................................................................................................................................................56
Method....................................................................................................................................................................58
Results.....................................................................................................................................................................61
Discussion..............................................................................................................................................................63
EXPERIMENT2........................................................................................................................................................64
Method....................................................................................................................................................................66
Results.....................................................................................................................................................................67
Discussion..............................................................................................................................................................68
EXPERIMENT3........................................................................................................................................................70
Method....................................................................................................................................................................71
Results.....................................................................................................................................................................72
Discussion..............................................................................................................................................................73
EXPERIMENT4........................................................................................................................................................74
Method....................................................................................................................................................................75
Results.....................................................................................................................................................................76
Repetitionpriming............................................................................................................................................78
Explicitrecognition...........................................................................................................................................79

vii
GENERALDISCUSSION...........................................................................................................................................80
CONCLUSIONS..........................................................................................................................................................85
INTRODUCTIONTOSTUDY3.................................................................................................................................86
4.STUDY3:SEARCHINGFOR“TUMORS”:STATISTICALLEARNINGOFPROBABLE
“TUMOR”LOCATIONSFACILITATESBOTHDETECTIONANDDISCRIMINATIONIN
VISUALSEARCH...................................................................................................................................87
PREFACE...................................................................................................................................................................87
SIGNIFICANCESTATEMENT..................................................................................................................................88
BACKGROUND..........................................................................................................................................................89
EXPERIMENT1........................................................................................................................................................94
Method....................................................................................................................................................................97
Results..................................................................................................................................................................100
Discussion...........................................................................................................................................................103
EXPERIMENT2.....................................................................................................................................................105
Method.................................................................................................................................................................107
Results..................................................................................................................................................................109
Discussion...........................................................................................................................................................118
Awareness..........................................................................................................................................................119
GENERALDISCUSSION........................................................................................................................................121
CONCLUSION.........................................................................................................................................................128
APPENDIX..............................................................................................................................................................128
5.GRANDSUMMARYANDGENERALDISCUSSION..................................................................131
5.1.SUMMARYOFALLEXPERIMENTS..............................................................................................................131
viii
5.2.THEORETICALIMPLICATIONS....................................................................................................................133
5.2.1.Influenceofrewardlearningonvisualattention.................................................................133
5.2.2.Durabilityoffeaturalprobabilityeffect....................................................................................135
5.2.3.Transferoflocationprobabilitylearningacrossdifferenttasks...................................138
5.4.FUTURERESEARCHDIRECTIONS...............................................................................................................141
5.4.1.Featuralprobabilitylearninginvisualsearchtasks...........................................................141
5.4.2.Effectsoflocationprobabilitylearningonspatialattention..........................................142
REFERENCES.......................................................................................................................................144

ix
List of Tables
TABLE2-1.MEANACCURACYINTHETESTINGPHASEOFEXPERIMENT2..................................................37
TABLE3-1.PERCENTAGECORRECTINALLFOUREXPERIMENTS..................................................................61
TABLE3-2.MEANRTANDPERCENTRTSAVINGINTHETRAININGPHASE...............................................79

x
List of Figures
FIGURE2-1.SCHEMATICILLUSTRATIONSOFTHESEARCHDISPLAYS..........................................................23
FIGURE2-2.RESULTSFROMEXPERIMENT1....................................................................................................27
FIGURE2-3.RESULTSFROMTHETRAININGPHASEOFEXPERIMENT2......................................................35
FIGURE2-4.RESULTSFROMTHETESTINGPHASEOFEXPERIMENT2.........................................................38
FIGURE3-1.ASCHEMATICILLUSTRATIONOFASEARCHDISPLAYUSEDINEXPERIMENT1....................58
FIGURE3-2.RESULTSFROMEXPERIMENT1....................................................................................................63
FIGURE3-3.ASCHEMATICILLUSTRATIONOFADISPLAYUSEDINEXPERIMENT2...................................65
FIGURE3-4.RESULTSFROMEXPERIMENT2....................................................................................................68
FIGURE3-5.RESULTSFROMEXPERIMENT3....................................................................................................72
FIGURE3-6.RESULTSFROMEXPERIMENT4....................................................................................................76
FIGURE4-1.SAMPLEVISUALSEARCHTRIALS...................................................................................................96
FIGURE4-2.TARGET-PRESENTRTDATAFROMEXPERIMENT1...............................................................101
FIGURE4-3.MEANRTONTARGET-PRESENTTRIALSOFEXPERIMENT2...............................................109
FIGURE4-4.FIXATIONDATAFROMTHETRAININGPHASEOFEXPERIMENT2.......................................113
FIGURE4-5.FIXATIONDATAFROMTHETESTINGPHASEOFEXPERIMENT2..........................................114
FIGURE4-6.DIRECTIONOFTHEFIRSTSACCADICEYEMOVEMENTINEXPERIMENT2..........................116
APPENDIXFIGURE4-1.DIRECTIONOFTHEFIRSTSACCADICEYEMOVEMENTONTARGET-PRESENT
TRIALSINEXPERIMENT2..................................................................................................................................128

1
1. Overview
Many activities, such as reading, driving, and hunting, involve processing of
complex visual information. During these activities, a large amount of visual input
impinges on our retina, but only a subset of which can be adequately processed. The
information overload exerts significant computational demands on the visual system to
selectively process relevant information, allowing resources to be optimally allocated.
Two major mechanisms exist to address this computational challenge. First, selective
attention allows us to prioritize relevant information at the expense of irrelevant
information. Second, learning of environmental regularities (“statistical learning”)
reduces the complexity of the sensory input in part by facilitating the determination of
what is or is not relevant. Extensive research has been conducted on both topics, often in
parallel to each other (Desimone & Duncan, 1995; Driver, 2001; Fiser & Aslin, 2001,
2002; Johnston & Dark, 1986; Saffran & Kirkham, 2018; Treisman, 1969; Yantis &
Jonides, 1990). Only recently have psychologists begun to identify the connection
between selective information processing and statistical learning (Chun & Jiang, 1998,
1999; Geng & Behrmann, 2002; Jiang & Chun, 2001; Saffran, Newport, Aslin, Tunick, &
Barrueco, 1997; Yu & Zhao, 2015; Zhao, Al-Aidroos, & Turk-Browne, 2013). The goal
of this dissertation is to enrich an understanding of how statistical learning enhances
visual attention.
The dissertation is comprised of three parts, based on three first-author peer-
reviewed articles that I published in my graduate career (Sha & Jiang, 2015; Sha,
2
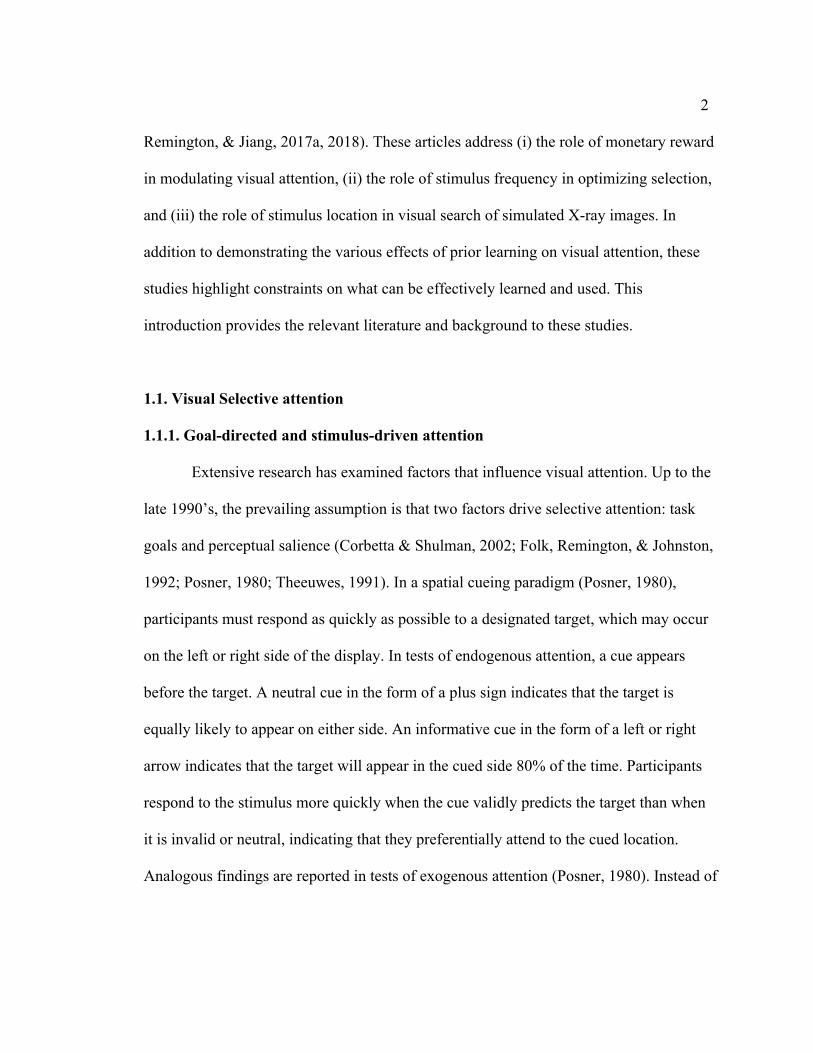
Remington, & Jiang, 2017a, 2018). These articles address (i) the role of monetary reward
in modulating visual attention, (ii) the role of stimulus frequency in optimizing selection,
and (iii) the role of stimulus location in visual search of simulated X-ray images. In
addition to demonstrating the various effects of prior learning on visual attention, these
studies highlight constraints on what can be effectively learned and used. This
introduction provides the relevant literature and background to these studies.
1.1. Visual Selective attention
1.1.1. Goal-directed and stimulus-driven attention
Extensive research has examined factors that influence visual attention. Up to the
late 1990’s, the prevailing assumption is that two factors drive selective attention: task
goals and perceptual salience (Corbetta & Shulman, 2002; Folk, Remington, & Johnston,
1992; Posner, 1980; Theeuwes, 1991). In a spatial cueing paradigm (Posner, 1980),
participants must respond as quickly as possible to a designated target, which may occur
on the left or right side of the display. In tests of endogenous attention, a cue appears
before the target. A neutral cue in the form of a plus sign indicates that the target is
equally likely to appear on either side. An informative cue in the form of a left or right
arrow indicates that the target will appear in the cued side 80% of the time. Participants
respond to the stimulus more quickly when the cue validly predicts the target than when
it is invalid or neutral, indicating that they preferentially attend to the cued location.
Analogous findings are reported in tests of exogenous attention (Posner, 1980). Instead of

3
an arrow, a peripheral cue flashes briefly (around 100ms) to the left or right of fixation
prior to the occurrence of the detection target. Although the cue is uninformative of the
target’s location (i.e., its validity is 50%), response time (RT) is faster when the target
occurs on the same, rather than the opposite, side of the cue. These results provide
compelling evidence that both endogenous cues and perceptually salient exogenous cues
can drive spatial attention.
Functional brain imaging reveals converging evidence for the presence of brain
networks corresponding to endogenous and exogenous control of attention (see Corbetta
& Shulman, 2002 for review). The dorsal fronto-parietal regions including the
intraparietal sulcus and the frontal eye field are involved in goal-directed shifts of spatial
attention (Corbetta, Kincade, Ollinger, McAvoy, & Shulman, 2000; Corbetta, Kincade, &
Shulman, 2002; Hopfinger, Buonocore, & Mangun, 2000; Kastner, Pinsk, De Weerd,
Desimone, & Ungerleider, 1999). This network also controls the selection of features or
objects, such as color and motion (Assad & Maunsell, 1995; Toth & Assad, 2002). In
contrast, a separate system including the temporoparietal junction cortex (TPJ) and the
ventral frontal cortex specializes in the detection of salient and unexpected stimuli. For
example, the TPJ is not engaged during the onset of a cue that indicates the likely
movement direction of a subsequent stimulus, but is strongly activated when the stimulus
occurs at an unexpected location (Corbetta, Kincade, Ollinger, McAvoy, & Shulman,
2000; Perry & Zeki, 2000).

4
Goal-driven and stimulus-driven attention do not operate completely
independently, however. Whether a perceptually salient stimulus captures attention
depends in part on the top-down control setting the observer adopts. For example, an
abrupt onset at a distractor location slows down response to a target stimulus when the
target itself has an abrupt onset. Onset capture does not occur if the target is defined as a
uniquely colored stimulus among homogenously colored distractors. Conversely, an
irrelevant singleton color cue produces greater interference if the target is a color
singleton at an uncued location but not if the target appears with an abrupt onset (Folk et
al., 1992). These findings indicate that although both endogenous and exogenous controls
of attention exist, the effectiveness of exogenous attention depends, in part, on
endogenous control of attention.
1.1.2. The role of selection history in attention
The dichotomous view of visual attention has successfully accounted for many
behavioral and neuroscience findings on attention. However, this view neglects a critical
source of selection: prior experience and selection history. For example, people are
sensitive to the repetition of the spatial configurations of items during visual search, even
though they are not explicitly aware of the repetition. In Chun and Jiang (1998),
participants searched for a sideways letter “T” among eleven letter “L”s and reported the
orientation of the T. The locations of distractors on each trial comprised a configuration,
or spatial context. Some displays repeated every 24 trials or so (“old”), whereas others

5
were newly generated, except for the repetition of the target location (“new”).
Participants were faster finding the target in old configurations than in new
configurations, showing contextual cueing. Thus, learning of the association between
spatial contexts and target locations guides visual attention. Contextual cueing is largely
implicit, occurring without an intent to learn or explicit awareness of what has been
learned (Chun & Jiang, 1998, 1999, 2003; Olson & Chun, 2001). Once acquired, the
effect lasts for at least a week (Jiang, Swallow, Rosenbaum, & Herzig, 2013).
Visual attention is also sensitive to short-term selection history effects, such as
inter-trial repetition priming. When two consecutive trials contain the same stimulus,
search is faster if this stimulus is the target on both trials (inter-trial priming; Hillstrom,
2000; Maljkovic & Nakayama, 1994, 2000), or slower if the target on one trial was a
distractor on the preceding trial (negative priming; Neill, Terry, & Valdes, 1994). More
broadly, people respond faster when they perform the same task on consecutive trials
(Waszak, Hommel, & Allport, 2003), make the same response (Lamy, Yashar, &
Ruderman, 2010), encounter the same target stimulus (Maljkovic & Nakayama, 1994;
Müller, Heller, & Ziegler, 1995), and find a search target in the same location (Maljkovic
& Nakayama, 1996) as what they just experienced. Unlike contextual cueing, inter-trial
priming effects are temporary. Repetition of target features has the strongest effect on the
immediately next trial. This effect diminishes with increasing trial lag. It becomes
insignificant after 5-8 intervening trials (Maljkovic & Nakayama, 1994), or after an
unfilled delay of 90 seconds (Maljkovic & Nakayama, 2000).
6
Additional factors that induce selection history effects include reward, emotional
state, and semantic associations acquired previously. For example, colors predictive of
higher monetary reward in a preceding search session capture attention even when they
are currently task-irrelevant (Anderson, Laurent, & Yantis, 2011a; Chelazzi et al., 2014;
Le Pelley, Pearson, Griffiths, & Beesley, 2015). Stimuli with high emotional valence,
such as a fearful face or a negative word, also capture attention owing to their ecological
significance (Anderson & Phelps, 2001; Hodsoll, Viding, & Lavie, 2011; Most & Wang,
2011; Williams, Moss, Bradshaw, & Mattingley, 2005).
Thus, various factors related to previous experience affect visual attention. These
findings challenge the dichotomous model of attentional selection, in which “top-down”
and “bottom-up” factors dictate the priority of visual processing. Awh and colleagues
propose a unified priority map framework, in which a priority map integrates three
sources of selection bias: the observers’ current task goals, selection history, and the
physical salience of items that compete for attention (Awh, Belopolsky, & Theeuwes,
2012). Of the three major drivers of attention, selection history is less well understood
compared with goal-directed and stimulus-driven attentional control. This dissertation
aims to understand selection history effects, with a focus on the role of statistical learning
in modulating attention.

7
1.2. Statistical Learning
Selection history effects demonstrate that humans can learn from prior experience
and use this information to guide attention. Indeed, a separate literature provides strong
evidence for the existence of various forms of statistical learning. Natural visual
environments contain statistical regularities, including regularities in the locations or
features of important objects. For example, apples are typically red or green but not blue,
and they grow on trees but not in the soil. Statistical learning (SL) is the ability to extract
statistical regularities in the environment to facilitate perception, action, and attention.
Most forms of statistical learning are implicit, occurring without an intention to learn or
explicit awareness of what is learned (Chun & Jiang, 1998, 1999, 2003; Fiser & Aslin,
2002; Olson & Chun, 2001; Turk-Browne, Jungé, & Scholl, 2005; Turk-Browne, Scholl,
Chun, & Johnson, 2009). Examples of statistical regularities that people can learn
include, but are not limited to, co-occurrence of events or objects (e.g., toasters and
microwaves tend to co-occur), dependency between words in speech or in artificial
languages (e.g., an article is usually followed by a noun), and the probable locations of
objects (e.g., mailboxes on the side of a street).
1.2.1. Statistical learning of various types of information
One of the first studies on statistical learning examined the acquisition of an
artificial grammar (Reber, 1967). The author created a grammar that produced different
“sentences” with five letters: P, S, T, V, X. These sentences formed an artificial language.

8
After an initial exposure to this language, participants encountered new sentences that
either followed or violated the learned grammar. Participants were able to identify the
grammatical sentences at above chance levels, even though the exact sentences used in
the testing phase differed from those used in the exposure stage. These findings indicate
that people learned the general grammatical structure, rather than specific instances of the
artificial language. Subsequent studies extended these findings to infants. For example,
Saffran, Aslin, and Newport (1996) presented 8-month-old infants with a continuous
stream of speech consisting of artificial tri-syllabic words (e.g., babupu, bupada). A
speech synthesizer removed the boundaries between words. However, the transitional
probability between syllables within a word (e.g., the probability of “bu” following “ba”)
was higher than that between syllables spanning a word boundary (e.g., the probability of
“bu” following “pu”). Both adults and infants could use transitional probabilities to
segment the speech into words. After just two minutes of listening to the streams, the
infants evidenced learning. They listened to non-words for a longer time than “words” in
a subsequent test phase. Additional research shows that statistical learning can occur at
multiple levels of language acquisition, including word learning and grammar learning
(Saffran & Wilson, 2003).
Statistical learning also applies to tones, sequences of shapes, and even tactile
stimuli (Conway & Christiansen, 2005; Fiser & Aslin, 2001; Saffran, Johnson, Aslin, &
Newport, 1999). For instance, Fiser and Aslin (2001, 2002) extended Saffran et al.
(1996)’s work to examine visual statistical learning (VSL) of novel shapes. They found

9
that people could acquire VSL both for simultaneously presented objects and for
temporal sequences of shapes. In Fiser and Aslin (2001), participants viewed visual
scenes containing novel shapes drawn from a set of twelve. Unbeknownst to the
participants, the twelve shapes were grouped into six base pairs. A base pair was defined
as two specific shapes with a particular spatial relation (e.g., shape A directly above
shape B). During the familiarization phase, each visual scene contained three base pairs
that were randomly placed in a 3×3 grid. Compared with shapes from different base pairs,
shapes within a base pair were more likely to occur in spatially adjacent locations.
Following the familiarization phase of 144 trials, participants were tested in a forced
choice task. On each trial of the testing, they were shown a base pair and two shapes from
different pairs. Their task was to choose the base pair. Participants performed at above-
chance levels in choosing base pairs, suggesting that they had acquired the statistical
dependencies among the shapes. These results demonstrate that people can extract
statistics of visual shape arrays. fMRI studies showed greater neural responses to the
structured shapes than random sequences in striatum and medial temporal lobe (Turke-
Browne et al., 2009), even in participants who evidenced no explicit awareness of the
structure. Learning of repeating sequences of stimuli does not depend on explicit
awareness. Patients with Korsakoff’s syndrome, who could not explicitly remember the
repeated sequence of visual stimuli and responses, were intact at learning the sequences
(Nissen & Bullemer, 1987).
10
Participants have also demonstrated sensitivity to ensemble statistics of an array
of objects. In one study, the authors presented participants with two arrays of 12 circles in
various sizes, one on the left and the other on the right side of the screen (Chong &
Treisman, 2003). Participants were able to accurately select the array that had a larger
mean size even when the arrays were presented briefly one after the other. People can
also readily extract the ensemble statistics of natural stimuli, such as faces, scenes, and
biological motion of human crowds (Haberman & Whitney, 2009; Sweeny, Haroz, &
Whitney, 2013). For instance, Haberman and Whitney (2009) showed participants a set
of faces with various expressions for 500ms. Although the participants could not
accurately remember the expression of any individual faces, they were able to accurately
estimate the mean emotion of each set. These findings show that people are able to
extract ensemble statistics from briefly presented information.
1.2.2. Interaction between statistical learning and attention
The studies reviewed above demonstrate human’s strong capacity of learning
statistical regularities, which may potentially influence attention. In fact, many studies
have revealed an interaction between statistical learning and visual attention (Chun &
Jiang, 1998, 1999; Jiang & Chun, 2001; Saffran et al., 1997; Zhao, Al-Aidroos, & Turk-
Browne, 2013). For example, one study showed that statistical regularities attracted
spatial attention even when they were unpredictive of the target’s location (Zhao, Al-
Aidroos, & Turk-Browne, 2013). In this study, participants viewed four streams of visual
11
shapes located in a diamond configuration. Similar to Fiser and Aslin (2002), one of the
four streams contained a regular, predictive sequence of shapes (e.g., triplets of shapes
presented in a predictable sequence). The other three streams contained temporally
unpredictable sequences of shapes. These sequences were occasionally interrupted by a
search display containing a target letter “T” and three distractor “L”s occupying the same
locations as the streams. Even though the location of the regular stream was unpredictive
of the search target’s location, participants were faster finding the T when it occurred in
the location of the regular shape stream rather than in the random streams. Follow-up
experiments showed that the color of a regular shape stream was better attended than the
color of random streams (Zhao et al., 2013). These findings indicate that spatial and
featural attention are biased toward stimuli that are statistically regular.
On the flip side, selective attention also influences what people can learn. One
study on SL examined whether participants could acquire auditory statistical learning
when their attention was diverted by a picture-drawing task (Saffran et al., 1997). Under
single-task conditions, participants were able to extract the transitional probabilities
among meaningless syllables, showing higher familiarity with the artificial “words” than
“non-words”. But learning was weaker when attention was diverted away. Similarly,
another study showed that performing a secondary task (e.g., line drawings, detecting
pitch changes) impaired statistical learning of a speech stream (Toro & Trobalón, 2005).
The findings above reveal a reciprocal relationship between visual attention and
statistical learning. Statistical learning about the target’s location or shape sequences

12
modulates spatial attention; conversely, selective attention affects what people are likely
to learn or rely on among the myriad of statistical regularities in the environment.
1.2.3. Constraints of statistical learning
The prior literature reveals human’s strong capacity for extracting statistics from
the environment; however, there are constraints on statistical learning. First, learned
information may interfere with the acquisition of new information, a primacy effect in
learning. One study reported that learning of one artificial language precluded learning of
a subsequent new language (Gebhart, Aslin, & Newport, 2009). In this study, participants
listened to two artificial languages (referred to as languages A and B) containing “words”
that were made up of meaningless syllables. In the familiarization phase, one group of
participants listened to language A and the other listened to language B, for about five
minutes. In the subsequent test phase, participants were presented with a word and a foil
on each trial, and asked to choose the more familiar one. Both groups correctly chose the
words in the respective language with comparable levels of accuracy (around 79%). To
examine the durability of learning and its potential interference effects on subsequent
learning, the authors presented a new group of participants with both languages, one after
the other, without temporal delays between them or explicit instructions about changes in
the structure. These participants showed learning of the first language they encountered
but not the second one. Their performance on the first language was comparable to the
participants who learned only that language. But their performance on the second
13
language was significantly lower, suggesting that learned information interfered with new
learning. Analogous effects were found in a contextual cueing study (Jungé, Scholl, &
Chun, 2007). In this study, the training phase consisted of a predictive phase, in which
the configurations of distractors were predictive of the target location, and a random
phase in which the configurations were uninformative. One group of participants was
first exposed to the predictive phase and then the random phase. The order of the two
phases was reversed for the other group of participants. Participants acquired contextual
cueing if the predictive phase preceded the random phase, but not if the random phase
came first. These findings suggest that an initial random phase interferes with subsequent
contextual learning.
Second, statistical learning exhibits viewpoint dependency. In location
probability learning, participants search for a target among distractors, without the
knowledge that the target is more likely to occur in some locations than in others.
Participants rapidly acquire this probability structure: they respond to the target faster
when it occurs in the high-probability locations than when it occurs in the low-probability
locations. The effect occurs even in participants who cannot identify the high-probability
locations (Geng & Behrmann, 2002). Once acquired, this learning persists for several
hundred trials when the target’s location becomes random, or after a one-week delay
(Jiang, Swallow, Rosenbaum, & Herzig, 2013). However, location probability learning
occurs only when the viewpoint of the participants is held constant. In Jiang and Swallow
(2014), participants searched for a letter “T” among “L”s placed on a tabletop. The

14
participants stood at a random location around the tabletop at the beginning of each trial.
Although the target had a high probability of appearing in one fixed region of the tabletop,
participants failed to prioritize that region. Instead, they acquired location probability
learning only when the more probable locations were consistently referenced relative to
their viewpoint. The viewpoint dependence constrains the type of statistical regularity
that people can learn in the visual environment.
1.3. Summary
The literature reviewed above demonstrates that (i) statistical learning affects the
deployment of visual attention, (ii) human are capable of learning many forms of
statistical regularities, and (iii) constraints exist in what people can learn and use. The
diversity of selection history effects, however, suggests that the underlying mechanisms
and constraints are likely to differ for each type of learning, such as reward learning,
short-term inter-trial priming, and long-term contextual or location probability learning.
This dissertation aims to further elucidate the mechanisms of statistical learning in
attention. It is structured as three research papers, focusing on the characteristics of three
types of statistical learning and their impact on visual search. Study 1 examined
attentional capture induced by search targets that previously received high monetary
reward. Contradicting the prevailing theory of value-based attentional capture, this study
showed that previously searched features, but not reward-associated features, slowed
down search speed in a subsequent task. This study adds to the growing literature on

15
reward-based attention by providing alternative interpretations. Study 2 contrasted short-
term with long-term learning, with a focus on mechanisms underlying target featural
probability effects. The results showed that participants can learn two types of
conditional probabilities of target features; however, only one of them has long lasting
effects on search performance. In this paper, we proposed a new theory to account for the
mixed findings in prior literature. Study 3 used simulated X-ray images to examine the
transfer of location probability learning across two tasks. Participants searched for a letter
“T” camouflaged in low-frequency noise and performed either a target detection or a
target discrimination task. Although the stimuli and task goals were similar, location
probability learning in one task did not transfer to the other. Eye tracking data showed
different fixation and saccade patterns, providing a possible account for this lack of
transfer. Taken together, this dissertation deepens understanding of how statistical
learning affects attention. It also uncovers new constraints on statistical learning.

16
2. Study 1: Components of reward-driven attentional capture
This study was published in Attention, Perception, & Psychophysics (2016). Full
citation: Sha, L.Z. & Jiang, Y.V. (2016). Components of reward-driven attentional
capture. Atten Percept Psychophys, 78(2): 403-414. https://doi.org/10.3758/s13414-
015-1038-7. The article is reproduced here.
Components of reward-driven attentional capture
Li Z. Sha
Yuhong V. Jiang
Department of Psychology, University of Minnesota
Short title: Reward and attention
Preface
Recent research reported that task-irrelevant colors captured attention if these
colors previously served as search targets and received high monetary reward. Here we
showed that both monetary reward and value-independent mechanisms influenced
selective attention. Participants searched for two potential target colors among distractor
colors in the training phase. Subsequently they searched for a shape singleton in a testing
phase. Experiment 1 found that participants were slower in the testing phase if a
distractor with the previous target colors was present rather than absent. Such slowing
17
was observed even when no monetary reward was used during training. Experiment 2
introduced monetary reward to the target colors during the training phase. Participants
were faster finding the target associated with higher monetary reward. However, reward
training did not yield value-dependent attentional capture in the testing phase. Attentional
capture by the previous target colors was not significantly greater for the previously high-
reward color than the previously low or no-reward color. These findings revealed both
the power and limitations of monetary reward on attention. Although monetary reward
can increase attentional priority for the high-reward target during training, subsequent
attentional capture effects may reflect, in part, attentional capture by previous targets.
Keywords: Selective attention; visual search; reward learning; attentional capture
Introduction
Neurons in many cortical and subcortical regions are sensitive to reward (Shuler
& Bear, 2006; Vickery, Chun, & Lee, 2011). In humans, secondary reward such as
money is a powerful motivation for many behaviors. Recent laboratory research has
found extensive evidence that monetary reward influences how limited processing
resources are prioritized (for a review, see Anderson, 2013; Chelazzi, Perlato,
Santandrea, & Della Libera, 2013). Anderson, Laurent, and Yantis (2011a) were among
the first to show that task-irrelevant stimuli previously associated with high monetary
reward captured attention. They asked participants to search for a target color among

18
distractor colors and report the orientation of the line inside the target. The single target
on each trial could be either red or green. Unbeknownst to participants, targets in one
color frequently yielded a higher monetary reward than targets in the other color.
Although participants found both colors equally quickly in the training phase, reward
association had long-lasting influences on attention. In a testing phase participants
searched for a unique shape and reported the orientation of the line inside the singleton
shape. Color was irrelevant in this phase, but red or green appeared as a distractor color
on half of the trials. The presence of red or green slowed down reaction time (RT),
relative to when they were absent, demonstrating attentional capture. The high-reward
color produced a numerically larger capture effect than the low-reward color (16 vs. 8
ms, though a direct statistical comparison was not reported), suggesting that monetary
reward influenced attention.
Value-driven attentional capture launched a large wave of research, with many
studies reporting conceptually similar findings to the original results (Anderson, Laurent,
& Yantis, 2011a). For example, Failing and Theeuwes (2014) showed that after an initial
training phase in which one color led to greater monetary reward than the other, the more
highly rewarded color later induced greater exogenous cuing. These findings provide
compelling evidence that monetary reward is a powerful driver of selective attention
(Awh, Belopolsky, & Theeuwes, 2012; Gottlieb, Hayhoe, Hikosaka, & Rangel, 2014).
However, these findings were not without controversies. Two issues emerged in
the growing literature. First, not all studies supported the initial characterization of

19
attentional capture as value-dependent. Second, whereas some studies found no effects of
reward in the training phase, others found that people were faster responding to the more
highly rewarded target during training. Here we provide a brief review of these findings
before presenting new experimental data to further examine these issues.
Perhaps the most unsettled issue on reward-based attention is whether monetary
reward drives attention in a value-dependent or value-independent manner. One close
independent replication of the value-dependent attentional capture was reported by Jiao
and colleagues (Jiao, Du, He, & Zhang, 2015). These researchers led participants to
believe that they were performing the search task simultaneously with another
participant, who may receive the same, more, or less reward relative to their own reward.
When participants were led to believe that the other individual received the same or less
reward, the previously reward-associated colors induced attentional capture, and the
magnitude of the capture was greater for the previous high-reward than the previous low-
reward color. Value-dependent attentional capture was also observed in Anderson and
colleagues’ more recent work (Anderson, 2015; Anderson & Yantis, 2013; Anderson et
al., 2011b), and in studies that trained participants to associate reward with a single
stimulus (as opposed to a search target; e.g., Mine & Saiki, 2015). Other studies using
primary reward such as chocolate odor or electric shock have also observed value-
dependent capture effects by previously reward-associated stimuli (Miranda & Palmer,
2013; Pool, Brosch, Delplanque, & Sander, 2014). Contradicting these findings of value-
dependency were other studies that showed either no effects of reward training or
20
attentional capture that was value-independent. For example, using Anderson et al.’s
(2011a) paradigm, Roper et al. (2014) did not find significant differences among high-
reward, low-reward, and baseline conditions in their adult sample. Other studies reported
increased capture by previously rewarded stimuli, but the capture effect was not greater
for the more highly-reward stimulus (Anderson, Laurent, & Yantis, 2013). In addition,
some studies that reported monetary reward driven capture effects did not always report
results from the low-reward color, either because this condition was omitted from the
design (e.g., Experiment 4 of Sali, Anderson, & Yantis, 2014), or because no direct
statistical comparisons were made between the high- and low- reward stimuli (e.g.,
Anderson et al., 2011a). Comparing high- and low- reward stimuli is sometimes made
difficult by the small effects of monetary reward. For example, the increased capture
effect by a previously high-reward target relative to baseline was only 16ms in the
original Anderson et al. (2011a) study, leaving little room for the low-reward target to
induce a smaller effect.
Why does it matter whether monetary reward modulates attention in a value-
dependent or value-independent manner? Although monetary reward could have an “all
or none” effect (perhaps because participants treat objectively different rewards as
subjectively similar), value-independent results in the original attentional capture
paradigm are more difficult to interpret than are value-dependent results. Whereas value-
dependent capture directly ties monetary reward with attention, value-independent
capture may reflect more general mechanisms unrelated to monetary reward. The high-

21
and low- reward colors were not only rewarded in the training phase, they also happened
to be the previous targets. Given the known difficulty of switching search mode and task
sets (Leber & Egeth, 2006; Monsell, 2003), participants may occasionally attend to the
previous targets. To rule out the target-driven capture hypothesis it is necessary to run
comparable experiments that do not involve monetary reward. For example, participants
may be trained to search for either red or green targets, without monetary reward, and
later be tested in an attentional capture paradigm. Relatively few published studies
included this crucial test. The ones that did sometimes reported no attentional capture by
former targets (Anderson, Laurent, & Yantis, 2014; Qi, Zeng, Ding, & Li, 2013), though
some of these studies suffered from low statistical power (e.g., Anderson et al., 2011a,
Experiment 2, N=10). In light of these inconsistencies, it is important to re-evaluate how
monetary reward modulates selective attention.
A second issue emerging from work on reward-based attention is when reward
influenced attention: during training when differential monetary reward was given, or
during testing when monetary reward was removed. Contrary to what one might expect
based on previous research on transfer of learning (Perkins & Salomon, 1992), effects of
monetary reward on attention frequently appeared in the testing phase but not the training
phase. For example, participants in Anderson et al. (2011a) were equally fast responding
to the high and low reward targets during the training phase. This was also the case in
several subsequent reports (Anderson & Yantis, 2013; Gong & Li, 2014; Sali et al.,
2014). Paradoxically, reward learning was expressed subsequently in the testing phase

22
when the previously rewarded colors were task-irrelevant and when monetary reward was
no longer used. One explanation for the lack of training effects is that the color search
task used in the training phase may have been relatively insensitive. Color search
typically has fast RT, leaving little room for reward to further reduce RT. The lack of
reward effects in the training phase may therefore be attributed to small effect sizes.
Consistent with the idea that statistical power may be at play, some studies have found
significant effects of monetary reward during the training phase either because they used
a shape discrimination task (Failing & Theeuwes, 2014) or because they associated
monetary reward additionally with response (Lee & Shomstein, 2014). Given that
transfer of learning typically depends on having significant training effects to begin with,
effects of monetary reward during the training phase merit further investigation.
Here we present two studies that address the issues raised above. Experiment 1
examined whether, in the absence of monetary reward during training, previous targets
can capture attention. This experiment sought evidence for the target-driven capture
hypothesis. It leaves open the possibility that monetary reward can influence attention
over and above target-driven capture. Experiment 2 tested a large number of participants
in a version of the value-driven attentional capture paradigm. Our focus here was to (i)
examine whether monetary reward influenced performance in the training phase, and (ii)
test whether attentional capture by previously rewarded targets was value-dependent or
value-independent.

23
Experiment 1
Using letters as stimuli, previous studies demonstrated that former targets
attracted attention in an involuntary manner (Kyllingsbaek, Schneider, & Bundesen,
2001); see also (Shiffrin & Schneider, 1977). These findings raised the possibility that the
previously reported value-driven capture effects may instead reflect attentional capture by
former targets. Experiment 1 examined whether experimental conditions similar to value-
driven attention capture could induce capture effects even when monetary reward was
never used. Participants searched for a target that could be in one of two colors, color1
and color2. They received no monetary reward in the training phase. In the testing phase
they performed a singleton-shape search; color was irrelevant to the task. On a subset of
the trials, color1 or color2 was the color of one of the distractors. We examined whether
the presence of previous target colors slowed down search.
Figure 2-1. Schematic illustrations of the search displays. A. Training phase. The target
was defined by its color (e.g., red or green). B. Testing phase. The target was the shape
+�
A� B�
+�
Target�Distractor�
Target�

24
singleton. The previous target colors may be absent (baseline) or present (as illustrated
here). Participants reported the orientation of the line inside the target in both phases.
Method
Participants. Twenty-four college students (18-35 years old, 20 females and 4
males) completed this experiment. The sample size was pre-determined to be comparable
to or larger than those of previous studies that examined value-driven attentional capture.
Participants had normal or corrected-to-normal visual acuity, normal color vision,
and were naïve to the purpose of the study.
Equipment. Participants were tested individually in a room with normal interior
lighting. The experiments were programmed using Psychtoolbox (Brainard, 1997; Pelli,
1997) implemented in MATLAB (www.mathworks.com). Stimuli were presented on a
17” CRT monitor with a resolution of 1024x768 pixels and a refresh rate of 75Hz.
Viewing distance was unconstrained but was approximately 40cm.
Materials and Stimuli. All stimuli were presented against a black background.
Each trial of the training phase presented participants with 6 equidistant outline circles
(size: 1.5ºx1.5º) at an eccentricity of 5º. The colors were chosen from 10 distinctive
colors with the constraint that each display had 6 unique colors (Figure 2-1A). Two
colors were assigned to be the target colors and the others were distractor colors. To
control for intrinsic differences in the perceptual salience of different colors, we
counterbalanced the color assignments across participants.
25
In the testing phase, each display contained 6 outline shapes at the same
eccentricity as that of the training phase. The display may contain one circle among 5
diamonds (size 1.5ºx1.5º) or one diamond among 5 circles. All six shapes had different
colors drawn from the same general set as the training phase, with the constraint that the
unique shape (target) could not have the same color as the target colors used in the
training phase.
Inside each outline circle or diamond was a white vertical or horizontal line
(length: 1º). Its orientation was randomly chosen (Figure 2-1B).
Procedure. Participants completed the training and testing phases on two
consecutive days. In the training phase, participants were shown an array of 6 colored
circles and were asked to find the target circle defined by its color. They then pressed a
button to report the orientation of the line inside the target circle. The target could be one
of two pre-specified colors. Only one target appeared on each trial and it was equally
likely to be either of the two pre-specified colors. There were 768 training trials. One day
later participants returned for the testing phase for a total of 300 trials. This time they
searched for an odd shape (either the unique circle among five diamonds or the other way
around, presented in random order) and pressed a button to report the orientation of the
enclosed line.
Each visual search trial started with a white fixation point (0.5ºx0.5º) with a
random duration between 400 and 600ms. The search display was then shown until
participants pressed a button corresponding to the orientation of the target’s line. To

26
discourage errors, the computer voice spoke the sentence “That was wrong. Please try to
be accurate” after each incorrect response. Correct trials were followed by three pure
tones (800, 1300, and 2000Hz, each for 100ms) or the text “too slow,” depending on
whether RT was faster than the cutoff of 1,000ms in the training phase or 1,500ms in the
testing phase. These cutoff times were chosen because pilot testing using more stringent
cutoffs led to error rates higher than 10%. The next trial commenced after 1,000ms.
Participants were given a break every 48 trials in the training phase and every 60 trials in
the testing phase.
Design. Unlike value-driven capture studies, participants in Experiment 1
received no monetary reward in the training phase. Color1 and color2 were therefore
simply target colors. In the testing phase, participants searched for an odd shape and were
asked to ignore item colors. The target was a circle among diamonds on half of the trials,
and a diamond among circles on the other half, in a randomly mixed order. Its color was
randomly selected except that it could not be the two target colors used in the training
phase. The previous target colors were present on 40% of the trials as a distractor (20%
color1, 20% color2) and absent on the other 60% of the trials (baseline). Trial types were
randomly intermixed in presentation order. No monetary reward was involved in the
testing phase either.
27
Results
Training phase
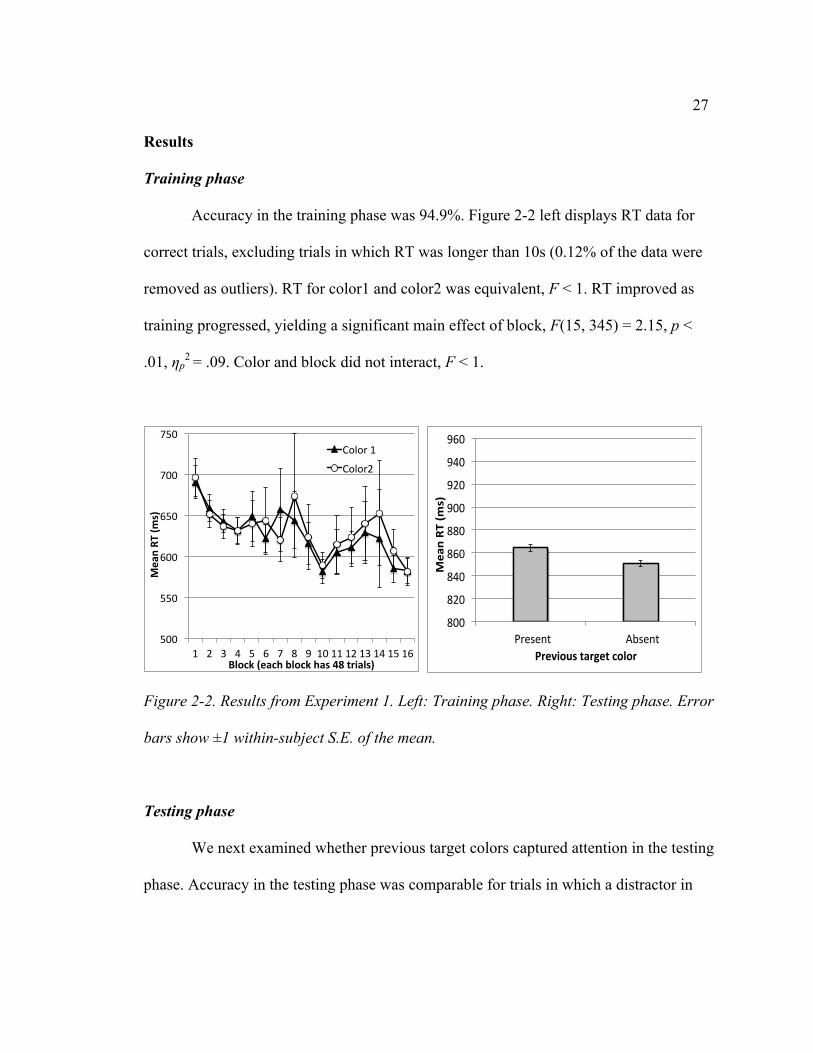
Accuracy in the training phase was 94.9%. Figure 2-2 left displays RT data for
correct trials, excluding trials in which RT was longer than 10s (0.12% of the data were
removed as outliers). RT for color1 and color2 was equivalent, F < 1. RT improved as
training progressed, yielding a significant main effect of block, F(15, 345) = 2.15, p <
.01, ηp2 = .09. Color and block did not interact, F < 1.
Figure 2-2. Results from Experiment 1. Left: Training phase. Right: Testing phase. Error
bars show ±1 within-subject S.E. of the mean.
Testing phase
We next examined whether previous target colors captured attention in the testing
phase. Accuracy in the testing phase was comparable for trials in which a distractor in
500#
550#
600#
650#
700#
750#
1# 2# 3# 4# 5# 6# 7# 8# 9# 10#11#12#13#14#15#16#
Mean%RT
%(ms)�
Block%(each%block%has%48%trials)�
Color#1#
Color2#
800#
820#
840#
860#
880#
900#
920#
940#
960#
Present# Absent#
Mean%RT
%(ms)%
Previous%target%color%

28
color1 or color2 was present (91%) and trials in which they were absent (91%), t < 1.
Figure 2-2 right shows RT for correct trials. Even though monetary reward was not
involved during training, the target colors used in the training phase slowed down search
in the testing phase, relative to when they were absent, t(23) = 2.10, p < .05, Cohen’s d =
.88. In a further analysis we separated data from the first and the second half of the
testing phase. Distractor color condition did not interact with testing half, F < 1,
indicating a consistent pattern of results in both halves of testing.
Discussion
Experiment 1 showed that following a color search task, participants were
susceptible to attentional capture by the previous target colors. In the testing phase when
they searched for a singleton shape, the presence of the previous target colors in one of
the distractors slowed down search. Consistent with previous studies using letter stimuli,
this finding indicates that previous targets can capture attention (Kyllingsbæk, Schneider,
& Bundesen, 2001; Shiffrin & Schneider, 1977). It fits with the widely accepted ideas
that switching one’s attentional set is challenging (Leber & Egeth, 2006; Monsell, 2003)
and that attentional capture is influenced by the attentional control setting (Folk,
Remington, & Johnston, 1992).
Experiment 1 demonstrates that experimental conditions similar to those used in
value-driven capture studies are also conducive to target-driven capture. These findings
reinforced the idea that former targets attracted attention (Kyllingsbaek et al., 2001;

29
Shiffrin & Schneider, 1977). They may seem inconsistent with some previous reports,
which did not find attentional capture by previously unrewarded targets (e.g., Anderson
et al., 2011a; Anderson, et al., 2014; Qi, et al., 2013; Sali et al., 2014). One explanation
for the inconsistency is that the large sample size used in our experiment may have given
us sufficient statistical power to detect target-driven capture. Our results, however, were
consistent with one previous study on value-driven attentional capture (Wang, Yu, &
Zhou, 2013). In this study, Wang et al. included a control experiment in which
participants searched for two potential targets, without receiving any monetary reward. In
a subsequent testing session, participants were slower finding a singleton target when the
display included a former search target, than when the display included a novel distractor.
Our study differed from Wang et al. in our choice of the baseline condition. Whereas
Wang et al. included a novel stimulus as their baseline, our study omitted the former
targets without adding a novel item. Given that novel stimuli could accentuate capture
(Folk & Remington, 2015; Horstmann & Ansorge, 2006; Neo & Chua, 2006), Wang et
al. may have underestimated the target-induced capture effect. What is in common,
however, is that both studies revealed attentional capture by former targets associated
with no monetary reward.
Results of Experiment 1 constrain the kind of inferences and conclusions one can
draw when evaluating capture effects by a previously rewarded target. These effects
could have two components: target-driven capture and value-driven capture. To isolate
the value-driven component it is not enough to compare reward-target absent trials with

30
reward-target present trials. Rather, one would need to examine whether capture effects
are stronger for a high reward target than a low-reward or no-reward target.
Experiment 2
Having demonstrated that previous targets could induce attentional capture
(Kyllingsbaek et al., 2001; Shiffrin & Schneider, 1977; Wang et al. 2013), here we tested
whether attention capture was stronger for a target that received greater monetary reward
than one that received less or no monetary reward. In the training phase participants
received monetary reward upon finding the target. Experiment 2A manipulated monetary
reward probabilistically. One target color received a high reward 80% of the time and a
low reward 20% of the time, whereas the other target color received a high reward 20%
of the time and a low reward 80% of the time. This version contrasted high-reward with
low-reward. Experiment 2B manipulated reward in an all-or-none fashion. One target
color received a high reward 100% of the time and the other target color received no
reward 100% of the time. This version contrasted high-reward with no-reward
[footnote1]. In both versions, the two colors were target colors. Target-driven capture
effects should be comparable between the two colors. Any difference between them
would correspond to value-dependent capture effects.
In addition to examining attentional capture by previously rewarded targets in the
testing phase, Experiment 2 aimed to delineate reward learning during the training phase.
1 We thank Jan Theeuwes for suggesting this manipulation.

31
The large sample size (48 across Experiments 2A and 2B) increased our chance to detect
an effect of monetary reward during training. Charting out the learning curve, as opposed
to reporting just the mean RT across the entire training phase, also enabled us to examine
the consistency of reward learning across different blocks of training.
Experiments 2A and 2B differed in minor aspects; these variations were designed
to ensure that our results were not specific to parameters used in either experiment.
Training was long in Experiment 2A (768 trials, similar to Anderson et al., 2011a’s
Experiment 1) but shorter in Experiment 2B (384 trials, similar to Anderson et al.,
2011a’s Experiment 3). Though longer training may be expected to produce greater
effects of learning, one anonymous reader noted that longer training could accentuate
target-driven capture effects.
In addition, testing was administered either after a one-day delay (Experiment 2A)
or immediately (Experiment 2B). The longer delay may facilitate consolidation of reward
learning, yet the shorter delay may reduce forgetting. We thus tested both long and short
delays. Finally, feedback for incorrect trials took the format of either a spoken message
(“That was wrong. Please try to be accurate” in Experiment 2A) or a pure tone
(Experiment 2B). The spoken messages may be more effective in discouraging errors,
reducing speed-accuracy tradeoff. However they were not typically used in previous
studies on value-driven attentional capture. Therefore we used pure tones for accuracy
feedback in Experiment 2B.

32
Method
Participants. Forty-eight participants completed this experiment, 24 in
Experiment 2A (14 females and 10 males) and 24 in Experiment 2B (15 females and 9
males). Participants were 18-35 years old, had normal or corrected-to-normal visual
acuity, normal color vision, and were naïve to the purpose of the study.
Stimuli and materials. We used the same stimuli as those of Experiment 1.
Procedure. Trial sequences were similar to those of Experiment 1 in the training
phase, except that participants received monetary reward after each trial. Each correct
response that met the RT cutoff of 1,000ms led to a display of reward earned. In
Experiment 2A the reward was either high “+10” (font size 50) or low “+1” (font size
20), displayed at the center of the screen for 500ms. In Experiment 2B the reward was
either high “+10” (font size 50) or zero “+0” (font size 20). Cumulative reward was
displayed at 5º below the trial reward.
In addition to the presentation of just high or no reward, Experiment 2B differed
from Experiment 2A in that we modified the computer’s feedback. In Experiment 2A, an
incorrect response was followed by the computer speaking the sentence “That was
wrong. Please try to be accurate.” A correct response made within the RT cutoff was
followed by three short tones (800, 1300, and 2000 Hz, each for 100ms). In Experiment
2B, an incorrect response was followed by a low tone (400 Hz, 200ms) and a correct
response made within the RT cutoff was followed by a high tone (1000 Hz, 200ms).

33
Participants were told that they would receive monetary reward indicated by the
number, but only if they made a correct response within the cutoff time.
Trial sequences used in the testing phase were the same as those of Experiment 1.
Design. Experiments 2A and 2B differed slightly in how monetary reward was
given in the training phase.
In Experiment 2A, reward was given probabilistically to the two target colors.
The high-reward target color was followed by “+10” 80% of the time, and “+1” 20% of
the time. The low-reward target color was followed by “+1” 80% of the time, and “+10”
20% of the time. Similar to Experiment 1, the high- and low- reward colors appeared
equally often. Reward accumulated to a point total and was converted into cash payment
at the completion of the experiment using a sliding scale ($2 for 0-3999 points, $3 for
4000-4499 points, and $4 for 4500 points and above). Participants were also compensated
for their time ($10/hour or extra course credit). The amount of cash reward used in our
study was comparable to that of previously published results (Failing & Theeuwes, 2014;
Stankevich & Geng, 2014). Providing points, then converting them to cash, had
previously been used to induce reward-based attention (Wang et al., 2013; Wentura,
Müller, & Rothermund, 2013). We did not tell participants that one color would yield
more monetary reward than the other. Like Experiment 1, the testing phase occurred 1
day later.
In Experiment 2B, reward was given exclusively to one target color. The high-
reward target color was followed by “+10” 100% of the time, and the no-reward target

34
color was followed by “+0” 100% of the time. Training lasted 384 trials (8 blocks) rather
than 768 trials. To reduce forgetting, we administered the testing phase immediately after
the training phase rather than one-day later. Other aspects were the same as in
Experiment 2A.
Recognition. At the completion of the experiment, participants were asked to
estimate the percentage of trials that a high-reward followed each of the two target colors.
A higher estimation for the high-reward color was considered correct.
Results
Training phase
Mean accuracy was 95.1% for both target colors in Experiment 2A, and 93.3% for
the high-reward color and 92.6% for the no-reward color in Experiment 2B. Reward did
not influence accuracy, t < 1 in both Experiment 2A and 2B. Figure 2-3 shows RT data
for correct trials (all trials had RT faster than the 10s cutoff time).

35
Figure 2-3. Results from the training phase of Experiment 2. Left: Data from Experiment
2A; Right: Data from Experiment 2B. Error bars show ±1 within-subject S.E. of the
mean.
Monetary reward had a clear effect on search RT in the training phase. With 48
participants across Experiments 2A and 2B, we observed a significant main effect of
reward in Blocks 1-8, F(1, 46) = 7.36, p < .01, ηp2 = .14. The effect was consistent across
the two experiments and did not interact with experimental version, F < 1. RT became
faster in later blocks, yielding a significant main effect of block, F(7, 322) = 36.55, p <
.001, ηp2 = .44. Block did not interact with reward or experimental version, largest F(7,
322) = 1.69, p > .10.
Extending the training further in Experiment 2A continued to yield consistent RT
differences between the high- and low- reward colors. In Blocks 9-16 RT was
significantly faster for the high-reward color than the low-reward color, F(1, 23) = 4.54, p
500#
550#
600#
650#
700#
750#
1# 2# 3# 4# 5# 6# 7# 8# 9# 10#11#12#13#14#15#16#
Mean%RT
%(ms)�
Block%(each%block%has%48%trials)�
High#reward#
Low#reward#
500#
550#
600#
650#
700#
750#
1# 2# 3# 4# 5# 6# 7# 8#
Mean%RT
%(ms)�
Block%(each%block%has%48%trials)�
Reward#
No#reward#
36
< .05, ηp2 = .17, and this effect did not interact with block, F < 1 for the interaction
between reward condition and block.
Thus, consistent with some previous studies, monetary reward influenced search
behavior during the training phase (Le Pelley, Pearson, Griffiths, & Beesley, 2015;
Failing & Theeuwes, 2014; Lee & Shomstein, 2014). Participants were faster responding
to the more highly rewarded color. Reward facilitation emerged relatively early, reaching
statistical significance in the first block, t(47) = 2.06, p < .05, Cohen’s d = 0.60.
The early onset of reward effects in the training phase could not be attributed to
intrinsic differences between the high-reward and the low/no reward colors. The
counterbalancing method for colors used in Experiment 2 was the same as in Experiment
1, which revealed comparable RTs for the two target colors. This suggests that the faster
RT for the high-reward color was driven by monetary reward rather than by extraneous
factors.
One mechanism that can produce faster RT for the high-reward target is repetition
priming. Previous studies showed that RT was faster when the target color repeated,
rather than changed, on consecutive trials (Kristjánsson & Campana, 2010; Maljkovic &
Nakayama, 1994). In addition, some studies found that priming was strengthened
following a high reward (Della Libera & Chelazzi, 2006, 2009; Hickey, Chelazzi, &
Theeuwes, 2014; Kristjánsson, Sigurjónsdóttir, & Driver, 2010). Reward-modulation of
priming, however, was unlikely an explanation for our study. Across all participants
(Blocks 1-8), RT was facilitated when the current trial’s target color was the same, rather

37
than different, as the preceding trial’s target color, F(1, 46) = 14.33, p < .001, ηp2 = .24
for the main effect of repetition. However, repetition priming was not greater following a
high-reward color (mean 16ms) than following a low/no-reward color (mean 23ms),
resulting in a lack of interaction between reward and repetition, F(1, 46) = 1.43, p > .23.
This finding suggests that monetary reward may have directly increased the attentional
priority for the high-reward target, rather than indirectly by increasing repetition priming.
Testing phase
The nature of the distractor color in the testing phase did not significantly
influence search accuracy (Table 2-1), F(2, 94) = 1.22, p > .30.
Table 2-1. Mean accuracy in the testing phase of Experiment 2. Standard error of the
mean is shown in parentheses.
Experiment High-reward color Low/no- reward color Absent
2A 92.5% (1.0%) 93.2% (1.1%) 93.2% (0.7%)
2B 86.9% (1.6%) 87.8% (1.3%) 88.4% (1.1%)
The use of two targets that received different reward enabled us to separate target-
driven capture from value-driven capture effects (Figure 2-4). An ANOVA on distractor
color condition (high-reward, low/no reward, or absent) and experimental version (2A or
2B) revealed a significant main effect of distractor color condition, F(2, 92) = 6.60, p <
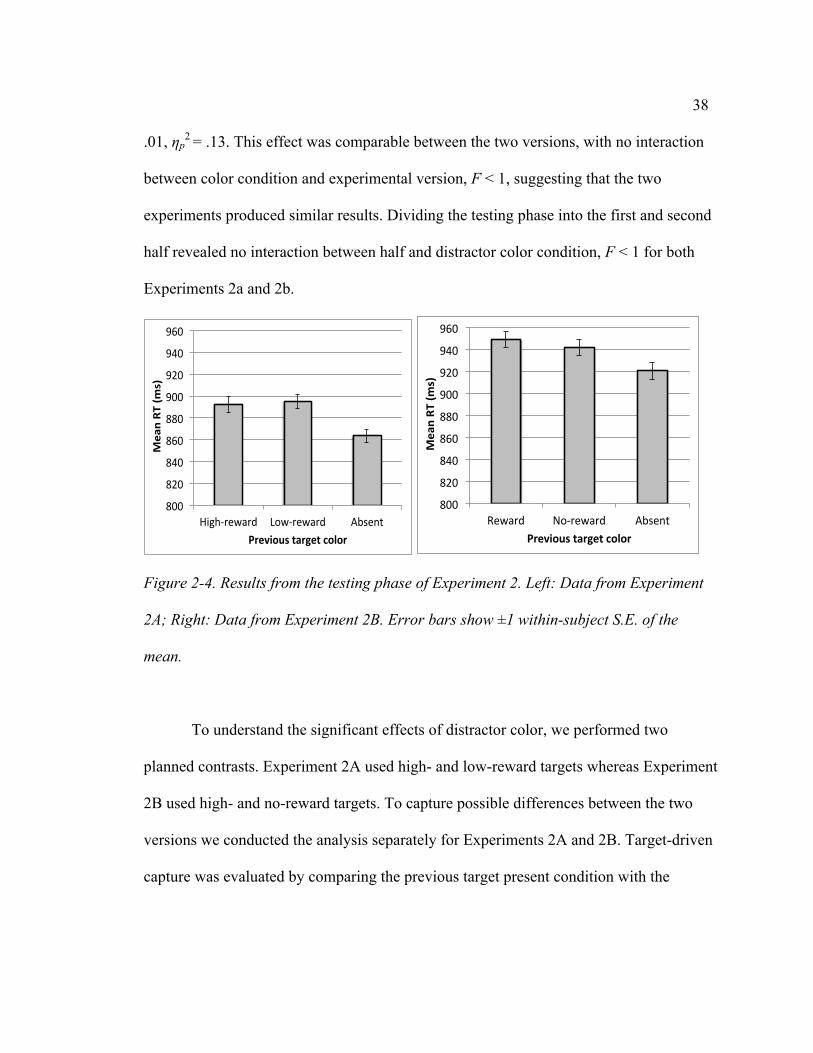
38
.01, ηp2 = .13. This effect was comparable between the two versions, with no interaction
between color condition and experimental version, F < 1, suggesting that the two
experiments produced similar results. Dividing the testing phase into the first and second
half revealed no interaction between half and distractor color condition, F < 1 for both
Experiments 2a and 2b.
Figure 2-4. Results from the testing phase of Experiment 2. Left: Data from Experiment
2A; Right: Data from Experiment 2B. Error bars show ±1 within-subject S.E. of the
mean.
To understand the significant effects of distractor color, we performed two
planned contrasts. Experiment 2A used high- and low-reward targets whereas Experiment
2B used high- and no-reward targets. To capture possible differences between the two
versions we conducted the analysis separately for Experiments 2A and 2B. Target-driven
capture was evaluated by comparing the previous target present condition with the
800#
820#
840#
860#
880#
900#
920#
940#
960#
High,reward# Low,reward# Absent#
Mean%RT
%(ms)%
Previous%target%color%
800#
820#
840#
860#
880#
900#
920#
940#
960#
Reward# No0reward# Absent#
Mean%RT
%(ms)%
Previous%target%color%
39
previous target absent condition. We found that RT was significantly slower when the
previous target color was present rather than absent, in both Experiment 2A (t(23) = 3.22,
p < .01, Cohen’s d = 1.34), and Experiment 2B (t(23) = 2.12, p < .05, Cohen’s d = 0.88).
Value-dependent capture effect was evaluated by comparing the previous high-reward
condition with the previous low/no-reward condition. The RT difference of 2ms did not
reach significance in Experiment 2A (t(23) = -0.16, p >.85), nor did the RT difference of
7.5ms in Experiment 2B reach significance (t(23) = 0.58, p > .55). Similar results were
found when data were pooled across all 48 participants. These analyses suggested that
attentional capture observed in Experiment 2 reflected primarily target-induced capture,
and that the capture effect was largely value-independent.
The data presented so far suggested that high- and low- (or no-) reward targets
induced comparable attentional capture in the testing phase, suggesting that the capture
effect was value-independent. However, did the use of monetary reward enhance the
overall capture effect, relative to Experiment 1 in which no money was used? To address
this question, we performed a cross-experiment comparison for the testing phase data
between Experiment 1 (N=24) and Experiment 2 (N=48). We entered color condition
(previous target present versus previous target absent) as a within-subject factor and
experiment as a between-subject factor in an ANOVA. This analysis revealed a
significant main effect of color condition, with slower RT when the previous target color
was present rather than absent, F(1, 70) = 9.66, p < .01, ηp2 = .12. The main effect of
experiment was not significant, F(1, 70) = 1.47, p > .20, neither did experiment interact

40
with color condition, F < 1. Restricting the cross-experiment comparison to just
Experiment 1 and Experiment 2A revealed the same results: experiment did not interact
with color condition, F(1, 46) = 1.45, p > .23. Similarly, restricting the comparison
between Experiment 1 and just the high-reward condition of Experiment 2B and
high/low-reward conditions of Experiments 2A revealed no interaction between
experiment and color condition, F(1, 70) = 1.40, p > .24. Thus, the use of monetary
reward did not induce statistically greater attentional capture in Experiment 2 relative to
Experiment 1.
Role of explicit awareness
12 of the 24 participants in Experiment 2A, and 14 of the 24 participants in
Experiment 2B assigned a higher reward value to the high-reward color than the low/no-
reward color. These were the “aware” participants. The other participants assigned either
equal or a lower value to the high-reward color. These were the “unaware” participants.
To examine whether explicit awareness influenced search data, we performed an
additional analysis that included recognition accuracy as a between-subject factor. In
neither the training nor the testing phase did recognition accuracy interact with effects of
reward, all p-values > .10. This finding suggests that explicit knowledge was not a critical
factor in our study.

41
Discussion
Using a large sample of 48 participants, Experiment 2 showed that monetary
reward influenced search behavior during the training phase. RT was faster for the target
color associated with greater monetary reward than for the other target color. This effect
emerged early and remained stable across 16 blocks of training. This finding supported
the idea that monetary reward can influence attentional priority in visual search
(Anderson, 2013; Bucker, Belopolsky, & Theeuwes, 2015; Chelazzi et al., 2013; Le
Pelley et al., 2015; Theeuwes & Belopolsky, 2012). In the dual-target search task used
here, monetary reward may have influenced the search template by giving higher weights
to the high-reward target (Hout, Walenchok, Goldinger, & Wolfe, 2015; Menneer, Cave,
& Donnelly, 2009; Vickery, King, & Jiang, 2005).
Although monetary reward influenced search performance in the training phase,
in our study it did not have durable effects in a subsequent transfer task. When
performing shape singleton search in the testing phase, participants demonstrated
attentional capture by previous target colors. The degree of capture, however, was not
significantly greater for the previously high-reward target color than the previously
low/no-reward target color. These results held across variations in the length of training,
delay between training and testing, and format of accuracy feedback. These findings
constrained interpretations of value-driven attentional capture. Though monetary reward

42
can influence attention (as evidenced in the training phase), its impact on subsequent
attentional capture may be weaker than previously thought [footnote2].
In our study, points were converted into cash payment at the end of the
experiment. The amount of cash reward used here was comparable to that used in
previously published work (Failing & Theeuwes, 2014; Stankevich & Geng, 2014). In
addition, some studies showed that points could modulate attention (Shen & Chun, 2011;
Wang et al., 2013; Wentura et al., 2013). The significant effect of monetary reward on
training phase performance further showed that the reward manipulation was effective in
affecting behavior. Future studies should examine whether value-driven attention capture
is stronger when monetary reward is substantially greater than what was used in our
study.
Our study revealed attentional capture in the testing phase, both when no money
was involved in the training phase (Experiment 1) and when money was used
(Experiment 2). In addition, capture effects were statistically equivalent between the two
experiments. In a previous study, Wang et al. (2013) also observed attentional capture
both with and without monetary reward, though the former was statistically stronger. As
noted earlier, one difference between these two studies was the definition of “baseline”
2 An anonymous reader noted that our accuracy feedback may have been too strong, akin to aversive outcomes (Schmidt, Belopolsky, & Theeuwes, 2015a, 2015b) or arousing sounds (Miranda & Palmer, 2013) known to influence attention. We believe that this is unlikely. The sounds used as accuracy feedback were pure tones. Unlike whizzing or hammering sounds used in Miranda & Palmer (2013), the pure tones had no prior value. The computer’s spoken message (“That was wrong; please try to be accurate”) was given by the computer’s monotone. It is unlikely to induce the kind of aversive response associated with electric shock (Schmidt et al., 2015a, 2015b). Experiment 2b also simplified the feedback to just a simple tone.

43
for evaluating attentional capture. Whereas Wang et al. (2013) included a novel stimulus
as the baseline, we used target-absent as the baseline. Our design therefore allowed us to
assess capture by former targets, independent of potential capture by novel stimuli (Folk
& Remington, 2015; Horstmann & Ansorge, 2006; Neo & Chua, 2006). It is also
important to note that our argument about value-independent capture rested primarily on
the within-experiment comparison of high-reward and low-reward colors. A between-
experiment comparison may be open to generic, value-independent effects of reward,
such as increased motivation or arousal for participants tested in the context of monetary
reward. In the general discussion we will discuss other factors that may modulate value-
driven attentional capture.
General Discussion
This study examined the role of monetary reward in modulating selective
attention to visual features (color). Experiment 1 showed that previous target colors
interfered with subsequent shape search, even though monetary reward was not used in
any part of the experiment. Experiment 2 showed that associating differential monetary
reward to two possible target colors induced reward learning in the training phase. RT
was faster for the more highly rewarded color. In a subsequent shape search task the
presence of these colors as distractors slowed down RT. Consistent with a subset of
previous findings, the degree of attentional capture by previous target colors was value
independent – it was comparable between the previously high-reward and low-reward or

44
no-reward colors (see also Anderson et al., 2013). The value-independent capture effect
implicated general mechanisms, such as the capture by previous target colors, as
contributing factors to value-driven attentional capture.
Our study addressed previously conflicting findings regarding value-driven
attentional capture. First, we showed that previous target colors could capture attention
even though monetary reward was not used. Studies that previously did not assess the
target-driven capture effect are therefore open to alternative interpretations. Second, our
experimental design enabled us to partition value-dependent and target-driven capture
effects. The testing phase data showed a significant target-driven capture effect, but not a
significant value-dependent capture effect. Third, although we failed to find significant
value-dependent effects in the testing phase, the training phase data provided clear
evidence that monetary reward could influence attention. The more highly rewarded
target color produced faster search RT, and this effect was unrelated to explicit
knowledge about the reward association (see also Le Pelley et al., 2015).
Our study supports a more nuanced view about value-driven attention than is
sometimes suggested in the literature. On the one hand, data from the training phase of
our study reinforces a growing literature showing that monetary reward can influence
attention (Anderson et al., 2011a; Anderson & Yantis, 2013; Chelazzi et al., 2013; Failing
& Theeuwes, 2014; Le Pelley et al., 2015; Theeuwes & Belopolsky, 2012). The two-
target search task used here is a form of “hybrid” memory and perceptual search, with the
two potential targets held in memory when perceptually searching from an array of items
45
(Wolfe, 2012). Previous studies using this paradigm showed that search was faster for the
target with a higher prevalence rate than for the other target (Godwin, Menneer, Riggs,
Cave, & Donnelly, 2015; Hout et al., 2015). Here we extended these findings by showing
that higher monetary reward could produce similar results. These data indicated that
monetary reward influenced the weight assigned to the two potential targets in a hybrid
search task.
On the other hand, although monetary reward affected search performance in the
training phase, our study suggested that its impact was negligible in the transfer phase.
Target colors used in the training phase induced attentional capture in a shape search
task. However, the degree of attentional capture was not greater for the high-reward color
than for a color that was less or not rewarded.
Our results do not rule out the possibility that other forms of reward, such as
primary reward and social reward, may exert stronger effects on attention. In addition,
they also leave open the possibility that value-independent effects may involve reward
processing. Some researchers have linked target detection to reinforcement learning
(Seitz & Watanabe, 2005; Swallow & Jiang, 2013). One may argue that the previous
targets captured attention not because they were previously attended, but because they
were previously associated with successful task completion, especially when strong
accuracy feedback was used. However, such effects clearly go beyond monetary reward
and should not be taken as evidence for value-driven attention. In addition, labeling all
effects as reward-related risks obscuring important differences among potentially

46
different sources of reinforcement learning, reducing rather than increasing the
explanatory power of reward processing.
Although we did not find evidence for value-dependent attentional allocation in
the testing phase, it remains possible that value-dependency can be found in other
experimental paradigms or when using stronger reward manipulation. Le Pelley and
colleagues showed that a distractor stimulus associated with high monetary reward
induced attentional capture (Le Pelley et al., 2015). This effect cannot be attributed to
target-driven capture. Similar to our study, however, the effect was observed during
training rather than in a transfer test. Other studies in the literature reported value-driven
capture effects. Some of these studies used different measures (e.g., first saccadic eye
movement in Theeuwes & Belopolsky, 2012) or different assessment of attention (e.g.,
exogenous cuing in Failing & Theeuwes, 2014) than what was used in the current study.
The diversity of findings in the literature raises the possibility that training using
monetary reward can yield transferrable effects in some, but not all, measures of
attention. An important future research direction is to examine when such transferrable
effects are robustly found.
One factor that may mediate attentional capture by previously rewarding stimuli
is the nature of reward training. Compelling evidence for greater capture by previously
high-reward stimuli had been observed when no search was involved in the training
phase. For example, Pool, Brosch, Delplanque, and Sander (2014) associated one shape
with chocolate odor (CS+) and another shape with just air (CS-). Subsequently CS+

47
shape induced attentional shifting. In another study, Wentura et al. (2013) presented
colors one at a time, and associated different colors to different amounts of monetary
reward. Subsequently they found that colors associated with higher reward induced
greater capture. Finally, participants in Mine and Saiki (2015)’s study responded to a
centrally presented target, whose color was associated with various levels of monetary
reward. This study, too, evidenced value-dependent capture in a testing phase. What was
in common among these studies was that participants did not perform any visual search
during reward training. Because the reward-associated stimuli cannot be considered as
previous targets (no search was performed on them), they are unlikely to produce target-
induced capture. In addition, reward learning may be stronger when reward learning was
the primary process in the training phase, as opposed to a process secondary to visual
search. Future studies should test the role of different training procedures in inducing
value-driven attentional capture.
Conclusion
In sum, we have provided evidence that attentional capture by previously
rewarded search targets may be primarily target-driven. Capture effects were strong from
previous targets, even ones associated with low-reward or no-reward. At the same time,
however, we showed that monetary reward could influence attention. People searched for
a high-reward target faster than a low- or no- reward target in the training phase, even
though they may not have explicit knowledge about the reward association. Our study

48
adds to the growing literature on reward-based attention by illustrating both its limitation
and its power.
Introduction to Study 2
Study 1 showed that former search targets captured attention. This finding
suggests that stimuli that more frequently served as the search target should be prioritized
in processing. In fact, if a visual search target does not occur often, people often miss it
on trials when it occurs, the “low prevalence” or “rare target” effect (Wolfe, Horowitz,
Van Wert, Kenner, Place, & Kibbi, 2007; Wolfe, Horowitz, & Kenner, 2005). In contrast,
targets that occur frequently are rarely missed (Godwin, Menneer, Cave, Helman, Way,
& Donnelly, 2010; Godwin, Menneer, Riggs, Cave, & Donnelly, 2015; Hon & Tan,
2013; Hout, Walenchok, Goldinger, & Wolfe, 2015). Study 2 aimed to examine these
frequency effects, asking whether a more frequently occurring target feature (e.g., red) is
prioritized relative to a less frequently occurring feature. The results indicated that
participants prioritized visual features that more frequently coincided with the target
rather than distractors, supporting the hypothesis that selection history affects featural
attention. In addition, this study examined the durability of the featural probability effect
and provided a new account for the inconsistent findings in the existing literature
(Kruijne & Meeter, 2015, 2016; Laberge & Tweedy, 1964; Sha, Remington, & Jiang,
2017b).

49
3. Study 2: Short-term and long-term attentional biases to frequently encountered
target features
This study was previously published in Attention, Perception, & Psychophysics
(2017). Full citation: Sha, L.Z., Remington, R.W., Jiang, Y.V. (2017). Short-term and
long-term attentional biases to frequently encountered target features. Attention,
Percepttion, & Psychophysics, 79(5), 1311-1322. https://doi.org/10.3758/s13414-017-
1317-6. It is reproduced here.
Short-term and long-term attentional biases to frequently encountered target
features
Li Z. Sha1
Roger W. Remington2,3
Yuhong V. Jiang1,3
Short title: feature probability learning
Preface
It has long been known that frequently occurring targets are better attended than
infrequent ones in visual search. But does this frequency-based attentional prioritization
reflect momentary or durable changes in attention? Here we observe both short-term and
50
long-term attentional biases for visual features as a function of different types of
statistical associations between targets, distractors, and features. Participants searched for
a target, a line oriented horizontally or vertically among diagonal distractors, and reported
its length. In one set of experiments we manipulated the target’s color probability: targets
were more often in Color1 than Color2. Distractors were in other colors. Participants
found Color1 targets more quickly than Color2 targets, but this preference disappeared
immediately when the target’s color became random in the subsequent testing phase. In
the other set of experiments, we manipulated the diagnostic values of two colors. Color1
was more often a target than a distractor; Color2 was more often a distractor than a target.
Participants found Color1 targets more quickly than Color2 targets. Importantly and in
contrast to the first set of experiments, the featural preference was sustained in the testing
phase. These results suggest that short-term and long-term attentional biases are products
of different statistical information. Finding a target momentarily activates its features,
inducing short-term repetition priming. Long-term changes in attention, on the other
hand, may rely on learning diagnostic features of targets.
Keywords: selective attention; visual search; target’s frequency effect; statistical
learning; diagnostic features
51
Introduction
A typical scene contains many colors, shapes, and objects. These stimuli differ in
various ways that influence how likely they will be attended. Research on selective
attention typically emphasizes two factors: whether the stimulus is perceptually salient
and whether it matches the observer’s task goals. It has long been known, however, that
attention may also be tuned to frequently encountered stimuli, especially if these stimuli
bear behavioral relevance. The “own name effect” illustrates this phenomenon: one’s
name is highly salient owing to its high occurrence rates and its association with oneself.
More broadly, features frequently associated with a target are prioritized in processing.
For example, in visual search tasks involving multiple possible targets, people more
accurately detect the target that occurs more frequently (Godwin, Menneer, Cave,
Helman, Way, & Donnelly, 2010; Godwin, Menneer, Riggs, Cave, & Donnelly, 2015;
Hout, Walenchok, Goldinger, & Wolfe, 2015).
Featural frequency may affect attention on multiple time scales. First, inter-trial
priming exerts short-term changes of attention. When a target is found on one trial, its
features are in an activated state, lowering the threshold needed for activation on
subsequent trials (Maljkovic & Nakayama, 1994). Because the more frequent feature
repeats more often, short-term inter-trial priming contributes to effects of the target’s
frequency on attention. Second, statistical learning about the target’s featural frequency
may induce long-term changes in attention. Observers extract the statistical regularities of
the target objects, including the frequency that a target has certain features. This

52
information allows observers to increase the priority weights assigned to the more
probable features. Stable differences in featural frequency are expected to yield persistent
changes in attention. In fact, many forms of statistical learning yield long-term, durable
changes in attention (Chun & Jiang, 2003; Gebhart et al., 2009; Jiang, Swallow,
Rosenbaum, & Herzig, 2013; Jungé et al., 2007; Yu & Zhao, 2015). Short-term and
long-term mechanisms of the target frequency effect provide complementary ways of
adapting attentional priority to the environment. Short-term mechanisms allow people to
rapidly adjust to the variable aspects of the environment based on recent search history.
Long-term mechanisms improve search efficiency in stable visual environments.
Experimental evidence has shown that both inter-trial priming and long-term
statistical learning contribute to changes in spatial attention. Specifically, when a target
frequently appears in one region of space, observers are faster at finding targets occurring
there relative to elsewhere. The reaction time (RT) advantage has two components:
location repetition priming and statistical learning of the target’s location probability
(Jiang, Sha, & Remington, 2015; Jiang et al., 2013; Walthew & Gilchrist, 2006).
Similarly, in the domain of featural attention, both transient and durable changes have
been reported (Kruijne & Meeter, 2015, 2016; Sha, Remington, & Jiang, 2017b).
However, unlike spatial attention in which short-term and long-term effects are both
present, studies on featural attention have sometimes failed to observe any long-term
effects. These findings, reviewed next, suggest that stable statistical regularities in the

53
frequency with which target features occur are insufficient to induce durable attentional
biases.
In one study, Kruijne and Meeter (2015) asked participants to perform a singleton
search task in which the target was a uniquely colored object (e.g., green) among
homogenous distractors (e.g., red). On some trials the target was green, and on others it
was red. In the training, “biased” phase, the target was four-times as likely to be in one
color as the other. In a subsequent, “neutral” phase, the target was equally likely to be in
either one of the two colors. Kruijne and Meeter (2015) found that participants prioritized
the high-frequency color in the biased phase. However, this effect did not persist in the
subsequent neutral phase. Sha et al. (2017b) extended this finding to a feature search task.
Participants searched for two possible target colors (Color1 or Color2) among distractors
in other colors. Because the distractor colors were heterogeneous, the task entailed
feature search rather than singleton search. Nonetheless, an attentional bias for the more
probable target color disappeared immediately in the neutral testing phase.
In contrast, when the search task involved a color-shape conjunction task, Kruijne
& Meeter (2015, 2016) found evidence for long-term changes in attention. In this task,
participants searched for either a green diamond or a red diamond, among distractors that
were blue diamonds or red/green/blue circles, triangles and squares. The target was four-
times as likely in one color as the other in the biased phase. Participants were faster at
finding the target when it appeared in the high-frequency color. Notably, this RT
difference extended to the subsequent neutral phase during which the target was equally

54
likely to be in either color. Instructions to treat the two colors equally did not eliminate
the attentional bias, nor did a one-week delay between the biased and neutral phases.
These data indicate that under some circumstances frequency differences in the target’s
color yield durable changes in attention.
To account for differences between singleton search and conjunction search,
Kruijne and Meeter (2015, 2016) propose that long-term attentional biases depend on
episodic retrieval of the search targets. In the conjunction search task, participants need to
search for diamonds of the two specific colors. These two colors are retained in episodic
memory, with stronger memory traces for the more frequent color. In contrast, in the
singleton search task, participants do not need to search for specific colors. Rather, search
can be accomplished using a singleton-detection mode (Bacon & Egeth, 1994), in which
participants search for differences in local contrasts among the stimuli. The two specific
colors fail to leave strong episodic memory traces, preventing long-term attentional
biases from emerging. Long-term attentional biases do not depend on task difficulty.
Kruijne and Meeter (2015) show that only short-term changes occurred in a difficult
singleton search task, whereas long-term changes were found in an easy conjunction
search task.
Though searching for specific features may be important for inducing long-term
attentional biases, it does not seem sufficient. The feature search task used by Sha et al.
(2017b) required participants to search for specific target colors among heterogeneous
distractor colors. Despite the need to maintain the target colors in memory, it failed to

55
induce durable attentional biases for the high-frequency color. What other factors may
contribute to long-term changes in featural attention?
An answer to this question comes from considering different types of statistical
regularities inherent in the different search tasks. One difference between feature search
and conjunction search lies in the feature’s utility in differentiating targets from
distractors. In the feature search task (Sha et al., 2017b), the two target colors (e.g., red
and green), by definition, are always targets and never distractors. They are both
maximally diagnostic of an object being a target. In the conjunction search task (Kruijne
& Meeter, 2015), however, targets are defined by a combination of color and shape, so a
specific color typically appears as both a target and a distractor. When a color is more
often associated with the target rather than a distractor, it becomes more diagnostic of the
target relative to the low-frequency color. It is possible that long-term changes of
attention are sensitive to how probable a feature coincides with a target rather than with a
distractor.
Following this logic, we distinguish between two types of feature-target
association: the target’s featural frequency and a feature’s diagnostic value. A target’s
featural frequency can be expressed as P(feature_i | target). Given a target, what is its
probability of having feature_i rather than other features? This association is computed
on all target objects, without considering the featural composition of distractors. Because
the target’s features are activated in working memory, processing of the same features
should be facilitated on subsequent trials (e.g., the next 5-8 trials, see Maljkovic &

56
Nakayama, 1994). If the target is more frequently associated with a certain feature, then
targets associated with this feature should gain stronger inter-trial priming and be found
faster than targets associated with other features. In contrast, a feature’s diagnostic value
pertains to how reliably the presence of the feature is associated with a target as opposed
to a distractor. It can be expressed as P(target |feature_i). Given a feature_i, what is its
probability of being associated with the target rather than a distractor? Prioritizing a
feature that is more diagnostic of the target is important because it leads to successful
task completion.
In four experiments, we tested the episodic retrieval account and the diagnostic
value account – the possibility that long-term changes of attention depend on differences
in diagnostic values. We manipulated the two types of color-target associations, while
minimizing the need to store the colors in episodic memory. In some experiments, the
two colors differed only in the target’s featural frequency. In other experiments, the two
colors also differed in their diagnostic values. We examined conditions under which
long-term changes in attention occurred.
Experiment 1
Experiment 1 tested the possibility that without a difference in diagnostic value,
differences in target’s featural frequency only induce short-term changes in attention. In
this experiment, participants searched for a target line in a canonical orientation
(horizontal or vertical) among distractor lines in noncanonical orientations (45º to the left

57
or the right). Once they found the target, they pressed a button to report whether the
target was long or short (Figure 3-1). All the lines had different colors. Unbeknownst to
the participants, the target line was always in one of two colors, such as red or green. The
distractor lines were in other colors. We manipulated the target’s color frequency. For
clarity we refer to the frequent target color as Color1 and the infrequent one as Color2.
The target was Color1 on 75% of the time and Color2 the other 25% of the time. We
examined (1) whether participants were faster finding targets in Color1 than Color2, and
(2) whether this preference persisted in a neutral testing phase in which the target was
equally likely to be Color1 or Color2.
In this design, both Color1 and Color2 always coincided with the target and never
coincided with the distractor. Thus, both colors are maximally diagnostic of the target,
P(target|Color1) = P(target|Color2) = 1. However, the target was more often Color1 than
Color2, P(Color1|target) = 0.75 is greater than P(Color2|target) = 0.25. The training phase
allowed us to measure the development of an RT advantage for finding targets that were
associated with Color1. The testing phase examined the durability of this advantage.

58
Figure 3-1. A schematic illustration of a search display used in Experiment 1. Participants
searched for a line in a canonical (horizontal/vertical) orientation and reported its length. Color
was an incidental feature. However, the target line was either Color1 (75% of the trials) or
Color2 (25% of the trials). Color1 and Color2 were exclusively targets. The distractor lines were
various colors other than Color1 and Color2.
Method
Participants. Participants in this study were students from the University of
Minnesota. They were 18-24 years old, had normal or corrected-to-normal visual acuity,
normal color vision, and were naïve to the purpose of the study. Participants were
compensated for their time with extra course credit or $10/hour.
Twelve participants (5 females) with a mean age of 19.8 years completed
Experiment 1.
Equipment. Participants were tested individually in a room with normal interior
lighting. The experiment was programmed using Psychtoolbox (Brainard, 1997; Pelli,
Target�

59
1997) implemented in MATLAB (www.mathworks.com). Stimuli were presented on a
17” CRT monitor with a resolution of 1024x768 pixels and a refresh rate of 75Hz.
Viewing distance was unconstrained but was approximately 40cm.
Materials and stimuli. Each display contained 6 colored lines presented at
equidistant locations on an imaginary circle (Figure 3-1). There were 1 target and 5
distractors. The eccentricity of each item was 5º. The length of each line was randomly
chosen to be either 1º or 2º. Four colors comprised the target set: red, green, yellow, and
blue. Two of these were randomly chosen as the potential target colors for a participant.
These assignments were counterbalanced across participants. The two colors not chosen
to be the target colors, along with 6 other colors generated using MATLAB’s maximally
distinguishable colors script
(http://www.mathworks.com/matlabcentral/fileexchange/29702-generate-maximally-
perceptually-distinct-colors/content/distinguishable_colors.m), comprised the distractor
set. The target’s orientation was randomly assigned to be either vertical or horizontal, and
distractors’ orientations were randomly assigned to be 45°-left-tilted or 45°-right-tilted
(Figure 3-1). All items were displayed against a black background.
Procedure. Participants were asked to search for a target in a canonical
orientation, specifically the single horizontal or vertical line, among tilted lines. Each trial
started with a white fixation point (0.5ºx0.5º). After a random duration of 400 to 600ms,
the six-item search display appeared. Upon finding the target, participants reported the
target’s length by pressing ‘L’ if the target was long (2°), or “S” if the target was short

60
(1°). The search display remained in view until participants responded (Figure 3-1). We
emphasized accuracy and speed in the task instructions and in the trial feedback. Each
incorrect response was followed by the computer voice speaking the sentence “That was
wrong. Please try to be accurate.” Correct trials were followed by a chirp, or the text “too
slow” if RT was slower than 1,000ms. The next trial commenced after 1,000ms.
Participants were encouraged to take a break every 48 trials. They completed 16 blocks,
with 48 trials per block.
Design. We manipulated the target color’s frequency. In the training phase (the
first 12 blocks of trials), the target was Color1 (high-frequency color) on 75% of the
trials, and Color2 (low-frequency color) on the remaining 25% of the trials. These two
colors never appeared as distractors. In the testing phase (the last 4 blocks of trials), the
target was associated with these two colors equally often (50% vs. 50%). We did not
inform participants of the target frequency difference. Assignments of the high- and low-
frequency colors were counterbalanced across participants. For example, if blue was the
high-frequency color and yellow was the low-frequency color for one participant, the
frequency assignment for blue and yellow targets would be reversed for another
participant.
Recognition. We queried participants about the target’s frequency at the end of
the experiment. The recognition questions asked participants to estimate the percentage
of trials in which the target appeared in Color1 and Color2, respectively. Recognition
questions first asked about Blocks 1-12 (the biased phase) and then Blocks 13-16 (the

61
neutral phase). Similar recognition questions were used in Experiment 2, 3 and 4.
Recognition results will be reported after we have presented search data from all four
experiments.
Results
Table 3-1 displays mean accuracy in all experiments, showing no evidence of a
speed-accuracy tradeoff (i.e., either no difference in accuracy between Color1 and
Color2, or the difference in accuracy between the two colors was consistent with the RT
results).
Table 3-1. Percentage correct in all four experiments, separately for the training phase
(first 12 blocks) and the testing phase (last 4 blocks of trials). Color1 was the high-
frequency target color in the training phase. Standard errors of the means shown in
parentheses. ns: not significant; **: p < .01; ***: p < .001 when comparing Color1 and
Color2.
Training phase Testing phase
Color1 Color2 Color1 Color2
Experiment 1 97.4 (0.5) 96.2 (0.6) ** 97.4 (0.7) 98.2 (0.5) ns
Experiment 2 96.5 (0.8) 94.4 (0.9) ** 96.6 (1.2) 97.3 (1.0) ns
Experiment 3 97.3 (0.4) 95.8 (0.4) *** 94.3 (1.0) 94.6 (0.6) ns
Experiment 4 96.5 (0.6) 94.3 (0.9) ** 97.4 (0.3) 97.3 (0.5) ns

62
Incorrect trials and trials whose RT exceeded 10 seconds (fewer than 0.03% of
trials were excluded as outliers in all experiments) were excluded from the RT analyses
in all experiments. Figure 3-2 displays mean RT in Experiment 1.
In the training phase, a repeated-measures ANOVA on target’s color (Color1 or
Color2) and block (Blocks 1-12) showed that RT was significantly faster for targets in
Color1 than targets in Color2, F(1, 11) = 9.64, p < .01, ηp2 = .47. Overall RT decreased as
the experiment progressed, producing a main effect of block, F(11, 121) = 4.07, p < .001,
ηp2 = .27. No significant interaction between target’s color and block was observed, F <
1.
To examine whether participants had acquired long-lasting changes in relative
attentional priority for the two colors, we administered the testing phase in which the
target was equally likely to be in either color. A two-way ANOVA on target’s color
(Color1 or Color2) and block (Blocks 13-16) showed no difference in RT between
Color1 and Color2, F < 1 for the main effect of target’s color. The interaction between
target’s color and block was not significant, F < 1. A follow-up t-test showed that the RT
advantage for targets associated with Color1 disappeared immediately in the testing
phase: In the first testing block (Block 13), RT was comparable between Color1 and
Color2, t < 1.

63
Figure 3-2. Results from Experiment 1. When the target was more frequently one color
(Color1) than the other (Color2) in the training phase (Blocks 1-12), participants were
faster finding the target associated with the high-frequency color. This effect disappeared
immediately in the testing phase (Blocks 13-16), when the target was equally likely to be
in either color. Error bars show +/- 1 S.E. of the mean.
Discussion
Experiment 1 both replicated and extended previous research on the target
frequency effect in visual search. First, the training phase showed that participants were
highly sensitive to the frequency of an incidental feature. Participants performed an
orientation search task and reported the target’s length, yet they were sensitive to the
target’s color frequency. Thus, the target frequency effect is not restricted to the task-
relevant features. Second, extending Kruijne and Meeter (2015)’s findings, the frequency
450
500
550
600
650
700
750
800
850
1 2 3 4 5 6 7 8 9 10 11 12 13 14 15 16
MeanRT
(ms)
Block(eachblockhas48trials)
Color1
Color2

64
effect was short-lived. As soon as the target became equally likely to be in either color,
the RT advantage for the previously high-frequency color disappeared. Thus, stable
differences in the target’s color frequency were insufficient to yield durable attentional
biases. These data are consistent with both the episodic retrieval account (Kruijne &
Meeter, 2015, 2016) and the diagnostic value account. The episodic retrieval account
accommodates these findings by postulating that, in an orientation search task, color is
not a searched feature and thus does not establish strong episodic memory traces. The
diagnostic value account explains these findings in terms of the colors’ diagnostic values
in discriminating targets from distractors. Both colors always coincide with the target and
never with a distractor. Therefore, they both receive maximal attentional priority. Short-
term changes can still occur due to inter-trial priming of the target’s colors, but long-term
changes in relative attentional priority fail to emerge.
Experiment 2
Experiment 2 introduced a difference in diagnostic value between the two colors
in addition to the different target’s color frequencies. Participants performed the same
orientation search task and reported the target’s length. Crucially, however, one color was
more diagnostic of the item being a target rather than a distractor, relative to the other
color. Specifically, during the training phase, 75% of the trials contained a target in
Color1 and a distractor in Color2. The other 25% of the trials contained a target in Color2
and a distractor in Color1. Because the target was Color1 75% of the time and Color2

65
25% of the time, its featural frequency (P(feature_i|target) was the same as in Experiment
1. The crucial difference though, is that Color1 and Color2 no longer had equal
diagnostic values. Color1 was more diagnostic (P(target|Color1) = 0.75) than Color2
(P(target|Color2) = 0.25). If different diagnostic values support long-term changes in
attention, then this experiment should yield a persistent RT advantage for targets in
Color1 than Color2. In contrast, the episodic retrieval account predicts that long-term
biases should not occur. This is because participants perform an orientation search task.
The target’s colors are not relevant and can not yield strong episodic traces that support
durable attentional biases.
Figure 3-3. A schematic illustration of a display used in Experiment 2. Participants
searched for a target in a canonical (horizontal/vertical) orientation among tilted lines,
and reported the length of the target. The target was in Color1 (e.g., red) on 75% of the
TargetDistractorinColor2

66
trials and Color2 (e.g., green) on 25% of the trials. When the target was one color (e.g.,
Color1), one of the distractors was in the other color (e.g., Color2).
Method
Participants. Twelve naive participants (seven females) with a mean age of 20.9
years, completed Experiment 2.
Materials and stimuli. Experiment 2 used the same ten colors as in Experiment 1.
Two colors were assigned to be the colors of interest. They were drawn randomly from
the set of four colors (red, green, yellow and blue) and counterbalanced across
participants. These will be referred to as Color1 and Color2. On each trial, the target was
one color and one of the distractors was the other color. The other four distractors had
colors randomly drawn from the remaining eight colors (Figure 3-3). Other aspects of the
experiment were the same as in Experiment 1.
Design. Similar to Experiment 1, the experiment comprised a training phase and a
testing phase. In the training phase, the target was Color1 on 75% of the trials. On those
trials, one distractor was Color2. On the other 25% of the trials, the target was in Color2
and one distractor was in Color1. During the testing phase, 50% of the trials had a Color1
target with a Color2 distractor, and the other 50% of the trials had a Color2 target with a
Color1 distractor.

67
Results
In the training phase, an ANOVA on target’s color and block showed that RT was
significantly faster when the target was in Color1 rather than Color2, F(1, 11) = 11.21, p
< .01, ηp2 = .51 for the main effect of target’s color (Figure 3-4, Blocks 1-12). Overall RT
decreased as the experiment progressed, F(11, 121) = 8.20, p < .001, ηp2 = .43 for the
main effect of block. No significant interaction between target’s color and block was
observed, F < 1.
Was the attentional bias for Color1 durable? In the testing phase the two colors
were equal in both target’s color frequencies and diagnostic values. However, an
ANOVA on target’s color and block showed that participants continued to exhibit faster
RT for targets in Color1 than those in Color2, F(1, 11) = 9.75, p < .01, ηp2 = .47 for the
main effect of target’s color (Figure 3-4, Blocks 13-16). This effect persisted for the
entire testing phase, revealing no significant interaction between target’s color and testing
block, F < 1.

68
Figure 3-4. Results from Experiment 2. In the training phase (Blocks 1-12), the target
was three-times as likely to be Color1 as Color2. In addition, Color1 was more often
associated with targets than distractors, whereas the reverse was true for Color2.
Participants were faster finding targets in Color1 than those in Color2. This effect
persisted in the neutral testing phase (Blocks 13-16). Error bars show ±1 S.E. of the
mean.
Discussion
The first two experiments manipulated two types of color-target association to
examine their impact on attention. Using the same orientation search task, we observed
both short-term and long-term changes in attention to a color that frequently coincided
with the target. In the training phase of both experiments the target’s featural frequency
favored Color1: the target was more often associated with Color1 than Color2.
Participants were faster finding the target when it was in Color1 than in Color2.
450
500
550
600
650
700
750
800
850
1 2 3 4 5 6 7 8 9 10 11 12 13 14 15 16
MeanRT
(ms)
Block(eachblockhas48trials)
Color1
Color2

69
However, The RT advantage dissipated in the neutral phase of Experiment 1. Thus, the
target’s featural frequency by itself induced just short-term changes in attention.
Experiment 2 differed from Experiment 1 in that not only was the target more
often Color1 (rather than Color2), but also Color1 coincided more often with targets than
with distractors. In other words, Color1 was more diagnostic than Color2 of a stimulus’s
status as a target rather than a distractor. The results showed that participants were
sensitive to differences between the two colors’ diagnostic values. To further confirm this
finding, we tested for cross-experiment interaction between target’s color and
experiments. First, with experiment (Experiment 1 vs. Experiment 2) as a between-
subject factor, and target’s color and block as within-subject factors, a three-way
ANOVA showed that the RT advantage for Color1 over Color2 was marginally greater in
the training phase in Experiment 2 than in Experiment 1, F(1, 22) = 3.41, p < .08, ηp2 =
.13. This finding suggests that the training phase includes an additional learning
component in Experiment 2. The marginal significance reported here may result from
lack of power (N=12 in each experiment). We will validate this finding in later
experiments. Second, the search advantage for Color1 persisted in the neutral phase of
Experiment 2, but disappeared in the neutral phase of Experiment 1, shown as a
significant interaction between target’s color and experiment in the testing phases, F(1,
22) = 5.29, p < .05, ηp2 = .31. This finding indicates that a long-term component was
acquired in Experiment 2 but not in Experiment 1. The comparisons between

70
Experiments 1 and 2 are between-experiment. The interaction effect should be validated
in future studies using between-subject, rather than between-experiment designs.
Experiment 3
So far we have shown that differences in features’ diagnostic values are
important for durable changes in attention. However, it is unclear whether diagnostic
values affect learning or the expression of learning. The diagnostic value account implies
that differences in features’ diagnostic values are necessary for inducing durable
attentional biases toward the more diagnostic color. That is, the locus of the effect lies in
the training phase. However, our data are also compatible with an alternative possibility:
presenting one color as a target and the other color as a distractor is a more sensitive test
for long-term changes in attention. On this account, it is possible that the training phases
of both Experiments 1 and 2 induced long-term attentional bias toward Color1. But the
bias went undetected in the testing phase of Experiment 1. We will refer to this account
as the latent learning account.
Latent learning has precedence in recent research on attention. Chelazzi et al.
(2014) trained participants to search for a target that appeared in one of 8 locations.
Participants received high, medium, or low reward for different target locations. This
training had no effect on the subsequent non-rewarded search when the display contained
a single target. Latent learning nonetheless occurred and was detected when the display
contained two targets. In this case, participants were more accurate in reporting the target

71
in the previously highly rewarded location. Chelazzi et al. (2014) explained the difference
between one-target and two-target trials in terms of the relative contribution of reward.
On one-target trials the bottom-up signal of the target was strong, rendering reward
learning trivial. On two-target trials the bottom-up signal was insufficient for resolving
unique target detection. This heightened the impact of previous reward.
In Experiment 1, latent learning of Color1 over Color2 may have occurred but
went undetected in the testing phase. If this is the case, then an RT advantage for Color1
may be revealed when the testing phase uses the two-color displays of Experiment 2. To
test this possibility, in Experiment 3 we used the same training procedure as that of
Experiment 1, but the same testing procedure as that of Experiment 2.
Method
Participants. Twenty-four participants (thirteen females) with a mean age of 20.3
years completed Experiment 3. Sample size doubled from the first two experiments
because the diagnostic value account predicted a null effect.
Design. Similar to Experiments 1 and 2, Experiment 3 contained 16 blocks of
trials with 48 trials per block. The first 12 blocks were the training phase. This phase was
identical to that of Experiment 1. The target was Color1 75% of the time and Color2 25%
of the time. Color1 and Color2 never appeared as distractors. The last 4 blocks were the
testing phase. This phase was identical to that of Experiment 2. Each trial contained both
Color1 and Color2, one of them was the target and the other was a distractor. We

72
examined whether Experiment 1’s training procedure induced durable changes in
attention, when assessed using Experiment 2’s testing procedure.
Results
Figure 3-5. Results from Experiment 3. Color1 was the high-frequency color in block 1-
12. Color2 was the low-frequency color in block 1-12. In block 13-16, the two colors
appeared simultaneously on each trial and were associated with the target with equal
frequencies. The line corresponds to trials in which the target was in Color1 (filled
triangles) or Color2 (open circles). Error bars show ±1 S.E.s of the means.
Replicating Experiment 1, a two-factor ANOVA on target’s color and block
showed that during the training phase participants were significantly faster responding to
Color1 targets than Color2 targets, F(1, 23) = 22.81, p < .001, ηp2 = .50 (Figure 3-5,
Blocks 1-12). In addition, RT was faster in later blocks than earlier ones, shown as a
450
500
550
600
650
700
750
800
850
1 2 3 4 5 6 7 8 9 10 11 12 13 14 15 16
MeanRT
(ms)
Block(eachblockhas48trials)
Color1
Color2

73
significant main effect of block, F(11, 253) = 5.87, p <.001, ηp2 = .20. The target’s
frequency effect diminished across blocks, F(11, 253) = 1.91, p <.05, ηp2 = .08 for the
interaction between target’s color and block.
Even though the testing phase presented both Color1 and Color2 concurrently,
we found no evidence of long-term attentional biases (Figure 3-5, Blocks 13-16). An
ANOVA on target’s color and block revealed no significant main effect of the target’s
color, F(1, 23) = 1.39, p > .25 or an interaction between target’s color frequency and
block, F(3, 69) = 1.55, p > .20.
The lack of long-term attentional biases in Experiment 3 can be contrasted with
that in Experiment 2. These two experiments were identical in the testing phase but
differed in the nature of the training phase. An ANOVA on target’s color and experiment
(Experiment 2 vs. Experiment 3) revealed a significant interaction between target’s color
and experiment in the testing phase, F(1, 34) = 7.08, p <.05, ηp2 = .17. This comparison
suggests that long-term effects are present in Experiment 2 but not in Experiment 3.
Discussion
Experiment 3 used a potentially more sensitive measure of attention in the testing
phase. On every trial the display contained both Color1 and Color2, one of which was the
target and the other was a distractor. If participants had acquired a persistent attentional
bias for Color1, they should have faster RT when Color1 was the search target and
Color2 was a distractor. In addition, they should be slower when a distractor was Color1,

74
which could potentially capture attention away from the target. However, Experiment 3
found no evidence of long-term attentional biases following Experiment 1’s training
procedure. RT was comparable for Color1 targets and Color2 targets. This was the case
even though the simultaneous presentation of Color1 and Color2 slowed down overall
RT. In fact, a two-way ANOVA on target’s color and block (Block 12 vs. Block 13)
showed slower RT in the first block of testing phase than in the last block of the training
phase, F(1, 23) = 17.03, p <.001, ηp2 = .43 for the main effect of block. This slowing
suggests that Color1 and Color2 competed for attention, making this paradigm a
potentially more sensitive test for any residual attentional biases for one of the colors.
Nonetheless, this procedure did not uncover durable changes in relative attentional
priority.
Experiment 4
Experiment 4 provided a complementary demonstration that differences in
features’ diagnostic values can yield long-term changes in attention. To this end,
Experiment 4 used Experiment 2’s training procedure. The testing phase contained a
random mix of two types of trials. In one type, the target was either Color1 or Color2 and
the other color did not appear on the display. This was similar to Experiment 1’s setup
(“one-color” testing), a potentially less sensitive assessment of featural attentional biases.
In the second trial type, both colors appeared on the display, one coincided with the target
and the other coincided with a distractor. This was similar to Experiment 2’s setup (“two-
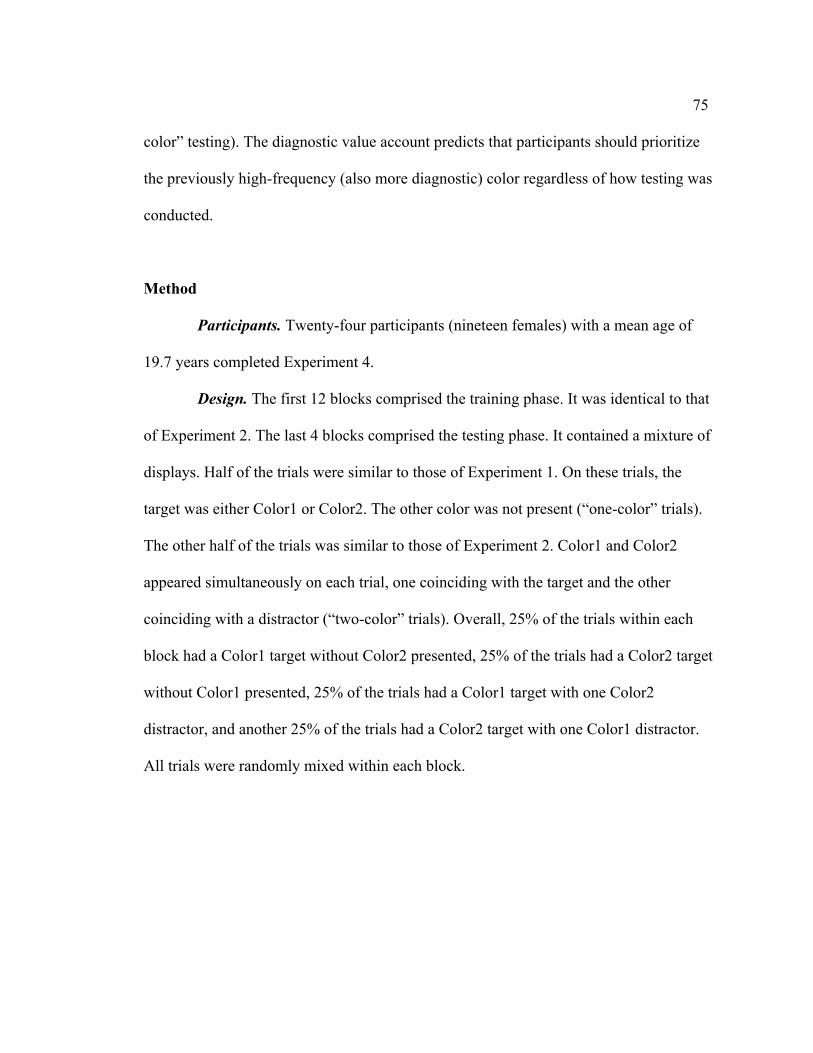
75
color” testing). The diagnostic value account predicts that participants should prioritize
the previously high-frequency (also more diagnostic) color regardless of how testing was
conducted.
Method
Participants. Twenty-four participants (nineteen females) with a mean age of
19.7 years completed Experiment 4.
Design. The first 12 blocks comprised the training phase. It was identical to that
of Experiment 2. The last 4 blocks comprised the testing phase. It contained a mixture of
displays. Half of the trials were similar to those of Experiment 1. On these trials, the
target was either Color1 or Color2. The other color was not present (“one-color” trials).
The other half of the trials was similar to those of Experiment 2. Color1 and Color2
appeared simultaneously on each trial, one coinciding with the target and the other
coinciding with a distractor (“two-color” trials). Overall, 25% of the trials within each
block had a Color1 target without Color2 presented, 25% of the trials had a Color2 target
without Color1 presented, 25% of the trials had a Color1 target with one Color2
distractor, and another 25% of the trials had a Color2 target with one Color1 distractor.
All trials were randomly mixed within each block.

76
Results
Figure 3-6. Results from Experiment 4. In the training phase (Blocks 1-12), all trials are
two-color trials (solid lines). In the testing phase, half of trials are one-color trials
(dashed lines), and the other half of trials are two-color trials. Color1 refers to the high-
frequency (also more diagnostic) color in the training phase. Error bars show ±1 S.E. of
the mean across participants.
Replicating Experiment 2, a two-way ANOVA on target’s color and block
showed that during the training phase participants were significantly faster responding to
targets in Color1 rather than Color2, F(1, 23) = 36.09, p < .001, ηp2 = .61 (Figure 3-6,
Blocks 1-12). RT was faster in later blocks than earlier ones, F(11, 253) = 13.44, p <.001,
ηp2 = .37. The effect of target color was stronger in later blocks, resulting in a significant
interaction between target’s color and block, F(11, 253) = 2.12, p < .05, ηp2 = .08.
Replicating Experiment 1 and Experiment 2, the training effect was greater in
450$
500$
550$
600$
650$
700$
750$
800$
850$
0$ 1$ 2$ 3$ 4$ 5$ 6$ 7$ 8$ 9$ 10$ 11$ 12$ 13$ 14$ 15$ 16$
Mean%RT
%(ms)�
Block%(each%block%has%48%trials)�
450$
500$
550$
600$
650$
700$
750$
800$
850$
0$ 2$ 4$ 6$ 8$ 10$ 12$ 14$ 16$ 18$
Mean%RT
%(ms)�
Block%(each%block%has%48%trials)�
Color1$in$two2color$trials$Color2$in$two2color$trials$Color1$in$one2color$trials$Color2$in$one2color$trials$

77
Experiment 4 than Experiment 3, F(1, 46) = 4.23, p < .05, ηp2 = .09 for the interaction
between target’s color and experiment.
Figure 3-6 (Blocks 13-16) plots RT separately for one-color trials and two-color
trials. Long-term attentional biases were apparent from these data. A three-way ANOVA
on trial type (one-color vs. two-color), target’s color (Color1 vs. Color2) and block (13-
16) showed a significant main effect of trial type. RT was faster on one-color trials than
on two-color trials, F(1, 23) = 87.61, p < .001, ηp2 = .79, consistent with stronger
competition between the two colors when they were presented together. Importantly,
participants were faster responding to the targets in Color1 rather than Color2, F(1, 23) =
9.79, p < .01, ηp2 = .30, yielding a significant main effect of target’s color. All other
factors failed to reach significance, largest F(1, 23) = 2.49, p > .12. Two follow-up
ANOVAs were conducted, separately for one-color and two-color trials, using target’s
color and block as factors. The main effect of target’s color was significant in both one-
color testing trials, F(1, 23) = 7.72, p < .02, ηp2 = .25, and two-color testing trials, F(1, 23)
= 6.51, p < .02, ηp2 = .22.
Together, Experiments 3 and 4 showed that the training procedure, rather than
the testing procedure, determined whether long-term changes in attention were revealed.
These data support the idea that whereas differences in target’s featural frequency could
induce short-term changes, how diagnostic features are for distinguishing targets from
distractors can additionally yield long-term changes in attention.
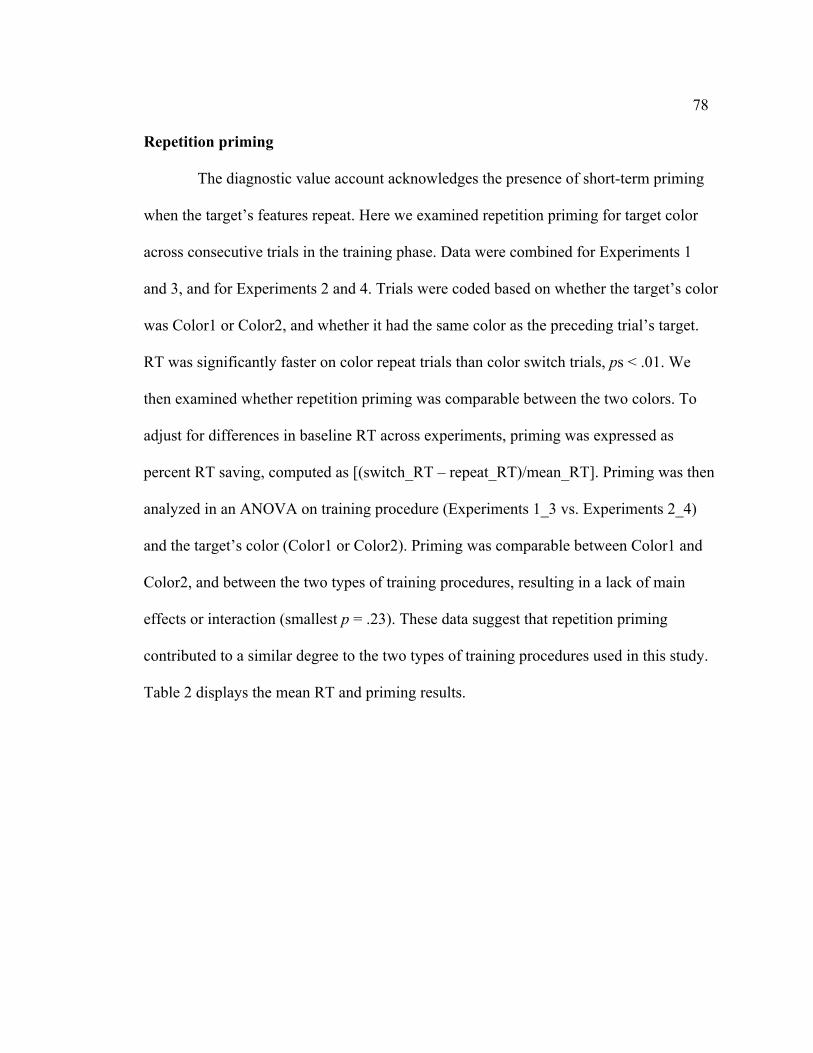
78
Repetition priming
The diagnostic value account acknowledges the presence of short-term priming
when the target’s features repeat. Here we examined repetition priming for target color
across consecutive trials in the training phase. Data were combined for Experiments 1
and 3, and for Experiments 2 and 4. Trials were coded based on whether the target’s color
was Color1 or Color2, and whether it had the same color as the preceding trial’s target.
RT was significantly faster on color repeat trials than color switch trials, ps < .01. We
then examined whether repetition priming was comparable between the two colors. To
adjust for differences in baseline RT across experiments, priming was expressed as
percent RT saving, computed as [(switch_RT – repeat_RT)/mean_RT]. Priming was then
analyzed in an ANOVA on training procedure (Experiments 1_3 vs. Experiments 2_4)
and the target’s color (Color1 or Color2). Priming was comparable between Color1 and
Color2, and between the two types of training procedures, resulting in a lack of main
effects or interaction (smallest p = .23). These data suggest that repetition priming
contributed to a similar degree to the two types of training procedures used in this study.
Table 2 displays the mean RT and priming results.
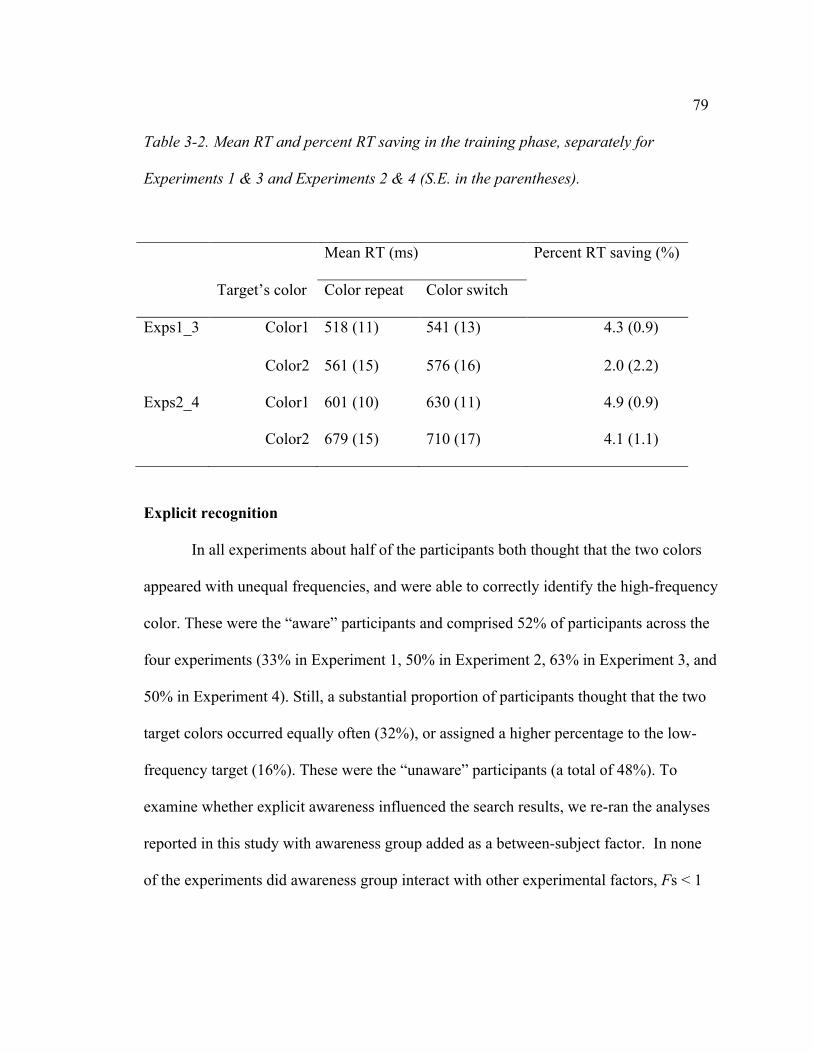
79
Table 3-2. Mean RT and percent RT saving in the training phase, separately for
Experiments 1 & 3 and Experiments 2 & 4 (S.E. in the parentheses).
Mean RT (ms) Percent RT saving (%)
Target’s color Color repeat Color switch
Exps1_3 Color1 518 (11) 541 (13) 4.3 (0.9)
Color2 561 (15) 576 (16) 2.0 (2.2)
Exps2_4 Color1 601 (10) 630 (11) 4.9 (0.9)
Color2 679 (15) 710 (17) 4.1 (1.1)
Explicit recognition
In all experiments about half of the participants both thought that the two colors
appeared with unequal frequencies, and were able to correctly identify the high-frequency
color. These were the “aware” participants and comprised 52% of participants across the
four experiments (33% in Experiment 1, 50% in Experiment 2, 63% in Experiment 3, and
50% in Experiment 4). Still, a substantial proportion of participants thought that the two
target colors occurred equally often (32%), or assigned a higher percentage to the low-
frequency target (16%). These were the “unaware” participants (a total of 48%). To
examine whether explicit awareness influenced the search results, we re-ran the analyses
reported in this study with awareness group added as a between-subject factor. In none
of the experiments did awareness group interact with other experimental factors, Fs < 1

80
(Analysis details can be found at:
http://jianglab.psych.umn.edu/FeatureProbability/ShortLongTermLearningAwareness.pdf
).
To attain higher statistical power, we combined data from Experiments 1 and 3,
and data from Experiments 2 and 4. In Experiments 1 and 3, neither the aware (N=19)
nor the unaware (N=17) participants showed RT differences for Color1 and Color2 in the
testing phase, Fs < 1. In Experiments 2 and 4, both the aware (N=18) and the unaware
(N=18) participants showed faster RT to Color1 than Color2 in the testing phase, ps <
.02. Thus, the main conclusion reached in this study held for both aware and unaware
participants. Consistent with Kruijne and Meeter (2016), frequency effects on visual
search did not depend on explicit awareness.
General Discussion
Intuitively, features frequently associated with a visual search target should be
prioritized. This intuition was supported by our training phase data. Across all four
experiments, a color that frequently coincided with the search target was associated with
faster search RT. The target’s frequency effect was found even though color was, strictly
speaking, task-irrelevant; orientation was the target’s defining property and length was
the target’s reported property. The training phase data suggest that target’s featural
frequency affects attentional allocation (Hasher & Zacks, 1984).
81
This study provides important insights about the conditions under which feature-
target association leads to long- or short-term attentional biases. We showed in
Experiments 1 and 3 that attentional priority for the previously high-frequency target
diminished rapidly in a neutral testing phase. This finding suggests that the frequency
effect observed in these experiments is likely supported by transient mechanisms, such as
inter-trial priming of the search target. The more frequent target color also repeats more
often across trials, accumulating greater inter-trial priming in the training phase. Because
inter-trial priming dissipates rapidly (Maljkovic & Nakayama, 2000), it does not support
sustained attentional biases when the two target colors become equally frequent. In fact,
Sha et al. (2017b) estimated inter-trial priming over 8 successive trials and found that this
effect could fully explain the RT advantage for the more frequent target color.
The second contribution of this study is the empirical demonstration in
Experiments 2 and 4 that the difference in diagnostic values of features in discriminating
targets from non-targets produces long-term statistical learning. Durable target frequency
effects have been reported previously in color-shape conjunction search tasks but not in
color singleton search tasks (Kruijne & Meeter, 2015). The current study extends this
finding to feature search tasks, and is important especially since it is unexpected by
previous theoretical work. According to Kruijne & Meeter (2015), durable frequency
effects are found when people maintain specific target’s defining features during search,
but not when people accomplish search by detecting local stimulus differences. This
account is consistent with the data showing differences between Kruijne and Meeter’s
82
(2015) conjunction and singleton search tasks. However, it does not adequately explain
why the feature search task used in the current study yielded just transient changes in
Experiments 1 and 3 but durable changes in Experiments 2 and 4. In all four experiments
participants searched for vertical or horizontal lines, so color was not part of the search
template. According to the episodic retrieval account, Color1 or Color2 should not have
left strong enough episodic traces that could support long-term changes in attention. One
might argue that owing to the correlational structure between color and target,
participants might have actively searched for Color1 and Color2. If this were the case, we
should have observed long-term attentional biases in all experiments (especially in
Experiments 1 and 3 where the correlational structure was strong), not just in
Experiments 2 and 4. Our study suggests that the time scale of the target frequency effect
is modulated by factors besides the accumulation of episodic traces.
A third contribution of the present study is that we provided initial evidence for a
theoretical distinction between two types of feature-target association. Both types are
expressed in terms of conditional probability, but they have potentially different
functional roles. The target’s featural frequency, expressed as P(feature_i | target),
indexes how frequently a feature_i target occurs. In contrast, a feature’s diagnostic value,
expressed as P(target | feature_i), indexes feature_i’s usefulness in visual search. A color
with higher diagnostic value is more predictive of the target than of distractors and can
facilitate visual search. This may explain why we observe durable attentional biases in
Experiments 2 and 4. One way to understand this proposal is by considering attention as a

83
mechanism that biases competition toward diagnostic features (Desimone & Duncan,
1995). In visual search, the crucial competition is between targets and distractors, rather
than among the targets themselves. When two features are both maximally indicative of
targets, they can both be prioritized, relative to nontarget features. But when a feature
more often coincides with a target and another feature more often coincides with a
distractor, these features compete for attentional priority and the more diagnostic feature
wins.
This diagnostic value account is consistent with a recent study examining the role
of statistical learning on attentional capture. Using the contingent capture paradigm (
Folk et al., 1992), Cosman and Vecera (2014) had subjects respond to the identity of a
red or green target presented along with a red or green distractor. On 80% of trials the
target was in one color (e.g., red), on 20% the reverse. Targets were preceded by a red or
green cue at one of the locations. By our analysis, the use of both colors as targets and
distractors established a higher diagnostic value for the high-frequency target color.
Indeed, in a subsequent neutral testing phase with equal color-target assignment, Cosman
and Vecera (2014) found stronger capture of attention when the cue was in the high-
frequency color than the low-frequency color. Unlike the present studies, Cosman and
Vecera (2014) did not examine conditions under which such effects are transient or
durable, nor did they formulate a general account of the effects of stable frequency
statistics on attention.

84
Our study supports the idea that humans are sensitive to conditional probabilities
in visual input (Orbán, Fiser, Aslin, & Lengyel, 2008). More broadly, conditional
probabilities are key elements in Bayesian inference in vision, reasoning, and language
(Kalish, Griffiths, & Lewandowsky, 2007; Kersten, Mamassian, & Yuille, 2004). Data
presented here demonstrate that such statistical information is also extracted to support
visual search. As is the case in standard Bayesian computation, the two conditional
probability terms, commonly given as P(A|B) and P(B|A), correspond to different
concepts and serve different functional roles. Our study suggests that these functional
differences may support learning at multiple time scales.
At first glance, the diagnostic value account appears to be inconsistent with one
finding in the literature: the lack of durable frequency effects in singleton search tasks.
Consider the task of finding an odd-colored target (e.g., red) among homogenous colored
distractors (e.g., green; Kruijne & Meeter, 2015). When most trials are red among green
and few are green among red, red is more often a target than a distractor and green is
more often a distractor than a target. Why does the difference in diagnostic value not
induce a persisting attentional bias for red? We believe that the reason is because when
people search for a color singleton, they primarily adopt the singleton-search mode
(Bacon & Egeth, 1994), such as detecting local discontinuity in color. The adoption of
this mode likely interferes with statistical learning of the specific target color. How visual
statistics are computed for singleton search remains to be tested.
85
Our experiments, and that of Cosman & Vecera (2014), establish the importance
of diagnostic value in long-term statistical learning. They do not, however, specify the
nature of the learning. We have proposed that frequency information accrues from trial to
trial with the resulting conditional probabilities computed independently and in parallel
for all target and distractor colors. Another possibility is that the simultaneous presence
of two potential target colors leads to a trial-by-trial inhibition of the color associated
with the distractor. Attentional priority would then be based on a computation of
accumulated strength across trials. Existing studies do not provide a definitive answer as
to the nature of the underlying learning.
Conclusions
This study examined the roles of featural frequency in inducing short-term and
long-lasting changes in attention. We found that both short-term and long-term
mechanisms contribute to people’s sensitivity to the featural frequency in visual search.
Our results support the claim that short-term changes operate on the target’s featural
frequency (e.g., inter-trial priming), while long-term changes may depend on the ratio of
a feature coinciding with the target rather than a distractor (diagnostic value). We propose
that the diagnostic value of a feature in discriminating targets from distractors is
important for inducing durable changes in attention.
86
Introduction to Study 3
Target probability effects occur not just in the featural domain (Study 2), but also
in the spatial domain. Evidence for location probability effects emerged in the 1970s. In a
visual search task, when the target more often appears in some locations than others,
people become faster finding the target in the high-probability locations (Geng &
Behrmann, 2002; Miller, 1988; Shaw & Shaw, 1977). Similar to featural probability
effects, location probability learning can yield long lasting changes in attention. For
instance, Jiang et al. (2013) trained participants to prioritize one visual quadrant of the
screen by presenting the target more frequently in that quadrant (“rich” quadrant) than in
the others. Participants prioritized the rich quadrant even after it was no longer “rich” and
after a delay of one-week. The durability of this effect raises the possibility that learning
acquired from one task or context may persist in another context or task. Study 3
examined the transfer of location probability learning across two tasks that simulated
different processes in radiological image reading. The results showed that location
probability learning did not transfer between tasks that differed in search procedure.

87
4. Study 3: Searching for “tumors”: Statistical learning of probable “tumor”
locations facilitates both detection and discrimination in visual search
This study was published in CR:PI (2019). Full citation is Sha, L. Z., Remington,
R. W., & Jiang, Y. V. (2018). Statistical learning of anomalous regions in complex faux
X-ray images does not transfer between detection and discrimination. Cognitive
research: principles and implications, 3(1), 48. doi:10.1186/s41235-018-0144-1. The
article is reproduced here.
Searching for “tumors”: Statistical learning of probable “tumor” locations
facilitates both detection and discrimination in visual search
Li Z. Sha1
Roger W. Remington2
Yuhong V. Jiang3
Preface
The visual environment contains predictable information - “statistical regularities” - that
can be used to aid perception and attentional allocation. Here we investigate the role of
statistical learning in facilitating search tasks that resemble medical image perception.
Using faux X-ray images, we employed two tasks that mimicked two problems in
medical image perception: detecting a target signal that is poorly segmented from the

88
background, and discriminating a candidate anomaly from benign signals. In the first,
participants searched a heavily camouflaged target embedded in cloud-like noise. In the
second, the noise opacity was reduced, but the target appeared among visually similar
distractors. We tested the hypothesis that learning may be task-specific. To this end, we
introduced statistical regularities by presenting the target disproportionately more
frequently in one region of the space. This manipulation successfully induced incidental
learning of the target’s location probability, producing faster search when the target
appeared in the high-probability region. The learned attentional preference persisted
through a testing phase in which the target’s location was random. Supporting the task-
specificity hypothesis, when the task changed between training and testing, the learned
priority did not transfer. Eye tracking showed fewer, but longer, fixations in the
detection than in the discrimination task. The observation of task-specificity of statistical
learning has implications for theories of spatial attention and sheds light on the design of
effective training tasks.
Keywords: Spatial attention, visual search, location probability learning, attentional
priority map, attention training
Significance Statement
Misses in routine cancer screening can be surprisingly high, a problem attributed,
in part, to perceptual errors and attentional limits. Here we tested whether a search task

89
involving medical-image-like stimuli benefited from statistical learning of the target’s
probable locations. Participants were assigned one of two tasks: detecting a heavily
camouflaged low-contrast target in noise, and discriminating a high-contrast target from
similar distractors. By placing the target frequently in one region of the image, we trained
participants to prioritize the high-probability region. We found that location probability
learning facilitated both tasks, but learning did not transfer when the task changed. These
findings suggest that statistical learning may facilitate natural search behaviors in a task-
specific manner.
Background
Human error is a major cause of accidents, contributing to over 90% of motor
vehicle crashes (National Motor Vehicle Crash Causation Survey, 2008). Human error is
also surprisingly common in medical image perception. False negatives in routine breast
cancer screening are as high as 20-30% (Evans, Georgian-Smith, Tambouret, Birdwell, &
Wolfe, 2013; Krupinski, 2015). These errors are attributed, in part, to a limit in visual
attention. For example, conspicuous anomalies may be missed when radiologists’
attention is diverted to other aspects of the image (Wolfe, 2016). What mechanisms can
be used to reduce the impact of attentional limitation? Here we examine whether training
can optimize the allocation of attention so that locations of greater behavioral relevance
are better attended than other locations. We also test the degree of cross-task transfer
following training. Addressing these questions has implications for theories of spatial

90
attention and may inform attentional training in applied fields, such as driving and
medical image perception.
Spatial attention training: Previous findings
Several studies on reward and statistical learning showed that training can shape
spatial attention. Chelazzi and colleagues (2014) trained participants to associate
locations with monetary reward. The training task involved visual search of geometric
shapes presented in 8 locations. The target was a set of triangles pointing upward and the
distractors were triangles pointing downward. Finding the target yielded different
amounts of reward when the target occurred in different locations. Participants learned to
associate reward with location. In a subsequent testing phase, participants searched for
characters among symbols that were briefly presented in the same 8 locations as before.
Even though the task changed and reward was no longer provided, participants were
more accurate at finding targets when they occurred in the previously high-reward
locations than other locations (Chelazzi, Eštočinová, Calletti, Lo Gerfo, Sani, Della
Libera, & Santandrea, 2014). The cross-task transfer suggests that learning-induced
changes are task-general.
Analogous results are found using statistical learning. Jiang, Swallow,
Rosenbaum, and Herzig (2013) used location probability learning to modify spatial
attention. Participants searched for a target, such as the letter T, among distractors.
Unbeknownst to them, the target more often appeared in one quadrant than in any of the

91
other quadrants. Although most participants could not identify the high-probability
quadrant, they developed a strong spatial preference for the high-probability quadrant,
producing faster response time (RT) on trials when the target was in that quadrant than in
the other quadrants (see also Druker & Anderson, 2010; Geng & Behrmann, 2002;
Miller, 1988). Like reward-induced changes in attention, location probability learning has
enduring effects. The spatial bias toward the high-probability locations persists for
several hundred trials after the target’s location becomes equi-probable. Cross-task
transfer was observed in visual search tasks, such as between a T-among-L search task
and a 2-among-5 search task, between a T-among-L search task and an inefficient line
orientation search task, and between two versions of the T-among-L search tasks that
differed in difficulty (Jiang, Swallow, Won, Cistera, & Rosenbaum, 2015). Transfer
occurred even when the display changed conspicuously, such as when participants were
trained with white items and tested with black items (Jiang, Swallow, et al., 2015), and
when they were trained to find a T among Ls and tested to find an arrow in natural scenes
(Salovich, Remington, & Jiang, 2017).
Other studies, however, challenged the idea that search history affects attention in
a task-general way. Several studies failed to observe effects of monetary reward on
spatial attention for participants unaware of the reward-location association, suggesting
that effects of reward depend on an explicit strategy (Jiang, Sha, & Remington, 2015;
Won & Leber, 2016). Even when present, the effects of implicit reward are small.
Without a reliable effect, the reward learning paradigm is ill-suited for testing whether

92
the learned priority transfers across tasks. Studies using location probability learning have
found consistent implicit learning. However, cross-task transfer does not occur in every
case. First, location probability learning acquired in a T-among-L search task did not
transfer to a color singleton search task, and vice versa (Jiang, Swallow, et al., 2015).
Second, spatial biases acquired from a T-among-L search task did not transfer to a non-
search foraging task (Jiang, Swallow, et al., 2015). In this foraging task, participants saw
several Ls and had to choose one of them to reveal a hidden treasure. Despite successful
location probability learning in the T-among-L search task, participants did not show
preferences for the previously high-probability locations in the following treasure-hunt
task (see also Gwinn, Leber, & Krajbich, 2018, for minimum transfer from visual search
to choice behavior). The reverse was also true: after acquiring a bias toward a quadrant
frequently hiding a treasure, participants did not perform the T-among-L task faster when
the target appeared in the more highly rewarded quadrant. Finally, lack of transfer was
observed even when two spatial tasks were performed concurrently. In Addleman, Tao,
Remington, & Jiang (2018), participants searched for a T among Hs overlaid on four
natural scenes, one per quadrant. They were asked to identify the T’s orientation and to
memorize all the background scenes. When the T more often appeared in one quadrant,
participants became faster and more accurate at finding the T in the high-probability
quadrant. However, the spatial bias did not extend to the scene task. Memory for the
scene in the visual search task’s high-probability quadrant was no better than that for
scenes in the low-probability quadrants (Addleman et al., 2018).

93
Current study
The findings reviewed above suggest that statistical learning may facilitate visual
search, implicating this mechanism in medical image perception. In fact, some
researchers suggest that tumor search relies on an initial stage of global image analysis
(Kundel, Nodine, Conant, & Weinstein, 2007). Within a single glimpse, radiologists can
detect the presence or absence of tumors at above-chance levels, even though they were
at chance in localizing the tumor (Evans et al., 2013; Evans, Haygood, Cooper, Culpan,
& Wolfe, 2016). In addition, the sort of location probability learning investigated in the
laboratory may also occur in medical image perception. The locations of tumors are
constrained by anatomy. For example, the heart is a prominent structure of a chest X-ray.
When scanning for lung cancer radiologists tend to deploy attention to regions of the lung
rather than the heart or the rib cage (Drew, Võ, & Wolfe, 2013). In addition, when pelvic
cancer metastasizes to the brain, it has a higher concentration in the posterior fossa than
other parts of the brain (Delattre, Krol, Thaler, & Posner, 1988). The presence of
statistical regularities in the tumor’s locations affords an opportunity for location
probability learning. However, nearly all relevant laboratory studies have used search
tasks that differ significantly from applied tasks, such as tumor search in medical
imaging. Unlike laboratory search tasks, tumors are difficult to segment from background
tissue. This difference raises questions about the utility of location probability learning in
tasks that resemble medical imaging perception.

94
The goal of the present study is to examine location probability learning using
stimuli and tasks that are more similar to medical-image search than those used in
previous studies. We employed two visual search tasks inspired by Drew, Cunningham,
and Wolfe (2012) to investigate two components of medical image search. In medical
imaging, radiologists face at least two types of search problems: detecting tumors among
highly confusable noise (“detection”), and differentiating abnormal from normal tissues
once a candidate anomaly is demarcated (“discrimination”). The tasks used in this study,
adapted from Drew et al. (2012), are an approximation to these problems. Specifically,
The detection task required participants to find a low-contrast T heavily camouflaged in
1/f3 noise, which has similar power spectrum as mammograms (Burgess, Jacobson, &
Judy, 2001). The discrimination task increased the T’s signal-to-noise ratio but presented
the T among similar-looking Ls (Figure 4-1). We examined location probability learning
by making the target disproportionately likely to appear in one region. We asked two
questions: First, can one improve search in regions that are more likely to contain a
target? Second, does training in one task transfer to the other?
Experiment 1
Studies on location probability learning have predominantly used well-segmented
stimuli, typically letters (Geng & Behrmann, 2002; Jiang, Swallow, Rosenbaum, et al.,
2013; Miller, 1988). Experiment 1 aimed to establish location probability learning with
low-contrast stimuli embedded among noise. We examined whether participants can

95
acquire location probability learning in the detection and the discrimination tasks. We
also tested the persistence of the learned spatial preference.
Participants were randomly assigned to perform either the detection or the
discrimination task. On 40% of the trials the target was absent, requiring participants to
press the spacebar. On the other 60% of the trials the target was present and was equally
likely to be rotated to the left or to the right. On these trials participants reported the
target’s orientation. The target’s spatial distribution was manipulated on target-present
trials. In the training phase, on target-present trials, the target appeared in one quadrant
50% of the time and in each of the other three quadrants 16.7% of the time. Immediately
following 7 training blocks, the testing phase proceeded to probe the persistence of
probability learning. In the testing phase, on target-present trials, the target appeared in
all quadrants equally often (25% of the time). The task used in the training phase was
maintained in the testing phase. This experiment will be contrasted with Experiment 2,
which used different tasks in the training and testing phases.

96
Figure 4-1. Upper panel: Sample visual search trials. Upper left: The detection task. For
illustrative purposes, the noise opacity used in this example (92%) differs from that used
in the actual experiment (mean 93%). Upper right: The discrimination task. Lower panel:
The target’s location probability in the two phases of the experiment.
50%(high-prob)
16.7%(low-prob)
Training phase
16.7%(low-prob)
16.7%(low-prob)
25% 25%
Testing phase
25% 25%

97
Method
Participants. College students were tested in this study. Their ages ranged from
18-26 years. All had normal or corrected-to-normal visual acuity and were naive to the
purpose of the study. The study was approved by the Institutional Review Board at the
University of Minnesota. Each participant provided written consent before participating.
A predetermined sample size of 16 was used in each task. This is the same sample
size as in previous studies on probability cuing (e.g., Jiang, Sha, et al., 2015). The effect
size of location probability learning in previous studies was large (e.g., Cohen’s f = 1.11
in Jiang, Sha, et al., 2015). Minimum sample size to reach a power of .95 was 5.
Thirty-two participants completed Experiment 1. The participants were randomly
assigned to perform either the detection (N = 16, 11 females and 5 males with a mean age
of 20.9 years) or the discrimination task (N = 16, 14 females and 2 males with a mean age
of 20.6 years).
Equipment. Participants were tested individually in a room with normal interior
lighting. The experiment was coded using Psychtoolbox (Brainard, 1997; Pelli, 1997),
implemented in MATLAB (2018). Stimuli were projected on a 19” CRT monitor (spatial
resolution 1024 x 768 pixels), which has a vertical refresh rate of 75 Hz. Viewing
distance was approximately 48 cm. Visual angles reported here were estimated from this
distance.
Stimuli. Search items were placed in randomly selected locations in an invisible
10x10 matrix (33.5ºx33.5º; Figure 4-1). The items were white embedded in noise with

98
the power spectrum of 1/f3. The noise was chosen to resemble the power spectrum of
mammograms (Burgess et al., 2001), and it changed from trial to trial. In the
discrimination task each quadrant contained 3 items. The target letter T was rotated 90º
either clockwise or counterclockwise, randomly determined on target-present trials. The
distractor Ls in the discrimination task had a random orientation of 0º, 90º, 180º, or 270º.
Each search item subtended 1.34ºx1.34º.
Procedure and Design. Participants were tested in a short thresholding task
before the main experiment. They completed a recognition test at the end.
(1) The thresholding task. The purpose of this task was to choose an appropriate
level of noise opacity in the detection task, or an appropriate level of target-distractor
similarity in the discrimination task.
Participants tested in the detection task were tasked to find a heavily camouflaged
letter T against 1/f3 noise (no Ls were presented in the detection task). Participants tested
in the discrimination task searched for the letter T among letter Ls in noise. In both cases,
the T was present on 60% of the trials and absent on 40% of the trials. To initiate each
trial, participants clicked on a white fixation square (0.4ºx0.4º) placed in a random
location within the central 1.5º. The mouse click required eye-hand coordination and
ensured that the fixation was centered at the start of a trial. The search display then
appeared and remained until participants made a response. Participants pressed the
spacebar if they thought the T was absent, and an arrow key to indicate the T’s
orientation if they thought it was present. Correct trials were followed by three chirps;
99
incorrect trials were followed by a low buzz, with no feedback about the position of the
target. Task instructions emphasized both accuracy and response time (RT).
The thresholding procedure of the detection task used 4 levels of noise opacity
(91%, 92%, 93%, or 94%). The thresholding procedure of the discrimination task used 4
levels of target-distractor similarities. Specifically, the letter Ls had an offset at the
intersection that ranged from 23 to 26 pixels, making them increasingly dissimilar to the
target (in comparison, the offset for the target T was 16 pixels). There were 15 trials of
each opacity or similarity level, presented in a random order. The opacity or similarity
level that yielded at least 77.8% accuracy and response times of approximately 3s was
selected for the main experiment. The mean noise opacity level used in Experiment 1 was
93% in the detection task. The mean similarity level used in the discrimination task was a
24-pixel offset.
(2) Main experiment. Each participant completed 440 experimental trials, divided
into 11 blocks of 40 trials each. The trial sequence was the same as in the thresholding
task. The target was absent on 40% of all trials. The first 7 blocks comprised the training
phase, during which the target T, when present, appeared in one (“high-probability”)
quadrant 50% of the time, and in each of the other three (“low-probability”) quadrants
16.7% of the time. The high-probability quadrant was counterbalanced across
participants. The last 4 blocks comprised the testing phase, during which the target T,
when present, was equally likely to appear in any quadrant (25% of the time).
Participants were not informed of the T’s location distribution.

100
(3) Recognition test. At the completion of the experiment, we probed explicit
awareness of the target’s location probability. Participants were first asked whether they
thought the target was equally likely to appear anywhere on the display or whether it
appeared in some locations more often than others. Regardless of their answer, they were
then informed that the target appeared in some locations more often, and asked to click
the region where the target most often appeared. Data from the recognition task will be
presented following the report of both experiments.
Results
In the detection task, accuracy was 91.2% on target-present trials and 99.1% on
target-absent trials (i.e., the false alarm rate was 0.9%). In the discrimination task,
accuracy was 91.0% on target-present trials and 99.2% on target-absent trials (false alarm
0.8%). In both tasks, RT was much longer on target-absent than target-present trials
(detection: 5357ms vs. 1661ms; discrimination: 4716ms vs. 2596ms). Because target-
absent trials were uninformative of location probability learning, we examined data from
target-present trials.
On target-present trials, accuracy did not differ between the high-probability
quadrant and the low-probability quadrants, t(15) = 1.63, p = .13 in the detection task, or t
< 1 in the discrimination task. Data analyses were conducted on RT from correct trials,
excluding outliers (under 250ms, 0% of the trials, or over 10s, 0.17% of the trials). Figure
4-2 displays the mean RT.

101
Figure 4-2. Target-present RT data from Experiment 1. The first 7 blocks were the
training phase (the target appeared in the high-probability quadrant disproportionately
often). The last 4 blocks were the testing phase (the target appeared in all quadrants
equally often). Error bars show ± 1 S.E. of the mean.
Training phase. This phase revealed the acquisition of location probability
learning. RT was faster when the target was in the high-probability rather than low-
probability quadrants. This was verified in an ANOVA with task (detection or
discrimination) as a between-subject factor, target quadrant (high vs. low probability
quadrants) and training block (1-7) as within-subject factors. Location probability
learning was reflected in the significant main effect of the target’s quadrant, F(1,30) =
9.40, p = .005, ηp2 = .24. In addition, search speed was faster in later blocks than earlier

102
ones, producing a significant main effect of training block, F(6,180) = 7.20, p < .001, ηp2
= .19. Even though we used a thresholding procedure to titrate individual participants’
search RT, RT was longer in the discrimination task than the detection task, yielding a
significant main effect of task, F(1,30) = 52.78, p < .001, ηp2 = .64. None of the
interaction effects were significant, Fs < 1. Thus, we successfully induced location
probability learning using X-ray like stimuli.
Testing phase. The testing phase probed the durability of location probability
learning. In this phase, the target was randomly placed and was equi-probable across all
quadrants. Thus, inter-trial repetition was no more likely in the high-probability than the
low-probability quadrants. Nonetheless, location probability learning persisted in the
testing phase. An ANOVA using task, target’s quadrant, and testing blocks as factors
revealed a significant main effect of the target’s quadrant, showing that participants were
faster finding the target in the previously high-probability quadrant than the previously
low-probability quadrants, F(1,30) = 4.90, p = .04, ηp2 = .14. RT did not change across
blocks in the testing phase, F(3, 90) = 1.19, p = .32 for the main effect of block. RT was
faster in the detection task than in the discrimination task, F(1,30) = 39.84, p < .001, ηp2 =
.57 for the main effect of task. The persisting probability cuing was comparable between
the detection and discrimination tasks, F < 1 for the interaction between target quadrant
and task. Probability cuing declined marginally with prolonged testing, F(3, 90) = 2.44,
p = .07, ηp2 = .08 for the interaction between target quadrant and testing block. This
suggests that as reinforcement of the high-probability quadrant was withdrawn, extinction

103
of the location probability learning slowly occurred. Block did not interact with task, F <
1, neither was the three-way interaction significant, F(3, 90) = 1.69, p = .17.
Discussion
Experiment 1 showed that participants responded to the target faster when it
occurred in a high-probability region than when it occurred in a low-probability region,
an effect that persisted in the testing phase. These results extended previous findings to
stimuli that were heavily camouflaged in noise. To our knowledge, this is the first time
that location probability learning has been found with stimuli that resemble medical
images. Experiment 1 also showed that the magnitude, pace, and persistence of location
probability learning were comparable between the detection and discrimination tasks,
though RT in the detection task was faster than that in the discrimination task.
In both tasks, the RT advantage in the high-probability quadrant was already
significant in Block 1. This could be due to inter-trial location repetition priming given
that the target was more likely to repeat its quadrant in the high-probability quadrant than
in the low-probability quadrants. To verify that there was no systematic differences in RT
across quadrants, we examined RT on the first trial in which the target was in the high-
probability quadrant, and the first trial in which the target was in any of the low-
probability quadrants. These data represented the “first” encounter of the conditions. We
found comparable RTs between these two types of trials (2188ms in the high-probability
quadrant, 2220ms in the low-probability quadrants, t(15) = 0.08, p = .94 in the detection
104
task, 3327ms in the high-probability quadrant, 3186ms in the low-probability quadrants,
t(15) = 0.35, p = .73 in the discrimination task), suggesting that the conditions were
equivalent prior to location repetition or probability learning. Having ruled out systematic
quadrant differences, the early appearance of facilitation in the high probability quadrant
could be due either to true location probability learning occurring early, or inter-trial
priming due to greater repetition of the approximate location of the targets for the high
probability quadrant. The sustained benefit for the high probability quadrant in the testing
phase, when targets occur equally in all quadrants, is evidence that true probability
learning has occurred.
The RT advantage in the high-probability quadrant could reflect a facilitation of
search efficiency; alternatively, participants could be faster in making a decision after the
target had been found. However, previous studies that manipulated set size have
consistently found a reduction in search slope. Search efficiency, as indexed by the slope
in the linear function relating RT to set size, is greater in the high-probability than low-
probability quadrants (Jiang, Swallow, & Rosenbaum, 2013; Sisk, Twedell, Koutstaal,
Cooper, & Jiang, 2018). As we will show in Experiment 2, eye movement data also
provide evidence that the location probability manipulation affects search shortly after
the onset of the search display.
The design of our experiment included a region that was more likely to contain
the target than the rest of the visual field. Conversely, location probability learning may
be induced by including a region less likely to contain the target than the rest of the visual

105
field. Although we did not use the latter design, others have varied location probability in
a graded fashion (e.g., Druker & Anderson, 2010); search priority followed the gradient.
In fact, even when the probability manipulation is binary, its effect is continuous across
space – locations farther from the high-probability quadrant are less well attended than
nearby locations (Jiang, Sha, & Sisk, 2018). Other studies have found that locations
frequently containing distractors are better ignored (Wang & Theeuwes, 2018),
suggesting that location probability learning can both increase target priority and reduce
distractor priority.
Experiment 2
The sensitivity of both the detection and discrimination tasks to location
probability learning raises an important question about the transferrability of learning. If
changes in spatial attention following training readily transfer across tasks, then the
design of training tasks may be guided by convenience. For example, any stimuli and
tasks might be used for training in medical imaging, as long as the spatial regularities are
maintained. However, studies reviewed earlier suggest that location probability learning
does not always transfer between tasks, especially if one of the two tasks does not involve
visual search (e.g., treasure hunt or scene memory). Although both the detection and
discrimination tasks used in this study involved visual search, differences in how well
search items could be segmented may influence how people shift attention in these tasks.
106
Participants in Experiment 2 were randomly assigned to acquire location
probability learning in either the detection or the discrimination task. Unlike Experiment
1, the task changed in the testing phase: from detection to discrimination or vice versa.
We examined whether location probability learning acquired in one task transferred to the
other.
We included eye tracking for a subset of the participants. This measure yielded
insights into potential differences in how search was conducted. We examined whether
the two tasks involved serial search (e.g., participants make multiple fixations before
finding the target), and if so, whether they differed in the number and duration of
fixations. Eye tracking also provided an additional measure of a search habit: the
direction of the first saccadic eye movement. Previous studies showed that location
probability learning not only facilitated RT, but also increased the proportion of first
saccades toward the high-probability quadrant (Jiang, Won, & Swallow, 2014; Salovich
et al., 2017). Discrepancies sometimes occurred, however. The first-saccadic preference
emerged more slowly than the RT advantage (Salovich et al., 2017). These findings
suggest that covert attention – attentional shifts without eye movements - rely on similar,
but not identical, mechanisms as overt shifts of attention with eye movements.
Differences between the two raise the possibility that RT and first saccades may show
different patterns of learning and cross-task transfer, a possibility tested in Experiment 2.

107
Method
Participants. Sixty-four college students completed Experiment 2. All
participants were drawn from the same participant pool. The first 32 participants were
tested without an eye tracker. Among them, a random half were trained in the detection
task and tested in the discrimination task, whereas the task assignment was reversed for
the other half. Eye tracking was added for the last 32 participants. A random half of these
participants were trained in the detection task and tested in the discrimination task, and
the other half were assigned the opposite tasks. Altogether, 32 participants completed the
detection training (26 females and 6 males, mean age 20.0 years), and 32 participants
completed the discrimination training (26 females and 6 males, mean age 20.5 years).
Procedure and Design. Similar to Experiment 1, participants first underwent a
thresholding task to determine the noise opacity for the detection task and the target-
distractor similarity for the discrimination task. Thresholding was done on both tasks in
separate blocks, counterbalanced in order between participants. The mean noise opacity
level used in Experiment 2 was 93% in the detection task. The mean similarity level was
an offset of 24 pixels.
Next, the detection training group carried out the detection task in 7 blocks, then
switched to the discrimination task for 4 blocks. The discrimination training group
carried out the discrimination task in 7 blocks, then switched to the detection task for 4
blocks. In both groups, the 7 training blocks involved a biased target distribution: the
target, when present, appeared in a high-probability quadrant on 50% of the trials and in

108
each of the other quadrants 16.7% of the trials. The last 4 testing blocks involved an
unbiased target distribution: the target, when present, appeared in each quadrant 25% of
the time. This experiment was comparable in design to that of Experiment 1. The key
difference is that the task changed between training and testing. A recognition test was
conducted at the completion of the visual search task.
Eye tracking. Eye tracking participants rested their head on a chinrest. An
EyeLink 1000 eye tracker (SR research Ltd, Mississauga, Canada) tracked the left eye at
a sampling rate of 2000 Hz. Eye position was calibrated prior to the experiment, and
verified before each trial. Re-calibration was done as needed. The eye tracker recorded
the eye position and information about saccades and fixations. We focused on (1) the
number of fixations per trial, (2) the duration of each fixation, and (3) the direction of the
first saccadic eye movement after trial onset.
Statistical analysis. In addition to repeated measures ANOVA, we performed a
Bayesian analysis on the testing phase data. In the case of a null effect, the Bayesian
analysis tests whether a lack of an effect is more plausible than the presence of an effect.
This Bayesian analysis was implemented in the BayesFactor package in R (Rouder &
Morey, 2012; Rouder, Morey, Speckman, & Province, 2012). We used the default prior
(Cauchy prior) in this package, which has been shown to be appropriate for the vast
majority of designs in experimental psychology (Rouder et al., 2012). We used a top-
down model comparison to assess the evidence for or against probability cuing in the
testing phase. This procedure first constructed a full model including all terms. Next it

109
took out each term one at a time and compared the resulting model with the full model.
Each term yields a Bayes Factor, which describes the degree to which the model omitting
that term is preferred over the full model. For example, a Bayes Factor of 5 implies that a
model omitting the term is five times more plausible than a model including it. In other
words, it is five times more likely that term does not have an effect than it does.
Results
(1) Behavioral data
Figure 4-3. Mean RT on target-present trials of Experiment 2. Left: Participants were
trained in the detection task and tested in the discrimination task. Right: Participants
were trained in the discrimination task and tested in the detection task. There were 7
training blocks and 4 testing blocks. Error bars show ± 1 S.E. of the mean.

110
Behavioral data were obtained from the whole sample. Accuracy was 98.8% on
target absent trials (false alarm rate: 1.2%). On target-present trials, accuracy was
unaffected by the target’s quadrant. It was 89.1% in the high-probability quadrant, 88.4%
in the low-probability quadrants, t(15) = 1.06, p = .30 for the detection-training
participants; 90.9% in the high-probability quadrant, 89.2% in the low-probability
quadrants, t(15) = 1.78, p = .09 for the discrimination-training participants. RT was
longer on target-absent than target-present trials (5698ms vs. 1758ms for the detection-
training participants, and 4784 vs. 2471ms for the discrimination-training participants).
We examined mean RT from correct target-present trials, excluding outliers (under
250ms: 0.01% of the trials; over 10s: 0.27% of the trials).
The training phase was the same as in Experiment 1. Replicating Experiment 1’s
finding, we found significant location probability learning. An ANOVA using task, target
quadrant, and training block as factors showed a significant main effect of target
quadrant, as RT was faster when the target was in the high-probability quadrant, F(1, 62)
= 47.90, p < .001, ηp2 = .44. RT also became faster in later blocks, producing a significant
main effect of block, F(6, 372) = 11.65, p < .001, ηp2 = .16. RT was faster in the
detection task than the discrimination task, F(1, 62) = 55.94, p < .001, ηp2 = .47. The lack
of interaction between target quadrant and task suggests that probability cuing was
comparable between the two tasks, F(1, 62) = 2.10, p = .15. Improvement in RT across
training blocks was larger in the discrimination task than the detection task, F(6, 372) =

111
2.17, p = .04, ηp2 = .03 for the interaction between block and task. None of the other
interaction effects were significant, largest F(6, 372) = 1.79, smallest p = .10.
Even though participants acquired probability cuing, this effect did not transfer in
the testing phase when the task changed. An ANOVA using task, target quadrant, and
testing block as factors showed no effects of target quadrant, F < 1. RT improved across
blocks, producing a significant main effect of testing block, F(3, 186) = 5.66, p = .001,
ηp2 = .08. RT was faster in the detection task than the discrimination task, F(1, 62) =
38.49, p < .001, ηp2 = .38 for the main effect of task. Target quadrant did not interact with
block, neither did it interact with task, Fs < 1, and the three-way interaction was not
significant, F < 1.
To examine the strength of the null effect in relation to the presence of a transfer
effect, we conducted a Bayesian analysis on the effect of target quadrant in the testing
phase (see Method). The Bayesian analysis provides strong evidence that location
probability learning did not transfer to the testing phase when the task changed. The
Bayes factor of target quadrant was 8.99, suggesting that it was 9 times more likely that
target quadrant did not affect RT than it did.
The above analysis combined data across all 64 participants who produced
behavioral data. Note that half of these were tested on an eye tracker and the other half
were not. When “eye-tracking status” was included as a between-group factor in the
analysis, this factor did not interact with any of the experimental factors. In the training
phase, the interaction between eye-tracking status and target’s quadrant was not

112
significant, F(1, 62) = 1.16, p > .28. Location probability learning was significant in each
group, F(1, 31) = 20.09, p < .001, ηp2 = .39 for those with eye-tracking; F(1, 31) = 27.11,
p < .001, ηp2 = .47 for those without eye-tracking. In the testing phase, there was no
interaction between eye-tracking status and target’s quadrant, F(1, 62) = 1.13, p > .29.
Transfer of learning was not significant for either the eye-tracked group, F < 1, or those
without eye tracking, F < 1.
(2) Eye movement data: Fixation pattern
Training phase. Differences in eye movement provided insight into the lack of
transfer between tasks. Both tasks entailed a large number of fixations (Figure 4-4, left).
Participants made more fixations on target-absent trials than target-present trials. We
conducted an ANOVA on the number of fixations, using task as a between-subject factor
and target status (target-present or target-absent) as a within-subject factor. This analysis
showed a significant main effect of target status, with more fixations on target-absent
trials, F(1, 30) = 422.87, p < .001, ηp2 = .93. Participants performing the discrimination
task made more fixations than those performing the detection task, F(1, 30) = 18.06, p <
.001, ηp2 = .38, a difference that was larger on target-present trials than target-absent
trials, F(1, 31) = 5.08, p = .03, ηp2 = .15 for the interaction between task and target status.
Although participants in the discrimination training task made more fixations, on
average each fixation was briefer (Figure 4-4, right). An ANOVA using target status as a
within-subject factor and task as a between-subject factor showed that fixation duration

113
was shorter on target-absent trials than target-present trials, F(1, 30) = 40.74, p < .001,
ηp2 = .58. Fixation duration was longer in the detection task than in the discrimination
task, F(1, 30) = 55.34, p < .001, ηp2 = .65, a difference that was larger on target-absent
than target-present trials, F(1, 30) = 5.40, p = .03, ηp2 = .15 for the interaction between
task and target status.
Figure 4-4. Fixation data from the training phase of Experiment 2. Left: Average number
of fixations per trial. Right: Mean fixation duration. Error bars show ± 1 S.E. of the
mean.
Testing phase. The pattern of fixation data was replicated in the testing phase
(Figure 4-5). Specifically, participants performing the discrimination task made more
fixations than those performing the detection task, particularly on target-present trials,
t(30) = 6.59, p < .001. Mean fixation duration was briefer in the discrimination task than

114
the detection task, F(1, 30) = 36.86, p < .001, ηp2 = .55. Other aspects of the statistical
analyses were similar to those of the training phase and the details are omitted.
Figure 4-5. Fixation data from the testing phase of Experiment 2. Left: Average number
of fixations per trial. Right: Mean fixation duration. Error bars show ± 1 S.E. of the
mean.
The fixation data showed that both detection and discrimination tasks involved a
large number of fixations, supporting the assumption that the tasks required serial search.
Differences between the two tasks were also apparent. Participants made more fixations
in the discrimination task than in the detection task. However, each fixation was briefer in
the discrimination task.

115
(3) Eye movement data: First-saccadic eye movements
Not only were people faster in finding the target in the high-probability quadrant,
but they also acquired a tendency of saccading toward that quadrant first. This effect was
most clearly revealed on target-absent trials, where saccade could not have been
influenced by the presence of target features (Figure 4-6). With four quadrants, the
chance rate of saccading toward the high-probability quadrant is 25%. In the training
phase (Blocks 1-7), the mean percentage of trials with first saccades to the high-
probability quadrant was 49.8% in the detection task and 39.6% in the discrimination
task, both of which were significantly higher than 25%, t(15) = 4.97, p < .001 for the
detection task and t(15) = 2.28, p = .04 for the discrimination task. An ANOVA using
task and training block as factors showed that participants’ tendency to saccade toward
the high-probability quadrant increased across training blocks, F(6, 180) = 9.36, p < .001,
ηp2 = .24 for the main effect of block. The main effect of task (F(1, 30) = 1.60, p = .21)
and the interaction between block and task (F(6, 180) = 1.37, p = .23) were not
significant.
As the task changed in the testing phase, the saccade pattern also changed. Those
trained in the discrimination task and tested in the detection task no longer persisted in
their overt search pattern. In these participants, the mean percentage of trials with first
saccades to the previously high-probability quadrant in the testing phase was 22.6%, a
level not significantly higher than chance, t < 1. Those trained in the detection task and
tested in the discrimination task, however, showed a persisting but declining trend of

116
saccading toward the high-probability quadrant. For these participants, the percentage of
first saccades directed toward the high-probability quadrant in the testing phase - 41.5% -
was significantly higher than chance, t(15) = 2.36, p = .03. This effect declined across
testing blocks, F(3, 90) = 4.31, p = .007, ηp2 = .13.
Figure 4-6. Direction of the first saccadic eye movement in Experiment 2. Plotted are the
percentage of trials where the first saccadic eye movement was directed toward the high-
probability quadrant on target-absent trials. Higher-values indicate a stronger saccadic
bias toward the high-probability quadrant. Error bars show ± 1 S.E. of the mean.
Qualitatively similar results were observed on target-present trials (Appendix
Figure 4-1). These trials presented some complications given that the first saccades may
be made after detecting target features and therefore would be influenced by where the
target was on a trial. Nonetheless, the pattern of data was similar to target-absent trials.
Specifically, when trained with the discrimination task, participants gradually acquired a
0
0.1
0.2
0.3
0.4
0.5
0.6
0.7
0.8
0.9
1
1 2 3 4 5 6 7 8 9 10 11
Percen
tageoffirstsaccade
land
inginth
ehigh-proba
bilityqu
adrant
Block(Training1-7;Testing8-11)
Detectiontraining+Discriminationtesting

117
tendency to saccade toward the high-probability quadrant first. This preference ceased
when the task changed to detection. When trained with the detection task, participants
also acquired a tendency to saccade toward the high-probability quadrant first. This
preference was substantially reduced, though somewhat persistent, when the task changed
to discrimination. Detailed results and statistical analyses that took into account the
target’s location can be found in the Appendix.
Appendix Figure 4-1 showed different saccade patterns between the detection and
discrimination tasks. Regardless of which phase these tasks were performed in, first
saccades in the discrimination task were insensitive to the target’s actual location. The
proportion of first saccades toward the high-probability quadrant was no stronger when
the target itself was in the high-probability quadrant than when it was elsewhere. This
suggests that the first saccades were executed prior to acquiring target features. In
contrast, in the detection task, the proportion of first saccades toward the high-probability
quadrant was stronger when the target was in that quadrant than when it was elsewhere.
This suggests that first saccades were initiated after participants had analyzed the image
and had some information about where the target was. In fact, first saccade latency was
longer in the detection task than in the discrimination task, both in the training phase
(target-absent trial means: 240ms vs. 156ms, t(30) = 4.67, p < .001 on trials) and in the
testing phase (226ms vs. 148ms, t(30) = 5.50, p < .001).

118
Discussion
Experiment 2 successfully induced a change in spatial attention in the training
phase in both the detection and discrimination tasks. However, no transfer in RT was
observed when the task changed. This was the case even though the two tasks were
performed in the same general space, the task set was similar, and the displays had
similar visual characteristics including the use of 1/f3 noise. On its own, the lack of
transfer may be explained by differences between the two tasks. For example, the
discrimination task took longer. However, differences in search RT did not prevent
transfer in previous studies. Jiang et al. (2015) observed transfer between two T-among-L
search tasks of different difficulty. The easy task had a mean RT around 1s, and the
difficult task 3s. The discrepancy in task difficulty in that case was greater than in the
current study, where RT differed by about 0.5s. A difference in display appearance (e.g.,
noise opacity level) also could not explain the results. Salovich et al. (2017) showed
transfer between two visually very different tasks - finding a T among Ls and finding an
arrow in natural scenes.
What might account for the lack of transfer in the current study? We suggest that
the lack of transfer may reflect differences in how search was conducted between the two
tasks. The discrimination task requires participants to make serial shifts of attention
among items that are easily segmented from the background. The detection task has few
candidate regions to inspect but requires longer scrutiny when one is identified. This
differs from previous studies where all tasks involve serial scanning among segmented

119
objects. The eye data supported this suggestion. The discrimination task involved a
higher number of fixations than the detection task, but each fixation was briefer. In
addition, the detection, but not the discrimination, task involved an initial stage of image
analysis before the first saccade was made. These data suggest that the search procedures
differed between the two tasks.
The target’s location probability not only enhanced search RT, but also induced a
tendency to direct the first saccade toward the high-probability quadrant. Consistent with
RT, the first-saccade bias acquired in the discrimination task did not transfer to the
detection task. However, the saccade preference acquired in the detection task only
gradually declined when the task changed to discrimination. This latter finding was not
accompanied by an RT advantage. This discrepancy suggests that a habit involving
saccades is harder to correct than the covert search habit indexed by RT. The lack of an
RT advantage suggests that information gathered from the preferential saccades is
discounted at a later level, hence there was no RT advantage even though eye movements
showed a residual preference toward the previously high-probability quadrant.
Awareness
In the recognition test, some participants reported noticing that the target was
more likely to occur in some locations than others and went on to correctly select the
high-probability quadrant. These were the “aware” participants. Combining data from
both experiments, there were 22 aware participants from detection-training (out of 48

120
total) and 8 from discrimination training (out of 48). The lower level of awareness in the
discrimination task may be attributed to the more demanding nature of the task owing to
the presence of distractors. The remaining 66 participants were “unaware”. To examine
the association between explicit recognition and location probability learning, we
performed a mixed ANOVA on the training phase data from each task, using target
quadrant and block as within-subject factors and awareness as a between-subject factor.
In participants undergoing detection training, location probability learning was
significant, F(1, 46) = 44.44, p < .001, ηp2 = .49, an effect that did not interact with
awareness status, F < 1. Similarly, in participants undergoing discrimination training,
location probability learning was significant, F(1, 46) = 14.13, p < .001, ηp2 = .24, but
this did not interact with awareness status, F < 1.
To ensure that location probability learning occurred independently of awareness,
we performed an ANOVA on the training phase data for unaware participants only,
separately for the two tasks, using target quadrant and block as within-subject factors.
Unaware participants undergoing detection training showed location probability learning
(main effect of target quadrant), F(1, 25) = 30.68, p < .001, ηp2 = .55. Similarly, unaware
participants undergoing discrimination training showed significant location probability
learning, F(1, 39) = 13.60, p < .001, ηp2 = .26. Consistent with prior work (Geng &
Behrmann, 2002; Jiang et al., 2018), location probability learning did not depend on
explicit awareness.

121
Finally, to examine whether explicit awareness affected the first-saccade
direction, we compared the percentage of first saccades that landed in the high-
probability quadrants between the aware and unaware participants. Independent t-tests
did not show significant differences between the two groups in either the training phase, t
< 1, or the testing phase, t(30) = 1.13, p > .26.
General Discussion
In two experiments we investigated the efficacy of incidental probability learning
to induce changes of spatial attention in faux X-ray images, with the goal of determining
if patterns of attentional bias acquired through learning could be leveraged to facilitate
performance in search tasks that resemble radiological image perception. The detection
task required participants to segment a target from background noise. We showed that
this task was sensitive to the target’s location probability. Participants preferentially
searched the region where the target was frequently found. This preference was acquired
incidentally. Once acquired, it persisted after the target’s location was random and equi-
probable. Similar results were observed in the discrimination task, which used well-
segmented elements and required a more traditional approach of discriminating the target
from distractors based on shape (Wolfe, 1998). Although the faux X-ray images used
here are not real, they are an intermediate stimulus between typical laboratory stimuli and
radiological images. Our data suggest that location probability learning can facilitate

122
performance in search tasks that resemble components of medical image perception, and
that learning is task specific.
Other studies, such as Evans et al. (2013, 2016), showed that radiologists relied
on global image statistics to detect abnormalities in mammograms and cervical cancer
images. Within a single glance, radiologists could determine the presence or absence of
cancers at above-chance levels, even though they could not localize the cancer. In fact,
radiologists gave higher abnormal ratings to images of apparently normal breasts that
subsequently turned cancerous (Brennan et al., 2018). These findings suggest that rapid
extraction of global image statistics could aid perception. The current study supports the
idea that statistical regularities in medical image-like stimuli can facilitate visual search.
We identified one specific source of regularities: the location probability of the target
object. This type of learning may be useful in medical image perception because tumor
locations are not random (Delattre et al., 1988; Drew et al., 2013).
An important finding from the current study is that learning-induced changes in
spatial attention did not transfer between the discrimination and the detection tasks. This
finding extends previous findings on the task-specificity of location probability learning.
Those previous studies observed a lack of transfer between search and non-search tasks,
such as between a T-among-L search task and scene memory (Addleman et al., 2018),
and between visual search and treasure hunt (Jiang, Swallow, et al., 2015). However,
previous studies did find transfer of probability cuing between visual search tasks,
including tasks that differed in RT and search efficiency or tasks that used completely
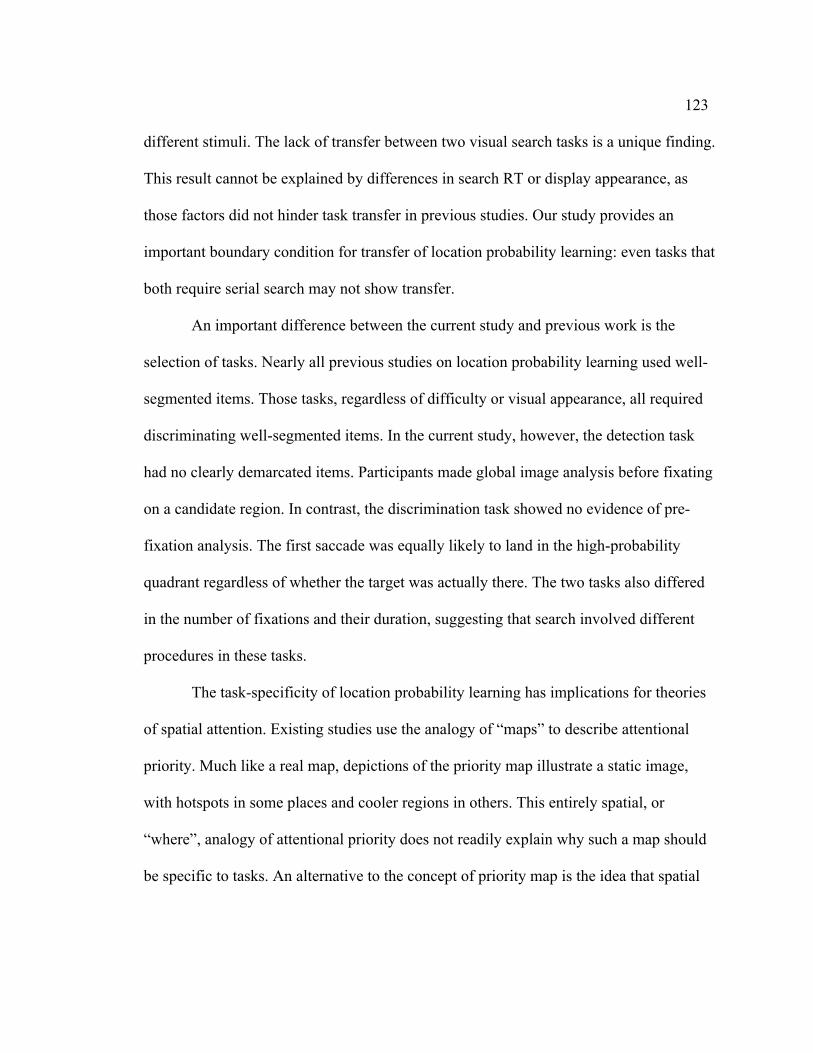
123
different stimuli. The lack of transfer between two visual search tasks is a unique finding.
This result cannot be explained by differences in search RT or display appearance, as
those factors did not hinder task transfer in previous studies. Our study provides an
important boundary condition for transfer of location probability learning: even tasks that
both require serial search may not show transfer.
An important difference between the current study and previous work is the
selection of tasks. Nearly all previous studies on location probability learning used well-
segmented items. Those tasks, regardless of difficulty or visual appearance, all required
discriminating well-segmented items. In the current study, however, the detection task
had no clearly demarcated items. Participants made global image analysis before fixating
on a candidate region. In contrast, the discrimination task showed no evidence of pre-
fixation analysis. The first saccade was equally likely to land in the high-probability
quadrant regardless of whether the target was actually there. The two tasks also differed
in the number of fixations and their duration, suggesting that search involved different
procedures in these tasks.
The task-specificity of location probability learning has implications for theories
of spatial attention. Existing studies use the analogy of “maps” to describe attentional
priority. Much like a real map, depictions of the priority map illustrate a static image,
with hotspots in some places and cooler regions in others. This entirely spatial, or
“where”, analogy of attentional priority does not readily explain why such a map should
be specific to tasks. An alternative to the concept of priority map is the idea that spatial

124
attention includes a procedural component, akin to learning oculomotor search paths.
Learning to attend involves not just learning where targets are likely to be, but also how
to optimize the vector of scan path to find the target (Jiang, 2017; Jiang, Swallow,
Rosenbaum, et al., 2013). Learning may influence attention not just by changing the
weights assigned in a Cartesian coordinate space. It may also affect the preferred
direction of attentional shift, the “how” of spatial orienting. Tasks that differ in search
procedure may not show transfer of learning because they do not share the procedural
component of search.
Location probability learning affects not only search RT, but also overt allocation
of attention as indexed by eye movements. Participants directed a disproportionately high
number of first saccades toward the high-probability quadrant. This tendency
strengthened with training. When the task changed in the testing phase, the first-saccade
bias did not carry over when participants were trained in the discrimination task but
tested in the detection task. On the other hand, the first-saccade bias acquired in the
detection task did carry over to the discrimination task. This bias gradually dissipated in
the testing phase. This asymmetry may be explained by how the two tasks were
performed. Because first saccades in the detection task were made after an initial analysis
about the image, guidance from target features could override the saccade habit acquired
from the discrimination task. In contrast, first saccades in the discrimination task were
mainly driven by previous experience. This allowed the habit acquired from the detection
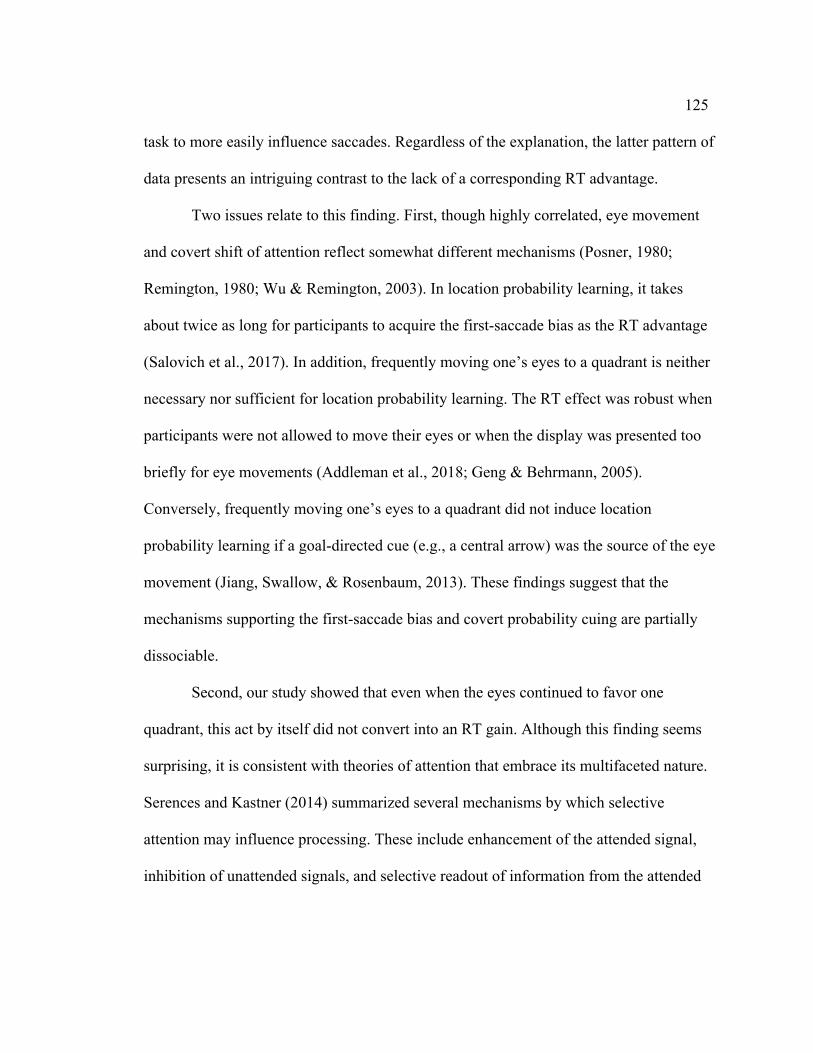
125
task to more easily influence saccades. Regardless of the explanation, the latter pattern of
data presents an intriguing contrast to the lack of a corresponding RT advantage.
Two issues relate to this finding. First, though highly correlated, eye movement
and covert shift of attention reflect somewhat different mechanisms (Posner, 1980;
Remington, 1980; Wu & Remington, 2003). In location probability learning, it takes
about twice as long for participants to acquire the first-saccade bias as the RT advantage
(Salovich et al., 2017). In addition, frequently moving one’s eyes to a quadrant is neither
necessary nor sufficient for location probability learning. The RT effect was robust when
participants were not allowed to move their eyes or when the display was presented too
briefly for eye movements (Addleman et al., 2018; Geng & Behrmann, 2005).
Conversely, frequently moving one’s eyes to a quadrant did not induce location
probability learning if a goal-directed cue (e.g., a central arrow) was the source of the eye
movement (Jiang, Swallow, & Rosenbaum, 2013). These findings suggest that the
mechanisms supporting the first-saccade bias and covert probability cuing are partially
dissociable.
Second, our study showed that even when the eyes continued to favor one
quadrant, this act by itself did not convert into an RT gain. Although this finding seems
surprising, it is consistent with theories of attention that embrace its multifaceted nature.
Serences and Kastner (2014) summarized several mechanisms by which selective
attention may influence processing. These include enhancement of the attended signal,
inhibition of unattended signals, and selective readout of information from the attended

126
channel. In other words, attention affects both perceptual and decisional processes. A
saccadic bias may enhance sensory processing from the previously high-probability
quadrant, but its impact will be minimal if the decision, or “readout”, process does not
favor input from that region.
Our study shows that learning of statistical regularities, such as the probable
locations of targets, can facilitate search. Part of the learning for medical students and
residents may be to acquire the right “prior” of likely tumor locations in certain types of
cancer (Delattre et al., 1988; Drew et al., 2013). Because this learning is incidental and its
persistence is not under complete conscious control, probability learning of this type can
facilitate search among images that share the same probability distribution. However,
such learning may have its drawbacks as well. It may hinder search when the tumor
appears in low-probability regions. The latter may contribute to inattentional blindness
and misdiagnosis (e.g., missing a tumor) in low-probability regions. Developing
specialties within radiological training, and adopting computer technologies that
preferentially scrutinize low-probability regions, may help alleviate this problem.
Because changes in spatial attention are task-specific, our study suggests that
statistical learning is more effective if performed on the same type of images that people
are likely to encounter. This recommendation differs from most Brain Training
technologies, which tout far transfer from training in specific laboratory tasks (e.g., useful
field of view) to real-world tasks (such as driving). Ultimately, transfer of learning rests
on shared processes between the trained task and the testing task. Our study provides an

127
example in which transfer fails even between two search tasks performed in the same
general space. It highlights the specificity of human skill acquisition, an idea that
resonates with findings in other domains such as chess expertise (Bilalić, McLeod, &
Gobet, 2009).
Our study is only the first step toward understanding effects of spatial training on
applied tasks such as medical imaging. The search stimuli used in our study differ from
tumors and other biological tissues; the prevalence of targets is much higher than the
rates of tumor in medical images; the testing equipment (e.g., CRT monitor) differs from
what radiologists use; and participants had no prior experience in search from images that
resemble medical images. Future studies are needed to both increase the realism of the
task and to employ spatial regularities informed by the distribution of tumors. One
approach to increase realism is to use targets that resemble actual tumors in shape, size,
texture, and contrast. Another approach is to extract the spatial distribution of tumors
from various types of cancer, and implement this distribution in the location probability
manipulation. In addition, future study can employ tasks requiring both detection and
discrimination (e.g., adding noise to the current discrimination task). Finally, collecting
data on medical students and residents in training can help understand the type of spatial
biases they do acquire.

128
Conclusion
Using stimuli embedded in noise, this study demonstrates that statistical learning
can facilitate visual search of images resembling X-rays. We showed that consistently
finding a target in one region biases people toward searching that region. This effect does
not transfer between a detection task, in which the target signal is heavily camouflaged,
and a discrimination task involving well-segmented items. Future studies should extend
the realism of these findings by characterizing the type of statistical regularities present in
medical images. In addition, it will be important to elucidate the pros and cons of
acquiring location probability learning in radiology and related fields.
Appendix
Appendix Figure 4-1. Direction of the first saccadic eye movement on target-present
trials in Experiment 2. Y-axis plots the proportion of trials in which the first saccade was

129
directed toward the high-probability quadrant. Trials were separated depending on
where the target was. Left: Participants were trained in the discrimination task and
tested in the detection task. Right: Participants were trained in the detection task and
tested in the discrimination task. Error bars show ± 1 S.E. of the mean.
Appendix Figure 4-1 (left) displays the first saccades of participants who were
trained in the discrimination task and tested in the detection task. We separated trials in
which the target itself was in the high-probability quadrant, from trials when it was in the
other quadrants. In the training phase using the discrimination task, participants had a
tendency to saccade toward the high-probability quadrant. This was the case both when
the target itself was in the high-probability quadrant, t(15) = 2.40, p = .03, and when the
target was in a low-probability quadrant, and t(15) = 2.48, p = .03. An ANOVA with
block and target’s location (high-probability and low-probability) as within-subject
factors showed a main effect of block, suggesting that people were increasingly more
likely to saccade toward the high-probability quadrant in later blocks , F(6, 90) = 2.16, p
= .055, ηp2 = .13. This tendency, however, was unaffected by where the target was, F < 1
for the main effect of target’s location. As soon as the task changed in the testing phase,
the first-saccade bias ceased. The percentage of first saccades landing in the previously
high-probability quadrant did not differ from chance, both when the target occurred in the
previously high-probability quadrant, t(15) = 1.25, p = .23, and when the target occurred
in the other quadrants, t(15) = 1.57, p = .13. The detection task, however, was sensitive to

130
where the target itself was. The first saccade was more likely directed to the high-
probability quadrant if the target itself appeared in that quadrant rather than elsewhere,
F(1, 15) = 13.92, p = .002, ηp2 = .48. The main effect of block and the interaction
between target’s location and block were not significant, Fs < 1.
Results were largely similar for participants trained in the detection task and
tested in the discrimination task. In the training phase, the first saccades were biased
toward the high-probability quadrant both when the target itself appeared in the high-
probability quadrant, t(15) = 9.97, p < .001, and when it appeared in a low-probability
quadrant, t(15) = 3.35, p = .004. An ANOVA with block and target’s location as factors
showed that this bias increased across training blocks, F(6, 90) = 6.18, p < .001, ηp2 = .29
for the main effect of block. This bias was stronger when the target was in the high-
probability quadrant than when it was elsewhere, F(1, 15) = 40.11, p < .001, ηp2 = .73.
Thus, first saccades in the detection task were made after participants had processed the
global image statistics, hence the saccade direction was biased toward where the target
was. When the task changed in the testing phase, the first-saccade bias was retained, both
when the target itself appeared in the high-probability quadrant, t(15) = 2.26, p = .04 and
when the target appeared elsewhere, t(15) = 1.97, p = .067. An ANOVA using target’s
location and block as factors showed that this bias marginally diminished in the testing
phase, F(3, 45) = 2.40, p = .08, ηp2 = .14 for the main effect of block.

131
5. Grand Summary and General Discussion
5.1. Summary of all experiments
Study 1 demonstrates that previously selected, rather than reward-associated,
items capture attention in a subsequent search task. In Experiment 1, participants
searched for two target colors in the absence of monetary reward. In a subsequent testing
phase they searched for a target defined by its unique shape. The previous target colors
were either presented as distractors or were absent from the display. The presence of the
former target color interfered with search, suggesting that it captured attention. In
Experiment 2, different amounts of monetary rewards followed correct responses to the
target colors in the training phase. Search was faster when the target was in the color
associated with a higher reward, demonstrating reward-induced attention. However, the
degree of attentional capture in the subsequent singleton-shape search task did not depend
on the reward value of the former target colors. These results indicated that colors
associated with former targets captured attention, even when they were not associated
with monetary reward. Contrary to other findings (Anderson, 2013; Anderson et al.,
2011a, 2011b), attentional capture was value-independent.
Study 2 investigated mechanisms underlying target featural probability effects.
We distinguished between two types of probabilities: target’s featural frequency versus
features’ diagnostic value. Target’s featural frequency was expressed as
P(feature_i|target), indexing how likely the target would have feature_i rather than other
features. Features’ diagnostic value was expressed as P(target|feature_i), indexing how

132
likely a feature_i coincides with the target rather than with a distractor. Using a visual
search paradigm, we manipulated the two types of probabilities separately in four
experiments. The results showed that differences in the target’s featural frequency
induced short-term attentional changes that dissipated immediately when features became
equally frequent. In contrast, differences in the features’ diagnostic value induced durable
changes in attention, which persisted even after the features became equally diagnostic of
the target. These results indicated that the various types of visual statistics people could
learn might have different effects on selective attention.
Study 3 examined the transfer of location probability learning between two visual
search tasks: a “detection” task and a “discrimination” task. In both tasks participants
searched for a letter “T”. In the detection task, the letter “T” was heavily camouflaged in
low-frequency noise. In the discrimination task, the noise opacity was reduced, but the
target appeared among visually similar distractors. In Experiment 1, two groups of
participants were randomly assigned to perform the two tasks in which the T more often
appeared in one visual quadrant in a training phase, and was randomly placed in a testing
phase. Participants acquired location probability learning in the training phase, and this
effect persisted in the unbiased testing phase. These results showed that both the
detection and discrimination tasks could benefit from location probability learning. In
Experiment 2, the training and testing phases used different task. Surprisingly, location
probability learning acquired in one task (e.g., detection) did not persist when the task
changed (e.g., to discrimination) in the testing phase. Eye-tracking data showed that the

133
two tasks were associated with different search procedures. Thus, instead of inducing a
task-independent, general change of attentional priority, location probability learning was
specific to the trained task.
5.2. Theoretical implications
5.2.1. Influence of reward learning on visual attention
Rewards and punishments are powerful in shaping human behavior. For instance,
an action that repeatedly yields a reward is more frequently elicited on subsequent
encounters of the same context (Thorndike, 1911). Reward learning is important because
it increases adaptive behaviors at the expense of competing, less-adaptive behaviors.
Reward also modulates selective visual attention, facilitating the processing of task-
relevant stimuli at the expense of irrelevant stimuli (Allport, 1989; Duncan, 1993;
Pashler, 1998). For example, a stimulus predictive of high reward produces stronger
interference when superimposed on a target stimulus than a similar item predictive of low
reward (Della Libera & Chelazzi, 2006). In addition, eye tracking studies showed that
participants made more saccades toward locations and stimuli associated with higher
rewards (Liston & Stone, 2008; Navalpakkam, Koch, Rangel, & Perona, 2010).
Consistent with these findings, Study 1 showed that participants responded faster to the
more highly rewarded target in the training phase. Participants learned the association
between visual stimuli and reward values, and prioritized the processing of more highly
rewarded stimuli in visual search tasks.
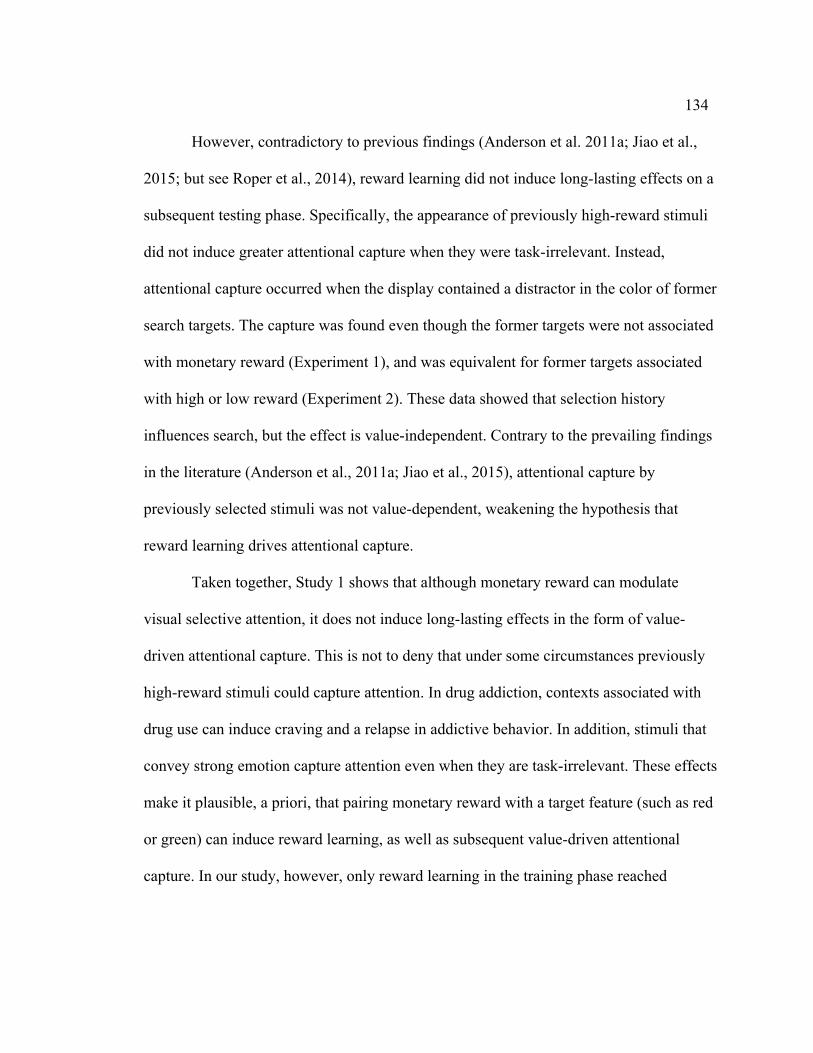
134
However, contradictory to previous findings (Anderson et al. 2011a; Jiao et al.,
2015; but see Roper et al., 2014), reward learning did not induce long-lasting effects on a
subsequent testing phase. Specifically, the appearance of previously high-reward stimuli
did not induce greater attentional capture when they were task-irrelevant. Instead,
attentional capture occurred when the display contained a distractor in the color of former
search targets. The capture was found even though the former targets were not associated
with monetary reward (Experiment 1), and was equivalent for former targets associated
with high or low reward (Experiment 2). These data showed that selection history
influences search, but the effect is value-independent. Contrary to the prevailing findings
in the literature (Anderson et al., 2011a; Jiao et al., 2015), attentional capture by
previously selected stimuli was not value-dependent, weakening the hypothesis that
reward learning drives attentional capture.
Taken together, Study 1 shows that although monetary reward can modulate
visual selective attention, it does not induce long-lasting effects in the form of value-
driven attentional capture. This is not to deny that under some circumstances previously
high-reward stimuli could capture attention. In drug addiction, contexts associated with
drug use can induce craving and a relapse in addictive behavior. In addition, stimuli that
convey strong emotion capture attention even when they are task-irrelevant. These effects
make it plausible, a priori, that pairing monetary reward with a target feature (such as red
or green) can induce reward learning, as well as subsequent value-driven attentional
capture. In our study, however, only reward learning in the training phase reached

135
significance. Value-driven attentional capture was absent, even though the study
paradigm was sensitive enough to detect the capture of attention by former targets. A
possible reason for the lack of value-driven attention is that the effect size is simply too
small. Studies using the value-driven attentional capture paradigm (Anderson et al.,
2011a) typically reported an attentional capture effect of around 10 milliseconds.
Although statistically significant in some studies, this effect may not be evident in other
studies and may be too weak to affect search behaviors in a meaningful way in real-world
settings.
5.2.2. Durability of featural probability effect
People are sensitive to event frequency in a largely automatic fashion (Hasher &
Zacks, 1984). Previous studies have shown that target’s featural probability affects
performance in visual search tasks. But they provided inconsistent evidence regarding the
durability of this effect (Kruijne & Meeter, 2016). On the basis of data from four
experiments, Study 2 reconciled the inconsistency by distinguishing between two types of
probabilities: target’s featural frequency (how frequently does the target have a certain
feature) versus features’ diagnostic values (how likely does a feature coincide with the
target). Whereas a difference in the target’s featural frequency induced transient changes
in attention, differences in the features’ diagnostic value led to durable attentional
changes. Thus, people are sensitive to various types of visual statistics, supported by
different mechanisms of learning. The short-term effect might operate through inter-trial

136
repetition priming, which lasts for no more than five to eight trials (Hillstrom, 2000;
Maljkovic & Nakayama, 1994, 2000). When target’s features became equally frequent,
they also repeated equally frequently. Thus, the prior difference in repetition priming
dissipated immediately, and so did the RT difference. On the other hand, the long-term
effect may be a result of learning the ratio of a feature coinciding with the target rather
than a distractor (diagnostic value). Such statistical learning is acquired more slowly but
persists when the statistics have changed.
The long-term attentional changes observed in Study 2 suggest that the visual
system does not always rapidly adapt to a change in the environment. However,
unpublished studies that I conducted suggest that adaptation can occur under some
circumstances. In one experiment, participants underwent the same training phase as
Experiments 2 and 4 of Study 2, in which one color was more diagnostic of the target
than the other color. In a subsequent testing phase, the previously less diagnostic color
always coincided with the target and never coincided with distractors, vice versa for the
previously more diagnostic color. This differed from Study 2, in which both of the colors
coincided with the target on half of the testing trials and with distractors on the other half.
If differences in the features’ diagnostic value always induce durable attentional changes,
the participants should respond faster to the previously more diagnostic color even if it
never coincided with the target in the testing phase. However, the attentional bias
reversed immediately in the first testing block. Participants quickly learned to prioritize

137
the previously less diagnostic color. These results indicated that people can rapidly adjust
to new statistics when the target is strongly associated with one color.
Despite our strong capacity of learning statistical regularities, limitations exist in
featural probability learning. For example, the occurrence of featural probability learning
depends on the relative perceptual discriminability of the visual attributes. When
distinguishing a basketball from a football (soccer ball), color (orange vs. black-white)
and size (basketballs are a little larger) are both distinguishing features that are sufficient
for recognition. However, the color difference is more salient than the size difference. In
fact, when multiple distinguishing features differ in their perceptual discriminability,
people preferentially attend to the feature that is more easily discriminable (Baruch,
Kimchi, & Goldsmith, 2014). In an unpublished study, I examined the effect of
perceptual discriminability on featural probability learning with two visual attributes:
color and orientation. I chose these attributes because studies showed that color was
highly efficient at guiding attention, whereas orientation was less effective (Zhuang &
Papathomas, 2011).
In this unpublished study, I first conducted pilot experiments to assess the various
attributes’ perceptual discriminability. Specifically, one group of participants searched
for a certain color (e.g., red) among heterogeneous colors (e.g., green, yellow, and blue),
and a second group searched for a certain orientation (e.g., horizontal) among
heterogeneous orientations (e.g., vertical, left-tilted, and right-tilted). The results
confirmed that participants were more efficient finding the color target than the

138
orientation target, indicating that color was more discriminable than orientation. In the
subsequent experiments, color and orientation were randomly assigned to be the target-
defining attribute and irrelevant attribute. The assignment was counterbalanced across
participants. Unbeknownst to the participants, we manipulated diagnostic values of the
irrelevant features as we did in Study 2. If featural probability learning occurs, one should
expect faster RT when the target coincides with the more diagnostic feature than when it
coincides with the less diagnostic one. However, such effect only occurred when the
irrelevant attribute was color. When searching for a certain color while one orientation
was more diagnostic than the other orientation, people did not prioritize the more
diagnostic orientation. These results suggested that differences in an irrelevant attribute’s
diagnostic value only biased attention when it had higher perceptual discriminability than
the target-defining feature. This may be because people have limited cognitive capacity
and need to focus on the most easily accessible information in the environment. In
contrast, the state-of-art artificial neural networks are able to process various types of
features in parallel given their strong computational power. From this perspective, people
are constrained in their ability to learn visual statistics if they are not perceptually salient.
5.2.3. Transfer of location probability learning across different tasks
Prior literature provides extensive evidence that location probability learning
affects performance in various tasks, such as visual search, stimulus detection, and
foraging (Jiang et al., 2014; Geng & Behrmann, 2002; Druker & Anderson, 2010).

139
Consistent with these findings, Study 3 demonstrated a location probability effect in two
types of tasks that simulated different processes in radiological image reading: detecting
potential tumor signals and discriminating tumors from normal tissue. The results
indicated that location probability learning might affect radiological image reading in
various ways. Location probability learning was durable, persisting even when the
target’s locations became random. Persistence of this effect raises the possibility that
learning of probable tumor locations is part of a radiologist’s expertise. For example,
prior expectation can bias spatial attention when a radiologist examines a chest X-ray,
because the probability of a nodule differs across anatomical regions within the chest.
Such attentional bias allows radiologists to become more accurate and faster at detecting
disease signals.
On the other hand, location probability learning is task specific. Previous studies
found that learning of probable target locations was egocentric (Jiang, Swallow, & Sun,
2014). In this study, participants searched for a letter “T” among “L”s, and the target was
more likely to occur in one visual quadrant (rich quadrant) of the screen than the others.
The participants gradually developed an attentional bias toward the rich quadrant.
However, when the participants’ view perspective changed, they prioritized rich regions
relative to their own perspective rather than relative to the environment, despite the
presence of multiple environmental landmarks. In real-world settings, such egocentricity
can invalidate prior learning when new tools emerge. For example, radiologists have
started to rely on computed tomography (CT) scans for lung nodule detection because it

140
produces higher-quality and more detailed images of the lung than traditional methods
such as X-ray. However, whereas chest X-rays are viewed in the frontal plane, CT
displays the lung in cross-section slices. Although radiologists perform the same task
(searching for lung nodules) when viewing CT and X-rays, changes of perspective can
make location probability learned from reading chest X-rays useless in examining CT
slices. In addition, Study 3 showed that location probability learning did not transfer
between the “detection” and “discrimination” tasks. These findings indicated that
location probability learning induced task-specific, rather than generic, changes in spatial
attention. Experts such as radiologists need to gain experience in various types of tasks
and tools to obtain a comprehensive understanding of their domain.
Study 3 also advances theoretical understanding of spatial attention. In
Experiment 2, the eye tracking data demonstrated several differences between the
detection and discrimination tasks. Although both tasks required participants to search for
a letter “T”, participants made fewer fixations and showed longer fixation duration in the
detection task than the discrimination task. In addition, first saccade direction was
sensitive to the target’s actual location in the detection task but not in the discrimination
task. Saccade latency was also longer in the detection task than in the discrimination task.
These results suggested that first saccades were initiated after visual analysis of the
images in the detection task, but they were executed before analysis of the images in the
discrimination task. These findings are consistent with a recent model proposing that
spatial attention has a procedural component. Specifically, location probability
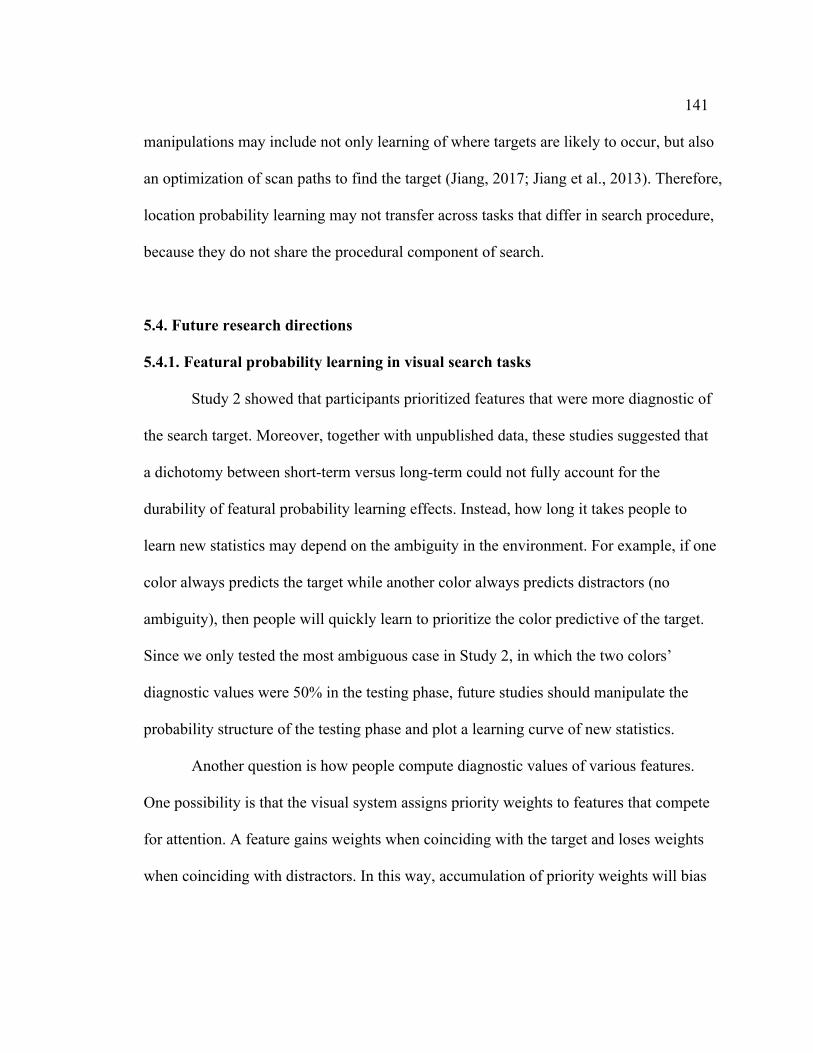
141
manipulations may include not only learning of where targets are likely to occur, but also
an optimization of scan paths to find the target (Jiang, 2017; Jiang et al., 2013). Therefore,
location probability learning may not transfer across tasks that differ in search procedure,
because they do not share the procedural component of search.
5.4. Future research directions
5.4.1. Featural probability learning in visual search tasks
Study 2 showed that participants prioritized features that were more diagnostic of
the search target. Moreover, together with unpublished data, these studies suggested that
a dichotomy between short-term versus long-term could not fully account for the
durability of featural probability learning effects. Instead, how long it takes people to
learn new statistics may depend on the ambiguity in the environment. For example, if one
color always predicts the target while another color always predicts distractors (no
ambiguity), then people will quickly learn to prioritize the color predictive of the target.
Since we only tested the most ambiguous case in Study 2, in which the two colors’
diagnostic values were 50% in the testing phase, future studies should manipulate the
probability structure of the testing phase and plot a learning curve of new statistics.
Another question is how people compute diagnostic values of various features.
One possibility is that the visual system assigns priority weights to features that compete
for attention. A feature gains weights when coinciding with the target and loses weights
when coinciding with distractors. In this way, accumulation of priority weights will bias

142
attention toward features that have a higher ratio of coinciding with the target rather than
distractors. Another possibility is that the visual system computes the diagnostic value of
each feature in parallel. Computational models such as naïve Bayesian model and
feedforward neural networks are probable solutions to modeling this computational
process. Future research may examine which model best simulates the durability of
featural probability effects under different probability conditions.
Finally, unpublished data suggest that differences in diagnostic value of a task-
irrelevant attribute only induce attentional biases when this attribute is more perceptually
discriminable than the target-defining attribute. This raises the question of whether
people only learn statistics of an irrelevant attribute when it is more discriminable, or
whether they learn statistics but only use it to optimize their attention when the attribute
is more discriminable? Although this idea requires further development, it points toward
an interesting possibility to dissociate acquisition and expression of visual statistical
learning, which has been discussed in studies on contextual cueing (Jiang & Leung,
2005).
5.4.2. Effects of location probability learning on spatial attention
Study 3 showed that location probability learning did not transfer across tasks that
differed in oculomotor search procedure. Consistent with a recently proposed model
(Jiang, 2017), these results indicated that spatial attention included a procedural
component. However, the nature of the procedural component remains vague. It may be a

143
habit of directing attention to certain spatial locations that contain task-relevant stimuli. It
may also be vectors of oculomotor scan paths. It can also be a sequence of making eye
saccades and doing peripheral analysis of a scene. Existing research has not yet provided
an answer to this question.
Another research direction is to examine location probability learning using
natural stimuli or in real-world settings. Studies on location probability learning typically
use computer-based tasks, which differ from tasks in the natural environment in viewer
mobility, spatial scale, etc. In a previous study, participants were asked to search for a
coin in a large outdoor space (Jiang, Won, Swallow, & Mussack, 2014). As in computer-
based tasks, participants learned to prioritize the rich space. However, unlike computer-
based tasks in which location probability learning is typically referenced relative to the
viewer’s perspective, learning could be referenced to either the environment or the
viewer in this large-scale study. These results indicated that the spatial reference frame of
attention had greater flexibility in the natural environment than in laboratory scenarios.
Future research may apply this finding to radiological image reading to facilitate transfer
of expertise. For example, experience of examining chest X-ray images cannot transfer to
reading CT slices. But what if the radiologists are trained with 3D representations of the
body? Such training will enable radiologist to rotate the 3D image of the lung and learn
how to search for lung nodules from various perspectives. It may enable transfer to 2D
images obtained from different perspectives, such as X-ray (coronal plane) and CT slices
(cross-section plane).

144
References
Addleman, D. A., Tao, J., Remington, R. W., & Jiang, Y. V. (2018). Explicit goal-driven attention, unlike implicitly learned attention, spreads to secondary tasks. Journal of Experimental Psychology: Human Perception and Performance, 44(3), 356–366. https://doi.org/10.1037/xhp0000457
Allport, A. (1989). Visual attention. In Foundations of cognitive science (pp. 631–682). Cambridge, MA, US: The MIT Press.
Anderson, A. K., & Phelps, E. A. (2001). Lesions of the human amygdala impair enhanced perception of emotionally salient events. Nature, 411(6835), 305–309. https://doi.org/10.1038/35077083
Anderson, B. A. (2013). A value-driven mechanism of attentional selection. Journal of Vision, 13(3), 7–7. https://doi.org/10.1167/13.3.7
Anderson, Brian A. (2015). Value-driven attentional priority is context specific. Psychonomic Bulletin & Review, 22(3), 750–756. https://doi.org/10.3758/s13423-014-0724-0
Anderson, Brian A., Laurent, P. A., & Yantis, S. (2011a). Learned value magnifies salience-based attentional capture. PLoS ONE, 6(11), e27926. https://doi.org/10.1371/journal.pone.0027926
Anderson, Brian A., Laurent, P. A., & Yantis, S. (2011b). Value-driven attentional capture. Proceedings of the National Academy of Sciences, 108(25), 10367–10371. https://doi.org/10.1073/pnas.1104047108
Anderson, Brian A., Laurent, P. A., & Yantis, S. (2013). Reward predictions bias attentional selection. Frontiers in Human Neuroscience, 7. https://doi.org/10.3389/fnhum.2013.00262
Anderson, Brian A., Laurent, P. A., & Yantis, S. (2014). Value-driven attentional priority signals in human basal ganglia and visual cortex. Brain Research, 1587, 88–96. https://doi.org/10.1016/j.brainres.2014.08.062
Anderson, Brian A., & Yantis, S. (2013). Persistence of value-driven attentional capture. Journal of Experimental Psychology: Human Perception and Performance, 39(1), 6–9. https://doi.org/10.1037/a0030860
Assad, J. A., & Maunsell, J. H. R. (1995). Neuronal correlates of inferred motion in primate posterior parietal cortex. Nature, 373(6514), 518. https://doi.org/10.1038/373518a0
Awh, E., Belopolsky, A. V., & Theeuwes, J. (2012). Top-down versus bottom-up attentional control: a failed theoretical dichotomy. Trends in Cognitive Sciences, 16(8), 437–443. https://doi.org/10.1016/j.tics.2012.06.010
Bacon, W. F., & Egeth, H. E. (1994). Overriding stimulus-driven attentional capture. Perception & Psychophysics, 55(5), 485–496. https://doi.org/10.3758/BF03205306
145
Baruch, O., Kimchi, R., & Goldsmith, M. (2014). Attention to distinguishing features in object recognition. Visual Cognition, 22(9–10), 1184–1215. https://doi.org/10.1080/13506285.2014.987860
Bilalić, M., McLeod, P., & Gobet, F. (2009). Specialization effect and its influence on memory and problem solving in expert chess players. Cognitive Science, 33(6), 1117–1143. https://doi.org/10.1111/j.1551-6709.2009.01030.x
Brainard, D. H. (1997). The Psychophysics Toolbox. Spatial Vision, 10(4), 433–436. Brennan, P. C., Gandomkar, Z., Ekpo, E. U., Tapia, K., Trieu, P. D., Lewis, S. J., … Evans, K. K. (2018). Radiologists can detect the ‘gist’ of breast cancer before any overt signs of cancer appear. Scientific Reports, 8(1), 8717. https://doi.org/10.1038/s41598-018-26100-5
Bucker, B., Belopolsky, A. V., & Theeuwes, J. (2015). Distractors that signal reward attract the eyes. Visual Cognition, 23(1–2), 1–24. https://doi.org/10.1080/13506285.2014.980483
Burgess, A. E., Jacobson, F. L., & Judy, P. F. (2001). Human observer detection experiments with mammograms and power-law noise. Medical Physics, 28(4), 419–437. https://doi.org/10.1118/1.1355308
Chelazzi, L., Eštočinová, J., Calletti, R., Gerfo, E. L., Sani, I., Della Libera, C., & Santandrea, E. (2014). Altering spatial priority maps via reward-based learning. Journal of Neuroscience, 34(25), 8594–8604. https://doi.org/10.1523/JNEUROSCI.0277-14.2014
Chelazzi, L., Perlato, A., Santandrea, E., & Della Libera, C. (2013). Rewards teach visual selective attention. Vision Research, 85, 58–72. https://doi.org/10.1016/j.visres.2012.12.005
Chong, S. C., & Treisman, A. (2003). Representation of statistical properties. Vision Research, 43(4), 393–404. https://doi.org/10.1016/S0042-6989(02)00596-5
Chun, M. M., & Jiang, Y. (1998). Contextual cueing: implicit learning and memory of visual context guides spatial attention. Cognitive Psychology, 36(1), 28–71. https://doi.org/10.1006/cogp.1998.0681
Chun, M. M., & Jiang, Y. (1999). Top-down attentional guidance based on implicit learning of visual covariation. Psychological Science, 10(4), 360–365. https://doi.org/10.1111/1467-9280.00168
Chun, M. M., & Jiang, Y. (2003). Implicit, long-term spatial contextual memory. Journal of Experimental Psychology: Learning, Memory, and Cognition, 29(2), 224–234. https://doi.org/10.1037/0278-7393.29.2.224
Conway, C. M., & Christiansen, M. H. (2005). Modality-constrained statistical learning of tactile, visual, and auditory sequences. 31(1), 24–39. http://dx.doi.org/10.1037/0278-7393.31.1.24
Corbetta, M., Kincade, J. M., Ollinger, J. M., McAvoy, M. P., & Shulman, G. L. (2000). Voluntary orienting is dissociated from target detection in human posterior parietal cortex. Nature Neuroscience, 3(3), 292–297. https://doi.org/10.1038/73009
Corbetta, M., Kincade, J. M., & Shulman, G. L. (2002). Neural systems for visual orienting and their relationships to spatial working memory. Journal of Cognitive Neuroscience, 14(3), 508–523. https://doi.org/10.1162/089892902317362029

146
Corbetta, M., & Shulman, G. L. (2002). Control of goal-directed and stimulus-driven attention in the brain. Nature Reviews Neuroscience, 3(3), 201–215. https://doi.org/10.1038/nrn755
Cosman, J. D., & Vecera, S. P. (2014). Establishment of an attentional set via statistical learning. Journal of Experimental Psychology: Human Perception and Performance, 40(1), 1–6. https://doi.org/10.1037/a0034489
Delattre, J. Y., Krol, G., Thaler, H. T., & Posner, J. B. (1988). Distribution of brain metastases. Archives of Neurology, 45(7), 741–744. https://doi.org/10.1001/archneur.1988.00520310047016
Della Libera, C., & Chelazzi, L. (2006). Visual selective attention and the effects of monetary rewards. Psychological Science, 17(3), 222–227. https://doi.org/10.1111/j.1467-9280.2006.01689.x
Della Libera, C., & Chelazzi, L. (2009). Learning to attend and to ignore is a matter of gains and losses. Psychological Science, 20(6), 778–784. https://doi.org/10.1111/j.1467-9280.2009.02360.x
Desimone, R., & Duncan, J. (1995). Neural mechanisms of selective visual attention. Annual Review of Neuroscience, 18(1), 193–222. https://doi.org/10.1146/annurev.ne.18.030195.001205
Drew, T., Cunningham, C., & Wolfe, J. M. (2012). When and why might a computer-aided detection (CAD) system interfere with visual search? An eye-tracking study. Academic Radiology, 19(10), 1260–1267. https://doi.org/10.1016/j.acra.2012.05.013
Drew, T., Evans, K., Võ, M. L.-H., Jacobson, F. L., & Wolfe, J. M. (2013). Informatics in radiology: what can you see in a single glance and how might this guide visual search in medical images? Radiographics: A Review Publication of the Radiological Society of North America, Inc, 33(1), 263–274. https://doi.org/10.1148/rg.331125023
Driver, J. (2001). A selective review of selective attention research from the past century. British Journal of Psychology, 92(1), 53–78. https://doi.org/10.1348/000712601162103
Druker, M., & Anderson, B. (2010). Spatial probability aids visual stimulus discrimination. Frontiers in Human Neuroscience, 4, 63. https://doi.org/10.3389/fnhum.2010.00063
Duncan, J. (1993). Coordination of what and where in visual attention. Perception, 22(11), 1261–1270. https://doi.org/10.1068/p221261
Evans, K. K., Georgian-Smith, D., Tambouret, R., Birdwell, R. L., & Wolfe, J. M. (2013). The gist of the abnormal: above-chance medical decision making in the blink of an eye. Psychonomic Bulletin & Review, 20(6), 1170–1175. https://doi.org/10.3758/s13423-013-0459-3
Evans, K. K., Haygood, T. M., Cooper, J., Culpan, A.-M., & Wolfe, J. M. (2016). A half-second glimpse often lets radiologists identify breast cancer cases even when viewing the mammogram of the opposite breast. Proceedings of the National Academy of Sciences of the United States of America, 113(37), 10292–10297. https://doi.org/10.1073/pnas.1606187113
Failing, M. F., & Theeuwes, J. (2014). Exogenous visual orienting by reward. Journal of Vision, 14(5), 6. https://doi.org/10.1167/14.5.6

147
Fiser, J., & Aslin, R. N. (2001). Unsupervised statistical learning of higher-order spatial structures from visual scenes. Psychological Science, 12(6), 499–504. https://doi.org/10.1111/1467-9280.00392
Fiser, J., & Aslin, R. N. (2002). Statistical learning of higher-order temporal structure from visual shape sequences. Journal of Experimental Psychology: Learning, Memory, and Cognition, 28(3), 458–467. https://doi.org/10.1037/0278-7393.28.3.458
Folk, C. L., & Remington, R. W. (2015). Unexpected abrupt onsets can override a top-down set for color. Journal of Experimental Psychology. Human Perception and Performance, 41(4), 1153–1165. https://doi.org/10.1037/xhp0000084
Folk, C. L., Remington, R. W., & Johnston, J. C. (1992). Involuntary covert orienting is contingent on attentional control settings. Journal of Experimental Psychology: Human Perception and Performance, 18(4), 1030–1044. https://doi.org/10.1037/0096-1523.18.4.1030
Gebhart, A. L., Aslin, R. N., & Newport, E. L. (2009). Changing structures in midstream: Learning along the statistical garden path. Cognitive Science, 33(6), 1087–1116. https://doi.org/10.1111/j.1551-6709.2009.01041.x
Geng, J. J., & Behrmann, M. (2002). Probability cuing of target location facilitates visual search implicitly in normal participants and patients with hemispatial neglect. Psychological Science, 13(6), 520–525. https://doi.org/10.1111/1467-9280.00491
Geng, J. J., & Behrmann, M. (2005). Spatial probability as an attentional cue in visual search. Perception & Psychophysics, 67(7), 1252–1268. https://doi.org/10.3758/BF03193557
Godwin, H. J., Menneer, T., Cave, K. R., Helman, S., Way, R. L., & Donnelly, N. (2010). The impact of relative prevalence on dual-target search for threat items from airport X-ray screening. Acta Psychologica, 134(1), 79–84. https://doi.org/10.1016/j.actpsy.2009.12.009
Godwin, H. J., Menneer, T., Riggs, C. A., Cave, K. R., & Donnelly, N. (2015). Perceptual failures in the selection and identification of low-prevalence targets in relative prevalence visual search. Attention, Perception, & Psychophysics, 77(1), 150–159. https://doi.org/10.3758/s13414-014-0762-8
Gong, M., & Li, S. (2014). Learned reward association improves visual working memory. Journal of Experimental Psychology: Human Perception and Performance, 40(2), 841–856. https://doi.org/10.1037/a0035131
Gottlieb, J., Hayhoe, M., Hikosaka, O., & Rangel, A. (2014). Attention, reward, and information seeking. Journal of Neuroscience, 34(46), 15497–15504. https://doi.org/10.1523/JNEUROSCI.3270-14.2014
Gwinn, R., Leber, A. B., & Krajbich, I. (2018). The spillover effects of attentional learning on value-based choice. Cognition, 182, 294-306. https://doi.org/10.1016/j.cognition.2018.10.012
Haberman, J., & Whitney, D. (2009). Seeing the mean: Ensemble coding for sets of faces. Journal of Experimental Psychology: Human Perception and Performance, 35(3), 718–734. https://doi.org/10.1037/a0013899
Hasher, L., & Zacks, R. T. (1984). Automatic processing of fundamental information: The case of frequency of occurrence. American Psychologist, 39(12), 1372–1388. https://doi.org/10.1037/0003-066X.39.12.1372

148
Hickey, C., Chelazzi, L., & Theeuwes, J. (2014). Reward-priming of location in visual search. PLoS ONE, 9(7), e103372. https://doi.org/10.1371/journal.pone.0103372
Hillstrom, A. P. (2000). Repetition effects in visual search. Perception & Psychophysics, 62(4), 800–817. https://doi.org/10.3758/BF03206924
Hodsoll, S., Viding, E., & Lavie, N. (2011). Attentional capture by irrelevant emotional distractor faces. Emotion (Washington, D.C.), 11(2), 346–353. https://doi.org/10.1037/a0022771
Hon, N., & Tan, C.-H. (2013). Why rare targets are slow: Evidence that the target probability effect has an attentional locus. Attention, Perception, & Psychophysics, 75(3), 388–393. https://doi.org/10.3758/s13414-013-0434-0
Hopfinger, J. B., Buonocore, M. H., & Mangun, G. R. (2000). The neural mechanisms of top-down attentional control. Nature Neuroscience, 3(3), 284–291. https://doi.org/10.1038/72999
Horstmann, G., & Ansorge, U. (2006). Attentional shifts to rare singletons. Visual Cognition, 14(3), 295–325. https://doi.org/10.1080/13506280500236492
Hout, M. C., Walenchok, S. C., Goldinger, S. D., & Wolfe, J. M. (2015). Failures of perception in the low-prevalence effect: Evidence from active and passive visual search. Journal of Experimental Psychology: Human Perception and Performance, 41(4), 977–994. https://doi.org/10.1037/xhp0000053
Jiang, Y., & Chun, M. M. (2001). Selective attention modulates implicit learning. The Quarterly Journal of Experimental Psychology Section A, 54(4), 1105–1124. https://doi.org/10.1080/713756001
Jiang, Y., & Leung, A. W. (2005). Implicit learning of ignored visual context. Psychonomic Bulletin & Review, 12(1), 100–106. https://doi.org/10.3758/BF03196353
Jiang, Y. V. (2017). Habitual versus goal-driven attention. Cortex. https://doi.org/10.1016/j.cortex.2017.06.018
Jiang, Y. V., Sha, L. Z., & Remington, R. W. (2015). Modulation of spatial attention by goals, statistical learning, and monetary reward. Attention, Perception & Psychophysics. https://doi.org/10.3758/s13414-015-0952-z
Jiang, Y.V., Sha, L.Z., & Sisk, C.A. (2018) Experience-guided attention: Uniform and implicit. Attention, Perception, & Psychophysics, 80(7), 1647–1653. https://doi.org/10.3758/s13414-018-1585-9
Jiang, Y. V., & Swallow, K. M. (2014). Changing viewer perspectives reveals constraints to implicit visual statistical learning. Journal of Vision, 14(12). https://doi.org/10.1167/14.12.3
Jiang, Y. V., Swallow, K. M., & Rosenbaum, G. M. (2013). Guidance of spatial attention by incidental learning and endogenous cuing. Journal of Experimental Psychology: Human Perception and Performance, 39(1), 285–297. https://doi.org/10.1037/a0028022
Jiang, Y. V., Swallow, K. M., Rosenbaum, G. M., & Herzig, C. (2013). Rapid acquisition but slow extinction of an attentional bias in space. Journal of Experimental Psychology: Human Perception and Performance, 39(1), 87–99. https://doi.org/10.1037/a0027611
Jiang, Y. V., Swallow, K. M., & Sun, L. (2014). Egocentric coding of space for incidentally learned attention: Effects of scene context and task instructions.

149
Journal of Experimental Psychology: Learning, Memory, and Cognition, 40(1), 233–250. https://doi.org/10.1037/a0033870
Jiang, Y. V., Swallow, K. M., Won, B.-Y., Cistera, J. D., & Rosenbaum, G. M. (2015). Task specificity of attention training: the case of probability cuing. Attention, Perception, & Psychophysics, 77(1), 50–66. https://doi.org/10.3758/s13414-014-0747-7
Jiang, Y. V., Won, B.-Y., Swallow, K. M., & Mussack, D. M. (2014). Spatial reference frame of attention in a large outdoor environment. Journal of Experimental Psychology: Human Perception and Performance, 40(4), 1346–1357. https://doi.org/10.1037/a0036779
Jiao, J., Du, F., He, X., & Zhang, K. (2015). Social comparison modulates reward-driven attentional capture. Psychonomic Bulletin & Review, 22(5), 1278–1284. https://doi.org/10.3758/s13423-015-0812-9
Johnston, W. A., & Dark, V. J. (1986). Selective attention. Annual Review of Psychology, 37(1), 43–75. https://doi.org/10.1146/annurev.ps.37.020186.000355
Jungé, J. A., Scholl, B. J., & Chun, M. M. (2007). How is spatial context learning integrated over signal versus noise? A primacy effect in contextual cueing. Visual Cognition, 15(1), 1–11. https://doi.org/10.1080/13506280600859706
Kalish, M. L., Griffiths, T. L., & Lewandowsky, S. (2007). Iterated learning: Intergenerational knowledge transmission reveals inductive biases. Psychonomic Bulletin & Review, 14(2), 288–294. https://doi.org/10.3758/BF03194066
Kastner, S., Pinsk, M. A., De Weerd, P., Desimone, R., & Ungerleider, L. G. (1999). Increased activity in human visual cortex during directed attention in the absence of visual stimulation. Neuron, 22(4), 751–761. https://doi.org/10.1016/S0896-6273(00)80734-5
Kersten, D., Mamassian, P., & Yuille, A. (2004). Object perception as Bayesian inference. Annual Review of Psychology, 55(1), 271–304. https://doi.org/10.1146/annurev.psych.55.090902.142005
Kristjánsson, Á., & Campana, G. (2010). Where perception meets memory: A review of repetition priming in visual search tasks. Attention, Perception, & Psychophysics, 72(1), 5–18. https://doi.org/10.3758/APP.72.1.5
Kristjánsson, Á., Sigurjónsdóttir, Ó., & Driver, J. (2010). Fortune and reversals of fortune in visual search: Reward contingencies for pop-out targets affect search efficiency and target repetition effects. Attention, Perception, & Psychophysics, 72(5), 1229–1236. https://doi.org/10.3758/APP.72.5.1229
Kruijne, W., & Meeter, M. (2015). The long and the short of priming in visual search. Attention, Perception, & Psychophysics, 77(5), 1558–1573. https://doi.org/10.3758/s13414-015-0860-2
Kruijne, W., & Meeter, M. (2016). Long-term priming of visual search prevails against the passage of time and counteracting instructions. Journal of Experimental Psychology: Learning, Memory, and Cognition, No Pagination Specified. https://doi.org/10.1037/xlm0000233
Krupinski, E. A. (2015). Improving patient care through medical image perception research. Policy Insights from the Behavioral and Brain Sciences, 2(1), 74–80. https://doi.org/10.1177/2372732215600451

150
Kundel, H. L., Nodine, C. F., Conant, E. F., & Weinstein, S. P. (2007). Holistic component of image perception in mammogram interpretation: Gaze-tracking study. Radiology, 242(2), 396-402. https://pubs.rsna.org/doi/10.1148/radiol.2422051997
Kyllingsbæk, S., Schneider, W. X., & Bundesen, C. (2001). Automatic attraction of attention to former targets in visual displays of letters. Perception & Psychophysics, 63(1), 85–98. https://doi.org/10.3758/BF03200505
Laberge, D., & Tweedy, J. R. (1964). Presentation probability and choice time. Journal of Experimental Psychology, 68(5), 477–481. https://doi.org/10.1037/h0048691
Lamy, D., Yashar, A., & Ruderman, L. (2010). A dual-stage account of inter-trial priming effects. Vision Research, 50(14), 1396–1401. https://doi.org/10.1016/j.visres.2010.01.008
Le Pelley, M. E., Pearson, D., Griffiths, O., & Beesley, T. (2015). When goals conflict with values: Counterproductive attentional and oculomotor capture by reward-related stimuli. Journal of Experimental Psychology: General, 144(1), 158–171. https://doi.org/10.1037/xge0000037
Leber, A. B., & Egeth, H. E. (2006). Attention on autopilot: Past experience and attentional set. Visual Cognition, 14(4–8), 565–583. https://doi.org/10.1080/13506280500193438
Lee, J., & Shomstein, S. (2014). Reward-based transfer from bottom-up to top-down search tasks. Psychological Science, 25(2), 466–475. https://doi.org/10.1177/0956797613509284
Liston, D. B., & Stone, L. S. (2008). Effects of prior information and reward on oculomotor and perceptual choices. Journal of Neuroscience, 28(51), 13866–13875. https://doi.org/10.1523/JNEUROSCI.3120-08.2008
Maljkovic, V., & Nakayama, K. (1994). Priming of pop-out: I. Role of features. Memory & Cognition, 22(6), 657–672. https://doi.org/10.3758/BF03209251
Maljkovic, V., & Nakayama, K. (1996). Priming of pop-out: II. The role of position. Perception & Psychophysics, 58(7), 977–991. https://doi.org/10.3758/BF03206826
Maljkovic, V., & Nakayama, K. (2000). Priming of popout: III. A short-term implicit memory system beneficial for rapid target selection. Visual Cognition, 7(5), 571–595. https://doi.org/10.1080/135062800407202
MATLAB (2018). www.mathworks.com. Accessed 17 May 2018. Menneer, T., Cave, K. R., & Donnelly, N. (2009). The cost of search for multiple targets:
effects of practice and target similarity. Journal of Experimental Psychology. Applied, 15(2), 125–139. https://doi.org/10.1037/a0015331
Miller, J. (1988). Components of the location probability effect in visual search tasks. Journal of Experimental Psychology: Human Perception and Performance, 14(3), 453–471. https://doi.org/10.1037/0096-1523.14.3.453
Mine, C., & Saiki, J. (2015). Task-irrelevant stimulus-reward association induces value-driven attentional capture. Attention, Perception, & Psychophysics, 77(6), 1896–1907. https://doi.org/10.3758/s13414-015-0894-5
Miranda, A. T., & Palmer, E. M. (2013). Intrinsic motivation and attentional capture from gamelike features in a visual search task. Behavior Research Methods, 46(1), 159–172. https://doi.org/10.3758/s13428-013-0357-7

151
Monsell, S. (2003). Task switching. Trends in Cognitive Sciences, 7(3), 134–140. https://doi.org/10.1016/S1364-6613(03)00028-7
Most, S. B., & Wang, L. (2011). Dissociating spatial attention and awareness in emotion-induced blindness. Psychological Science, 22(3), 300–305. https://doi.org/10.1177/0956797610397665
Müller, H. J., Heller, D., & Ziegler, J. (1995). Visual search for singleton feature targets within and across feature dimensions. Perception & Psychophysics, 57(1), 1–17. https://doi.org/10.3758/BF03211845
National motor vehicle crash causation survey (2008). Retrieved from https://crashstats.nhtsa.dot.gov/Api/Public/ViewPublication/811052
Navalpakkam, V., Koch, C., Rangel, A., & Perona, P. (2010). Understanding how reward and saliency affect overt attention and decisions. Journal of Vision, 10(7), 32–32. https://doi.org/10.1167/10.7.32
Neill, W. T., Terry, K. M., & Valdes, L. A. (1994). Negative priming without probe selection. Psychonomic Bulletin & Review, 1(1), 119–121. https://doi.org/10.3758/BF03200767
Neo, G., & Chua, F. K. (2006). Capturing focused attention. Perception & Psychophysics, 68(8), 1286–1296. https://doi.org/10.3758/BF03193728
Nissen, M. J., & Bullemer, P. (1987). Attentional requirements of learning: Evidence from performance measures. Cognitive Psychology, 19(1), 1–32. https://doi.org/10.1016/0010-0285(87)90002-8
Olson, I. R., & Chun, M. M. (2001). Temporal contextual cuing of visual attention. Journal of Experimental Psychology. Learning, Memory, and Cognition, 27(5), 1299–1313. http://dx.doi.org/10.1037/0278-7393.27.5.1299
Orbán, G., Fiser, J., Aslin, R. N., & Lengyel, M. (2008). Bayesian learning of visual chunks by human observers. Proceedings of the National Academy of Sciences, 105(7), 2745–2750. https://doi.org/10.1073/pnas.0708424105
Pashler, H. (1998). The Psychology of Attention. MIT Press, Cambridge, Massachusetts. Pelli, D. G. (1997). The VideoToolbox software for visual psychophysics: transforming
numbers into movies. Spatial Vision, 10(4), 437–442. Perkins, D. & Saloman, G. (1994). Transfer of learning. In T. Husen & T. Postlethwaite
(Eds), The international encyclopedia of education 2nd Edition, Vol. 11. Elsevier Science Ltd, Oxford.
Pool, E., Brosch, T., Delplanque, S., & Sander, D. (2014). Where is the chocolate? Rapid spatial orienting toward stimuli associated with primary rewards. Cognition, 130(3), 348–359. https://doi.org/10.1016/j.cognition.2013.12.002
Posner, M. I. (1980). Orienting of attention. Quarterly Journal of Experimental Psychology, 32(1), 3–25. https://doi.org/10.1080/00335558008248231
Qi, S., Zeng, Q., Ding, C., & Li, H. (2013). Neural correlates of reward-driven attentional capture in visual search. Brain Research, 1532, 32–43. https://doi.org/10.1016/j.brainres.2013.07.044
Reber, A. S. (1967). Implicit learning of artificial grammars. Journal of Verbal Learning and Verbal Behavior, 6(6), 855–863. https://doi.org/10.1016/S0022-5371(67)80149-X

152
Remington, R. W. (1980). Attention and saccadic eye movements. Journal of Experimental Psychology: Human Perception and Performance, 6(4), 726–744. https://doi.org/10.1037/0096-1523.6.4.726
Roper, Z. J. J., Vecera, S. P., & Vaidya, J. G. (2014). Value-driven attentional capture in adolescence. Psychological Science, 0956797614545654. https://doi.org/10.1177/0956797614545654
Rouder, J. N., & Morey, R. D. (2012). Default Bayes factors for model selection in regression. Multivariate Behavioral Research, 47(6), 877–903. https://doi.org/10.1080/00273171.2012.734737
Rouder, J. N., Morey, R. D., Speckman, P. L., & Province, J. M. (2012). Default Bayes factors for ANOVA designs. Journal of Mathematical Psychology, 56(5), 356–374. https://doi.org/10.1016/j.jmp.2012.08.001
Saffran, J. R., Aslin, R. N., & Newport, E. L. (1996). Statistical learning by 8-month-old infants. Science, 274(5294), 1926–1928. https://doi.org/10.1126/science.274.5294.1926
Saffran, J. R., Johnson, E. K., Aslin, R. N., & Newport, E. L. (1999). Statistical learning of tone sequences by human infants and adults. Cognition, 70(1), 27–52. https://doi.org/10.1016/S0010-0277(98)00075-4
Saffran, J. R., & Kirkham, N. Z. (2018). Infant statistical learning. Annual Review of Psychology, 69, 181–203. https://doi.org/10.1146/annurev-psych-122216-011805
Saffran, J. R., Newport, E. L., Aslin, R. N., Tunick, R. A., & Barrueco, S. (1997). Incidental language learning: Listening (and Learning) out of the corner of your ear. Psychological Science, 8(2), 101–105. https://doi.org/10.1111/j.1467-9280.1997.tb00690.x
Saffran, J. R., & Wilson, D. P. (2003). From syllables to syntax: Multilevel statistical learning by 12-month-old infants. Infancy, 4(2), 273–284. https://doi.org/10.1207/S15327078IN0402_07
Sali, A. W., Anderson, B. A., & Yantis, S. (2014). The role of reward prediction in the control of attention. Journal of Experimental Psychology: Human Perception and Performance, 40(4), 1654–1664. https://doi.org/10.1037/a0037267
Salovich, N. A., Remington, R. W., & Jiang, Y. V. (2017). Acquisition of habitual visual attention and transfer to related tasks. Psychonomic Bulletin & Review, 1–7. https://doi.org/10.3758/s13423-017-1341-5
Schmidt, L. J., Belopolsky, A. V., & Theeuwes, J. (2015a). Attentional capture by signals of threat. Cognition and Emotion, 29(4), 687–694. https://doi.org/10.1080/02699931.2014.924484
Schmidt, L. J., Belopolsky, A. V., & Theeuwes, J. (2015b). Potential threat attracts attention and interferes with voluntary saccades. Emotion, 15(3), 329–338. https://doi.org/10.1037/emo0000041
Schneider, W., & Shiffrin, R. M. (1977). Controlled and automatic human information processing: I. Detection, search, and attention. Psychological Review, 84(1), 1–66. https://doi.org/10.1037/0033-295X.84.1.1
Seitz, A., & Watanabe, T. (2005). A unified model for perceptual learning. Trends in Cognitive Sciences, 9(7), 329–334. https://doi.org/10.1016/j.tics.2005.05.010

153
Serences, J.T. & Kastner, S. (2014) A multi‐level account of selective attention. In A.C. Nobre & S. Kastner (Eds), The Oxford Handbook of Attention. Oxford University Press,Oxford, pp. 76–104.
Sha, L. Z., & Jiang, Y. V. (2016). Components of reward-driven attentional capture. Attention, Perception, & Psychophysics, 78(2), 403–414. https://doi.org/10.3758/s13414-015-1038-7
Sha, L. Z., Remington, R. W., & Jiang, Y. V. (2017a). Short-term and long-term attentional biases to frequently encountered target features. Attention, Perception & Psychophysics, 79(5), 1311–1322. https://doi.org/10.3758/s13414-017-1317-6
Sha, L. Z., Remington, R. W., & Jiang, Y. V. (2017b). Rapid and selective updating of the target template in visual search. Journal of Vision, 17(1), 36. https://doi.org/10.1167/17.1.36
Sha, L. Z., Remington, R. W., & Jiang, Y. V. (2018). Statistical learning of anomalous regions in complex faux X-ray images does not transfer between detection and discrimination. Cognitive Research: Principles and Implications, 3(1), 48. https://doi.org/10.1186/s41235-018-0144-1
Shaw, M. L., & Shaw, P. (1977). Optimal allocation of cognitive resources to spatial locations. Journal of Experimental Psychology: Human Perception and Performance, 3(2), 201–211. https://doi.org/10.1037/0096-1523.3.2.201
Shen, Y. J., & Chun, M. M. (2011). Increases in rewards promote flexible behavior. Attention, Perception, & Psychophysics, 73(3), 938–952. https://doi.org/10.3758/s13414-010-0065-7
Shuler, M. G., & Bear, M. F. (2006). Reward timing in the primary visual cortex. Science, 311(5767), 1606–1609. https://doi.org/10.1126/science.1123513
Sisk, C.A., Twedell, E.L., Koutstaal, W., Cooper, S.E., & Jiang, Y.V. (2018). Implicitly-learned spatial attention is unimpaired in patients with Parkinson’s disease. Neuropsychologia, 119, 34-44.
Stankevich, B. A., & Geng, J. J. (2014). Reward associations and spatial probabilities produce additive effects on attentional selection. Attention, Perception, & Psychophysics, 76(8), 2315–2325. https://doi.org/10.3758/s13414-014-0720-5
Swallow, K. M., & Jiang, Y. V. (2013). Attentional load and attentional boost: A review of data and theory. Frontiers in Psychology, 4. https://doi.org/10.3389/fpsyg.2013.00274
Sweeny, T. D., Haroz, S., & Whitney, D. (2013). Perceiving group behavior: sensitive ensemble coding mechanisms for biological motion of human crowds. Journal of Experimental Psychology. Human Perception and Performance, 39(2), 329–337. https://doi.org/10.1037/a0028712
Theeuwes, J. (1991). Exogenous and endogenous control of attention: The effect of visual onsets and offsets. Perception & Psychophysics, 49(1), 83–90. https://doi.org/10.3758/BF03211619
Thorndike, E. L. (1911). Animal intelligence: Experimental studies. New York: Macmillan.
Toro, J. M., & Trobalón, J. B. (2005). Statistical computations over a speech stream in a rodent. Perception & Psychophysics, 67(5), 867–875. https://doi.org/10.3758/BF03193539

154
Toth, L. J., & Assad, J. A. (2002). Dynamic coding of behaviourally relevant stimuli in parietal cortex. Nature, 415(6868), 165. https://doi.org/10.1038/415165a
Treisman, A. M. (1969). Strategies and models of selective attention. Psychological Review, 76(3), 282–299. https://doi.org/10.1037/h0027242
Turk-Browne, N. B., Jungé, J. A., & Scholl, B. J. (2005). The automaticity of visual statistical learning. Journal of Experimental Psychology: General, 134(4), 552–564. https://doi.org/10.1037/0096-3445.134.4.552
Turk-Browne, N. B., Scholl, B. J., Chun, M. M., & Johnson, M. K. (2009). Neural evidence of statistical learning: Efficient detection of visual regularities without awareness. Journal of Cognitive Neuroscience, 21(10), 1934–1945. https://doi.org/10.1162/jocn.2009.21131
Vickery, T. J., King, L. W., & Jiang, Y. (2005). Setting up the target template in visual search. Journal of Vision, 5(1), 8–8. https://doi.org/10.1167/5.1.8
Vickery, Timothy J., Chun, M. M., & Lee, D. (2011). Ubiquity and specificity of reinforcement signals throughout the numan brain. Neuron, 72(1), 166–177. https://doi.org/10.1016/j.neuron.2011.08.011
Walthew, C., & Gilchrist, I. D. (2006). Target location probability effects in visual search: An effect of sequential dependencies. Journal of Experimental Psychology: Human Perception and Performance, 32(5), 1294–1301. https://doi.org/10.1037/0096-1523.32.5.1294
Wang, B. & Theeuwes, J. (2018). How to inhibit a distractor location? Statistical learning versus active, top-down suppression. Attention, Perception, & Psychophysics, 80(4), 860–870. http://doi.org/10.3758/s13414-018-1493-z
Wang, L., Yu, H., & Zhou, X. (2013). Interaction between value and perceptual salience in value-driven attentional capture. Journal of Vision, 13(3), 5–5. https://doi.org/10.1167/13.3.5
Waszak, F., Hommel, B., & Allport, A. (2003). Task-switching and long-term priming: Role of episodic stimulus–task bindings in task-shift costs. Cognitive Psychology, 46(4), 361–413. https://doi.org/10.1016/S0010-0285(02)00520-0
Wentura, D., Müller, P., & Rothermund, K. (2013). Attentional capture by evaluative stimuli: Gain- and loss-connoting colors boost the additional-singleton effect. Psychonomic Bulletin & Review, 21(3), 701–707. https://doi.org/10.3758/s13423-013-0531-z
Williams, M., Moss, S., Bradshaw, J., & Mattingley, J. (2005). Look at me, I’m smiling: Visual search for threatening and nonthreatening facial expressions. Visual Cognition, 12(1), 29–50. https://doi.org/10.1080/13506280444000193
Wolfe, J. M. (1998). What can 1 million trials tell us about visual search? Psychological Science, 9(1), 33–39. https://doi.org/10.1111/1467-9280.00006
Wolfe, J. M. (2012). Saved by a log: how do humans perform hybrid visual and memory search? Psychological Science, 23(7), 698–703. https://doi.org/10.1177/0956797612443968
Wolfe, J. M. (2016). Use-inspired basic research in medical image perception. Cognitive Research: Principles and Implications, 1(1), 17. https://doi.org/10.1186/s41235-016-0019-2

155
Wolfe, J. M., Horowitz, T. S., & Kenner, N. M. (2005). Cognitive psychology: Rare items often missed in visual searches. Nature, 435(7041), 439–440. https://doi.org/10.1038/435439a
Wolfe, J. M., Horowitz, T. S., Van Wert, M. J., Kenner, N. M., Place, S. S., & Kibbi, N. (2007). Low target prevalence is a stubborn source of errors in visual search tasks. Journal of Experimental Psychology. General, 136(4), 623–638. https://doi.org/10.1037/0096-3445.136.4.623
Won, B.-Y., & Leber, A. B. (2016). How do magnitude and frequency of monetary reward guide visual search? Attention, Perception, & Psychophysics, 78(5), 1221–1231. https://doi.org/10.3758/s13414-016-1154-z
Wu, S. C., & Remington, R. W. (2003). Characteristics of covert and overt visual orienting: Evidence from attentional and oculomotor capture. Journal of Experimental Psychology. Human Perception and Performance, 29(5), 1050–1067. https://doi.org/10.1037/0096-1523.29.5.1050
Yantis, S., & Jonides, J. (1990). Abrupt visual onsets and selective attention: Voluntary versus automatic allocation. Journal of Experimental Psychology: Human Perception and Performance, 16(1), 121–134. https://doi.org/10.1037//0096-1523.16.1.121
Yu, R. Q., & Zhao, J. (2015). The persistence of the attentional bias to regularities in a changing environment. Attention, Perception, & Psychophysics, 1–12. https://doi.org/10.3758/s13414-015-0930-5
Zhao, J., Al-Aidroos, N., & Turk-Browne, N. B. (2013). Attention is spontaneously biased toward regularities. Psychological Science, 0956797612460407. https://doi.org/10.1177/0956797612460407
Zhuang, X., & Papathomas, T. V. (2011). Cue relevance effects in conjunctive visual search: cueing for location, color, and orientation. Journal of Vision, 11(7). https://doi.org/10.1167/11.7.6