Shurokkha crowdfunding project on crowd patch garment workers bangladesh

1
Learning from the Crowd: The Feedback Value of Crowdfunding*
Ting Xu†
University of British Columbia
January 2017
Job Market Paper
Abstract
Does crowdfunding bring any value to entrepreneurs beyond extending finance? This paper
shows that a key role of crowdfunding is to provide early feedback to entrepreneurs about the
market demand for their projects. Using a novel dataset from Kickstarter and exploiting
weather-induced variation in funding outcomes within unfunded projects, I show that
entrepreneurs who receive more positive feedback, as proxied by more funding pledged by
the crowd, are more likely to later commercialize their projects. Better feedback also
increases entrepreneurs’ chances of returning to Kickstarter and increasing the scale of their
projects. These effects are stronger when entrepreneurs face higher uncertainty or when the
crowd is more experienced. Consistent with the feedback value of crowdfunding,
entrepreneurs on Kickstarter launch riskier projects to benefit more from feedback when the
opportunity cost of crowdfunding rises. A survey of Kickstarter entrepreneurs corroborates
these results. Overall, this paper highlights the role of crowdfunding in reducing the
uncertainty faced by early-stage entrepreneurs.
Keywords: entrepreneurship, crowdfunding, learning, real option, experimentation
JEL Classification: D83, G20, L26, M1
* I am grateful to my advisors Jan Bena, Thomas Hellmann, and Kai Li for their invaluable guidance. I thank my
discussants Shai Bernstein, Frank Fossen, Will Gornall, David Schoenherr, and Per Strömberg for helpful
comments. I also benefit from feedback from Markus Baldauf, Murray Carlson, David Cimon, Douglas Cumming,
Jack Favilukis, Josh Gottlieb, Dale Griffin, Jennifer Huang, Erica Li, Song Ma, Pedro Matos, Pablo Moran,
Lalitha Naveen, Elena Pikulina, David Robinson, Elena Simintzi, Rick Townsend, John Van Reenen, and seminar
participants at AFA (San Francisco), EFA (Vienna), LBS Trans-Atlantic Doctoral Conference, IZA/Kauffman
Entrepreneurship Workshop, NFA (Lake Louise), FMA Doctoral Consortium (Orlando), CKGSB, and UBC. I
thank Carlos Costa, Walter Haas, and Cung Nguyen for help with the data and the Kickstarter help desk for
clarification of institutional details. Financial support from the Canadian Securities Institute Research
Foundation is gratefully acknowledged. The research was approved by the UBC Behavioural Research Ethics
Board (BREB Number: H16-02695). All errors are my own. † Finance Division, Sauder School of Business, University of British Columbia, 2053 Main Mall, Vancouver, BC,
V6T1Z2, Canada. E-mail: [email protected]. Tel: + 1 (604) 657 3362.

1
1. Introduction
The financing of entrepreneurs has been traditionally dominated by intermediaries such as
banks and venture capital firms. In recent years, this practice has been disrupted by the
participation of the general public (the crowd). Crowdfunding, a new financing method for
entrepreneurs, has grown exponentially in market size and attracted great attention.1 While
many tout its potential to democratize access to finance, others regard it as “dumb money”
that provides no monitoring or other value-adding services to entrepreneurs. 2 Does
crowdfunding bring any value to entrepreneurs beyond extending finance? What role does it
play in the entrepreneurial process?
In this paper, I argue that a key role of crowdfunding is to provide entrepreneurs early
feedback on the market demand for their projects. Being closer to the product market, the
crowd often knows more about the potential of a project than the entrepreneur. Such
information can be conveyed to the entrepreneur through the crowd’s funding decisions.
Compared with intermediaries, the crowd is also more accessible, especially at an early stage
before entrepreneurs exercise key real options such as investment or abandonment.
Crowdfunding outcome can therefore serve as a useful signal that guides entrepreneurs’
decisions. Such early feedback lowers the risk and increases the (real option) value of
entrepreneurial projects. The value of crowdfunding therefore goes beyond financing.
I examine the feedback role of crowdfunding using a novel dataset from the world’s
largest crowdfunding market, Kickstarter. I first study whether and how crowdfunding
feedback, as proxied by the amount of funding committed by the crowd, affects entrepreneurs’
subsequent decisions such as commercialization, continuation, and project scale choice. I then
examine whether the feedback value of crowdfunding is reflected in the type of entrepreneurs
using Kickstarter when crowdfunding cost changes. Lastly, I survey Kickstarter
entrepreneurs to extract evidence on their learning motives for accessing crowdfunding.
Testing whether and how entrepreneurs learn from crowdfunding outcomes faces two
challenges. First, it is difficult to separate feedback from financing. Successful funding may
1 According to Massolution (2015), the global crowdfunding volume grew from $0.5 billion in 2009 to $34.4 billion
in 2015. See Figure 1 for the trend in Google search interest for crowdfunding. 2 See, for example, Forbes, 11/3/2013, “Do you really want dumb money?”; The Economist, 6/16/2012, “The new
thundering herd”; Inc., 11/1/2013, “The dark side of equity crowdfunding”; The Wall Street Journal, 1/31/2013,
“Inventive funding deserves creative regulation”; The Wall Street Journal, 11/6/2015, “The Uberization of money”;
Financial Times, 11/26/2012, “The unexpected cost of success”.

2
prompt an entrepreneur to commercialize her project both because of the positive signal she
receives from being funded and the capital she raised. Second, feedback may correlate with
unobserved entrepreneurial or project qualities that also affect entrepreneurs’ future
decisions. To overcome the first challenge, I exploit variation in funding outcome within
unfunded projects on Kickstarter, all of which received zero financing. Kickstarter funding is
all-or-nothing based: a project is funded only if the total amount pledged by backers (the
crowd) passes the funding target, in which case the entrepreneur gets all pledged money;
otherwise the project is unfunded and the entrepreneur receives no funding. Examining
unfunded projects therefore allows me to focus on variation in feedback (pledged amount)
while shutting down the effect of financing. To overcome the second challenge, I instrument
funding outcomes with local weather shocks happening over projects’ funding windows. Bad
weather conditions increase web traffic (Cardona et al. 2013) and therefore the amount of
online attention received by projects fundraising during that time. Given the importance of
local backers in funding success, such projects ultimately receive more pledges, thereby
generating more positive feedback to the entrepreneurs.3
I document a strong effect of crowdfunding feedback on entrepreneurs’ subsequent
decisions. A 50% increase in pledged amount leads to a 9 percent increase in the probability
of commercialization outside the crowdfunding platform.4 I further find that more positive
feedback increases entrepreneurs’ chances of returning to Kickstarter and launching another
project. Conditional on returning, those who have received better feedback are also more
likely to launch a project similar to their previous projects. I then use the sample of
entrepreneurs who have launched multiple similar projects on Kickstarter to study how they
adjust the scale of their projects (proxied by funding target) in response to crowdfunding
feedback. I find that a 50% increase in the pledged amount received by an earlier project
increases the scale of the next similar project by 6 percent. These feedback effects are
stronger when entrepreneurs face higher uncertainty or when the crowd is perceived to be
more experienced, consistent with the basic features of Bayesian updating.
3 A similar identification strategy is applied in Gilchrist and Sands (2016), who use weather shocks to instrument
moviegoing, another indoor activity. I present evidence on the importance of local backers and the effect of weather
on online activities in Section 3.1.1. 4 I measure commercialization by matching Kickstarter projects to databases of launched products. Specifically,
I match film projects to IMBD, PC game projects to Steam, and book projects to the OpenLibrary Database. See
section 3.1.2 for more details on measurement.

3
If crowdfunding allows entrepreneurs to reduce downside risks by abandoning bad
projects earlier, ex ante, crowdfunding should contain real option value from feedback in
addition to providing finance. To establish the presence of such feedback value, I examine
how shocks to the cost of crowdfunding impact the type of entrepreneurs using Kickstarter.
I show that when the opportunity cost of crowdfunding increases, entrepreneurs with safer
projects, for whom the abandonment option is less valuable, drop out of the platform, while
those with riskier projects stay, because they benefit particularly from feedback and derive
higher real option value. In my sample, the main financing alternative for entrepreneurs is
bank credit. Cheaper bank credit represents higher opportunity cost of crowdfunding. Using
housing price movements and small business loan supply shocks as shocks to the opportunity
cost of crowdfunding, I find that entrepreneurs on Kickstarter shift to riskier types, i.e.,
having more novel and higher fixed-costs projects, when crowdfunding becomes relatively
more costly. These results suggest that the ex-ante feedback value of crowdfunding is an
important consideration when entrepreneurs decide whether to access this type of financing.
I conduct a number of robustness checks. I show that the effects of crowdfunding
feedback on entrepreneurs’ decisions remain similar when using an alternative measure of
feedback—the number of backers that have pledged funding. I also show that these results
are not driven by the reputation effect of funding outcome or entrepreneurs’ learning about
their own abilities. Lastly, I show that my main results are robust on subsamples of more
product-oriented projects.
Finally, I conduct a survey of 262 unfunded Kickstarter entrepreneurs to provide
further evidence on the feedback role of crowdfunding. After failing funding on Kickstarter,
33% of the entrepreneurs continued their projects as planned, 20% scaled down or modified
their projects, and the remainder abandoned their projects. Among those who did not
continue their projects, 57% cite “lack of market interest (i.e., feedback from the crowd not
good enough)” as the reason behind their decisions. I then ask these entrepreneurs what their
decisions would have been had their projects achieved above 90% or below 5% of the funding
target. This allows me to obtain variation in feedback within an entrepreneur-project. Using
entrepreneur-project fixed effects, I find that entrepreneurs are 4 percent more likely to stick
to their projects when the ratio of pledged amount to funding target increases by 10%. Finally,
63.4% of the surveyed entrepreneurs indicate that they chose to crowdfund their projects to
“test the market and obtain feedback,” with a majority believing such feedback cannot be

4
obtained from other financiers such as banks or VC/angel investors.
The main contribution of this paper is to empirically document the feedback role of
crowdfunding in the entrepreneurial entry process. Unlike managers of listed firms who have
access to rich financial market feedback, early-stage entrepreneurs face a much worse
information environment. Significant decisions often have to be made under extreme
uncertainty. This paper suggests that crowdfunding can be a solution to entrepreneurs’
information problem. By democratizing access to early feedback, crowdfunding reduces
entrepreneurs’ uncertainty and improves their decisions. The value of crowdfunding
therefore goes beyond providing finance.
This paper adds to the literature on crowdfunding.5 Most existing studies focus on the
financing role of crowdfunding as well as incentives and mechanisms on funding platforms.
My paper instead examines the informational role of crowdfunding. This paper also builds
on recent studies that document the wisdom of the crowd. Iyer et al. (2015) find that lenders
in debt-based crowdfunding markets predict borrower defaults with higher accuracy than do
borrowers’ exact credit scores (unobserved by the lenders). Mollick and Nanda (2015) find a
high degree of agreement between the crowd’s and the experts’ decisions in funding
Kickstarter arts projects. Mollick (2013) shows that the crowd assess entrepreneurial quality
in similar ways as VCs. On the theory front, Golub and Jackson (2010) show that the crowd’s
opinion will converge to the truth as long as the influence of the most influential agent
vanishes as the network grows. Li (2016), Chemla and Tinn (2016), and Brown and Davies
(2016) examine optimal contracts and platform designs that harness the wisdom of the crowd.
This paper studies whether entrepreneurs take cues from the crowd and adapt their decisions
accordingly.
This paper also contributes to a recent literature that views entrepreneurship as
experimentation. Kerr, Nanda, and Rhodes-Kropf (2014) and Manso (2016) argue that
entrepreneurship is about experimentation and the value of entrepreneurship arises from
5 Agrawal, Catalini, and Goldfarb (2014) study how geographical distance affects investors’ funding patterns;
Zhang and Liu (2012), Mollick (2014), Kuppuswamy and Bayus (2014), and Li and Duan (2014) study funding
dynamics; Ahlers et al. (2013), Marom and Sade (2013), and Bernstein, Korteweg, and Laws (2015) examine the
determinants of funding decisions and outcomes; Li (2015), Morllick and Kuppuswamy (2014), and Mollick (2015,
2016) study project outcomes of after crowdfunding; Bellefalmme, Lambert, and Schwienbacher (2014), Cumming,
Leboeuf, and Schwienbacher (2015), and Wei and Lin (2013) compare funding mechanisms; Hildebrand, Puri, and
Rocholl (2016) examine investor incentives. See Agrawal, Catalini, and Goldfarb (2013) and Morse (2016) for
reviews of the literature.

5
the real options available from experimenting with new ideas. The costs and constraints on
the ability to experiment can therefore impact entry into entrepreneurship (Hombert et al.
2014; Gottlieb, Townsend, and Xu 2016) and financing strategy (Ewens, Nanda, and Rhodes-
Kropf 2015). This paper suggests that, by increasing the feedback value of experimentation,
crowdfunding can encourage entrepreneurship through a channel other than relieving
financing constraints.
Lastly, this paper ties to the literature on the informational role of financial markets
(Bond, Edmans, and Goldstein 2012). Security prices from secondary markets often contain
information unkown to the managers and, through managers’ learning, can guide their real
decisions (Luo 2005; Chen, Goldstein, Jiang 2007; Bakke and Whited 2010; Foucault and
Fresard 2014; Zuo 2016). Relatedly, Allen and Gale (1999) demonstrate that markets are
superior to intermediaries in evaluating projects that are subject to greater disagreement,
such as those involving new technologies. This paper shows that crowdfunding allows
entrepreneurs to learn from the primary financing market. By shifting financing from
intermediaries to markets, crowdfunding can improve the information environment faced by
entrepreneurs.
The paper proceeds as follows. Section 2 introduces crowdfunding and describes
Kickstarter and the data. Section 3 examines whether and how feedback from crowdfunding
outcomes affect entrepreneurs’ subsequent decisions. Section 4 studies the ex-ante feedback
value of crowdfunding. Section 5 reports additional survey evidence. Section 6 provides
further discussions, and section 7 concludes.
2. Platform and Data
2.1. Crowdfunding
Crowdfunding is the practice of openly funding a project or venture by raising monetary
contributions from a large number of people, typically via an online platform. As a new
financial phenomenon, it is reshaping the financing of entrepreneurs and has garnered great
public attention (see Figure 1). The global crowdfunding market has grown tremendously
from $0.5 billion in 2009 to $34.4 billion in 2015, with now around 1250 platforms in more
than 50 countries (Massolution 2015). Regulators around the world have also passed various
6
regulations to assist the growth of crowdfunding. Crowdfunding platforms fall largely into
three categories: debt-based, reward-based, and equity-based. 8F
6 Debt-based crowdfunding,
also known as peer-to-peer lending, is typically used to fund personal expenditures or debt
consolidations, with a small proportion going to small business financing. Reward-based
crowdfunding gives investors in-kind rewards for their funding and involves no financial
securities. Equity-based crowdfunding issues equity shares to investors and is the most
nascent of the three. In U.S., Title III of the JOBS (Jumpstart Our Business Startups) Act
legalized equity crowdfunding involving non-accredited investors in 2012 and was
implemented by the Securities and Exchange Commission in May 2016.
An important distinction of crowdfunding from traditional entrepreneurial finance is
the lack of intermediation. Due to high information asymmetry, the financing of early-stage
ventures is traditionally heavily intermediated. Both banks and venture capitalists rely on
close relationships with entrepreneurs to acquire information and to monitor. In
crowdfunding, platforms mainly provide a market for investors and entrepreneurs to match;
they are not actively involved in the screening, pricing, or monitoring of entrepreneurs’
projects. Information asymmetry in crowdfunding markets is primarily mitigated by the
crowd’s collective information production, while the transparency and reputation
mechanisms help curtail moral hazards. Further, investors are able to achieve substantial
diversification due to small investment thresholds and low transaction costs. These
mechanisms, enabled mainly by internet technologies, sustain the functioning of
crowdfunding markets.
2.2. Kickstarter
Kickstarter is the world’s largest reward-based crowdfunding platform. Founded in
April 2009, it has since grown rapidly (see Figure 2). As of October 2016, Kickstarter is open
to entrepreneurs from 20 countries and backers from 224.7 More than 322,000 projects have
been launched on the platform, receiving $2.7 billion pledged funds from 11 million backers.
Prominent projects funded on Kickstarter include Pebble Watch (a smartwatch), Oculus (a
virtual reality gaming goggle), the film Veronica Mars, and Coolest Cooler (a multi-function
6 Prominent reward-based crowdfunding platforms include Kickstarter (US), Indiegogo (US), and Crowdfunder
(UK); examples of debt-based crowdfunding platforms include LendingClub (US), Prosper (US), and Zopa (UK);
examples of equity-based platforms include Seedrs (UK), Crowdcube (UK), EquityNet (US), EarlyShares (US),
and ASSOB (Australia). 7 Most of the projects come from U.S., with U.K. and Canada coming second and third.

7
cooler).8
On Kickstarter, an entrepreneur posts a project pitch that typically contains
information on product, team, traction, use of funds, relevant risks, and promised rewards
(see Figure 3 for a sample project page). She also sets a funding target and a funding time
window. After the project is launched, backers start to pledge money in return for the promise
of in-kind rewards. Rewards vary across projects, ranging from gifts, early samples, product
parts, to the final product eventually produced by the project. Rewards are also structured
into tiers that correspond to different contributing amounts. Funding follows an all-or-
nothing rule: a project is funded if, by the end of the funding window, the total pledged
amount reaches or exceeds the funding target, in which case the entrepreneur gets all the
pledged money; otherwise the project is unfunded and no money is transferred to the
entrepreneur. Kickstarter takes 5% of the successfully raised funds. The platform does not
engage in screening, pricing, or monitoring of the projects; nor does it guarantee returns or
arbitrate disputes between entrepreneurs and backers.9
The Kickstarter platform features various social components that allow users to
communicate and share information. Backers can post comments on a project’s page and raise
questions in the Q&A section. The entrepreneur is then able to reply to those comments and
questions and post updates. Users can also follow each other on Kickstarter and observe the
backing activities of their friends in social network. Most of these online interactions are
publicly observable and are permanently archived on Kickstarter. These features greatly
facilitate collective information production on the platform.
In reward-based crowdfunding, backers can be considered as a type of trade creditors
to whom an entrepreneur owes a liability in the form of “goods deliverable.” Failure to deliver
the promised rewards is a violation of contract and may be subject to legal actions by backers.
However, backers do not always seek financial returns when making investments. Their
funding decisions are largely driven by personal interests in the proposed project, and they
8 These project achieved great funding success on Kickstarter and subsequently received further financing from
angel or VC investors. In a recent prominent deal, Oculus was acquired by Facebook for $2 billion. 9 Kickstarter does conduct a simple vetting of submitted projects to make sure they are within Kickstarter’s basic
mandates before releasing them for launch. Kickstarter also features some projects on its front page and in the
weekly newsletters sent to subscribers. Although Kickstarter does not guarantee the delivery of the rewards, the
vast majority of projects (91%) do deliver (Mollick 2015).

8
can sometimes be based on non-pecuniary or even altruistic considerations.10
Schoar (2010) highlights the distinction between transformational entrepreneurs and
subsistence entrepreneurs. Transformational entrepreneurs seek to grow their businesses
through professionalization and innovation, while subsistence ones start their businesses as
a means of living with no intention to grow. Entrepreneurs on Kickstarter can be described
as more of transformational entrepreneurs than subsistence ones. First, the demographics of
Kickstarter entrepreneurs suggest that they are not subsistence entrepreneurs. Mollick
(2016) reports that 82% of entrepreneurs on Kickstarter have a college degree. The mean
annual earnings of Kickstarter entrepreneurs before Kickstarter is $48,300, and only 4% of
them are unemployed. Second, Kickstarter places great emphasis on project creativity,
meaning entrepreneurs on the platform do intend to innovate. Indeed, innovativeness is an
important factor in attracting funding on Kickstarter. Thirty percent of funded projects in
technology and product design have filed for patents (Mollick 2016). Third, the fact that
Kickstarter entrepreneurs are willing to seek funding and attention from the public means
that they do intend to grow instead of remaining small and quiet. Mollick (2016) estimates
that, on average, one dollar of funding on Kickstarter translates to $2.46 of revenue outside
of Kickstarter. Nevertheless, most of the entrepreneurs on Kickstarter are still at an early
stage and have yet to achieve the same level of professionalism and success as VC-backed
entrepreneurs. Studying these entrepreneurs is thus important for understanding the role of
crowdfunding at the earliest stage of the entrepreneurial process.
2.3. Data and descriptive statistics
Kickstarter claims no ownership over the projects and the information it produces.
Project pages are permanently archived and accessible to the public. After funding is
completed, projects and uploaded contents cannot be edited or removed from the site. This
allows me to observe all historical information. To construct my dataset, I use web crawling
scripts to scrape information from all project pages, including both funded and unfunded
projects. I also extract entrepreneurs’ biographies, entrepreneurs’ and backers’ locations, and
the project-backer network. The final dataset contains the near universe of projects launched
on Kickstarter from April 2009 to April 2014, with 137,371 project pages, 118,214
10 Though backers’ funding decisions can sometimes be donation-motivated, Kickstarter explicitly requires that
“projects can’t promise to donate funds raised to a charity or cause, and they can’t offer financial incentives like
equity or repayment.”

9
entrepreneurs, 12 million project-backer links, and 3 million posted comments. To the best of
my knowledge, this is the most comprehensive reward-based crowdfunding database
compiled thus far.
Figure 2 plots the growth of Kickstarter over my sample period April 2009 to April
2014. There is a tremendous growth in both the number of projects and the aggregate funding
amount. About 43% of projects are successfully funded and the success rate is fairly stable
over time. Figure 4 shows the geographic distribution of funding demand on Kickstarter
across U.S. Metro/Micropolitan Statistical Areas. Funding demand on Kickstarter is quite
geographically dispersed and is more concentrated in regions with traditionally high
entrepreneurial activities, such as the Bay Area, Seattle, Boston, and New York City.
Table 1 Panel A presents the summary statistics of key variables for all projects,
unfunded projects, and funded projects. The average funding target is $22,669 and the
median is $5,000. The funding target amount is rather skewed with a long tail of projects
with large funding targets. Funded projects have lower funding targets than unfunded ones.
The median pledge ratio (pledged amount divided by funding target) for a funded project is
1.13 and the mean is 3.77, suggesting a small number of projects were extremely successful
and vastly over-subscribed. For unfunded projects, many received little pledging, with a
mean pledge ratio of 0.11 and a median of 0.04. On average, a project attracts around 100
backers. The average pledged amount per backer is $72, and it is slightly higher for funded
projects ($82) than for unfunded projects ($63). The funding window is typically around one
month.
Comparing funded and unfunded projects, we can get a rough idea of what
characteristics are likely associated with funding success. Funded entrepreneurs typically
have a longer project pitch, provide more reward choices, and employ more videos and images
on their project pages. They are also more active online than unfunded entrepreneurs, having
more websites and Facebook friends. In return, funded projects receive more comments from
backers. Further, more experienced entrepreneurs seem to have higher success rates. Overall,
the statistics suggest that having a reasonable funding target, communicating well in the
project pitch, and being active and well-connected online are important factors for funding
success on Kickstarter.
Panel B breaks down the projects by project category. Kickstarter defines 13 project

10
categories based on the nature of the projects. A large proportion of projects are in creative
arts, with another sizable share in product and design, food, fashion, games, technology, and
publishing. Technology projects typically have the largest funding amounts, while dance and
music projects have the smallest. Success rates also differ across project categories. Fashion,
publishing, and technology have the lowest success rates, while dance, theatre, and music
have the highest.
3. Crowdfunding Feedback and Entrepreneurs’ Subsequent Decisions
3.1. Empirical Strategy
3.1.1. Identification
To establish the feedback role of crowdfunding, I first focus on the learning behavior of
entrepreneurs. Specifically, I examine how feedback in the form of crowdfunding outcome
affects entrepreneurs’ follow-on decisions such as commercialization, continuation, and
project scale choice.
Empirically identifying the effect of crowdfunding feedback faces two challenges. First,
unlike feedback from stock prices in the secondary market, feedback from the funding
outcome in the primary financing market is entangled with the monetary effect of the capital
raised. A funded entrepreneur may be more likely to continue with her project than an
unfunded one both because of the positive signal she receives from being funded and the
capital she raised that allows her to continue. Comparing funded and unfunded
entrepreneurs therefore mixes the effects of feedback and financing; so would a comparison
between just funded and over-funded entrepreneurs. To overcome this challenge, I take
advantage of the unique all-or-nothing feature of Kickstarter and exploit variation in
pledging outcome within unfunded projects. For unfunded projects, no money is raised, yet
there is still variation in the amount pledged by backers, which serves as a signal to
entrepreneurs that is uncontaminated by the effect of financing.
Second, feedback can be endogenous. Even within unfunded projects, unobservables
about the project or entrepreneur may correlate with the amount pledged by backers and, at
the same time, affect entrepreneurs’ incentive or ability to continue with their projects,
leading to omitted variable bias. The direction of such bias, however, is ambiguous. Better

11
pledging outcome may correlate with higher unobserved project quality or entrepreneurs’
ability, both of which can positively predict continuation. On the other hand, entrepreneurs
with higher ability likely also have higher outside options and are therefore more likely to
exercise the abandonment option. To solve this omitted variable problem, I need an
instrument that satisfies three conditions: 1) the instrument affects feedback, i.e. the total
amount pledged by backers; 2) the instrument is exogenous to unobservables that may affect
entrepreneurs’ future decisions; 3) the instrument cannot be completely filtered out by
entrepreneurs (imperfect learning). The first and second conditions correspond to the
relevance and exclusion condition of a valid instrument. The third condition ensures that the
instrumented part of feedback, though orthogonal to the quality of the project or the
entrepreneur, will not be completely disregarded by entrepreneurs when updating their
beliefs. In what follows, I first describe the instrument I propose. I then discuss how the
instrument satisfies each of the three conditions for proper identification of the causal effect
of crowdfunding feedback.
On Kickstarter, thousands of projects are live for funding every day. Given people’s
limited attention, the competition for funding is also a competition for online attention. Well-
funded projects typically receive many page visits and are actively shared by backers on social
media. Online traffic is therefore an important factor for crowdfunding success. I propose an
instrument that shocks online traffic to Kickstarter projects exploiting variations in local
weather condition during a project’s funding window. The idea is that worse weather
increases online traffic, which lead to more visits and pledges from local backers. Given the
importance of local backers in a project’s overall funding success, projects launched in worse
weather conditions ultimately have better pledging outcomes, therefore generating more
positive feedback to the entrepreneurs.11
Specifically, my instrument, Cloudcover, is the average deseasoned cloud cover over a
project’s funding window within 100 kilometers of the project. I obtain weather data from the
Integrated Surface Database from the National Oceanic and Atmospheric Administration
(NOAA). The NOAA database contains hourly weather observations from over 35,000
weather stations in the U.S. and abroad. I map weather stations to Kickstarter projects based
on the geographic coordinates of each station and project, and only keep stations within 100
11 In a similar vein, Gilchrist and Sands (2016) use weather shocks to instrument movies’ viewership. Similar to
moviegoing, backing Kickstarter projects online is also an indoor activity.

12
kilometers of each project. The average number of weather stations per project is 18, and the
average distance between stations and a project is 56 kilometers. Cloud cover conditions are
reported hourly on a nine-point scale, ranging from 0 (completely clear) to 8 (completely
overcast). I use the mean score over all reported hours in a day to compute daily cloud cover
at each weather station. I then deseason daily cloud cover at the station level by removing
month-of-the-year means at each weather station. Finally, I average the deseasoned cloud
cover across weather stations and funding window days to arrive at my instrument.
To establish the relevance of the instrument, I first show that local backers are
important. Panel A of Table A1 in Appendix II reports statistics on the percentage of local
backers. For each project with at least one backer, I compute the percentage of backers that
are located in the same city or in the same state as the entrepreneur. I then average this
percentage across projects. I do this for each of the 13 project categories, and for all projects
as well as unfunded projects. On average, about 20% of backers come from the same city as
the entrepreneur, and 30% from the same state. These numbers are higher for projects with
a more local audience, such as those in Theater, Dance, and Food, and are lower for projects
whose demand is more geographically dispersed, such as those in Technology, Games, and
Design. Importantly, these numbers likely underestimate the importance of local backers in
projects’ overall funding success. This is because local backers tend to back early in the
funding window (Agrawal, Catalini, and Goldfarb 2011; Kuppuswamy and Bayus 2014;
Mollick 2014) and can influence the decisions of subsequent backers through a herding or
cascading effect (Herzenstein et. al 2011; Zhang and Liu 2012; Li and Duan 2014). Local
backers are also closer to the entrepreneur in social network (Agrawal, Catalini, and Goldfarb
2011) and, as a result, are pivotal in the dissemination of the project across the network on
social media (Lu et. al 2014).
I then present evidence that worse weather conditions increase Kickstarter backing
through the internet usage channel. Various studies have found that worse weather increases
internet traffic, online sales volume, and social media activities.12 In Panel B of Table A1 in
12 Using traffic data from Internet eXchange Points (IXP) located on 5 continents, Cardona, Stanojevic, and
Cuevas (2013) find that precipitation increases internet traffic demand by up to 6%. Walton (2013) uses online
sales data from major retailers in the greater Seattle area and finds that online sales volume is higher when
weather is cloudier and rainier. Similar findings are obtained by two separate studies by Tradedoubler and
Rakuten, both e-commerce companies. Using Facebook activity data from 1500 German Facebook pages and daily
weather data for the year 2013, a study by Fanpage Karma, a social media analytics company, finds that Facebook
activities is 42% higher when the weather is cloudy or rainy.

13
Appendix II, I use the American Time Use Survey to show that individuals spend more time
on computers for leisure when the weather is cloudier or rainier. I also show that, in my
sample, worse weather conditions over a project’s funding window increase the number of
times the project is shared on Facebook (Panel C of Table A1). I further find that my weather
instrument predicts pledging outcome more strongly when measured over non-working hours
than over working hours (Panel A of Table A2), consistent with leisure time internet usage
being the channel behind my instrument. I also find that the instrument is stronger for more
local projects (Panel B of Table A2), suggesting that the instrument works by affecting
backers’ activities rather than entrepreneurs’ activities. Lastly, consistent with worse
weather inducing more people to get online, I show that the instrument affects pledging
outcome only through the number of backers, while having no effect on the intensive margins
of pledging (Panel C of Table A2) such as pledged amount per backer, number of comments
per backer, or backers’ sentiment (a measure constructed from text-analyzing backers’
comments following the methodology in Tetlock (2007)).
In terms of the exclusion condition, weather during a project’s short funding window
is arguably exogenous to the fundamentals of the project and its long-term outcomes.
Weather is also outside the control of an entrepreneur once her campaign is launched. It
remains possible that an entrepreneur can time the launching of her campaign if weather is
highly predictable. However, I fail to find any evidence of such strategic timing. Panel D of
Table A1 shows that entrepreneurs are not more likely to launch projects on days with worse
weather, nor do they ask for larger amounts of funding. The instrument therefore satisfies
the exclusion condition.
The finding that entrepreneurs do not time their campaigns on weather also lends
support to the third condition that the instrument cannot be completely filtered out by
entrepreneurs in their learning process. If entrepreneurs are fully aware of the effect of
weather, they would avoid launching projects on sunny days; they would also be able to filter
out the part of feedback induced by weather when updating beliefs, thereby not reacting to
my instrument. A further search of the internet also fails to reveal any discussion of weather
as a factor contributing to funding success on Kickstarter. The absence of weather in
entrepreneurs’ information set, together with their bounded rationality, suggests that the

14
third condition is likely satisfied.13
3.1.2. Measurement
I first examine how entrepreneurs’ decisions to commercialize their projects depend
on the feedback they received from crowdfunding. If the amount pledged by backers is a
signal for a project’s potential market size, I should observe that an entrepreneur who
receives more pledges will be more likely to commercialize her project, as such a project is
more likely to have a positive NPV. To measure commercialization, I match three types of
Kickstarter projects to external databases. This allows me to observe the outcome of a project
outside of Kickstarter. Focusing on specific types of projects also allows for a clean definition
of commercialization, which can vary substantially across projects of different types.
Specifically, I match film projects to the International Movie Database (IMDB), PC
game projects to the Steam database, and book projects to the OpenLibrary database. IMDB
is the world’s largest and most comprehensive database for released and upcoming films and
television programs, with a collection of 1.2 million titles. Steam is the largest digital
distribution platform for PC games, with over 125 million registered users and more than
38,000 games. An estimated 75% of games bought online were downloaded through Steam.
OpenLibrary is an online bibliographic database of books maintained by Internet Archive. It
collects book information from the Library of Congress, other libraries, publishers,
Amazon.com, and user contributions, and is one of the largest online databases of books,
boasting 25 million works and 6 million authors. All three databases are current as of
September 2016, allowing for at least 2.5 years to observe the commercialization of
Kickstarter projects. For each type of project, I use both the project name and the name of
the entrepreneur to identify matches in the respective database. Details on the matching
procedure are described in variable definitions in Appendix I. Among unfunded projects, 9.8%
of film projects are matched to IMBD, 5.1% of PC game projects are matched to Steam, and
6.3% of book projects are matched to OpenLibrary.
For a project to be listed in one of these databases, the entrepreneur should have
completed the project and made the commercialization decision, i.e., exercised the
13 Similar test strategies replying on imperfect learning have also been used in Morck, Shleifer, and Vishny (1990)
in search for the impact of investor sentiment on corporate investment and in Dessaint et al. (2015) and Yan
(2016) to examine the learning behavior of peer firms and private firms, respectively.
15
continuation option. However, this does not necessarily mean that the project is successful
or has positive NPV. Because the databases I use are comprehensive for their purposes and
I only measure the presence of projects in these databases, I capture continuation rather than
success. I do not measure projects’ level of success such as box office (for films), downloads
(for games), or sales revenue (for books).
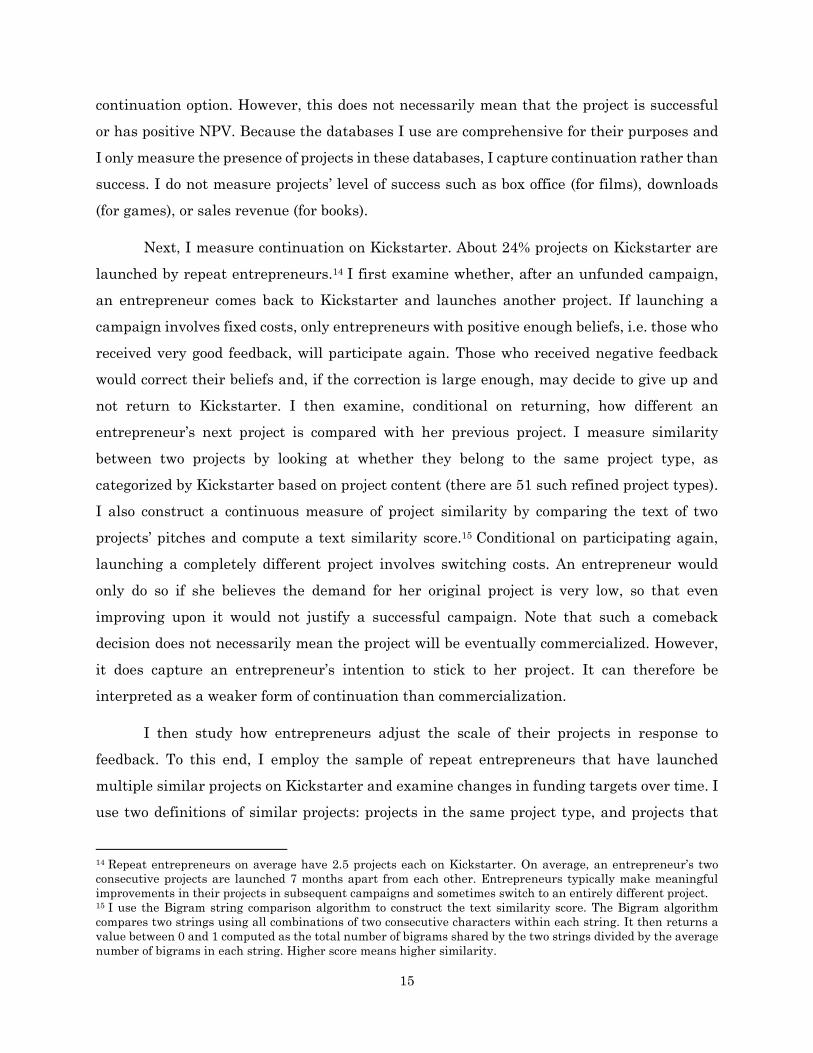
Next, I measure continuation on Kickstarter. About 24% projects on Kickstarter are
launched by repeat entrepreneurs.14 I first examine whether, after an unfunded campaign,
an entrepreneur comes back to Kickstarter and launches another project. If launching a
campaign involves fixed costs, only entrepreneurs with positive enough beliefs, i.e. those who
received very good feedback, will participate again. Those who received negative feedback
would correct their beliefs and, if the correction is large enough, may decide to give up and
not return to Kickstarter. I then examine, conditional on returning, how different an
entrepreneur’s next project is compared with her previous project. I measure similarity
between two projects by looking at whether they belong to the same project type, as
categorized by Kickstarter based on project content (there are 51 such refined project types).
I also construct a continuous measure of project similarity by comparing the text of two
projects’ pitches and compute a text similarity score.15 Conditional on participating again,
launching a completely different project involves switching costs. An entrepreneur would
only do so if she believes the demand for her original project is very low, so that even
improving upon it would not justify a successful campaign. Note that such a comeback
decision does not necessarily mean the project will be eventually commercialized. However,
it does capture an entrepreneur’s intention to stick to her project. It can therefore be
interpreted as a weaker form of continuation than commercialization.
I then study how entrepreneurs adjust the scale of their projects in response to
feedback. To this end, I employ the sample of repeat entrepreneurs that have launched
multiple similar projects on Kickstarter and examine changes in funding targets over time. I
use two definitions of similar projects: projects in the same project type, and projects that
14 Repeat entrepreneurs on average have 2.5 projects each on Kickstarter. On average, an entrepreneur’s two
consecutive projects are launched 7 months apart from each other. Entrepreneurs typically make meaningful
improvements in their projects in subsequent campaigns and sometimes switch to an entirely different project. 15 I use the Bigram string comparison algorithm to construct the text similarity score. The Bigram algorithm
compares two strings using all combinations of two consecutive characters within each string. It then returns a
value between 0 and 1 computed as the total number of bigrams shared by the two strings divided by the average
number of bigrams in each string. Higher score means higher similarity.

16
have a text similarity score above 0.9. The funding target reflects an entrepreneur’s
expectation about the scale of her project, which in turn depends on the expected demand or
market size for the project.16 In my sample, entrepreneurs typically adjust up (down) the
funding target with the next similar project if the current project is funded (unfunded). This
suggests that funding outcome likely provides a signal to entrepreneurs on the appropriate
scale of their projects. Likewise, such adjustments should also happen within unfunded
entrepreneurs—those who received more pledges should reduce their funding targets by less.
Lastly, to provide further evidence on learning, I need cross-sectional variables that
measure uncertainty faced by entrepreneurs as well as the precision of crowdfunding
feedback, both of which should increase entrepreneurs’ sensitivity to feedback. I measure the
novelty of projects to proxy for uncertainty. Project novelty is one minus the cosine score
between the word vector of a project’s pitch and the combined word vector of all projects’
pitches in the same project type. Higher Project novelty means a project is more novel and
innovative relative to the average project of the same type. Entrepreneurs of such a project
therefore face higher uncertainty due to a lack of relevant information out there that informs
potential returns.17 To proxy for the precision of feedback, I measure Backers’ experience by
computing the average number of projects backers have previously backed on the platform.
Backers more experienced in investing on Kickstarter should collectively provide more
reliable feedback. Appendix I provides further details on the construction of these measures.
3.1.3. Specification
I employ the following specification to test the effect of crowdfunding feedback on
entrepreneurs’ subsequent decisions:
Subsequent decision = α + β × ln(pledged amount) + γ × ln(funding target)
+ 𝜑 × project characteristics + 𝛿 × entrepreneur characteristics
16 The all-or-nothing funding rule gives entrepreneurs incentives to estimate the expected market demand for
their projects: a target too high will reduce the chance of raising any money, while a target too low will drive away
backers who fear the risk of entrepreneurs not investing due to undercapitalization (Cumming et al. 2015; Chemla
and Tinn 2016). In addition, backers tend to stop funding a project after it reaches its target (Mollick 2014;
Kuppuswamy and Bayus 2014). This further curtails entrepreneurs’ incentives to strategically lower the target
to achieve funding success. 17 To validate this measure, I sort projects into quintiles based on Project novelty and tabulate the mean and
standard deviation of the logarithmic pledge ratio for each quintile. As shown in Table A7 in Appendix II, funding
outcomes exhibit lower means and higher variations for projects with higher Project novelty. This is consistent
with risk-averse backers being more cautious and disagreeing more when funding projects with higher
uncertainty.

17
+ project type FE + year-quarter FE + MSA FE + ε. (1)
The dependent variable Subsequent decision is one of the outcome variables described in the
previous section. The key independent variable is ln(pledged amount) , which measures
crowdfunding feedback received by unfunded entrepreneurs. For robustness, I also use
ln(number of backers) as an alternative measure of feedback. Both feedback measures are
instrumented with Cloudcover in a 2SLS specification. I always control for the
ln(funding target) of a project to condition feedback on the asked amount.18 Note that the
coefficient on ln(pledged amount), β, would be equal to the coefficient on the logarithmic
pledge ratio ln(pledged amount/funding target). 19 I also control for other project
characteristics such as funding window length (in days), has website dummy, number of
reward tiers, average reward price, project pitch length, number of images, and number of
videos, and entrepreneur characteristics such as the number of Facebook friends, length of
entrepreneur’s biography, and entrepreneur’s experience index (detailed definitions of these
variables in Appendix I). In addition, I include project type fixed effects to account for
heterogeneities across projects of different nature. I also include fixed effects for the year-
quarter in which a project is launched to account for unobserved trends as well as the time
gap between a campaign and the point I measure continuation. Lastly, I control for MSA
fixed effects to absorb unobserved regional economic conditions.20
3.2. Main Results
Table 2 presents the effect of crowdfunding feedback on entrepreneurs’ continuation
decisions. Panel A focuses on commercialization outside Kickstarter for three types of projects.
The samples include unfunded projects by non-repeat entrepreneurs. Columns 1 to 6 present
the OLS and IV results for film, PC game, and book projects separately. Columns 7 and 8
combine the three samples. Across all columns, ln(pledged amount) has a significantly
positive effect on the probability of commercialization. The effect is also economically
significant. Combining all three types of projects, column 8 implies that a 50 percent increase
18 I add one dollar to all pledged amounts to account for zero pledging. For projects raising funds in other
currencies, I convert both the pledged amount and target amount to U.S. dollar based on exchange rates at the
end of projects’ funding windows. 19 The empirical distribution of the pledge ratio is rather skewed with both unfunded and funded projects. Many
unfunded projects received very little pledging and only a few funded projects are vastly oversubscribed. 20 MSA here includes both Metropolitan and Micropolitan Statistical Areas. For the very few projects that are in
rural areas, I assign them to the nearest MSAs. For projects outside of U.S., I define MSA simply by city.
18
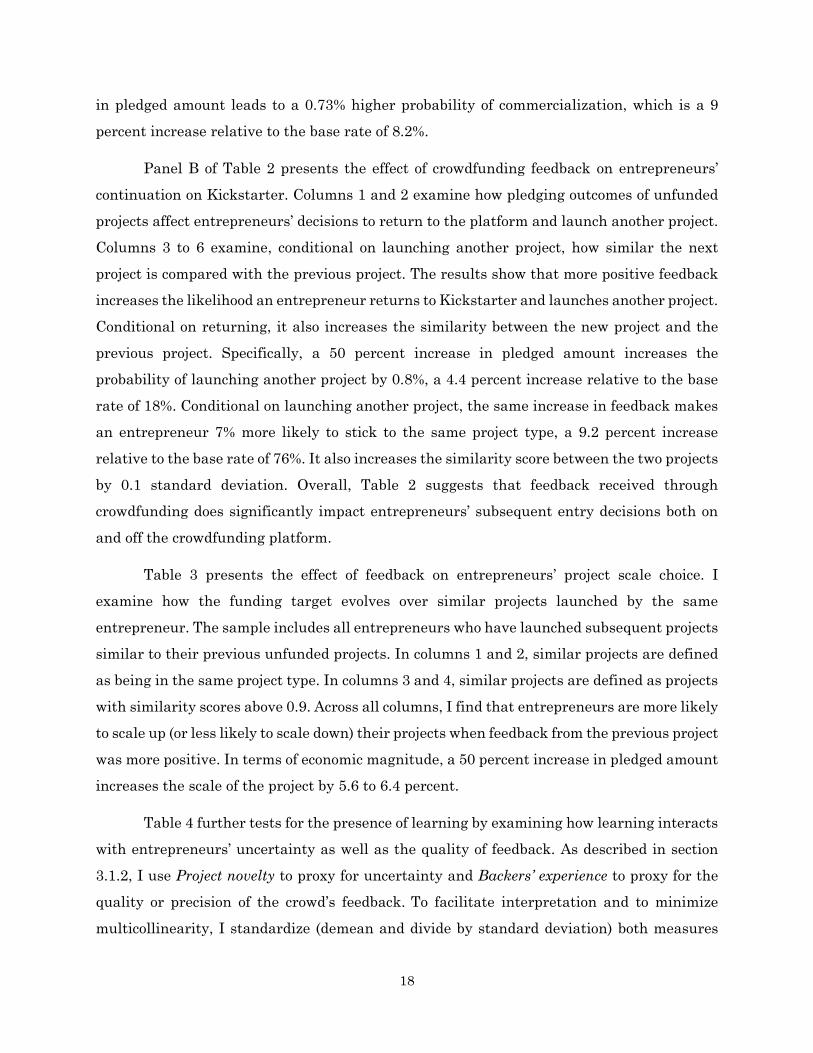
in pledged amount leads to a 0.73% higher probability of commercialization, which is a 9
percent increase relative to the base rate of 8.2%.
Panel B of Table 2 presents the effect of crowdfunding feedback on entrepreneurs’
continuation on Kickstarter. Columns 1 and 2 examine how pledging outcomes of unfunded
projects affect entrepreneurs’ decisions to return to the platform and launch another project.
Columns 3 to 6 examine, conditional on launching another project, how similar the next
project is compared with the previous project. The results show that more positive feedback
increases the likelihood an entrepreneur returns to Kickstarter and launches another project.
Conditional on returning, it also increases the similarity between the new project and the
previous project. Specifically, a 50 percent increase in pledged amount increases the
probability of launching another project by 0.8%, a 4.4 percent increase relative to the base
rate of 18%. Conditional on launching another project, the same increase in feedback makes
an entrepreneur 7% more likely to stick to the same project type, a 9.2 percent increase
relative to the base rate of 76%. It also increases the similarity score between the two projects
by 0.1 standard deviation. Overall, Table 2 suggests that feedback received through
crowdfunding does significantly impact entrepreneurs’ subsequent entry decisions both on
and off the crowdfunding platform.
Table 3 presents the effect of feedback on entrepreneurs’ project scale choice. I
examine how the funding target evolves over similar projects launched by the same
entrepreneur. The sample includes all entrepreneurs who have launched subsequent projects
similar to their previous unfunded projects. In columns 1 and 2, similar projects are defined
as being in the same project type. In columns 3 and 4, similar projects are defined as projects
with similarity scores above 0.9. Across all columns, I find that entrepreneurs are more likely
to scale up (or less likely to scale down) their projects when feedback from the previous project
was more positive. In terms of economic magnitude, a 50 percent increase in pledged amount
increases the scale of the project by 5.6 to 6.4 percent.
Table 4 further tests for the presence of learning by examining how learning interacts
with entrepreneurs’ uncertainty as well as the quality of feedback. As described in section
3.1.2, I use Project novelty to proxy for uncertainty and Backers’ experience to proxy for the
quality or precision of the crowd’s feedback. To facilitate interpretation and to minimize
multicollinearity, I standardize (demean and divide by standard deviation) both measures

19
before interacting them with feedback. Table 4 shows that, across all decision variables,
entrepreneurs react more strongly to feedback when the project is more uncertain (Panel A),
and when the crowd is perceived to be more experienced (Panel B). In terms of magnitude, a
one-standard-deviation increase in project novelty increases entrepreneurs’ sensitivity to
feedback by 10 to 42 percent; a one-standard-deviation increase in backers’ experience
increases entrepreneurs’ sensitivity to feedback by 14 to 27 percent. These results are
consistent with basic rational updating in learning.
In Panel C of Table 4, I further examine how learning differs across entrepreneurs of
different genders. Female is a dummy variable indicating that an entrepreneur is female.21
The sample is conditioned on individual entrepreneurs that are not registered as firms on
Kickstarter. I find that, compared with male entrepreneurs, female entrepreneurs are more
responsive to crowdfunding feedback across all decision variables. This is consistent with a
large prior literature documenting that men are more overconfident than women—they tend
to overestimate the precision of their information, especially in tasks perceived to be
masculine or risky (Lundeberg, Fox and Puncochar (1994), Barber and Odean (2001)). In
activities such as entrepreneurship, men may therefore overweight the importance of their
priors and be less responsive to feedback than female entrepreneurs. Combining all cross-
sectional results, Table 4 suggests that entrepreneurs’ learning is indeed the driving
mechanism behind the results in Tables 2 and 3.
Overall, based on results from Tables 2 to 4, I conclude that crowdfunding outcome
does provide feedback to entrepreneurs about their projects and such feedback has real effects
on entrepreneurs’ subsequent decisions.
3.3. Robustness and Additional Analyses
3.3.1. Robustness
Recall in section 3.3.1 that my instrument affects the total pledged amount mainly
through the number of backers rather than the amount pledged per backer. In Panel A of
Table 5, I show that my results are robust to using ln(number of backers) an alternative
21 Following Greenberg and Mollick (2016), I algorithmically identify the gender of entrepreneurs by their first
names using the genderize.io name database. The database contains 208,631 first names from 79 countries and
89 languages. For each name, the database assigns a probability that a specific name-gender attribution is correct
in the population of a country. An entrepreneur is identified to be of a specific gender if the associated probability
exceeds 70%. In 94.6% of the matched cases, the probability exceeded 95%, suggesting a high degree of accuracy.

20
measure of feedback. A 50% increase in the number of backers increases the probability of
commercialization by 1.5 percentage points, the probability of launching another project by
1.7 percentage points, the similarity between two consecutive projects by 0.14 standard
deviation, and the scale of the next similar project by 8.5 percent.
I also show that my results are robust to using a subsample of projects in more
product-oriented sectors, i.e., those in “Product and design”, “Fashion and apparel”, “Food
and restaurant”, “Games”, “Publishing”, and “Technology”. These projects more closely
resemble the type of projects traditionally pursued by entrepreneurs or self-employed
individuals. Table A3 reports the subsample analyses. The results remain similar.
3.3.2. Alternative explanations
Although my findings are most consistent with entrepreneurs learning about the
market demand for their projects, it is also possible that entrepreneurs learn about their own
abilities through crowdfunding. To shed light on whether this type of learning drives my
results, I first conduct a placebo test relating an entrepreneur’s decision about her current
project to the feedback she received from an earlier unrelated project, i.e., a project in a
different project type. In Panel B of Table 5, I fail to find any relation between an
entrepreneur’s entry or project scale decisions and the feedback she received on her previous
non-related project. This suggests that learning about one’s general ability as an
entrepreneur does not drive my results, as such information should affect all of an
entrepreneur’s subsequent projects. To gauge whether learning about one’s project-specific
ability drives my results, I interact my baseline results with a variable Jockey that measures
the extent to which a project features the entrepreneur (Marom and Sade 2013).22 If learning
is primarily about project-specific ability, belief updates should be stronger for projects that
rely more on the human capital of the entrepreneur. Panel C of Table 5 shows that the Jockey
measure does not interact significantly with feedback, suggesting that learning about project-
specific ability is not dominant in my sample. Overall, these results are most consistent with
entrepreneurs learning from the crowd about market demand for their projects.
22 See Appendix I for detailed definition of this variable. The variable name Jockey comes from Kaplan, Sensoy,
and Stromberg (2009), where they compare the idea to “the horse” and the entrepreneur to “the jockey”. I validate
this measure in Panel B of Table A7 in Appendix II by sorting project categories by Jockey. Consistent with
intuition, projects in “Music”, “Dance”, and “Theater” have the highest values in Jockey, whereas projects in
“Games”, “Technology”, and “Product and design” have the lowest values.

21
Another possible explanation of my results is the reputation effect. Although failing
funding on Kickstarter is generally a negative reputation event, among unfunded
entrepreneurs, those who received more pledges still have relatively better reputations,
which make it easier for them to obtain funding from other financiers or resources from
suppliers, thereby allowing them to continue. This explanation unlikely holds for several
reasons. First and foremost, Kickstarter makes an intentional effort to hide the pages of
unfunded projects from the public to protect the reputation of unfunded entrepreneurs.
Failed Kickstarter campaign pages include meta tags to keep search engines from indexing
them. In addition, Kickstarter’s front page and the “Discover” interface do not show failed
projects.23 Second, it is not obvious under the reputation effect why my results are stronger
when entrepreneurs face higher uncertainty, when backers are more experienced, and among
female entrepreneurs. Lastly, if reputation is the driving force, my results should be weaker
for projects launched by established firms, who arguably face fewer reputation concerns. This
is because established firms already have a reputation out there compared with individual
entrepreneurs. They also have more internal resources and face fewer constraints from
financiers and suppliers if they want to continue a project. However, in Table A4 in Appendix
II, I fail to find such evidence: if anything, the effect of feedback on future decisions is stronger
among corporate entrepreneurs.
4. The Ex-ante Feedback Value of Crowdfunding
If early feedback helps entrepreneurs abandon bad projects before entering the product
market, ex ante, crowdfunding should contain option value from feedback in addition to
financing value. 24 In this section, I establish the presence of such feedback value in a
framework where entrepreneurs choose between crowdfunding and alternative financing.
4.1. Why crowdfunding has an advantage in providing feedback
I argue that crowdfunding provides better and earlier feedback to entrepreneurs than
23 See Kickstarter’s FAQ section (https://www.kickstarter.com/help/faq/creator+questions#faq_41810);
“Kickstarter hides failure” by Dan Misener, Misener.org, 2012; “Failure Is Not An Option: Why Kickstarter
Hides Failed Projects“, by John Biggs, TechCrunch, 2012. 24 Hereafter, I use “feedback value” to mean the option value from feedback, i.e., the value from the option to
abandon bad projects upon receiving negative feedback.

22
alternative financiers.
First, crowdfunding leverages the wisdom of the crowd and features low information
production costs. Relying on internet technology, crowdfunding platforms present minimal
participation costs for the crowd, each bringing his or her own piece of information. Through
online social interactions, different pieces of information can be quickly updated, aggregated,
and disseminated. These interactions also facilitate the production of soft information critical
to early-stage financing (Iyer et al. 2015; Lin, Prabhala, and Viswanathan 2013; Morse 2015).
Disintermediated markets therefore provide rich feedback to entrepreneurs by capitalizing
on the collective information production of the crowd (Wolfers and Zitzewitz 2004; Golub and
Jackson 2010; Mollick and Nanda 2015). In reward-based crowdfunding, such feedback is
especially helpful, as backers are also potential consumers who can provide unique product
market information unavailable from other traditional financiers.
Feedback from crowdfunding also comes at an earlier stage than that from traditional
financiers. The removal of fixed intermediation costs lowers optimal transaction size, so that
smaller investments can be financed with crowdfunding than is possible with
intermediaries.19F
25 At the same time, online investing enables investors to diversify across a
large number of projects, achieving substantial risk-sharing. It is the smaller and riskier
nature of crowdfunding that makes it accessible to entrepreneurs at a much earlier stage
than traditional financing sources.26 As such, feedback from crowdfunding is more likely to
arrive before entrepreneurs’ key decisions such as investment or abandonment, thereby
commanding extra real option value.
On the other hand, although VCs (and perhaps angels) have advantages in mentoring
and monitoring, they are inaccessible to most entrepreneurs, especially at a very early stage.
In the U.S., less than 0.5% of newly created firms have raised capital from VCs, and less than
5% have raised capital from angel investors.27 Bank credit is the dominant external financing
source for entrepreneurs (Robb and Robinson 2014; Cosh, Cumming, Hughes 2009). Banks,
25 The average fundraising size on Kickstarter is about $23,000. The U.S. Small Business Administration reports
an average small business loan amount is around $330,000. Data from CrunchBase shows that the median angel
investment amount is $450,000 while the median venture capital round is $4.5 million. 26 On Kickstarter, more than 80% of the entrepreneurs are not yet incorporated. Among incorporated ventures,
the median age is 1.5 years old. According to CrunchBase, the average age of firms receiving angel financing is 2
years old and the average age of firms receiving venture capital funding is 4.5 years old. 27 Based on data from U.S. Census, Small Business Administration, PWC Money Tree, and CVR Angel Report.

23
however, provide relatively poor feedback on entrepreneurs’ projects. They are not specialized
in evaluating risky startups. Most of the lendings to entrepreneurs are either in personal
loans or in business loans heavily collateralized or guaranteed by personal assets (Avery,
Bostic, and Samolyk 1998; Robb and Robinson 2014; Meisenzahl 2014).28 These lending
decisions are therefore largely based on entrepreneurs’ personal credit conditions, such as
credit score or the availability of collateral, rather than the product market potential of the
projects. Further, in banks, lending decisions are typically delegated to a loan officer, while
crowdfunding market engages many investors with diverse opinions. Markets are therefore
more suitable than banks to finance and provide feedback to innovative projects that are
subject to greater disagreement (Allen and Gale 1999).
4.2. Empirical Strategy
The ideal setting to test whether crowdfunding contains extra feedback value is to
directly compare crowdfunding and traditional financing methods. However, there is no
exogenous expansion of crowdfunding that allows for such a comparison. I overcome this by
instead exploiting shocks to entrepreneurs’ selection into crowdfunding. Specifically, I
examine how the composition of entrepreneurs on crowdfunding platform changes when the
opportunity cost of crowdfunding changes. I employ a setting where entrepreneurs choose
between crowdfunding and bank borrowing, the main financing alternative for early-stage
entrepreneurs. When local credit becomes cheaper, the opportunity cost of crowdfunding
increases. If crowdfunding provides extra feedback value, then entrepreneurs who do not
benefit particularly from feedback will drop out from the platform and switch to bank credit,
while those deriving high option value from feedback, i.e., those facing high uncertainty, will
stay on the platform. I should therefore observe entrepreneurs on Kickstarter shift to riskier
types when local borrowing costs decrease. In other words, cheaper local credit attracts away
entrepreneurs who crowdfund mainly for money and reveal those who crowdfund for feedback.
I formalize this intuition in Appendix III in a simple theoretical framework featuring
learning and real options.
It is worth noting that this empirical strategy does not require every entrepreneur to
28 Early-stage entrepreneurs who haven’t registered their businesses can only borrow through personal loans. For
sole proprietorships or partnerships, unlimited liability blurs the difference between business and personal loans.
For corporations, small business lenders typically require personal guarantees or personal collaterals, effectively
circumventing entrepreneurs’ limited liability (Avery, Bostic, and Samolyk 1998; Mann 1998; Moon 2009).

24
respond to cheaper local credit. For example, wealthy individuals or those severely priced out
by the banks may not experience any change in access to credit when local borrowing costs
decrease. As long as some individuals react to lower borrowing costs and switch from
crowdfunding to banks, I should observe a change in the average option value from feedback
derived by the remaining entrepreneurs.
4.2.1. Empirical proxies for shocks to local borrowing costs
My first measure of shocks to local borrowing costs is instrumented MSA-level
housing price movements. Robb and Robinson (2014) document that entrepreneurs rely
predominantly on collateralised personal debt to finance their new ventures. Meisenzahl
(2014) documents the pervasiveness of private residence as entrepreneurial collateral.
Consistent with this evidence, Adelino, Schoar, and Severino (2014) and Schmalz, Sraer, and
Thesmar (2015) find that local housing price appreciation leads to more entrepreneurial
entry through relieving collateral constraints. A positive local housing price shock should
therefore lower the costs of bank borrowing.29 At the same time, it should not affect the
financing cost on Kickstarter as crowdfunding requires no collateral. This makes
crowdfunding relatively more costly. In a “difference-in-differences” setting, I can therefore
compare two regions—one with housing price increases and one without—and look at the
differential changes in the composition of entrepreneurs entering Kickstarter. The region
that experienced greater housing price appreciation should produce crowdfunding
entrepreneurs who face higher uncertainty and have projects with higher fixed costs.
One potential concern is that the effect of housing prices on the composition of
entrepreneurs on Kickstarter may be driven by shifts in local demands. For example, local
housing price appreciations may increase the wealth of local consumers and hence their
demand for products produced by Kickstarter entrepreneurs. To address this, I compare
entrepreneurs who are likely renters with those who are likely homeowners. I do not observe
the exact homeownership status of the entrepreneurs in my sample. However, their
geographic coordinates allow me to proxy for their likelihood of homeownership with the
average homeownership rates in the zipcodes they live in. Because renters and homeowners
in the same region face the same local shocks, such a comparison differences out unobserved
29 Constrained borrowers face an infinitely high borrowing cost at the desired borrowing amount. The relief of
collateral constraint is therefore equivalent to a reduction in borrowing costs at each borrowing amount, i.e., a
downward shift in the supply curve.

25
local demand shifts. I also show that my results are robust to excluding projects that may
face predominantly local demands. A second concern is that higher housing prices may relieve
entrepreneurs’ financial constraints through a wealth effect in addition to the collateral
channel (Jensen, Leth-Peterson, and Nanda 2014; Kerr, Kerr, and Nanda 2014). Although
my identification uses collateralised bank debt as a financing alternative to crowdfunding, it
can be easily extended to include both bank credit and personal wealth as financing
alternatives. In this case, both the wealth effect and the collateral effect imply a higher
opportunity cost of crowdfunding when local housing prices increase. As a result, my
empirical strategy and its interpretation remain unaffected. Finally, it is possible that my
results can be explained by changing risk-aversion if higher housing prices make
entrepreneurs wealthier and less risk-averse. However, existing literature fails to find a
significant effect of wealth changes on changes in risk aversion or risk taking (Brunnermeier
and Nagel 2008). Schmalz, Sraer, and Thesmar (2015) show that firms started by wealthier
homeowners are not riskier than those started by poorer individuals. They also find that
housing price appreciation increases entrepreneurship only for full homeowners and not for
partial homeowners though both experience the same wealth shocks, suggesting access to
more valuable collateral itself does not increase risk-taking.
I also employ a second shifter of local borrowing costs that captures the supply shocks
to local small business lendings. To this end, I turn to the small business loan data banks
report under the Community Reinvestment Act (CRA). The granularity of the bank-county
level data enables me to decompose local lending growth into bank-level supply shocks and
county-level demand shocks. The decomposition method follows Amiti and Weinstein (2013),
Flannery and Lin (2015), and Greenstone, Mas, and Nguyen (2015), which is an improved
variation of the fixed effect estimator used in studies such as Khwaja and Mian (2008),
Jiménez et al. (2012), and Schnabl (2012) to control for credit demand.30 I construct county-
level lending supply shocks as weighted averages of bank-level shocks based on banks’
lending shares in each county. The estimation procedure is elaborated in Appendix IV.
Because this measure reflects local supply shocks that originate from the bank level, it is
uncorrelated with local economic conditions.
30 This approach imposes additional adding-up constraints on the estimation of bank supply shocks. In particular,
a county cannot borrow more without at least one bank lending more, and a bank cannot lend more without at
least one county borrowing more. Amiti and Weinstein (2013) show that ignoring these adding-up constraints
could produce estimates of bank lending growth that are widely different from the actual growth rates.

26
4.3. Results
I first validate the assumption that crowdfunding and bank credit are indeed
substitutes in financing Kickstarter projects. I examine how funding demand on Kickstarter
changes in response to shocks to local housing prices or small business loan supply. If bank
credit is a viable alternative to crowdfunding, a decrease in local borrowing cost should
trigger an outflow of entrepreneurs from Kickstarter to banks, generating a decrease in
demand on Kickstarter. Table 6 confirms this. In Panel A, the dependent variable MSA-level
demand for finance on KS is the logarithm of quarterly aggregate funding target amount on
Kickstarter at the Metro/Micropolitan Statistical Area (MSA) level.28F
31 The independent
variable Local housing price index is the quarterly MSA-level Housing Price Index (HPI) from
the Federal Housing Financing Agency (FHFA). I follow Cvijanovic (2014) and instrument
HPI with the interaction of MSA-level land supply elasticity (Saiz 2010) and national real
estate prices (the S&P/Case-Shiller Home Price Index). 29F The sample is at the MSA-quarter
level covering 287 MSAs and from April 2009 to March 2014. In Panel B, the dependent
variable County-level demand for finance on KS is the logarithm of quarterly aggregate
funding target amount on Kickstarter at the county level. The independent variable Local
SBL supply shock is the county-year level weighted average shocks to banks’ small business
loan supply. The sample covers 2,144 counties from April 2009 to March 2014. In both panels,
I also control for local unemployment rate, population, and income per capita.
I find a significantly negative relationship between access to local credit and demand
for funding on Kickstarter. A one-standard-deviation increase in Local housing price index
(Local SBL supply shock) reduces demand on Kickstarter by 11% to 22% (4% to 11%) from its
mean. This suggests that bank credit and crowdfunding can indeed be substitutes in
financing crowdfunding projects. Cheaper access to local credit therefore increases the
relative cost of doing crowdfunding.
I then test how the relative cost of crowdfunding affects the option value and therefore
the uncertainty and fixed costs faced by entrepreneurs choosing crowdfunding. I apply two
proxies for uncertainty. The first measure is Project novelty used in Section 3. The second
31 I use the crosswalk files from the U.S. Department of Housing and Urban Development (HUD) to map zipcodes
to CBSA (Core Based Statistical Area) codes, which is the collective of all Metropolitan Statistical Areas
and Micropolitan Statistical Areas. I also use the same files to map zipcodes to FIPS (Federal Information
Processing Standard) county codes.
27
measure, Experience index, is constructed from text-analysing entrepreneurs’ biographies
and measures the amount of professional or entrepreneurial experience an entrepreneur has.
Holding the project constant, less experienced entrepreneurs should face higher subjective
uncertainty. These two measures therefore complement each other by capturing uncertainty
from the project side and the entrepreneur side respectively. The option value from learning
should be higher for projects with higher Project novelty or for entrepreneurs with lower
Experience index.32 To measure fixed costs involved in a project, I follow Cumming et al. (2015)
and construct a variable Fixed costs by counting the mentioning of fixed-costs-related words
in the project’s project pitch. A higher value of means a project is likely associated with
higher operating leverage and therefore derives higher option value from early feedback.
Detailed definitions of these variables are in Appendix I.
Table 7 presents the main results. I find that when local borrowing cost drops, as
proxied by higher local housing prices (Panel A) and positive small business loan supply
shocks (Panel C), entrepreneurs entering Kickstarter tend to be less experienced, choose
riskier projects and projects involving higher fixed costs. This is consistent with the
prediction that higher relative cost of crowdfunding drives up the average option value
derived by entrepreneurs choosing crowdfunding if and only if crowdfunding provides more
precise feedback than banks.
To ensure that the relation between housing prices and entrepreneurial activities on
Kickstarter is not driven by local demands, in Panel B of Table 7, I interact Local housing
price index with High homeownership, a dummy variable indicating an entrepreneur’s
zipcode has above median homeownership rate. The main results in Panel A are significantly
stronger for entrepreneurs who are likely homeowners than those who are likely renters.
In summary, the results are consistent with crowdfunding giving entrepreneurs
additional option value from feedback compared with alternative financing.
4.4. Robustness and Alternative Explanation
32 To further validate these measures, I sort projects into quintiles based on Project novelty and Experience index
and tabulate the mean and standard deviation of the logarithmic pledge ratio for each quintile. As shown in Table
A7 in Appendix II, funding outcomes exhibit lower means and higher variations for projects with higher Project
novelty and lower Experience index. This is consistent with risk-averse backers being more cautious and
disagreeing more when funding projects with higher uncertainty.

28
To further ensure that my local credit shocks are not driven by changing local
economic conditions, in Panel A of Table A5 in Appendix II, I drop projects in “Food and
restaurant”, “Fashion and apparel”, “Dance”, and “Theatre”, which may face predominantly
local demands. I show that my results continue to hold. In Panel B of Table A5, I also show
that my results also hold on projects in more product-oriented sectors, i.e., those in “Product
and design”, “Fashion and apparel”, “Food and restaurant”, “Games”, “Publishing”, and
“Technology”.
One potential alternative explanation for my results is credit rationing. When local
credit becomes cheaper, entrepreneurs who still choose crowdfunding may be those priced
out by banks instead of those who benefit particularly from learning. If priced-out
entrepreneurs also tend to have riskier projects, then credit rationing alone may explain my
results without the presence of learning.
I argue that the credit rationing story unlikely explains my results. Cheaper local
credit leaves behind not only priced-out entrepreneurs on Kickstarter, but also entrepreneurs
who are financial unconstrained, e.g., wealthy individuals. Therefore, from a theoretical
perspective, it is unclear that entrepreneurs on Kickstarter will on average become more
constrained and therefore riskier as local borrowing costs decrease.
I also empirically test for this. I proxy for an entrepreneur’s propensity to be credit-
constrained by estimating zipcode-level credit constrained probability. Following Jappelli
(1990) and Morse (2011), I use the Survey of Consumer Finances (SCF) to estimate the
probability that an individual is credit constrained as a function of her socioeconomic
characteristics. I then project the relationship onto zipcodes by applying the SCF coefficients
to Census socioeconomic variables observed at the zipcode level. Panel A of Table A6 presents
the models estimated from SCF 2010 and 2013 data. I use three proxies for credit constraint
from SCF: Denied credit, At credit limit, and Behind on payment. I estimate the three models
separately and then project them to annual Census data at the zipcode level (available from
American Community Survey). I standardise each of the three estimated probabilities and
take their average to arrive at my Credit constrained likelihood measure. Panel B of Table
A6 shows that, contrary to the prediction of the credit rationing story, the average likelihood
of Kickstarter entrepreneurs being credit constrained does not vary significantly with local
credit conditions. I therefore conclude that credit rationing does not drive my findings in

29
section 4.3.
5. Survey Evidence
In the last part of the paper, I conduct a survey of Kickstarter entrepreneurs to obtain direct
evidence on learning from entrepreneurs themselves. The survey complements my previous
analyses and provides new information on the feedback role of crowdfunding.
I construct my survey sample by applying the following steps. First, I focus on
unfunded Kickstarter projects launched by non-repeat entrepreneurs. Second, I include all
entrepreneurs for which I can directly obtain their email addresses or LinkedIn pages from
their project pitches or biographies. Third, I randomly select a subsample of projects from
“Technology”, “Design”, “Games”, and “Fashion” and hand collect the LinkedIn pages of these
entrepreneurs.33 I focus on projects in these four categories because their entrepreneurs are
more likely to have a public profile for me to locate their LinkedIn pages. Fourth, I use
RocketReach to pull out entrepreneurs’ emails from their LinkedIn links. Lastly, I use the
contact verification function from SurveyMonkey to remove bounced emails and emails that
have opted out of SurveyMonkey. I obtained 3,936 emails for 2,677 entrepreneurs.
I administer the survey via SurveyMonkey, a large online survey company. Surveys
are sent out in five waves from August 2016 to September 2016. I follow up each wave with
two rounds of reminders one week and two weeks after the original email. In the end, I
obtained 262 responses, out of which 258 are complete. The 9.6% response rate is in line with
most survey studies such as Graham and Harvey (2001), Gompers, Kaplan, and
Mukharlyamov (2016), Gompers et al. (2016), and Mollick (2014).
The survey contains six questions and respondents on average take 1.5 minutes to
complete it. I first ask entrepreneurs about their continuation decisions after the project was
unfunded on Kickstarter. I then ask them about the reason for their decision. I also elicit
their counterfactual decisions in hypothetical scenarios where their projects achieved a very
high or very low pledging outcome. This allows me to obtain variation in feedback within an
33 I use the following information to locate and verify an entrepreneur’s LinkedIn page: entrepreneur’s name,
location, education history, employment history, and picture. These information are usually obtainable from
entrepreneurs’ Kickstarter profile, Facebook page, Twitter page, Crunchbase page, firm website, or personal
website.

30
entrepreneur-project pair. Lastly, I ask them about their general motives for accessing
crowdfunding and whether they think feedback from crowdfunding can be obtained from
other financiers.
Panel A of Table 8 presents the summary statistics for the survey sample. Compared
with all contacted entrepreneurs and the universe of unfunded non-repeat entrepreneurs,
entrepreneurs who responded to my survey are on average more experienced, have larger
projects, and received more pledges. Their projects also tend to have more reward tiers,
higher reward price, longer project pitches, and more images and videos. Entrepreneurs in
my survey sample are therefore of higher quality than the average unfunded entrepreneur.
Panel B of Table 8 reports the survey results. After failing funding on Kickstarter, 33%
of the entrepreneurs continued with their projects as planned, 20% scaled down or
substantially modified their projects, and 47% abandoned their projects. In Panel A of Table
9, I link entrepreneurs’ responses to the pledging outcomes they received on Kickstarter. I
find that, consistent with the main findings in Section 3, entrepreneurs who received better
feedback from crowdfunding are more likely to continue with their projects, and are less likely
to modify or scale down their project or giving up their projects. Such results hold both in an
OLS specification and a multinomial logit specification.
Among the entrepreneurs who did not continue their project, 79% cite “insufficient
funding” as the reason, 57% cite “lack of market interest (i.e. feedback from the crowd not
good enough)”, while 4.6% cite “other reasons”. This suggests that feedback from
crowdfunding plays an important role in affecting entrepreneurs’ continuation decisions.
When asked about their counterfactual decisions in a scenario where their project
achieved more than 90% of the funding target (though still unfunded), 60% of entrepreneurs
say they would continue with the project, 27% would scale down or modify the project, and
only 13% choose to abandon it. When the counterfactual pledging outcome changes to less
than 5% of funding target, 52% of entrepreneurs say they would abandon the project or put
it on hold, 25% would choose to scale down or modify the project, and 23% would choose to
continue as planned. Panel B of Table 9 tabulates the means of pledge ratio and the decision
variable for the two counterfactual scenarios and for the real scenario. On average,
entrepreneurs are much more likely to continue with their projects when feedback is more
positive. In Panel C of Table 9, I combine counterfactual decisions with real decisions and

31
apply entrepreneur-project fixed effects to relate continuation to feedback within an
entrepreneur-project. This gives strong identification as I am able to absorb all unobserved
entrepreneur or project characteristics. Using this specification, I find that a 10 percentage
point increase in pledge ratio increases entrepreneurs’ likelihood of continuing by 4
percentage points.
Lastly, I ask entrepreneurs about their general motives for accessing crowdfunding.
Unsurprisingly, obtaining funding is mentioned by most entrepreneurs. Importantly, 63.4%
of entrepreneurs report that they chose to crowdfund their projects also to “test the market
and obtain feedback.” Among these entrepreneurs, 60.2% believe that such feedback cannot
be obtained from other financing sources such as banks, friends and family, or angel/VC
investors. This suggests that obtaining market feedback is an important motive for accessing
crowdfunding; to entrepreneurs, crowdfunding indeed has an advantage in providing such
feedback compared with traditional financiers.
6. Further Discussion
A point worth discussing is to what extent the results on reward-based crowdfunding can be
generalized to other types of crowdfunding. Despite their differences, crowdfunding platforms
share common features that contribute to the formation of rich learning opportunities. These
features include the involvement of the crowd, online social interactions, and accessibility at
an early stage. Nevertheless, the type of contract offered to investors will affect the kind of
feedback generated in the funding process. In reward-based crowdfunding, backers are trade
financiers and potential customers; their feedback is therefore more product market-oriented.
In equity-based crowdfunding, funders hold equity stakes in projects and are therefore more
long-term oriented. Equity crowdfunders also care about the financial viability of a project in
addition to its product-market potentials. These incentive differences will in turn be
incorporated into the feedback generated in the funding process, and affect what
entrepreneurs will learn about. However, the key distinguishing features of crowdfunding
that enable feedback provision remain the same across different crowdfunding types. The
results in this paper can therefore speak to crowdfunding as a new financing method in
general.

32
This paper focuses on information provision from the crowd to entrepreneurs who
participate in crowdfunding. The informational benefit of crowdfunding, however, likely
reaches beyond those who launch a campaign. Feedback generated on a platform can also be
picked up by other entrepreneurs outside of the platform through observational learning.
Such information spillover is possible due to the public nature of crowdfunding and its
transparency. In contrast, information produced by VCs and banks is largely held within the
intermediary and is not shared with other parties (Kaplan 2006, Breton 2011, Dang, Gordon,
Holmström, and Ordonez 2014). Crowdfunding therefore has the potential to drastically
change the information environment faced by all entrepreneurs and influence their entry at
the aggregate level.
7. Conclusion
In recent years, entrepreneurial finance has been experiencing a gradual disintermediation
caused by the rise of crowdfunding. For the first time in history, entrepreneurs are able to
raise capital online directly from the public. Our understanding of this new financing method
is still very limited. What’s the distinguishing feature of crowdfunding? Does it provide any
benefit to entrepreneurs beyond financing? This paper advances our knowledge about
crowdfunding by uncovering an important role it plays in the entrepreneurial process: the
provision of early feedback to entrepreneurs. Using a novel dataset from Kickstarter, I show
that the crowd’s funding decisions help entrepreneurs learn about the prospects of their
projects. Such feedback affects entrepreneurs’ subsequent decisions such as
commercialization, continuation, and project scale choice. Consistent with the feedback value
of crowdfunding, entrepreneurs entering Kickstarter shift to those who face higher
uncertainty when crowdfunding becomes relative more costly. Overall, my results highlight
the potential of crowdfunding in reducing the uncertainty faced by early-stage entrepreneurs.
My paper suggests that feedback from financial markets, traditionally only available to
public firms, can become accessible to entrepreneurs as early-stage financing is
disintermediated by the involvement of the crowd.

33
References
Adelino, Manuel, Antoinette Schoar, and Felipe Severino, 2014, House prices, collateral and self-
employment, Journal of Financial Economics, forthcoming.
Ahlers, Gerrit K.C., Douglas J. Cumming, Christina Guenther, and Denis Schweizer, 2012, Signaling
in equity crowdfunding, working paper.
Allen, Franklin, and Douglas Gale, 1999, Diversity of opinion and financing of new
technologies, Journal of Financial Intermediation 8(1), 68-89.
Amiti, Mary, and David E. Weinstein, 2013, How much do bank shocks affect investment? Evidence
from matched bank-firm loan data, NBER working paper No. 18890.
Agrawal, Ajay, Christian Catalini, and Avi Goldfarb, 2011, The geography of crowdfunding, NBER
working paper No. 16820.
Agrawal, Ajay, Christian Catalini, and Avi Goldfarb, 2013, Some simple economics of crowdfunding,
NBER working paper No. 19133.
Avery, Robert B., Ralph W. Bostic, and Katherine A. Samolyk, 1998, The role of personal wealth in
small business finance, Journal of Banking and Finance 22(6), 1019-61.
Bakke, Tor-Erik, and Toni M. Whited, 2010, Which firms follow the market? An analysis of corporate
investment decisions, Review of Financial Studies 23(5), 1941-1980.
Barber, Brad M., and Terrance Odean, 2001, Boys will be boys: Gender, overconfidence, and common
stock investment, Quarterly Journal of Economics 116, 261-292.
Belleflamme, Paul, Thomas Lambert, and Armin Schwienbacher, 2014, Crowdfunding: tapping the
right crowd, Journal of Business Venturing 29(5), 585-609.
Bernstein, Shai, Arthur Korteweg, and Kevin Laws, 2015, Attracting early stage investors: Evidence
from a randomized field experiment, Journal of Finance, forthcoming.
Bond, Philip, Alex Edmans, and Itay Goldstein, 2012, The real effects of financial markets, Annual
Review of Financial Economics 4, 339-360.
Breton, Regis, 2011, A smoke screen theory of financial intermediation, working paper.
Brown, David C., and Shaun William Davies, 2016, Equity crowdfunding: Harnessing the wisdom of
the crowd, working paper.
Cardona, Juan Camilo, Rade Stanojevic, and Rubén Cuevas, 2013, On weather and internet traffic
demand, International Conference on Passive and Active Network Measurement, 260-263. Springer
Berlin Heidelberg.
Chemla, Gilles, and Katrin Tinn, 2016, Learning through crowdfunding, working paper.
Chen, Qi, Itay Goldstein, and Wei Jiang, 2007, Price informativeness and investment sensitivity to
stock price, Review of Financial Studies 20(3), 619-650.
Cosh, Andy, Douglas Cumming, and Alan Hughes, 2009, Outside entrepreneurial capital, Economic
Journal 119(540), 494-533.
Cumming, Douglas J., Gael Leboeuf, and Armin Schwienbacher, 2015, Crowdfunding models: Keep-
It-All vs. All-or-Nothing, working paper.
Cvijanovic, Dragana, 2014, Real estate prices and firm capital structure, Review of Financial Studies
27(9), 2690-2735.

34
Dang, Tri Vi, Gary Gorton, Bengt Holmström, and Guillermo Ordonez, 2014, Banks as secret keepers,
NBER working paper No. 20255.
Dessaint, Olivier, Thierry Foucault, Laurent Frésard, and Adrien Matray, 2015, Ripple effects of noise
on corporate investment, working paper.
Ewens, Michael, Ramana Nanda, And Matthew Rhodes-Kropf, 2015, Cost of experimentation and the
evolution of venture capital, working paper.
Flannery, Mark, and Leming Lin, 2015, House prices, bank balance sheets, and bank credit supply,
working paper.
Foucault, Thierry, and Laurent Fresard, 2014, Learning from peers' stock prices and corporate
investment, Journal of Financial Economics 111(3), 554-577.
Gilchrist, Duncan Sheppard, and Emily Glassberg Sands, 2016, Something to talk about: social
spillovers in movie consumption, Journal of Political Economy 124(5), 1339-1382.
Golub, Benjamin, and Matthew O. Jackson, 2010, Naïve learning in social networks and the wisdom
of crowds, American Economic Journal: Microeconomics 2(1), 112-149.
Gompers, Paul, William Gornall, Steven N. Kaplan, and Ilya A. Strebulaev, 2016, How do venture
capitalists make decisions? Working paper.
Gompers, Paul, Steven N. Kaplan, and Vladimir Mukharlyamov, 2016, What do private equity firms
say they do? Journal of Financial Economics 121(3), 449-476.
Gottlieb, Joshua D., Richard R. Townsend, and Ting Xu, 2016, Experimenting with entrepreneurship:
the effect of job-protected leave, NBER working paper No. 22446.
Graham, John R., and Campbell R. Harvey, 2001, The theory and practice of corporate finance:
Evidence from the field, Journal of Financial Economics 60(2), 187-243.
Greenberg, Jason, and Ethan Mollick, 2016, Activist choice homophily and the crowdfunding of female
founders, Administrative Science Quarterly 1-34.
Greenstone, Michael, and Alexandre Mas, 2015, Do credit market shocks affect the real economy?
Quasi-experimental evidence from the Great Recession and “normal” economic times, NBER working
paper No.20704.
Herzenstein, Michal, Utpal M. Dholakia, and Rick L. Andrews, 2011. Strategic herding behavior in
peer-to-peer loan auctions. Journal of Interactive Marketing 25(1), 27-36.
Hombert, Johan, Antoinette Schoar, David Sraer, and David Thesmar, 2013, Can unemployment
insurance spur entrepreneurial activity? Evidence from France, NBER working paper No. 20717.
Hildebrand, Thomas, Manju Puri, and Jörg Rocholl, 2016, Adverse incentives in crowdfunding,
Management Science, forthcoming.
Iyer, Rajkamal, Asim Ijaz Khwaja, Erzo F. P. Luttmer, and Kelly Shue, 2015. Screening peers softly:
Inferring the quality of small borrowers, Management Science 62(6), 1554-1577.
Jappelli, Tullio, 1990, Who is credit constrained in the U.S. economy? Quarterly Journal of Economics
105(1), 219-234.
Jovanovic, Boyan, 1979, Job matching and the theory of turnover, Journal of Political Economy, 972-
990.
Jensen, Thais Laerkholm, Søren Leth-Petersen, and Ramana Nanda, 2014, Housing collateral, credit
constraints and entrepreneurship: Evidence from a mortgage reform, working paper.

35
Jiménez, Gabriel, Steven Ongena, José-Luis Peydró, and Jesús Saurina, 2012, Credit supply and
monetary policy: Identifying the bank balance-sheet channel with loan applications, American
Economic Review 102(5), 2301-26.
Kaplan, Todd, 2006, Why banks should keep secrets, Economic Theory 27(2), 341-357.
Kaplan, Steven N., Berk A. Sensoy, and Per Stromberg, 2009, Should investors bet on the jockey or
the horse? Evidence from the evolution of firms from early business plans to public companies, Journal
of Finance 64(1), 75-115.
Kerr, Sari Pekkala, William R. Kerr, and Ramana Nanda, 2014, House money and entrepreneurship,
working paper.
Kerr, William R., Ramana Nanda, and Matthew Rhodes-Kropf, 2014, Entrepreneurship as
experimentation, Journal of Economic Perspectives 28(3), 25-48.
Khwaja, Asim Ijaz, and Atif Mian, 2008, Tracing the impact of bank liquidity shocks: Evidence from
an emerging market, American Economic Review 98(4), 1413-1442.
Kuppuswamy, Venkat, and Barry L. Bayus, 2014, Crowdfunding creative ideas: The dynamics of
project backers in Kickstarter, working paper.
Li, Jiasun, 2016, Profit-sharing: A contracting solution to harness wisdom of the crowd, working paper.
Li, Emma, 2015, The usual suspects: Experienced backers and early stage venture success, working
paper.
Li, Zhuoxin, and Jason A. Duan, 2014, Dynamic strategies for successful online crowdfunding, working
paper
Lin, Mingfeng, N.R. Prabhala, and Siva Viswanathan, 2013, Judging borrowers by the company they
keep: Friendship networks and information asymmetry in online peer-to-peer lending, Management
Science 59(1), 17-35.
Lu, Chun-Ta, Sihong Xie, Xiangnan Kong, and Philip S. Yu, 2014, Inferring the impacts of social media
on crowdfunding. In Proceedings of the 7th ACM international conference on Web search and data
mining (573-582). ACM.
Lundeberg, Mary A., Paul W. Fox, and Judith Punccohar, 1994, Highly confident but wrong: Gender
differences and similarities in confidence judgments, Journal of Educational Psychology 86, 114-121.
Luo, Yuanzhi, 2005, Do insiders learn from outsiders? Evidence from mergers and
acquisitions, Journal of Finance 60(4), 1951-1982.
Mann, Ronald J., 1998, Comment on Avery, Bostic, and Samolyk, Journal of Banking and Finance 22,
1062-1066.
Manso, Gustavo, 2016, Experimentation and the returns to entrepreneurship, Review of Financial
Studies, forthcoming.
Marom, Dan, and Orly Sade, 2013, Are the life and death of a young start-up indeed in the power of
the tongue? Lessons from online crowdfunding pitches, working paper.
Massolution, 2015, 2015 CF Crowdfunding Industry Report.
Meisenzahl, Ralf, 2014, Verifying the state of financing constraints: Evidence from us business credit
contracts, Journal of Economic Dynamics and Control 43, 58–77.
Mollick, Ethan R., 2013, Swept away by the crowd? Crowdfunding, venture capital, and the selection

36
of entrepreneurs, working paper.
Mollick, Ethan R., 2014, The dynamics of crowdfunding: An exploratory study, Journal of Business
Venturing 29(1), 1-16.
Mollick, Ethan R., 2015, Delivery rates on Kickstarter, working paper.
Mollick, Ethan R., 2016, Containing multitudes: The many impacts of Kickstarter funding, working
paper.
Mollick, Ethan R., and Venkat Kuppuswamy, 2014, After the campaign: Outcomes of crowdfunding,
working paper.
Mollick, Ethan R., and Ramana Nanda, 2015, Wisdom or madness? Comparing crowds with expert
evaluation in funding the arts, Management Science, forthcoming.
Moon, John, 2009, Small business finance and personal assets, Community Investments 21, 9-10.
Morck, Randall, Andrei Shleifer and Robert W Vishny, 1990, The stock market and investment: is the
market a sideshow? Brookings Papers on Economic Activity 2, 157-215.
Morse, Adair, 2011, Payday lenders: Heroes or villains? Journal of Financial Economics 102(1), 28-44.
Morse, Adair, 2015, Peer-to-peer crowdfunding: Information and the potential for disruption in
consumer lending, Annual Review of Financial Economics, forthcoming.
Robb, Alicia. M., and David T. Robinson, 2014, The capital structure decisions of new firms, Review of
Financial Studies 27(1), 153-179.
Saiz, Albert, 2010, The geographic determinants of housing supply, Quarterly Journal of Economics
125(3), 1253-1296.
Schmalz, Martin C., David Alexandre Sraer, and David Thesmar, 2015, Housing collateral and
entrepreneurship, Journal of Finance, forthcoming.
Schnabl, Philipp, 2012, The international transmission of bank liquidity shocks: Evidence from an
emerging market, Journal of Finance 67(3), 897-932.
Schoar, Antoinette, 2010, The divide between subsistence and transformational entrepreneurship,
NBER Chapters, National Bureau of Economic Research, Inc.
Tetlock, Paul C., 2007, Giving content to investor sentiment: The role of media in the stock market,
Journal of Finance 62(3), 1139-1168.
Walton, Mariah, 2013, What happens with online shopping when it rains? Linking online shopping to
weather and exploring drivers of noise in sales data, Staff report, RichRelevance.
Wei, Zaiyan, and Mingfeng Lin, 2015, Market mechanisms in online crowdfunding, working paper.
Wolfers, Justin, and Eric Zitzewitz, 2004, Prediction markets, Journal of Economic Perspectives 18(2),
107-126.
Yan, Dong, 2016, Do private firms (mis)learn from the stock market? Stockholm School of Economics
working paper.
Zhang, Juanjuan, and Peng Liu, 2012, Rational herding in microloan markets, Management Science
58(5), 892-912.
Zuo, Luo, 2016. The informational feedback effect of stock prices on management forecasts, Journal of
Accounting and Economics, 61(2), 391-413.

37
Figure 1. Google Search Interests for “Crowdfunding” and “Venture Capital”
This graph plots monthly Google search interests for the keywords “Crowdfunding” and “Venture capital” from
January 2008 to January 2016. Data are retrieved from Google Trends.
Figure 2. Kickstarter Growth
This figure plots Kickstarter’s growth from its founding in April 2009 to April 2015. Red (blue) bar represents
the cumulative number of funded (unfunded) projects. Green (yellow) line represents the cumulative amount
of pledged (raised) money in U.S. dollars.
020
40
60
80
100
Go
ogl
e se
arch
in
tere
st (
mo
nth
ly)
2008m1 2009m1 2010m1 2011m1 2012m1 2013m1 2014m1 2015m1 2016m1
Crowdfunding Venture capital
0
200
400
600
800
1000
Am
oun
t in
mil
$
0
50
00
010
00
00
15
00
00
# o
f P
roje
cts
2009m1 2010m1 2011m1 2012m1 2013m1 2014m1
No. of unfunded projects No. of funded projects
Raised amount (mil $) Pledged amount (mil $)
Kickstarter growth over time

38
Figure 3. A Sample Project Page on Kickstarter

39
Figure 4. Geographic Distribution of Funding Demand on Kickstarter in U.S.
This figure plots the distribution of funding demand on Kickstarter in U.S. across Metropolitan/Micropolitan Statistical Areas based on data from
April 2009 to April 2014. Projects are assigned to MSAs based on their geographic coordinates. Funding target amounts are then aggregated to the
Metropolitan/Micropolitan Statistical Area level and plotted on the map, with darker areas representing higher amounts. White areas on the map
represent regions not in the MSA system. Alaska, Hawaii, Puerto Rico, and other territories are omitted to fit in the map.

40
Table 1. Summary Statistics
Panel A presents the summary statistics for key variables for the sample of all projects (137,371 projects), unfunded
projects (78,216 projects), and funded projects (59,155 projects). All variables are defined in Appendix I. Panel B breaks
down the full sample of projects by project category and tabulates the number of projects, share of total pledged amount,
average funding target, and average success rate within each category.
Panel A
All projects Unfunded projects Funded projects
Variable Mean Median Mean Median Mean Median
Project characteristics
Target amount 22,669.01 5,000.00 33,593.87 7,000.00 8,223.92 3,500.00
Pledged amount 7,336.25 1,139.00 1,602.79 212.00 14,917.16 4,250.00
Pledge ratio 1.69 0.30 0.11 0.04 3.77 1.13
Funded 0.43 0.00 1.00 1.00 0.00 0.00
Number of backers 99.49 21.00 21.62 6.00 202.45 63.00
Pledged amount per backer 72.33 50.48 63.38 40.00 82.35 61.64
Funding window (in days) 35.63 30.00 37.22 30.00 33.53 30.00
No. of words in project pitch 553.99 404.00 531.78 378.00 583.35 435.00
No. of videos 0.98 1.00 0.92 1.00 1.07 1.00
No. of images 3.78 0.00 3.54 0.00 4.11 0.00
Has website 0.83 1.00 0.79 1.00 0.87 1.00
No. of reward tiers 8.69 8.00 7.99 7.00 9.60 8.00
Average ln(reward price) 3.60 3.67 3.55 3.61 3.67 3.72
No. of comments 29.06 0.00 2.97 0.00 63.54 2.00
No. of comments per backer 0.09 0.00 0.08 0.00 0.09 0.03
Entrepreneur characteristics
No. of Facebook friends 466.31 138.00 393.44 81.00 562.65 263.00
Has Facebook 0.58 1.00 0.56 1.00 0.59 1.00
No. of words in biography 119.61 78.88 117.29 76.57 122.69 82.01
Experience index 1.57 1.61 1.54 1.61 1.62 1.61
Female 0.41 0.00 0.45 0.00 0.38 0.00
Decision variables
Commercialized_films 0.16 0.00 0.10 0.00 0.25 0.00
Commercialized_PCgames 0.09 0.00 0.05 0.00 0.20 0.00
Commercialized_books 0.08 0.00 0.06 0.00 0.12 0.00
Commercialized_combined 0.13 0.00 0.08 0.00 0.20 0.00
Launch again 0.17 0.00 0.18 0.00 0.16 0.00
Same-type project 0.78 1.00 0.76 1.00 0.80 1.00
Project similarity 0.94 0.96 0.94 0.96 0.95 0.96
Other variables
Project novelty 0.66 0.67 0.68 0.68 0.65 0.65
Backers’ experience 1.60 1.27 1.80 1.50 1.38 1.13
Jockey 2.86 2.97 2.77 2.86 2.99 3.06
Fixed costs 1.98 2.00 1.97 2.00 1.99 2.00
Local housing price index 1.94 1.96 1.91 1.90 1.97 2.01
Local SBL supply shock -0.07 -0.17 -0.08 -0.17 -0.06 -0.16
Cloudcover 0.06 0.03 0.03 0.01 0.08 0.05

41
Panel B
Project category No. of projects
Share of total
pledged amount
Avg. funding
target ($) Success rate
Art 12,265 3.7% 24,803 47%
Comics 3,802 2.5% 8,720 48%
Dance 1,802 0.6% 6,142 69%
Product and design 7,158 14.5% 25,266 37%
Fashion and apparel 5,560 3.0% 13,103 29%
Film and video 33,546 19.7% 35,818 40%
Food and restaurant 5,666 3.8% 18,071 39%
Games 9,071 21.5% 43,521 34%
Music 27,956 10.4% 9,115 55%
Photography 4,184 1.3% 10,447 36%
Publishing 16,588 4.9% 11,373 32%
Technology 4,006 11.8% 63,590 33%
Theater 5,767 2.3% 12,365 64%

42
Table 2. Crowdfunding Feedback and Continuation Decisions
This table presents the effect of crowdfunding feedback on entrepreneurs’ subsequent commercialization decisions and decisions to return to
Kickstarter. All samples include only unfunded projects. Crowdfunding feedback is measured as the logarithm of the pledged amount. Panel
A examines the commercialization outcome outside Kickstarter for three types of projects: films, PC games, and books. Commercialized_ is
an indicator equal to one if a project is found in the respective database (IMDB for films, Steam for PC games, and OpenLibrary for books).
The samples include unfunded projects by non-repeat entrepreneurs. Panel B examines entrepreneurs’ continuation decisions on Kickstarter.
Launch again is an indicator equal to one if an entrepreneur has launched another project after the current unfunded project before May
2013 (allowing for one year before the end of the sample period to observe entrepreneurs’ comeback decisions). Same-type project is an indicator
equal to one if an entrepreneur’s next project is of the same type as her current project. Project similarity is the Bigram text similarity score
between the pitches of an entrepreneur’s two consecutive projects. The instrument Cloudcover is the average deseasoned cloud cover over a
project’s funding window within 100 kilometers of the entrepreneur’s location. All specifications control for the characteristics of the current
project (ln(target amount), funding window length (in days), has website dummy, number of reward tiers, average reward price, project pitch
length, number of images, number of videos), characteristics of the entrepreneur (number of Facebook friends, length of entrepreneur’s
biography, and entrepreneur’s experience index), project type fixed effects, year-quarter fixed effects, and MSA fixed effects. Detailed variable
definitions are in Appendix I. Standard errors are clustered at the MSA level in Panel A and at the project type level in Panel B. *, **, and
*** denote significance at the 10%, 5%, and 1% levels, respectively.
Panel A. Commercialization outside Kickstarter
Commercialized
_films Commercialized
_PCgames Commercialized
_books Commercialized
_combined
OLS IV OLS IV OLS IV OLS IV
(1) (2) (3) (4) (5) (6) (7) (8)
Ln(pledged amount) 0.006*** 0.012** 0.012*** 0.042*** 0.009*** 0.024*** 0.007*** 0.018***
[0.001] [0.006] [0.002] [0.016] [0.002] [0.009] [0.001] [0.005]
First stage Cloudcover 0.089*** 0.082*** 0.065*** 0.083***
[0.016] [0.024] [0.012] [0.013]
F-stat of instrument 28.36 17.87 22.25 37.18
Other controls Yes Yes Yes Yes Yes Yes Yes Yes
Project type FE No No No No No No Yes Yes
Year-quarter FE Yes Yes Yes Yes Yes Yes Yes Yes
MSA FE Yes Yes Yes Yes Yes Yes Yes Yes
Observations 16,202 16,202 3,097 3,097 8,080 8,080 27,379 27,379
Adjusted R2 0.029 0.030 0.143 0.145 0.089 0.090 0.034 0.034

43
Panel B. Continuation on Kickstarter
Launch again Same-type project Project similarity
(conditional on launching again)
OLS IV OLS IV OLS IV
(1) (2) (3) (4) (5) (6)
Ln(pledged amount) 0.002** 0.019** 0.020*** 0.172*** 0.002*** 0.018***
[0.001] [0.009] [0.003] [0.025] [0.001] [0.007]
First stage Cloudcover 0.079*** 0.080*** 0.080***
[0.010] [0.017] [0.017]
F-stat of instrument 39.38 20.51 20.51
Other controls Yes Yes Yes Yes Yes Yes
Project type FE Yes Yes Yes Yes Yes Yes
Year-quarter FE Yes Yes Yes Yes Yes Yes
MSA FE Yes Yes Yes Yes Yes Yes
Observations 51,861 51,861 11,175 11,175 11,175 11,175
Adjusted R2 0.038 0.035 0.095 0.082 0.310 0.294

44
Table 3. Crowdfunding Feedback and the Adjustment of Project Scale
This table examines the effect of crowdfunding feedback on entrepreneurs’ adjustment of project scale,
as reflected in changes in funding target over an entrepreneur’s two similar projects. The sample in
columns 1 and 2 consists of unfunded entrepreneurs who have launched a subsequent project of the
same type as the current unfunded project. The sample in columns 3 and 4 consists of unfunded
entrepreneurs who launched a subsequent project highly similar to (project similarity score above 0.9)
the current unfunded project. Crowdfunding feedback is measured as the logarithm of the pledged
amount the current project receives. The dependent variable is the logarithmic funding target of an
entrepreneur’s next same-type project in columns 1 and 2, and that of her next highly similar project
in columns 3 and 4. All specifications control for the characteristics of the current project (ln(target
amount), funding window length (in days), has website dummy, number of reward tiers, average
reward price, project pitch length, number of images, number of videos), characteristics of the
entrepreneur (number of Facebook friends, log length of entrepreneur’s biography, and entrepreneur’s
experience index), project type fixed effects, year-quarter fixed effects, and MSA fixed effects. Detailed
variable definitions are in Appendix I. Standard errors are clustered at the project type level. *, **,
and *** denote significance at the 10%, 5%, and 1% levels, respectively.
Ln(target amount) of the next
same-type project
Ln(target amount) of the next
highly-similar project OLS IV OLS IV (1) (2) (3) (4)
Ln(pledged amount) 0.052*** 0.139** 0.060*** 0.159**
[0.005] [0.059] [0.006] [0.072]
First stage Cloudcover 0.087*** 0.085***
[0.016] [0.015]
F-stat of instrument 21.04 21.51
Other Controls Yes Yes Yes Yes
Project type FE Yes Yes Yes Yes
Year-quarter FE Yes Yes Yes Yes
MSA FE Yes Yes Yes Yes
Observations 8,683 8,683 7,497 7,497
Adjusted R2 0.384 0.378 0.388 0.332

45
Table 4. Cross-sectional Heterogeneity in Learning
This table examines the heterogeneity in entrepreneurs’ reaction to crowdfunding feedback. The samples and
specifications follow those used in Tables 2 and 3. In Panel A, Project novelty is one minus the cosine similarity
score between the word vector of a project’s pitch and the combined word vector of all project pitches in the
same project type. In Panel B, Backers’ experience is the average number of prior projects a project’s backers
have backed. It is only available for projects with at least one backer. In Panel C, Female is an indicator equal
to one if an entrepreneur’s name is identified to be a female name. It is only available for projects whose
entrepreneur is an individual rather than an institution. All three measures are standardized (removing mean
and divided by standard deviation) in all regressions. All specifications control for the characteristics of the
initial project (ln(target amount), funding window in days, web site dummy, number of reward tiers, average
log reward price, project pitch length, number of images, number of videos), characteristics of the entrepreneur
(number of Facebook friends, log length of entrepreneur’s biography, and entrepreneur’s experience index),
project type fixed effects, year-quarter fixed effects, and MSA fixed effects. Detailed variable definitions are in
Appendix I. In all panels, standard errors are clustered at the MSA level in column 1 and at the project type
level in other columns. *, **, and *** denote significance at the 10%, 5%, and 1% levels, respectively.
Panel A. Interaction with project uncertainty
Commercialized
_combined
Launch another
project
Project similarity
(conditional on
launching again)
Ln(target amount)
of the next same-
type project
(1) (2) (3) (4)
Ln(pledged amount) 0.007*** 0.0017** 0.0019*** 0.053***
[0.001] [0.0008] [0.0005] [0.005]
Ln(pledged amount) 0.003*** 0.0004** 0.0002** 0.008**
× Project novelty [0.001] [0.0002] [0.0001] [0.003]
Project novelty 0.003 -0.0007 0.0021 -0.080***
[0.004] [0.0030] [0.0020] [0.026]
Other controls Yes Yes Yes Yes
Project type FE Yes Yes Yes Yes
Year-quarter FE Yes Yes Yes Yes
MSA FE Yes Yes Yes Yes
Observations 27,379 51,861 11,175 8,683
Adjusted R2 0.036 0.015 0.307 0.374
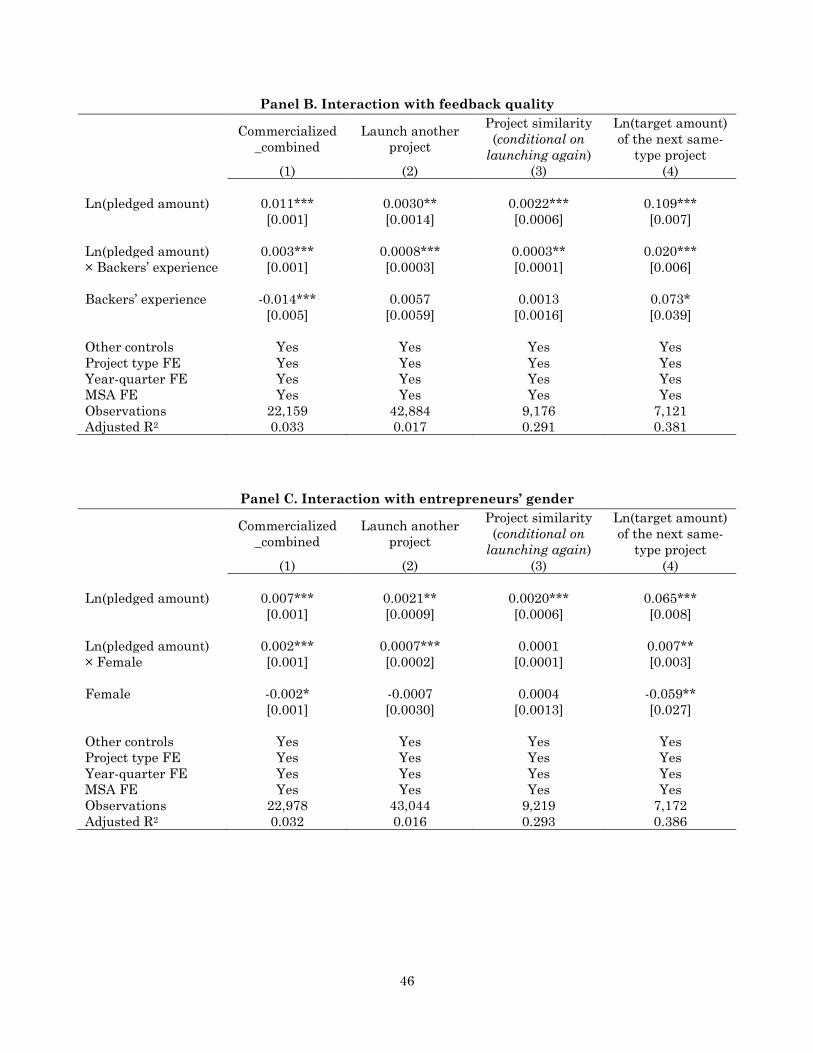
46
Panel B. Interaction with feedback quality
Commercialized
_combined
Launch another
project
Project similarity
(conditional on
launching again)
Ln(target amount)
of the next same-
type project
(1) (2) (3) (4)
Ln(pledged amount) 0.011*** 0.0030** 0.0022*** 0.109***
[0.001] [0.0014] [0.0006] [0.007]
Ln(pledged amount) 0.003*** 0.0008*** 0.0003** 0.020***
× Backers’ experience [0.001] [0.0003] [0.0001] [0.006]
Backers’ experience -0.014*** 0.0057 0.0013 0.073*
[0.005] [0.0059] [0.0016] [0.039]
Other controls Yes Yes Yes Yes
Project type FE Yes Yes Yes Yes
Year-quarter FE Yes Yes Yes Yes
MSA FE Yes Yes Yes Yes
Observations 22,159 42,884 9,176 7,121
Adjusted R2 0.033 0.017 0.291 0.381
Panel C. Interaction with entrepreneurs’ gender
Commercialized
_combined
Launch another
project
Project similarity
(conditional on
launching again)
Ln(target amount)
of the next same-
type project
(1) (2) (3) (4)
Ln(pledged amount) 0.007*** 0.0021** 0.0020*** 0.065***
[0.001] [0.0009] [0.0006] [0.008]
Ln(pledged amount) 0.002*** 0.0007*** 0.0001 0.007**
× Female [0.001] [0.0002] [0.0001] [0.003]
Female -0.002* -0.0007 0.0004 -0.059**
[0.001] [0.0030] [0.0013] [0.027]
Other controls Yes Yes Yes Yes
Project type FE Yes Yes Yes Yes
Year-quarter FE Yes Yes Yes Yes
MSA FE Yes Yes Yes Yes
Observations 22,978 43,044 9,219 7,172
Adjusted R2 0.032 0.016 0.293 0.386

47
Table 5. Robustness and Additional Analyses
Panel A reproduces the main results in Tables 2 to 3 using ln(number of backers) as an alternative measure of feedback. The samples and
specifications are the same as those used in Tables 2 to 3. Panel B conducts placebo tests examining how an entrepreneur’s decisions with
respect to a current project depends on the feedback she received on her previous project in a different project type (ln(pledged
amount)_difftype). The samples include entrepreneurs who have launched at least two projects in different project types. Panel C interacts
crowdfunding feedback with the variable Jockey, which measures the extent to which the entrepreneur is featured in a project’s pitch. Samples
and specifications follow those used in Table 4. Details on the variation definitions are provided in Appendix I. In all panels, standard errors
are clustered at the MSA level in column 1 and at the project type level in other columns.*, **, and *** denote significance at the 10%, 5%,
and 1% levels, respectively.
Panel A. Alternative measure of feedback: ln(number of backers)
Commercialized
_combined
Launch another
project
Project similarity
(conditional on
launching again)
Ln(target amount)
of the next same-
type project
OLS IV OLS IV OLS IV OLS IV
(1) (2) (3) (4) (5) (6) (7) (8)
Ln(no. of backers) 0.019*** 0.037*** 0.006*** 0.042*** 0.003*** 0.028*** 0.132*** 0.210**
[0.002] [0.007] [0.002] [0.016] [0.001] [0.008] [0.008] [0.101]
First stage Cloudcover 0.051*** 0.054*** 0.063*** 0.069***
[0.008] [0.008] [0.012] [0.012]
F-stat of instrument 35.29 41.10 19.72 23.18
Other controls Yes Yes Yes Yes Yes Yes Yes Yes
Project type FE Yes Yes Yes Yes Yes Yes Yes Yes
Year-quarter FE Yes Yes Yes Yes Yes Yes Yes Yes
MSA FE Yes Yes Yes Yes Yes Yes Yes Yes
Observations 27,379 27,379 51,861 51,861 11,175 11,175 8,683 8,683
Adjusted R2 0.038 0.038 0.038 0.036 0.310 0.295 0.393 0.393

48
Panel B. Placebo tests
Commercialized
_combined
Ln(target amount)
(1) (2)
Ln(pledged amount)_difftype 0.004 0.014
[0.003] [0.009]
Other controls Yes Yes
Project type FE Yes Yes
Year-quarter FE Yes Yes
MSA FE Yes Yes
Observations 1,407 2,881
Adjusted R2 0.028 0.169
Panel C. Interaction with the “Jockey” measure
Commercialized
_combined
Launch another
project
Project similarity
(conditional on
launching again)
Ln(target amount)
of the next same-
type project
(1) (2) (3) (4)
Ln(pledged amount) 0.007*** 0.002** 0.002*** 0.053***
[0.001] [0.001] [0.001] [0.005]
Ln(pledged amount) -0.001 -0.001 0.001 -0.003
× Jockey [0.001] [0.001] [0.003] [0.004]
Jockey 0.001 -0.004 0.025*** 0.049*
[0.006] [0.003] [0.006] [0.029]
Other controls Yes Yes Yes Yes
Project type FE Yes Yes Yes Yes
Year-quarter FE Yes Yes Yes Yes
MSA FE Yes Yes Yes Yes
Observations 27,379 51,861 11,175 8,683
Adjusted R2 0.035 0.016 0.311 0.373
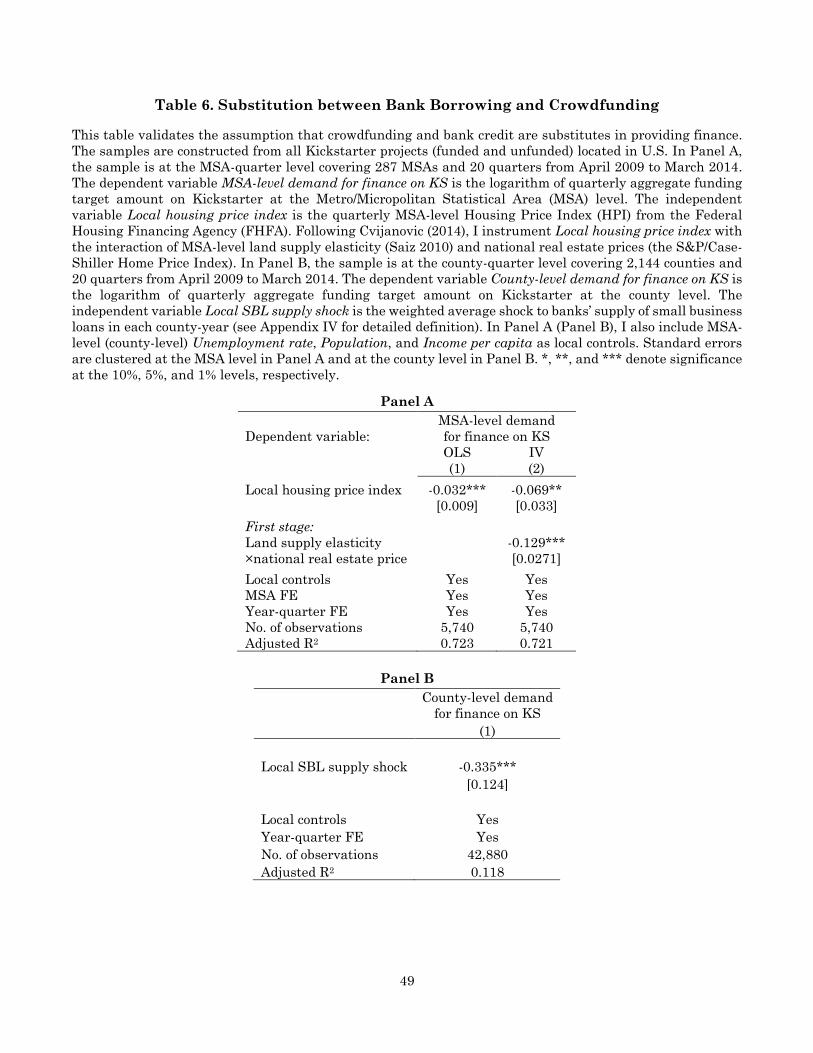
49
Table 6. Substitution between Bank Borrowing and Crowdfunding
This table validates the assumption that crowdfunding and bank credit are substitutes in providing finance.
The samples are constructed from all Kickstarter projects (funded and unfunded) located in U.S. In Panel A,
the sample is at the MSA-quarter level covering 287 MSAs and 20 quarters from April 2009 to March 2014.
The dependent variable MSA-level demand for finance on KS is the logarithm of quarterly aggregate funding
target amount on Kickstarter at the Metro/Micropolitan Statistical Area (MSA) level. The independent
variable Local housing price index is the quarterly MSA-level Housing Price Index (HPI) from the Federal
Housing Financing Agency (FHFA). Following Cvijanovic (2014), I instrument Local housing price index with
the interaction of MSA-level land supply elasticity (Saiz 2010) and national real estate prices (the S&P/Case-
Shiller Home Price Index). In Panel B, the sample is at the county-quarter level covering 2,144 counties and
20 quarters from April 2009 to March 2014. The dependent variable County-level demand for finance on KS is
the logarithm of quarterly aggregate funding target amount on Kickstarter at the county level. The
independent variable Local SBL supply shock is the weighted average shock to banks’ supply of small business
loans in each county-year (see Appendix IV for detailed definition). In Panel A (Panel B), I also include MSA-
level (county-level) Unemployment rate, Population, and Income per capita as local controls. Standard errors
are clustered at the MSA level in Panel A and at the county level in Panel B. *, **, and *** denote significance
at the 10%, 5%, and 1% levels, respectively.
Panel A
Dependent variable:
MSA-level demand
for finance on KS
OLS
(1)
IV
(2)
Local housing price index -0.032*** -0.069**
[0.009] [0.033]
First stage: Land supply elasticity -0.129***
×national real estate price [0.0271] Local controls Yes Yes
MSA FE Yes Yes
Year-quarter FE Yes Yes
No. of observations 5,740 5,740
Adjusted R2 0.723 0.721
Panel B
County-level demand
for finance on KS
(1)
Local SBL supply shock -0.335***
[0.124]
Local controls Yes
Year-quarter FE Yes
No. of observations 42,880
Adjusted R2 0.118
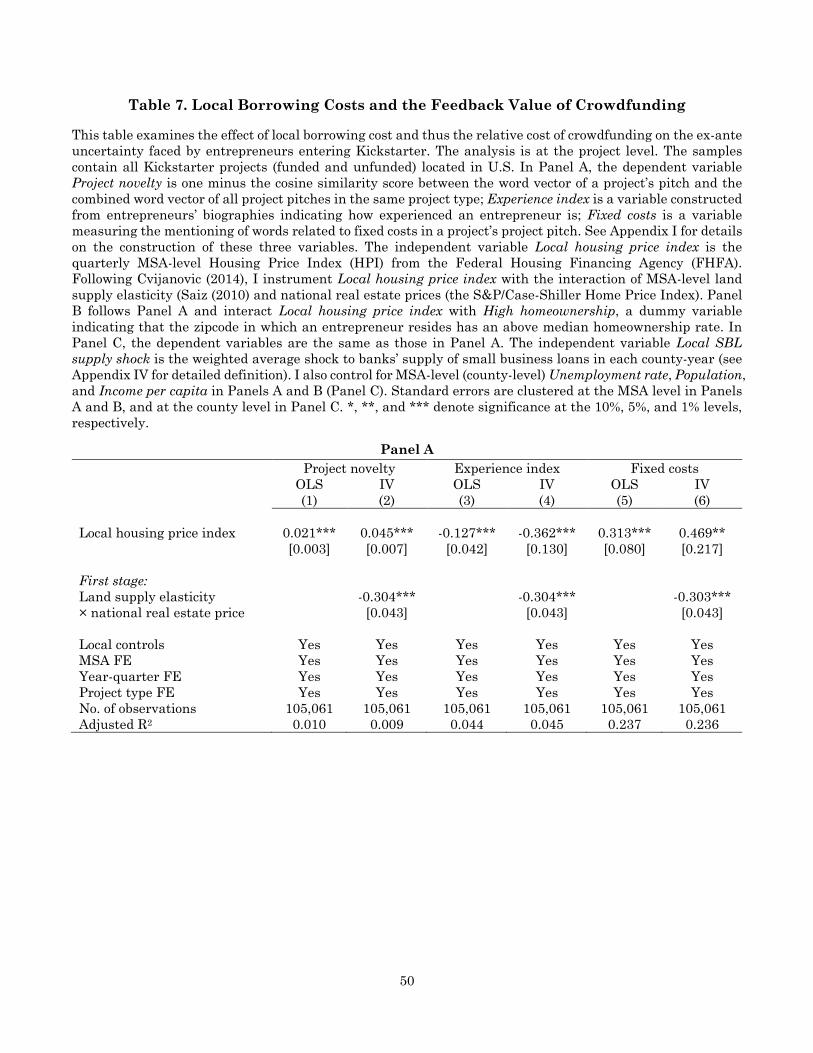
50
Table 7. Local Borrowing Costs and the Feedback Value of Crowdfunding
This table examines the effect of local borrowing cost and thus the relative cost of crowdfunding on the ex-ante
uncertainty faced by entrepreneurs entering Kickstarter. The analysis is at the project level. The samples
contain all Kickstarter projects (funded and unfunded) located in U.S. In Panel A, the dependent variable
Project novelty is one minus the cosine similarity score between the word vector of a project’s pitch and the
combined word vector of all project pitches in the same project type; Experience index is a variable constructed
from entrepreneurs’ biographies indicating how experienced an entrepreneur is; Fixed costs is a variable
measuring the mentioning of words related to fixed costs in a project’s project pitch. See Appendix I for details
on the construction of these three variables. The independent variable Local housing price index is the
quarterly MSA-level Housing Price Index (HPI) from the Federal Housing Financing Agency (FHFA).
Following Cvijanovic (2014), I instrument Local housing price index with the interaction of MSA-level land
supply elasticity (Saiz (2010) and national real estate prices (the S&P/Case-Shiller Home Price Index). Panel
B follows Panel A and interact Local housing price index with High homeownership, a dummy variable
indicating that the zipcode in which an entrepreneur resides has an above median homeownership rate. In
Panel C, the dependent variables are the same as those in Panel A. The independent variable Local SBL
supply shock is the weighted average shock to banks’ supply of small business loans in each county-year (see
Appendix IV for detailed definition). I also control for MSA-level (county-level) Unemployment rate, Population,
and Income per capita in Panels A and B (Panel C). Standard errors are clustered at the MSA level in Panels
A and B, and at the county level in Panel C. *, **, and *** denote significance at the 10%, 5%, and 1% levels,
respectively.
Panel A
Project novelty Experience index Fixed costs
OLS
(1)
IV
(2)
OLS
(3)
IV
(4)
OLS
(5)
IV
(6)
Local housing price index 0.021*** 0.045*** -0.127*** -0.362*** 0.313*** 0.469**
[0.003] [0.007] [0.042] [0.130] [0.080] [0.217]
First stage: Land supply elasticity -0.304*** -0.304*** -0.303***
× national real estate price [0.043] [0.043] [0.043]
Local controls Yes Yes Yes Yes Yes Yes
MSA FE Yes Yes Yes Yes Yes Yes
Year-quarter FE Yes Yes Yes Yes Yes Yes
Project type FE Yes Yes Yes Yes Yes Yes
No. of observations 105,061 105,061 105,061 105,061 105,061 105,061
Adjusted R2 0.010 0.009 0.044 0.045 0.237 0.236

51
Panel B
Project novelty Experience index Fixed costs
OLS IV OLS IV OLS IV
Local housing price index 0.018*** 0.034*** -0.122*** -0.329** 0.213*** 0.647**
[0.003] [0.007] [0.041] [0.133] [0.077] [0.263]
Local housing price index 0.006** 0.017*** -0.202** -0.427* 0.195** 0.304***
× High homeownership [0.003] [0.007] [0.100] [0.234] [0.097] [0.115]
High homeownership 0.011** 0.018 -0.005 -0.009 -0.022 -0.017
[0.006] [0.014] [0.010] [0.010] [0.019] [0.019]
Local controls Yes Yes Yes Yes Yes Yes
MSA FE Yes Yes Yes Yes Yes Yes
Year-quarter FE Yes Yes Yes Yes Yes Yes
Project type FE Yes Yes Yes Yes Yes Yes
No. of observations 105,061 105,061 105,061 105,061 105,061 105,061
Adjusted R2 0.010 0.009 0.044 0.045 0.237 0.230
Panel C
Project novelty Experience index Fixed costs
Local SBL supply shock 0.009*** -0.117*** 0.140***
[0.003] [0.030] [0.044]
Local controls Yes Yes Yes
Year-quarter FE Yes Yes Yes
Project type FE Yes Yes Yes
No. of observations 120,719 120,719 120,719
Adjusted R2 0.002 0.036 0.230

52
Table 8. A Survey of Kickstarter Entrepreneurs
This table reports the results from a survey of 262 unfunded entrepreneurs. The survey was administered via
SurveyMonkey in five waves from August 2016 to September 2016. Panel A presents the summary statistics
for the sample of responded entrepreneurs, contacted entrepreneurs, and all unfunded non-repeat
entrepreneurs. Panel B presents the survey questions and the associated results. The questions are presented
to survey participants one by one following the internal logic indicated in parentheses (words in parentheses
are presented to the survey participants). Questions 2 and 5 allow multiple answers while other questions
allow one answer only. Numbers in percentages indicate the percentage of respondents choosing each answer
for that question.
Panel A. Summary statistics for the survey sample
Responded
entrepreneurs
(N=262)
Contacted
entrepreneurs
(N=2,677)
All unfunded
non-repeat
entrepreneurs
(N=56,573)
Ln(pledged amount) 7.16 6.50 4.90
Ln(funding target) 9.91 9.53 8.92
Funding window (in days) 36.00 36.32 37.18
Has website 0.59 0.58 0.45
No. of reward tiers 9.02 8.59 7.98
Average ln(reward price) 3.84 3.72 3.59
Ln(no. of words in project pitch) 6.55 6.33 5.94
Ln(no. of images) 1.61 1.45 0.78
Ln(no. of videos) 0.74 0.69 0.59
Ln(no. of Facebook friends) 3.46 3.59 3.11
Ln(bio length) 6.39 6.32 5.73
Experience index 1.90 1.80 1.54
Panel B. Survey questions and results
Q1. Did you continue to pursue this specific project after your Kickstarter campaign? (Redirected to Q3 if
answer is A) A. Yes, I continued the project as originally planned
33.1%
B. The project was substantially scaled down or modified 19.9% C. The project was put on hold/abandoned
47.0%
Q2. What prevented you from continuing your project as planned? (Multiple answers allowed) A. Insufficient funding
78.8%
B. Lack of market interest (i.e. feedback from the crowd not good enough) 57.0% C. Other reasons
4.6%
Q3. Had your campaign achieved more than 90% of the funding goal (though still unfunded in the end),
what would your answer to the first question be? A. I would continue the project as planned
59.9%
B. I would scale down or modify the project
27.5% C. I would put the project on hold or abandon it
12.6%

53
Q4. Had your campaign achieved less than 5% of the funding goal, what would your answer to the first
question be? A. I would continue the project as planned
23.6%
B. I would scale down or modify the project
24.8% C. I would put the project on hold or abandon it
51.6%
Q5. In general, what's the reason you chose to crowdfund your project? (Multiple answers allowed.
Redirected to the end of the survey if answer does not include B) A. To obtain funding
90.6%
B. To test the market/obtain feedback
63.4% C. Other reasons
2.4%
Q6. Do you think such market feedback can be learnt from other financing sources such as bank, friends
and family, or angel/VC investors? A. Yes
19.4%
B. No
60.2% C. Not sure
20.4%

54
Table 9. Analysis of Survey Results
This table presents the results from regression analyses of respondents’ answers to Questions 1, 3, and 4 of
the survey. Panel A links respondents’ answers to Question 1 to their actual pledge ratios obtained on
Kickstarter. Dependent variable Subsequent decisions is equal to 1 if the respondent continued her project as
originally planned, is equal to 0.5 if she substantially scaled down or modified the project, and is equal to 0 if
she abandoned the project or put it on hold. Column 1 presents the OLS specification. Column 2 presents the
multinomial logit specification with those that have continued their project as the base group. Pledge ratio is
the ratio between the pledged amount and the funding target. Panel B compares respondents’ counterfactual
continuation decisions answered in Questions 3 and 4 with their actual decisions answered in Question 1.
Panel C does the comparison in a multivariate setting with entrepreneur-project fixed effects. Standard errors
are clustered at the project type level. *, **, and *** denote significance at the 10%, 5%, and 1% levels,
respectively.
Panel A. Crowdfunding feedback and actual continuation decisions
Subsequent decision:
=1 if continue as planned
=0.5 if scale down or modify
=0 if abandon or put on hold
Scale down
or modify
Abandon or
put on hold
Base group: Continue
OLS Multinomial logit
Pledge ratio 0.371** -2.585** -2.334**
[0.178] [1.221] [0.923]
Other controls Yes Yes
Project type FE Yes Yes
Year-quarter FE Yes Yes
Observations 262 262
Adjusted/Pseudo R2 0.122 0.063
Panel B. Actual and counterfactual continuation decisions: univariate analysis
Bad scenario Actual scenario Good scenario
Mean of pledge ratio 0.025 0.156 0.950
Mean of Subsequent decision 0.371*** 0.469 0.737***
Panel C. Actual and counterfactual continuation decisions: multivariate analysis
Subsequent decision:
=1 if continue as planned
=0.5 if scale down or modify
=0 if abandon or put on hold
Pledge ratio 0.381*** 0.388***
[0.030] [0.034]
Other controls Yes No
Project type FE Yes No
Year-quarter FE Yes No
Entrepreneur-project FE No Yes
Observations 780 780
Adjusted R2 0.141 0.554

55
Appendix I. Variable Definitions
Variable Name Definition
Target amount The funding target amount (in $) set by the entrepreneur. Amount in other
currencies are converted to US dollar based on the exchange rates in the
month the project is launched.
Pledged amount Amount (in $) pledged by the backers by the end of the project’s funding
window.
Pledge ratio The ratio between Target amount and Pledged amount. This ratio is larger
than or equal to one for funded projects and less than one for unfunded
projects.
Funded A dummy indicating the project is successfully funded. This happens when
the pledged amount reaches or exceeds the target amount, i.e., pledge ratio
equal to or larger than one.
Number of backers The number of backers that have pledged funding for the project.
Pledged amount per backer The average dollar amount pledged by each backer.
Funding window (in days) The number of days over which a project raises funding. Funding window
length is set by the entrepreneur.
Project pitch length The logarithm of the number of words in a project’s main pitch.
Number of videos The number of videos used in a project pitch.
Number of images The number of images used in a project pitch.
Has website A dummy equal to one if there is a dedicated website for the project.
Number of rewards tiers The number of reward tiers offered to backers. Each reward tier corresponds
to a price.
Average log(reward price) The average of the logarithm of reward price across all reward tiers offered
by a project.
Number of comments The number of comments posted by backers on a project’s wall.
Number of comments per
backer
The number of comments posted divided by the number of backers.
Number of Facebook
friends
The number of Facebook friends an entrepreneur has. For entrepreneurs who
do not have Facebook, this variable is set to zero.
Has Facebook A dummy equal to one if an entrepreneur has Facebook.
Biography length The logarithm of the number of words in an entrepreneur’s biography.
Experience index The log number of times experience-related keywords appear in an
entrepreneur’s biography. To create this index, I first construct a text bank
combining the biography texts of all entrepreneurs. This text bank is then
transformed into a dictionary of words with associated frequency scores.
From this dictionary, I manually identify 85 keywords most commonly
associated with professional or entrepreneurial experience. I then compute
the number of times these keywords appear in entrepreneurs’ biographies

56
and define the log of this frequency number as the Experience Index.
Incorporated A dummy equal to one if the entrepreneur is not an individual. I identify
incorporated entrepreneurs as those whose names are not persons’ names
(i.e., cannot be matched to the Genderize name database) and who have
a .com website.
Female A dummy indicating the gender of the entrepreneur. Following Greenberg
and Mollick (2016), gender is algorithmically coded using the genderize.io tool
by comparing entrepreneurs’ first names with a database of 208,631 distinct
names across 79 countries and 89 languages. For each name, the database
assigns a probability that a specific name-gender attribution (male or female)
is correct in the population of a country. An entrepreneur is identified to be
of a specific gender if the associated probability exceeds 70%. This variable is
only defined for non-firm individual entrepreneurs.
Commercialized_films A dummy equal to one if a film project is found in the IMDB database. I match
film projects on Kickstarter to the IMBD database based on project name and
the name of the entrepreneur. I first keep only titles in IMBD that were
released since 2009. I then match project names with title names based on
string matching algorithm and manual checks. I further require that the
name of the entrepreneur to match to at least one of the following fields in
IMBD: director name, writer name, and producer name. Finally, I require the
film release date to be after the project launch date on Kickstarter.
Commercialized_PCgames A dummy equal to one if a PC game project is found in the Steam database.
I match PC game projects on Kickstarter to the Steam database based on
project name and the name of the entrepreneur. I first keep only games on
Steam that were released since 2009. I then match project names with game
names based on string matching algorithm and manual checks. I further
require the name of the entrepreneur to match to either the developer name
or the publisher name on Steam. Finally, I require the game release date to
be after the project launch date on Kickstarter.
Commercialized_books A dummy equal to one if a book project is found in the OpenLibrary database.
I match book projects on Kickstarter to the OpenLibrary database based on
project name and the name of the entrepreneur. I first keep only books in
OpenLibrary that were published since 2009. I then match project names
with book names based on string matching algorithm and manual checks. I
further require the name of the entrepreneur to match to the author name in
OpenLibrary. Finally, I require the book publishing date to be after the
project launch date on Kickstarter.
Commercialized_combined A dummy equal to one if the either of the three commercialization indicators
above is equal to one.
Launch again A dummy equal to one if the entrepreneur launches another project after the
current project. This variable is only defined for projects launched before May
2013 to allow for enough time to observe re-launching.
Same-type project An indicator equal to one if an entrepreneur’s next project is of the same
project type as the current project.
Project similarity The Bigram similarity score between the pitch texts of two projects. The
Bigram algorithm compares two strings using all combinations of two
consecutive characters within each string. The score, valued between 0 and
1, is computed as the total number of bigrams shared by the two strings
divided by the average number of bigrams in each string

57
Cloudcover The average deseasoned cloud cover over a project’s funding window
within 100 kilometers of the entrepreneur’s location. I obtained hourly
weather station data from the Integrated Surface Database of the
National Oceanic and Atmospheric Administration (NOAA). For each
project, I keep weather stations that are within a 100 kilometer radius. I
first calculate the mean cloud cover score over all reported hours in a day
to compute daily cloud cover at each weather station. I then deseason
daily cloud cover at the station level by removing month of the year
averages at each weather station. Finally, I average the deseasoned cloud
cover across weather stations and funding days.
Project novelty One minus the cosine similarity score between the word vector of a project’s
pitch and the combined word vector of all project pitches in that project type.
To construct this variable, I first clean all project pitch texts by removing
numbers, non-text symbols, and common prepositions, articles, pronouns,
auxiliaries, and conjunctions. I then create a word vector for each project
pitch by collapsing the text into unique words with corresponding
frequencies. I do the same for each project type based on the pooled text of all
projects’ pitches in that project type. I then compute the cosine similarity
score between the word vector of a project and the combined word vector of
all projects in the same project type. The project novelty measure is one
minus the cosine similarity score
Backers’ experience The average number of projects a project’s backers have previously backed on
Kickstarter before backing this project.
Jockey Following Marom and Sade (2013), I construct Jockey as the number of times
the entrepreneur’s name (entrepreneurs’ names) or pronouns and possessive
adjectives (“I”, “my”, “we”, “our”, “he”, “his”, “she”, “her”, etc.) are mentioned
in the project pitch.
Fixed costs A variable that counts the mentioning of words related to fixed costs in a
project’s project pitch. The word list related to fixed costs is based on
Cumming et al. (2015) and includes: acquire, building, construct-, develop-,
equipment, fixed cost(s), legal fees, license, machine, manufactur-, mold,
overhead cost(s), patent, permit, produced, production, prototype, purchas-,
rent, R&D, research and development, and tool.
Local housing price index MSA-quarter level Housing Price Index (HPI) published by the Federal
Housing Finance Agency (FHFA), scaled by 1/100. The index is based on
transactions involving conforming, conventional mortgages purchased or
securitized by Fannie Mae or Freddie Mac.
Local SBL supply shock The county-year level weighted average shocks of bank supply of small
business loans with origination amount less than $100k. See Appendix IV for
details on the construction of this variable.
Land supply elasticity ×
national real estate price
The instrument for the Local housing price index. Following Cvijanovic
(2014), it is constructed as the interaction between Saiz (2010) land supply
elasticity and the S&P/Case-Shiller national home price index. This variable
is at the MSA-quarter level.
MSA-level demand for
finance on KS
The logarithm of quarterly aggregate funding target amount on Kickstarter
at the Metro/Micropolitan Statistical Area (MSA) level.
County-level demand for
finance on KS
The logarithm of quarterly aggregate funding target amount on Kickstarter
at the county-level.
58
Unemployment rate Annual MSA- and county-level unemployment rates. Obtained from the Local
Area Uemployment Statistics (LAUS) database of the Bureau of Labor
Statistics.
Population Annual MSA- and county-level population (in logarithm) obtained from the
Beaurea of Economic Analysis (BEA) Regional Economic Accounts.
Income per capita Annual MSA- and county-level income per capital (in logarithm) obtained
from the Beaurea of Economic Analysis (BEA) Regional Economic Accounts.
High homeownership A dummy variable indicating that the zipcode in which an entrepreneur
resides has above median homeownership rate. Zipcode level homeownership
rates are obtained from American Community Survey 2009-2013 5-year Data
Release.
Credit constrained
likelihood
The likelihood that individuals in a zipcode are credit constrained. Following
Jappelli (1990) and Morse (2011), I use the 2010 and 2013 Survey of
Consumer Finances (SCF) to estimate the probability that an individual is
credit constrained as a function of her socioeconomic characteristics. I then
project the relationship onto zipcodes by applying the SCF coefficients to
Census socioeconomic variables observed at the zipcode level. This variable
is at the zipcode-year level.

59
Appendix II: Additional Tables
Table A1. Validating the instrument.
Panel A. The importance of local backers
This table presents the average percentage of backers in the same city or state as the entrepreneur. For each
project, I compute the percentages of backers who are located in the same city or the same state as the
entrepreneur. I then average this percentage across projects for projects in different categories.
Project category All projects Unfunded projects
same state same city same state same city
Art 34.0% 23.9% 35.8% 24.7%
Comics 18.6% 13.6% 23.0% 16.0%
Dance 38.1% 24.6% 40.0% 26.5%
Product and design 18.1% 12.7% 20.8% 14.4%
Fashion and apparel 27.3% 18.3% 30.3% 20.2%
Film and video 30.6% 20.1% 33.2% 21.7%
Food and restaurants 36.8% 25.7% 37.8% 26.2%
Games 14.4% 10.8% 19.2% 13.8%
Music 31.2% 19.8% 34.1% 21.5%
Photography 28.5% 19.4% 29.1% 20.1%
Publishing 27.5% 18.8% 29.8% 20.1%
Technology 16.1% 12.3% 18.3% 14.5%
Theater 38.1% 26.0% 39.1% 25.2%
Total 29.2% 19.5% 30.3% 20.2%
Panel B. Weather and time on computer for leisure: Evidence from American Time Use Survey
This table uses the American Time Use survey to study the effect of weather on individuals’ time spent on the
computer for leisure. The sample includes all individuals in American Time Use Survey from 2003 to 2015
with non-missing MSA information and weather data on the interview day. Weather is measured on the
interview day at the MSA level. Weather data are from the Integrated Surface Database (ISD) from the
National Oceanic and Atmosphere Administration (NOAA). Standard errors are clustered at the MSA level.
Time spent on computer for leisure
Cloudcover 0.061***
[0.018]
Precipitation 0.362**
[0.140]
Controls
House hold size, number of kids, house hold type
FE, family income, age, age2, gender FE, race
FE, marital status FE, immigration status FE,
education FE, labor status FE, occupation FE,
year FE, MSA × month FE, day of week FE.
Observations 49,396 48,357
Adjusted R2 0.264 0.264

60
Panel C. Weather and Facebook sharing of Kickstarter projects
This table presents the effect of weather on the number of Facebook shares received by Kickstarter projects.
The first column includes all unfunded projects. The second column includes both funded and unfunded
projects. Cloudcover is the average deseasoned cloud cover over a project’s funding window within 100
kilometers of the entrepreneur’s location. Control variables are the same as those used in Table 3. Standard
errors are clustered at the project type level. *, **, and *** denote significance at the 10%, 5%, and 1% levels,
respectively.
Ln(1+no. of Facebook shares)
Unfunded projects All projects
Cloudcover 0.017*** 0.044***
[0.005] [0.004]
Other controls Yes Yes
Project type FE Yes Yes
Year-quarter FE Yes Yes
MSA FE Yes Yes
Observations 70,722 127,317
Adjusted R2 0.266 0.295
Panel D. Weather and strategic timing of project launch.
This table examines whether entrepreneurs strategically time the launch of their projects on days with certain
weather conditions. The sample is at the MSA-day level from May 1st 2009 to April 1st 2014 covering 885 MSAs
in USA. Dependent variables are the logarithmic number of projects launched and total funding target amount
asked on each MSA-day. Standard errors are clustered at the MSA level.
Ln(1+no. of
projects)
Ln(1+aggregate
target amount)
Cloudcover -0.007 -0.082
[0.006] [0.065]
Day of week FE Yes Yes
Year-quarter FE Yes Yes
MSA FE Yes Yes
Observations 1,416,315 1,416,315
Adjusted R2 0.429 0.307

61
Table A2. First stage results for the instrument
Panel A. Weather measured over working and non-working hours
This table presents the first stage effect of the weather instrument (and its variants) on the pledging outcome
of all unfunded projects on Kickstarter for which I have non-missing weather data. Cloudcover is constructed
from weather reported in all hours of a day. Cloudcover_nonworktime is constructed from weather reported
from 6pm to 12am on Monday to Friday and from 9am to 12am on weekends. Cloudcover_worktime is
constructed from weather reported from 9am to 5pm on Monday to Friday. Control variables are the same as
those used in Tables 2 and 3. Standard errors are clustered at the project type level. *, **, and *** denote
significance at the 10%, 5%, and 1% levels, respectively.
Ln(pledged amount) Ln(no. of backers)
Cloudcover 0.088*** 0.065***
[0.010] [0.006]
Cloudcover_nonworktime 0.091*** 0.067***
[0.010] [0.007]
Cloudcover_worktime 0.058*** 0.045***
[0.007] [0.005]
Other controls Yes Yes Yes Yes Yes Yes
Project type FE Yes Yes Yes Yes Yes Yes
Year-quarter FE Yes Yes Yes Yes Yes Yes
MSA FE Yes Yes Yes Yes Yes Yes
Observations 70,722 70,722 70,722 70,722 70,722 70,722
Adjusted R2 0.295 0.295 0.294 0.310 0.310 0.309
Panel B. More local and less local projects
This table presents the effect of the instrument on subsamples of unfunded projects that are more local and
less local based on the average percentage of local backers presented in Panel A of Table A1. More local projects
include Theater, Dance, Food and restaurants, Music, Films and videos, and Art. Less local projects include
Games, Technology, Product and design, Fashion, Comics, Publishing, and Photography. Specification is the
same as that used in Panel A of Table A2. Standard errors are clustered at the project type level. *, **, and
*** denote significance at the 10%, 5%, and 1% levels, respectively.
Ln(pledged amount)
More local projects Less local projects
Cloudcover 0.101*** 0.067***
[0.008] [0.010]
Other controls Yes Yes
Project type FE Yes Yes
Year-quarter FE Yes Yes
MSA FE Yes Yes
Observations 29,875 40,849
Adjusted R2 0.247 0.377

62
Panel C. Weather and the intensive margins of backing
This table presents the effect of weather on the intensive margins of backing, i.e. the average amount pledged
by per backer, the average number of comments posted per backer, and a backers’ sentiment measure
constructed from text-analyzing their comments following the methodology in Tetlock (2007). Specification is
the same as that used in Panel A of Table A2. Columns 1 and 2 include all unfunded projects that received a
positive pledged amount. Column 3 includes all unfunded projects that have received comments from the
backers. Standard errors are clustered at the project type level. *, **, and *** denote significance at the 10%,
5%, and 1% levels, respectively.
Ln(pledged amount per
backer)
(1)
Ln(no. of comments per
backer)
(2)
Backers'
sentiment
(3)
Cloudcover -0.000 -0.001 0.003
[0.003] [0.001] [0.010]
Other controls Yes Yes Yes
Project type FE Yes Yes Yes
Year-quarter FE Yes Yes Yes
MSA FE Yes Yes Yes
Observations 59,880 59,880 17,974
Adjusted R2 0.178 0.046 0.029

63
Table A3. Continuation on Kickstarter and Project Scale Adjustment: Alternative
Sample
This table reproduces Table 2 Panel B and Table 3 on the subsample of projects in more product-oriented
sectors, i.e. projects in “Product and design”, “Fashion and apparel”, “Food and restaurant”, “Games”,
“Publishing”, and “Technology”. Standard errors are clustered at the project type level. *, **, and *** denote
significance at the 10%, 5%, and 1% levels, respectively.
Launch again
Project similarity
(conditional on
launching again)
Ln(target amount) of
the next same-type
project
OLS IV OLS IV OLS IV
(1) (2) (3) (4) (5) (6)
Ln(pledged amount) 0.007*** 0.029*** 0.002** 0.025** 0.066*** 0.541**
[0.001] [0.010] [0.001] [0.013] [0.008] [0.251]
Other controls Yes Yes Yes Yes Yes Yes
Project type FEs Yes Yes Yes Yes Yes Yes
Year-quarter FEs Yes Yes Yes Yes Yes Yes
MSA × month FEs Yes Yes Yes Yes Yes Yes
Observations 18,565 18,565 4,459 4,459 3,410 3,410
Adjusted R2 0.015 0.015 0.301 0.300 0.374 0.372
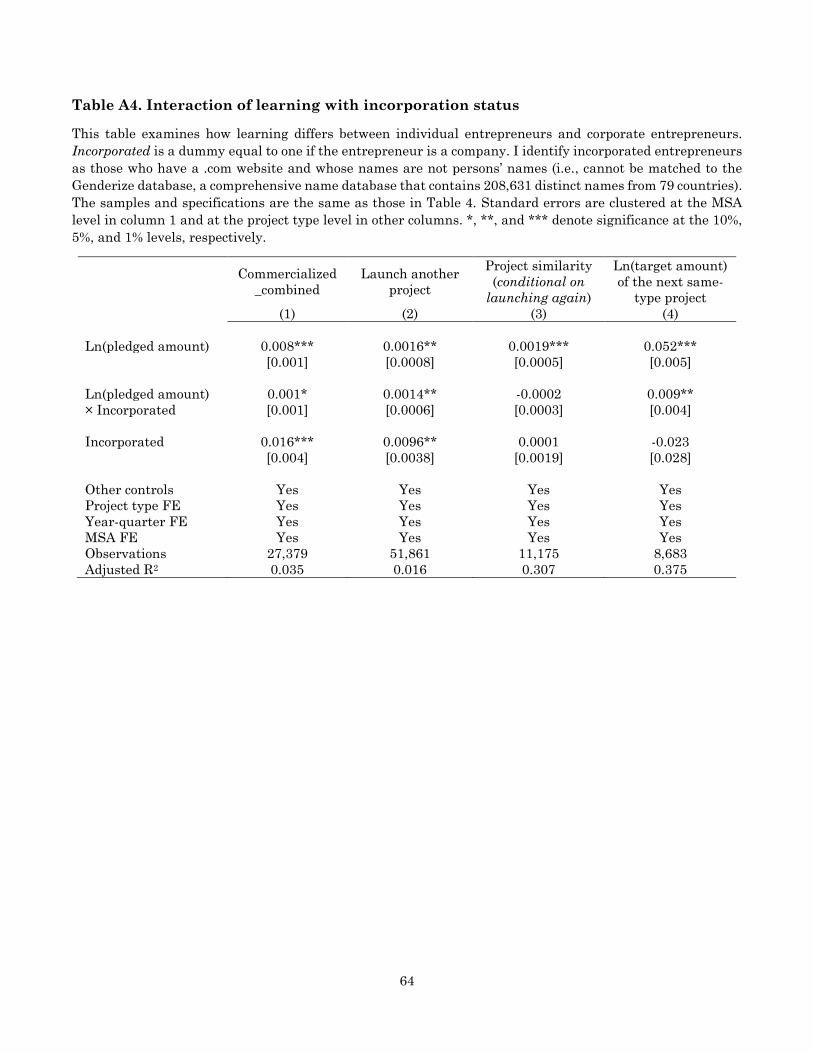
64
Table A4. Interaction of learning with incorporation status
This table examines how learning differs between individual entrepreneurs and corporate entrepreneurs.
Incorporated is a dummy equal to one if the entrepreneur is a company. I identify incorporated entrepreneurs
as those who have a .com website and whose names are not persons’ names (i.e., cannot be matched to the
Genderize database, a comprehensive name database that contains 208,631 distinct names from 79 countries).
The samples and specifications are the same as those in Table 4. Standard errors are clustered at the MSA
level in column 1 and at the project type level in other columns. *, **, and *** denote significance at the 10%,
5%, and 1% levels, respectively.
Commercialized
_combined
Launch another
project
Project similarity
(conditional on
launching again)
Ln(target amount)
of the next same-
type project
(1) (2) (3) (4)
Ln(pledged amount) 0.008*** 0.0016** 0.0019*** 0.052***
[0.001] [0.0008] [0.0005] [0.005]
Ln(pledged amount) 0.001* 0.0014** -0.0002 0.009**
× Incorporated [0.001] [0.0006] [0.0003] [0.004]
Incorporated 0.016*** 0.0096** 0.0001 -0.023
[0.004] [0.0038] [0.0019] [0.028]
Other controls Yes Yes Yes Yes
Project type FE Yes Yes Yes Yes
Year-quarter FE Yes Yes Yes Yes
MSA FE Yes Yes Yes Yes
Observations 27,379 51,861 11,175 8,683
Adjusted R2 0.035 0.016 0.307 0.375

65
Table A5. Local Borrowing Costs and the Feedback Value of Crowdfunding: Alternative
Subsamples
Panel A reproduces Table 7 dropping projects that likely face predominantly local demands, i.e. projects in
“Food and restaurant”, “Fashion and apparel”, “Dance”, and “Theatre”. Panel B reproduces Table 7 focusing
on projects in more product-oriented sectors such as “Product and design”, “Fashion and apparel”, “Food and
restaurant”, “Games”, “Publishing”, and “Technology”. All specifications are the same as those used in Table
7. *, **, and *** denote significance at the 10%, 5%, and 1% levels, respectively.
Panel A. Excluding projects with local demand
Project novelty Experience index Fixed costs
OLS IV OLS IV OLS IV
Local housing price index 0.017*** 0.034*** -0.084** -0.359*** 0.296*** 0.453**
[0.003] [0.007] [0.036] [0.124] [0.075] [0.205]
First stage: Land supply elasticity -0.332*** -0.332*** -0.332***
×national real estate price [0.054] [0.054] [0.054]
Local controls Yes Yes Yes Yes Yes Yes
MSA FE Yes Yes Yes Yes Yes Yes
Year-quarter FE Yes Yes Yes Yes Yes Yes
Project type FE Yes Yes Yes Yes Yes Yes
No. of observations 89,075 89,075 89,075 89,075 89,075 89,075
Adjusted R2 0.016 0.016 0.036 0.036 0.257 0.257
Project novelty Experience index Fixed costs
Local SBL supply shock 0.013*** -0.128*** 0.137***
[0.004] [0.032] [0.047]
Local controls Yes Yes Yes
Year-quarter FE Yes Yes Yes
Project type FE Yes Yes Yes
No. of observations 102,557 102,557 102,557
Adjusted R2 0.001 0.026 0.250

66
Panel B. Projects in more product-oriented sectors
Project novelty Experience index Fixed costs
OLS IV OLS IV OLS IV
Local housing price index 0.023*** 0.042*** -0.100** -0.232* 0.269** 0.382*
[0.004] [0.011] [0.048] [0.130] [0.136] [0.218]
First stage: Land supply elasticity -0.374*** -0.374*** -0.374***
×national real estate price [0.048] [0.048] [0.048]
Local controls Yes Yes Yes Yes Yes Yes
MSA FE Yes Yes Yes Yes Yes Yes
Year-quarter FE Yes Yes Yes Yes Yes Yes
Project type FE Yes Yes Yes Yes Yes Yes
No. of observations 35,968 35,968 35,968 35,968 35,968 35,968
Adjusted R2 0.018 0.018 0.040 0.040 0.278 0.278
Project novelty Experience index Fixed costs
Local SBL supply shock 0.014*** -0.130*** 0.232**
[0.005] [0.050] [0.093]
Local controls Yes Yes Yes
Year-quarter FE Yes Yes Yes
Project type FE Yes Yes Yes
No. of observations 40,744 40,744 40,744
Adjusted R2 0.002 0.027 0.269

67
Table A6. Local Borrowing Costs and Kickstarter Entrepreneurs’ Likelihood of Being Credit
Constrained
Panel A. Constructing zipcode-level likelihood of credit constraint
Following Jappelli (1990) and Morse (2011), I use the Survey of Consumer Finances (SCF) to estimate the
probability that an individual is credit constrained as a function of her socioeconomic characteristics. I then
project the relationship onto zipcodes by applying the SCF coefficients to Census socioeconomic variables
observed at the zipcode level. I use SCF data from 2010 and 2013. I use three proxies for credit constraint
available in SCF: Denied credit, At credit limit, and Behind on payment. I estimate the three models separately
and then project them to annual Census data at the zipcode level (available from American Community
Survey). I standardize each of the three estimated probabilities and then take their average to arrive at my
final Credit constrained likelihood measure.
Census:
Proportion in Zipcode
SCF Logit:
Denied credit
SCF Logit:
At credit limit
SCF Logit:
Behind on payments
$ 0 ≤ household income < $ 10,000 0.075 0.326*** 0.214*** 0.194*** $ 10,000 ≤ household income < $ 15,000 0.060 0.340*** 0.315*** 0.218*** $ 15,000 ≤ household income < $ 25,000 0.120 0.313*** 0.276*** 0.200*** $ 25,000 ≤ household income < $ 35,000 0.114 0.322*** 0.307*** 0.218*** $ 35,000 ≤ household income < $ 50,000 0.147 0.302*** 0.334*** 0.224*** $ 50,000 ≤ household income < $ 75,000 0.189 0.236*** 0.256*** 0.196*** $ 75,000 ≤ household income < $100,000 0.119 0.202*** 0.262*** 0.156*** $100,000 ≤ household income < $150,000 0.108 0.152*** 0.135*** 0.110*** $150,000 ≤ household income < $200,000 0.035 0.087*** 0.118*** 0.041*** $200,000 ≤ household income 0.033 -- -- -- Unemployed persons 0.089 0.037*** 0.003 0.032*** 0 ≤ persons’ age < 20 0.249 0.251*** 0.115*** 0.028 20 ≤ persons’ age < 25 0.060 0.278*** 0.116*** 0.134*** 25 ≤ persons’ age < 35 0.112 0.361*** 0.077*** 0.160*** 35 ≤ persons’ age < 45 0.122 0.379*** 0.059*** 0.198*** 45 ≤ persons’ age < 55 0.152 0.311*** 0.063*** 0.171*** 55 ≤ persons’ age < 65 0.140 0.286*** 0.046*** 0.116*** 65 ≤ persons’ age < 75 0.092 0.132*** 0.036*** 0.046*** 75 ≤ persons’ age 0.072 -- -- -- Less than high school 0.148 0.073*** 0.012*** 0.019*** High school graduate 0.343 0.083*** 0.019*** 0.042*** Attend some college 0.223 0.108*** 0.032*** 0.080*** Associate degree 0.084 0.047*** 0.036*** 0.050*** Bachelor’s degree 0.131 0.026*** 0.012*** 0.012** Graduate degree 0.071 -- -- -- Homeowning households 0.739 -0.074*** -0.009*** -0.015*** $ 0 ≤ Shelter costs < $ 300 0.163 -0.102*** -0.015*** -0.042*** $ 300 ≤ Shelter costs < $ 500 0.163 -0.066*** -0.007*** -0.013** $ 500 ≤ Shelter costs < $ 700 0.144 -0.053*** 0.003 -0.011** $ 700 ≤ Shelter costs < $1,000 0.173 -0.057*** 0.003 -0.007 $1,000 ≤ Shelter costs < $2,000 0.257 -0.045*** 0.002 -0.003 $2,000 ≤ Shelter costs 0.100 -- -- -- Owns 1+ Vehicles 0.787 0.009** 0.004*** 0.003 Female persons 0.499 0.012*** 0.008*** 0.010*** Non-white persons 0.159 0.057*** 0.001 0.010*** Person per household = 1 0.265 -0.069*** -0.007*** -0.054*** Person per household = 2 0.371 -0.044*** -0.007*** -0.031*** Person per household = 3 0.150 -0.000 0.001 -0.001 Person per household ≥ 4 0.215 -- -- -- Married persons 0.533 -0.041*** 0.000 -0.015***
Observations in SCF 62,485 62,485 62,485 Percentage correctly predicted by logit 0.767 0.939 0.854 Adjusted R2 0.155 0.105 0.098

68
Panel B. Local borrowing costs and crowdfunding entrepreneurs’ likelihood of being credit
constrained
This table examines the effect of local borrowing costs on Kickstarter entrepreneurs’ likelihood of being credit
constrained. Credit constrained likelihood is at the zipcode-year level and is the average of the three estimated
probabilities in Panel A: Denied credit, At credit limit, and Behind on payments. Samples and specifications
are the sample as those used in Table 7.
Credit constrained
likelihood
OLS IV
(1) (2)
Local housing price index 0.004 -0.011
[0.003] [0.010]
First stage: Land supply elasticity -0.304***
× national real estate price [0.043]
Local controls Yes Yes
MSA FE Yes Yes
Year-quarter FE Yes Yes
Project type FE Yes Yes
No. of observations 105,061 105,061
Adjusted R2 0.585 0.573
Credit constrained
likelihood
Local SBL supply shock 0.014
[0.016]
Local controls Yes
Year-quarter FE Yes
Project type FE Yes
No. of observations 120,719
Adjusted R2 0.011

69
Table A7. Validation of key measures
In Panel A, projects (both funded and unfunded) are sorted into quintiles based on the value of Project novelty
and Experience index, respectively. Higher quintile number correspond to a higher value of these measures. I
then tabulate the mean and the standard deviation of the funding outcome ln(pledge ratio) in each quintile for
each sorting variable. Panel B sorts project categories by the average of the Jockey measure and the average
of the Fixed costs measure.
Panel A. Validating uncertainty measures
Sorting variable:
Project novelty
Sorting variable:
Experience index
Quintiles Mean of Std. dev. of Mean of Std. dev. of
ln(pledge ratio) ln(pledge ratio) ln(pledge ratio) ln(pledge ratio)
1 -1.390 1.880 -1.683 1.997
2 -1.449 1.900 -1.516 1.966
3 -1.523 1.921 -1.532 1.936
4 -1.639 1.963 -1.497 1.906
5 -1.725 2.020 -1.441 1.859
Panel B. Mean of Jockey and Fixed cost by project categories
Project category
in descending order
Mean of
Jockey
Project category
in descending order
Mean of
Fixed costs
Music 1.949 Technology 4.325
Dance 0.573 Product and design 4.154
Theater 0.206 Games 2.953
Fashion and apparel 0.094 Food and restaurant 2.735
Food and restaurant -0.021 Fashion and apparel 2.260
Film and video -0.140 Film and video 2.162
Publishing -0.270 Theater 1.967
Art -0.286 Art 1.707
Photography -0.494 Dance 1.608
Comics -0.588 Photography 1.448
Product and design -1.473 Publishing 1.273
Technology -2.292 Comics 1.267
Games -2.315 Music 1.114

70
Appendix III. Identifying the Feedback Value of Crowdfunding: Theoretical Framework
In this appendix, I demonstrate how I identify the feedback value of crowdfunding in simple
theoretical framework featuring learning and real option.
Entrepreneur 𝑖 has a prior belief 𝜇𝑖 about the profit of her project, which is equal to an uncertain
gross profit (revenue minus variable cost), 𝑠𝑖, minus a constant fixed cost, 𝐼𝑖 . Following earlier work
on learning (Jovanovic 1979), I assume 𝑠𝑖 is normally distributed with mean �̅� and precision ℎ0:
𝑠𝑖~𝑁 (�̅�, 1
ℎ0). Therefore 𝜇𝑖~𝑁 (�̅�,
1
ℎ0), where �̅� = �̅� − 𝐼𝑖. I also assume that, on average, a project is
profitable, i.e., �̅� > 0. The entrepreneur chooses between crowdfunding and bank borrowing to
finance her project. The crowd provides a feedback 𝑓𝑖𝑐 that is an imperfect signal of 𝜇𝑖 with
precision ℎ𝑐 : 𝑓𝑖𝑐|𝜇𝑖~𝑁 (𝜇𝑖 ,
1
ℎ𝑐). The bank also provides a feedback 𝑓𝑖
𝑏 with the same mean but a
different precision ℎ𝑏: 𝑓𝑖𝑏|𝜇𝑖~𝑁 (𝜇𝑖 ,
1
ℎ𝑏). After receiving feedback from either the bank or the crowd,
the entrepreneur updates her belief and makes her commercialization decision. Crowdfunding gives
the entrepreneur an ex-ante value of
𝑉𝑖𝑐 = 𝐸{𝑀𝑎𝑥[0, 𝐸(𝜇𝑖|𝑓𝑖
𝑐)] − 𝑅𝑖𝑐}, (1)
and bank borrowing gives her an ex-ante value of
𝑉𝑖𝑏 = 𝐸{𝑀𝑎𝑥[0, 𝐸(𝜇𝑖|𝑓𝑖
𝑏)] −𝑅𝑖𝑏}. (2)
Both values are equal to the expected maximum of the outside option (assumed to be zero) and the
updated expected profit 𝐸(𝜇𝑖|𝑓𝑖), minus the cost of accessing the respective type of finance, 𝑅𝑖.36 The
entrepreneur chooses crowdfunding over bank borrowing if and only if 𝑉𝑖𝑐 > 𝑉𝑖
𝑏, i.e.,
𝑂𝑖 = 𝐸{𝑀𝑎𝑥[0, 𝐸(𝜇𝑖|𝑓𝑖𝑐)] − 𝑀𝑎𝑥[0, 𝐸(𝜇𝑖|𝑓𝑖
𝑏)]} > 𝐸[𝑅𝑖𝑐 − 𝑅𝑖
𝑏] = 𝐹𝑖, (3)
where 𝑂𝑖 is the (relative) feedback value of crowdfunding, and 𝐹𝑖 is the (relative) financing cost of
crowdfunding.
It can be proven that the following predictions obtain if and only if crowdfunding provides more
precise feedback than the bank, i.e., ℎ𝑐 > ℎ𝑏:
36 Crowdfunding costs include, among other things, the 5% fee to Kickstarter, 3% to 5% payment processing fee to Amazon
Payment, overheads from preparing for the campaign, costs of procuring, producing, and shipping the rewards, as well as
the price discount of rewards relative to their future market value.

71
i) The feedback value of crowdfunding 𝑂𝑖 is positive;
ii) The feedback value of crowdfunding 𝑂𝑖 decreases in entrepreneur’s prior precision ℎ0;
iii) The feedback value of crowdfunding 𝑂𝑖 increases in the project’s fixed costs 𝐼𝑖;
iv) Let 𝐸𝑖(. ) denote the average across individuals. A decrease in bank borrowing cost 𝑅𝑖𝑏 for a
non-empty set of individuals {𝑖} will increase the average feedback value for entrepreneurs
who choose crowdfunding 𝐸𝑖[𝑂𝑖|𝑂𝑖 > 𝐹𝑖], leading to an increase in these entrepreneurs’ prior
precisions 𝐸𝑖[ℎ0|𝑂𝑖 > 𝐹𝑖] or their projects’ fixed costs 𝐸𝑖[𝐼𝑖|𝑂𝑖 > 𝐹𝑖].
Prediction iv) says that entrepreneurs who choose crowdfunding on average derive higher option
value from feedback when the local borrowing cost decreases. This is because, as crowdfunding
becomes relatively more costly, only entrepreneurs who benefit enough from learning select into
crowdfunding, i.e., those who face higher uncertainty or higher fixed costs. In other words, cheaper
local credit attracts away entrepreneurs who crowdfund mainly for money and teases out those who
crowdfund for feedback. This therefore generates the following testable hypothesis: When local
borrowing costs decrease so that crowdfunding becomes relatively more costly, entrepreneurs who
remain using crowdfunding will shift to those facing higher uncertainty or proposing projects with
higher fixed costs.
Proofs:
i) Following DeGroot (1970), the entrepreneur’s posterior expectation after receiving feedback
from crowdfunding is 𝜇𝑓 = 𝐸(𝜇𝑖|𝑓𝑖𝑐) =
ℎ0
ℎ0+ℎ𝑐× �̅� +
ℎ𝑐
ℎ0+ℎ𝑐× 𝑓𝑖
𝑐, with a posterior variance 𝑉𝑎𝑟(𝜇𝑖|𝑓𝑖𝑐) =
1
ℎ0+ℎ𝑐.
By variance decomposition, the variance of her posterior expectation is
𝑉𝑎𝑟[𝐸(𝜇𝑖|𝑓𝑖𝑐)] = 𝑉𝑎𝑟[𝜇𝑖] − 𝐸[𝑉𝑎𝑟(𝜇𝑖|𝑓𝑖
𝑐)] =1
ℎ0−
1
ℎ0+ℎ𝑐=
ℎ𝑐
(ℎ0+ℎ𝑐)ℎ0 (4)
Therefore we have 𝐸(𝜇𝑖|𝑓𝑖𝑐)~𝑁(�̅�, 𝜎𝑐
2) and 𝐸(𝜇𝑖|𝑓𝑖𝑏)~𝑁(�̅�, 𝜎𝑏
2), where 𝜎𝑐2 =
ℎ𝑐
(ℎ0+ℎ𝑐)ℎ0 and 𝜎𝑏
2 =ℎ𝑏
(ℎ0+ℎ𝑏)ℎ0.
Writing 𝜎𝑐 as 𝜎𝑐 = [(ℎ0
ℎ𝑐+ 1)ℎ0]−
1
2, it can be shown that
∂ 𝜎𝑐
∂ℎ0< 0,
∂ 𝜎𝑐
∂ℎc> 0. (5)
Using the equation for the expectation of a truncated normal distribution (Greene 2008), it can be
shown that
𝐸{𝑀𝑎𝑥[0, 𝐸(𝜇𝑖|𝑓𝑖𝑐)]} = 𝐹(�̅�, 𝜎𝑐) = �̅� + 𝜎𝑐𝜆 (
�̅�
𝜎𝑐), (6)
where 𝜆 (�̅�
𝜎𝑐) = 𝜙(
�̅�
𝜎𝑐)/𝛷(
�̅�
𝜎𝑐) is the inverse Mill’s ratio, 𝜙(. ) is the probability density function of

72
standard normal distribution, and 𝛷(. ) is the cumulative density function of standard normal
distribution.
Taking the first order derivative of 𝐹(�̅�, 𝜎𝑐) w.r.t. 𝜎𝑐, we have
∂𝐹(�̅�,𝜎𝑐)
∂𝜎𝑐= 𝜆(
�̅�
𝜎𝑐)[1 +
�̅�
𝜎𝑐(
�̅�
𝜎𝑐+ 𝜆 (
�̅�
𝜎𝑐))]. (7)
Applying the Mill’s ratio inequality from Gordon (1941): 𝑥
𝑥2+1
1
√2𝜋𝑒
−𝑥2
2 ≤1
√2𝜋∫ 𝑒
−𝑡2
2∞
𝑥≤
1
𝑥
1
√2𝜋𝑒
−𝑥2
2 for 𝑥 >
0, it is immediate that 1 +�̅�
𝜎𝑐(
�̅�
𝜎𝑐+ 𝜆 (
�̅�
𝜎𝑐)) > 0. Since 𝜆 (
�̅�
𝜎𝑐) > 0, we have
∂𝐹(�̅�,𝜎𝑐)
∂𝜎𝑐> 0. Given
∂ 𝜎𝑐
∂ℎc> 0, we
also have ∂𝐹(�̅�, 𝜎𝑐)
∂ℎc> 0. I therefore proved that 𝑂𝑖 = 𝐹(�̅�, 𝜎𝑐) − 𝐹(�̅�, 𝜎𝑏) > 0 if and only if ℎ𝑐 > ℎ𝑏.
ii) Writing 𝑂𝑖 as
𝑂𝑖 = 𝐹(�̅�, 𝜎𝑐) − 𝐹(�̅�, 𝜎𝑏) ≈ [𝜎𝑐 − 𝜎𝑏]∂𝐹(�̅�,𝜎𝑐)
∂𝜎𝑐 (8)
Since ∂ 𝜎𝑐
∂ℎ0< 0, and 𝜎𝑐 − 𝜎𝑏 > 0 if and only if ℎ𝑐 > ℎ𝑏, to prove that 𝑂𝑖 decreases in ℎ0 if and only if ℎ𝑐 >
ℎ𝑏, I only need to prove ∂2𝐹(�̅�,𝜎𝑐)
∂𝜎𝑐2 >0.
It can be shown that
∂2𝐹(�̅�,𝜎𝑐)
∂𝜎𝑐2 = (
�̅�
𝜎𝑐)
2 1
𝜎𝑐𝜆 (
�̅�
𝜎𝑐) [(𝜆 (
�̅�
𝜎𝑐) +
�̅�
𝜎𝑐) (2 ∗ 𝜆 (
�̅�
𝜎𝑐) +
�̅�
𝜎𝑐) − 1] (9)
Using the Mill’s ratio inequality from Sampford (1953): 𝜆(𝑥)[(𝜆(𝑥) + 𝑥)(2𝜆(𝑥) + 𝑥) − 1] > 0 for all
finite 𝑥, it immediately follows that ∂2𝐹(�̅�,𝜎𝑐)
∂𝜎𝑐2 > 0.
iii) Since �̅� = �̅� − 𝐼, and 𝜎𝑐 − 𝜎𝑏 > 0 if and only if ℎ𝑐 > ℎ𝑏, to prove that 𝑂𝑖 increase in 𝐼𝑖 if and only
if ℎ𝑐 > ℎ𝑏, I only need to prove ∂2𝐹(�̅�,𝜎𝑐)
∂𝜎𝑐 ∂�̅�< 0.
It can be shown that
∂2𝐹(�̅�,𝜎𝑐)
∂𝜎𝑐 ∂�̅�= −
�̅�
𝜎𝑐2 𝜆 (
�̅�
𝜎𝑐) [(𝜆 (
�̅�
𝜎𝑐) +
�̅�
𝜎𝑐) (2 ∗ 𝜆 (
�̅�
𝜎𝑐) +
�̅�
𝜎𝑐) − 1] (10)
Applying the Mill’s ratio inequality from Sampford (1953), it follows that ∂2𝑉(�̅�,𝜎𝑐)
∂𝜎𝑐 ∂�̅�< 0 when �̅� > 0.
iv) A decrease in 𝑅𝑖𝑏 for a non-empty set of {𝑖} increases the (relative) financing cost of
crowdfunding 𝐹𝑖 and therefore the lower bound in the conditional expectation 𝐸𝑖[𝑂𝑖|𝑂𝑖 > 𝐹𝑖]. This
increases the value of 𝐸𝑖[𝑂𝑖|𝑂𝑖 > 𝐹𝑖]. Given (ii) and (iii), a decrease in 𝐸𝑖[ℎ0|𝑂𝑖 > 𝐹𝑖] will be observed
if and only if ℎ𝑐 > ℎ𝑏, and an increase in 𝐸𝑖[𝐼𝑖|𝑂𝑖 > 𝐹𝑖] will be observed if and only if ℎ𝑐 > ℎ𝑏.

73
References:
Gordon, Robert D., 1941, Values of Mills' Ratio of Area to Bounding Ordinate and of the Normal
Probability Integral for Large Values of the Argument, The Annals of Mathematical Statistics Vol.
12, No. 3, 364-366.
Greene, William H., 2008, Econometric Analysis, 6th Edition, Prentice Hall.
Sampford, M. R., 1953, Some Inequalities on Mill's Ratio and Related Functions, The Annals of
Mathematical Statistics Vol. 24, No. 1, 130-132.

74
Appendix IV. Estimating Local Small Business Loan Supply Shocks
As an alternative measure of shocks to local borrowing costs of entrepreneurs, I use detailed bank-
county level small business lending data to estimate local lending supply shocks that are separate
from local demand shocks. I employ a decomposition method developed by Amiti and Weinstein
(2013) (see Flannery and Lin (2015) and Greenstone, Mas, and Nguyen (2015) for recent
applications).
The small business loan data come from the Federal Financial Institutions Examination
Council (FFIEC). 37 Under the Community Reinvestment Act (CRA), all financial institutions
regulated by the Office of the Comptroller of the Currency, Federal Reserve System, Federal Deposit
Insurance Corporation, and the Office of Thrift Supervision that meet the asset size threshold are
subject to data collection and reporting requirements. Each bank reports its small business lending
data in each county it operates. The loan data is further decomposed into four categories based on
the loan amount at origination: $250K to $1 million, $100K to $250K, and below $100K. I focus on
loans smaller than $100K as 97% Kickstarter projects have funding targets lower than this amount.
I start by writing the growth in bank-county level lending as the following.
, , , , , ,c b t c t b t c b tg (1)
, where gc,b,t is the growth rate of small business loans extend by bank b to county c from year t – 1
to year t, αc,t captures credit demand shocks in county c, and βb,t captures credit supply shocks for
bank b. εc,b,t is the error term and E(εc,b,t) = 0.
Aggregating equation (1) to county level by weighted-averaging across banks yields
, , , , , 1 ,c b t c t c b t b t
b
GC . (2)
Aggregating equation (1) to bank level by weighted-averaging across counties yields
, , , , , 1 ,c b t b t c b t c t
c
GB .
(3)
GCc,b,t is the growth rate of borrowing of county c from all of its banks from year t – 1 to year t, GBc,b,t
is the growth rate of lending of bank b to all of its counties from year t – 1 to year t, θc,b,t−1 is the
37 CRA defines a small business loan as any loan to a business in an original amount of $1 million or less, excluding loans
to farms or secured by farm or any residential properties.

75
share of bank b’s loans obtained by county c in year t – 1, and φc,b,t−1 is the share of county c’s loans
obtained from bank b in year t – 1.38
Equations (2) and (3) provide a system of C + B equations and C + B unknowns in each time
period that enables solving for a unique set of county (αc,t) and bank shocks (βb,t) (up to a numéraire)
in each period, where C is the total number of counties and B is the total number of banks.39 The
estimated bank shocks (βb,t) can then be aggregated to the county-level based on banks’ lending
shares in each county to form an estimate of county-level local small business loan supply shocks:
Local SBL supply shockc,t = , , 1 ,c b t b t
b
(4)
In solving the system of equations in (2) and (3), I follow Flannery and Lin (2015) and drop,
for each year, banks and counties whose total growth in small business loans are above the 99th
percentile to minimize the influence of extreme values. To efficiently solve the system, I also ignore,
for each bank, the counties whose loans account for less than 1% of lending by this bank, and for
each county the banks whose lending account for less than 1% of the loans to that county. Eventually,
I end up with estimates of local demand shocks for 3,054 counties and estimates of credit supply
shocks for 2,328 banks from 2002 to 2013. The correlation between estimated loan supply shocks
and the actual growth rate in lending in my sample is 0.56, which is close to the correlation of 0.62
reported in Flannery and Lin (2015). To put the local supply shock measure in perspective, Figure
A1 in Appendix V plots the median, 5th percentile, and 95th percentile of Local SBL supply shock
over 2002-2013. Figure A2 in Appendix V shows the geographic distribution of average Local SBL
supply shock over financial crisis years 2008-2010. The temporal and spatial distributions of Local
SBL supply shock are largely consistent with our knowledge of bank lending during the financial
crisis.
38 Since θc,b,t-1 and φc,b,t-1 are predetermined variables, we can impose the following moment conditions on the data. E [∑b
θc,b,t−1 εc,b,t ] = ∑b θc,b,t−1E [εc,b,t ] = 0, and E [∑c φc,b,t−1 εc,b,t ] = ∑c φc,b,t−1E [εc,b,t ] = 0. 39 For detailed illustration of the decomposition and the estimation method, see Appendix 1.1 of Amiti and Weinstein
(2013).

76
Appendix V. Additional Figures
Figure A1. Temporal distribution of local small business loan supply shocks
This graph plots the median and the 5th and 95th percentile of county-level small business loan supply shocks
for each year over the period 2002-2013.
Figure A2. Geographic distribution of small business loan supply shocks during
financial crisis years (2008-2010)
This map plots the county-level distribution of small business loan supply shocks over the financial crisis years
2008 to 2010. For each county, I compute the average small business loan supply shock over 2008-2010.
Counties are then divided into five quintiles, with darker-colored counties associated with more positive supply
shocks and lighter-colored counties associated with more negative supply shocks.
-1.5
-1.2
-0.9
-0.6
-0.3
0
0.3
0.6
0.9
1.2
1.5
2002 2003 2004 2005 2006 2007 2008 2009 2010 2011 2012 2013
Local small business loan supply shock
5th percentile 50th percentile 95th percentile