Which updates during an equity crowdfunding campaign ... · Which updates during an equity...
25
Which updates during an equity crowdfunding campaign increase crowd participation? Jörn Block & Lars Hornuf & Alexandra Moritz Accepted: 30 March 2017 /Published online: 24 May 2017 # The Author(s) 2017. This article is an open access publication Abstract Start-ups often post updates during equity crowdfunding campaigns. However, little is known about the effects of such updates on crowd participation. We investigate this question by using hand-collected data from 71 funding campaigns and 39,399 investment decisions on two German equity crowdfunding portals. Using a com- bination of different empirical research techniques, we find that posting an update has a significant positive effect on the number of investments made by the crowd and the investment amount collected by the start-up. This effect does not occur immediately in its entirety; rather, it lags the update by a few days. Furthermore, the effect of updates loses statistical significance with the number of updates posted during a campaign. We also find that an easier language used in updates increases crowd participation, whereas the length of updates has no effects. With respect to the update’ s content, we find that the positive effect can be attributed to updates about new developments of the start-up such as campaign developments, new funding, business developments, and cooperation projects. Updates on the start-up team, business model, product develop- ments, and promotional campaigns do not have meaning- ful effects. Our paper contributes to the literature on the effects of information disclosure on equity crowdfunding participation. Furthermore, our results have practical im- plications for start-ups and their investor communication during equity crowdfunding campaigns. Keywords Crowdfunding . Entrepreneurial finance . Updates . Investor communication 1 Introduction Equity crowdfunding is an important tool for young and innovative start-ups to collect early-stage funding. Prior research has investigated the success drivers of equity crowdfunding campaigns and has shown that informa- tion provided by the start-up, such as the human and social capital of the founders, risks involved, and finan- cial projections, have a positive influence on campaign Small Bus Econ (2018) 50:3–27 DOI 10.1007/s11187-017-9876-4 J. Block : A. Moritz Department of Management, University of Trier, Universitätsring 15, 54296 Trier, Germany J. Block e-mail: [email protected] A. Moritz e-mail: [email protected] J. Block Department of Applied Economics, Erasmus University Rotterdam, P.O. Box 1738, 3000 DR Rotterdam, Netherlands J. Block Erasmus Research Institute of Management (ERIM), Erasmus University Rotterdam, P.O. Box 1738, 3000 DR Rotterdam, Netherlands L. Hornuf University of Trier, Department of Economics, Behringstrasse 21, 54296 Trier, Germany L. Hornuf (*) Max Planck Institute for Innovation and Competition, Marstallplatz 1, 80539 Munich, Germany e-mail: [email protected]
Transcript of Which updates during an equity crowdfunding campaign ... · Which updates during an equity...
Which updates during an equity crowdfunding campaignincrease crowd participation?
Jörn Block & Lars Hornuf & Alexandra Moritz
Accepted: 30 March 2017 /Published online: 24 May 2017# The Author(s) 2017. This article is an open access publication
Abstract Start-ups often post updates during equitycrowdfunding campaigns. However, little is known aboutthe effects of such updates on crowd participation. Weinvestigate this question by using hand-collected data from71 funding campaigns and 39,399 investment decisions ontwo German equity crowdfunding portals. Using a com-bination of different empirical research techniques, we findthat posting an update has a significant positive effect onthe number of investments made by the crowd and the
investment amount collected by the start-up. This effectdoes not occur immediately in its entirety; rather, it lags theupdate by a few days. Furthermore, the effect of updatesloses statistical significance with the number of updatesposted during a campaign. We also find that an easierlanguage used in updates increases crowd participation,whereas the length of updates has no effects. With respectto the update’s content, we find that the positive effect canbe attributed to updates about new developments of thestart-up such as campaign developments, new funding,business developments, and cooperation projects. Updateson the start-up team, business model, product develop-ments, and promotional campaigns do not have meaning-ful effects. Our paper contributes to the literature on theeffects of information disclosure on equity crowdfundingparticipation. Furthermore, our results have practical im-plications for start-ups and their investor communicationduring equity crowdfunding campaigns.
Keywords Crowdfunding . Entrepreneurial finance .
Updates . Investor communication
1 Introduction
Equity crowdfunding is an important tool for young andinnovative start-ups to collect early-stage funding. Priorresearch has investigated the success drivers of equitycrowdfunding campaigns and has shown that informa-tion provided by the start-up, such as the human andsocial capital of the founders, risks involved, and finan-cial projections, have a positive influence on campaign
Small Bus Econ (2018) 50:3–27DOI 10.1007/s11187-017-9876-4
J. Block :A. MoritzDepartment of Management, University of Trier, Universitätsring15, 54296 Trier, Germany
J. Blocke-mail: [email protected]
A. Moritze-mail: [email protected]
J. BlockDepartment of Applied Economics, Erasmus UniversityRotterdam, P.O. Box 1738, 3000 DR Rotterdam, Netherlands
J. BlockErasmus Research Institute of Management (ERIM), ErasmusUniversity Rotterdam, P.O. Box 1738, 3000 DR Rotterdam,Netherlands
L. HornufUniversity of Trier, Department of Economics, Behringstrasse 21,54296 Trier, Germany
L. Hornuf (*)Max Planck Institute for Innovation and Competition,Marstallplatz 1, 80539 Munich, Germanye-mail: [email protected]
success (Ahlers et al. 2015; Moritz et al. 2015; Vismara2016b; Polzin et al. 2017). This information usuallydoes not change during a crowdfunding campaign andis typically provided by the start-up before a campaignstarts.
Our paper takes a more dynamic perspective than priorresearch by investigating the role of updates provided bystart-ups during an equity crowdfunding campaign. Weanalyze how start-ups can use updates during the campaignto encourage the crowd to provide funding. This particulardeterminant of equity crowdfunding participation has beenoverlooked in the literature so far, and as such, there is animportant gap on the effects of information disclosure oncrowd participation (Ahlers et al. 2015; Moritz et al. 2015;Bernstein et al. 2017; Vismara 2016b; Polzin et al. 2017).Updates enable start-ups to signal their value to the crowdand to establish credibility and legitimacy during acrowdfunding campaign. We investigate three researchquestions: First, we analyze whether updates and theirfrequency have an influence on crowd participation andwhether the effect occurs immediately or in a lagged form(Research Question 1 (RQ1)). Second, we investigate howthe language complexity used in the updates and the lengthof the updates affect crowd participation (Research Ques-tion 2 (RQ2)). And finally, we look at the content of theseupdates to determine how the crowd reacts to differentsignals and information communicated via updates (Re-search Question 3 (RQ3)). Thus, we not only look at theeffects of updates on funding participation per se but also atthe effects of specific update characteristics and contents.
To answer our research questions, we investigate up-dates posted by start-ups during an equity crowdfundingcampaign by using hand-collected data from 71 fundingcampaigns and 39,399 investment decisions on two Ger-man equity crowdfunding portals. We find an overallpositive effect of posting an update on the number ofinvestments by the crowd and the investment amountcollected by the start-up. However, this positive effect doesnot occur immediately in its entirety; rather, it lags a fewdays behind the respective update. The effect increaseswith the ease of language used in the update. Furthermore,we find that the first updates have positive but only mar-ginally significant effects, while the later updates have nosignificant effects on crowd participation. Large differ-ences exist when distinguishing updates according to theircontent. Updates that deal with the start-up team, businessmodel, product developments, and campaign promotionsdo not have meaningful effects on crowd participation.Instead, positive effects on funding participation can be
attributed to updates about campaign development, newfunding, business developments, and cooperation projects.
Our paper contributes to the entrepreneurial financeliterature (for recent overviews see Block et al. 2017a, b).In particular, we contribute to research on the selectioncriteria of early-stage investors looking at a new type ofinvestor—the crowd. It has been found that specific infor-mation, such as education of the entrepreneurial team,protection of intellectual property rights, the venture’snetwork, and firm alliances, are important drivers for theinvestment decisions of professional early-stage investorssuch as venture capital funds (Audretsch et al. 2012; Baumand Silverman 2004; Block et al. 2014, 2017a, b; Busenitzet al. 2005; Franke et al. 2008; Jell et al. 2011). It has alsobeen shown that start-ups use this information to signaltheir value to investors (Audretsch et al. 2012; Block et al.2014; Connelly et al. 2011). Hence, our paper contributesto research about signals in entrepreneurial finance bylooking at the specific context of crowdfunding andcrowdinvestors as a new type of venture investor. Further-more, we add to the growing research on crowdfundingand in particular on equity crowdfunding. Our paper ex-tends this literature by taking a dynamic perspective, in-vestigating how start-ups can signal their value during acrowdfunding campaign using updates as communicationtools to increase the likelihood of successful campaigns.
In addition to its contribution to the academic literature,our paper’s results also have practical implications forstart-ups and crowdfunding platforms. For start-ups, it isworthwhile to learn more about the effects of updates onequity crowdfunding participation. By posting updates,start-ups can actively influence the chances of successfullycompleting their equity crowdfunding campaigns. Ourresults show, for example, that the specific content of anupdate is key, while simply posting more updates has littleeffect. Knowingwhich updates drive funding participationis crucial for start-ups to design an effective and successfulcommunication in equity crowdfunding campaigns. Forplatforms, this information is important to encourage start-ups to publish updates with content valued by the crowd toincrease the likelihood of a successful campaign and ulti-mately, the platforms’ own business success.
The remainder of the paper is organized as follows. Thenext section provides the theoretical framework of ourstudy and develops hypotheses. Section 3 introduces thedata sources and the research techniques used to code andcategorize the updates posted by the start-ups during thecampaigns. Based on this, we introduce the variables usedin the regression analysis and explain our empirical model.
4 Block et al.
Section 4 presents the descriptive and multivariate results.The final two sections discuss our results, link them to thecrowdfunding and entrepreneurial finance literatures, andsummarize our contributions to theory and practice.
2 Theoretical framework and hypotheses
2.1 Signaling theory
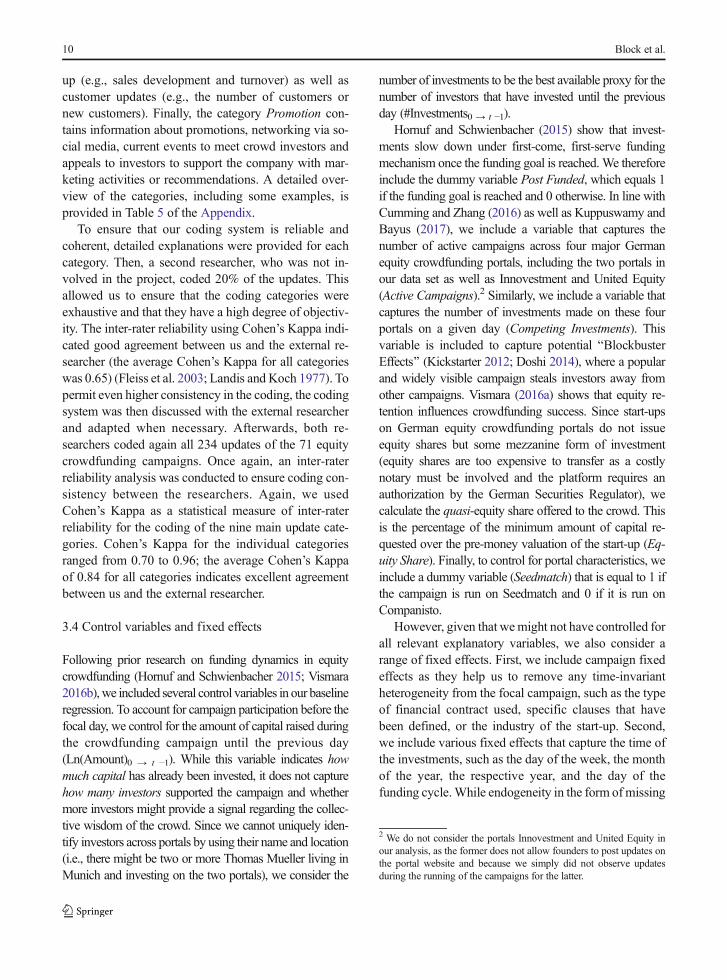
Our theoretical framework is based on signaling theory,which is primarily concerned with reducing informationasymmetries between two parties, where the better in-formed party sends a quality signal to the less informedparty (Connelly et al. 2011). In a seminal article, Spence(1973) applied this theory to the labor market, demonstrat-ing how job applicants can use their higher education aseffective signals to reduce their potential employers’ infor-mation deficits. Since then, signaling theory has been usedin various research fields such as strategic management,entrepreneurship, labor economics, and human resourcemanagement (Connelly et al. 2011). The core concept ofsignaling theory is summarized in Fig. 1. The key elementsare the signaler, the signal, the receiver, and the signalingenvironment. Signalers are information insiders who pos-sess private information about an individual, a product, oran organization that is not available to outsiders (Spence1973; Connelly et al. 2011). Signalers deliberately sendpositive signals to information outsiders to reduce informa-tion asymmetries and cause a reaction by the receiver, forexample, the investment in a company (Certo 2003;Busenitz et al. 2005). However, for signals to be effective,they need to fulfill twomain characteristics: First, they needto be observable because otherwise they would not beperceived by the receiver. Second, signals need to be costly,otherwise theywould be too easy to fake or imitate (Spence1973). Signaler and receiver have—at least in part—con-flicting interests: The signaler would gain from sendinginferior signals and therefore has an incentive to deceivethe receiver (Ross 1977). As receivers are disadvantaged byacting on false signals, they learn to ignore these signals andperceive the signaler as dishonest (Connelly et al. 2011).
Signal effectiveness can be enhanced by communicatingsignals frequently and with a high signal consistency(Janney and Folta 2003; Fischer and Reuber 2014). Thisincreases the chances that receivers capture the signal andare not confused by different signal contents (Gulati andHiggins 2003; Gao et al. 2008). This is directly related tothe role of receivers’ characteristics for signal effectiveness
(Perkins and Hendry 2005). In addition to the requiredattention of receivers to capture the signal, different re-ceivers are likely to interpret signals differently (PerkinsandHendry 2005). This signal translationmight even resultin a diversion of the signals’ original intent (Branzei et al.2004; Highhouse et al. 2007). Hence, signal clarity isanother important characteristic of a signal so that thesignaler can achieve the desired effect (Certo 2003;Warner et al. 2006). In this context, countersignals sendby receivers as feedback to the signaler can provide addi-tional information about the effectiveness of the signal(Srivastava 2001; Connelly et al. 2011). Finally, the signal-ing environment can influence the signals’ effectiveness.Distortions of the signal can occur, for example, wheneverthe signal medium reduces its observability (Carter 2006;Fischer and Reuber 2014). In addition, other receivers’interpretation can affect the effectiveness of signals. If anumber of receivers interpret signals in a specific way, thismight lead to imitation by others (McNamara et al. 2008;Connelly et al. 2011).
2.2 Updates by the start-ups as signals in crowdfunding
2.2.1 Visibility of updates and its effects on crowdparticipation
In the context of entrepreneurial finance, informationasymmetries between a start-up’s management team andpotential investors play a major role. Ventures need tofind a way to signal their quality to potential investors toestablish legitimacy and credibility and to receive fi-nancing (Rao et al. 2008; Zimmerman and Zeitz2002). In the specific setting of crowdfunding, start-ups aim to collect capital from a large number of mostlyanonymous investors, who contribute small amounts ofmoney via the Internet (Moritz et al. 2015; Belleflammeet al. 2014; Hemer et al. 2011; Hornuf andSchwienbacher 2016). The average crowdfunding in-vestor is not likely to have the time, capacity, andincentive to investigate firms and their business modelin detail (Ahlers et al. 2015; Lukkarinen et al. 2016).Due to the specific characteristics of crowdfunding,establishing personal relationships to reduce informa-tion asymmetries typical for business angel or venturecapital investments (Landström 1992; Sapienza andKorsgaard 1996; Kollmann and Kuckertz 2006) is notfeasible in equity crowdfunding markets. Hence, com-panies need to find alternative ways to communicatetheir value to the crowd.
Which updates increase crowd participation? 5
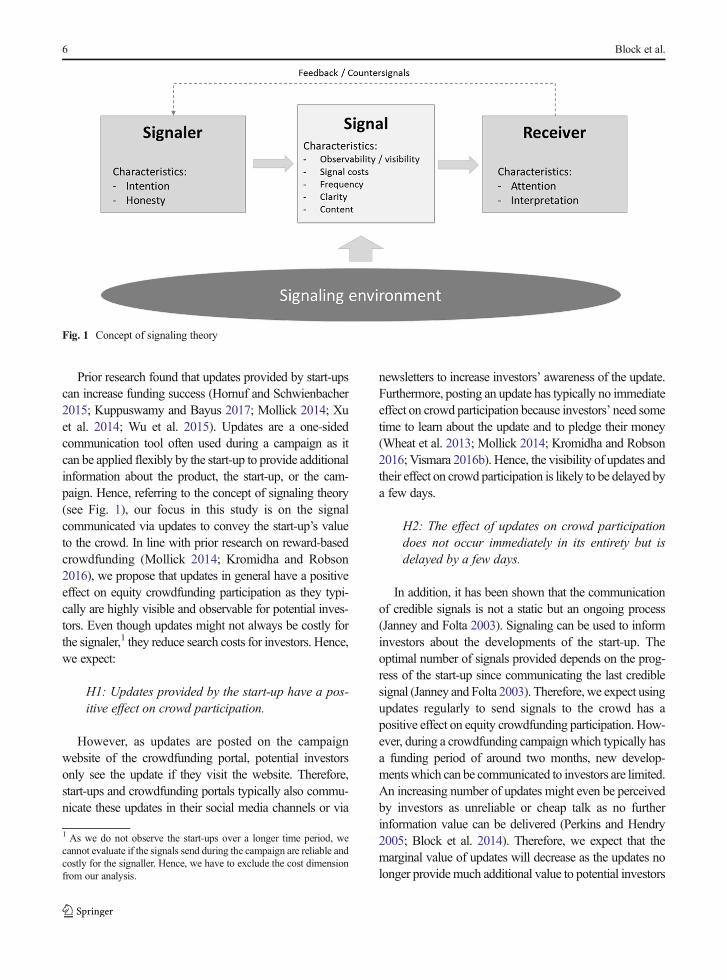
Prior research found that updates provided by start-upscan increase funding success (Hornuf and Schwienbacher2015; Kuppuswamy and Bayus 2017; Mollick 2014; Xuet al. 2014; Wu et al. 2015). Updates are a one-sidedcommunication tool often used during a campaign as itcan be applied flexibly by the start-up to provide additionalinformation about the product, the start-up, or the cam-paign. Hence, referring to the concept of signaling theory(see Fig. 1), our focus in this study is on the signalcommunicated via updates to convey the start-up’s valueto the crowd. In line with prior research on reward-basedcrowdfunding (Mollick 2014; Kromidha and Robson2016), we propose that updates in general have a positiveeffect on equity crowdfunding participation as they typi-cally are highly visible and observable for potential inves-tors. Even though updates might not always be costly forthe signaler,1 they reduce search costs for investors. Hence,we expect:
H1: Updates provided by the start-up have a pos-itive effect on crowd participation.
However, as updates are posted on the campaignwebsite of the crowdfunding portal, potential investorsonly see the update if they visit the website. Therefore,start-ups and crowdfunding portals typically also commu-nicate these updates in their social media channels or via
newsletters to increase investors’ awareness of the update.Furthermore, posting an update has typically no immediateeffect on crowd participation because investors’ need sometime to learn about the update and to pledge their money(Wheat et al. 2013; Mollick 2014; Kromidha and Robson2016; Vismara 2016b). Hence, the visibility of updates andtheir effect on crowd participation is likely to be delayed bya few days.
H2: The effect of updates on crowd participationdoes not occur immediately in its entirety but isdelayed by a few days.
In addition, it has been shown that the communicationof credible signals is not a static but an ongoing process(Janney and Folta 2003). Signaling can be used to informinvestors about the developments of the start-up. Theoptimal number of signals provided depends on the prog-ress of the start-up since communicating the last crediblesignal (Janney and Folta 2003). Therefore, we expect usingupdates regularly to send signals to the crowd has apositive effect on equity crowdfunding participation. How-ever, during a crowdfunding campaignwhich typically hasa funding period of around two months, new develop-mentswhich can be communicated to investors are limited.An increasing number of updates might even be perceivedby investors as unreliable or cheap talk as no furtherinformation value can be delivered (Perkins and Hendry2005; Block et al. 2014). Therefore, we expect that themarginal value of updates will decrease as the updates nolonger providemuch additional value to potential investors
Fig. 1 Concept of signaling theory
1 As we do not observe the start-ups over a longer time period, wecannot evaluate if the signals send during the campaign are reliable andcostly for the signaller. Hence, we have to exclude the cost dimensionfrom our analysis.
6 Block et al.
(Janney and Folta 2003, 2006; Block et al. 2014). Hence,we suggest that a negative relationship exists between thenumber of updates posted and their effect on crowdparticipation:
H3: The effect of updates on crowd participationdecreases with the number of updates posted by thestart-up.
2.2.2 Clarity of updates and its effects on crowdparticipation
Signaling theory has shown that signals need to be visibleand clear so that market participants are able to capture theinformation content of the signal (Certo 2003;Warner et al.2006). The clarity of the signal directly relates to the inter-pretation by receivers: Members of a group of very hetero-geneous receivers are more likely to translate the signaldifferently (Perkins and Hendry 2005; Connelly et al.2011). As the receivers of signals in crowdfunding marketshave been found to be very heterogeneous (Ahlers et al.2015), the clarity of the signal is particularly important.Clarity, however, depends on the complexity of the lan-guage used in the updates. Hence, we propose that updatesusing a complex language are more difficult to understand,loose clarity and therefore their effectiveness as a signal:
H4: The effect of updates on crowd participationdecreases with the complexity of the language usedin the update.
Furthermore, previous research found that the lengthof descriptions in crowdfunding campaigns have a sig-nificant positive effect on the campaign outcome(Greiner and Wang 2010; Gao and Lin 2014). Longerdescriptions can deliver more information about theproject, the start-up, or the product and can help toreduce information asymmetries between the start-upand potential investors. Hence, we propose:
H5: The effect of updates on crowd participationincreases with the length of the update.
2.2.3 Content of updates and its effects on crowdparticipation
Prior research in entrepreneurial finance found that the contentof signals provided by the start-up plays an important role.
Ventures can use a number of different signals to reduceinformation asymmetries by communicating their value topotential investors, such as the entrepreneurial team educa-tion, intellectual property rights, and the share of retainedequity (Audretsch et al. 2012; Baum and Silverman 2004;Block et al. 2014; Busenitz et al. 2005).
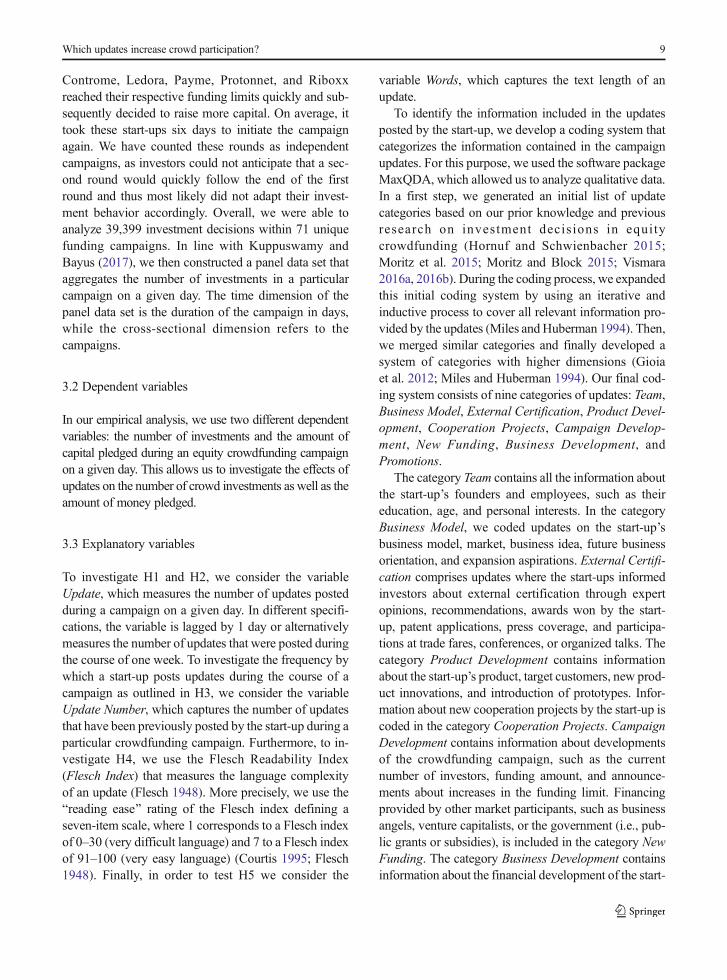
Even though crowdfunding research is still young, anumber of different signals have been found to have apositive effect on crowd participation. However, it needsto be considered that investors’ motivations have beenshown to depend on the specific crowdfunding model(Cholakova and Clarysse 2015; Lukkarinen et al. 2016;Vulkan et al. 2016; Polzin et al. 2017), which suggeststhat the effects of updates and the signals used also differaccording to the crowdfunding model. Focusing onfindings in relation to venture financing with a profitparticipation of investors, the content of these signalscan be roughly summarized into information about thestart-up’s quality (i.e., the management team, its pre-paredness and openness, and the start-up’s financials)and external credentials provided by third parties (i.e.,through social networks, reputable investors, protectionof intellectual property, reception of grants, and thereaction by the crowd). Table 1 provides an overviewof the findings from prior crowdfunding research.
However, none of these studies focuses on the dy-namic aspects of providing new and ongoing signals toinvestors using updates during equity crowdfundingcampaigns. Our study is—to the best of our knowl-edge—the first to look into this important researchquestion.
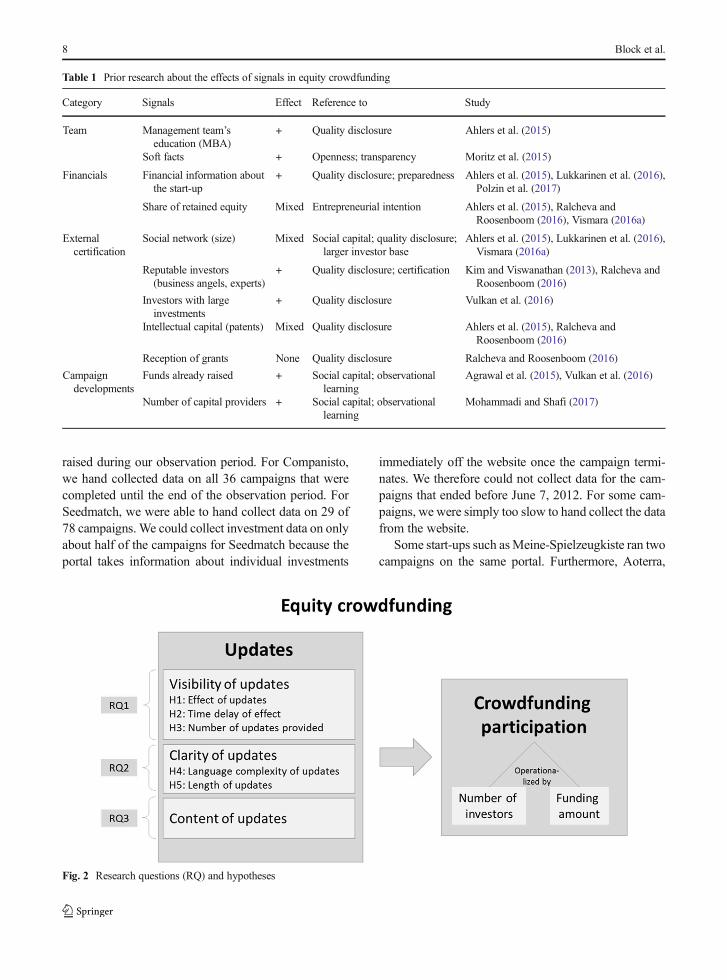
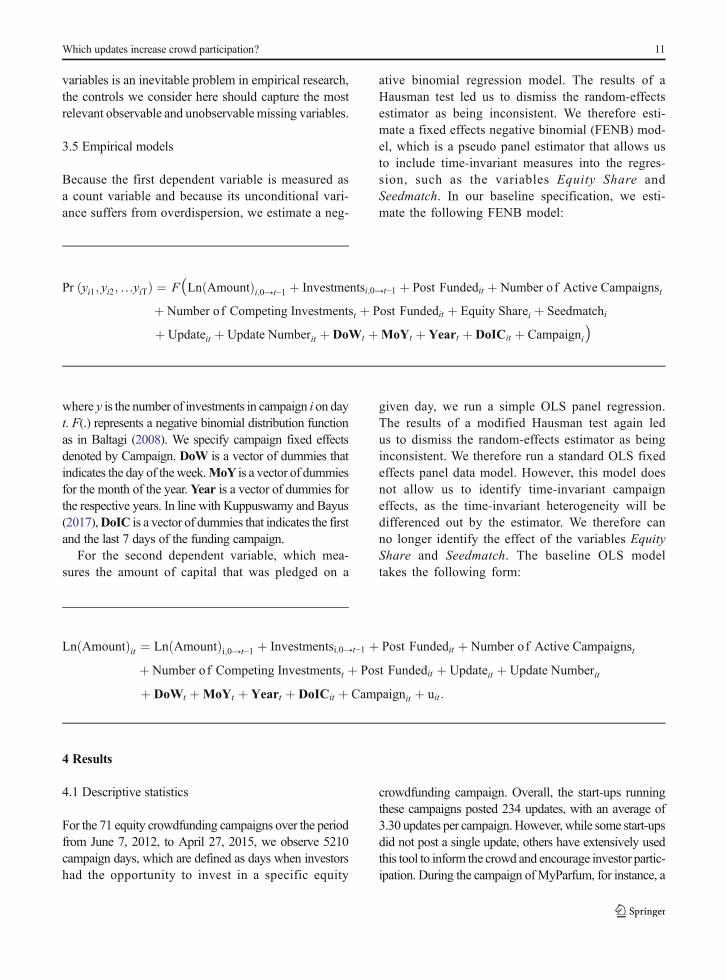
We refrain from ex ante assumptions and use anexploratory approach and formulate the following openresearch question: BHow does the type of content pro-vided in the update influence crowd participation?^.Figure 2 summarizes our three research questions andhypotheses.
3 Data and method
3.1 Data sources
Our empirical analysis uses data from two Germanequity crowdfundingportals over the period from June 7,2012, to April 27, 2015. The two portals are Seedmatchand Companisto, which are important players in theGerman equity crowdfunding market and together rep-resent about 75% of the overall crowdfunding capital
Which updates increase crowd participation? 7
raised during our observation period. For Companisto,we hand collected data on all 36 campaigns that werecompleted until the end of the observation period. ForSeedmatch, we were able to hand collect data on 29 of78 campaigns.We could collect investment data on onlyabout half of the campaigns for Seedmatch because theportal takes information about individual investments
immediately off the website once the campaign termi-nates. We therefore could not collect data for the cam-paigns that ended before June 7, 2012. For some cam-paigns, we were simply too slow to hand collect the datafrom the website.
Some start-ups such asMeine-Spielzeugkiste ran twocampaigns on the same portal. Furthermore, Aoterra,
Table 1 Prior research about the effects of signals in equity crowdfunding
Category Signals Effect Reference to Study
Team Management team’seducation (MBA)
+ Quality disclosure Ahlers et al. (2015)
Soft facts + Openness; transparency Moritz et al. (2015)
Financials Financial information aboutthe start-up
+ Quality disclosure; preparedness Ahlers et al. (2015), Lukkarinen et al. (2016),Polzin et al. (2017)
Share of retained equity Mixed Entrepreneurial intention Ahlers et al. (2015), Ralcheva andRoosenboom (2016), Vismara (2016a)
Externalcertification
Social network (size) Mixed Social capital; quality disclosure;larger investor base
Ahlers et al. (2015), Lukkarinen et al. (2016),Vismara (2016a)
Reputable investors(business angels, experts)
+ Quality disclosure; certification Kim and Viswanathan (2013), Ralcheva andRoosenboom (2016)
Investors with largeinvestments
+ Quality disclosure Vulkan et al. (2016)
Intellectual capital (patents) Mixed Quality disclosure Ahlers et al. (2015), Ralcheva andRoosenboom (2016)
Reception of grants None Quality disclosure Ralcheva and Roosenboom (2016)
Campaigndevelopments
Funds already raised + Social capital; observationallearning
Agrawal et al. (2015), Vulkan et al. (2016)
Number of capital providers + Social capital; observationallearning
Mohammadi and Shafi (2017)
Fig. 2 Research questions (RQ) and hypotheses
8 Block et al.
Controme, Ledora, Payme, Protonnet, and Riboxxreached their respective funding limits quickly and sub-sequently decided to raise more capital. On average, ittook these start-ups six days to initiate the campaignagain. We have counted these rounds as independentcampaigns, as investors could not anticipate that a sec-ond round would quickly follow the end of the firstround and thus most likely did not adapt their invest-ment behavior accordingly. Overall, we were able toanalyze 39,399 investment decisions within 71 uniquefunding campaigns. In line with Kuppuswamy andBayus (2017), we then constructed a panel data set thataggregates the number of investments in a particularcampaign on a given day. The time dimension of thepanel data set is the duration of the campaign in days,while the cross-sectional dimension refers to thecampaigns.
3.2 Dependent variables
In our empirical analysis, we use two different dependentvariables: the number of investments and the amount ofcapital pledged during an equity crowdfunding campaignon a given day. This allows us to investigate the effects ofupdates on the number of crowd investments as well as theamount of money pledged.
3.3 Explanatory variables
To investigate H1 and H2, we consider the variableUpdate, which measures the number of updates postedduring a campaign on a given day. In different specifi-cations, the variable is lagged by 1 day or alternativelymeasures the number of updates that were posted duringthe course of one week. To investigate the frequency bywhich a start-up posts updates during the course of acampaign as outlined in H3, we consider the variableUpdate Number, which captures the number of updatesthat have been previously posted by the start-up during aparticular crowdfunding campaign. Furthermore, to in-vestigate H4, we use the Flesch Readability Index(Flesch Index) that measures the language complexityof an update (Flesch 1948). More precisely, we use theBreading ease^ rating of the Flesch index defining aseven-item scale, where 1 corresponds to a Flesch indexof 0–30 (very difficult language) and 7 to a Flesch indexof 91–100 (very easy language) (Courtis 1995; Flesch1948). Finally, in order to test H5 we consider the
variable Words, which captures the text length of anupdate.
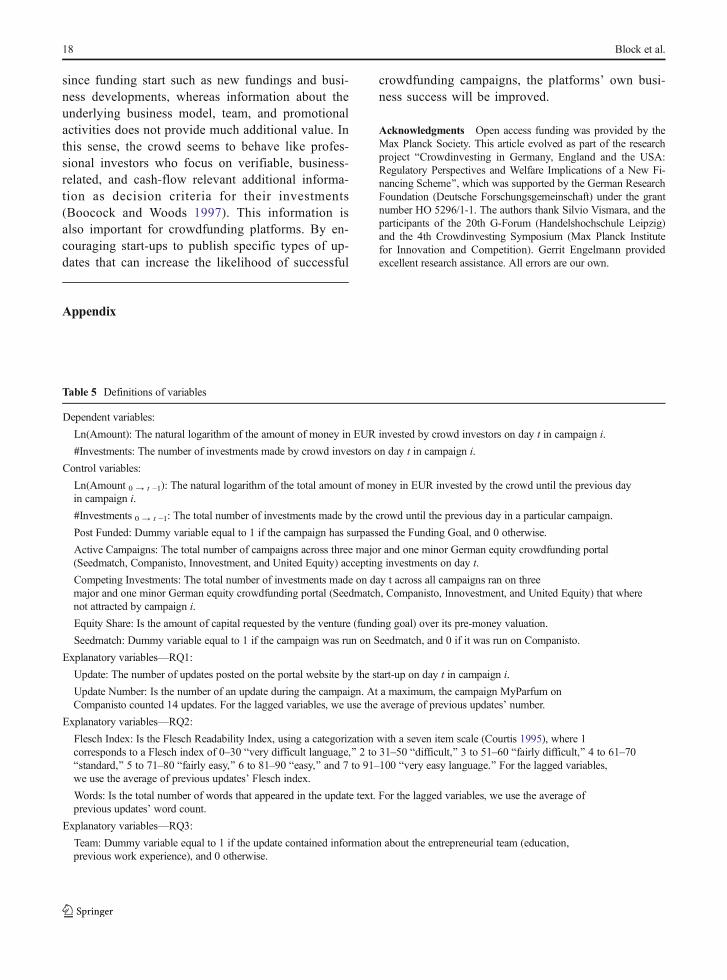
To identify the information included in the updatesposted by the start-up, we develop a coding system thatcategorizes the information contained in the campaignupdates. For this purpose, we used the software packageMaxQDA, which allowed us to analyze qualitative data.In a first step, we generated an initial list of updatecategories based on our prior knowledge and previousresearch on investment decis ions in equitycrowdfunding (Hornuf and Schwienbacher 2015;Moritz et al. 2015; Moritz and Block 2015; Vismara2016a, 2016b). During the coding process, we expandedthis initial coding system by using an iterative andinductive process to cover all relevant information pro-vided by the updates (Miles andHuberman 1994). Then,we merged similar categories and finally developed asystem of categories with higher dimensions (Gioiaet al. 2012; Miles and Huberman 1994). Our final cod-ing system consists of nine categories of updates: Team,Business Model, External Certification, Product Devel-opment, Cooperation Projects, Campaign Develop-ment, New Funding, Business Development, andPromotions.
The category Team contains all the information aboutthe start-up’s founders and employees, such as theireducation, age, and personal interests. In the categoryBusiness Model, we coded updates on the start-up’sbusiness model, market, business idea, future businessorientation, and expansion aspirations. External Certifi-cation comprises updates where the start-ups informedinvestors about external certification through expertopinions, recommendations, awards won by the start-up, patent applications, press coverage, and participa-tions at trade fares, conferences, or organized talks. Thecategory Product Development contains informationabout the start-up’s product, target customers, new prod-uct innovations, and introduction of prototypes. Infor-mation about new cooperation projects by the start-up iscoded in the category Cooperation Projects. CampaignDevelopment contains information about developmentsof the crowdfunding campaign, such as the currentnumber of investors, funding amount, and announce-ments about increases in the funding limit. Financingprovided by other market participants, such as businessangels, venture capitalists, or the government (i.e., pub-lic grants or subsidies), is included in the category NewFunding. The category Business Development containsinformation about the financial development of the start-
Which updates increase crowd participation? 9
up (e.g., sales development and turnover) as well ascustomer updates (e.g., the number of customers ornew customers). Finally, the category Promotion con-tains information about promotions, networking via so-cial media, current events to meet crowd investors andappeals to investors to support the company with mar-keting activities or recommendations. A detailed over-view of the categories, including some examples, isprovided in Table 5 of the Appendix.
To ensure that our coding system is reliable andcoherent, detailed explanations were provided for eachcategory. Then, a second researcher, who was not in-volved in the project, coded 20% of the updates. Thisallowed us to ensure that the coding categories wereexhaustive and that they have a high degree of objectiv-ity. The inter-rater reliability using Cohen’s Kappa indi-cated good agreement between us and the external re-searcher (the average Cohen’s Kappa for all categorieswas 0.65) (Fleiss et al. 2003; Landis and Koch 1977). Topermit even higher consistency in the coding, the codingsystem was then discussed with the external researcherand adapted when necessary. Afterwards, both re-searchers coded again all 234 updates of the 71 equitycrowdfunding campaigns. Once again, an inter-raterreliability analysis was conducted to ensure coding con-sistency between the researchers. Again, we usedCohen’s Kappa as a statistical measure of inter-raterreliability for the coding of the nine main update cate-gories. Cohen’s Kappa for the individual categoriesranged from 0.70 to 0.96; the average Cohen’s Kappaof 0.84 for all categories indicates excellent agreementbetween us and the external researcher.
3.4 Control variables and fixed effects
Following prior research on funding dynamics in equitycrowdfunding (Hornuf and Schwienbacher 2015; Vismara2016b),we included several control variables in our baselineregression. To account for campaign participation before thefocal day, we control for the amount of capital raised duringthe crowdfunding campaign until the previous day(Ln(Amount)0 → t −1). While this variable indicates howmuch capital has already been invested, it does not capturehow many investors supported the campaign and whethermore investors might provide a signal regarding the collec-tive wisdom of the crowd. Since we cannot uniquely iden-tify investors across portals by using their name and location(i.e., there might be two or more Thomas Mueller living inMunich and investing on the two portals), we consider the
number of investments to be the best available proxy for thenumber of investors that have invested until the previousday (#Investments0 → t −1).
Hornuf and Schwienbacher (2015) show that invest-ments slow down under first-come, first-serve fundingmechanism once the funding goal is reached.We thereforeinclude the dummy variable Post Funded, which equals 1if the funding goal is reached and 0 otherwise. In line withCumming and Zhang (2016) as well as Kuppuswamy andBayus (2017), we include a variable that captures thenumber of active campaigns across four major Germanequity crowdfunding portals, including the two portals inour data set as well as Innovestment and United Equity(Active Campaigns).2 Similarly, we include a variable thatcaptures the number of investments made on these fourportals on a given day (Competing Investments). Thisvariable is included to capture potential BBlockbusterEffects^ (Kickstarter 2012; Doshi 2014), where a popularand widely visible campaign steals investors away fromother campaigns. Vismara (2016a) shows that equity re-tention influences crowdfunding success. Since start-upson German equity crowdfunding portals do not issueequity shares but some mezzanine form of investment(equity shares are too expensive to transfer as a costlynotary must be involved and the platform requires anauthorization by the German Securities Regulator), wecalculate the quasi-equity share offered to the crowd. Thisis the percentage of the minimum amount of capital re-quested over the pre-money valuation of the start-up (Eq-uity Share). Finally, to control for portal characteristics, weinclude a dummy variable (Seedmatch) that is equal to 1 ifthe campaign is run on Seedmatch and 0 if it is run onCompanisto.
However, given that wemight not have controlled forall relevant explanatory variables, we also consider arange of fixed effects. First, we include campaign fixedeffects as they help us to remove any time-invariantheterogeneity from the focal campaign, such as the typeof financial contract used, specific clauses that havebeen defined, or the industry of the start-up. Second,we include various fixed effects that capture the time ofthe investments, such as the day of the week, the monthof the year, the respective year, and the day of thefunding cycle.While endogeneity in the form ofmissing
2 We do not consider the portals Innovestment and United Equity inour analysis, as the former does not allow founders to post updates onthe portal website and because we simply did not observe updatesduring the running of the campaigns for the latter.
10 Block et al.
variables is an inevitable problem in empirical research,the controls we consider here should capture the mostrelevant observable and unobservable missing variables.
3.5 Empirical models
Because the first dependent variable is measured asa count variable and because its unconditional vari-ance suffers from overdispersion, we estimate a neg-
ative binomial regression model. The results of aHausman test led us to dismiss the random-effectsestimator as being inconsistent. We therefore esti-mate a fixed effects negative binomial (FENB) mod-el, which is a pseudo panel estimator that allows usto include time-invariant measures into the regres-sion, such as the variables Equity Share andSeedmatch. In our baseline specification, we esti-mate the following FENB model:
Pr yi1; yi2;…yiTð Þ ¼ FðLn Amountð Þi;0→t−1 þ Investmentsi;0→t−1 þ Post Fundedit þ Number of Active Campaignst
þ Number of Competing Investmentst þ Post Fundedit þ Equity Sharei þ Seedmatchi
þ Updateit þ Update Numberit þ DoWt þMoYt þ Yeart þ DoICit þ CampaigniÞ
where y is the number of investments in campaign i on dayt. F(.) represents a negative binomial distribution functionas in Baltagi (2008). We specify campaign fixed effectsdenoted by Campaign. DoW is a vector of dummies thatindicates the day of the week.MoY is a vector of dummiesfor the month of the year.Year is a vector of dummies forthe respective years. In line with Kuppuswamy and Bayus(2017),DoIC is a vector of dummies that indicates the firstand the last 7 days of the funding campaign.
For the second dependent variable, which mea-sures the amount of capital that was pledged on a
given day, we run a simple OLS panel regression.The results of a modified Hausman test again ledus to dismiss the random-effects estimator as beinginconsistent. We therefore run a standard OLS fixedeffects panel data model. However, this model doesnot allow us to identify time-invariant campaigneffects, as the time-invariant heterogeneity will bedifferenced out by the estimator. We therefore canno longer identify the effect of the variables EquityShare and Seedmatch. The baseline OLS modeltakes the following form:
Ln Amountð Þit ¼ Ln Amountð Þi;0→t−1 þ Investmentsi;0→t−1 þ Post Fundedit þ Number of Active Campaignst
þ Number of Competing Investmentst þ Post Fundedit þ Updateit þ Update Numberit
þ DoWt þMoYt þ Yeart þ DoICit þ Campaignit þ uit:
4 Results
4.1 Descriptive statistics
For the 71 equity crowdfunding campaigns over the periodfrom June 7, 2012, to April 27, 2015, we observe 5210campaign days, which are defined as days when investorshad the opportunity to invest in a specific equity
crowdfunding campaign. Overall, the start-ups runningthese campaigns posted 234 updates, with an average of3.30 updates per campaign.However, while some start-upsdid not post a single update, others have extensively usedthis tool to inform the crowd and encourage investor partic-ipation. During the campaign ofMyParfum, for instance, a
Which updates increase crowd participation? 11
total of 14 updates were posted. Interestingly, some updatecategories were posted more frequently than others. Forexample, investors were more often informed about thebusiness model, promotional campaigns, the latest productdevelopments, and the external certifications of the start-upthan about recent campaign developments or the start-upteam. Start-ups rarely disclosed updates on new funding.During most of the campaign days, no update was posted.Every 25 days, start-ups posted an update and occasionallyeven two updates were posted on the same day. The meanupdate contained 289words (median: 248words).
The 71 campaigns in our sample were run by 63 uniquestart-ups. Some start-ups ran multiple campaigns on differ-ent or sometimes the same portal. All of these start-ups arelocatedinGermany.Mostof themoperatein theinformationand communication, wholesale and retail, as well asmanufacturing sectors. Regarding the campaign develop-ment, on 86% of the campaign days, the start-ups hadalready surpassed the funding goal, and the founders of thestart-up thus knew that they would ultimately receive thecapital (Post Funded). Table 2 also shows that, on average,7.56 investments were made on a campaign day and that5886.74 € were pledged by the crowd. On some days, thecrowd invested as much as 1.5 million € in a single cam-paign, while on other days, they withdrew 10,000 € ofinvestments. On average, 436.85 investments were madebefore an investor decided to invest. On a given campaignday,40.37investmentsweremadein theoverallmarket,and6.55 campaignswere run in addition to the campaign underconsideration. Table 6 in the Appendix shows a correlationtable that includes the dependent variables and the mainexplanatory variables.
4.2 Results of the baseline regression models
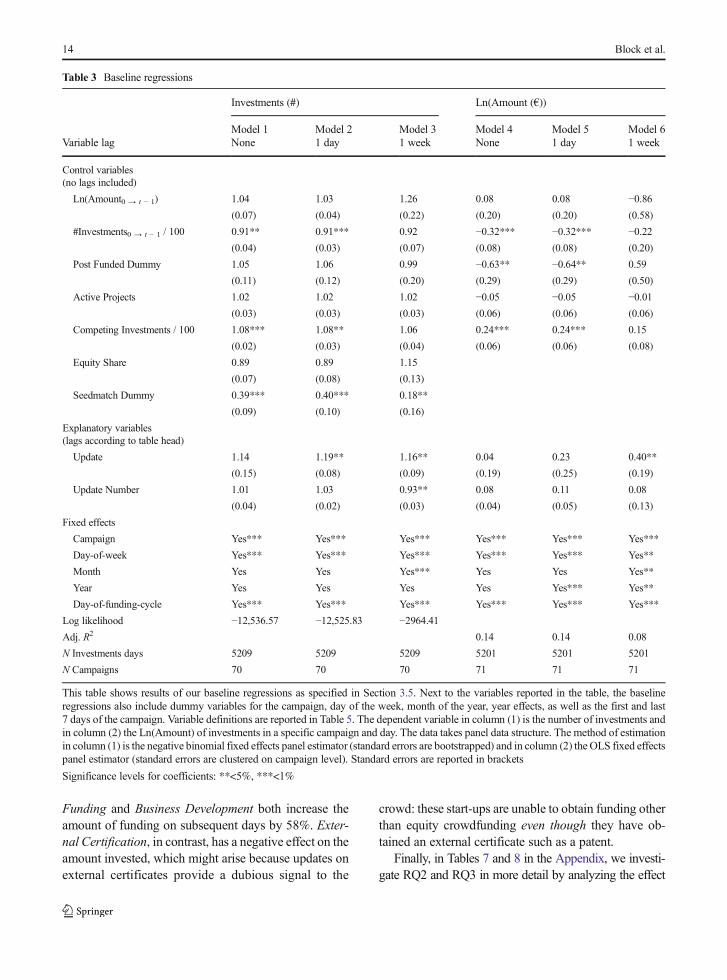
Table 3 shows the regression results for our baselinemodels. For theFENBmodel,we report incident rate ratios,which can be interpreted as multiplicative effects or semi-elasticities.3 In line with prior research (Hornuf and
Schwienbacher 2015), we find that 100 additional invest-ments until the previous day reduce the number of invest-ments on a given day by 9% and the amount invested by32%. Once the campaign was successfully funded, theinvestment amounts on a given day decrease on averageby 63%. Moreover, when other campaigns received 100additional investments, the campaign under considerationreceived 8% more investments and 24% more capital waspledged.This findingmay result fromageneral boom in theequitycrowdfundingsectorafterperiodsofextensivemediacoverage positively reporting about this method of financ-ing. Portal differences exist, with Seedmatch campaigns—dependingon the specification—attractingonaverage60 to82%fewerinvestments thanCompanistocampaigns,whichis most likely due to the fact that the minimum investmentticket ofSeedmatch is 50 times larger than the5€minimumticket of Companisto. Furthermore, while the day of theweek dummies show that less investment activities takeplaceduringtheweekendandthat thecampaigndaysfollowthe L-shaped pattern as described in Hornuf andSchwienbacher (2015), no consistent pattern emerges forany of the other fixed effects.
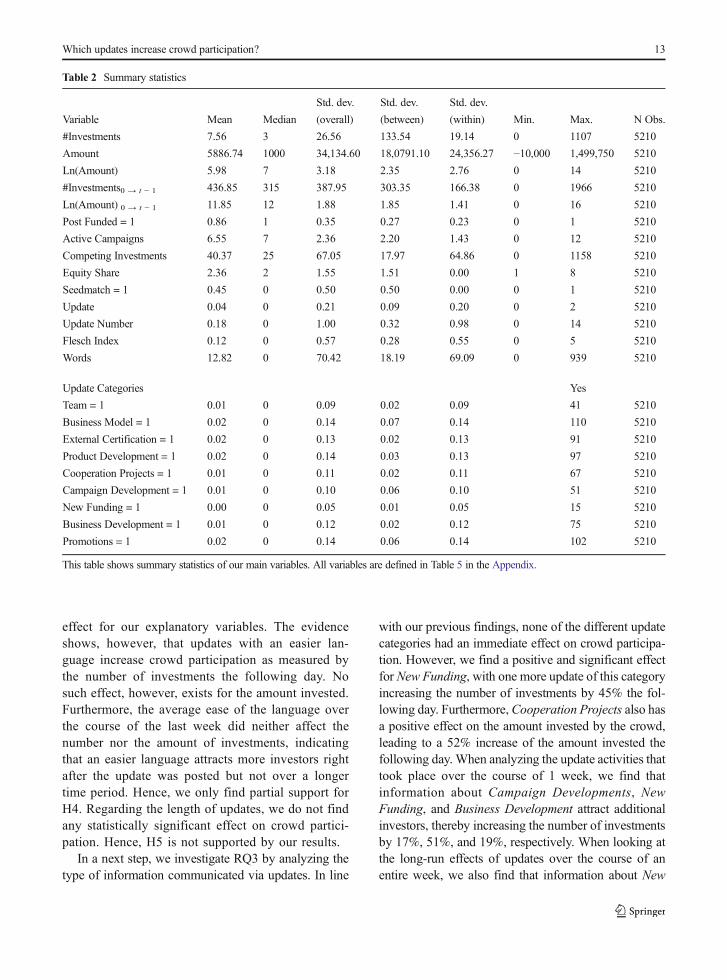
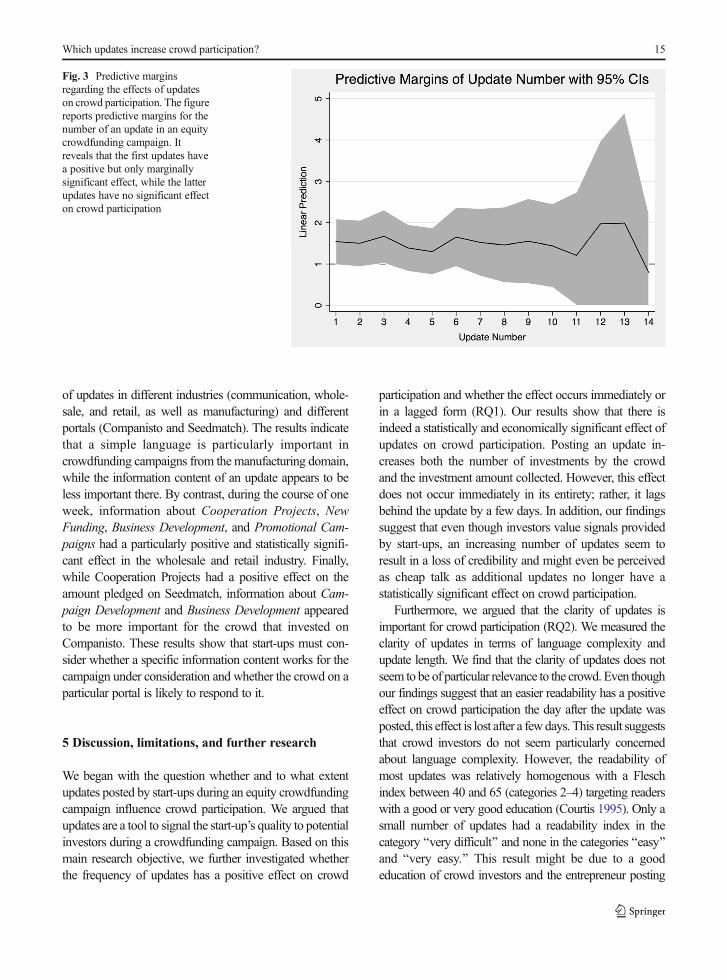
In accordance with H1, we find that updates positivelyinfluence crowd participation. While the effect does nottake place immediately, we locate a significant effect forthe number of investments the following day. Further-more, updates posted over the course of 1 week do notonly influence the number of investments but also theamount invested, with one more update increasing thenumber of investments by 16% and the amount investedby 40%.We interpret this as strong support for our H1 andH2. In a next step, we investigate whether the frequencyby which updates are posted exhibits a particular relation-ship. Figure 3 reports the predictive margins for thenumber of updates posted during a campaign. It showsthat while the effect is positive except for such highnumbers as 14 updates, the standard errors are steadilyincreasing with the number of updates, stifling any statis-tically significant effect as more updates are posted. Thus,we do not find support for H3.
4.3 Update categories and their effect on crowdparticipation
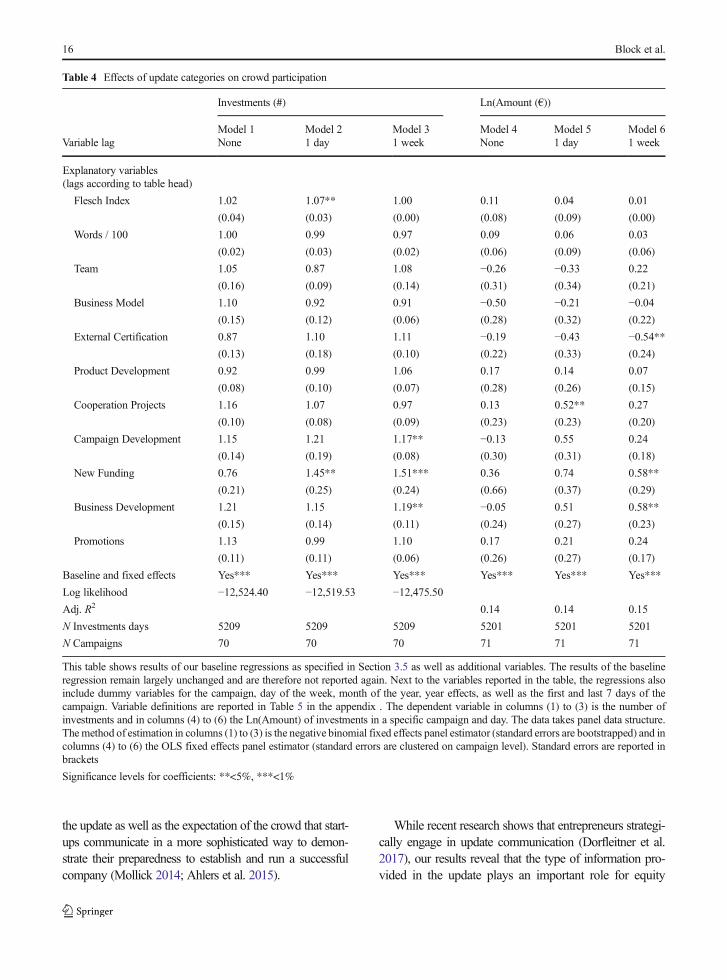
First, as outlined in RQ2 and RQ3, Table 4 investi-gates how the complexity of the language used inupdates, the length of the updates, and the content ofupdates influences crowd participation. As in theprevious regressions, we do not find any immediate
3 For example, the coefficient ofCompeting Investments in Table 3Model1 is 1.08. It indicates that an increase of the explanatory variable (which ismeasured in 100 competing investments) corresponds to a 1.08 timeschange in the dependent variable. In this case, the dependent variable—the number of investments per day—increases by 8% if 100 morecompeting investments are made in other campaigns. On the other hand,the coefficient of #Investments (which is measured in 100 previousinvestments) is 0.91. This time, the coefficient indicates that an increaseof the explanatory variable corresponds to a 0.91 times change in thedependent variable. Thus, the dependent variable decreases by 9% if 100more investments are made by the crowd until the previous day.
12 Block et al.
effect for our explanatory variables. The evidenceshows, however, that updates with an easier lan-guage increase crowd participation as measured bythe number of investments the following day. Nosuch effect, however, exists for the amount invested.Furthermore, the average ease of the language overthe course of the last week did neither affect thenumber nor the amount of investments, indicatingthat an easier language attracts more investors rightafter the update was posted but not over a longertime period. Hence, we only find partial support forH4. Regarding the length of updates, we do not findany statistically significant effect on crowd partici-pation. Hence, H5 is not supported by our results.
In a next step, we investigate RQ3 by analyzing thetype of information communicated via updates. In line
with our previous findings, none of the different updatecategories had an immediate effect on crowd participa-tion. However, we find a positive and significant effectfor New Funding, with one more update of this categoryincreasing the number of investments by 45% the fol-lowing day. Furthermore,Cooperation Projects also hasa positive effect on the amount invested by the crowd,leading to a 52% increase of the amount invested thefollowing day. When analyzing the update activities thattook place over the course of 1 week, we find thatinformation about Campaign Developments, NewFunding, and Business Development attract additionalinvestors, thereby increasing the number of investmentsby 17%, 51%, and 19%, respectively. When looking atthe long-run effects of updates over the course of anentire week, we also find that information about New
Table 2 Summary statistics
Std. dev. Std. dev. Std. dev.
Variable Mean Median (overall) (between) (within) Min. Max. N Obs.
#Investments 7.56 3 26.56 133.54 19.14 0 1107 5210
Amount 5886.74 1000 34,134.60 18,0791.10 24,356.27 −10,000 1,499,750 5210
Ln(Amount) 5.98 7 3.18 2.35 2.76 0 14 5210
#Investments0 → t − 1 436.85 315 387.95 303.35 166.38 0 1966 5210
Ln(Amount) 0 → t − 1 11.85 12 1.88 1.85 1.41 0 16 5210
Post Funded = 1 0.86 1 0.35 0.27 0.23 0 1 5210
Active Campaigns 6.55 7 2.36 2.20 1.43 0 12 5210
Competing Investments 40.37 25 67.05 17.97 64.86 0 1158 5210
Equity Share 2.36 2 1.55 1.51 0.00 1 8 5210
Seedmatch = 1 0.45 0 0.50 0.50 0.00 0 1 5210
Update 0.04 0 0.21 0.09 0.20 0 2 5210
Update Number 0.18 0 1.00 0.32 0.98 0 14 5210
Flesch Index 0.12 0 0.57 0.28 0.55 0 5 5210
Words 12.82 0 70.42 18.19 69.09 0 939 5210
Update Categories Yes
Team = 1 0.01 0 0.09 0.02 0.09 41 5210
Business Model = 1 0.02 0 0.14 0.07 0.14 110 5210
External Certification = 1 0.02 0 0.13 0.02 0.13 91 5210
Product Development = 1 0.02 0 0.14 0.03 0.13 97 5210
Cooperation Projects = 1 0.01 0 0.11 0.02 0.11 67 5210
Campaign Development = 1 0.01 0 0.10 0.06 0.10 51 5210
New Funding = 1 0.00 0 0.05 0.01 0.05 15 5210
Business Development = 1 0.01 0 0.12 0.02 0.12 75 5210
Promotions = 1 0.02 0 0.14 0.06 0.14 102 5210
This table shows summary statistics of our main variables. All variables are defined in Table 5 in the Appendix.
Which updates increase crowd participation? 13
Funding and Business Development both increase theamount of funding on subsequent days by 58%. Exter-nal Certification, in contrast, has a negative effect on theamount invested, which might arise because updates onexternal certificates provide a dubious signal to the
crowd: these start-ups are unable to obtain funding otherthan equity crowdfunding even though they have ob-tained an external certificate such as a patent.
Finally, in Tables 7 and 8 in the Appendix, we investi-gate RQ2 and RQ3 in more detail by analyzing the effect
Table 3 Baseline regressions
Investments (#) Ln(Amount (€))
Model 1 Model 2 Model 3 Model 4 Model 5 Model 6Variable lag None 1 day 1 week None 1 day 1 week
Control variables(no lags included)
Ln(Amount0 → t − 1) 1.04 1.03 1.26 0.08 0.08 −0.86(0.07) (0.04) (0.22) (0.20) (0.20) (0.58)
#Investments0 → t − 1 / 100 0.91** 0.91*** 0.92 −0.32*** −0.32*** −0.22(0.04) (0.03) (0.07) (0.08) (0.08) (0.20)
Post Funded Dummy 1.05 1.06 0.99 −0.63** −0.64** 0.59
(0.11) (0.12) (0.20) (0.29) (0.29) (0.50)
Active Projects 1.02 1.02 1.02 −0.05 −0.05 −0.01(0.03) (0.03) (0.03) (0.06) (0.06) (0.06)
Competing Investments / 100 1.08*** 1.08** 1.06 0.24*** 0.24*** 0.15
(0.02) (0.03) (0.04) (0.06) (0.06) (0.08)
Equity Share 0.89 0.89 1.15
(0.07) (0.08) (0.13)
Seedmatch Dummy 0.39*** 0.40*** 0.18**
(0.09) (0.10) (0.16)
Explanatory variables(lags according to table head)
Update 1.14 1.19** 1.16** 0.04 0.23 0.40**
(0.15) (0.08) (0.09) (0.19) (0.25) (0.19)
Update Number 1.01 1.03 0.93** 0.08 0.11 0.08
(0.04) (0.02) (0.03) (0.04) (0.05) (0.13)
Fixed effects
Campaign Yes*** Yes*** Yes*** Yes*** Yes*** Yes***
Day-of-week Yes*** Yes*** Yes*** Yes*** Yes*** Yes**
Month Yes Yes Yes*** Yes Yes Yes**
Year Yes Yes Yes Yes Yes*** Yes**
Day-of-funding-cycle Yes*** Yes*** Yes*** Yes*** Yes*** Yes***
Log likelihood −12,536.57 −12,525.83 −2964.41Adj. R2 0.14 0.14 0.08
N Investments days 5209 5209 5209 5201 5201 5201
N Campaigns 70 70 70 71 71 71
This table shows results of our baseline regressions as specified in Section 3.5. Next to the variables reported in the table, the baselineregressions also include dummy variables for the campaign, day of the week, month of the year, year effects, as well as the first and last7 days of the campaign. Variable definitions are reported in Table 5. The dependent variable in column (1) is the number of investments andin column (2) the Ln(Amount) of investments in a specific campaign and day. The data takes panel data structure. The method of estimationin column (1) is the negative binomial fixed effects panel estimator (standard errors are bootstrapped) and in column (2) the OLS fixed effectspanel estimator (standard errors are clustered on campaign level). Standard errors are reported in brackets
Significance levels for coefficients: **<5%, ***<1%
14 Block et al.
of updates in different industries (communication, whole-sale, and retail, as well as manufacturing) and differentportals (Companisto and Seedmatch). The results indicatethat a simple language is particularly important incrowdfunding campaigns from themanufacturing domain,while the information content of an update appears to beless important there. By contrast, during the course of oneweek, information about Cooperation Projects, NewFunding, Business Development, and Promotional Cam-paigns had a particularly positive and statistically signifi-cant effect in the wholesale and retail industry. Finally,while Cooperation Projects had a positive effect on theamount pledged on Seedmatch, information about Cam-paign Development and Business Development appearedto be more important for the crowd that invested onCompanisto. These results show that start-ups must con-sider whether a specific information content works for thecampaign under consideration and whether the crowd on aparticular portal is likely to respond to it.
5 Discussion, limitations, and further research
We began with the question whether and to what extentupdates posted by start-ups during an equity crowdfundingcampaign influence crowd participation. We argued thatupdates are a tool to signal the start-up’s quality to potentialinvestors during a crowdfunding campaign. Based on thismain research objective, we further investigated whetherthe frequency of updates has a positive effect on crowd
participation and whether the effect occurs immediately orin a lagged form (RQ1). Our results show that there isindeed a statistically and economically significant effect ofupdates on crowd participation. Posting an update in-creases both the number of investments by the crowdand the investment amount collected. However, this effectdoes not occur immediately in its entirety; rather, it lagsbehind the update by a few days. In addition, our findingssuggest that even though investors value signals providedby start-ups, an increasing number of updates seem toresult in a loss of credibility and might even be perceivedas cheap talk as additional updates no longer have astatistically significant effect on crowd participation.
Furthermore, we argued that the clarity of updates isimportant for crowd participation (RQ2). We measured theclarity of updates in terms of language complexity andupdate length. We find that the clarity of updates does notseem to be of particular relevance to the crowd.Even thoughour findings suggest that an easier readability has a positiveeffect on crowd participation the day after the update wasposted, this effect is lost after a fewdays. This result suggeststhat crowd investors do not seem particularly concernedabout language complexity. However, the readability ofmost updates was relatively homogenous with a Fleschindex between 40 and 65 (categories 2–4) targeting readerswith a good or very good education (Courtis 1995). Only asmall number of updates had a readability index in thecategory Bvery difficult̂ and none in the categories Beasy^and Bvery easy.^ This result might be due to a goodeducation of crowd investors and the entrepreneur posting
Fig. 3 Predictive marginsregarding the effects of updateson crowd participation. The figurereports predictive margins for thenumber of an update in an equitycrowdfunding campaign. Itreveals that the first updates havea positive but only marginallysignificant effect, while the latterupdates have no significant effecton crowd participation
Which updates increase crowd participation? 15
the update as well as the expectation of the crowd that start-ups communicate in a more sophisticated way to demon-strate their preparedness to establish and run a successfulcompany (Mollick 2014; Ahlers et al. 2015).
While recent research shows that entrepreneurs strategi-cally engage in update communication (Dorfleitner et al.2017), our results reveal that the type of information pro-vided in the update plays an important role for equity
Table 4 Effects of update categories on crowd participation
Investments (#) Ln(Amount (€))
Model 1 Model 2 Model 3 Model 4 Model 5 Model 6Variable lag None 1 day 1 week None 1 day 1 week
Explanatory variables(lags according to table head)
Flesch Index 1.02 1.07** 1.00 0.11 0.04 0.01
(0.04) (0.03) (0.00) (0.08) (0.09) (0.00)
Words / 100 1.00 0.99 0.97 0.09 0.06 0.03
(0.02) (0.03) (0.02) (0.06) (0.09) (0.06)
Team 1.05 0.87 1.08 −0.26 −0.33 0.22
(0.16) (0.09) (0.14) (0.31) (0.34) (0.21)
Business Model 1.10 0.92 0.91 −0.50 −0.21 −0.04(0.15) (0.12) (0.06) (0.28) (0.32) (0.22)
External Certification 0.87 1.10 1.11 −0.19 −0.43 −0.54**(0.13) (0.18) (0.10) (0.22) (0.33) (0.24)
Product Development 0.92 0.99 1.06 0.17 0.14 0.07
(0.08) (0.10) (0.07) (0.28) (0.26) (0.15)
Cooperation Projects 1.16 1.07 0.97 0.13 0.52** 0.27
(0.10) (0.08) (0.09) (0.23) (0.23) (0.20)
Campaign Development 1.15 1.21 1.17** −0.13 0.55 0.24
(0.14) (0.19) (0.08) (0.30) (0.31) (0.18)
New Funding 0.76 1.45** 1.51*** 0.36 0.74 0.58**
(0.21) (0.25) (0.24) (0.66) (0.37) (0.29)
Business Development 1.21 1.15 1.19** −0.05 0.51 0.58**
(0.15) (0.14) (0.11) (0.24) (0.27) (0.23)
Promotions 1.13 0.99 1.10 0.17 0.21 0.24
(0.11) (0.11) (0.06) (0.26) (0.27) (0.17)
Baseline and fixed effects Yes*** Yes*** Yes*** Yes*** Yes*** Yes***
Log likelihood −12,524.40 −12,519.53 −12,475.50Adj. R2 0.14 0.14 0.15
N Investments days 5209 5209 5209 5201 5201 5201
N Campaigns 70 70 70 71 71 71
This table shows results of our baseline regressions as specified in Section 3.5 as well as additional variables. The results of the baselineregression remain largely unchanged and are therefore not reported again. Next to the variables reported in the table, the regressions alsoinclude dummy variables for the campaign, day of the week, month of the year, year effects, as well as the first and last 7 days of thecampaign. Variable definitions are reported in Table 5 in the appendix . The dependent variable in columns (1) to (3) is the number ofinvestments and in columns (4) to (6) the Ln(Amount) of investments in a specific campaign and day. The data takes panel data structure.The method of estimation in columns (1) to (3) is the negative binomial fixed effects panel estimator (standard errors are bootstrapped) and incolumns (4) to (6) the OLS fixed effects panel estimator (standard errors are clustered on campaign level). Standard errors are reported inbrackets
Significance levels for coefficients: **<5%, ***<1%
16 Block et al.
crowdfunding participation. Updates that inform the crowdabout new funding and business developments seem to bevalued highly by investors. Updates providing informationabout campaign developments and cooperation projectsalso have a positive effect on crowd participation. In con-trast to previous findings, investors did not seem to valueinformation about the start-up team (Ahlers et al. 2015;Moritz et al. 2015; Bernstein et al. 2017). This result mightbe explained by the fact that the start-up team typically doesnot change during a crowdfunding campaign and thatinvestors expect to receive information about consistentfactors of the start-up directly at the beginning of thecampaign, e.g., in the business plan. This interpretation issupported by the results regarding the business model.Altogether, our results suggest that investors seem to valueupdates signaling additional and dynamic aspects about thestart-up’s quality during a crowdfunding campaign and donot value information which should have been provided atthe funding start. The negative effect of external certifica-tions on crowd investments is rather surprising and indi-cates that the crowd does not find expert opinions, successstories, awards received, and patents obtained credible andvaluable. However, a deeper analysis of this categorywith alarger data set is required to better understand the crowds’reaction to this information.
Our paper contributes to the entrepreneurial finance andcrowdfunding literatures. We contribute to research on theselection criteria of early-stage investors. It has been foundthat start-ups use specific information such as the quality oftheir management, intellectual property, the venture’s net-work, and firm alliances to signal their quality to investors(Audretsch et al. 2012; Baum and Silverman 2004; Blocket al. 2014; Franke et al. 2008; Jell et al. 2011). In ouranalysis, we have shown that specific signals incrowdfunding campaigns also seem to enhance the likeli-hood of a successful campaign. Hence, our paper expandsresearch on signaling theory by analyzing effective signalswithin updates during equity crowdfunding campaigns. Inaddition, our paper contributes to the small but growingliterature on the effects of information disclosure on equitycrowdfunding participation (Vismara 2016b; Ahlers et al.2015; Moritz et al. 2015; Moritz and Block 2015;Bernstein et al. 2017). So far, this literature has not takeninto account that start-ups can also provide or discloseinformation to the crowd while running an equitycrowdfunding campaign. Our analysis takes a dynamicapproach to this issue and investigates these disclosureeffects, considering updates that are given during ongoingcrowdfunding campaigns.
This paper is not without limitations, which providefruitful avenues for further research. Although we considertwo different portals, the sample size of 71 funding cam-paigns and 39,399 investment decisions is still relativelysmall. Our dataset is slightly biased. Extremely positivecrowdfunding campaigns, where the funding limit wasreached within a few hours, simply had no time (or need)to publish updates. The sample size does not allow us tobuild larger subgroups of start-ups from different indus-tries, countries, and development stages. Future researchcould collect larger samples of funding campaigns andinvestigate potential moderation effects related to start-upor campaign characteristics. We would expect, for exam-ple, to see stronger positive effects of updates on patentsand successful prototypes in technology-intensive indus-tries than in other industries. Our subsample of start-ups intechnology-intensive industries is too small to investigatesuchmoderation effects.Moreover, with a larger sample ofstart-ups and campaigns, one could compare lone founderstart-ups with team start-ups. It might very well be thatupdates on new teammembers have particularly meaning-ful effects for lone founder start-ups, especially when thefounder lacks technological and/or business competences.Another possible avenue for further research is to extendthe research about the effects of updates on crowd partic-ipation to reward-based crowdfunding (Colombo et al.2015; Mollick 2014; Xu et al. 2014). Mollick (2014), forexample, has shown that projects with updates are morelikely than other projects to attract funding from the crowd.However, he does not distinguish between different typesof updates. Given the particularities of reward-basedcrowdfunding and its strong focus on products and pro-jects, we would expect updates with information aboutproject and product developments to have particularlystrong effects.
6 Implications for practice
Our paper’s results are important for start-ups seek-ing equity crowdfunding. Knowing which updatesdrive funding participation is crucial for start-upswhen designing an effective and successful investorcommunication and social media strategy for theirequity crowdfunding campaigns. By posting up-dates, start-ups can actively influence their cam-paigns’ chances of success. The crowd seems par-ticularly sensitive to verifiable and business-relatedinformation about the development of the start-up
Which updates increase crowd participation? 17
since funding start such as new fundings and busi-ness developments, whereas information about theunderlying business model, team, and promotionalactivities does not provide much additional value. Inthis sense, the crowd seems to behave like profes-sional investors who focus on verifiable, business-related, and cash-flow relevant additional informa-tion as decision criteria for their investments(Boocock and Woods 1997). This information isalso important for crowdfunding platforms. By en-couraging start-ups to publish specific types of up-dates that can increase the likelihood of successful
crowdfunding campaigns, the platforms’ own busi-ness success will be improved.
Acknowledgments Open access funding was provided by theMax Planck Society. This article evolved as part of the researchproject BCrowdinvesting in Germany, England and the USA:Regulatory Perspectives and Welfare Implications of a New Fi-nancing Scheme^, which was supported by the German ResearchFoundation (Deutsche Forschungsgemeinschaft) under the grantnumber HO 5296/1-1. The authors thank Silvio Vismara, and theparticipants of the 20th G-Forum (Handelshochschule Leipzig)and the 4th Crowdinvesting Symposium (Max Planck Institutefor Innovation and Competition). Gerrit Engelmann providedexcellent research assistance. All errors are our own.
Appendix
Table 5 Definitions of variables
Dependent variables:
Ln(Amount): The natural logarithm of the amount of money in EUR invested by crowd investors on day t in campaign i.
#Investments: The number of investments made by crowd investors on day t in campaign i.
Control variables:
Ln(Amount 0 → t −1): The natural logarithm of the total amount of money in EUR invested by the crowd until the previous dayin campaign i.
#Investments 0 → t −1: The total number of investments made by the crowd until the previous day in a particular campaign.
Post Funded: Dummy variable equal to 1 if the campaign has surpassed the Funding Goal, and 0 otherwise.
Active Campaigns: The total number of campaigns across three major and one minor German equity crowdfunding portal(Seedmatch, Companisto, Innovestment, and United Equity) accepting investments on day t.
Competing Investments: The total number of investments made on day t across all campaigns ran on threemajor and one minor German equity crowdfunding portal (Seedmatch, Companisto, Innovestment, and United Equity) that wherenot attracted by campaign i.
Equity Share: Is the amount of capital requested by the venture (funding goal) over its pre-money valuation.
Seedmatch: Dummy variable equal to 1 if the campaign was run on Seedmatch, and 0 if it was run on Companisto.
Explanatory variables—RQ1:
Update: The number of updates posted on the portal website by the start-up on day t in campaign i.
Update Number: Is the number of an update during the campaign. At a maximum, the campaign MyParfum onCompanisto counted 14 updates. For the lagged variables, we use the average of previous updates’ number.
Explanatory variables—RQ2:
Flesch Index: Is the Flesch Readability Index, using a categorization with a seven item scale (Courtis 1995), where 1corresponds to a Flesch index of 0–30 Bvery difficult language,^ 2 to 31–50 Bdifficult,^ 3 to 51–60 Bfairly difficult,^ 4 to 61–70Bstandard,^ 5 to 71–80 Bfairly easy,^ 6 to 81–90 Beasy,^ and 7 to 91–100 Bvery easy language.^ For the lagged variables,we use the average of previous updates’ Flesch index.
Words: Is the total number of words that appeared in the update text. For the lagged variables, we use the average ofprevious updates’ word count.
Explanatory variables—RQ3:
Team: Dummy variable equal to 1 if the update contained information about the entrepreneurial team (education,previous work experience), and 0 otherwise.
18 Block et al.
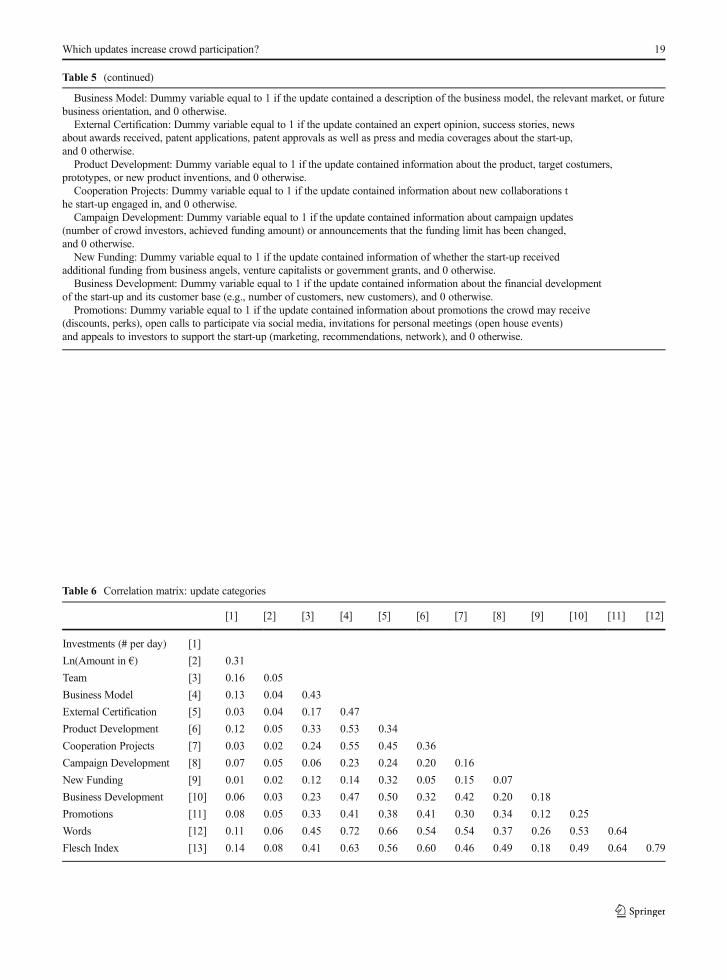
Table 5 (continued)
Business Model: Dummy variable equal to 1 if the update contained a description of the business model, the relevant market, or futurebusiness orientation, and 0 otherwise.
External Certification: Dummy variable equal to 1 if the update contained an expert opinion, success stories, newsabout awards received, patent applications, patent approvals as well as press and media coverages about the start-up,and 0 otherwise.
Product Development: Dummy variable equal to 1 if the update contained information about the product, target costumers,prototypes, or new product inventions, and 0 otherwise.
Cooperation Projects: Dummy variable equal to 1 if the update contained information about new collaborations the start-up engaged in, and 0 otherwise.
Campaign Development: Dummy variable equal to 1 if the update contained information about campaign updates(number of crowd investors, achieved funding amount) or announcements that the funding limit has been changed,and 0 otherwise.
New Funding: Dummy variable equal to 1 if the update contained information of whether the start-up receivedadditional funding from business angels, venture capitalists or government grants, and 0 otherwise.
Business Development: Dummy variable equal to 1 if the update contained information about the financial developmentof the start-up and its customer base (e.g., number of customers, new customers), and 0 otherwise.
Promotions: Dummy variable equal to 1 if the update contained information about promotions the crowd may receive(discounts, perks), open calls to participate via social media, invitations for personal meetings (open house events)and appeals to investors to support the start-up (marketing, recommendations, network), and 0 otherwise.
Table 6 Correlation matrix: update categories
[1] [2] [3] [4] [5] [6] [7] [8] [9] [10] [11] [12]
Investments (# per day) [1]
Ln(Amount in €) [2] 0.31
Team [3] 0.16 0.05
Business Model [4] 0.13 0.04 0.43
External Certification [5] 0.03 0.04 0.17 0.47
Product Development [6] 0.12 0.05 0.33 0.53 0.34
Cooperation Projects [7] 0.03 0.02 0.24 0.55 0.45 0.36
Campaign Development [8] 0.07 0.05 0.06 0.23 0.24 0.20 0.16
New Funding [9] 0.01 0.02 0.12 0.14 0.32 0.05 0.15 0.07
Business Development [10] 0.06 0.03 0.23 0.47 0.50 0.32 0.42 0.20 0.18
Promotions [11] 0.08 0.05 0.33 0.41 0.38 0.41 0.30 0.34 0.12 0.25
Words [12] 0.11 0.06 0.45 0.72 0.66 0.54 0.54 0.37 0.26 0.53 0.64
Flesch Index [13] 0.14 0.08 0.41 0.63 0.56 0.60 0.46 0.49 0.18 0.49 0.64 0.79
Which updates increase crowd participation? 19
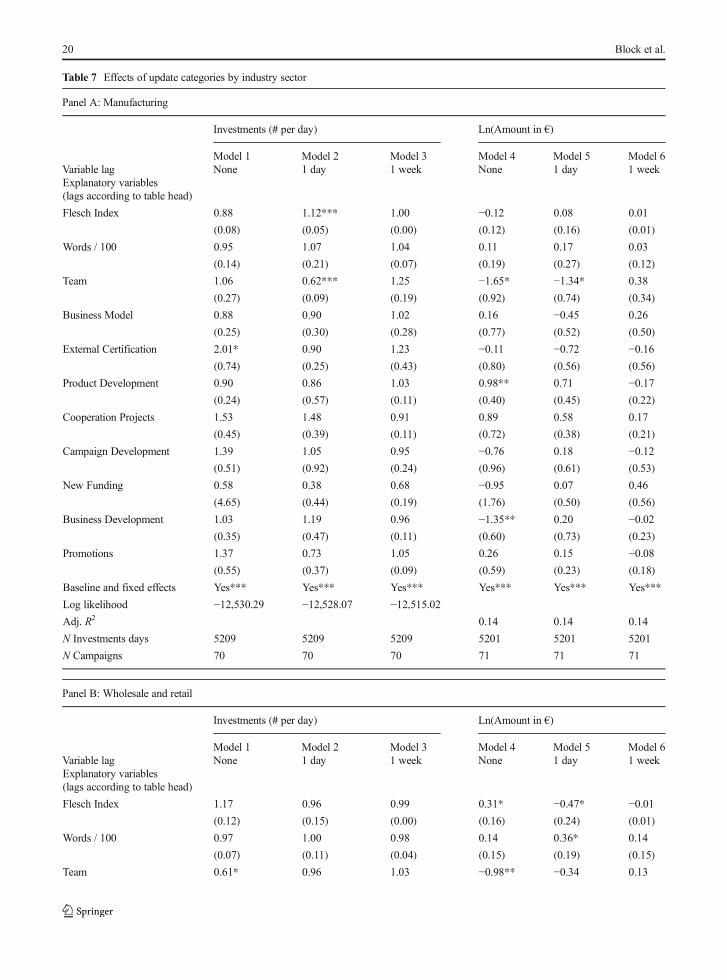
Table 7 Effects of update categories by industry sector
Panel A: Manufacturing
Investments (# per day) Ln(Amount in €)
Model 1 Model 2 Model 3 Model 4 Model 5 Model 6Variable lag None 1 day 1 week None 1 day 1 weekExplanatory variables(lags according to table head)
Flesch Index 0.88 1.12*** 1.00 −0.12 0.08 0.01
(0.08) (0.05) (0.00) (0.12) (0.16) (0.01)
Words / 100 0.95 1.07 1.04 0.11 0.17 0.03
(0.14) (0.21) (0.07) (0.19) (0.27) (0.12)
Team 1.06 0.62*** 1.25 −1.65* −1.34* 0.38
(0.27) (0.09) (0.19) (0.92) (0.74) (0.34)
Business Model 0.88 0.90 1.02 0.16 −0.45 0.26
(0.25) (0.30) (0.28) (0.77) (0.52) (0.50)
External Certification 2.01* 0.90 1.23 −0.11 −0.72 −0.16(0.74) (0.25) (0.43) (0.80) (0.56) (0.56)
Product Development 0.90 0.86 1.03 0.98** 0.71 −0.17(0.24) (0.57) (0.11) (0.40) (0.45) (0.22)
Cooperation Projects 1.53 1.48 0.91 0.89 0.58 0.17
(0.45) (0.39) (0.11) (0.72) (0.38) (0.21)
Campaign Development 1.39 1.05 0.95 −0.76 0.18 −0.12(0.51) (0.92) (0.24) (0.96) (0.61) (0.53)
New Funding 0.58 0.38 0.68 −0.95 0.07 0.46
(4.65) (0.44) (0.19) (1.76) (0.50) (0.56)
Business Development 1.03 1.19 0.96 −1.35** 0.20 −0.02(0.35) (0.47) (0.11) (0.60) (0.73) (0.23)
Promotions 1.37 0.73 1.05 0.26 0.15 −0.08(0.55) (0.37) (0.09) (0.59) (0.23) (0.18)
Baseline and fixed effects Yes*** Yes*** Yes*** Yes*** Yes*** Yes***
Log likelihood −12,530.29 −12,528.07 −12,515.02Adj. R2 0.14 0.14 0.14
N Investments days 5209 5209 5209 5201 5201 5201
N Campaigns 70 70 70 71 71 71
Panel B: Wholesale and retail
Investments (# per day) Ln(Amount in €)
Model 1 Model 2 Model 3 Model 4 Model 5 Model 6Variable lag None 1 day 1 week None 1 day 1 weekExplanatory variables(lags according to table head)
Flesch Index 1.17 0.96 0.99 0.31* −0.47* −0.01(0.12) (0.15) (0.00) (0.16) (0.24) (0.01)
Words / 100 0.97 1.00 0.98 0.14 0.36* 0.14
(0.07) (0.11) (0.04) (0.15) (0.19) (0.15)
Team 0.61* 0.96 1.03 −0.98** −0.34 0.13
20 Block et al.
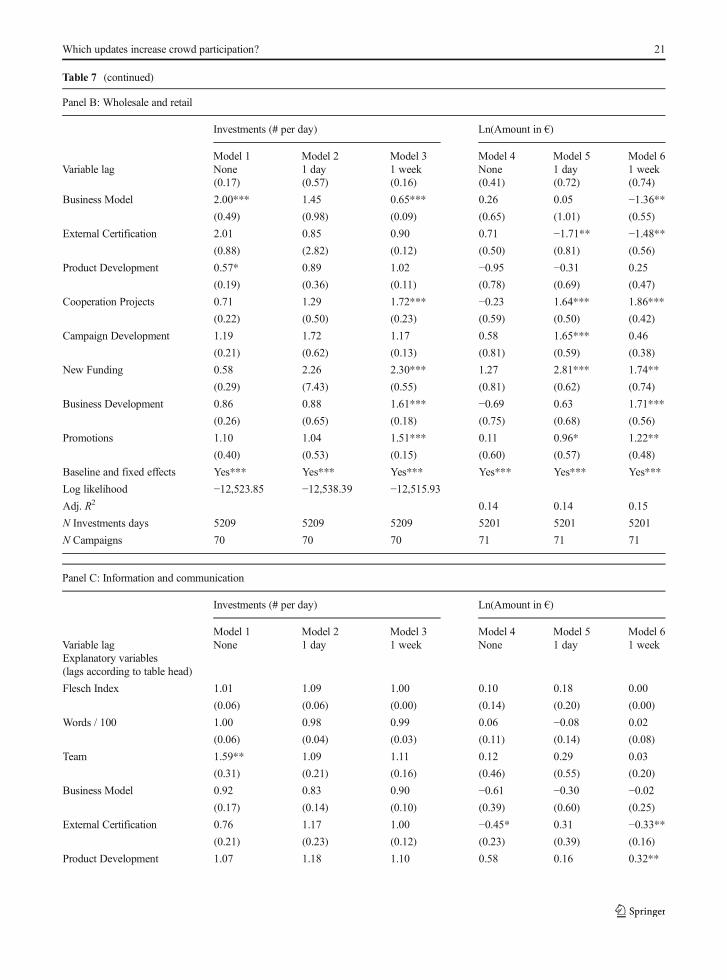
Table 7 (continued)
Panel B: Wholesale and retail
Investments (# per day) Ln(Amount in €)
Model 1 Model 2 Model 3 Model 4 Model 5 Model 6Variable lag None 1 day 1 week None 1 day 1 week
(0.17) (0.57) (0.16) (0.41) (0.72) (0.74)
Business Model 2.00*** 1.45 0.65*** 0.26 0.05 −1.36**(0.49) (0.98) (0.09) (0.65) (1.01) (0.55)
External Certification 2.01 0.85 0.90 0.71 −1.71** −1.48**(0.88) (2.82) (0.12) (0.50) (0.81) (0.56)
Product Development 0.57* 0.89 1.02 −0.95 −0.31 0.25
(0.19) (0.36) (0.11) (0.78) (0.69) (0.47)
Cooperation Projects 0.71 1.29 1.72*** −0.23 1.64*** 1.86***
(0.22) (0.50) (0.23) (0.59) (0.50) (0.42)
Campaign Development 1.19 1.72 1.17 0.58 1.65*** 0.46
(0.21) (0.62) (0.13) (0.81) (0.59) (0.38)
New Funding 0.58 2.26 2.30*** 1.27 2.81*** 1.74**
(0.29) (7.43) (0.55) (0.81) (0.62) (0.74)
Business Development 0.86 0.88 1.61*** −0.69 0.63 1.71***
(0.26) (0.65) (0.18) (0.75) (0.68) (0.56)
Promotions 1.10 1.04 1.51*** 0.11 0.96* 1.22**
(0.40) (0.53) (0.15) (0.60) (0.57) (0.48)
Baseline and fixed effects Yes*** Yes*** Yes*** Yes*** Yes*** Yes***
Log likelihood −12,523.85 −12,538.39 −12,515.93Adj. R2 0.14 0.14 0.15
N Investments days 5209 5209 5209 5201 5201 5201
N Campaigns 70 70 70 71 71 71
Panel C: Information and communication
Investments (# per day) Ln(Amount in €)
Model 1 Model 2 Model 3 Model 4 Model 5 Model 6Variable lag None 1 day 1 week None 1 day 1 weekExplanatory variables(lags according to table head)
Flesch Index 1.01 1.09 1.00 0.10 0.18 0.00
(0.06) (0.06) (0.00) (0.14) (0.20) (0.00)
Words / 100 1.00 0.98 0.99 0.06 −0.08 0.02
(0.06) (0.04) (0.03) (0.11) (0.14) (0.08)
Team 1.59** 1.09 1.11 0.12 0.29 0.03
(0.31) (0.21) (0.16) (0.46) (0.55) (0.20)
Business Model 0.92 0.83 0.90 −0.61 −0.30 −0.02(0.17) (0.14) (0.10) (0.39) (0.60) (0.25)
External Certification 0.76 1.17 1.00 −0.45* 0.31 −0.33**(0.21) (0.23) (0.12) (0.23) (0.39) (0.16)
Product Development 1.07 1.18 1.10 0.58 0.16 0.32**
Which updates increase crowd participation? 21
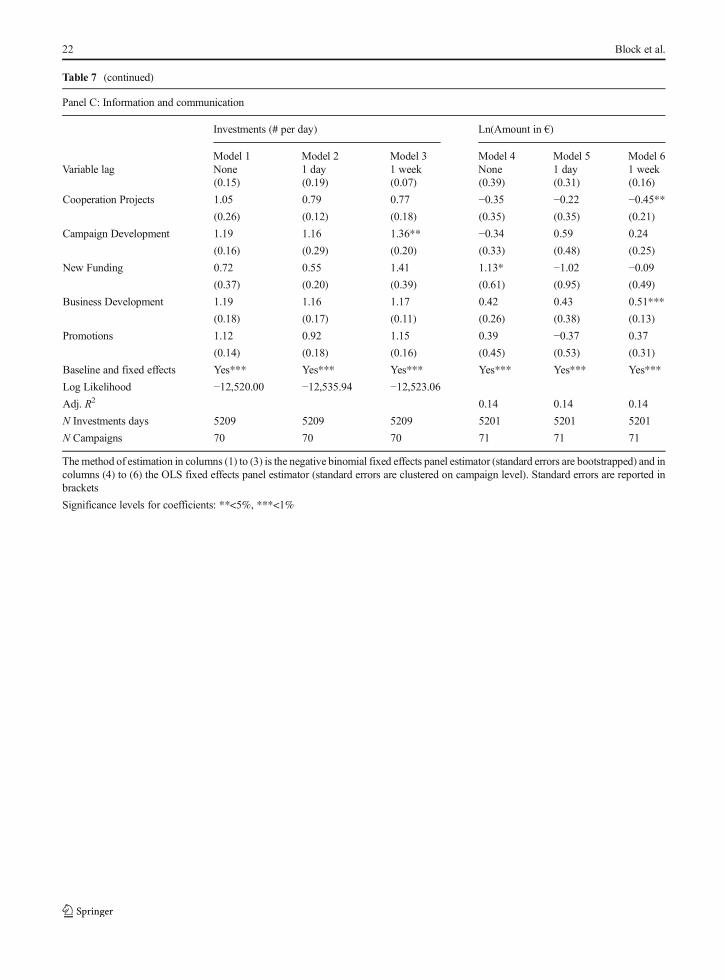
Table 7 (continued)
Panel C: Information and communication
Investments (# per day) Ln(Amount in €)
Model 1 Model 2 Model 3 Model 4 Model 5 Model 6Variable lag None 1 day 1 week None 1 day 1 week
(0.15) (0.19) (0.07) (0.39) (0.31) (0.16)
Cooperation Projects 1.05 0.79 0.77 −0.35 −0.22 −0.45**(0.26) (0.12) (0.18) (0.35) (0.35) (0.21)
Campaign Development 1.19 1.16 1.36** −0.34 0.59 0.24
(0.16) (0.29) (0.20) (0.33) (0.48) (0.25)
New Funding 0.72 0.55 1.41 1.13* −1.02 −0.09(0.37) (0.20) (0.39) (0.61) (0.95) (0.49)
Business Development 1.19 1.16 1.17 0.42 0.43 0.51***
(0.18) (0.17) (0.11) (0.26) (0.38) (0.13)
Promotions 1.12 0.92 1.15 0.39 −0.37 0.37
(0.14) (0.18) (0.16) (0.45) (0.53) (0.31)
Baseline and fixed effects Yes*** Yes*** Yes*** Yes*** Yes*** Yes***
Log Likelihood −12,520.00 −12,535.94 −12,523.06Adj. R2 0.14 0.14 0.14
N Investments days 5209 5209 5209 5201 5201 5201
N Campaigns 70 70 70 71 71 71
Themethod of estimation in columns (1) to (3) is the negative binomial fixed effects panel estimator (standard errors are bootstrapped) and incolumns (4) to (6) the OLS fixed effects panel estimator (standard errors are clustered on campaign level). Standard errors are reported inbrackets
Significance levels for coefficients: **<5%, ***<1%
22 Block et al.
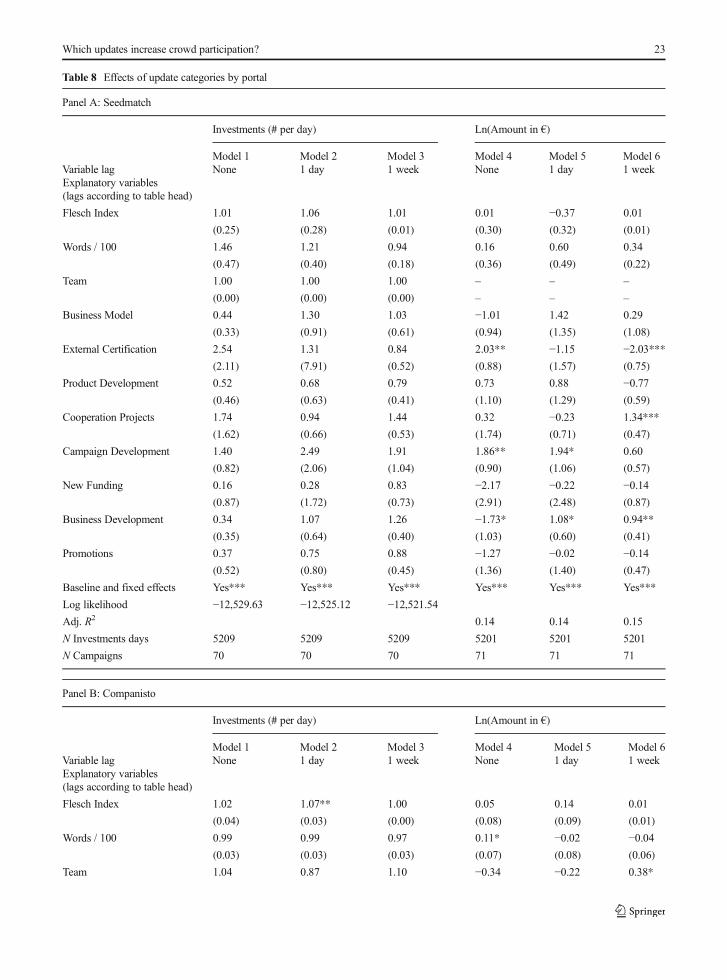
Table 8 Effects of update categories by portal
Panel A: Seedmatch
Investments (# per day) Ln(Amount in €)
Model 1 Model 2 Model 3 Model 4 Model 5 Model 6Variable lag None 1 day 1 week None 1 day 1 weekExplanatory variables(lags according to table head)
Flesch Index 1.01 1.06 1.01 0.01 −0.37 0.01
(0.25) (0.28) (0.01) (0.30) (0.32) (0.01)
Words / 100 1.46 1.21 0.94 0.16 0.60 0.34
(0.47) (0.40) (0.18) (0.36) (0.49) (0.22)
Team 1.00 1.00 1.00 – – –
(0.00) (0.00) (0.00) – – –
Business Model 0.44 1.30 1.03 −1.01 1.42 0.29
(0.33) (0.91) (0.61) (0.94) (1.35) (1.08)
External Certification 2.54 1.31 0.84 2.03** −1.15 −2.03***(2.11) (7.91) (0.52) (0.88) (1.57) (0.75)
Product Development 0.52 0.68 0.79 0.73 0.88 −0.77(0.46) (0.63) (0.41) (1.10) (1.29) (0.59)
Cooperation Projects 1.74 0.94 1.44 0.32 −0.23 1.34***
(1.62) (0.66) (0.53) (1.74) (0.71) (0.47)
Campaign Development 1.40 2.49 1.91 1.86** 1.94* 0.60
(0.82) (2.06) (1.04) (0.90) (1.06) (0.57)
New Funding 0.16 0.28 0.83 −2.17 −0.22 −0.14(0.87) (1.72) (0.73) (2.91) (2.48) (0.87)
Business Development 0.34 1.07 1.26 −1.73* 1.08* 0.94**
(0.35) (0.64) (0.40) (1.03) (0.60) (0.41)
Promotions 0.37 0.75 0.88 −1.27 −0.02 −0.14(0.52) (0.80) (0.45) (1.36) (1.40) (0.47)
Baseline and fixed effects Yes*** Yes*** Yes*** Yes*** Yes*** Yes***
Log likelihood −12,529.63 −12,525.12 −12,521.54Adj. R2 0.14 0.14 0.15
N Investments days 5209 5209 5209 5201 5201 5201
N Campaigns 70 70 70 71 71 71
Panel B: Companisto
Investments (# per day) Ln(Amount in €)
Model 1 Model 2 Model 3 Model 4 Model 5 Model 6Variable lag None 1 day 1 week None 1 day 1 weekExplanatory variables(lags according to table head)
Flesch Index 1.02 1.07** 1.00 0.05 0.14 0.01
(0.04) (0.03) (0.00) (0.08) (0.09) (0.01)
Words / 100 0.99 0.99 0.97 0.11* −0.02 −0.04(0.03) (0.03) (0.03) (0.07) (0.08) (0.06)
Team 1.04 0.87 1.10 −0.34 −0.22 0.38*
Which updates increase crowd participation? 23
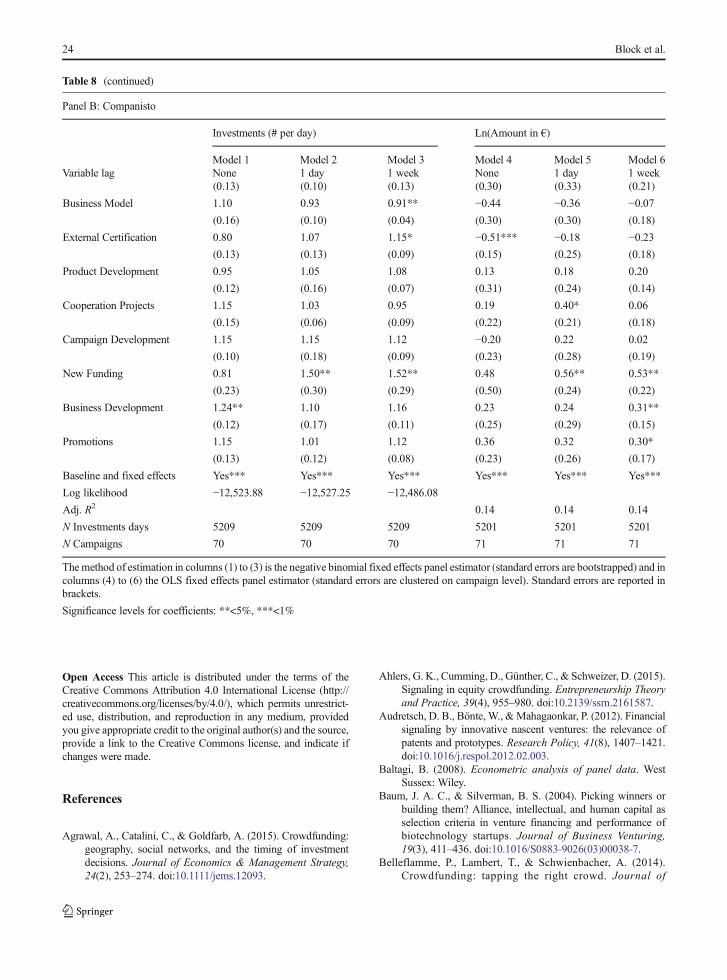
Open Access This article is distributed under the terms of theCreative Commons Attribution 4.0 International License (http://creativecommons.org/licenses/by/4.0/), which permits unrestrict-ed use, distribution, and reproduction in any medium, providedyou give appropriate credit to the original author(s) and the source,provide a link to the Creative Commons license, and indicate ifchanges were made.
References
Agrawal, A., Catalini, C., & Goldfarb, A. (2015). Crowdfunding:geography, social networks, and the timing of investmentdecisions. Journal of Economics & Management Strategy,24(2), 253–274. doi:10.1111/jems.12093.
Ahlers, G. K., Cumming, D., Günther, C., & Schweizer, D. (2015).Signaling in equity crowdfunding. Entrepreneurship Theoryand Practice, 39(4), 955–980. doi:10.2139/ssrn.2161587.
Audretsch, D. B., Bönte,W., &Mahagaonkar, P. (2012). Financialsignaling by innovative nascent ventures: the relevance ofpatents and prototypes. Research Policy, 41(8), 1407–1421.doi:10.1016/j.respol.2012.02.003.
Baltagi, B. (2008). Econometric analysis of panel data. WestSussex: Wiley.
Baum, J. A. C., & Silverman, B. S. (2004). Picking winners orbuilding them? Alliance, intellectual, and human capital asselection criteria in venture financing and performance ofbiotechnology startups. Journal of Business Venturing,19(3), 411–436. doi:10.1016/S0883-9026(03)00038-7.
Belleflamme, P., Lambert, T., & Schwienbacher, A. (2014).Crowdfunding: tapping the right crowd. Journal of
Table 8 (continued)
Panel B: Companisto
Investments (# per day) Ln(Amount in €)
Model 1 Model 2 Model 3 Model 4 Model 5 Model 6Variable lag None 1 day 1 week None 1 day 1 week
(0.13) (0.10) (0.13) (0.30) (0.33) (0.21)
Business Model 1.10 0.93 0.91** −0.44 −0.36 −0.07(0.16) (0.10) (0.04) (0.30) (0.30) (0.18)
External Certification 0.80 1.07 1.15* −0.51*** −0.18 −0.23(0.13) (0.13) (0.09) (0.15) (0.25) (0.18)
Product Development 0.95 1.05 1.08 0.13 0.18 0.20
(0.12) (0.16) (0.07) (0.31) (0.24) (0.14)
Cooperation Projects 1.15 1.03 0.95 0.19 0.40* 0.06
(0.15) (0.06) (0.09) (0.22) (0.21) (0.18)
Campaign Development 1.15 1.15 1.12 −0.20 0.22 0.02
(0.10) (0.18) (0.09) (0.23) (0.28) (0.19)
New Funding 0.81 1.50** 1.52** 0.48 0.56** 0.53**
(0.23) (0.30) (0.29) (0.50) (0.24) (0.22)
Business Development 1.24** 1.10 1.16 0.23 0.24 0.31**
(0.12) (0.17) (0.11) (0.25) (0.29) (0.15)
Promotions 1.15 1.01 1.12 0.36 0.32 0.30*
(0.13) (0.12) (0.08) (0.23) (0.26) (0.17)
Baseline and fixed effects Yes*** Yes*** Yes*** Yes*** Yes*** Yes***
Log likelihood −12,523.88 −12,527.25 −12,486.08Adj. R2 0.14 0.14 0.14
N Investments days 5209 5209 5209 5201 5201 5201
N Campaigns 70 70 70 71 71 71
Themethod of estimation in columns (1) to (3) is the negative binomial fixed effects panel estimator (standard errors are bootstrapped) and incolumns (4) to (6) the OLS fixed effects panel estimator (standard errors are clustered on campaign level). Standard errors are reported inbrackets.
Significance levels for coefficients: **<5%, ***<1%
24 Block et al.

Business Venturing, 29(5), 585–609. doi:10.1016/j.jbusvent.2013.07.003.
Bernstein, S., Korteweg, A. G., & Laws, K. (2017). Attractingearly stage investors: evidence from a randomized field ex-periment. Journal of Finance, 72(2), 509–538. doi:10.1111/jofi.12470.
Block, J. H., De Vries, G., Schumann, J. H., & Sandner, P. (2014).Trademarks and venture capital valuation. Journal ofBusiness Venturing, 29(4), 525–542. doi:10.1016/j.jbusvent.2013.07.006.
Block, J., Colombo, M., Cumming, D., & Vismara, S. (2017a).New players in entrepreneurial finance and why they arethere. Small Business Economics, forthcoming. doi:10.1007/s11187-016-9826-6.
Block, J., Fisch, C., & van Praag, M. (2017b). The Schumpeterianentrepreneur: a review of the empirical evidence on theantecedents, behavior, and consequences on innovative en-trepreneurship. Industry and Innovation, 31(8), 793–801.doi:10.1080/13662716.2016.1216397.
Boocock, G., &Woods,M. (1997). The evaluation criteria used byventure capitalists: evidence from a UK venture fund.International Small Business Journal, 16(1), 36–57.doi:10.1177/0266242697161003.
Branzei, O., Ursacki-Bryant, T. J., Vertinsky, I., & Zhang, W.(2004). The formation of green strategies in chinese firms:matching corporate environmental responses and individualprinciples. Strategic Management Journal, 25(11), 1075–1095. doi:10.1002/smj.409.
Busenitz, L. W., Fiet, J. O., & Moesel, D. D. (2005). Signaling inventure capitalist—new venture decisions: does it indicatelong-term venture outcomes? Entrepreneurship Theory andPractice, 29(1), 1–12. doi:10.1111/j.1540-6520.2005.00066.x.
Carter, S. M. (2006). The interaction of top management group,stakeholder, and situational factors on certain corporate rep-utation management activities. Journal of ManagementStudies , 43 (3) , 1145–1176. doi:10.1111/j .1467-6486.2006.00632.x.
Certo, S. T. (2003). Influencing initial public offering investorswith prestige: signaling with board structures. Academy ofManagement Review, 28(3), 432–446. doi:10.5465/AMR.2003.10196754.
Cholakova, M., & Clarysse, B. (2015). Does the possibility tomake equity investments in crowdfunding projects crowd outreward-based investments? Entrepreneurship Theory andPractice, 39(1), 145–172. doi:10.1111/etap.12139.
Colombo, M. G., Franzoni, C., & Rossi-Lamastra, C. (2015).Internal social capital and the attraction of early contributionsin crowdfunding. Entrepreneurship Theory and Practice,39(1), 75–100. doi:10.1111/etap.12118.
Connelly, B. L., Certo, S. T., Ireland, R. D., & Reutzel, C. R.(2011). Signaling theory: a review and assessment. Journalo f Manag emen t , 3 7 ( 1 ) , 3 9–67 . d o i : 1 0 . 1177/0149206310388419.
Courtis, J. K. (1995). Readability of annual reports: Westernversus Asian evidence. Accounting, Auditing &Accountability Journal, 8(2), 4–17. doi:10.1108/09513579510086795.
Cumming, D. & Zhang, Y. (2016). Are crowdfunding platformsactive and effective intermediaries? SSRN Working Paper,No. 2882026. Available at SSRN: https: / /ssrn.com/abstract=2882026.
Dorfleitner, G., Hornuf, L. & Weber, M. (2017). Dynamics ofinvestor communication in equity crowdfunding, mimeo.
Doshi, A. (2014). The impact of high performance outliers on two-sided platforms: evidence from crowdfunding, SSRNWorking Paper, No. 2422111. Available at SSRN:http://ssrn.com/abstract=2422111.
Fischer, E., & Reuber, A. R. (2014). Online entrepreneurial com-munication: mitigating uncertainty and increasing differenti-ation via twitter. Journal of Business Venturing, 29(4), 565–583. doi:10.1016/j.jbusvent.2014.02.004.
Fleiss, J. L., Levin, B., & Paik, M. C. (2003). Statistical methodsfor rates and proportions (3rd ed.). Hoboken: Wiley.
Flesch, R. (1948). A new readability yardstick. Journal of AppliedPsychology, 32(3), 221–233. doi:10.1037/h0057532.
Franke, N., Gruber, M., Harhoff, D., & Henkel, J. (2008). Venturecapitalists’ evaluations of start-up teams: trade-offs, knock-out cri teria, and the impact of VC experience.Entrepreneurship Theory and Practice, 32(3), 459–483.doi:10.1111/j.1540-6520.2008.00236.x.
Gao, Q., & Lin, M. (2014). Linguistic features and peer-to-peerloan quality: a machine learning approach. SSRN WorkingPaper, No. 2446114. Available at SSRN: http://papers.ssrn.com/sol3/papers.cfm?abstract_id=2446114.
Gao, H., Darroch, J., Mather, D., & MacGregor, A. (2008).Signaling corporate strategy in IPO communication: a studyof biotechnology IPOs on the NASDAQ. The Journal ofBusiness Communication, 45(1), 3–30. doi:10.1177/0021943607309349.
Gioia, D. A., Corley, K. G., & Hamilton, A. L. (2012). Seekingqualitative rigor in inductive research: notes on the Gioiamethodology. Organizational Research Methods, 16(1),15–31. doi:10.1177/1094428112452151.
Greiner, M. E., & Wang, H. (2010). Building consumer-to-consumer trust in E-finance marketplaces: an empirical anal-ysis. International Journal of Electronic Commerce, 15(2),105–136. doi:10.2753/JEC1086-4415150204.
Gulati, R., & Higgins, M. C. (2003). Which ties matter when? Thecontingent effects of interorganizational partnerships on IPOsuccess. Strategic Management Journal, 24(2), 127–144.doi:10.1002/smj.287.
Hemer, J., Schneider, U., Dornbusch, F., & Frey, S. (2011).Crowdfunding und andere Formen Informel lerM i k r o f i n a n z i e r u n g i n d e r P r o j e k t - u n dInnovationsfinanzierung. Stuttgart: Fraunhofer Verlag.
Highhouse, S., Thornbury, E. E., & Little, I. S. (2007). Social-identity functions of attraction to organizations.Organizational Behavior and Human Decision Processes,103(1), 134–146. doi:10.1016/j.obhdp.2006.01.001.
Hornuf, L., & Schwienbacher, A. (2015). Portal design andfunding dynamics in crowdinvesting. Research Papers inEconomics, 9(15) and SSRN Working Paper, No. 2612998.Available at SSRN: http://ssrn.com/abstract=2612998.
Hornuf, L., & Schwienbacher, A. (2016). Crowdinvesting: angelinvesting for the masses? In H. Landström & C. Mason(Eds.), Handbook of Research on Business Angels (pp.381–397). Cheltenham: Edward Elgar.
Janney, J. J., & Folta, T. B. (2003). Signaling through privateequity placements and its impact on the valuation of biotech-nology firms. Journal of Business Venturing, 18(3), 361–380.doi:10.1016/S0883-9026(02)00100-3.
Which updates increase crowd participation? 25

Janney, J. J., & Folta, T. B. (2006). Moderating effects of investorexperience on the signaling value of private equity place-ments. Journal of Business Venturing, 21(1), 27–44.doi:10.1016/j.jbusvent.2005.02.008.
Jell, F., Block, J. H., & Henkel, J. (2011). Innovativität als Kriteriumbei Venture-Capital-Investitionsentscheidungen. Kredit undKapital, 44(4), 509–541. doi:10.3790/kuk.44.4.509.
Kickstarter (2012). Blockbuster Effects. Available at: http://www.kickstarter.com/blog/blockbuster-effects.
Kim, K., & Viswanathan, S.. (2013). The experts in the crowd: therole of reputable investors in a crowdfunding market. TPRC41: The 41st Research Conference on Communication,Information and Internet Policy. Available at SSRN:http://ssrn.com/abstract=2258243.
Kollmann, T., & Kuckertz, A. (2006). Investor relations for start-ups: an analysis of venture capital investors’ communicativeneeds. International Journal of Technology Management,34(1), 47–62. doi:10.1504/IJTM.2006.009447.
Kromidha, E., & Robson, P. (2016). Social identity and signallingsuccess factors in online crowdfunding. Entrepreneurship &Regional Development, 28(9–10), 605–629. doi:10.1080/08985626.2016.1198425.
Kuppuswamy, V., & Bayus, B. L. (2017). Crowdfunding creativeideas: The dynamics of project backers. In D. Cumming & L.Hornuf (Eds.), The Economics of Crowdfunding: Startups,Portals, and Investor Behavior (forthcoming). London:Palgrave Macmillan.
Landis, J. R., & Koch, G. G. (1977). The measurement of observeragreement for categorical data. Biometrics, 33(1), 159–174.doi:10.2307/2529310.
Landström, H. (1992). The relationship between private investorsand sma l l f i rms : an agency theory approach .Entrepreneurship & Regional Development, 4(3), 199–223.doi:10.1080/08985629200000012.
Lukkarinen, A., Teich, J. E.,Wallenius, H., &Wallenius, J. (2016).Success drivers of online equity crowdfunding campaigns.Decision Support Systems, 87, 26–38. doi:10.1016/j.dss.2016.04.006.
McNamara, G. M., Haleblian, J., & Dykes, B. J. (2008). Theperformance implications of participating in an acquisitionwave: early mover advantages, bandwagon effects, and themoderating influence of industry characteristics and acquirertactics. Academy of Management Journal, 51(1), 113–130.doi:10.5465/AMJ.2008.30755057.
Miles, M., & Huberman, A. M. (1994). Qualitative data analysis:an expanded sourcebook (2nd ed.). Thousand Oaks: Sage.
Mohammadi, A., & Shafi, K. (2017). Gender differences in thecontribution patterns of equity-crowdfunding investors gen-der differences in the contribution patterns of equity-crowdfunding investors. Small Business Economics, forth-coming. doi:10.1007/s11187-016-9825-7.
Mollick, E. R. (2014). The dynamics of crowdfunding: an explor-atory study. Journal of Business Venturing, 29(1), 1–16.doi:10.1016/j.jbusvent.2013.06.005.
Moritz, A., & Block, J. H. (2015). Crowdfunding: a literaturereview and research directions. In: Block, J. H., &Kuckertz, A. (Series Eds.), Brüntje, D., & Gajda, O. (Vol.Eds.), FGF Studies in Small Business and Entrepreneurship:
Vol. 1. Crowdfunding in Europe – State of the Art in Theoryand Practice (pp. 25–53). Cham: Springer Science &Business Media.
Moritz, A., Block, J. H., & Lutz, E. (2015). Investor communica-tion in equity-based crowdfunding: a qualitative-empiricalstudy. Qualitative Research in Financial Markets, 7(3),309–342. doi:10.1108/QRFM-07-2014-0021.
Perkins, S. J., & Hendry, C. (2005). Ordering top pay: interpretingthe signals. Journal of Management Studies, 42(7), 1443–1468. doi:10.1111/j.1467-6486.2005.00550.x.
Polzin F., Toxopeus H., Stam E. (2017). The wisdom of the crowdin funding. Information heterogeneity and social networks ofcrowdfunders. Small Business Economics, forthcoming.doi:10.1007/s11187-016-9829-3.
Ralcheva, A., & Roosenboom, P. (2016). On the road to success inequity crowdfunding. SSRN Working Paper, No. 2727742,Available on SSRN: https://papers.ssrn.com/sol3/papers.cfm?abstract_id=2727742.
Rao, R. S., Chandy, R. K., & Prabhu, J. C. (2008). The fruits oflegitimacy: why some new ventures gain more from innova-tion than others. Journal of Marketing, 72(4), 58–75.
Ross, S. A. (1977). The determination of financial structure: theincentive signalling approach. Bell Journal of Economics,8(1), 23–40. doi:10.2307/3003485.
Sapienza, H., & Korsgaard, M. (1996). Procedural justice inentrepreneur-investor relations. Academy of ManagementJournal, 39(3), 544–574. doi:10.2307/256655.
Spence, M. (1973). Job market signaling. The Quarterly Journalof Economics, 87(3), 355–374. doi:10.2307/1882010.
Srivastava, J. (2001). The role of inferences in sequential bargainingwith one-sided incomplete information: some experimentalevidence. Organizational Behavior and Human DecisionProcesses, 85(1), 166–187. doi:10.1006/obhd.2000.2936.
Vismara, S. (2016a). Equity retention and social network theory inequity crowdfunding. Small Business Economics, 46(4),579–590. doi:10.1007/s11187-016-9710-4.
Vismara, S. (2016b). Information cascades among investors inequity crowdfunding. Entrepreneurship Theory andPractice, forthcoming. doi:10.1111/etap.12261.
Vulkan, N., Åstebro, T., & Sierra, M. F. (2016). Equitycrowdfunding: a new phenomena. Journal of BusinessVenturing Insights, 5, 37–49. doi:10.1016/j.jbvi.2016.02.001.
Warner, A. G., Fairbank, J. F., & Steensma, H. K. (2006).Managing uncertainty in a formal standards-based industry:a real options perspective on acquisition timing. Journal ofMana g emen t , 3 2 ( 2 ) , 2 7 9 – 29 8 . d o i : 1 0 . 11 7 7/0149206305280108.
Wheat, R. E., Wang, Y., Byrnes, J. E., & Ranganathan, J. (2013).Raising money for scientific research through crowdfunding.Trends in Ecology & Evolution, 28(2), 71–72. doi:10.1016/j.tree.2012.11.001.
Wu, S., Wang, B., & Li, Y. (2015). How to attract the crowd incrowdfunding? International Journal of Entrepreneurshipand Small Business, 24(3), 322–334. doi:10.1504/IJESB.2015.067465.
Xu, A., Yang, X., Rao, H., Fu, W. T., Huang, S.W., & Bailey, B. P.(2014). Show me the money! An analysis of project updatesduring crowdfunding campaigns. In Proceedings of the 32nd
26 Block et al.

Annual ACM Conference for Human Factors in ComputingSystems, ACM: 591–600. Available at: https://pdfs.semanticscholar.org/34a6/bb3c6ed524f0cdb56cd7c11fe8159ef595a5.pdf.
Zimmerman, M. A., & Zeitz, G. J. (2002). Beyond survival:achieving new venture growth by building legitimacy.Academy of Management Review, 27(3), 414–431.doi:10.5465/AMR.2002.7389921.
Which updates increase crowd participation? 27