Learning Analytics Primer: Getting Started with Learning and Performance Analytics
Upload
oecd-educationCategory
view
565download
0
Education governance; The role of dataWorkshop C: Learning Analytics
Peter Karlberg | Skolverket
twitter: peterkarlberg
linkedin: https://www.linkedin.com/in/peterkarlberg
#laceproject

What is learning analytics?
• the measurement, collection, analysis and reporting of data about learners and their contexts, for purposes of understanding and optimising learning and the environments in which it occurs – First International Conference on Learning Analytics And Knowledge (LAK11), Banff, Alberta, Feb 27-Mar 1, 2011
– other terms; Educational data mining (EDM), Big data in education, learner analytics …..

Photo public domain: http://commons.wikimedia.org/wiki/File:DESYNebelkammer.jpg
- Erik Duval http://erikduval.wordpress.com/2012/01/30/learning-analytics-and-educational-data-mining/
“collecting traces that learners leave behind and using those traces to improve learning”
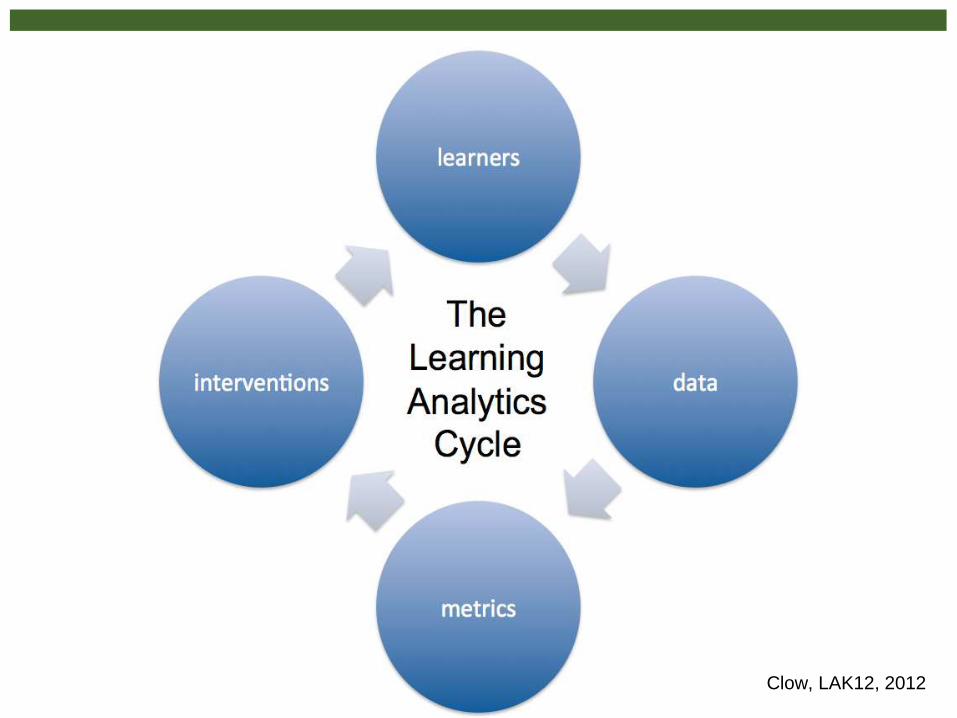
Clow, LAK12, 2012

School dashboards (Google Images)
• Maybe chop the first slide about this.
5

ELLI Teacher view
6
Buckingham Shum and Deakin Crick, 2012 (LAK12)

What data do we have about learners?
• Demographics
• Previous educational experience
• Grades, scores, achievements, struggles
• Attendance, location, gaze
• Software logs
• Online tracking
• Other online activity (tracking)
• … more every week.
7
Photo (CC)-BY-SA AJ Cann https://www.flickr.com/photos/ajc1/15574010080/

What can we do with that data?
• Identify learners who need help– Simple or predictive
• Trigger interventions
– Via teacher, or direct
• Learn which interventions work
• Build a complete cognitive learning system
• Suggest resources or source of help– Learners like you found this helpful
– This person might be able to help you
8
Photo (CC)-BY-NC Pulpolux https://www.flickr.com/photos/pulpolux/8735428280

what should we do?
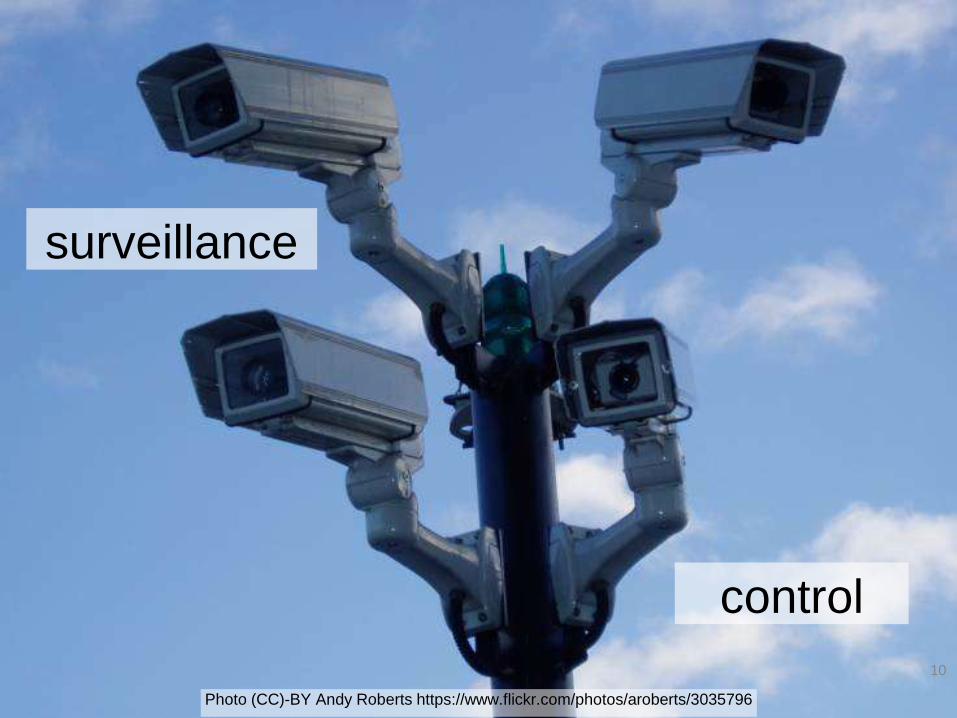
10
control
Photo (CC)-BY Andy Roberts https://www.flickr.com/photos/aroberts/3035796
surveillance

11
support
Photo (CC)-BY-NC-SA Drew Bennett https://www.flickr.com/photos/abennett96/2710211041
guidance

Glasswinged butterfly, ? Greta oro
Photo (CC)-BY-NC-ND by Greg Foster on Flickr http://www.flickr.com/photos/gregfoster/3365801458/
Principles
• Privacy
• Data protection
• Ethics
• Transparency
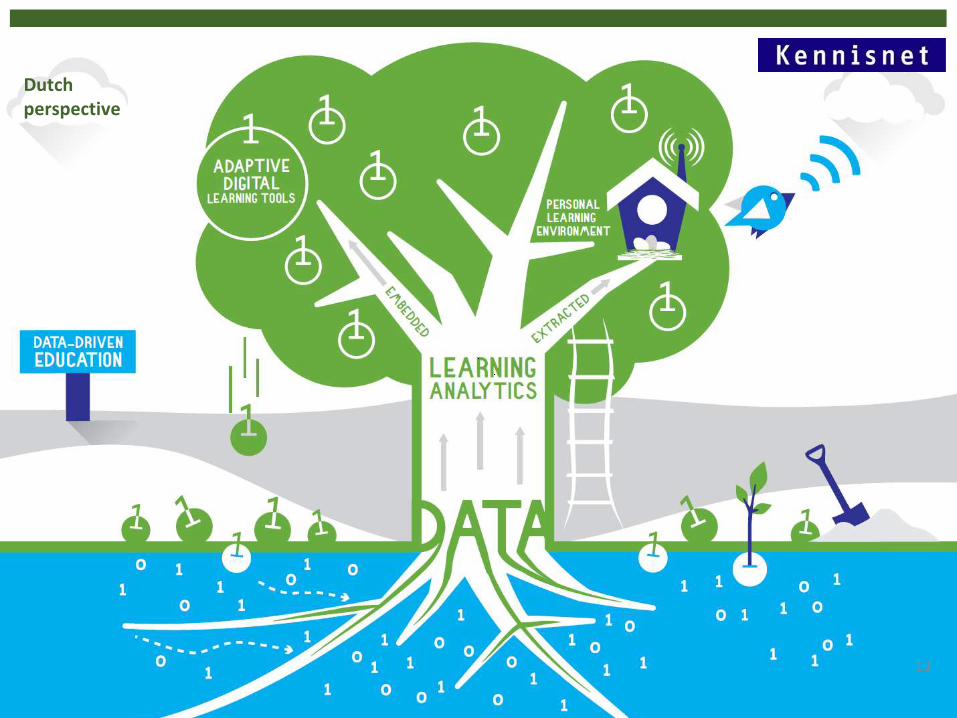
Dutchperspective
13

Example 1: Math Garden (NL)
14

A garden that needs maintainens
• From primary school –
• Encourages weekly practice – otherwise the garden withers
• Rewards: blooming plants and virtual coins (which can be exchanged)
• Automatically adjusts the difficulty of math exercises to the ability level of the user
15

Studi.se (SWE)
• Videos (also with sub-titles in many languages), texts and quizzes
• Feedback to both the student and the teacher16

Interactive Flipped Classroom (SWE)
• Based on the flipped classroom method
• Makes the students more active in the classroom
• But they are still quite passive when looking at videos
• Technical platform which helps the teacher to cut the videos in smaller chunks and add quizzes
• Also possible for students to stop the video and write questions to the teacher
17
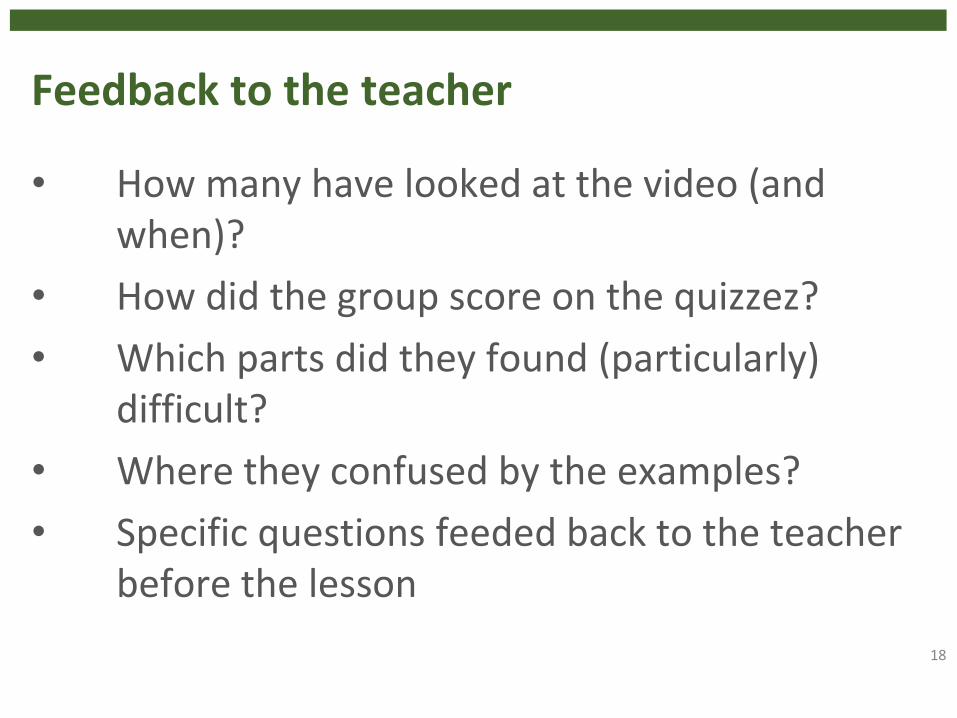
Feedback to the teacher
• How many have looked at the video (and when)?
• How did the group score on the quizzez?
• Which parts did they found (particularly) difficult?
• Where they confused by the examples?
• Specific questions feeded back to the teacher before the lesson
18

19Why do you subtract 4/9? The students can stop the video and
write questions if needed

Regional initiative on drop-outs
• Western parts of Sweden
• When do student drop-out from upper secondary school?
• Can we discover a pattern?
• Using the data – analysing
20

www.laceproject.euLearning Analytics Community Exchange
• Coordination and Support
• Evidence Hub
• Events
• Publications, briefings, webinars

Activities and Achievements
• Capturing the Latest Thinking
– 18 blog posts on LACE website
– Infographic
22

Evidence Hub
23
• Manage content and metadata of the web presence and knowledge base (the Evidence Hub) to create a valued and used resource
• Identify, collect and synthesise claims and evidence for the benefits of learning analytics

Evidence Hub – Rationale
• Add value on top of bibliographies (Mendeley)& machine analysis of LAK Dataset
• Support for practitioners, researchers, managers, policymakers
• Evidence for or against a proposition / hypothesis
• Propositions developed among partners & at SoLAR Flare UK
24Photo (CC)-BY Inessa Achmedova https://www.flickr.com/photos/kooklanekookla/1816753147
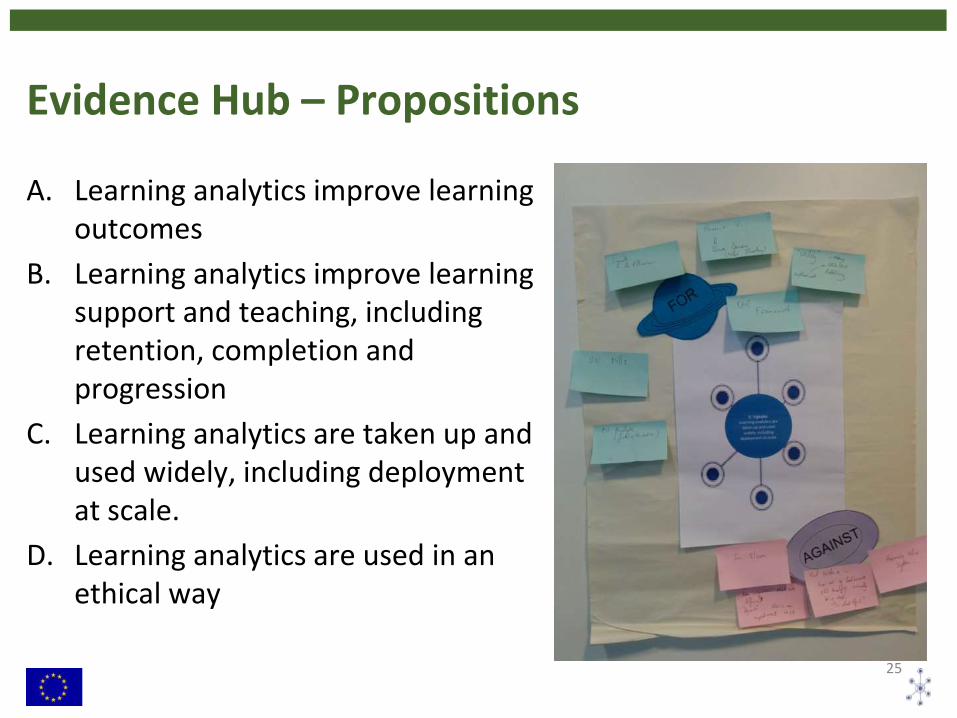
Evidence Hub – Propositions
A. Learning analytics improve learning outcomes
B. Learning analytics improve learning support and teaching, including retention, completion and progression
C. Learning analytics are taken up and used widely, including deployment at scale.
D. Learning analytics are used in an ethical way
25

Evidence Hub – Evidence Flow map
26

Evidence Hub – Map of Evidence
27

Evidence Hub – Outlook
• Also capture material witha lower threshold– Projects
– Activity
– Opinion and policy
• Easier to submit &quality control
• Broader view of field
• Not already available elsewhere
• Broader interest– Helps sustainability beyond
the project
28

State of the art of LA in school sector
• little systematic use of data at school level
• more at national and municipal level
• lack of knowledge in the school community
• some interest
• increasing vendor interest – new products
• privacy big issue
• little research found
29

Thanks!
• Slides made by Doug Clow, Jan Hylén and myself
30

31
2
CC-BY – You are free to:
copy, share, adapt, or re-mix;
photograph, film, or broadcast;
blog, live-blog, or post video of
this presentation provided that:You attribute the work to its authors and respect the rights andlicences associated with its components.