Population Changes How populations grow, shrink, and change.
Upload
truongkienCategory
view
219download
0
POPULATIONS
ISSUE 20 | SUmmEr 2014 brIngIng CUTTIng-EDgE SCIEnCE InTo THE CLASSroom
SPOT THE DIFFERENCELearn how populations
grow, change and move

2 | BIG PICTURE 20: populations
What’s the first thing that pops into your mind when you read the word population? Most likely it’s the ever-increasing human population on earth. You’re a member of that population, which is the term for all the members of a single species living together in the same location. The term population isn’t just used to describe humans: it can refer to the poppy population in a New Zealand field or even the microbial populations forming a community in your body. Join us as we learn more about how populations grow, change and move, and why understanding them is so important.
INSIDE
POPULATIONS PICTUREA snapshot of populations around the world
FOUNDATIONS OF POPULATIONSUnderstanding the basics
CHANGES BIG AND SMALLExploring the many ways a population can change
COMPLEX NETWORKSInvestigating how and why populations interact
FIND OUT FOR YOURSELFPutting your populations knowledge into action
POPULATION PROBLEMSCase studies on antibiotic resistance, birth control and genetic modification
REAL vOICESTalking to people with a personal perspective on the topic
2
4
6
8
10
12
14
ONLINEAll of the resources for this issue – and plenty more – can be found online at bigpictureeducation.com
POPULATION PyrAmIDS
A snapshot of populations around the world
Source: Central Intelligence Agency, The World Factbook 2013–14
POPULATIONS PIcTUrE
95 9085807570656055504540353025201510
50
95 9085807570656055504540353025201510
50
95 9085807570656055504540353025201510
50
100+
100+
100+
––––––––––––––––––––
––––––––––––––––––––
––––––––––––––––––––
99 948984797469645954494439342924191494
99 948984797469645954494439342924191494
99 948984797469645954494439342924191494
125 100 75 50 25 0 0 25 50 75 100 125
65 52 39 26 13 0 0 13 26 39 52 65
3 2.4 1.8 1.2 0.6 0 0 0.6 1.2 1.8 2.4 3
population (in thousands)
population (in millions)
population (in millions)
population (in thousands)
population (in millions)
population (in millions)
bOTSwANA 2013
INDIA 2013
UK 2013
AGE GrOUP
AGE GrOUP
AGE GrOUP
Cover: Pattern variation in adult harlequin ladybirds Lajos Nagy/epa/Corbis

summer 2014 | 3
cOUNTING chIcKENS, 2010
hUmAN POPULATION: PAST, PrESENT AND fUTUrE
Source: AM Klein et al. Proceedings of the Royal Society B: Biological Sciences 274:303–13
ONLINE POPULATIONS rELIANcE ON ThE hONEybEE
PErcENTAGE Of TOTAL POPULATION LIVING IN UrbAN ArEAS, 1960–2010
Putting this diagram together, we found that different sources gave different numbers for the same thing. Why don’t they match? Well, data can be interpreted in different ways, and estimates can be made using different methods and/or baseline data. Definitions matter, too – different sources might define ‘size’ or ‘time’ differently. Which should you choose? The source itself is important – is it reliable? How valid is the original study? Are the figures recent? How might an organisation’s ‘agenda’ affect how it calculates and presents data?
Source: Atlantic, 4 October 2012
Source: Loren Cobb, compiled using US Census Bureau historical estimates and UN Population Division 2010 projections
3.6 chIcKENS TO 1 PErSON
6.84 chIcKENS TO 1 PErSON
2.4 chIcKENS TO 1 PErSON
chINA
USA
UK
mOUThfULS Of ThE fOOD wE EAT DEPENDENT ON bEE POLLINATION
wOrLD POPULATION IN 1804
PEOPLE USING fAcEbOOK IN 2012
30% 70%UrbAN rUrAL
196050% 50%UrbAN rUrAL
2010
4600m
2100m
150m
1 IN 3
1 bILLION 16
15
14
13
12
11
10
9
8
7
6
5
4
3
2
1
0
1800
1880
1960
2080
1840
1920
2040
2000
1820
1900
1980
2100
1860
1940
2060
2020
BEFORE 1950 (ESTIMATED)
KEy
popu
latio
n x
106
Year
PROjECTIONS 2010 ONWARDS (USING HIGH UNITED NATIONS ESTIMATES)
PROjECTIONS 2010 ONWARDS (USING MEDIUM UNITED NATIONS ESTIMATES)
PROjECTIONS 2010 ONWARDS (USING LOW UNITED NATIONS ESTIMATES)
1950–2010 (ACTUAL)
Source: www.healthinternetwork.com/gho/urban_health/situation_trends/urban_population_growth/en/
Sources: economist.com/blogs/dailychat/2011/07/global-livestock-counts, DEFRA farming statistics (UK chicken population), Office for National Statistics (UK human population)
fINDING DATA
4 | BIG PICTURE 20: populations
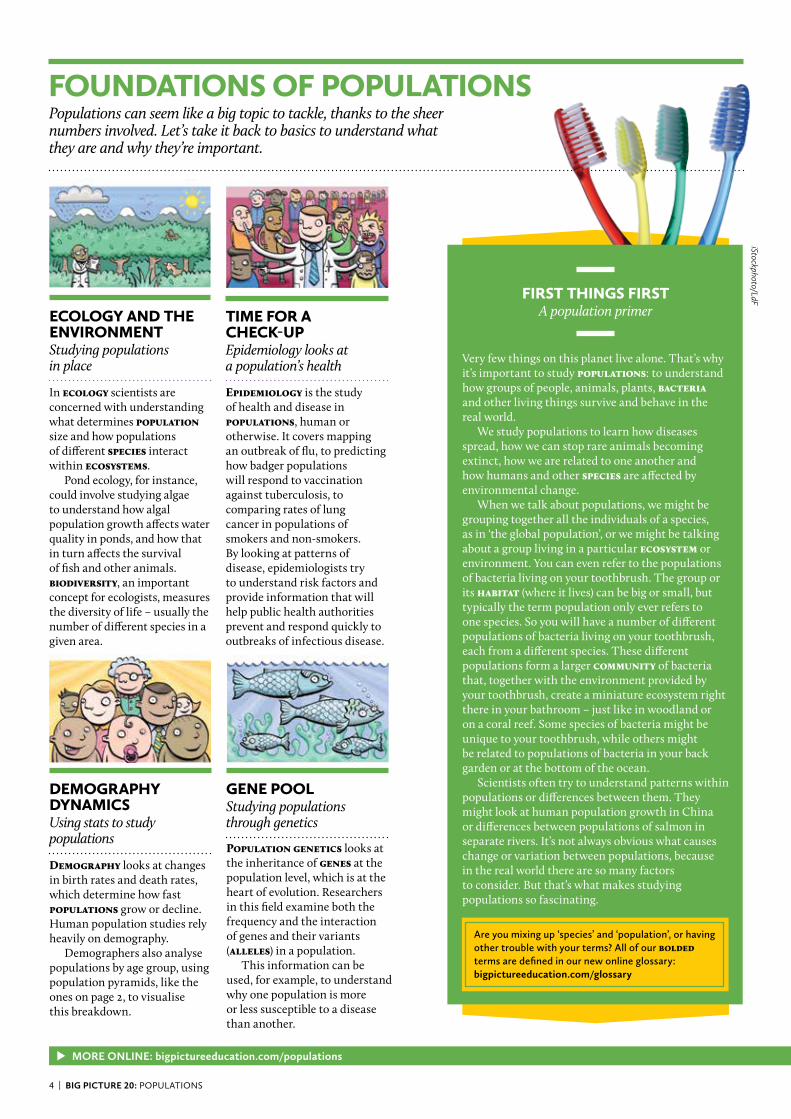
fOUNDATIONS Of POPULATIONSPopulations can seem like a big topic to tackle, thanks to the sheer numbers involved. Let’s take it back to basics to understand what they are and why they’re important.
EcOLOGy AND ThE ENVIrONmENT Studying populations in place
TImE fOr A chEcK-UP Epidemiology looks at a population’s health
In ecology scientists are concerned with understanding what determines population size and how populations of different species interact within ecosystems. Pond ecology, for instance, could involve studying algae to understand how algal population growth affects water quality in ponds, and how that in turn affects the survival of fish and other animals. biodiversity, an important concept for ecologists, measures the diversity of life – usually the number of different species in a given area.
Epidemiology is the study of health and disease in populations, human or otherwise. It covers mapping an outbreak of flu, to predicting how badger populations will respond to vaccination against tuberculosis, to comparing rates of lung cancer in populations of smokers and non-smokers. By looking at patterns of disease, epidemiologists try to understand risk factors and provide information that will help public health authorities prevent and respond quickly to outbreaks of infectious disease.
MORE ONLINE: bigpictureeducation.com/populations
DEmOGrAPhy DyNAmIcSUsing stats to study populations
GENE POOLStudying populations through genetics
Demography looks at changes in birth rates and death rates, which determine how fast populations grow or decline. Human population studies rely heavily on demography. Demographers also analyse populations by age group, using population pyramids, like the ones on page 2, to visualise this breakdown.
Population genetics looks at the inheritance of genes at the population level, which is at the heart of evolution. Researchers in this field examine both the frequency and the interaction of genes and their variants (alleles) in a population. This information can be used, for example, to understand why one population is more or less susceptible to a disease than another.
Very few things on this planet live alone. That’s why it’s important to study populations: to understand how groups of people, animals, plants, bacteria and other living things survive and behave in the real world. We study populations to learn how diseases spread, how we can stop rare animals becoming extinct, how we are related to one another and how humans and other species are affected by environmental change. When we talk about populations, we might be grouping together all the individuals of a species, as in ‘the global population’, or we might be talking about a group living in a particular ecosystem or environment. You can even refer to the populations of bacteria living on your toothbrush. The group or its habitat (where it lives) can be big or small, but typically the term population only ever refers to one species. So you will have a number of different populations of bacteria living on your toothbrush, each from a different species. These different populations form a larger community of bacteria that, together with the environment provided by your toothbrush, create a miniature ecosystem right there in your bathroom – just like in woodland or on a coral reef. Some species of bacteria might be unique to your toothbrush, while others might be related to populations of bacteria in your back garden or at the bottom of the ocean. Scientists often try to understand patterns within populations or differences between them. They might look at human population growth in China or differences between populations of salmon in separate rivers. It’s not always obvious what causes change or variation between populations, because in the real world there are so many factors to consider. But that’s what makes studying populations so fascinating.
Are you mixing up ‘species’ and ‘population’, or having other trouble with your terms? All of our bolded terms are defined in our new online glossary: bigpictureeducation.com/glossary
fIrST ThINGS fIrSTA population primer
iStockphoto/LdF
summer 2014 | 5
ExTrEmE LOcATIONSFinding life where you least expect it
MORE ONLINE: bigpictureeducation.com/populations
Life creeps into just about every corner of our planet, meaning you’ll find thriving populations in places that seem almost uninhabitable. Over 25 years ago a reactor at the Chernobyl nuclear power station in Ukraine exploded. Most humans were evacuated from the contaminated areas, wildlife has moved back in, and populations of pine trees and swallows are now studied for the lasting effects of radiation. Populations depend upon one another, forming communities – so where you find one you’re sure to find another. At deep-sea vents, which spout volcanically heated water from cracks in the seafloor, there is no light and plants cannot grow. Yet even in this hostile environment, populations of microbes survive by releasing energy from chemicals in the hot fluid. Higher up the food chain,
animal populations, including worms and shrimp, depend on these microbes for their own energy. Meanwhile, vent crabs scavenge, eating both microbes and dead animals. Other odd places for populations and communities include shipwrecks and the underwater components of offshore wind turbines, which can act like reefs for mussels and fish, the International Space Station, which hosts a very small population of astronauts, and Antarctic islands, which are home to ancient mosses that can be brought back to life in a lab after having been frozen for 1500 years. There’s even an ecosystem in your belly button – scientists have discovered a whole new species of bacteria in people’s navels. (Google ‘Belly Button Biodiversity Project’ if you want to find out more.)
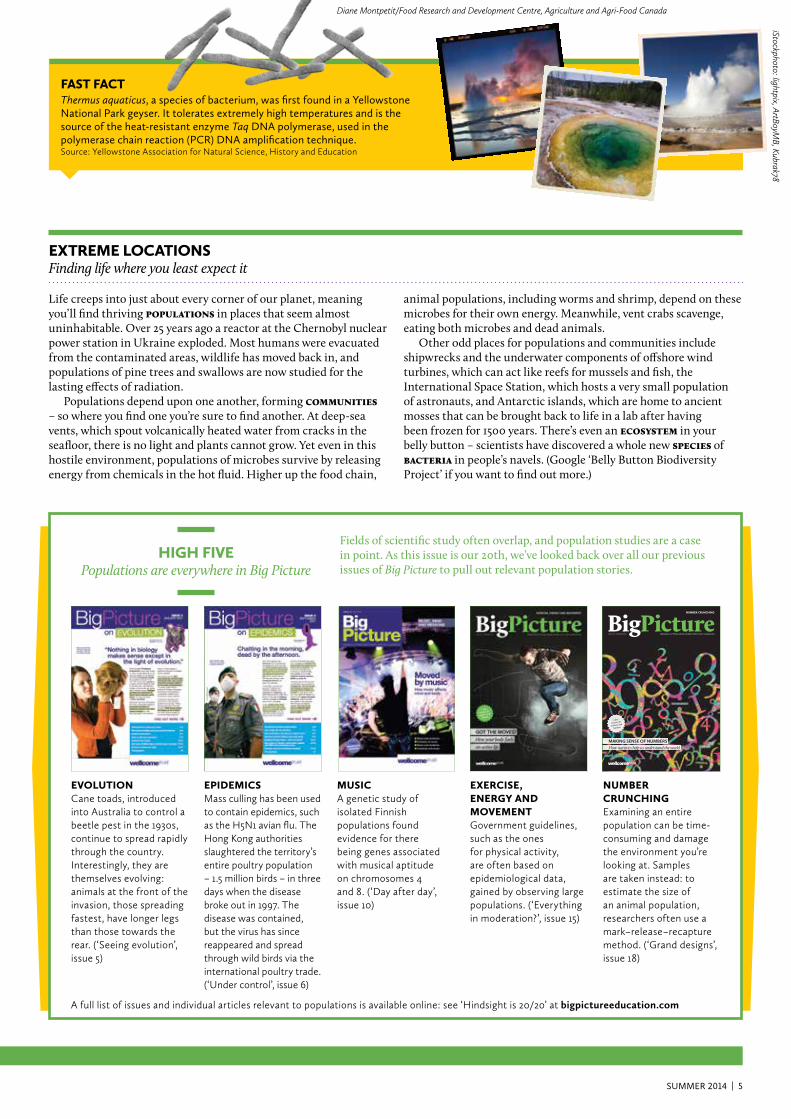
Fields of scientific study often overlap, and population studies are a case in point. As this issue is our 20th, we’ve looked back over all our previous issues of Big Picture to pull out relevant population stories.
A full list of issues and individual articles relevant to populations is available online: see ‘Hindsight is 20/20’ at bigpictureeducation.com
EVOLUTIONCane toads, introduced into Australia to control a beetle pest in the 1930s, continue to spread rapidly through the country. Interestingly, they are themselves evolving: animals at the front of the invasion, those spreading fastest, have longer legs than those towards the rear. (‘Seeing evolution’, issue 5)
EPIDEmIcSMass culling has been used to contain epidemics, such as the H5N1 avian flu. The Hong Kong authorities slaughtered the territory’s entire poultry population – 1.5 million birds – in three days when the disease broke out in 1997. The disease was contained, but the virus has since reappeared and spread through wild birds via the international poultry trade. (‘Under control’, issue 6)
mUSIcA genetic study of isolated Finnish populations found evidence for there being genes associated with musical aptitude on chromosomes 4 and 8. (‘Day after day’, issue 10)
ExErcISE, ENErGy AND mOVEmENTGovernment guidelines, such as the ones for physical activity, are often based on epidemiological data, gained by observing large populations. (‘Everything in moderation?’, issue 15)
NUmbEr crUNchINGExamining an entire population can be time-consuming and damage the environment you’re looking at. Samples are taken instead: to estimate the size of an animal population, researchers often use a mark–release–recapture method. (‘Grand designs’, issue 18)
NUMBER CRUNCHING
ISSUE 18 | SUMMER 2013 BRINGING CUTTING-EDGE SCIENCE INTO THE CLASSROOM
MAKING SENSE OF NUMBERSHow statistics help us understand the world
hIGh fIVE Populations are everywhere in Big Picture
iStockphoto: lightpix, ArtBoyMB, Kubrak78
Diane Montpetit/Food Research and Development Centre, Agriculture and Agri-Food Canada
Thermus aquaticus, a species of bacterium, was first found in a Yellowstone national park geyser. it tolerates extremely high temperatures and is the source of the heat-resistant enzyme Taq Dna polymerase, used in the polymerase chain reaction (pCr) Dna amplification technique.Source: Yellowstone Association for Natural Science, History and Education
fAST fAcT

6 | BIG PICTURE 20: populations
In 2011 the human population reached 7 billion. This statistic might have surprised the economist Thomas Malthus, who at the turn of the 19th century made some gloomy predictions about population growth. He believed that overpopulation would soon lead to war and famine, as demand for food outstripped
supply. In ecological terms, we would have exceeded our carrying capacity – the maximum population that our environment and all of its resources can support. Malthus was writing from the perspective of a man living in a world of 1bn and didn’t foresee the advances in farming technology that would enable the planet to support many more people. However, by no means are all 7bn well fed. Around one in eight people suffer from chronic hunger, mostly in low- and middle-income countries, which are also predicted to see some of the biggest population
increases over the coming decades. Population growth is slowing, but it is likely there will be more than 10bn of us by 2050. The enduring growth of the human population is often referred to as the ‘population explosion’. But other species undergo shorter-lived booms, with dramatic effects. In the USA a sudden explosion in the grasshopper population can destroy millions of hectares of grazing land. Scientists are trying to work out what causes grasshopper numbers to increase so suddenly, in order to predict when a plague might
occur. The answer may lie in not one but a combination of factors, including the availability of the plants the insects use for food, and the ability of predators like birds and spiders to keep the insects’ eggs under control. Read more about Malthus and an opponent’s view and watch our ‘Bugs vs Burgers’ video online.
SUPErSIZEDThe implications
of persistent population growth
chANGES bIG AND SmALLPopulations can change in obvious ways – such as growing or shrinking over time – or in more subtle ways.
Charles Darwin saw that individuals with attributes that made them more successful at living and reproducing tended to leave more offspring. His insight was that if these attributes were inherited, they would become more common in the population. Darwin didn’t know that inheritance depends on genes, but otherwise his ideas about natural selection were right. Other processes that can affect gene frequency include migration, or even chance events. The Hardy–Weinberg principle states that the gene pool in a population will remain constant unless evolutionary forces are at work. Evolution is therefore the change in the frequency of genes (or their alleles) over time. Deer mice are a good example: a gene variant for light-coloured fur has spread in a Nebraskan population of deer mice since a glacier deposited light-coloured sand on their habitat around 10 000 years ago. Lighter fur provided better camouflage, so those mice with it survived to pass on their genes.
Genetic variation is important as a means for future adaptation to changes in the environment. Small, isolated populations have less variation, and inbreeding can lead to what is called a genetic bottleneck effect. For example, scientists are currently concerned about the lack of genetic variability in endangered bearded vulture populations. In human populations inbreeding has
had some unusual results. The Fugate family of Kentucky became famous for its blue skin, caused by the chance marriage of two individuals with the same rare gene variant, which was then passed on to the next generation through marriages within the family.
For more on evolution, read our previous issue Big Picture: Evolution online.
EVOLUTIONAry fOrcESWhat’s Darwin got to do with it?
MORE ONLINE: bigpictureeducation.com/populations
This graph shows the Hardy–Weinberg proportions for two different alleles (A and a) at a single gene locus. Take a closer look at the graph. What are the frequencies of the different genotypes if the allele frequency for p is 0.7 and q is 0.3? (Hint: look at the dotted line.) Using the equation above, we can expect 0.49 of the population to be AA, 0.42 of the population to be Aa and 0.09 of the population to be aa. Don’t forget – this principle only holds if no evolutionary forces are at work. Use it as standard for comparing changes in populations.
The Hardy–Weinberg principle (p2+2pq+q2 = 1)
expe
cted
gen
otyp
e fr
eque
ncy
allele frequency
Thomas Robert Malthus Wellcome Library, London
aa p2 q22pq
0.1 0.2 0.3 0.4 0.5 0.6 0.7 0.8 0.9 10.9 0.8 0.7 0.6 0.5 0.4 0.3 0.2 0.1 0
0
1
0.8
0.4
0.6
0.2
aa aa
q–1p–0
summer 2014 | 7
AN UNEASy rELATIONShIP
Populations and disease are intertwined
Ecologists often divide the factors influencing ecosystem and population change into two types. biotic or intrinsic factors relate to living organisms, and include predators and competition between organisms for food, while abiotic or extrinsic factors relate to non-living aspects of the environment, such as water or places to live. Biotic and abiotic factors interact. For example, in the 1970s a drought (an abiotic factor) caused a crash in the population of medium ground finches living on one of the Galapágos Islands. The birds were pushed to the brink of extinction as the drought wiped out their food supply, seeds (a biotic factor). Biotic and abiotic factors typically influence population size in different ways. Abiotic factors (like temperature) may affect individuals whatever the size of the population: they are density-independent. On the other hand, biotic factors may have different effects depending on the population size: a single predator may have a much bigger impact on a small population than a large one; and competition for territory may force some animals out of prime mating areas when populations are large. Such effects are density-dependent. However, weather alters habitat quality, so these factors almost always interact.
bEhIND ThE ScENESWhat causes change?
The spread of disease affects a population in the short term through ill health and death, but also in the long term by influencing the overall genetic structure of the population. One of the leading causes of death globally is HIV/AIDS. There were 1.6 million AIDS-related deaths in 2012, with many occurring in populations in low-income countries where treatment is less affordable. The ravages of HIV/AIDS may affect the genetic make-up of populations. One genetic mutation, CCR5-delta 32, protects against HIV, helping people survive. It is therefore becoming more common – and more likely to spread in affected regions. Some scientists think that CCR5-delta 32 may have offered protection from other diseases in the past and that this is why it’s particularly common in Europe, where bubonic plague wiped out around a third of the population in the 14th century. The behaviour of some diseases depends on population size. Measles statistics show that before a vaccine became available, larger cities were associated with an increased frequency of epidemics. This is probably because in smaller cities there were not enough susceptible people to allow the measles virus to circulate – people had already been infected and become immune. Plants get sick too, of course. A fungal disease called ash dieback, which has been spreading through Europe since the 1990s, has killed between 60 per cent and 90 per cent of Denmark’s ash trees, leaving only a small population of resistant trees. Ash trees are important in woodlands because their canopies allow light to filter through to support life on the ground.
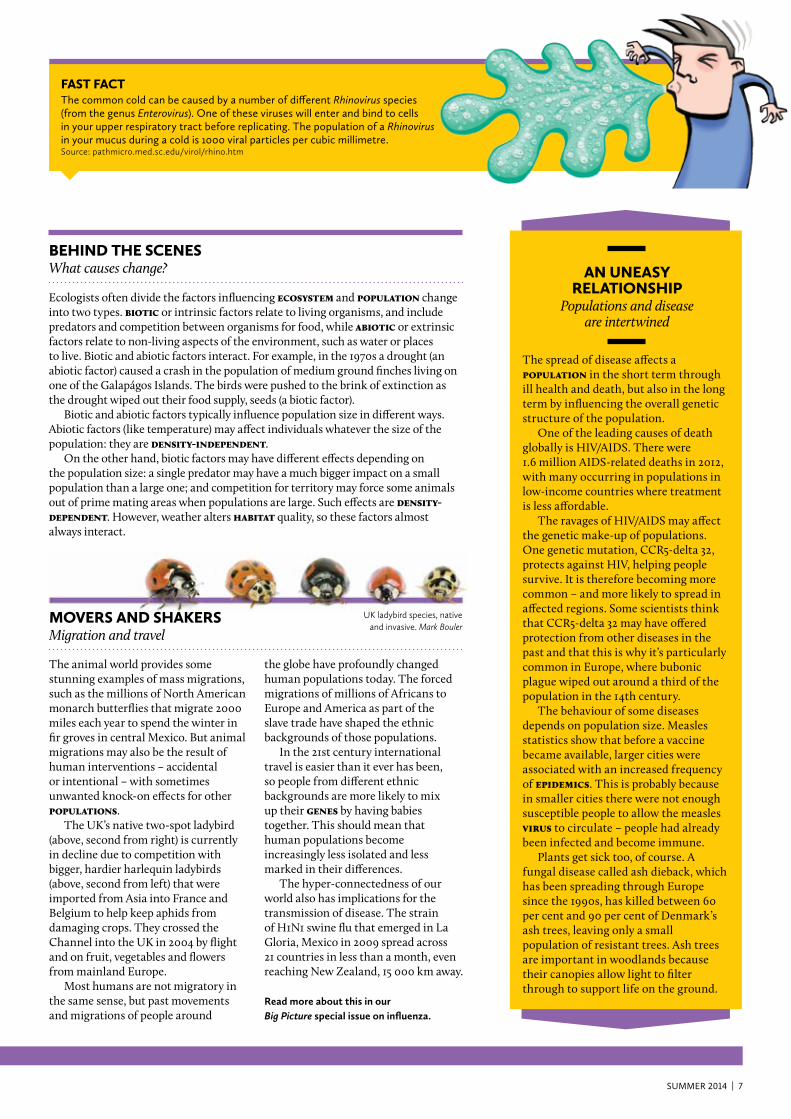
The animal world provides some stunning examples of mass migrations, such as the millions of North American monarch butterflies that migrate 2000 miles each year to spend the winter in fir groves in central Mexico. But animal migrations may also be the result of human interventions – accidental or intentional – with sometimes unwanted knock-on effects for other populations. The UK’s native two-spot ladybird (above, second from right) is currently in decline due to competition with bigger, hardier harlequin ladybirds (above, second from left) that were imported from Asia into France and Belgium to help keep aphids from damaging crops. They crossed the Channel into the UK in 2004 by flight and on fruit, vegetables and flowers from mainland Europe. Most humans are not migratory in the same sense, but past movements and migrations of people around
the globe have profoundly changed human populations today. The forced migrations of millions of Africans to Europe and America as part of the slave trade have shaped the ethnic backgrounds of those populations. In the 21st century international travel is easier than it ever has been, so people from different ethnic backgrounds are more likely to mix up their genes by having babies together. This should mean that human populations become increasingly less isolated and less marked in their differences. The hyper-connectedness of our world also has implications for the transmission of disease. The strain of H1N1 swine flu that emerged in La Gloria, Mexico in 2009 spread across 21 countries in less than a month, even reaching New Zealand, 15 000 km away. Read more about this in our Big Picture special issue on influenza.
UK ladybird species, native and invasive. Mark Bouler
mOVErS AND ShAKErS Migration and travel
the common cold can be caused by a number of different Rhinovirus species (from the genus Enterovirus). one of these viruses will enter and bind to cells in your upper respiratory tract before replicating. the population of a Rhinovirus in your mucus during a cold is 1000 viral particles per cubic millimetre.Source: pathmicro.med.sc.edu/virol/rhino.htm
fAST fAcT

8 | BIG PICTURE 20: populations
cOmPLEx NETwOrKSSpecies, populations and individuals interact with each other all the time, and for many different reasons.
ThE GAmE Of LIfE Competing for survival
Most animals interact with other animals or plants directly because they depend on them for food. They also compete with animals of their own species, or with other animal populations, for the same food sources, especially when these are scarce. Some species interact for mutual benefit – like the birds that feed on the mites that pester buffalo – and some, like viruses and parasites, only interact to help themselves. Human populations are involved in more interactions
with other species than it seems possible to count – from our domestication of animals for food and companionship, to the destruction of natural ecosystems, to the communities of bacteria in our guts that help us digest our food. Of course, human populations also interact with one another. Like all animals, we fight over territory and resources, even as we try to cooperate for the greater good. Within all ecosystems there is competition for precious
resources, such as light, water or space. When competition is between members of the same species, it is intraspecific; when it is between different species, it is interspecific. Scientists have spent many years studying interspecific competition between crayfish species across Europe and North America. In many areas of the UK native white-clawed crayfish (above left) are being replaced by invasive North American signal crayfish (above right), which originally escaped
from British crayfish farms. The larger invaders oust the native crayfish from the limited refuges under rocks in streams and rivers and compete for food. They also carry a fungal plague, to which the UK species has no defence. Their battle over niche is an example of the competitive exclusion principle, which states that it is impossible for two species in the same ecosystem to coexist if they are competing for the same resources.
MORE ONLINE: bigpictureeducation.com/populations
TALK TALKBacteria communicate with each other using quorum sensing
Humans talk to one another. Other animals, like birds and whales, also use sound to communicate. But in the bacterial world, conversation is chemical. This chemical communication, or ‘quorum sensing’, is what allows bacteria to synchronise the type of coordinated attack that will leave you feeling sick. Since the discovery of quorum sensing several decades ago, scientists have realised that all bacteria use it to communicate all the time – within their own population and with other populations of bacteria within the same community. Quorum sensing is based on population density. Bacteria release communication molecules that float away when the population is small. But when the population is large and the bacteria are all squashed together, the communication chemicals build up to a level that signals to the bacteria that they are surrounded. One universal molecule is used by all types of bacteria to provide information about
a community as a whole, whereas more specialised molecules are used by individuals of the same species – each has its own chemical language. A curious light-producing bacterium called Vibrio fischeri uses quorum sensing molecules to sense when its population has grown to a certain size, at which point all the bacteria in the population switch on their lights. The bacteria are symbiotic, living in an organ of the Hawaiian bobtail squid (pictured above). The bacteria’s luminescence prevents these squid from casting shadows on moonlit nights, which in turn helps them avoid predators.
cOOPErATION Some species are natural
partners, or even bedfellows
Snapping shrimps build their homes by burrowing into the seafloor, but they don’t sleep alone. At night a shrimp will share its burrow with a goby fish. In return, the fish guards the entrance to the burrow, alerting the shrimp with a waggle of its tail when it spies danger. This kind of close cooperation between species is known as symbiosis, or mutualism. Other symbionts include Rhizobia, the soil bacteria that live in the roots of bean and pea plants, where they convert nitrogen into nutrients that the plants need to grow (a process called nitrogen fixation).
How does conservation fit into this picture? Find out at bigpictureeducation.com/conservation
MJ M
cFall–Ngai
Left: Linda Pitkin/2020VISION/naturepl.com Right: Rob Jordan/2020VISION/naturepl.com
summer 2014 | 9
MORE ONLINE: bigpictureeducation.com/populations
fIGhT TO ThE fINISh Understanding host–pathogen interactions
An infection occurs when a population of pathogens (the disease-causing agents) grow in or on an organism (the host), affecting its function. The host population might be made up of people, animals, plants or even bacteria. Some pathogens infect more than one host – like the flu viruses that infect birds as well as humans, and the tuberculosis-causing bacteria that infect cows and badgers. At the individual level of the host, an infection is a battle between its defences – its immune system – and the strategies that the pathogen population deploys to bypass these defences. A healthy human immune system will fight off the pathogen and develop antibodies that can recognise it in the future. At the population level this creates an arms race between the pathogen population and the host population, in which the pathogen evolves new strategies to overcome the hosts’ defences. In human populations these defences involve drugs and vaccines as well as naturally developed immunity. Viruses can only live and reproduce inside their hosts’ cells. Any flu virus that leaves your body via a sneeze will only survive on a door handle or a kitchen surface for a matter of hours. This is why viral epidemics can only sustain themselves if enough new, susceptible members of the population are available to spread the infection. The success of measles and cervical cancer vaccines depends on critical thresholds of vaccination being reached within a population, thereby preventing the viruses that cause these diseases from moving easily between one host and another. This concept is known as ‘herd immunity’.
Read more about herd immunity online: bigpictureeducation.com/herd-mentality
SOUrcES Of SUSTENANcEHow do humans and plants interact?
The human population depends on crop plants for food. Supermarket shelves are stocked with a wide selection of fruit, vegetable and grain varieties. But relative to the diversity present within nature, our options are limited. So what does this mean for those plants that have made it onto the menu? Plant crops are very different to their wild ancestors. Over thousands of years we have domesticated them to produce hardier species that are easier to grow. The ancestor of the modern-day apple is a wild Asian species that is today considered vulnerable to extinction. Agriculture creates an unnatural environment for food crops. One problem with the systems of intensive agriculture that keep the growing human population fed is that they rely on monoculture – the cultivation of a single crop over very large areas. Monoculture is risky because it leaves plant populations susceptible to pests and diseases that can wipe out entire crops. In the most extreme cases we face the possibility of losing important food crops entirely. Of over 1000 banana varieties, for example, only one, the Cavendish banana, accounts for 99 per cent of exports globally, and it is currently under threat from a deadly fungus known as Panama disease. If we want to save our supermarket bananas, we may have to consider genetic modification to provide them with disease-resistant genes. Or start eating other types of bananas.
Debate and discuss GM crops on page 13.
Malcolm
Chivers
the herd immunity threshold (the percentage of the population that needs to be immunised for the whole to be protected) for a very infective disease like measles can be as high as 94 per cent, whereas for mumps it could be as low as 75 per cent.Source: Centers for Disease Control, USA www.bt.cdc.gov/agent/smallpox/training/overview/pdf/eradicationhistory.pdf
fAST fAcT
10 | BIG PICTURE 20: populations
chOOSE yOUr POPULATIONIn this section we’ll use the common periwinkle (Littorina littorea) and the seaweed (a type of algae) that provides its habitat, dabberlocks (Alaria esculenta), as examples, but most of the questions we’ll ask can apply to any population. Consider the extent of your survey. Do you want to sample the population of a single beach or an entire coastline? What is feasible in the time that you have?
whAT DO yOU wANT TO fIND OUT?Are you just counting the numbers of periwinkles and dabberlocks algae? Perhaps you’re interested in something more complex like behaviour, disease or size/age? Do you want to compare populations at different sites or at different times? Devise a method that will allow you to collect the particular information you need.
whAT SOrT Of SAmPLES wILL yOU cOLLEcT?How many samples will you need to take? How can you ensure all the samples are taken in the same way? Will you use random or systematic sampling? You may want to divide your survey area into zones or decide how many periwinkles to sample at each survey location. Write up your method, making it clear enough for someone else to follow it.
hOw wILL yOU IDENTIfy mEmbErS Of yOUr POPULATION?Do you know what dabberlocks looks like? How will you tell it apart from other seaweeds? An identification chart is useful. (See: nhm.ac.uk/resources-rx/files/the-big-seaweed-search--36073.pdf. Can you create something similar for periwinkles?)
whAT wILL yOU NEED TO TAKE wITh yOU?Remember your identification chart and anything you’ll need to take your samples or record the data you are collecting. Are there any other practical items that you might need, like wellies or warm clothes? Have you completed a risk assessment?
whAT wILL yOU DO wITh yOUr DATA?When you’ve collected your data, how will you know what they mean? Will you have to calculate ranges or averages? How will you show if your results are significant? Think about the amount of data you will produce, whether you have enough time to analyse them, and how you could display your results visually, so that they are easy to understand.
hOw wILL yOU cOmmUNIcATE yOUr rESULTS?Once you’ve analysed your data, you’ll be able to see if and why your results are important. Decide how you’re going to convey their importance to others, so they can build on the knowledge.
STEP by STEPSet up your own population study
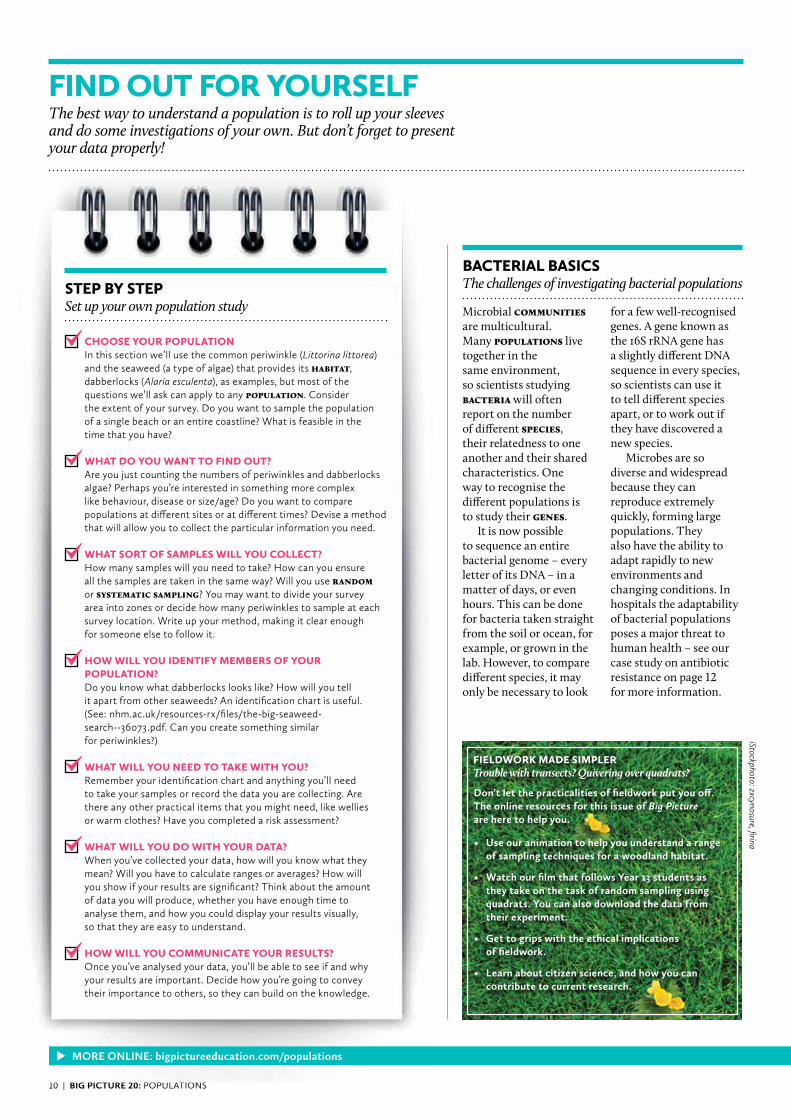
fIND OUT fOr yOUrSELfThe best way to understand a population is to roll up your sleeves and do some investigations of your own. But don’t forget to present your data properly!
MORE ONLINE: bigpictureeducation.com/populations
bAcTErIAL bASIcSThe challenges of investigating bacterial populations
Microbial communities are multicultural. Many populations live together in the same environment, so scientists studying bacteria will often report on the number of different species, their relatedness to one another and their shared characteristics. One way to recognise the different populations is to study their genes. It is now possible to sequence an entire bacterial genome – every letter of its DNA – in a matter of days, or even hours. This can be done for bacteria taken straight from the soil or ocean, for example, or grown in the lab. However, to compare different species, it may only be necessary to look
for a few well-recognised genes. A gene known as the 16S rRNA gene has a slightly different DNA sequence in every species, so scientists can use it to tell different species apart, or to work out if they have discovered a new species. Microbes are so diverse and widespread because they can reproduce extremely quickly, forming large populations. They also have the ability to adapt rapidly to new environments and changing conditions. In hospitals the adaptability of bacterial populations poses a major threat to human health – see our case study on antibiotic resistance on page 12 for more information.
fIELDwOrK mADE SImPLErTrouble with transects? Quivering over quadrats?
Don’t let the practicalities of fieldwork put you off. The online resources for this issue of Big Picture are here to help you.
• Useouranimationtohelpyouunderstandarange of sampling techniques for a woodland habitat. • WatchourfilmthatfollowsYear13studentsas they take on the task of random sampling using quadrats. You can also download the data from their experiment. • Gettogripswiththeethicalimplications of fieldwork. • Learnaboutcitizenscience,andhowyoucan contribute to current research.
iStockphoto: zxcynosure, firina
summer 2014 | 11
MORE ONLINE: bigpictureeducation.com/populations
TrEASUrE hUNTUsing data on human
populations
Information collected via birth and death registers, national censuses and other sources – from insurance companies to online social networks – means that there is always a wealth of data available for studying human populations that isn’t available for other species.
Studying human populations might just be a case of locating data that have already been collected and analysing them in the correct way. This type of study is based on secondary data, not collected for the specific purposes of the study. For example, scientists wanting to study driving behaviour across Germany used data from a transport survey, combined them with satellite data and plotted them on a map. They showed that people who lived further away from built-up urban areas
were more likely to own a car and to drive further each week. However, when data are collected for other reasons, it is difficult to firmly link cause and effect. In this type of study you would have to account for factors such as wealth and family size, rather than just assuming differences were due to distance from local amenities. In a medical trial it is important to eliminate such ‘confounding’ factors, which influence both the risk of contracting and the outcome
of the disease being studied. Imagine researchers want to study the safety of a commonly prescribed blood pressure drug. They could look at death rates among people taking blood pressure drugs over the last five years. But a new study, using primary data, may be preferable. In this way, the study parameters can be controlled to account for confounding factors, such as other medical conditions and age. See our ‘Number Crunching’ issue for more on data.
PrESENTATION IS EVEryThINGThe data you collect can’t reach their full potential until they’re presented
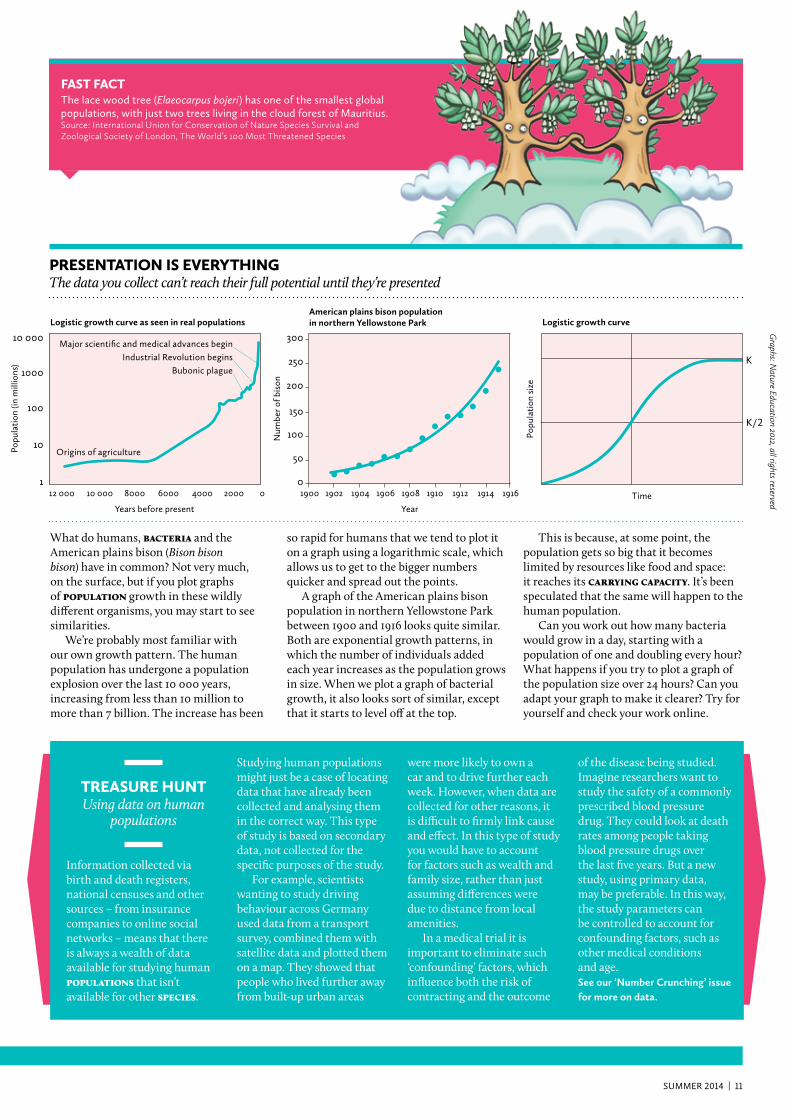
What do humans, bacteria and the American plains bison (Bison bison bison) have in common? Not very much, on the surface, but if you plot graphs of population growth in these wildly different organisms, you may start to see similarities. We’re probably most familiar with our own growth pattern. The human population has undergone a population explosion over the last 10 000 years, increasing from less than 10 million to more than 7 billion. The increase has been
so rapid for humans that we tend to plot it on a graph using a logarithmic scale, which allows us to get to the bigger numbers quicker and spread out the points. A graph of the American plains bison population in northern Yellowstone Park between 1900 and 1916 looks quite similar. Both are exponential growth patterns, in which the number of individuals added each year increases as the population grows in size. When we plot a graph of bacterial growth, it also looks sort of similar, except that it starts to level off at the top.
This is because, at some point, the population gets so big that it becomes limited by resources like food and space: it reaches its carrying capacity. It’s been speculated that the same will happen to the human population. Can you work out how many bacteria would grow in a day, starting with a population of one and doubling every hour? What happens if you try to plot a graph of the population size over 24 hours? Can you adapt your graph to make it clearer? Try for yourself and check your work online.
time
Logistic growth curveAmerican plains bison population in northern Yellowstone ParkLogistic growth curve as seen in real populations
popu
lati
on s
ize
popu
lati
on (i
n m
illio
ns)
num
ber o
f bis
on
Years before present Year
Graphs: N
ature Education 2012, all rights reserved
30010 000
200
150
1000
origins of agriculture
major scientific and medical advances begin industrial revolution begins
Bubonic plague
5010
250
100
100
K
K/2
01190012 000 19084000 19048000 19120 190210 000 19102000 19066000 1914 1916
the lace wood tree (Elaeocarpus bojeri) has one of the smallest global populations, with just two trees living in the cloud forest of mauritius.Source: International Union for Conservation of Nature Species Survival and Zoological Society of London, The World’s 100 Most Threatened Species
fAST fAcT
12 | BIG PICTURE 20: populations
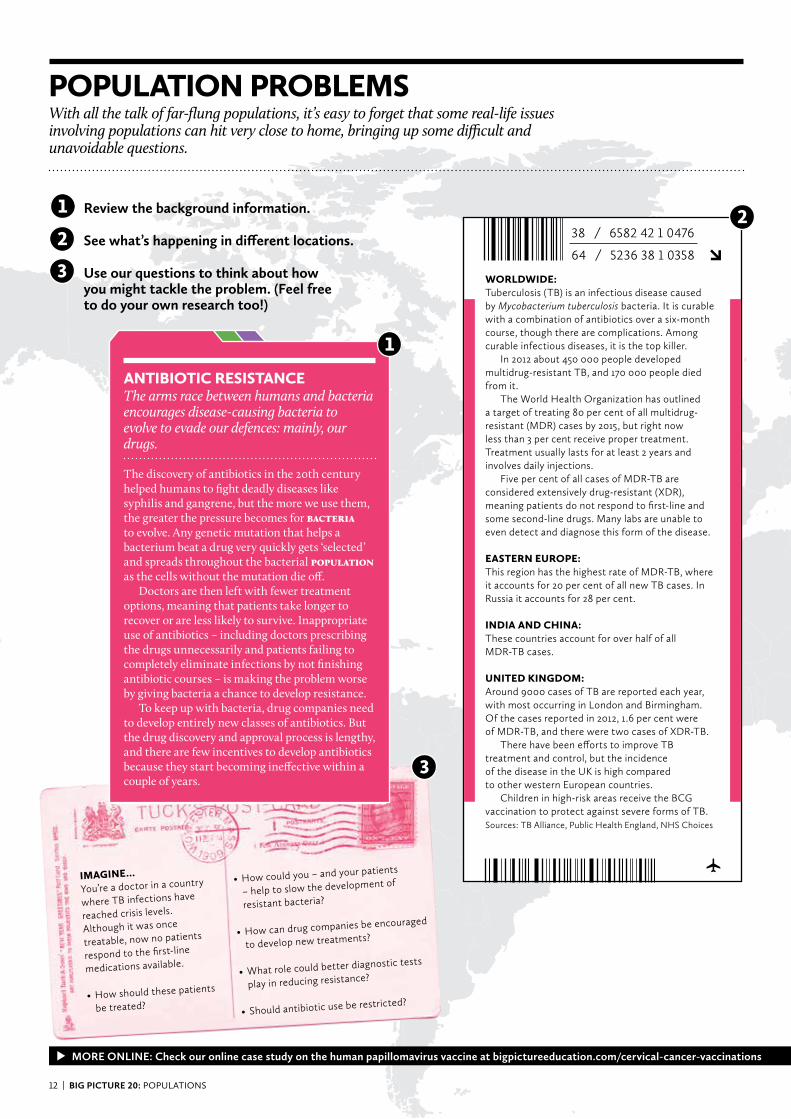
The discovery of antibiotics in the 20th century helped humans to fight deadly diseases like syphilis and gangrene, but the more we use them, the greater the pressure becomes for bacteria to evolve. Any genetic mutation that helps a bacterium beat a drug very quickly gets ‘selected’ and spreads throughout the bacterial population as the cells without the mutation die off. Doctors are then left with fewer treatment options, meaning that patients take longer to recover or are less likely to survive. Inappropriate use of antibiotics – including doctors prescribing the drugs unnecessarily and patients failing to completely eliminate infections by not finishing antibiotic courses – is making the problem worse by giving bacteria a chance to develop resistance. To keep up with bacteria, drug companies need to develop entirely new classes of antibiotics. But the drug discovery and approval process is lengthy, and there are few incentives to develop antibiotics because they start becoming ineffective within a couple of years.
MORE ONLINE: Check our online case study on the human papillomavirus vaccine at bigpictureeducation.com/cervical-cancer-vaccinations
POPULATION PrObLEmSWith all the talk of far-flung populations, it’s easy to forget that some real-life issues involving populations can hit very close to home, bringing up some difficult and unavoidable questions.
ANTIbIOTIc rESISTANcEThe arms race between humans and bacteria encourages disease-causing bacteria to evolve to evade our defences: mainly, our drugs.
See what’s happening in different locations.
Use our questions to think about how you might tackle the problem. (Feel free to do your own research too!)
wOrLDwIDE:Tuberculosis (TB) is an infectious disease caused by Mycobacterium tuberculosis bacteria. It is curable with a combination of antibiotics over a six-month course, though there are complications. Among curable infectious diseases, it is the top killer. In 2012 about 450 000 people developed multidrug-resistant TB, and 170 000 people died from it. The World Health Organization has outlined a target of treating 80 per cent of all multidrug-resistant (MDR) cases by 2015, but right now less than 3 per cent receive proper treatment. Treatment usually lasts for at least 2 years and involves daily injections. Five per cent of all cases of MDR-TB are considered extensively drug-resistant (XDR), meaning patients do not respond to first-line and some second-line drugs. Many labs are unable to even detect and diagnose this form of the disease.
EASTErN EUrOPE:This region has the highest rate of MDR-TB, where it accounts for 20 per cent of all new TB cases. In Russia it accounts for 28 per cent.
INDIA AND chINA: These countries account for over half of all MDR-TB cases.
UNITED KINGDOm:Around 9000 cases of TB are reported each year, with most occurring in London and Birmingham. Of the cases reported in 2012, 1.6 per cent were of MDR-TB, and there were two cases of XDR-TB. There have been efforts to improve TB treatment and control, but the incidence of the disease in the UK is high compared to other western European countries. Children in high-risk areas receive the BCG vaccination to protect against severe forms of TB. Sources: TB Alliance, Public Health England, NHS Choices
38 / 6582 42 1 0476
64 / 5236 38 1 0358
ImAGINE...
You’re a doctor in a country
where TB infections have
reached crisis levels.
Although it was once
treatable, now no patients
respond to the first-line
medications available.
•Howshouldthesepatients
be treated?
•Howcouldyou–andyourpatients
– help to slow the development of
resistant bacteria?
•Howcandrugcompan
iesbeencouraged
to develop new treatments?
•Whatrolecouldbette
rdiagnostictests
play in reducing resistance?
• Shouldantibioticuseb
erestricted?
Review the background information.

ImAGINE…
A government struggling
to cope with overpopulation
decides it will only offer
housing benefit to those
of childbearing age if they
agree to use birth control.
•Doyouthinkthisisagoodidea?
Why or why not?
•Whataretheimplicationsfor
current and future populations?
•Canyouthinkofanyalternatives
for dealing with overpopulation?
summer 2014 | 13
MORE ONLINE: Check our online case study on the human papillomavirus vaccine at bigpictureeducation.com/cervical-cancer-vaccinations
•Whatarethebenefitsandrisks for farmers, for consumers and to biodiversity of switching to the GM crop?
•Whoownsthesenewvarieties? Who should own them?
ImAGINE…Scientists engineer a new type of Cavendish banana that is resistant to Panama disease.
•Wouldyoubehappy to eat GM bananas? Why or why not?
bIrTh cONTrOLMany low- and middle-income countries are struggling with soaring populations, and throughout the world, people are living longer.
KENyA:In Kenya rapid population growth since the 1950s has put pressure on resources such as land for farming, water and healthcare. Use of contraception increased from 7 per cent in 1978 to 46 per cent in 2008, contributing to a reduction in the average number of children per mother from eight to five. However, over 10 million Kenyans still do not have enough food or have poor diets.
chINA:China’s one-child policy, introduced in 1979, prevented hundreds of millions of births by withdrawing benefits and imposing fines on couples who had more than one child. The policy went against traditions favouring large families and may have led to some women undergoing unwanted abortions or sterilisation. Most abortions during this time were of female fetuses. There are now fewer women than men in China, and single-child families have produced fewer working-age adults to support the older generation. Recently, China relaxed its policy.
frANcE:France adopted a pro-natal policy for the first half of the 20th century – the ‘Code de la famille’ – which offered strong incentives for having a three-child family. It also included a ban on contraceptives, though this was lifted in the 1960s.
22 / 9745 76 1 0428
79 / 9242 20 1 0219
GENETIc mODIfIcATIONMany scientists claim that genetically modified (GM) crops will contribute to feeding a larger population more sustainably, though anti-GM campaigners disagree.
NOrTh AND SOUTh AmErIcA:In the USA, where 40 per cent of GM crops are grown, a type of pest-resistant GM corn was removed from sale because it was thought that the bacterial genes it contained might cause allergies. Brazil grows 23 per cent of the world’s GM crops, while Argentina grows 14 per cent. Concerns are not just related to consumer safety, but also to the effects of GM crops on agricultural ecosystems. For example, one GM cotton crop that was created to tolerate a particular weedkiller resulted in the growth of ‘super-weeds’ that became resistant to the weedkiller after farmers started applying it too heavily.
EUrOPE:GM crops are hardly grown at all. This is partly due to the perception among some consumers that GM foods are unnatural and potentially unsafe. There is no clear evidence that the risks associated with eating GM foods are greater than for non-GM foods. In a 2012 Wellcome Monitor survey here in the UK, 90 per cent of adults and 83 per cent of young people had heard of the term ‘GM’/‘genetically modified’, but only 34 per cent thought they had a very good or good understanding of it. A quarter of adults thought that by eating GM fruit a person’s genes could also become modified, while just under a third of young people thought the same.
AfrIcA:Plantings of GM food crops are small, but Bt cotton is very popular. There is mistrust of the companies that sell GM products because the seeds are expensive, making it difficult for farmers from low- and middle-income countries to afford them.
42 / 9345 83 1 0216
55 / 8244 66 1 0861

14 | BIG PICTURE 20: populations
rUPErT hOUGhTONPhD student studying crayfish populations
PhILIP TAyLOrApple farmer
rEAL VOIcESFour people talk to us about the role of populations in their lives. Meet Rupert Houghton, a PhD student modelling crayfish populations, Philip Taylor, a long-time apple farmer from Essex, and Tejovathi and Gopal Rao, a married couple who migrated from the village to the city in India.
MORE ONLINE: bigpictureeducation.com/populations
What do you do?I have been farming for over 30 years, and with my brother Stephen, we are the third generation of my family to grow fruit at Lathcoats Farm. What do you farm?Our speciality is apples! We grow over 40 varieties of apple, including Essex’s own Chelmsford Wonder. But we also grow strawberries, raspberries, currants, cherries and gooseberries. What factors affect your yield?They are very often out of our control, such as the weather! If conditions are favourable, we can produce up to 450 tonnes of apples, but poor weather such as frost, hail, or excessive rain or wind can almost completely destroy the yield. This can be particularly detrimental if it coincides with flowering, as it is not conducive to pollination. There are also a number of biotic factors – such as fungi, mildews and storage rots – that can affect the quality of the fruit, as well as the yield. Do you have a problem with pests?There are various pests, such as aphids, mites, birds and moth caterpillars, but we can normally control these well
using pheromone traps and disrupters. We are also able to manage our orchard edges, hedgerows and grasslands to attract certain insects that feed on the pests.
How has the apple farming industry changed over your lifetime?The most notable changes have been in the marketing conditions and in consumer preferences, rather than in technology. Customers now require crisp, crunchy and sweet apples, such as Gala and Braeburns, rather than the more traditional varieties. We have also experienced decreasing profit margins due to increasing growing costs. As a result, high yields are now essential, and we have had to increase the planting densities. What does the future hold?We will probably see a reduction in the number of smaller fruit growers, with a move towards fewer but bigger producers who are able to implement complex and expensive growing systems to ensure a reliable yield and quality. Find out more at eapples.co.uk
What do you do? I am a first-year PhD student at the University of Aberdeen using population-modelling techniques to find the most effective combination of eradication methods for managing the invasive American signal crayfish in Scotland.
How did you get into population modelling?It’s always been my ambition to forge a career in the natural sciences. I studied Biology, Physics and Maths at A level, completed my BSc in Biological Sciences, my Master’s in Ecology, Evolution and Conservation, and have worked for several ecological consultancy firms. I applied for my PhD because I am interested in the ecology of aquatic animals. I’m using population modelling specifically because it allows you to answer important conservation questions without having to conduct large-scale, expensive and impractical experiments. What is the most interesting thing about your population model?Using my model I’ll be able to inform real ecological management strategies, which could eventually be incorporated into the daily routine of river and fishery managers all over the UK.
What is an average day like when completing fieldwork?I’m currently working with a group of volunteers on the River Nairn, not far from Inverness. We meet weekly, checking crayfish traps and counting, sexing, measuring and weighing the crayfish captured. What would you like to achieve using your population model?I’m interested in finding out the movements of crayfish exposed to different eradication methods, as we may find that it’s easier to slow down the spread of the crayfish than to reduce their numbers. Finally, do you eat crayfish? I don’t eat signal crayfish. If culinary value is attributed to them, people will likely spread them into new catchments to harvest them. Also, harvesting may actually encourage population growth, because traps typically catch large males, who dominate subordinate crayfish and reduce the survival and growth of juveniles.

summer 2014 | 15
TEjOVAThI AND GOPAL rAOMarried couple living in Chandanagar, Hyderabad, India
MORE ONLINE: bigpictureeducation.com/populations
When did you migrate to the city?G: I came here in 1966, when I was eight or nine years old. My older brother got a job here, so we moved from a small village near Warangal, about 180 km away.T: I came when I got married to Gopal – my brother worked in the same factory as his brother.
What’s changed since you arrived?G: In 1966 this area had about 40 houses – there are many more people now.T: People are changing, adopting artificial lifestyles. There is less time to interact. I’ve changed too, of course, but I still care about others.
How’s your health here in the city?G: I have diabetes, like most of my friends and relatives. About 18 months ago I had a heart attack. I went to the hospital and was given a stent. I also have epilepsy, so I now take three types of tablet every day – I’ve had to set up alerts on my phone to remind me when to take them all.T: I can’t do too much exercise because I had polio when I was a child and it left me with a knee problem, but I try to keep moving. I took part in a research project called the Indian Migration Study a few years ago, looking at the health of people working in my brother’s factory. Survey questions about physical activity made me think about my health, so I do all the housework by hand now and I’ve stopped sleeping in the daytime.
What is your diet like?T: We have improved our diet since the study. A good diet avoids oil, roots and cabbage. We eat beans instead. I’ve stopped using salt, which was harder than cutting down on fat and sugar. No rice, either – just wheat chapattis, which are less fattening. No spiced food and no meat.G: Every day the first food I take is garlic and fenugreek – they are antibiotic and good for diabetes. My blood pressure is normal; I spend an hour and a half each day in prayer, which helps.
Which is better, living in a city or a village?G: It is better to live in a village because there is no pollution. Here there is lots of pollution – water pollution, air pollution – that makes people sick. But all my friends are in Hyderabad now, and my cousins live in the city too. One of my brothers moved to Mumbai; our daughter got married and our son emigrated to Australia. So I wouldn’t go back to the village – there is no one there any more!
This interview was done through a translator.
Education editor: Louise StubberfieldEditor: Jennifer Trent StavesAssistant editor: Rob ReddickWriters: Hayley Birch, Justin Colver, Rob Reddick, Michael RegnierGraphic designer: Malcolm ChiversIllustrator: Glen McBethPublisher: Mark HendersonHead of Education and Learning: Hilary Leevers
Teachers’ advisory board: Peter Anderson, Paul Connell, Emma Cresswell-Maynard, Alison Davies, Ian Graham, Stephen Ham, Kim Hatfield, Tyrone John, Jaswinder Kaur, Pauline Newnham, Robert Rowney, Jonathan Schofield
Advisory board: Tim Benton, Sarah Chan, Lia Commissar, Rob Freckleton, Chrissie Giles, Peter Greenberg, Sophie Mathewson, Giles Newton, Iain Palot, Robin Sutton, Frank Tanser, Beth Thompson, Cesar Victora, Bruce Winney, Paul Woodgate
Student reviewers: Kitty Hudson-Long, Kanak Shah
Wellcome Trust: We are a global charitable foundation dedicated to achieving extraordinary improvements in human and animal health. We support the brightest minds in biomedical research and the medical humanities. Our breadth of support includes public engagement, education and the application of research to improve health. We are independent of both political and commercial interests.
The future of science depends on the quality of science education today.
All images, unless otherwise indicated, are from Wellcome Images (images.wellcome.ac.uk).Big Picture is © the Wellcome Trust 2014 and is licensed under Creative Commons Attribution 4.0 International. ISSN 1745-7777.
Cartoon illustrations are © Glen McBeth.
This is an open access publication and, with the exception of images and illustrations, the content may unless otherwise stated be reproduced free of charge in any format or medium, subject to the following conditions: content must be reproduced accurately; content must not be used in a misleading context; the Wellcome Trust must be attributed as the original author and the title of the document must be specified in the attribution. The Wellcome Trust is a charity registered in England and Wales, no. 210183. Its sole trustee is The Wellcome Trust Limited, a company registered in England and Wales, no. 2711000 (whose registered office is at 215 Euston Road, London NW1 2BE, UK). PU-5938/30K/05–2014/MC
ThE TEAm

Available to UK addresses only
You’ll get a single copy of each issue when it’s published (twice a year) sent to you by post, along with any posters.
• Tosignupforasingle- copy subscription, visit myprofile.wellcome.ac.uk.• Tosignupforaclass-set subscription, email [email protected].
ELEcTrONIc
Available to UK and international addresses You’ll get a pDF copy of each issue when it’s published (twice a year) sent to you by email, along with any posters.
• Tosignupforanelectronic subscription, visit myprofile. wellcome.ac.uk.
bAcK ISSUES
Would you like to order a print copy of an older issue? We’d be happy to send past issues to you, as long as we have them in stock. • Toordersinglecopiesof back issues, visit myprofile. wellcome.ac.uk.• Toordermultiplecopiesof back issues, email [email protected].• TodownloadPDFcopiesof back issues, visit our website: bigpictureeducation.com/ issues.
fEEDbAcK as always, we love receiving your input. if you have any questions, comments or ideas, please share them with us at: [email protected]
Big Picture is a free post-16 resource that explores issues surrounding biology and medicine. All of our content is online at our new website bigpictureeducation.com. We offer both print and electronic subscriptions, allowing you to receive our content as soon as it’s published.
This document was printed on material
made from 25 per cent post-consumer
waste & 25 per cent pre-consumer waste. 50%
How to order a copy of BigPicture
VISIT OUr NEw bIG PIcTUrE wEbSITE
You’ll find ready-made teaching resources and activities for use in the classroom. Explore animations, games, videos and audio files to bring cutting-edge science to life.
bigpictureeducation.com
proteinsISSUE 19 | SPRING 2014
bRINGING CUTTING-EDGE SCIENCE INTo THE CLASSRooM
UNDER YOUR SKINExploring proteins in your body and beyond
iStockphoto/Creativeye99