Lean Operations - National Paralegal College · 2018-11-15 · Lean Operations Just-in-time (JIT)...
61
16 - 1 Copyright © 2017 Pearson Education, Inc. PowerPoint presentation to accompany Heizer, Render, Munson Operations Management, Twelfth Edition Principles of Operations Management, Tenth Edition PowerPoint slides by Jeff Heyl Lean Operations 16
Transcript of Lean Operations - National Paralegal College · 2018-11-15 · Lean Operations Just-in-time (JIT)...
16 - 1Copyright © 2017 Pearson Education, Inc.
PowerPoint presentation to accompany
Heizer, Render, Munson
Operations Management, Twelfth Edition
Principles of Operations Management, Tenth Edition
PowerPoint slides by Jeff Heyl
Lean Operations 16
16 - 2Copyright © 2017 Pearson Education, Inc.
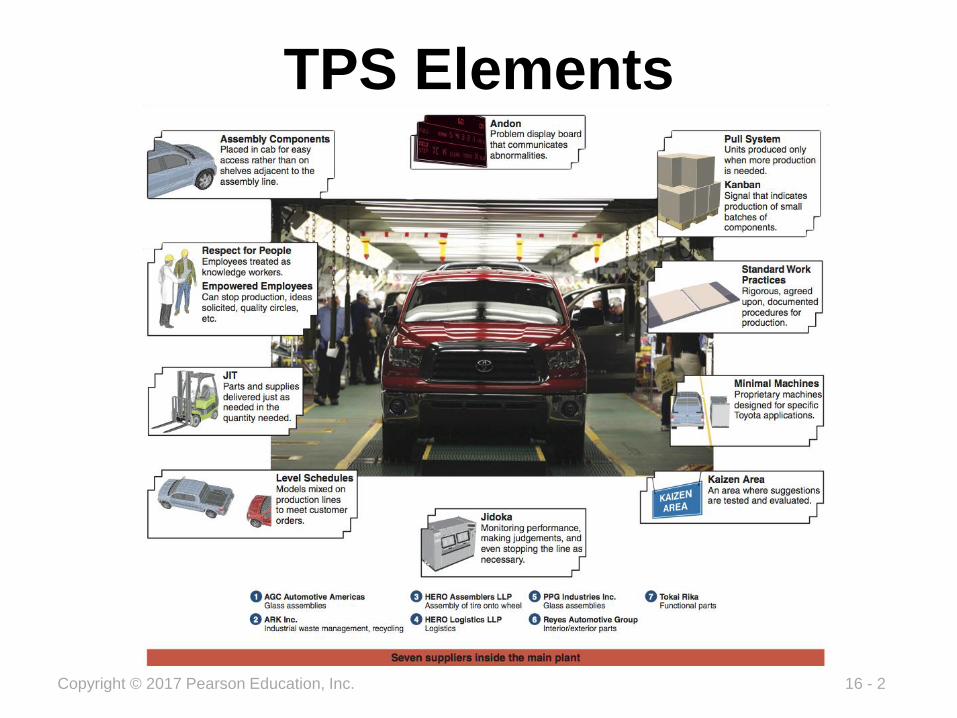
TPS Elements

16 - 3Copyright © 2017 Pearson Education, Inc.
Lean Operations
▶ Lean operations supply the customer with exactly what the customer wants when the customer wants it, without waste, through continuous improvement
▶ Driven by “pulling” customer orders

16 - 4Copyright © 2017 Pearson Education, Inc.
Lean Operations
▶ Just-in-time (JIT) focuses on continuous forced problem solving
▶ Toyota Production System (TPS) emphasizes continuous improvement, respect for people, and standard work practices in an assembly-line environment

16 - 5Copyright © 2017 Pearson Education, Inc.
Lean Operations
▶ Encompasses both JIT and TPS
▶ Sustains competitive advantage and increases return to stakeholders
▶ Three fundamental issues
▶ Eliminate waste
▶Remove variability
▶ Improve throughput

16 - 6Copyright © 2017 Pearson Education, Inc.
Eliminate Waste
▶Waste is anything that does not add value from the customer point of view
▶ Storage, inspection, delay, waiting in queues, and defective products do not add value and are 100% waste
16 - 7Copyright © 2017 Pearson Education, Inc.
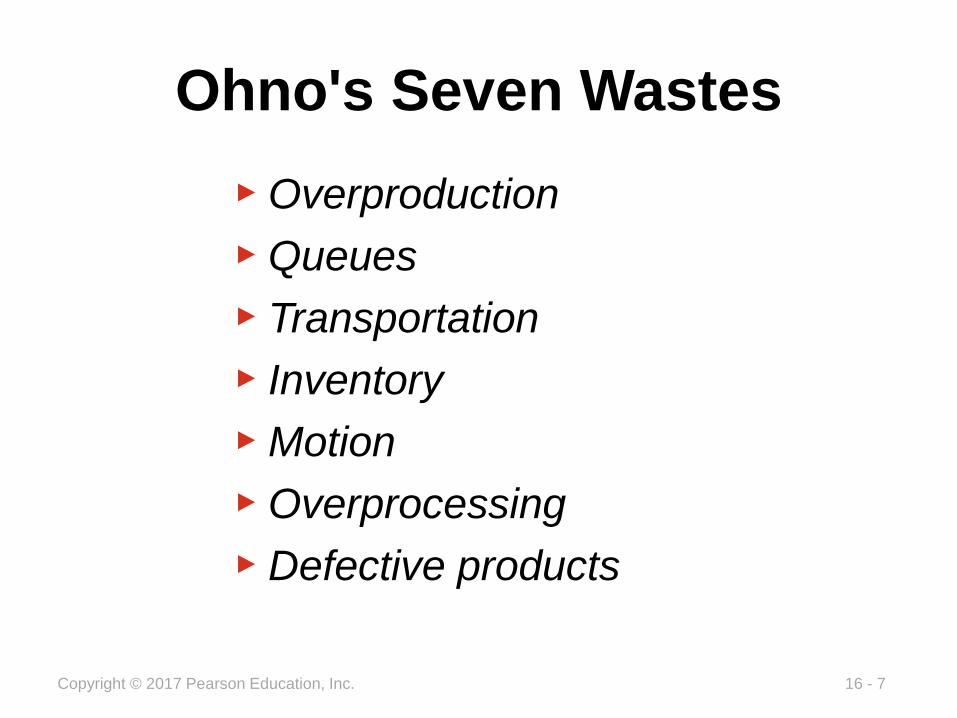
Ohno's Seven Wastes
▶ Overproduction
▶ Queues
▶ Transportation
▶ Inventory
▶Motion
▶ Overprocessing
▶ Defective products

16 - 8Copyright © 2017 Pearson Education, Inc.
Eliminate Waste
▶ Other resources such as energy, water, and air are often wasted
▶ Efficient, sustainable production minimizes inputs, reduces waste
▶ Traditional "housekeeping" has been expanded to the 5Ss

16 - 9Copyright © 2017 Pearson Education, Inc.
The 5Ss
▶ Sort/segregate – when in doubt, throw it out
▶ Simplify/straighten – methods analysis tools
▶ Shine/sweep – clean daily
▶ Standardize – remove variations from processes
▶ Sustain/self-discipline – review work and recognize progress

16 - 10Copyright © 2017 Pearson Education, Inc.
▶ Sort/segregate – when in doubt, throw it out
▶ Simplify/straighten – methods analysis tools
▶ Shine/sweep – clean daily
▶ Standardize – remove variations from processes
▶ Sustain/self-discipline – review work and recognize progress
The 5Ss
Two additional Ss
► Safety – built in good practices
► Support/maintenance – reduce variability and unplanned downtime

16 - 11Copyright © 2017 Pearson Education, Inc.
Remove Variability
▶ Variability is any deviation from the optimum process
▶ Lean systems require managers to reduce variability caused by both internal and external factors
▶ Inventory hides variability
▶ Less variability results in less waste
16 - 12Copyright © 2017 Pearson Education, Inc.
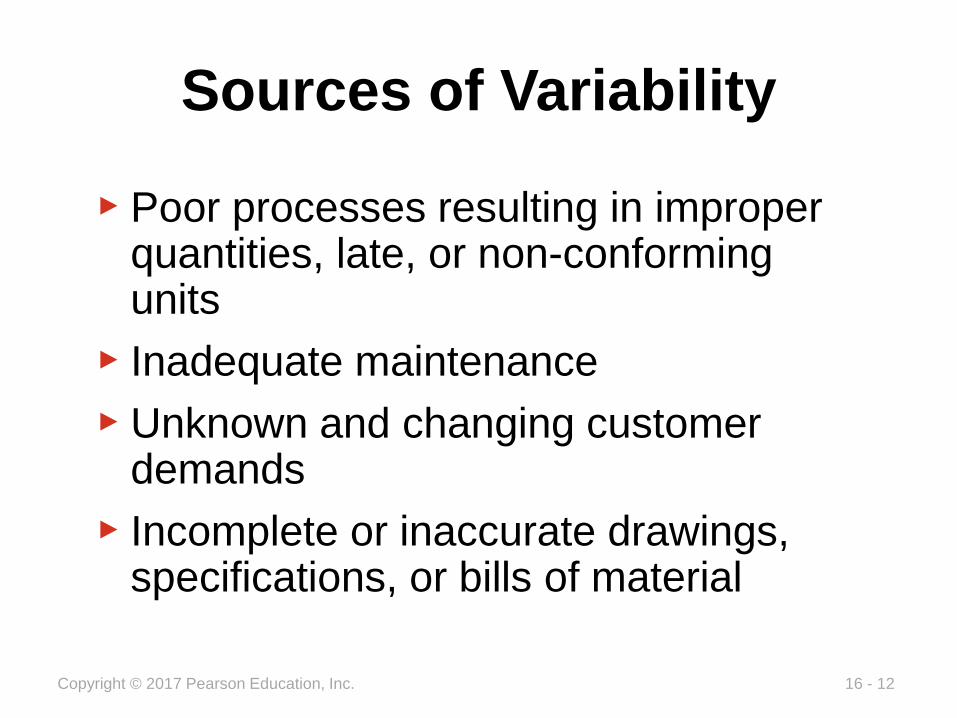
Sources of Variability
▶ Poor processes resulting in improper quantities, late, or non-conforming units
▶ Inadequate maintenance
▶ Unknown and changing customer demands
▶ Incomplete or inaccurate drawings, specifications, or bills of material

16 - 13Copyright © 2017 Pearson Education, Inc.
▶ Poor processes resulting in improper quantities, late, or non-conforming units
▶ Inadequate maintenance
▶ Unknown customer demands
▶ Incomplete or inaccurate drawings, specifications, or bills of material
Sources of Variability

16 - 14Copyright © 2017 Pearson Education, Inc.
Improve Throughput
▶ The rate at which units move through a process
▶ The time between the arrival of raw materials and the shipping of the finished order is called manufacturing cycle time
▶ A pull system increases throughput

16 - 15Copyright © 2017 Pearson Education, Inc.
Improve Throughput
▶ By pulling material in small lots, inventory cushions are removed, exposing problems and emphasizing continual improvement
▶Manufacturing cycle time is reduced
▶ Push systems dump orders on the downstream stations regardless of the need

16 - 16Copyright © 2017 Pearson Education, Inc.
Lean and Just-In-Time▶ Powerful strategy for improving operations
▶ Materials arrive where they are needed only when they are needed
▶ Identifying problems and driving out waste reduces costs and variability and improves throughput
▶ Requires a meaningful buyer-supplier relationship

16 - 17Copyright © 2017 Pearson Education, Inc.
JIT and Competitive Advantage
Figure 16.1

16 - 18Copyright © 2017 Pearson Education, Inc.
JIT and Competitive Advantage
Figure 16.1
WHICH RESULTS IN:
Rapid throughput frees assets
Quality improvement reduces waste
Cost reduction adds pricing flexibility
Variability reduction
Rework reduction
WHICH WINS ORDERS BY:
Faster response to the
customer at lower cost
and higher quality –
A Competitive Advantage

16 - 19Copyright © 2017 Pearson Education, Inc.
Supplier Partnerships
▶ Supplier partnerships exist when a supplier and purchaser work together to remove waste and drive down costs
▶ Four goals of supplier partnerships are:
▶Removal of unnecessary activities
▶Removal of in-plant inventory
▶Removal of in-transit inventory
▶ Improved quality and reliability

16 - 20Copyright © 2017 Pearson Education, Inc.
JIT Partnerships
Figure 16.2
16 - 21Copyright © 2017 Pearson Education, Inc.
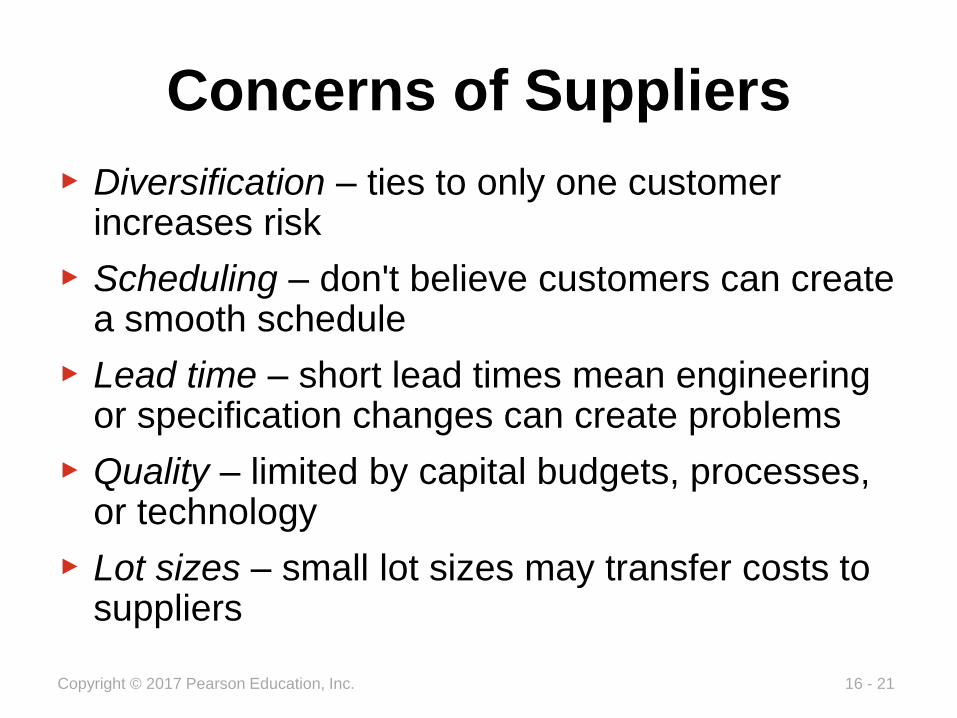
Concerns of Suppliers
▶ Diversification – ties to only one customer increases risk
▶ Scheduling – don't believe customers can create a smooth schedule
▶ Lead time – short lead times mean engineering or specification changes can create problems
▶ Quality – limited by capital budgets, processes, or technology
▶ Lot sizes – small lot sizes may transfer costs to suppliers

16 - 22Copyright © 2017 Pearson Education, Inc.
Lean Layout
▶ Reduce waste due to movement
TABLE 16.1
LEAN LAYOUT TACTICS
Build work cells for families of products
Include a large number operations in a small area
Minimize distance
Design little space for inventory
Improve employee communication
Use poka-yoke devices
Build flexible or movable equipment
Cross-train workers to add flexibility

16 - 23Copyright © 2017 Pearson Education, Inc.
Distance Reduction
▶ Large lots and long production lines with single-purpose machinery are being replaced by smaller flexible cells
▶ Often U-shaped for shorter paths and improved communication
▶ Often using group technology concepts

16 - 24Copyright © 2017 Pearson Education, Inc.
Increased Flexibility
▶ Cells designed to be rearranged as volume or designs change
▶ Applicable in office environments as well as production settings
▶ Facilitates both product and process improvement

16 - 25Copyright © 2017 Pearson Education, Inc.
Impact on Employees
▶ Employees may be cross-trained for flexibility and efficiency
▶ Improved communications facilitate the passing on of important information about the process (poka-yoke functions can help)
▶With little or no inventory buffer, getting it right the first time is critical

16 - 26Copyright © 2017 Pearson Education, Inc.
Reduced Space and Inventory
▶With reduced space, inventory must be in very small lots
▶ Units are always moving because there is no storage

16 - 27Copyright © 2017 Pearson Education, Inc.
Lean Inventory
▶ Inventory is at the minimum level necessary to keep operations running
TABLE 16.2
LEAN INVENTORY TACTICS
Use a pull system to move inventory
Reduce lot sizes
Develop just-in-time delivery systems with suppliers
Deliver directly to point of use
Perform to schedule
Reduce setup time
Use group technology

16 - 28Copyright © 2017 Pearson Education, Inc.
Reduce Variability
Inventory level
Process downtime
Scrap
Setup time
Late deliveries
Quality problems
Figure 16.3

16 - 29Copyright © 2017 Pearson Education, Inc.
Inventory level
Reduce Variability
Figure 16.3
Process downtime
Scrap
Setup time
Late deliveries
Quality problems

16 - 30Copyright © 2017 Pearson Education, Inc.
Inventory level
Reduce Variability
Figure 16.3
Process downtime removed
No scrap
Setup time
reducedNo late
deliveries
Quality problems removed

16 - 31Copyright © 2017 Pearson Education, Inc.
Reduce Inventory
▶ Reducing inventory uncovers the "rocks"
▶ Problems are exposed
▶ Ultimately there will be virtually no inventory and no problems
▶ Shingo says "Inventory is evil"
Inventory
16 - 32Copyright © 2017 Pearson Education, Inc.
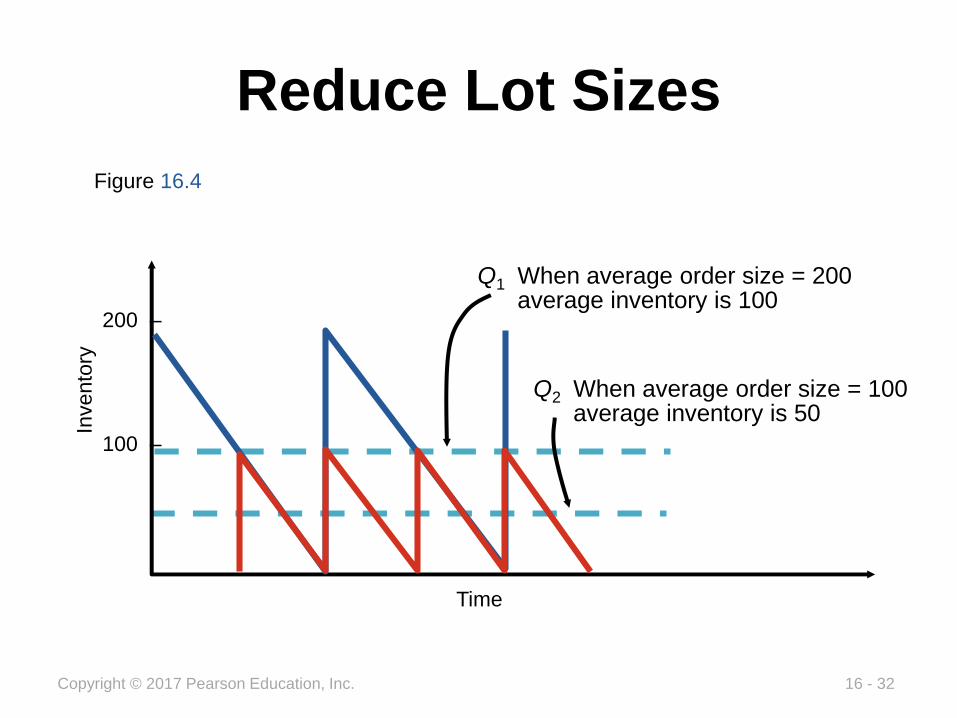
Reduce Lot Sizes
Figure 16.4
200 –
100 –
Invento
ry
Time
Q2 When average order size = 100average inventory is 50
Q1 When average order size = 200average inventory is 100

16 - 33Copyright © 2017 Pearson Education, Inc.
Reduce Lot Sizes
▶ Ideal situation is to have lot sizes of one pulled from one process to the next
▶ Often not feasible
▶ Can use EOQ analysis to calculate desired setup time
▶ Two key changes necessary
▶ Improve material handling
▶Reduce setup time
Qp
* =2DS
H 1- (d / p)éë
ùû

16 - 34Copyright © 2017 Pearson Education, Inc.
Setup Time ExampleD = Annual demand = 400,000 units
d = Daily demand = 400,000/250 = 1,600 per day
p = Daily production rate = 4,000 units
Qp = EOQ desired = 400
H = Holding cost = $20 per unit
S = Setup cost (to be determined)
Setup time = $2.40/($30/hour) = 0.08 hr = 4.8 minutes
Qp
* =2DS
H 1- (d / p)éë
ùûQ
p
2 =2DS
H 1- (d / p)éë
ùû
S =Qp
2( ) H( ) 1- d / p( )2D
=(400)2(20)(1-1,600 / 4,000)
2(400,000)= $2.40

16 - 35Copyright © 2017 Pearson Education, Inc.
Reduce Setup Costs
▶ High setup costs encourage large lot sizes
▶ Reducing setup costs reduces lot size and reduces average inventory
▶ Setup time can be reduced through preparation prior to shutdown and changeover

16 - 36Copyright © 2017 Pearson Education, Inc.
Lower Setup CostsFigure 16.5
Sum of ordering and holding costs
Holding cost
Setup cost curve (S1)
T1
S1
T2
S2
Cost
Lot size
Setup cost curve (S2)

16 - 37Copyright © 2017 Pearson Education, Inc.
Reduce Setup CostsFigure 16.6
90 min —
60 min —
40 min —
25 min —
15 min —13 min —
—
Use one-touch system to eliminate adjustments (save 10 minutes)
Training operators and standardizing work procedures (save 2 minutes)
Step 4
Step 5
Initial Setup Time
Step 2Move material closer and improve material handling
(save 20 minutes)
Step 1
Separate setup into preparation and actual setup, doing as much as possible while the
machine/process is operating (save 30 minutes)
Step 3Standardize and improve tooling
(save 15 minutes)
Repeat cycle until subminute setup is achieved
Step 6
16 - 38Copyright © 2017 Pearson Education, Inc.
Lean Scheduling
▶ Schedules must be communicated inside and outside the organization
▶ Level schedules
▶ Process frequent small batches
▶ Freezing the schedule helps stability
▶ Kanban
▶ Signals used in a pull system

16 - 39Copyright © 2017 Pearson Education, Inc.
Lean Scheduling
▶ Better scheduling improves performance
TABLE 16.3
LEAN SCHEDULING TACTICS
Make level schedules
Use kanbans
Communicate schedules to suppliers
Freeze part of the schedule
Perform to schedule
Seek one-piece-make and one-piece-move
Eliminate waste
Produce in small lots
Make each operation produce a perfect part

16 - 40Copyright © 2017 Pearson Education, Inc.
Level Schedules
▶ Process frequent small batches rather than a few large batches
▶Make and move small lots so the level schedule is economical
▶ Freezing the schedule closest to the due dates can improve performance

16 - 41Copyright © 2017 Pearson Education, Inc.
Scheduling Small Lots
A B CA AAB B B B B C
JIT Level Material-Use Approach
A CA AA B B B B B C CB B B BA A
Large-Lot Approach
Time
Figure 16.7
16 - 42Copyright © 2017 Pearson Education, Inc.
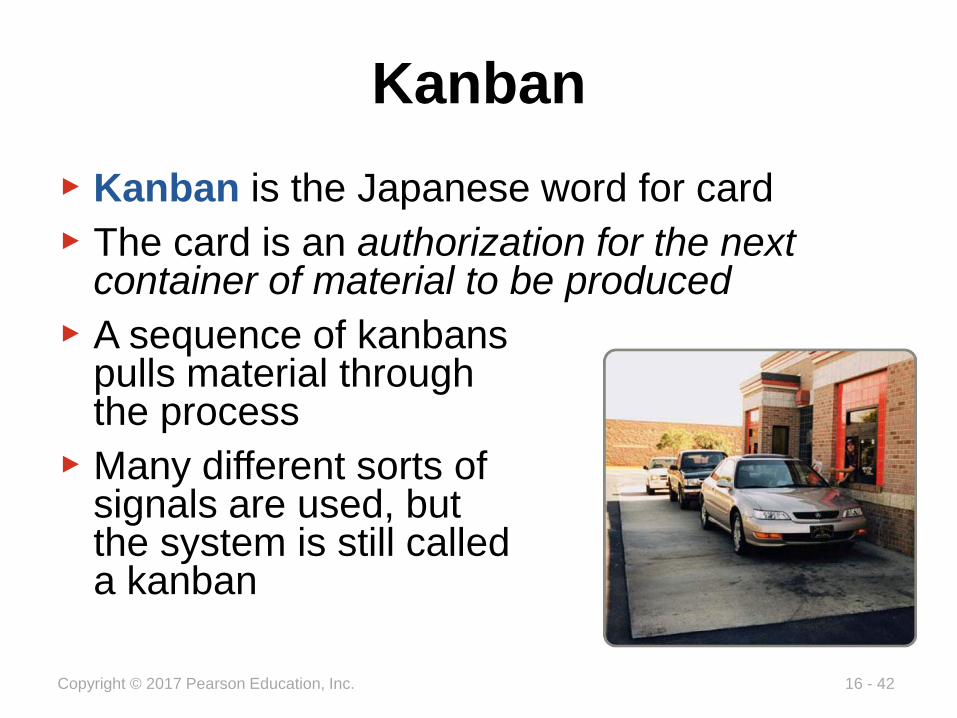
Kanban
▶ Kanban is the Japanese word for card
▶ The card is an authorization for the next container of material to be produced
▶ A sequence of kanbans pulls material through the process
▶ Many different sorts of signals are used, but the system is still called a kanban

16 - 43Copyright © 2017 Pearson Education, Inc.
Signal marker hanging on post
for part Z405 shows that
production should start for that
part. The post is located so that
workers in normal locations can
easily see it.
Signal marker on stack of boxes
Part numbers mark location of
specific part
KanbanFigure 16.8

16 - 44Copyright © 2017 Pearson Education, Inc.
Kanban
▶When there is visual contact
▶ The user removes a standard-size container of parts from a small storage area, as shown in Figure 16.8.
▶ The signal at the storage area is seen by the producing department as authorization to replenish the using department or storage area. Because there is an optimum lot size, the producing department may make several containers at a time.
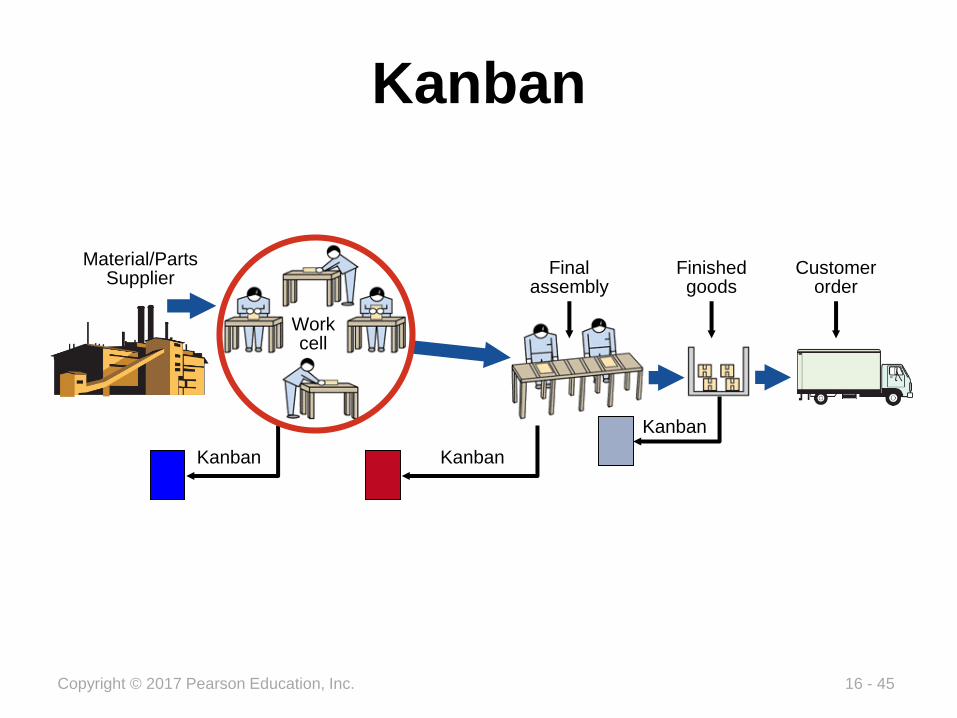
16 - 45Copyright © 2017 Pearson Education, Inc.
Kanban
Kanban
Kanban
Final assembly
Work cell
Kanban
Material/Parts Supplier
Finished goods
Customer order

16 - 46Copyright © 2017 Pearson Education, Inc.
Kanban
▶When the producer and user are not in visual contact, a card can be used; otherwise, a light or flag or empty spot on the floor may be adequate
▶ Usually each card controls a specific quantity of parts although multiple card systems may be used if there are several components or if the lot size is different from the move size

16 - 47Copyright © 2017 Pearson Education, Inc.
Kanban
▶ Kanban cards provide a direct control and limit on the amount of work-in-process between cells
▶ A complicating factor in a manufacturing firm is the time needed for actual manufacturing (production) to take place

16 - 48Copyright © 2017 Pearson Education, Inc.
The Number of Kanban Cardsor Containers
▶ Need to know the lead time needed to produce a container of parts
▶ Need to know the amount of safety stock needed
Number of kanbans(containers)
Demand during Safetylead time + stock
Size of container=

16 - 49Copyright © 2017 Pearson Education, Inc.
Number of Kanbans Example
Daily demand = 500 cakes
Production lead time = 2 days(Wait time + Material handling time + Processing time)
Safety stock = 1/2 day
Container size = 250 cakes
Demand during lead time = 2 days x 500 cakes = 1,000
Safety stock = ½ x Daily demand = 250
Number of kanbans = = 51,000 + 250
250

16 - 50Copyright © 2017 Pearson Education, Inc.
Advantages of Kanban
▶ Small containers require tight schedules, smooth operations, little variability
▶ Shortages create an immediate impact
▶ Places emphasis on meeting schedules, reducing lead time and setups, and economic material handling
▶ Standardized containers reduce weight, disposal costs, wasted space, and labor

16 - 51Copyright © 2017 Pearson Education, Inc.
Lean Quality
▶ Strong relationship
▶ Lean cuts the cost of obtaining good quality because Lean exposes poor quality
▶ Because lead times are shorter, quality problems are exposed sooner
▶ Better quality means fewer buffers and allows simpler Lean systems to be used

16 - 52Copyright © 2017 Pearson Education, Inc.
Lean Quality Tactics
TABLE 16.4
LEAN QUALITY TACTICS
Use statistical process control
Empower employees
Build fail-safe methods (poka-yoke, checklists, etc.)
Expose poor quality with small lots
Provide immediate feedback

16 - 53Copyright © 2017 Pearson Education, Inc.
Toyota Production System
▶ Continuous improvement
▶ Build an organizational culture and value system that stresses improvement of all processes, kaizen
▶ Part of everyone’s job
▶ Respect for people
▶ People are treated as knowledge workers
▶ Engage mental and physical capabilities
▶ Empower employees

16 - 54Copyright © 2017 Pearson Education, Inc.
Toyota Production System
▶ Processes and standard work practice
▶ Work shall be completely specified as to content, sequence, timing, and outcome
▶ Internal and external customer-supplier connections are direct
▶ Material and service flows must be simple and directly linked to the people or machinery involved
▶ Process improvement must be made in accordance with the scientific method at the lowest possible level of the organization

16 - 55Copyright © 2017 Pearson Education, Inc.
Toyota Production System
▶ Processes and standard work practice
▶ Stopping production because of a defect is called jidoka
▶ Dual focus
▶ Education and training of employees
▶ Responsiveness of the system to problems
▶Result is continuous improvement

16 - 56Copyright © 2017 Pearson Education, Inc.
Lean Organizations
▶ Understanding the customer and their expectations
▶ Functional areas communicate and collaborate to make sure customer expectations are met
▶ Implement the tools of Lean throughout the organization

16 - 57Copyright © 2017 Pearson Education, Inc.
Building a Lean Organization
▶ Transitioning to a Lean system can be difficult
▶ Build a culture of continual improvement
▶ Open communication
▶ Demonstrated respect for people
▶ Gemba walks to see work being performed

16 - 58Copyright © 2017 Pearson Education, Inc.
Building a Lean Organization
▶ Lean systems tend to have the following attributes
▶Respect and develop employees
▶ Empower employees
▶Develop worker flexibility
▶Develop collaborative partnerships with suppliers
▶ Eliminate waste by performing only value-added activities

16 - 59Copyright © 2017 Pearson Education, Inc.
Lean Sustainability
▶ Two sides of the same coin
▶Maximize resource use and economic efficiency
▶ Focus on issues outside the immediate firm
▶ Driving out waste is the common ground

16 - 60Copyright © 2017 Pearson Education, Inc.
Lean in Services
▶ The Lean techniques used in manufacturing are used in services
▶ Suppliers
▶ Layouts
▶ Inventory
▶ Scheduling

16 - 61Copyright © 2017 Pearson Education, Inc.
All rights reserved. No part of this publication may be reproduced, stored in a
retrieval system, or transmitted, in any form or by any means, electronic,
mechanical, photocopying, recording, or otherwise, without the prior written
permission of the publisher.
Printed in the United States of America.