Lean in Danske Bank - NFKR · 3 Transforming Danske Bank into a Lean organization Operational...
15
Lean in Danske Bank Copenhagen, 21 August 2014 Presentation for Statoil
Transcript of Lean in Danske Bank - NFKR · 3 Transforming Danske Bank into a Lean organization Operational...

Lean in Danske Bank
Copenhagen, 21 August 2014
Presentation for Statoil

1
Agenda
Introduction to Think Simple
Tools and examples
Summing up

2
Think Simple: Step by step journey built on results
today Mission 30% Think Simple
May 2011 Target Operating model
Health Check
August 2011 "Car loan" end-to-end
Lean piloted
January 2012 End-to-end Lean programme launched in
PB, later in BB
Jan 2013 Programme extended to entire group
and multiple change levers
April 2013 ExBo+ decides to move forward full
speed with Think Simple
May 2013 Think Simple Wave 1 launched – work begins in C&I and IT with the first pilots
Sep 2013 Streams report Wave 1 financial impact in
line with expectations
Major execution milestones
Aug-Sep 2013 Streams decide on Wave 2 plan (demand higher than resources)
May 2012 Extensive Lean training
started
2011-2012 Lean methodology developed and
documented
Change and enablement
May 2013 Central progress tracking
starts
2010 Lean in
Operations
Key decisions
Oct 2013 ExBo+ decides on Demand driven
Think Simple and revised scope
Feb-March 2014 Streams decide on Wave3 plan
and kick off new transformations
August 2014 Wave 4kicked off

3
Transforming Danske Bank into a Lean organization
Operational excellence
Improved performance Reduced lead time Efficient use of resources
Service excellence
Increased advisor meetings Daily planning of activities Follow-up
E2E Process excellence
Predictability and quality Shorter time to Yes Reduced processing time
Management programme
Mindset change from the top Training and tools relevant for daily work

4
18 weeks
Group Lean End-2-End transformation Full scale implementation Pre-phase
ExBo (4 p.a)
Fast Track Mgmt Team (~3 weeks)
Project team
Stream SteerCo (ad hoc)
Process Selection
Relevant branches & departments
1
Intro Scope Initial baseline Resource
allocation
3
Reference process Status on gaps
4
Approve target process Bottom-up verification of baseline & potentials
5
Status on pilot First indication of
KPIs
6
Approve roll out Evaluate final pilot results Effect Realization plans Recommendation for roll-out execution Final agreement on KPIs
Analyse & design
Prepare pilot Pilot Refine
Pilot & Refine
As-is process
Reference process
Prepa-ration
Approve implementation
Overall approach: From selection to implementation Transformation of 18 weeks supported by End-2-End consultants
Roll-out/ Continuous improvement
All employee WS Branch kickoffs Celebrate success On site observation, time study and/or time registration
VSM results Pain points
Stop or Go
Target process
2
Number of SteerCo meetings will vary between PB, BB and C&I Streams and depend on the number of ongoing transformations.

5
Improvements for loans and services enable reduction
of lead time, fewer errors and increased efficiency
Improvements on strategic priorities Example: Andelsbolig tool developed
All key data on relevant association for 'Andelsbolig' available – especially whether valid valuation exists
Freed up time Fewer cases with input errors
Reduced time to yes for
Andelsbolig loans
Customer attention Simplicity Efficiency
From 17 to 5 days
From 50% to 16%
22%
E2E Process Excellence

6
Roll out time frame: N/A Immediately after the transformation 1-2 years after transformation
(dep. on IT-dev. and prioritization)
The road from As-is to Target process
As-is
As-is
As-is
As-is
As-is
Country A
Country B
Country C
Country D
Country E
Reference Process
GROUP
Vision Process
GROUP
As-is Reference process Target process Vision process
The As-is process is the current state of the process in each country.
The Vision process is the ideal process design with full IT-automation.
The Country Target processes are the final optimized processes for each country w/o IT. They are adapted versions of the Group Reference process including the countries’ permanent and temporary gaps. Accepted gaps can only be of legal or system character.
The Reference process is the immediate optimized and harmonized process across countries w/o IT. Each country has to investigate if they have gaps of legal, system or organizational character and whether these are closable, temporary or permanent.
Gaps
Gaps
Gaps
Gaps
Gaps
Country A
Country B
Country C
Country D
Country E
Country A
Country B
Country C
Country D
Country E
Country Target Process
Country Target Process
Country Target Process
Country Target Process
Country Target Process

7
Credit-card example ~34% average process time reduction without IT
DK UK Ireland
-59%
-46%
-50%
Norway Sweden Finland
-18% -4%
-28%
Group aligned target
Local developed target
Before
Processing time
E2E Process Excellence
93 of 118 gaps across countries to target process closed without IT changes

8
Operational Excellence project model
Diagnosis and Design 7 weeks
Implementation 11 weeks
Follow up 18 weeks
Analysis- and project track
Preparation of Business Case and Implementation Plan
Statement of effect and prepare action plan for the follow up period
Implementation of activities according to the action plan
Change Management Track
Initial analysis and project A3
Introduction of weekly operations meetings including target measurement and continuous improvements
Introduction for employees (full day event)
Process mapping
Design Blitz 1 Blitz 2 Blitz 3
Continue weekly operations meetings
Continuous improvements and target measurement
Follow up on implementations done during Blitzes
Management track
Regular Management Discussions (minimum bi-weekly) Management introduction
OM2 OM3
Continued dialogue and follow up
OM4 OM5 OM1
Continuous project progress reporting Project Kick off
Project Management and Commu- nication track
SG1 SG2 SG3 SG4
Communi-cation plan
Continuous communication according to the communication plan (including local newsletters)
9
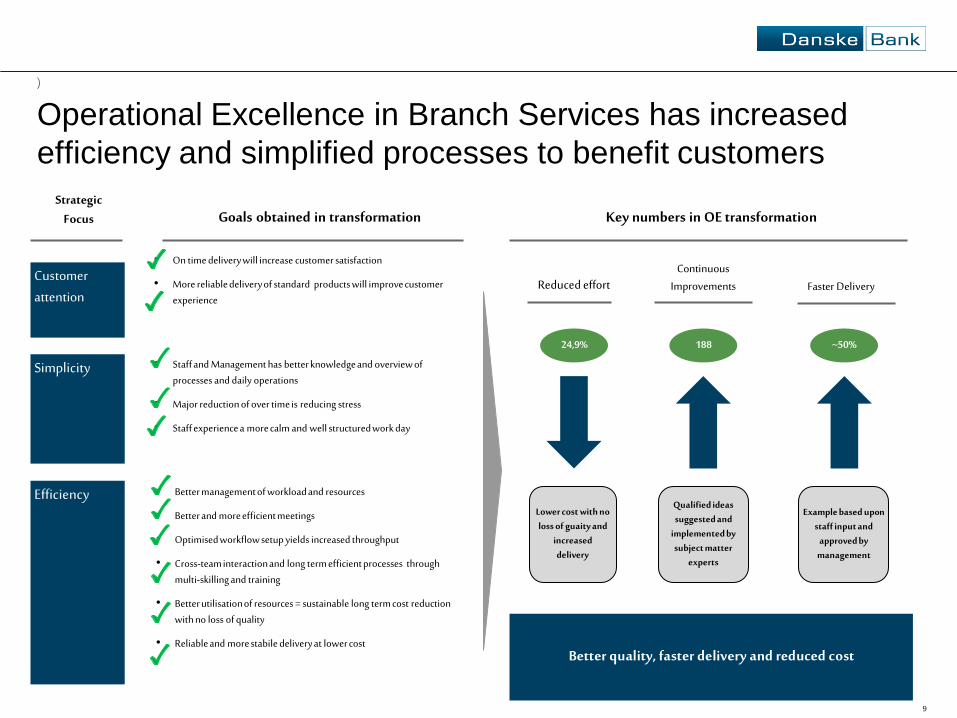
Key numbers in OE transformation Strategic
Focus
24,9%
Better quality, faster delivery and reduced cost
Lower cost with no loss of guaity and
increased delivery
188
Goals obtained in transformation
Operational Excellence in Branch Services has increased
efficiency and simplified processes to benefit customers
Continuous Improvements
• Better management of workload and resources
• Better and more efficient meetings
• Optimised workflow setup yields increased throughput
• Cross-team interaction and long term efficient processes through multi-skilling and training
• Better utilisation of resources = sustainable long term cost reduction with no loss of quality
• Reliable and more stabile delivery at lower cost
Efficiency
Reduced effort
Qualified ideas suggested and
implemented by subject matter
experts
Faster Delivery
~50%
Example based upon staff input and
approved by management
Simplicity
• Staff and Management has better knowledge and overview of processes and daily operations
• Major reduction of over time is reducing stress
• Staff experience a more calm and well structured work day
Customer attention
• On time delivery will increase customer satisfaction
• More reliable delivery of standard products will improve customer experience
)

11
Service Excellence three overall areas
The main objective of Service Excellence is to improve the sales force effectiveness by focus the sales force , improve effi ciency in daily work (make the machine hum) and aligning the organization
Consists of 10 key drivers
Focus the sales force Target setting Incentives
Training & Coaching Performance Mgm't
Make the machine hum Operating rhythm Lead generation
Sales process & rhythm Mgm't information
Align the organization Organization Resourcing & Utilization
Focus the sales force
Align the
organi- zation
Make the machine hum
Service Excellence
Service Excellence model

12
Service Excellence pilot in Business Direct DK showing results
Improvements on strategic priorities
Daily planning
Task allocation
Freed up time
Fewer inter-ruptions from calls per case
Reduced call abandon-ment rate in Level 1
From 8% to 4% From 40% to
~12% 30%
Customer attention Simplicity Efficiency
Examples of solutions developed
Service Excellence

13
Customer oriented processes
Execution and delivery
Managing continuous improvement
Simplification
Manager role in Think Simple
1 2 3 4
Understand and incorporate
customer value in daily work and strategic priorities
Build simplification capabilities and facilitate collaboration and
problem solving
Structured follow-up of management team with
standardised tools
Facilitate, support and motivate
to drive continuous improvement
Focus area for training in H2 2013
Focus area for training in 2014 Focus area for training in 2014
TSMP focuses on shared knowledge and mindset across the
Group
Focus area for training in 2014

14
Agenda
Introduction to Think Simple
Tools and examples
Summing up

15