LEAD. INNOVATE. GROW. · Part I, Item 1A “Risk Factors,” and Part II, Item 7 and Item 7A...
41
LEAD. INNOVATE. GROW. Investor Presentation May 2017
Transcript of LEAD. INNOVATE. GROW. · Part I, Item 1A “Risk Factors,” and Part II, Item 7 and Item 7A...

LEAD.INNOVATE.GROW.
Investor Presentation May 2017

INVESTOR INFORMATIONThis and other presentations made by NW Natural from time to time, may contain forward-looking statements within the meaning of the U.S. Private Securities Litigation Reform Act of 1995, which are subject to the safe harbors created by such Act. Forward-looking statements can be identified by words such as “anticipates,” “intends,” “plans,” “seeks,” “believes,” “estimates,” “expects” and similar references to future periods. Examples of forward-looking statements include, but are not limited to, statements regarding the following: including regional third-party projects, storage, pipeline and other infrastructure investments, commodity costs and sourcing, competitive advantage, service territory, customer service, customer and business growth, conversion potential, multifamily development, business risk, efficiency of business operations, regulatory recovery, business development and new business initiatives, environmental remediation recoveries, gas storage markets and business opportunities, gas storage development, costs, timing or returns related thereto, financial positions and performance, economic and housing market trends and performance shareholder return and value, capital expenditures, liquidity, strategic goals, carbon savings, workforce trends, hedge efficacy, cash flows and adequacy thereof, return on equity, capital structure, return on invested capital, revenues and earnings and timing thereof, margins, net income, operations and maintenance expense, dividends, credit ratings and profile, debt and equity issuances, the regulatory environment, effects of regulatory disallowance, timing or effects of future regulatory proceedings or future regulatory approvals, regulatory prudence reviews, effects of regulatory mechanisms, including, but not limited to, SRRM and the Company’s infrastructure investments, effects of legislation, including but not limited to bonus depreciation and PHMSA regulations and carbon regulations, and other statements that are other than statements of historical facts.
Forward-looking statements are based on our current expectations and assumptions regarding our business, the economy and other future conditions. Because forward-looking statements relate to the future, they are subject to inherent uncertainties, risks and changes in circumstances that are difficult to predict. Our actual results may differ materially from those contemplated by the forward-looking statements, so we caution you against relying on any of these forward-looking statements. They are neither statements of historical fact nor guarantees or assurances of future performance. Important factors that could cause actual results to differ materially from those in the forward-looking statements are discussed by reference to the factors described in Part I, Item 1A “Risk Factors,” and Part II, Item 7 and Item 7A “Management’s Discussion and Analysis of Financial Condition and Results of Operations,” and “Quantitative and Qualitative Disclosure about Market Risk” in the Company’s most recent Annual Report on Form 10-K, and in Part I, Items 2 and 3 “Management’s Discussion and Analysis of Financial Condition and Results of Operations” and “Quantitative and Qualitative Disclosures About Market Risk”, and Part II, Item 1A, “Risk Factors”, in the Company’s quarterly reports filed thereafter.
All forward-looking statements made in this presentation and all subsequent forward-looking statements, whether written or oral and whether made by or on behalf of the Company, are expressly qualified by these cautionary statements. Any forward-looking statement speaks only as of the date on which such statement is made, and we undertake no obligation to publicly update any forward-looking statement, whether as a result of new information, future developments or otherwise, except as may be required by law.
FORWARD LOOKING STATEMENTSCOMPANY INFORMATION
NW Natural220 NW Second Ave.Portland, OR 97209nwnatural.com
Nikki SparleyDirector, Investor Relations(503) 721 – [email protected]
2

TABLE OF CONTENTS
I. IntroductionII. UtilityIII. Gas StorageIV. Growth OpportunitiesV. Financial PerformanceVI. Conclusion
Appendix
4


NW NATURAL LEADERSHIPMr. Anderson is currently NW Natural’s President and CEO effective August 1, 2016. Since he joined the Company in 2004, Mr. Anderson has served in various executive positions over Operations, Regulation and Financial Matters, as COO and CFO. Previously, Mr. Anderson held executive positions within TXU Corporate including Senior Vice President and Chief Accounting Officer. Mr. Anderson holds a BBA in Accounting from Texas Tech University and held a CPA (retired) and CGMA.
Brody J. WilsonVice President, Treasurer and Chief Accounting Officer & Controller
Mr. Wilson is currently serving as NW Natural’s Vice President and Treasurer effective May 17, 2017 in addition to his duties as Chief Accounting Officer and Controller. Mr. Wilson was appointed Chief Accounting Officer and Assistant Treasurer in 2016 and has been serving as NW Natural’s Controller since 2013. Prior to joining the Company in 2012, he was a Senior Manager at PricewaterhouseCoopers LLP where he worked in PwC’s Energy & Utility Group in Portland, Oregon and London, England. Mr. Wilson holds a Bachelor of Science in Accounting from George Fox University and is a CPA in Oregon.
David H. AndersonPresident and CEO
6
Frank BurkhartsmeyerSenior Vice President, Chief Financial Officer
Mr. Burkhartsmeyer is currently NW Natural’s CFO effective May 17, 2017. Previously, Mr. Burkhartsmeyer served as President and CEO of Avangrid Renewables and Senior Vice president of Finance at Iberdrola Renewables US. He also held various director-level positions at PPM Energy (a subsidiary of ScottishPower), ScottishPower and PacificCorp (a subsidiary of ScottishPower). Mr. Burkhartsmeyer has an MBA from the University of Oregon and a Bachelor of Arts in Liberal Arts from the University of Montana.
MardiLyn SaathoffSenior Vice President, Regulation and General Counsel
Ms. Saathoff is currently NW Natural’s Senior Vice President, Regulation and General Counsel since 2016 and 2015, respectively. Since she joined the Company in 2008, Ms. Saathoff has served in a variety of executive positions including ChiefGovernance Officer and Corporate Secretary. Previously Ms. Saathoff held executive positions within Danaher Corporation and was General Counsel to Oregon Governor Kulongoski. Ms. Saathoff received her Bachelor of Arts in Sociology and Master of Arts in Teaching from Lewis and Clark College, and her J.D. from Lewis and Clark Law School.

INVESTMENT HIGHLIGHTS• Low-risk business profile with 90%+ of revenues from pure-play LDC• Over 730,000 utility customers with nearly 14,000 miles of distribution and
transmission mains• Supportive regulatory environments in Oregon and Washington with progressive
recovery mechanisms• Modern distribution system – no identified cast iron or bare steel
Stable, Regulated Earnings Profile
Proven Financial Performance
Tangible Growth Opportunities
• Stable dividends with 61-year record of increasing dividends paid annually
• Investment grade credit ratings from S&P and Moody’s
• Experienced management team with broad knowledge of the energy industry
• Projected five-year capital expenditures plan of $850 to $950 million
• Service territory experiencing above average customer growth (1.7% for the twelve months ending March 31, 2017)
• Continuous replacement of existing infrastructure to ensure reliability and safety
• $128 million (estimated) regulated expansion of Mist facility to support renewables in the region
7

HIGHLY REGULATED BUSINESS
Note: Excludes Other segment due to values consistently less than 1.0%.
Utility92.7%
Gas Storage
7.3%
Utility99.0%
Gas Storage
1.0%
Utility91.6%
Gas Storage
8.4%
2016 Capital Expenditures2016 Net Income
2016 Total Assets
$140 million$59 million
$3.1 billion
8
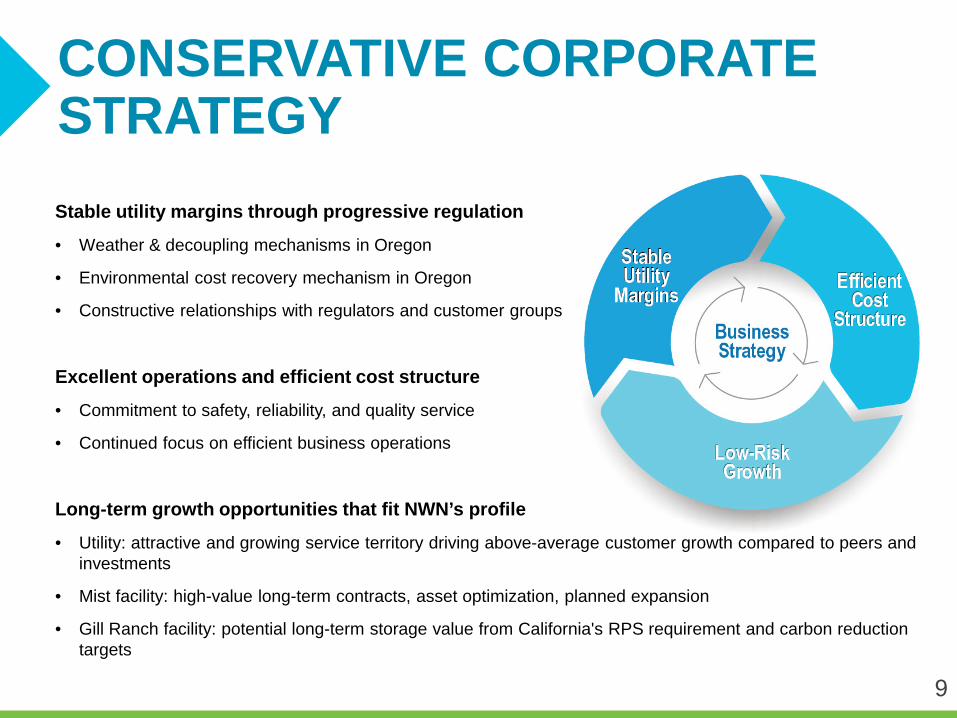
CONSERVATIVE CORPORATE STRATEGYStable utility margins through progressive regulation
• Weather & decoupling mechanisms in Oregon
• Environmental cost recovery mechanism in Oregon
• Constructive relationships with regulators and customer groups
Excellent operations and efficient cost structure
• Commitment to safety, reliability, and quality service
• Continued focus on efficient business operations
Long-term growth opportunities that fit NWN’s profile
• Utility: attractive and growing service territory driving above-average customer growth compared to peers and investments
• Mist facility: high-value long-term contracts, asset optimization, planned expansion
• Gill Ranch facility: potential long-term storage value from California's RPS requirement and carbon reduction targets
9
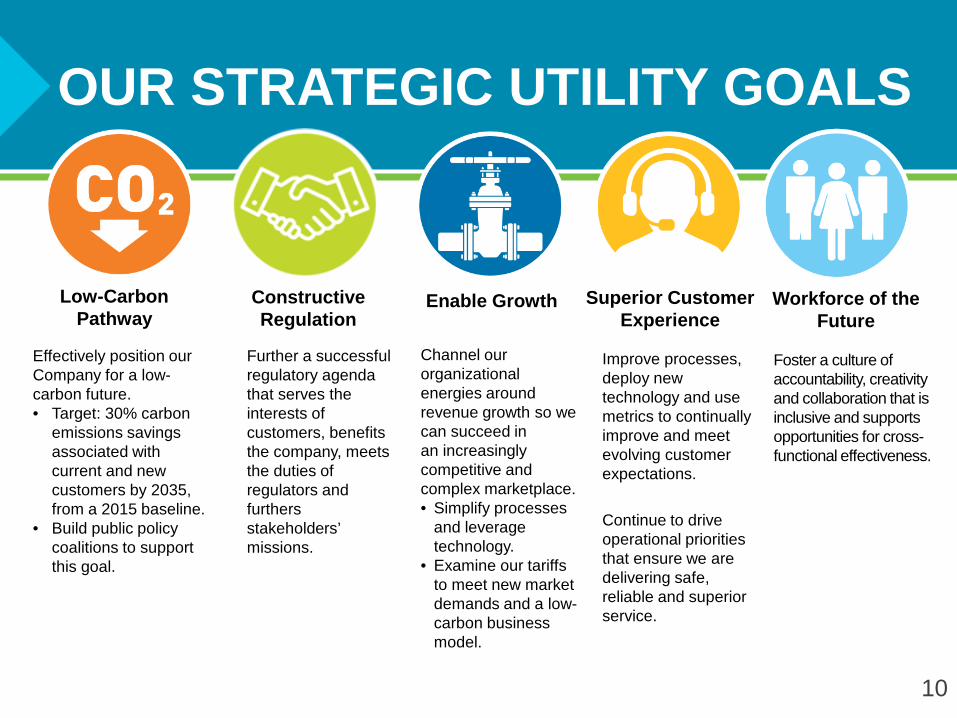
Low-Carbon Pathway
Enable Growth Superior Customer Experience
OUR STRATEGIC UTILITY GOALS
Constructive Regulation
Workforce of the Future
Effectively position our Company for a low-carbon future.• Target: 30% carbon
emissions savings associated with current and new customers by 2035, from a 2015 baseline.
• Build public policy coalitions to support this goal.
Further a successful regulatory agenda that serves the interests of customers, benefits the company, meets the duties of regulators and furthers stakeholders’ missions.
Channel our organizational energies around revenue growth so we can succeed in an increasingly competitive and complex marketplace.• Simplify processes
and leverage technology.
• Examine our tariffs to meet new market demands and a low-carbon business model.
Improve processes, deploy new technology and use metrics to continually improve and meet evolving customer expectations.
Continue to drive operational priorities that ensure we are delivering safe, reliable and superior service.
Foster a culture of accountability, creativity and collaboration that is inclusive and supports opportunities for cross-functional effectiveness.
10

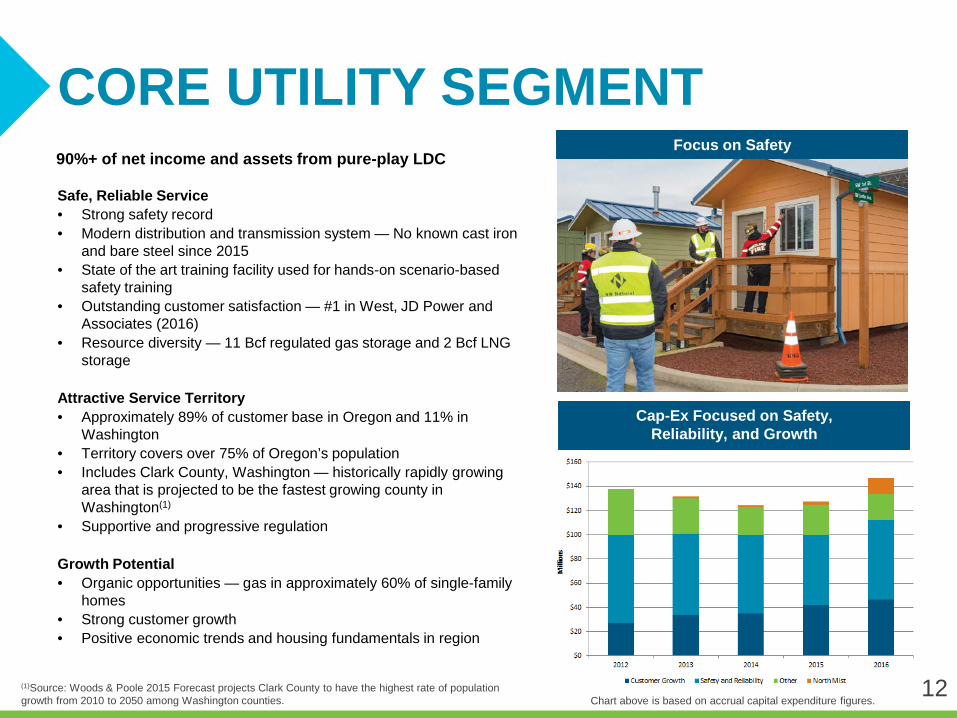
CORE UTILITY SEGMENT
Safe, Reliable Service• Strong safety record• Modern distribution and transmission system — No known cast iron
and bare steel since 2015• State of the art training facility used for hands-on scenario-based
safety training • Outstanding customer satisfaction — #1 in West, JD Power and
Associates (2016)• Resource diversity — 11 Bcf regulated gas storage and 2 Bcf LNG
storage
Attractive Service Territory• Approximately 89% of customer base in Oregon and 11% in
Washington• Territory covers over 75% of Oregon’s population • Includes Clark County, Washington — historically rapidly growing
area that is projected to be the fastest growing county in Washington(1)
• Supportive and progressive regulation
Growth Potential• Organic opportunities — gas in approximately 60% of single-family
homes • Strong customer growth • Positive economic trends and housing fundamentals in region
90%+ of net income and assets from pure-play LDC Focus on Safety
Cap-Ex Focused on Safety, Reliability, and Growth
12Chart above is based on accrual capital expenditure figures.
(1)Source: Woods & Poole 2015 Forecast projects Clark County to have the highest rate of population growth from 2010 to 2050 among Washington counties.

KEY REGULATORY ITEMS
Oregon Washington
Rate Structures:
Rate Case Year 2012 2009
ROE 9.5% 10.1%
ROR 7.8% 8.4%
Equity Ratio 50% 51%
2016 Rate Base $1.2B $0.1B
Key Mechanisms:
Decoupling/WARM X
Purchased Gas Adjustment X X
Environmental Cost Recovery Deferral(1)
Pension Balancing X
Incentive Sharing(2) X X
(1) Washington allows deferral of environmental costs, but a cost recovery mechanism or methodology has not yet been established by the Washington Commission. A carrying charge related to deferred amounts will be determined in a future proceeding.
(2) In Oregon, NW Natural shares PGA gains and losses. In both Oregon and Washington, NW Natural shares with customers revenues it achieves through interstate storage and optimization activities. 13

GROWING RATE BASE($ in billions)
14
0
500
1000
1500
2000
2500
3000
3500
2012 2013 2014 2015 2016
Net Rate Base Accumulated Depreciation Deferred Tax Liability - Depreciation
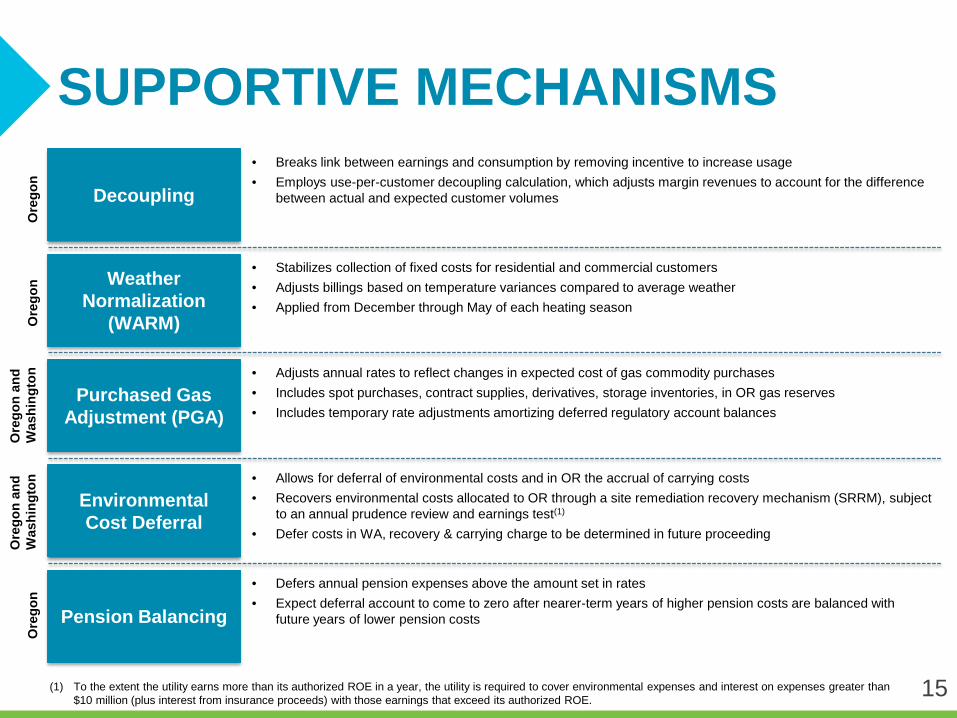
SUPPORTIVE MECHANISMS
• Allows for deferral of environmental costs and in OR the accrual of carrying costs• Recovers environmental costs allocated to OR through a site remediation recovery mechanism (SRRM), subject
to an annual prudence review and earnings test(1)
• Defer costs in WA, recovery & carrying charge to be determined in future proceeding
• Breaks link between earnings and consumption by removing incentive to increase usage• Employs use-per-customer decoupling calculation, which adjusts margin revenues to account for the difference
between actual and expected customer volumes
• Adjusts annual rates to reflect changes in expected cost of gas commodity purchases• Includes spot purchases, contract supplies, derivatives, storage inventories, in OR gas reserves• Includes temporary rate adjustments amortizing deferred regulatory account balances
• Stabilizes collection of fixed costs for residential and commercial customers• Adjusts billings based on temperature variances compared to average weather• Applied from December through May of each heating season
• Defers annual pension expenses above the amount set in rates• Expect deferral account to come to zero after nearer-term years of higher pension costs are balanced with
future years of lower pension costs
Ore
gon
and
Was
hing
ton
Ore
gon
and
Was
hing
ton
Ore
gon
Ore
gon
Ore
gon
Decoupling
Weather Normalization
(WARM)
Purchased Gas Adjustment (PGA)
Environmental Cost Deferral
Pension Balancing
15(1) To the extent the utility earns more than its authorized ROE in a year, the utility is required to cover environmental expenses and interest on expenses greater than $10 million (plus interest from insurance proceeds) with those earnings that exceed its authorized ROE.
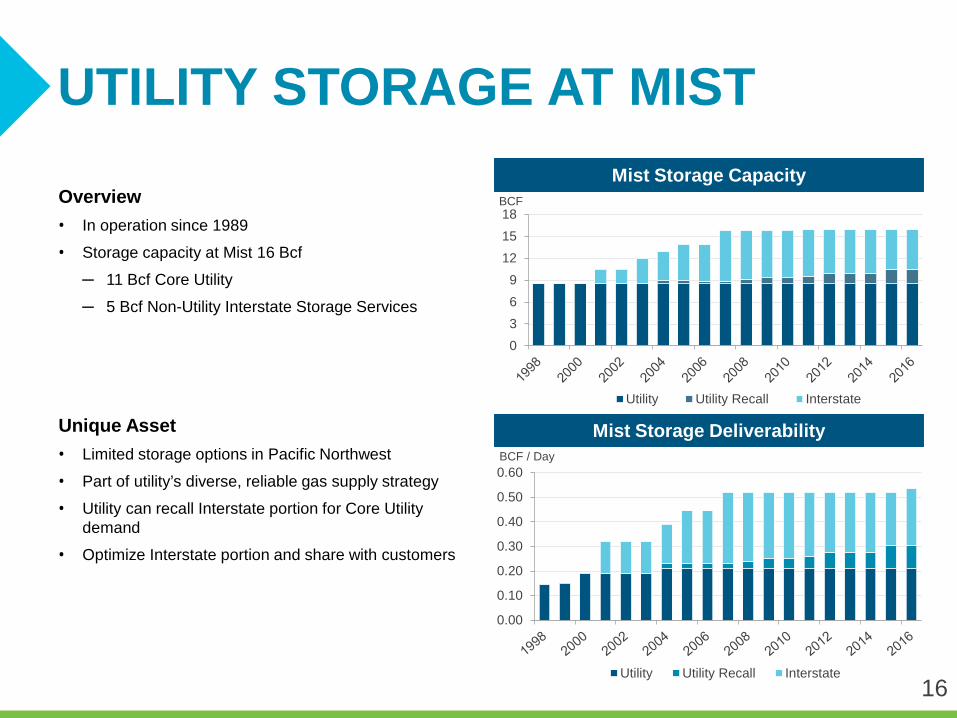
UTILITY STORAGE AT MIST
Overview• In operation since 1989
• Storage capacity at Mist 16 Bcf
─ 11 Bcf Core Utility
─ 5 Bcf Non-Utility Interstate Storage Services
Unique Asset• Limited storage options in Pacific Northwest
• Part of utility’s diverse, reliable gas supply strategy
• Utility can recall Interstate portion for Core Utility demand
• Optimize Interstate portion and share with customers
0.00
0.10
0.20
0.30
0.40
0.50
0.60BCF / Day
Utility Utility Recall Interstate
0369
121518BCF
Utility Utility Recall Interstate
Mist Storage Capacity
Mist Storage Deliverability
16
17
NON-UTILITY STORAGE SEGMENT
OR
WA
Portland
CA
San Francisco
Gill Ranch
Mist
NWN Service Territory
Mist (Interstate Portion)
Gill Ranch (NWN Portion)
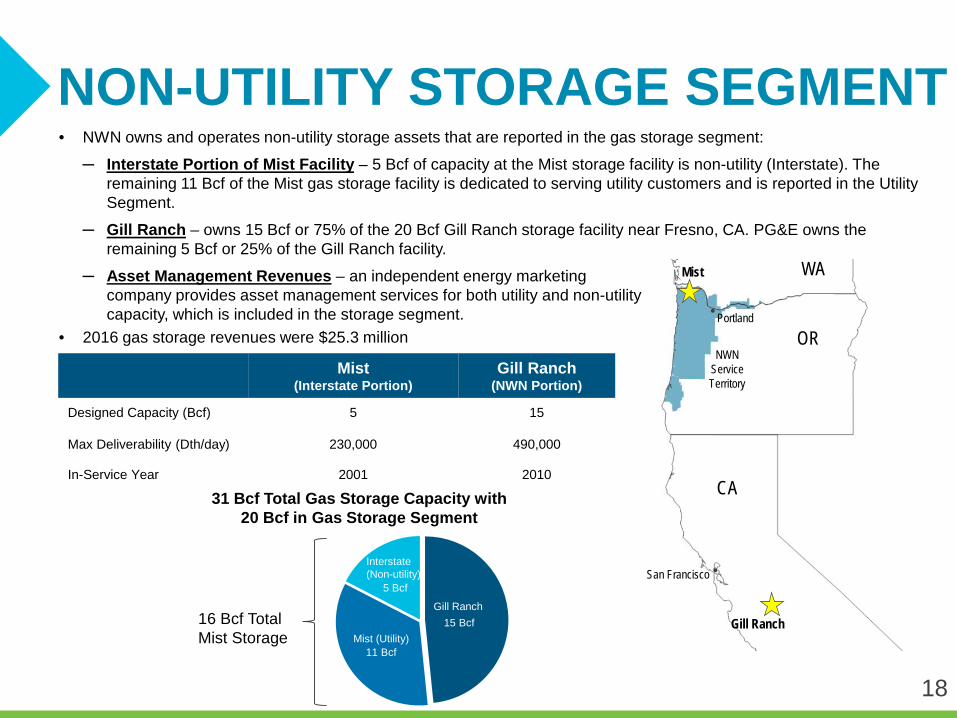
Designed Capacity (Bcf) 5 15
Max Deliverability (Dth/day) 230,000 490,000
In-Service Year 2001 2010
Mist
16 Bcf Total Mist Storage
31 Bcf Total Gas Storage Capacity with20 Bcf in Gas Storage Segment
Gill Ranch15 Bcf
Mist (Utility)11 Bcf
Interstate(Non-utility)
5 Bcf
• NWN owns and operates non-utility storage assets that are reported in the gas storage segment:
─ Interstate Portion of Mist Facility – 5 Bcf of capacity at the Mist storage facility is non-utility (Interstate). The remaining 11 Bcf of the Mist gas storage facility is dedicated to serving utility customers and is reported in the Utility Segment.
─ Gill Ranch – owns 15 Bcf or 75% of the 20 Bcf Gill Ranch storage facility near Fresno, CA. PG&E owns the remaining 5 Bcf or 25% of the Gill Ranch facility.
─ Asset Management Revenues – an independent energy marketingcompany provides asset management services for both utility and non-utilitycapacity, which is included in the storage segment.
• 2016 gas storage revenues were $25.3 million
18

GILL RANCH STORAGE FACILITY
19

• Contracted for 2017-18 gas storage year with ~50% of capacity in firm contracts at slightly higher prices than 2016-17; remaining facility under third-party asset management contracts (subject to market prices)
• Overall prices remain low relative to our original contracts for the facility
• Anticipating greater storage needs in near future as regulations impact overall deliverability and capacity in the market
• Pursuing higher value service contracts and strategic market opportunities
• No asset-level debt
• Ability to expand, but will depend on California storage market conditions
• High-value asset in premium geographic location with limited competition from other Pacific Northwest storage facilities
• Facility fully contracted with longer-term, multi-year contracts
• Strong and stable operating results
• Interstate capacity is fully recallable by the utility in the future
GAS STORAGE OUTLOOKMist Interstate Storage Trends
Gill Ranch Storage Trends
20

21
FOCUS ON REGULATED GROWTH Select one picture
INVESTING IN GROWTH($
in m
illion
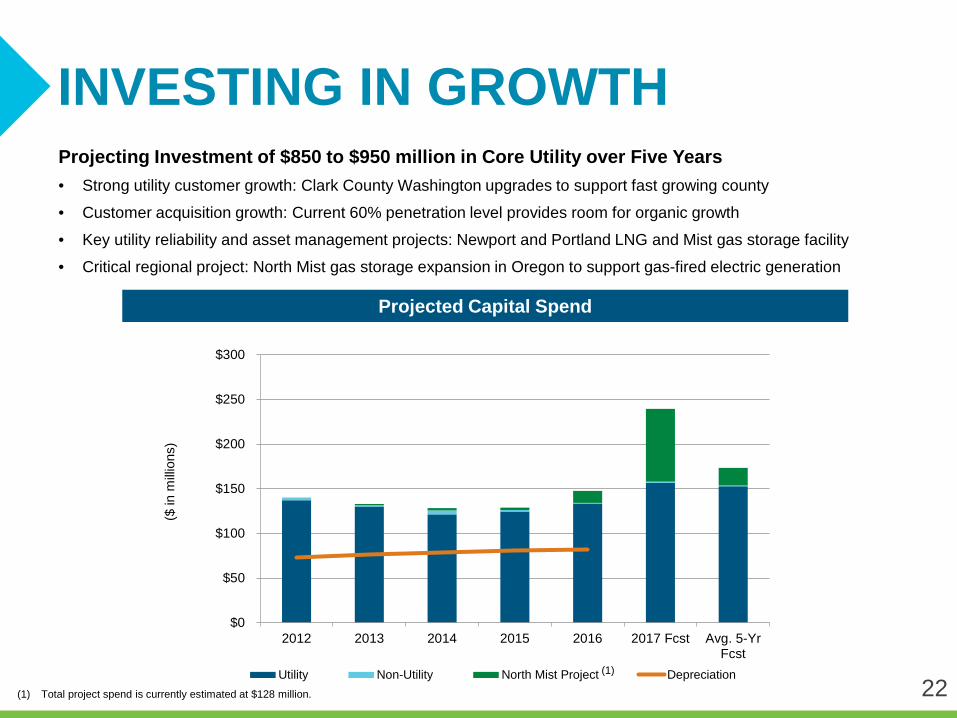
s)Projecting Investment of $850 to $950 million in Core Utility over Five Years• Strong utility customer growth: Clark County Washington upgrades to support fast growing county
• Customer acquisition growth: Current 60% penetration level provides room for organic growth
• Key utility reliability and asset management projects: Newport and Portland LNG and Mist gas storage facility
• Critical regional project: North Mist gas storage expansion in Oregon to support gas-fired electric generation
(1) Total project spend is currently estimated at $128 million.
Projected Capital Spend
22
$0
$50
$100
$150
$200
$250
$300
2012 2013 2014 2015 2016 2017 Fcst Avg. 5-YrFcst
Utility Non-Utility North Mist Project Depreciation(1)
HIGH-GROWTH TERRITORY
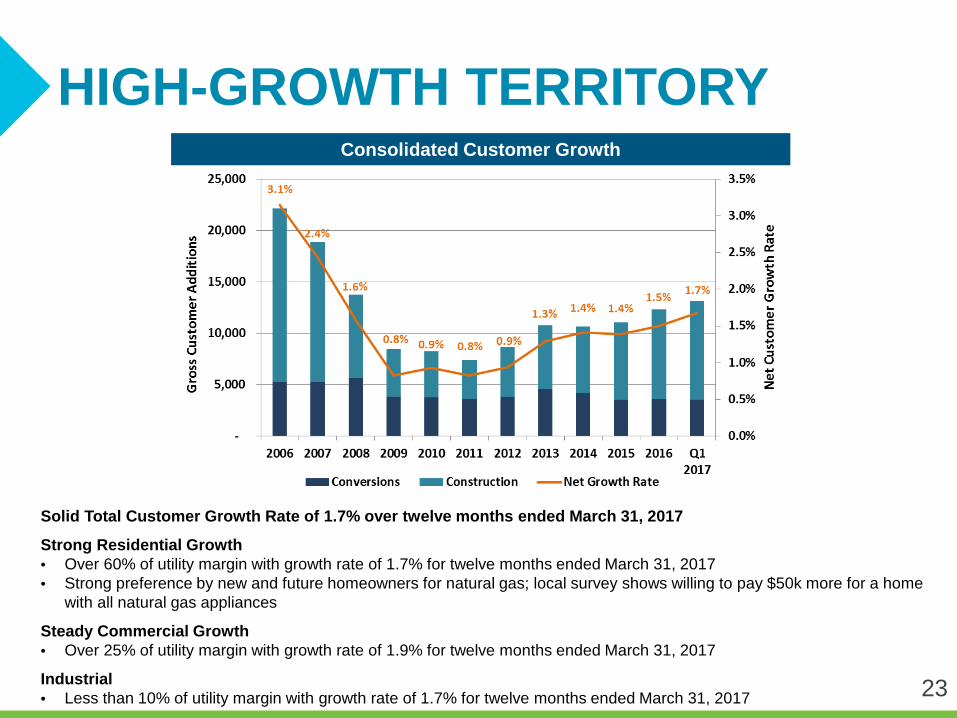
Solid Total Customer Growth Rate of 1.7% over twelve months ended March 31, 2017
Strong Residential Growth• Over 60% of utility margin with growth rate of 1.7% for twelve months ended March 31, 2017• Strong preference by new and future homeowners for natural gas; local survey shows willing to pay $50k more for a home
with all natural gas appliances
Steady Commercial Growth• Over 25% of utility margin with growth rate of 1.9% for twelve months ended March 31, 2017
Industrial• Less than 10% of utility margin with growth rate of 1.7% for twelve months ended March 31, 2017
Consolidated Customer Growth
23

Competitive Advantage• Preferred energy source with recent survey showing 9 out
of 10 new or future homeowners primarily in the Portland/Vancouver area would pick a home with all natural gas appliances versus electric
• Low-cost, reliable, clean energy choice
• Natural gas in approximately 60% of single-family homes
Customer Connections Portal• Cutting edge web-based tool for targeted conversions,
validates customer interest
• Enhanced web services for trade allies
Leveraging the Portal• Ability to identify potential main extensions
• Beginning to identify targets and analyze cost profiles
Gas Not Currently AvailableGas Available
Gas Likely Available
INNOVATIVE ACQUISITION TOOL
24

FOCUSING ON MULTIFAMILYMarket activity• Increase in multifamily construction, especially
mixed-use developments in urban areas
• In-migration and local economic growth have lead to record low vacancy rates in Portland area
• Despite some cooling, still a landlords’ market, with undersupply on a regional level
Executing on the Opportunity• See apartments as an untapped growth
opportunity and a priority segment moving forward
• Analyzed renter preferences and natural gas availability - showing a competitive opportunity
• Created comprehensive marketing program, including a streamlined piping design, technical support and financial incentives to target apartment developers and pursue sector
25

LNG FacilitiesNewport LNG• Upgrades underway totaling approx. $25 million with construction
from 2015 – 2018
Portland LNG• Upgrades totaling approx. $10 million with completion in 2018
Vancouver, Washington Infrastructure• Fastest growing region in service territory
• Upgrades underway totaling approx. $25 million with construction from 2015 – 2019
System Integrity, Replacement, and Betterments• General system replacements and betterments at Mist, operating
facilities, and information technology enhancements
• Proposed PHMSA gas safety regulations in April 2016; comment phase in 2016; expect final rules in late 2017 or early 2018
Integrated Resource Plan Update • Filed IRP in August 2016; acknowledged by OPUC and letter of
compliance from WUTC
Gas Reserve Investments• Future investments contingent upon additional direction from OPUC,
market conditions, and tax appetite
INVESTING FOR RELIABILITY & GROWTH
26

Planned Expansion ProfileStorage Capacity 2.5 Bcf
Deliverability 120,000 Dth/day
Estimated Project Spend $128 million(1)
Target In-Service Date Winter 2018/2019
Planned Expansion Project Update• Innovative no-notice 24/7 storage service integrates
renewables into the power system for RPS
• Agreement with PGE to serve their Port Westward Plant
• Received critical permit from Oregon Energy Facilities Siting Council in April 2016 and delta pressure permit in 2017
• Received Notice to Proceed on September 30, 2016 allowing NW Natural to move forward with construction
• Expansion for single long-term customer; no rate case required for cost recovery; revenues recovered under established tariff schedule
(1) Total project spend based on 2016 notice to proceed estimate.
EXPANDING MIST UTILITY STORAGE
27
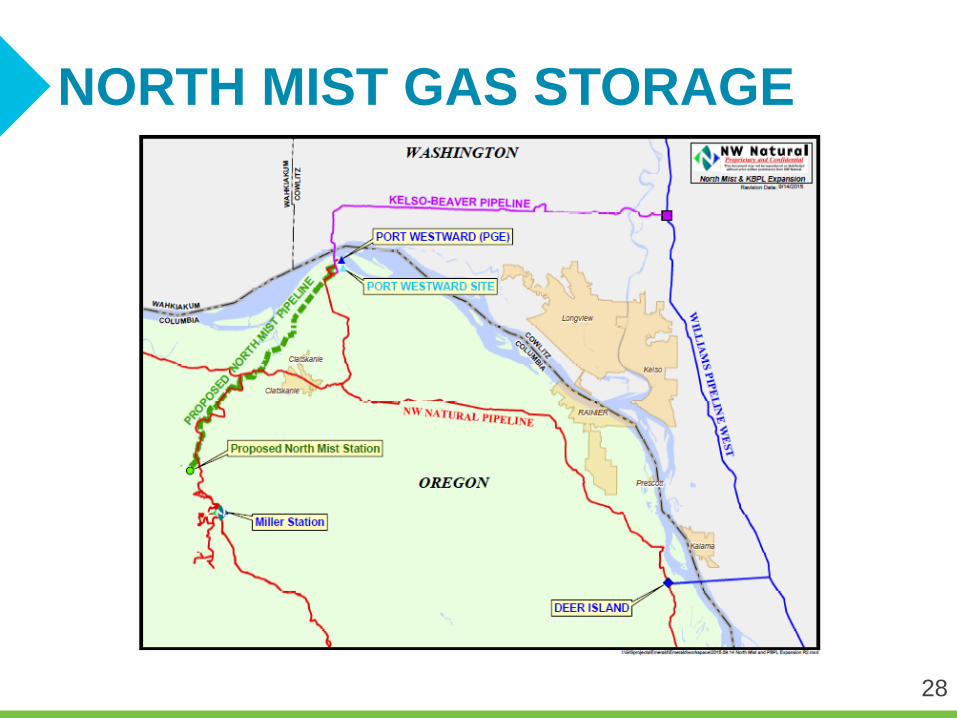
NORTH MIST GAS STORAGE
28

29

DELIVERING SHAREHOLDER VALUEDelivered on 2016 Guidance• GAAP EPS of $2.12 within 2016 guidance range of $1.98 to $2.18 per share
• Non-GAAP EPS of $2.19, which excludes environmental disallowance, within non-GAAP guidance range of $2.05 to $2.25 per share(1)
• Increased utility margin and steady customer growth
• Higher gas storage revenues primarily from Mist gas storage capacity and transportation
• Resumed sustainable O&M expense levels after temporary cost savings in 2015
Solid Earnings in Q1 2017• GAAP EPS of $1.40 for Q1 2017, compared to $1.33 for the same period last year
• Strong earnings from utility
• Higher utility margin from customer growth and effects of colder weather offset by lower gains from gas cost incentive sharing
• Higher other income due to 2016 results including an environmental disallowance from closing out environmental docket and implementing environmental recovery mechanism
• Gas storage results lower
• Decrease in asset management revenues from our Mist facility and transportation capacity and increase in operating expenses for routine maintenance at Gill Ranch
(1) 2016 non-GAAP adjusted EPS excludes the $3.3 million pre-tax or $2.0 million after-tax regulatory disallowance related to the OPUC's Jan. 2016 environmental order. Amounts per share are calculated using the combined federal and state statutory tax rate of 39.5% and divided by 27.8 million diluted shares. 30

Cash Flows• Operating cash flows support capital needs• New environmental mechanism providing ongoing cash flow
for environmental cost recovery
Equity and Debt Offerings in Q4 2016• Successful equity offering generated net proceeds of over $50
million• Strong $150 million medium-term note issuance under shelf:
• $40 million 30-year debt at 4.136% (115 bps over treasury); • $35 million 10-year debt at 3.211% (90 bps over treasury);
and • $75 million 2-year debt at 1.545% (45 bps over treasury)
• Proceeds used for general corporate purposes, to fund utility capital expenditures, including the North Mist gas storage expansion, and to reduce short-term debt balances
Liquidity• $300 million credit facility through 2019• Access to capital markets• Solid credit ratings(1)
DELIVERING SHAREHOLDER VALUE CONTINUED
Credit Ratings(1)
Dividend $50 M
CFFO
S&P Moody’sSecured Debt AA- A1
Commercial Paper A-1 P-2
Outlook Stable Stable
(1) The above credit ratings are dependent upon a number of factors, both qualitative and quantitative, and are subject to change at any time. The disclosure of these credit ratings is not a recommendation to buy, sell or hold NW Natural securities.
($ in millions)
Cash Flow from Operations
31
$169 $176
$216$185
$222
$0
$50
$100
$150
$200
$250
2012 2013 2014 2015 2016
Strong Cash Flows and Liquidity
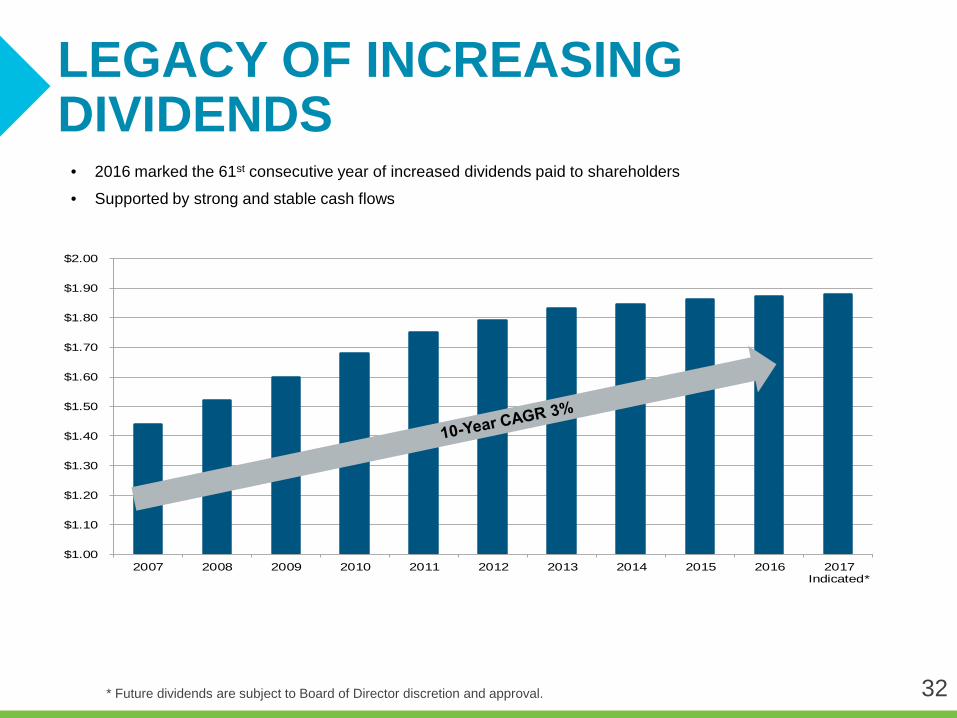
$1.00
$1.10
$1.20
$1.30
$1.40
$1.50
$1.60
$1.70
$1.80
$1.90
$2.00
2007 2008 2009 2010 2011 2012 2013 2014 2015 2016 2017Indicated*
• 2016 marked the 61st consecutive year of increased dividends paid to shareholders
• Supported by strong and stable cash flows
LEGACY OF INCREASING DIVIDENDS
32* Future dividends are subject to Board of Director discretion and approval.


Stable utility margins • Company results continue to show steady growth from utility
• Utility-focused business with stable core customer revenues
• Organic growth potential with strong economics driving single and multifamily construction
Excellent operations and efficient cost structure• Consistently high customer satisfaction ratings and system reliability
• Strong balance sheet and cash flows
• 61-year history of increasing dividends paid to shareholders
Long-term growth opportunities• Innovative ideas and new programs
• Storage development opportunities to support flexible energy resource needs
• Regional pipeline expansion opportunity
CONSISTENT STRATEGY
34

INVESTMENT HIGHLIGHTS• Low-risk business profile with 90%+ of revenues from pure-play LDC• Over 730,000 utility customers with nearly 14,000 miles of distribution and
transmission mains• Supportive regulatory environments in Oregon and Washington with progressive
recovery mechanisms• Modern distribution system – no identified cast iron or bare steel
Stable, Regulated Earnings Profile
Proven Financial Performance
Tangible Growth Opportunities
• Stable dividends with 61-year record of increasing dividends paid annually
• Investment grade credit ratings from S&P and Moody’s
• Experienced management team with broad knowledge of the energy industry
• Projected five-year capital expenditures plan of $850-950 million
• Service territory experiencing above average customer growth (1.7% for the twelve months ending March 31, 2017)
• Continuous replacement of existing infrastructure to ensure reliability and safety
• $128 million (estimated) regulated expansion of Mist facility to support renewables in the region
35

36
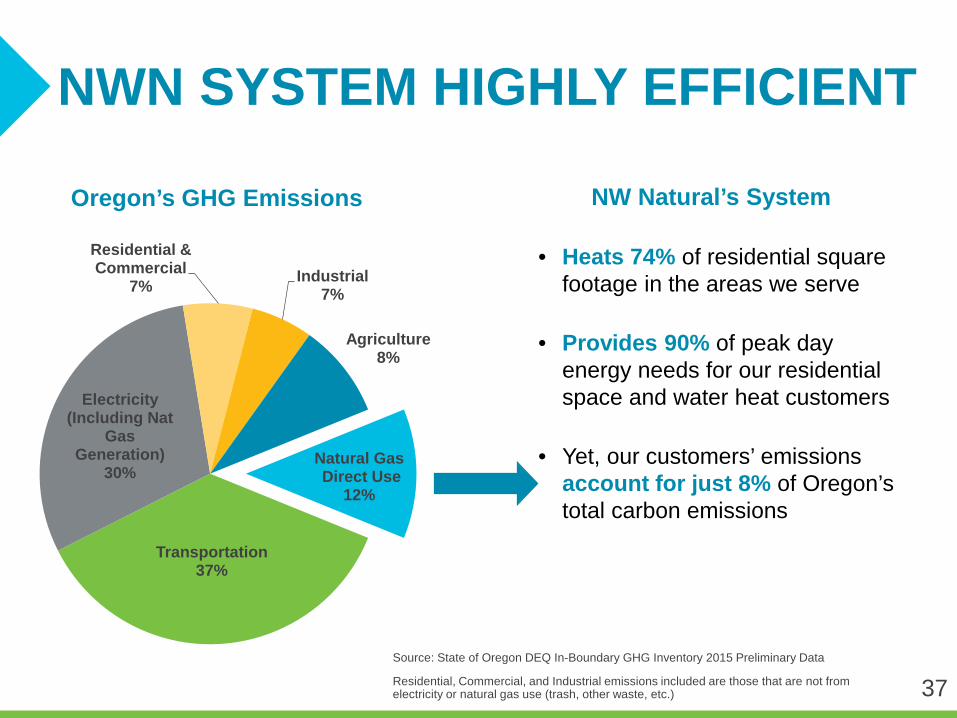
NWN SYSTEM HIGHLY EFFICIENT
Transportation37%
Electricity (Including Nat
Gas Generation)
30%
Residential & Commercial
7% Industrial7%
Agriculture8%
Natural GasDirect Use
12%
Source: State of Oregon DEQ In-Boundary GHG Inventory 2015 Preliminary Data
Residential, Commercial, and Industrial emissions included are those that are not from electricity or natural gas use (trash, other waste, etc.)
NW Natural’s System
• Heats 74% of residential square footage in the areas we serve
• Provides 90% of peak day energy needs for our residential space and water heat customers
• Yet, our customers’ emissions account for just 8% of Oregon’s total carbon emissions
Oregon’s GHG Emissions
37

OUR LOW-CARBON PATHWAY
Baseline: 2015 emissions associated with customer use.
VOLUNTARY GOAL: 30% CARBON SAVINGS BY 2035
38
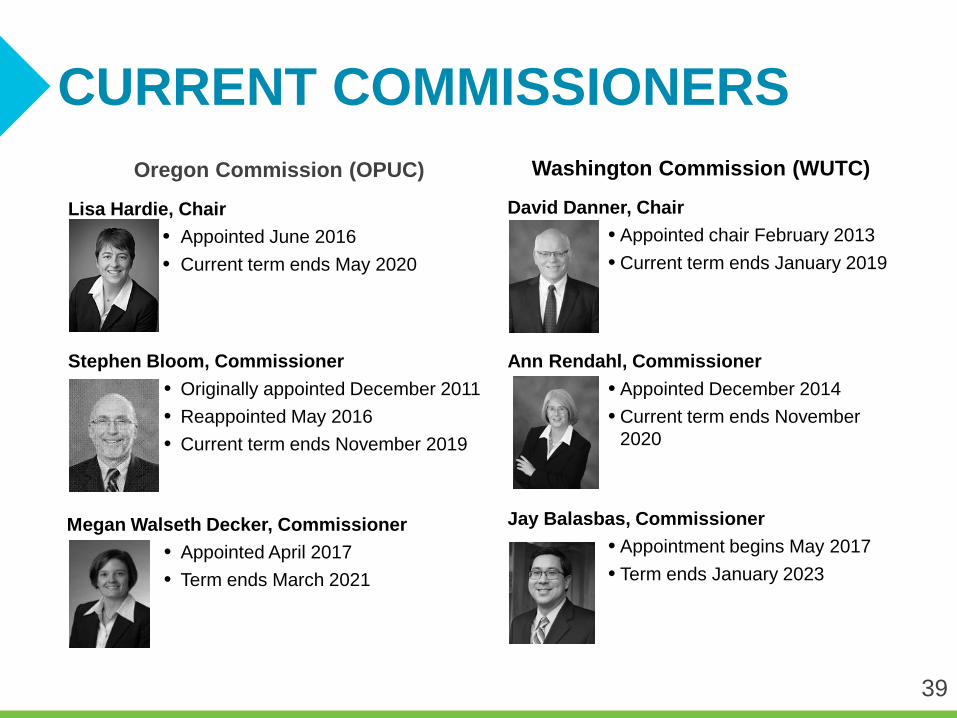
Oregon Commission (OPUC)
Lisa Hardie, Chair• Appointed June 2016• Current term ends May 2020
Stephen Bloom, Commissioner• Originally appointed December 2011• Reappointed May 2016• Current term ends November 2019
Megan Walseth Decker, Commissioner• Appointed April 2017• Term ends March 2021
Washington Commission (WUTC)
David Danner, Chair• Appointed chair February 2013• Current term ends January 2019
Ann Rendahl, Commissioner• Appointed December 2014• Current term ends November
2020
Jay Balasbas, Commissioner• Appointment begins May 2017• Term ends January 2023
CURRENT COMMISSIONERS
39

POTENTIAL TRAIL WEST PIPELINE
40
• Regional pipeline expansion opportunities
• NWN owns 50% of Trail West Holdings (TWH)
• TWH is pursuing development of Trail West gas transmission pipeline
• Continue to evaluate Trail West for development
• NWN investment in TWH is $13.4 million at March 31, 2017

LEAD. INNOVATE. GROW.