LC/MS WORKSHOP IOWA STATE UNIVERSITY Kamel Harrata Instrument Description Data Acquisition Data...
28
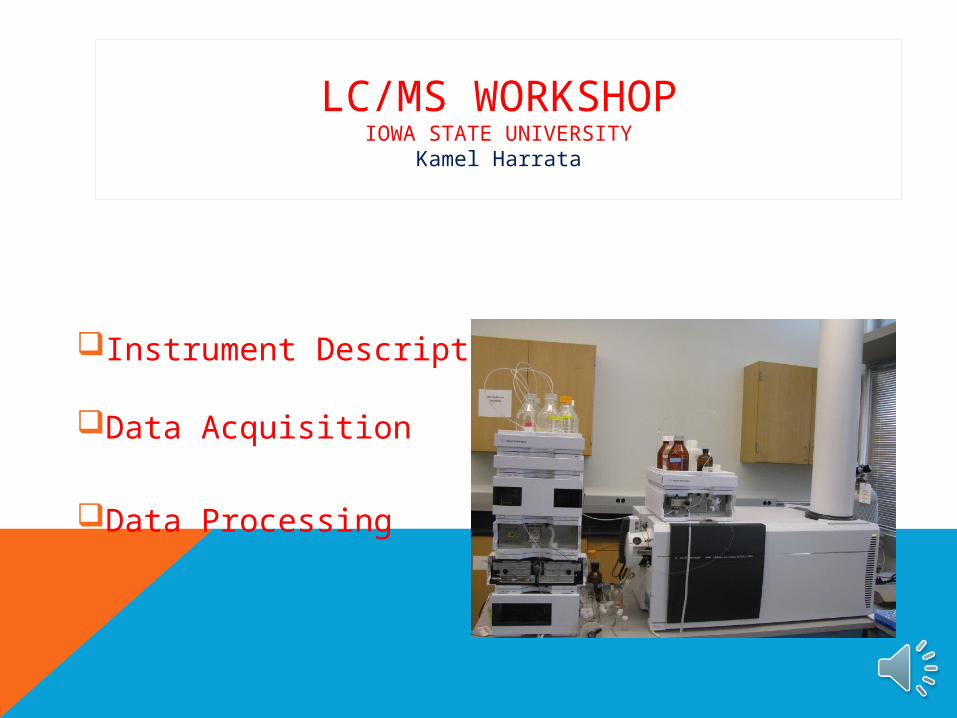
LC/MS WORKSHOP IOWA STATE UNIVERSITY Kamel Harrata Instrument Description Data Acquisition Data Processing
-
Upload
oswald-jenkins -
Category
Documents
-
view
216 -
download
0
Transcript of LC/MS WORKSHOP IOWA STATE UNIVERSITY Kamel Harrata Instrument Description Data Acquisition Data...
LC/MS WORKSHOPIOWA STATE UNIVERSITY
Kamel Harrata
Instrument Description
Data Acquisition
Data Processing

WHAT IS MASS SPECTROMETRY?
Mass spectrometry is an analytical technique that involves the study in the gas phase of ionized molecules with the aim of one or more of the following:
• Structural characterization • Gas phase reactivity study • Qualitative and quantitative analysis of
components in a mixture. • Molecular weight determination

LC/MS and GC/MS Mass Spectrometers
GC/MS
LC/MS
InletIon
SourceAnalyzer
Detector
m/z
Data SystemDirect Probe
Flow InjectionGC, LC
EI, CIAPCI, ESI
Q, QQQEB,Ion TrapTOF, QTOFFT, Orbitrap
EM, PM
Micromass GCT Agilent QTOF 6540

•Pharmaceutical analysis•Biomolecule characterization
Proteins and peptidesOligonucleotides
•Environmental analysisPesticides on foodsSoil and groundwater contamination
•Forensic analysis/clinical
Applications of Mass Spectrometry

TOF EQUATION

TIME OF FLIGHT SCAN

QTOF 6540 CAPABILITIES
MS and MS/MSMass Accuracy of better than 3ppmResolution (FWHM) 45,000 for mass
1000Rapid switching between positive
and negative ion modes

LC SYSTEM
4 reservoir bottles A1, A2, B1, B2
Binary Pump can handle up to 8000 psi
UV detector
LC Column housing
Autosampler

ELECTROSPRAY IONIZATION
Desolvation + Coulomb Explosions

AGILENT ELECTROSPRAY ION SOURCE (POSITIVE MODE)
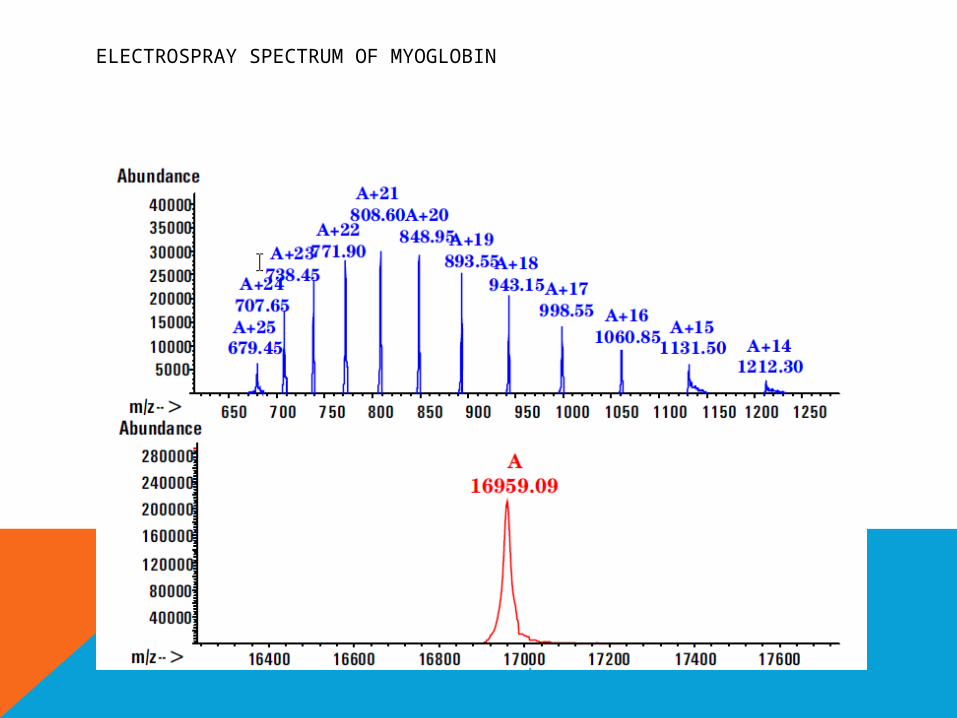
ELECTROSPRAY SPECTRUM OF MYOGLOBIN

RELATIVE APPLICABILITY OF LC/MS TECHNIQUES
ADVANTAGES OF ELECTROSPRAY
• Soft ionization
• LC/MS interface with best sensitivity
• Extends mass range for multiply charged analytes
• Works with a wide range of moderate to high polarity compounds
• Low maintenance

ELECTROSPRAY SOLUTION CHEMISTRY
- Mobile phase pH has a major effect for analyte that are ions in solution
- Basic pH (>7.0; 9 preferred) for negative ions
- Acidic pH (<7.0; 5 preferred) for positive ions
- Manipulation of pH can enhance performance for analytes that are not normally ionized in solution

QTOF 6540 ION PATH ELEMENTS
MASS SPECTROMETER TYPE: MASS ACCURACY
• Quadrupole 200-300 ppm• Linear Time of Flight 200 ppm• Reflectron Time of Flight 25-50
ppm• OR-Time of Flight 1-3 ppm• Fourier Transform MS 0.1-1
ppm

MASS ACCURACY-DEVIATION IN PPM

EXACT MASS CALCULATION AND DEVIATION

HOW MUCH MASS ACCURACY IS NEEDED?
Elemental composition implication

TOF RESOLUTION
Resolution is the ability to distinguish between two mass peaks that are extremely close togetherResolution = M / Peak Width
(FWHM: full width at half maximum)

LC/MS OF SEMIX (10 UG/ML) 10 PPM
LC/ESI pos of : L-Selenocysteine (Peak#1); MethSeCy (#2); SeMethionine(#3); Etionine(#4)
Agilent XDB C18, 1.8 um, 4.6mm ID, 150 mm L
L-Selenocysteine MW 168 MethylSelenoCysteine MW 182
SelenoMethinine MW196 MW 163

QUALITATIVE DATA PROCESSINGMASS HUNTER QUAL SOFTWARE
Open File
Use default layout: Chromatogram, Mass Specta
Process and print data
Display mass spectrum
Average few scans
Background substraction
Peak integration

POSITIVE ION MODE LC/ESI OF SEMIX
6x10
0.52
0.54
0.56
0.58
0.6
0.62
0.64
0.66
0.68
0.7
0.72
0.74
0.76
0.78
0.8
0.82
0.84
0.86
0.88
0.9
0.92
0.94
0.96
0.98
1
1.02
1.04
1.06
1.08
1.1
1.12
1.14
1.16
1.18+ESI TIC Scan Frag=175.0V QTOF1100112.d
1
Counts vs. Acquisition Time (min)0.2 0.4 0.6 0.8 1 1.2 1.4 1.6 1.8 2 2.2 2.4 2.6 2.8 3 3.2 3.4 3.6 3.8

SELECTED IONS FROM SEMIX
1x10
0
1
2
3
+ESI TIC Scan Frag=175.0V QTOF1100112.d
2.05720.86140.6812
1.3037
0.5993 1.8606 2.3520
2x10
0
0.25
0.5
0.75
1+ESI EIC(336.9181) Scan Frag=175.0V QTOF1100112.d
0.6976
0.77951.0907 1.9425
2x10
0
0.25
0.5
0.75
1+ESI EIC(166.9597) Scan Frag=175.0V QTOF1100112.d
0.8614
2x10
0
0.25
0.5
0.75
1+ESI EIC(197.9998) Scan Frag=175.0V QTOF1100112.d
1.3037
0.6812 1.5166
2x10
0
0.25
0.5
0.75
1+ESI EIC(164.0743) Scan Frag=175.0V QTOF1100112.d
2.0572
Counts (%) vs. Acquisition Time (min)0.4 0.5 0.6 0.7 0.8 0.9 1 1.1 1.2 1.3 1.4 1.5 1.6 1.7 1.8 1.9 2 2.1 2.2 2.3 2.4 2.5

ESI MASS SPECTRA OF SEMIX
3x10
0
0.5
1
1.5
2
2.5
3
3.5
4+ESI Scan (0.6321-0.7304 min, 7 scans) Frag=175.0V QTOF1100112.d Subtract
247.8689
336.9161
167.9531 288.9178
4x10
0
0.2
0.4
0.6
0.8
1
1.2
1.4
+ESI Scan (0.8287-0.9269 min, 7 scans) Frag=175.0V QTOF1100112.d Subtract
166.9578
227.9477
4x10
0
0.2
0.4
0.6
0.8
1
1.2
+ESI Scan (1.2709-1.3528 min, 6 scans) Frag=175.0V QTOF1100112.d Subtract
180.9732
134.9684
4x10
0
0.5
1
1.5
2
2.5
3
3.5
4
+ESI Scan (2.0244-2.1063 min, 6 scans) Frag=175.0V QTOF1100112.d Subtract
147.0449
208.0347
Counts vs. Mass-to-Charge (m/z)120 140 160 180 200 220 240 260 280 300 320 340 360 380 400 420 440 460 480 500 520 540 560 580

LC/ESI OF SURFACTINE MIXTURES

14 DALTON DIFFERENCE BETWEEN COMPOUNDS

POSITIVE ION MODE APCI OF CAROTENOIDS
m/z
Positive ion mode LC/APCI is the method of choice for analyzing and quantifying Carotenoids