Larvae - University of California, Santa Cruz “Bipartite” life cycle of benthic marine organisms...
21
1 “Bipartite” life cycle of benthic marine organisms with pelagic larvae Benthic Environment Adult Larvae Juvenile Pelagic Environment survive, grow, mature survive, grow, develop, disperse settlement reproduce I. Pattern: species distributed in discrete zones relative to elevation and tidal height. In the beginning… when ecologists first wandered into the intertidal…
Transcript of Larvae - University of California, Santa Cruz “Bipartite” life cycle of benthic marine organisms...

1
“Bipartite” life cycle of benthic marine
organisms with pelagic larvae
Benthic Environment
Adult
Larvae
Juvenile
Pelagic Environment
survive, grow, mature
survive, grow, develop, disperse
settlement reproduce
I. Pattern: species distributed in discrete zones
relative to elevation and tidal height.
In the beginning… when ecologists first wandered
into the intertidal…

2
mussels
gooseneck barnacles
acorn barnacles,
tunicates, sponges,
anemones
pink coralline algae
Rocky Intertidal Zonation
‘keystone’ predator
Pisaster
3

4
i) zonation exhibited across a very short distance
- Implies very strong determinants of distribution and
abundance
- wonderful opportunity to examine causes of zonation
In the beginning… when ecologists first wandered
into the intertidal…
II) Almost all of the early ecological studies designed to
explain zonation concentrated on processes affecting
individuals after settlement (i.e. juv.s and adults in
benthic habitat)
Reasons:
i) those were the organisms (life stages) of which
patterns were described (zonation)
ii) logistically easier to work on questions involving
benthic stages than larvae (in the field)
iii) benthic populations thought to be replenished by a
limitless pool of larvae (i.e. benthic interactions more
important determinants of benthic populations
In the beginning… when ecologists first wandered
into the intertidal…

5
i) Intertidal zone is an (ecotone), the interface of two
distinct habitats; terrestrial, and marine (higher, more
terrestrial tolerant; lower more marine tolerant)
ii) what could cause such sharp boundaries in species
distributions? It seemed clear that such boundaries had
to be the result of physical factors
[[rapid shift in environmental conditions and successful
species]]
iii) what was the most likely physical factor that could
cause zonation in intertidal areas? ---Tides
II) Tides as a determinant of zonation patterns in intertidal
X
12:00
Noon
X
X
6:00 PM
X
X
X
X
X
6:00 AM
12:00
Midnight
Tide
Level
SUN
MOON
gravitational pull
Semi-diurnal (twice daily) tides
Spring tide sequence
6
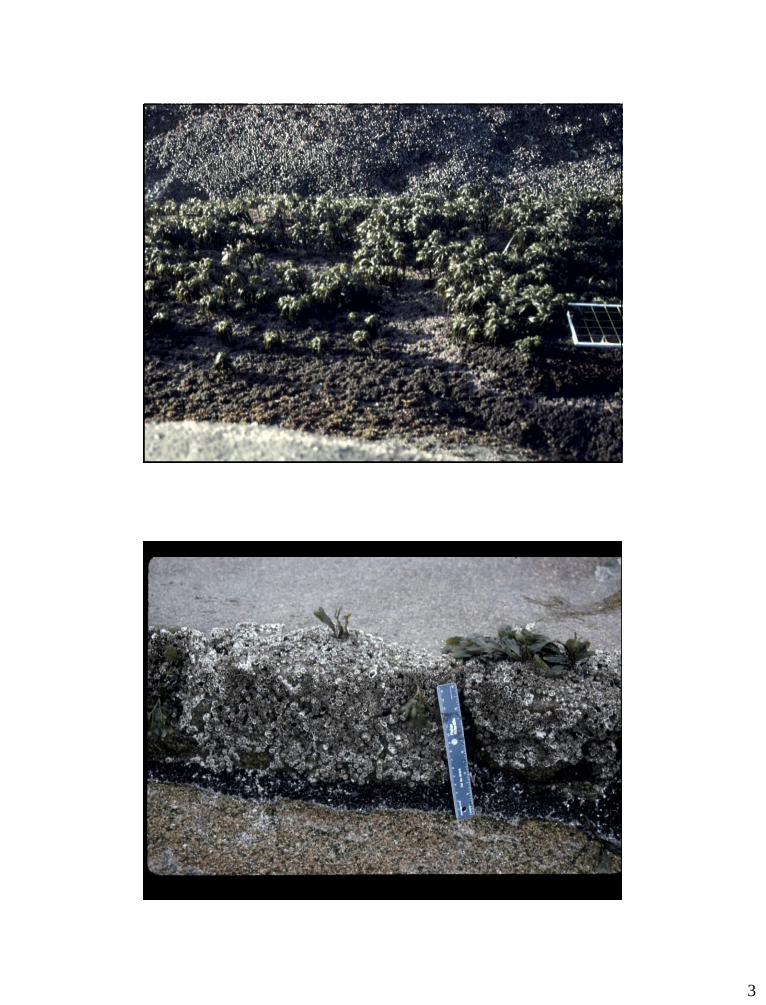
Sun and moon have different gravitational strengths
(previous slide) and topography of ocean basin
modifies tidal current so that high (and low) tides
are not same height. This is referred to as mixed
semi-diurnal tides
mean sea level
0 ft mark at MLLW (mean lower low water)
= mean lowest tides over the year at that location
http://tbone.biol.sc.edu/tide/
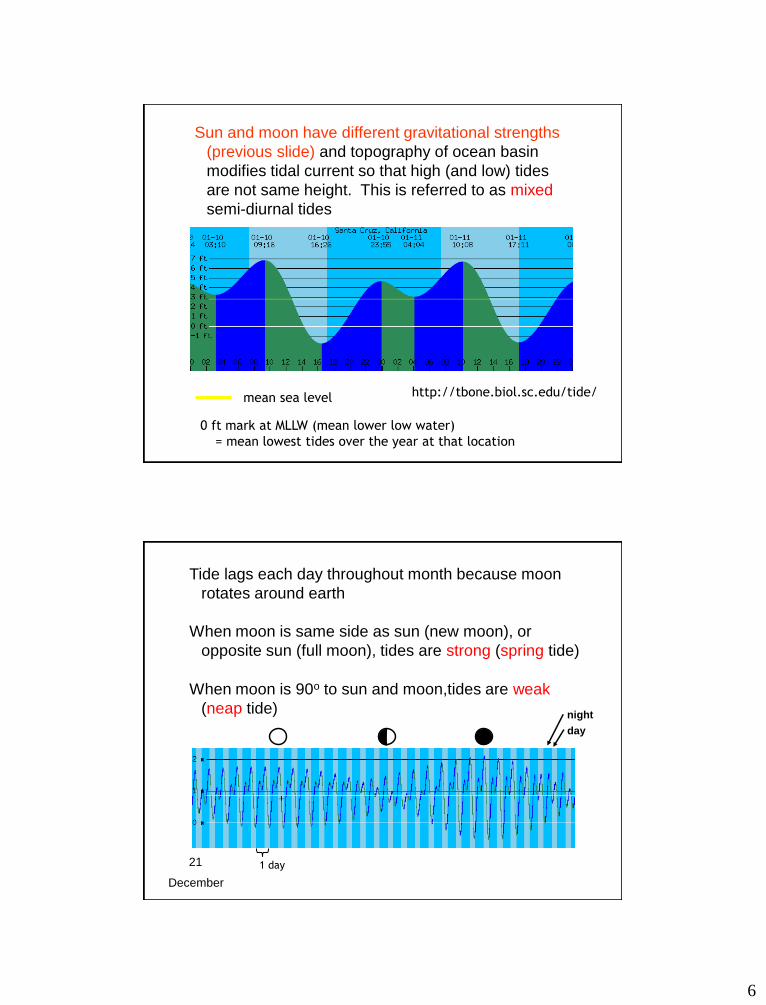
Tide lags each day throughout month because moon
rotates around earth
When moon is same side as sun (new moon), or
opposite sun (full moon), tides are strong (spring tide)
When moon is 90o to sun and moon,tides are weak
(neap tide) night
day
December
21 1 day

7
a) Tides are sinusoidal. Appearance of the sine wave tidal
function might lead one to believe that the relationship
between immersion time (time underwater) and tidal
height decreases smoothly (and linearly or gently
curvilinear) with increasing tidal height:
II) Tides as a determinant of zonation patterns in intertidal
Mean no. hr of
immersion
(= submergence)
tidal level (= height in intertidal)
low high
Does this correspond intuitively to sharp breaks in zonation patterns?
i) Pattern: sampled distributions of species of macroalgae along CA
and Oregon coasts and found (at all sites):
b) Example Doty (1946, Ecology 27:315-328)
Nonetheless, an early example exploring this hypothesis…
iii) Specific hypothesis: species zones will correlate with discrete zones
of immersion (“critical tide levels”)
crustose coralline reds (cc)
Six distinct zones
Endocladia (En)
Gigartina (G)
Egregia (Eg)
fleshy reds (fr)
Laminaria – kelp (L)
elevation
in
intertidal
low
high
MLLW
ii) General hypothesis: tidal fluctuation and differential tolerance to
immersion causes zonation of species in intertidal

8
iv) Test: Calculated the actual immersion times over the tidal range:
b) Example Doty (1946, Ecology 27:315-328)
vi) Conclusion: physical factors - immersion - control species distribution
and determine zonation of species in intertidal
v) Results: dramatic non-linear steps in immersion that correlated with
algal zonation!
Mean no. hr of
immersion
(= submergence)
tidal level (= height in intertidal)
low high
24
16
12
8
20
0
4
CC G En Eg fr L
Literally cut and weighed tide tables!

9
i) Should upper and lower limits both be set by physical factors?
Where do intertidal species come from?
Would physical factors determine lower limit?
c) Questions / observations:
ii) critical tidal levels were less good at explaining animal distributions;
particularly mobile animals – does this cause rejection or
modification of the general hypothesis?
iii) Alternative hypotheses?
Upper limits
a) radiation (UV)
b) desiccation
c) thermal stress
d) freshwater
e) lack of settlement - larval supply
f) food availability
g) biotic interactions
Lower limits
a) submersion
b) lack of settlement - larval supply
c) biotic interactions
iv) How best to distinguish among these alternative hypotheses?
c) Questions / observations:
v) What processes or mechanisms are responsible for each
alternative?
III) Connell and the experimental revolution
a) Most ecological field studies prior to study we are to
examine were purely descriptive (like Doty’s)
Connell, J. H.:
PhD in Milport, England
Ecology 1961; Ecol. Monographs 1961

10
III) Connell and the experimental revolution
a) Most ecological field studies prior to study we are to
examine were purely descriptive (like Doty’s)
b) System: two species of barnacles and a carnivorous
gastropod in the rocky intertidal:
i) Balanus (Semibalanus) balanoidies (S) - a large
barnacle
ii) Chthamalus stellatus (C) – a small barnacle
iii) Thais (Nucella) lapillus (T) – predatory snail

11
Semibalanus Chthamalus
Thais (Nucella)
III) Connell and the experimental revolution
c) Pattern: disjunct vertical distribution of adults of the
two barnacle species in intertidal zone
1) Adult distributions more restricted than
recruit distribution:
- at upper limits for both species
- at lower limits for Chthamalus
2) Distribution of Ctham and Semi overlap
extensively as recruits but little as adults
3) Thais only found in adult distribution of Semi

12
III) Connell and the experimental revolution
d) Hypotheses (and circumstantial evidence)
1) Upper limits - propose some for both species
a) set by settlement distribution?
- inconsistent with observation that settlement
occurs higher than adult distribution
Why untested?
i) Chthamalus - few organisms above it (including
predators)
ii) Semibalanus - no evidence from other work that
(Chtham negatively affects Semi)
b) species interactions? (untested by Connell)
13
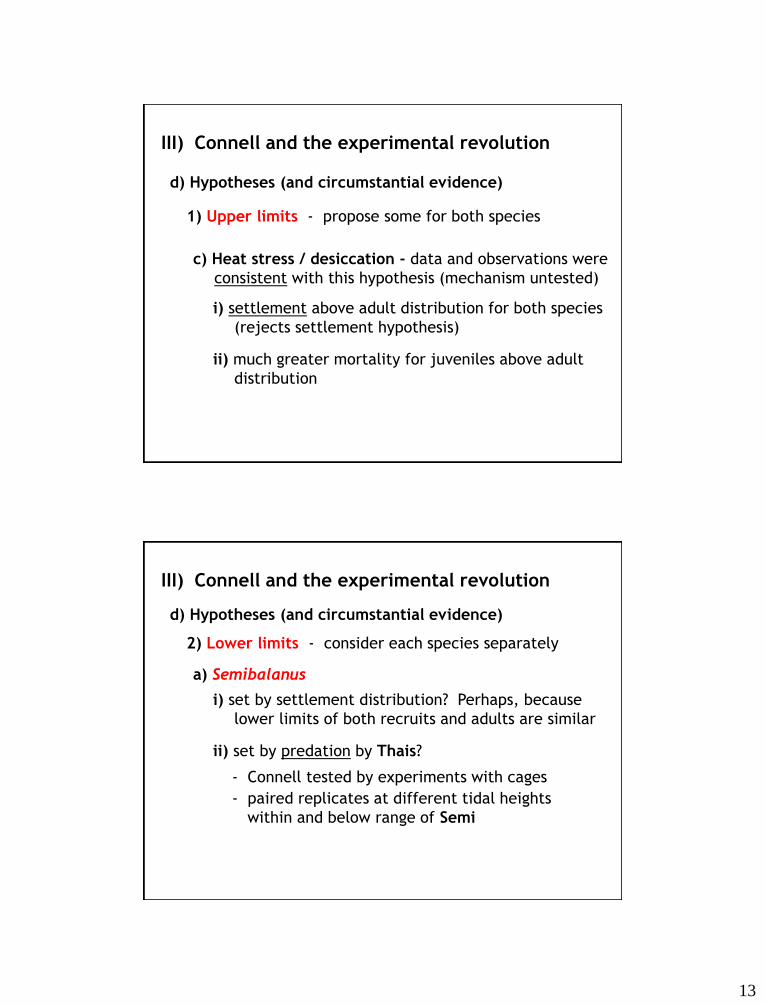
III) Connell and the experimental revolution
d) Hypotheses (and circumstantial evidence)
1) Upper limits - propose some for both species
c) Heat stress / desiccation - data and observations were
consistent with this hypothesis (mechanism untested)
i) settlement above adult distribution for both species
(rejects settlement hypothesis)
ii) much greater mortality for juveniles above adult
distribution
III) Connell and the experimental revolution
d) Hypotheses (and circumstantial evidence)
2) Lower limits - consider each species separately
a) Semibalanus
i) set by settlement distribution? Perhaps, because
lower limits of both recruits and adults are similar
ii) set by predation by Thais?
- Connell tested by experiments with cages
- paired replicates at different tidal heights
within and below range of Semi
14
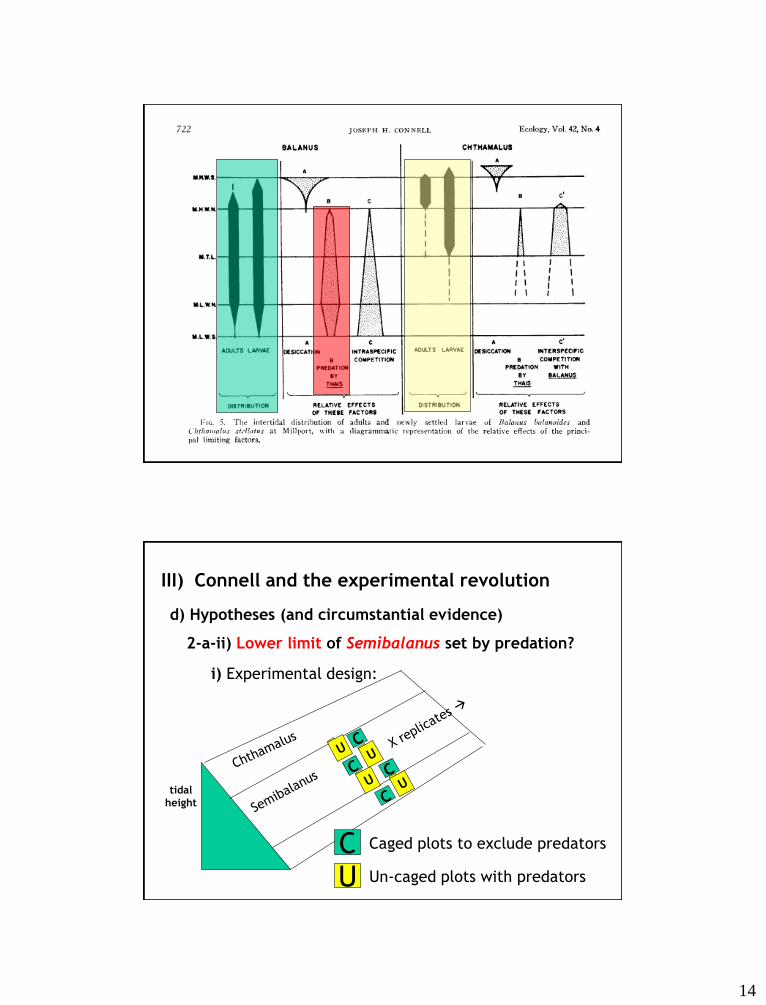
III) Connell and the experimental revolution
d) Hypotheses (and circumstantial evidence)
2-a-ii) Lower limit of Semibalanus set by predation?
tidal
height
C Caged plots to exclude predators
U Un-caged plots with predators
i) Experimental design:

15
III) Connell and the experimental revolution
d) Hypotheses (and circumstantial evidence)
2-a-ii) Lower limit of Semibalanus set by predation?
Caged plots to exclude predators
Un-caged plots with predators ii) Prediction:
Semi
Density
(no./m0.25)
a) predation more intense at lower limits, but
b) Semi were not completely excluded at any tidal height
c) in absence of predators, tidal ht unimportant to Semi abundance
iii) Results:
tidal height low high
tidal height low high
III) Connell and the experimental revolution
d) Hypotheses (and circumstantial evidence)
2) Lower limit of Semibalanus set by predation?
iii) Results:
d) lower limit not set by predation (numbers reduced with or
without predator), but size distribution changed (larger higher
in intertidal - important later)
3) Other Biological Interactions? e.g. competition with
algae (untested)
4) Physical factors? — immersion— untested — why?
Mean
size of
Semi
(mm)
tidal height low high

16
III) Connell and the experimental revolution
d) Hypotheses (and circumstantial evidence)
2) Lower limits - consider each species separately
b) Chthamalus
i) Physical processes — immersion (= submergence)
- placed rocks with Chtham juveniles in tidepools
(of same tidal ht)
- compared survivorship to those not in tidepools
- no difference in survivorship
- conclusion: immersion not important
ii) Settlement distribution — unlikely
- settlement distribution much lower than adult distribution
- indicates post-settlement mortality
III) Connell and the experimental revolution
d) Hypotheses (and circumstantial evidence)
2) Lower limits - consider each species separately
b) Chthamalus
iii) Predation/Competition — Tested both at once
(allows for test of multiple causality and
interaction among factors)
- attached rocks with juvenile Chtham and Semi at several
tidal heights
- remove Semi from ½ of each rock
- half of rocks at each tidal ht were enclosed in cages (to
exclude predators)

17
III) Connell and the experimental revolution
d) Hypotheses (and circumstantial evidence)
2-b-iii) Lower limits of Chthamalus set by predation
and/or competition?
- remove Semi from ½ of each rock
- half of rocks at each tidal ht were enclosed in cages (to
exclude predators)
Semi
Thais
i) Experimental design:
III) Connell and the experimental revolution
d) Hypotheses (and circumstantial evidence)
2-b-iii) Lower limits of Chthamalus set by predation
and/or competition?
ii) Predictions:
Chtham.
percent
cover
+ Semi -- Semi
+T +T
-T -T
Conclusions:
+ Semi -- Semi
+T
+T
-T
-T
+ Semi -- Semi
+T +T -T
-T
+ Semi -- Semi
+T
+T
-T -T
Only predation
important
Only competition
important
Both C and P
important
(additive effects)
C and P interact
(multiplicative
effects)

18
III) Connell and the experimental revolution
d) Hypotheses (and circumstantial evidence)
2-b-iii) Lower limits of Chthamalus set by predation
and/or competition?
- Semi limits Chth distribution and abundance (competition)
- Thais does not control Chth by itself
Semi
Thais
ii) Results:
+ Semi
Chtham.
percent
cover
-- Semi
+ T + T
- T
- T
- Semi and Thais jointly limit Chth distribution and abundance
- Thais eats Semi, enhancing Chth distribution and abundance
III) Connell and the experimental revolution
Consequences:
1) “Connell’s rule”: upper limits set by physical processes, lower limits set by
species interactions
2) The dawn of appreciation and exploration of experimental field ecology
Width of “bar”
represents
strength of
importance

19
III) Connell and the experimental revolution
2) Other examples (the “take off” of field experiments)
David Wethey (1984, Biological Bulletin)
a) System - same as Connell’s (Semibalanus and Chthamalus)
But in New England on east coast of US
b) Pattern - same as Connell’s (Semibalanus and Chthamalus)
But focus greater focus on explaining upper limits
c) General hypotheses:
i) Solar exposure affects Semi (more than Chth) restricting its upper
limit
ii) Competition with Semi restricts Chth lower limit
d) Specific hypotheses:
Shading areas above upper limit of Semi will:
1) allow Semi to extend higher (test of (i) above)
2) cause decrease in Chth because of increase in Semi ((ii) above)
III) Connell and the experimental revolution
Consequences:
1) “Connell’s rule”: upper limits set by physical processes, lower limits set by
species interactions
2) The dawn of appreciation and exploration of experimental field ecology
Width of “bar”
represents
strength of
importance

20
III) Connell and the experimental revolution
2) Other examples (David Wethey, 1984)
e) Design:
- unmanipulated “control” treatment level to compare manipulations
with (why???)
- manipulations designed to test for artifacts of main manipulation
1) Unmanipulated control - predators, no shading
2) 2-sided cage, with screen “roof” - no shade but physical effect of a roof
3) Full cage with screen “roof” - exclude confounding effects of predators, no shade
4) 2-sided cage, with clear plastic roof - “cage effects” and no shading
5) Full cage, with clear plastic roof - exclude predators, no shading
6) 2-sided cage, with opaque (shading) plastic roof - cage effects, shading
7) Full cage, with opaque (shading) plastic roof - exclude predators, with shading
(7) vs. (5) both exclude predators and differ only in the degree of shading
All others get at artifacts of predator exclusion and materials for manipulating shading
III) Connell and the experimental revolution
2) Other examples (David Wethey 1984)
f) Results:
i) No cage or roof material effects
ii) Survivorship of Semi above
normal adult distribution:
No
shade
(3/5)
survivorship
Shade
(7)
iii) Survivorship of Chth above
normal adult distribution:
Semi
Chth
iv) Decreased survivorship of Chth in shade
because of increased abundance of Semi
g) Conclusions:
i) Upper limit of Semi set by “solar exposure”
ii) Lower limit of Chth set by competition with Semi.
iii) Support for Connell’s Rule!

21