Seasonal patterns of benthic-pelagic coupling in oyster ...
15
MARINE ECOLOGY PROGRESS SERIES Mar Ecol Prog Ser Vol. 652: 95–109, 2020 https://doi.org/10.3354/meps13490 Published October 15 1. INTRODUCTION Large oyster populations characterized many estu- aries on the Atlantic Coast of North America prior to European colonization (Nixon 1997, Beck et al. 2011, Zu Ermgassen et al. 2013, Rick et al. 2016). Globally, oyster reefs have declined by approximately 85% of their historic extent (Beck et al. 2011), and less than 6% of oyster reefs on the Northeastern Coast of the United States remain (Zu Ermgassen et al. 2012). Increasingly, there are efforts to restore oyster reefs and develop the oyster aquaculture industry to re- cover both economic and ecological benefits. Such ecological services include provision of habitat for other marine species, protection from storm surge, and prevention and reduction of the symptoms of eutrophication (Jackson 2001, Newell et al. 2005, Bernhardt & Leslie 2013). Additionally, oysters play an important role in regulating benthic−pelagic cou- pling processes in coastal ecosystems (Newell et al. 2005, Smyth et al. 2013a). Specifically, oysters en- hance rates of organic matter (OM) deposition to the benthos, thereby increasing dissolved nitrogen (N) and phosphorus (P) recycling in coastal systems (Boucher & Boucher-Rodoni 1988, Dame et al. 1992). Oysters not only enhance elemental cycling rates in coastal systems, but can also change the pathways dominating these rates. For example, oysters may © The authors 2020. Open Access under Creative Commons by Attribution Licence. Use, distribution and reproduction are un- restricted. Authors and original publication must be credited. Publisher: Inter-Research · www.int-res.com *Corresponding author: [email protected] Seasonal patterns of benthic-pelagic coupling in oyster habitats Nicholas E. Ray 1, *, Robinson W. Fulweiler 1,2 1 Department of Biology, Boston University, Boston, MA 02215, USA 2 Department of Earth and Environment, Boston University, Boston, MA 02215, USA ABSTRACT: Oysters enhance benthic−pelagic coupling in coastal systems by moving large quan- tities of suspended particulates to the sediments, stimulating biogeochemical processes. Recent research efforts have focused on quantifying the impact of oysters on coastal biogeochemical cycling, yet there is little consensus on how oysters influence processes across systems. A poten- tial driver of this variance is availability of organic material suspended in the water column and subsequent loading to sediment by oysters. Here, we measured fluxes of sediment di-nitrogen (N 2 -N), ammonium (NH 4 + ), combined nitrate-nitrite (NO x ), and phosphate (PO 4 3− ) in spring, sum- mer, and fall at 2 oyster reefs and 1 farm in a temperate estuary (Narragansett Bay, Rhode Island). We then linked these fluxes with patterns of water column primary production. Nitrogen removal from the system was highest in spring, when we detected net sediment denitrification (48.8 μmol N 2 -N m −2 h −1 ) following a winter−spring diatom bloom. In contrast, we measured sediment N 2 fix- ation in fall (−44.8 μmol N 2 -N m −2 h −1 ) at rates nearly equivalent to spring denitrification. In the summer, we measured a nearly net zero sediment N 2 -N flux (−2.7 μmol N 2 -N m −2 h −1 ). Recycling of nitrogen to the water column was consistent across seasons, composed almost exclusively of NH 4 + . These results demonstrate that sediment nitrogen cycling in oyster habitats is dynamic and can change rapidly based on seasonal patterns of productivity. At carrying capacity, the impact of oysters on nitrogen cycling is large and should be considered during efforts to increase oyster populations through aquaculture or reef restoration. KEY WORDS: Oyster · Nitrogen · Denitrification · Benthic−pelagic coupling · Phosphorus · Nitrogen fixation OPEN PEN ACCESS CCESS
Transcript of Seasonal patterns of benthic-pelagic coupling in oyster ...

MARINE ECOLOGY PROGRESS SERIESMar Ecol Prog Ser
Vol. 652: 95–109, 2020https://doi.org/10.3354/meps13490
Published October 15
1. INTRODUCTION
Large oyster populations characterized many estu-aries on the Atlantic Coast of North America prior toEuropean colonization (Nixon 1997, Beck et al. 2011,Zu Ermgassen et al. 2013, Rick et al. 2016). Globally,oyster reefs have declined by approximately 85% oftheir historic extent (Beck et al. 2011), and less than6% of oyster reefs on the Northeastern Coast of theUnited States remain (Zu Ermgassen et al. 2012).Increasingly, there are efforts to restore oyster reefsand develop the oyster aquaculture industry to re -cover both economic and ecological benefits. Suchecological services include provision of habitat for
other marine species, protection from storm surge,and prevention and reduction of the symptoms ofeutrophication (Jackson 2001, Newell et al. 2005,Bernhardt & Leslie 2013). Additionally, oysters playan important role in regulating benthic−pelagic cou-pling processes in coastal ecosystems (Newell et al.2005, Smyth et al. 2013a). Specifically, oysters en -hance rates of organic matter (OM) deposition to thebenthos, thereby increasing dissolved nitrogen (N)and phosphorus (P) recycling in coastal systems(Boucher & Boucher-Rodoni 1988, Dame et al. 1992).Oysters not only enhance elemental cycling rates incoastal systems, but can also change the pathwaysdominating these rates. For example, oysters may
© The authors 2020. Open Access under Creative Commons byAttribution Licence. Use, distribution and reproduction are un -restricted. Authors and original publication must be credited.
Publisher: Inter-Research · www.int-res.com
*Corresponding author: [email protected]
Seasonal patterns of benthic−pelagic coupling inoyster habitats
Nicholas E. Ray1,*, Robinson W. Fulweiler1,2
1Department of Biology, Boston University, Boston, MA 02215, USA2Department of Earth and Environment, Boston University, Boston, MA 02215, USA
ABSTRACT: Oysters enhance benthic−pelagic coupling in coastal systems by moving large quan-tities of suspended particulates to the sediments, stimulating biogeochemical processes. Recentresearch efforts have focused on quantifying the impact of oysters on coastal biogeochemicalcycling, yet there is little consensus on how oysters influence processes across systems. A poten-tial driver of this variance is availability of organic material suspended in the water column andsubsequent loading to sediment by oysters. Here, we measured fluxes of sediment di-nitrogen(N2-N), ammonium (NH4
+), combined nitrate-nitrite (NOx), and phosphate (PO43−) in spring, sum-
mer, and fall at 2 oyster reefs and 1 farm in a temperate estuary (Narragansett Bay, Rhode Island).We then linked these fluxes with patterns of water column primary production. Nitrogen removalfrom the system was highest in spring, when we detected net sediment denitrification (48.8 μmolN2-N m−2 h−1) following a winter−spring diatom bloom. In contrast, we measured sediment N2 fix-ation in fall (−44.8 μmol N2-N m−2 h−1) at rates nearly equivalent to spring denitrification. In thesummer, we measured a nearly net zero sediment N2-N flux (−2.7 μmol N2-N m−2 h−1). Recyclingof nitrogen to the water column was consistent across seasons, composed almost exclusively ofNH4
+. These results demonstrate that sediment nitrogen cycling in oyster habitats is dynamic andcan change rapidly based on seasonal patterns of productivity. At carrying capacity, the impact ofoysters on nitrogen cycling is large and should be considered during efforts to increase oysterpopulations through aquaculture or reef restoration.
KEY WORDS: Oyster · Nitrogen · Denitrification · Benthic−pelagic coupling · Phosphorus · Nitrogen fixation
OPENPEN ACCESSCCESS

Mar Ecol Prog Ser 652: 95–109, 2020
stimulate denitrification, a process that converts bio -available nitrate (NO3
−) and nitrite (NO2−; collec-
tively NOx) into inert di-nitrogen (N2) gas.In coastal systems polluted with anthropogenic N,
denitrification can serve to remove up to 50% of ex -cess N from the system (Seitzinger 1988), and there issubstantial interest in the potential for oyster restora-tion projects and aquaculture to promote denitrifica-tion (Newell et al. 2005). Recent efforts to quantify howrates of sediment denitrification change in the pres-ence of oysters yield conflicting results. Some studiesreport enhanced denitrification in sediments beneathoysters in reef and aquaculture systems (Kellogg et al.2013, Smyth et al. 2015, Humphries et al. 2016, Lun-strum et al. 2018), while others have found no differ-ence (Higgins et al. 2013, Testa et al. 2015, Westbrooket al. 2019). Similarly, there is large variance in theamount by which denitrification is enhanced whenhigher rates are found in oyster habitats, with somestudies reporting enhancement of less than 100 μmolN2-N m−2 h−1 (Hoellein et al. 2015, Lunstrum et al.2018), others several hundred μmol N2-N m−2 h−1
(Humphries et al. 2016, Smyth et al. 2016, Ray et al.2020), and even reports of en hancement over 1000μmol N2-N m−2 h−1 (Kellogg et al. 2013). Perhaps thereason for this disparity is the assumption that oysterswill enhance sediment denitrification similarly regard-less of the properties of the system they are in (e.g. dis-solved nutrient concentrations, temperature, turbidity,etc.). Another reason for this disparity could rest in thecomplexity of the N cycle.
Coastal sediment N cycling is dynamic, with multi-ple, often competing, processes co-occurring (Ful-weiler et al. 2013, Kuypers et al. 2018, Foster & Ful-weiler 2019, Ray et al. 2020). For example, coastalsediments can rapidly (days to months) switch fromN2 fixation — which introduces new N to the sys-tem — to denitrification following the addition oflabile OM (Fulweiler et al. 2007, 2008, 2013). As thisOM is used up and only recalcitrant OM remains, netN2 fluxes decline (Fulweiler et al. 2013) and maybecome negative as N2 fixation proceeds more rap-idly than denitrification (Fulweiler et al. 2008). Inhighly productive systems and/or seasons, we antici-pate that denitrification will be promoted in oysterhabitats as oysters move labile OM to the sedimentsbelow in biodeposits consisting of both feces andpseudofeces. In less productive systems and/or sea-sons, oysters may be more likely to consume anddigest any suspended particles that are processedduring filter-feeding, yielding fewer biodeposits,thus reducing OM loading to the sediments beneath,favoring N2 fixation. We hypothesize that net sedi-
ment N2 fluxes in oyster habitats track primary pro-duction in the water column, with net denitrificationfollowing large blooms, followed by a rapid switch toN2 fixation when productivity and availability oflabile OM added to the sediments via oyster biode-posits declines (Burgin & Hamilton 2007, Fulweiler etal. 2013, Hardison et al. 2015).
Sediment O2 consumption and phosphate (PO43−)
release can be enhanced in oyster habitats (Mazouniet al. 1996, Kellogg et al. 2013) and are also likely tofollow patterns of water column productivity. GreaterOM loading to sediments can drive aerobic de -composition, reducing O2 concentrations and leadingto PO4
3− release (Ingall & Jahnke 1994, Foster & Fulweiler 2019). Thus, we expect greater O2 con-sumption and PO4
3− release immediately followingblooms.
Quantifying seasonal patterns of benthic−pelagiccoupling in oyster habitats will help us understandbiogeochemical cycling in coastal systems prior toover-exploitation of oyster populations and allow forsmart decision making as oyster populations are en -hanced through restoration and development ofaquaculture. Here, we took advantage of seasonalpatterns of primary production in Narragansett Bayto investigate how these patterns regulate sedimentbiogeochemical processes in oyster habitats. We as-sessed whether seasonal patterns of sediment bio-geochemical processes followed bay-wide patterns ofprimary production. We further tested whether themagnitude of these biogeochemical processes couldbe predicted by water column and sediment chloro-phyll a (chl a) and pheophytin (pheo) concentrations,where chl a indicates the relative abundance of livephytoplankton, and pheo indicates the relative abun-dance of degraded chl a (Yentsch & Menzel 1963), in-dicative of dead or dying phytoplankton. To accom-plish this goal, we collected sediment and watercolumn chl a and pheo samples to compare with along-term weekly data set of sur face pigment con-centrations (The Narragansett Bay Long-Term Plank-ton Time Series, https:// web. uri. edu/ gso/ research/plankton/), and incubated sediment cores to quantifyrates of sediment O2 consumption, and N and PO4
3−
fluxes across the sediment−water interface.
2. MATERIALS AND METHODS
2.1. Site description and sampling scheme
Narragansett Bay is a shallow (mean depth: 8.6 m)temperate estuary. The Bay runs from north to south
96

Ray & Fulweiler: Seasonal benthic−pelagic coupling
and drains to Rhode Island Sound. The ProvidenceRiver in the north is the main freshwater source, butdaily freshwater inflow is low (annual mean: 100 m3
s−1; Pilson 1985). The average water retention time isapproximately 26 d (Pilson 1985). Concentrations ofdissolved N and P are typically highest near points offreshwater inflow and decrease along a north tosouth gradient (Smayda & Borkman 2008). Weeklymeasurements of water column chl a and pheo havebeen collected at 41.567° N, 71.384° W since the1950s, and data collected since 1999 is availableonline as part of The Narragansett Bay Long-TermPlankton Time Series (hereafter Plankton TimeSeries). Phytoplankton blooms in the Bay tend to besynchronous bay-wide events, regardless of the pointof initiation (Smayda & Borkman 2008). Primary pro-duction in the system has historically been character-ized by large winter−spring blooms, but the period ofpeak bloom has become more variable over the last50 yr (Nixon et al. 2009).
Like other coastal systems near large human popu-lations, Narragansett Bay has experienced signifi-cant change over the past 400 yr. Prior to Europeancolonization, oysters covered a large portion of theBay. Following over-harvest and mortality associatedwith disease, pollution, and siltation, less than 1% ofnatural populations remained at the start of the 21st
century (Zu Ermgassen et al. 2012, Schumann 2015).Modeling estimates suggest the Bay could currentlysustain 625 times more oysters before reaching eco-logical carrying capacity (Byron et al. 2011). Morerecently, there have been efforts to increase oysterpopulations within Narragansett Bay through resto-ration and the expansion of the oysteraquaculture industry (Beutel 2017).Between 2011 and 2016, sales of cul-tured oysters raised in the state ofRhode Island (which includes Narra-gansett Bay and several smallercoastal lagoons that are at or near thelegal limit for aquaculture develop-ment) have increased by 92% (Beutel2017). Beginning in 2006, wastewatertreatment plants in the watershedsthat drain to Narragansett Bay imple-mented ad vanced N removal tech-nologies. By 2012, the N load was 50%less than in 2006, and in 2016 the totalN load was 66% less than in 2006(Narragansett Bay Estuary Program2017, Oczkowski et al. 2018). Duringthis same time frame, NarragansettBay has also shown symptoms of a
system responding to a changing global climate (Fulweiler et al. 2007, Fulweiler & Nixon 2009, Nixonet al. 2009), with a reduced magnitude of the winter−spring diatom bloom, which has only occa-sionally occurred in recent years. Warmer winters inthe region are the main driver of a reduced winter−spring bloom, as warm winters appear to enhancerates of grazing on phytoplankton, increase the num-ber of cloudy days which subsequently reduces theamount of light available for photosynthesis, andmake the water column more stable, leading to lessmixing and nutrient availability in the upper portionof the water column (Nixon et al. 2009, Fulweiler etal. 2013, Fulweiler & Heiss 2014).
We collected sediment and water column samplesfrom 3 oyster habitats in Narragansett Bay betweenJuly 2016 and October 2017 (Fig. 1). Two samplingsites were on the western side of the bay. Allen Har-bor is an oyster farm located directly on the mainchannel of the Bay that employs the rack and bagmethod of culture, where oysters are suspended inmesh bags approximately 30 cm from the sedimentsurface. Bissel Cove is a small embayment that con-tains both natural and restored oyster reefs, with res-toration taking place within the 5 yr prior to our sampling. The third site, Town Pond, is located in thenortheastern portion of Narragansett Bay in Mt.Hope Bay. The embayment contains several smallrestored oyster reefs which were constructed be -tween 2008 and 2014. The embayment is surroundedby saltmarsh and is in close proximity to a golfcourse. At both reef sites, oysters were in direct contact with the sediments.
97
Fig. 1. Sampling sites in Narragansett Bay, Rhode Island, USA. Inset: Narra-gansett Bay (red box); star on the larger map: location of the Narragansett Bay
Long-Term Plankton Time Series

Mar Ecol Prog Ser 652: 95–109, 2020
2.2. Water column chl a sample collection and analysis
We collected water column chl a and pheo samplesmonthly at each site during spring (April, May), sum-mer (June, July, August), and fall (September, Octo-ber). Each month between July 2016 and October2017, we collected samples every 20 min over a 3 hperiod, and once a season, we collected samplesevery hour for 8 h. During each sampling event, wecollected duplicate samples by filtering site waterthrough GF/F (0.7 μm) filters, which were stored in acooler on ice until return to the lab where they werestored at −80°C until analysis. Samples were ex -tracted in 10 ml of 90% acetone and kept at 4°Cfor 24 h until fluorometric analysis (Arar & Collins1997). Immediately following fluorometric analysis,we added 25 μl of 0.30 HCl to each sample and thenwaited 3 min before repeating the analysis in order toestimate pheo concentration (Arar & Collins 1997).
2.3. Sediment collection and flux measurement
We hand-collected triplicate sediment cores fromeach site in summer (August) and fall (October) 2016,and spring (April) and summer (July) 2017 usingclear PVC tubes that were 28 cm in length and had across sectional area of 0.00785 m2. Approximately12 cm of sediment was collected. Cores were col-lected from patches within the reef where no oysterswere present (Bissel Cove and Town Pond) and fromdirectly beneath oyster cages (Allen Harbor). Sedi-ments in Bissel Cove and Town pond were silty andmucky and made up of fine particles, while sedi-ments at Allen Harbor were made up of fine sandand silt. Immediately after collection, we added sitewater to the top of each core before capping them,placing them in a cooler, and transporting them tothe laboratory for incubations and analysis. We alsocollected unfiltered site water in 20 l acid-washedcarboys for use during the incubations. Upon returnto the lab, we moved the cores into a water bath in anenvironmental chamber, both maintained at the insitu temperature of the field site. We removed thecaps and gently bubbled the cores overnight. Prior tobeginning incubations the next day, we siphoned offthe water overlaying the sediments in each core andreplaced it with water from the carboys. We alsofilled an empty core with unfiltered site water to beincubated alongside the sediment cores to accountfor any fluxes occurring in the water column. In caseswhere there was a flux in the water control core, we
subtracted this flux equally from the fluxes measuredin the sediment cores. This adjustment was made for14 of 42 cores for N2-N fluxes, 30 of 42 cores for O2
flux, and for all cores for ammonium (NH4+), NOx,
and PO43− fluxes.
Immediately prior to capping each core and begin-ning incubations, we measured salinity using a con-ductivity probe (CDC401; Hach) and dissolved oxy-gen (DO) using an optical sensor (LDO101; Hach).We then removed 30 ml of water using an acid-washed plastic syringe and filtered this samplethrough a Whatman GF/F filter (0.7 μm) into an acid-washed polyethylene bottle, which was immediatelyfrozen until later analysis for dissolved inorganic N(DIN) and PO4
3−. Each core was then capped with aclear acrylic lid equipped with a magnetic stir bar tokeep water overlying the sediments gently mixed(40 rpm), an inflow port connected to one of the site-water carboys, and an outflow port for sample collec-tion (Ray et al. 2019a).
We collected duplicate water samples for analysisof N2-N and O2 concentration at 5 time points, whichwere spaced to allow DO in each core (except thesite-water control) to drop at least 2.0 mg l−1 over thecourse of the incubation without becoming hypoxic(concentration below 2.0 mg l−1) (Foster & Fulweiler2014, Ray et al. 2019b). Incubations typically lasted5−10 h, with each sample collected 1−2 h apart. Ateach sample collection point, we filled 12 ml glassLabco exetainers (n = 2) from the bottom, allowingthe exetainers to overflow 3 times the full volume.We then added 25 μl of saturated zinc chloride solu-tion to each in order to stop any biological activityand preserve the sample, then capped them with gastight cap septa. As samples were collected, both theinflow and outflow ports to the core were opened sothat site-water from the carboy could replace the volume of water collected in the sample. Followingthe last time point, we removed the core lid andagain collected samples for DIN and PO4
3− analysis.Total water replacement in each core over the
course of the incubation was less than 15%. Lightsremained off for the duration of the incubations,except for short periods to collect samples, check DOlevels in the cores, and to check for bubble forma-tion. We recorded a positive DO flux from one corecollected from Town Pond in summer 2017, indica-ting there was a leak allowing for gas exchange withthe incubation chamber. We excluded all fluxes fromthis core from our analyses.
The day after the incubation, we siphoned thewater from each core in order to collect samples foranalysis of sediment properties. Using an acid-
98

Ray & Fulweiler: Seasonal benthic−pelagic coupling
washed 60 ml plastic syringe with the tip cut off, wecollected the top cm of sediment and stored thesesamples in acid-washed centrifuge tubes at −20°Cuntil analysis for porosity, density, % OM, and C:N.We repeated this process using a deionized water(DI)-rinsed syringe and DI-rinsed centrifuge tubes tocollect samples for analysis of sediment chl a andpheo content. These samples were stored at −80°Cuntil analysis.
2.4. Sample analysis and sediment flux calculation
We quantified sediment porosity and bulk densityusing standard methods (Nielsen et al. 2000). Sedi-ment OM was measured as the percent of mass loston ignition at 500°C, and sediment total C and N andC:N were quantified using a Micro Vario ElementalAnalyzer (Elementar Americas). We quantified sedi-ment chl a concentration by extracting a known massof sediment in 92% acetone, then sonicated the sam-ple for 30 s and stored it at 4°C for 24 h until fluoro-metric analysis (Arar & Collins 1997, Fagherazzi et al.2014). Sediment pheo was estimated by adding 25 μlof 0.300 HCl to the sample immediately following flu-orometric analysis, waiting 3 min, and then repeatingthe fluorometric analysis.
We quantified net N2-N and O2 fluxes using aquadrupole membrane inlet mass spectrometer (MIMS;Bay Instruments) following the N2:Ar method (Kana etal. 1994). N2-N concentrations in each sample werecalculated by multiplying the sample N2:Ar ratio de-termined by the MIMS by the theoretical Ar concen-tration in the sample given its temperature andsalinity (Weiss 1970, Colt 1984). We estimated sampleO2 concentrations in the same way, but instead usedO2:Ar determined by the MIMS.
DIN and dissolved inorganic P (DIP) samples wereanalyzed using high-resolution digital colorimetry(Seal Autoanalyzer 3; SEAL Analytical). Minimumdetection limits during sample analysis were 0.80 μMfor NH4
+, 0.013 μM for NOx, and 0.010 μM for PO43−.
We estimated fluxes of N2-N and O2 using a linearregression of gas concentration over time (h). Whenthe regression calculation R2 ≥ 0.65 and p ≤ 0.10, wemultiplied the slope of the regression line by the corevolume, and then divided by the core cross sectionalarea to estimate the flux in μmol m−2 h−1. If R2 ≤ 0.65or p ≥ 0.10, the flux was assigned a value of zero(Prairie 1996, Foster & Fulweiler 2016). For DIN andDIP, we calculated the flux as the difference betweenthe concentrations in the initial and final samples,scaled by the core volume.
2.5. Statistical analysis and data availability
We conducted all statistical analyses and made allfigures using R statistical software version 3.6.1 (RCore Team 2014) and the ‘lme4’ (Bates et al. 2015),‘fitdistrplus’ (Delignette-Muller & Dutang 2015),‘emmeans’ (Lenth 2018), ‘ggplot2’ (Wickham 2016),‘dplyr’ (Wickham et al. 2019), and ‘plyr’ packages(Wickham 2011). The map of site locations was madeusing the ‘ggspatial’ (Dunnington 2018) and ‘sf’ (Pe -besma 2018) packages and the NOAA Medium Res-olution Shoreline shapefile (https:// shoreline. noaa.gov/ data/ datasheets/ medres. html). We consideredthe results of all statistical tests to be significantwhen p ≤ 0.05, and report all rates and concentra-tions as the mean ± SE. In addition to performinganalyses on fluxes of individual compounds, we alsoanalyzed the sum of all measured N fluxes (ΣN),which we calculated by adding the N2-N, NH4
+-N,and NOx-N fluxes measured for an individual core.Finally, we considered each sediment core and thefluxes and properties associated with that core to beindependent samples when assessing predictivevariables and relationships between sediment prop-erties and fluxes.
We tested whether chl a and pheo concentrationsin our hand-collected samples could be predicted byvalues reported in the Plankton Time Series using alinear regression approach. First, we calculated themean daily value for chl a and pheo for each sam-pling date. Next, we matched those values with val-ues from the nearest date in the Plankton TimeSeries. If our hand sampling fell directly between 2time series dates, we used the average of the 2 valuesin the time series. To test for correlation betweensediment chemical properties, we used Pearson cor-relations.
To compare fluxes between seasons, we used amixed model approach (Zuur et al. 2009). To begin,we determined whether our measured ΣN, N2, NH4
+,NOx, PO4
3−, and O2 fluxes best fit normal, log normal,or gamma distributions using the ‘fitdistrplus’ pack-age. We found that N2-N, NH4
+, and PO43− fluxes
were best described by normal distributions, ΣN andO2 fluxes best fit gamma distributions, and NOx
fluxes were log normal. In order to best meet theassumptions of mixed models, we shifted the ΣN databy adding one plus the lowest flux value to everyflux, and multiplied the O2 fluxes by −1, so that allflux values were positive. For the NOx fluxes, weshifted the data so all values were positive in thesame way as for the ΣN data before performing asquare root transformation. We then compared flux -
99

Mar Ecol Prog Ser 652: 95–109, 2020100
es between seasons by creating generalized linearmixed models (GLMMs), using season as a fixedeffect and sampling site as a random effect, thenused least square means tests to conduct pairwisecomparisons.
To investigate whether water column and sedimentchl a and pheo concentrations could predict sedimentfluxes, we used a linear regression approach. For thewater column regressions, we used the reportedwater column chl a, pheo, or sum of chl a and pheoconcentrations from the Plankton Time Series theweek before the sediment incubation, the mean fromthe previous month, and the mean from the previous3 mo as the independent variable, and the mean fluxfor a given analyte from that incubation as thedependent variable. We considered the best modelfor each flux to be the one with the highest R2 value.For the sediment regressions, we used the chl a andpheo concentrations as quantified from samples col-lected immediately following incubations, and thoseconcentrations specific to each individual sedimentcore.
All sediment flux data and associated sediment prop -erties are accessible through the Figshare re pository(https:// doi. org/ 10. 6084/ m9. figshare. 12059499). TheNarragansett Bay Long-Term Plankton Time Seriesdata is accessible online at https:// web. uri. edu/ gso/research/ plankton/.
3. RESULTS
3.1. Seasonal water column and sediment properties
Dissolved NH4+ and NOx concentrations were re -
latively low year round, with the highest concentra-tions in the spring, specifically at Town Pond (Table S1in the Supplement at www. int-res. com/ articles/ suppl/m652 p095 _ supp. pdf). Water column chl a concentra-tions followed the classic temperate pattern of a win-ter−spring bloom with chl a peaks in January andFebruary and a secondary bloom in July and Augustin 2016 and 2017 (Fig. 2).
While the concentrations of hand-collected chl asamples at each site tended to follow those recordedas part of the long-term time series (Fig. 2), we onlyfound one statistically significant linear relation-ship between the pigment concentration of hand- collected samples relative to concentrations reportedin the long-term time series (Table 1).
Sediment density and porosity were similar acrossseasons (Table S2). Across all sites, the amount of
OM was highest in spring (3.97 ± 1.00% OM), fol-lowed by fall (3.65 ± 1.22% OM), and lowest duringsummer sampling (2.74 ± 0.57% OM; Table S2). The
Fig. 2. Seasonal patterns of water column chl a (solid greenline) and pheophytin (dashed brown line) in NarragansettBay. Solid green circles and open brown circles: hand- sampled concentrations; vertical dashed lines: sediment corecollection; x-axis dates reported as yr-mo-d. Data from theNarragansett Bay Long-Term Phytoplankton Time Series
(https://web.uri.edu/gso/research/plankton/)
Site Chl a Pheophytin
Allen Harbor R2 = 0.06 R2 = 0.00p = 0.22 p = 0.70
Bissel Cove R2 = 0.00 R2 = 0.00p = 0.46 p = 0.42
Town Pond R2 = 0.16 R2 = 0.33p = 0.14 p = 0.05
Table 1. Results of linear regressions comparing hand-collectedconcentrations of chl a and pheophytin to concentrationsmeasured as part of the Narragansett Bay Long-Term Plank-ton Time Series. Bolded values indicate a statistically signi-
ficant relationship (p ≤ 0.05)

Ray & Fulweiler: Seasonal benthic−pelagic coupling
C:N ratio in sediments tended to increase across seasons, and was lowest in spring (19.1 ± 3.9 mol/mol), increased during summer (25.4 ± 2.3 mol/mol),and was highest during fall (33.3 ± 7.8 mol/mol;Table S2). Sediment chl a concentrations followedthe same pattern as sediment C:N, decreasing fromspring to fall (spring: 3857.9 ± 642.6 μg chl a m−2,summer: 2828.1 ± 585.4 μg chl a m−2, fall: 2367.9 ±562.4 μg chl a m−2; Table S2). Sediment pheo pat-terns were similar, with highest concentrations inspring (5650.7 ± 1202.9 μg pheo m−2), a marked dropin summer (2781.1 ± 559.1 μg pheo m−2), and then aslight increase in fall (3770.4 ± 1007.5 μg pheo m−2;Table S2).
Many sediment properties were significantly cor-related with one another (Table 2). Pheo content insediments was significantly related to the totalamount of OM, % C, % N, and C:N. We found no sig-nificant relationships between chl a and any othersediment property.
3.2. Seasonal patterns of sediment biogeochemicalprocesses in oyster habitats
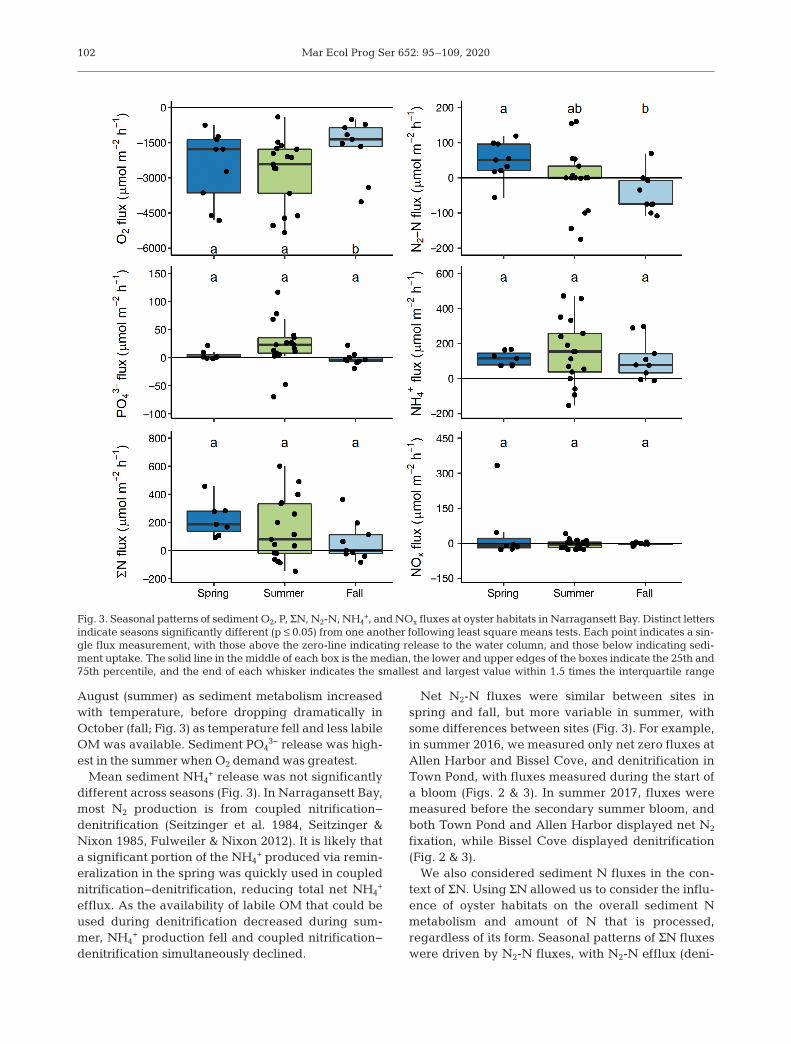
Sediment O2 consumption was significantly higherin spring (−2518.6 ± 502.3 μmol m−2 h−1) and summer(−2738.8 ± 344.3 μmol m−2 h−1) than in fall (−1683.8 ±406.9 μmol m−2 h−1; Fig. 3). PO4
3− regeneration washighest in summer (21.8 ± 10.4 μmol m−2 h−1), thoughrates were not statistically different from spring(4.3 ± 2.8 μmol m−2 h−1) or fall, when sediments werea net PO4
3− sink (−2.4 ± 3.8 μmol m−2 h−1; Fig. 3).
Sediment N2-N fluxes varied across seasons, withnet denitrification during spring (48.8 ± 17.8 μmolm−2 h−1), a near zero net flux in summer (−2.7 ±21.6 μmol m−2 h−1), and net N2 fixation in fall nearlyequivalent to the magnitude of denitrification inspring (−44.8 ± 19.1 μmol m−2 h−1; Fig. 3). Spring N2-N fluxes were significantly different from those in fall(p = 0.028), but not summer (p = 0.219). Fall N2-Nfluxes were also not statistically different from sum-mer fluxes (p = 0.352). Sediments were a net sourceof NH4
+ to the water column, with little seasonal vari-ation (Fig. 3). NOx fluxes were small, and also did notdiffer seasonally (Fig. 3). ΣN fluxes followed the pat-tern of net N2-N fluxes, with highest fluxes in spring(223.4 ± 42.3 μmol m−2 h−1), then summer (145.0 ±54.1 μmol m−2 h−1), and the lowest in fall (63.6 ±47.2 μmol m−2 h−1), though there were no statisticaldifferences between seasons (Fig. 3).
3.3. Chl a and pheo concentrations as predictors ofbiogeochemical processes in oyster habitats
There were few statistically significant relation-ships between mean water column chl a and pheoconcentrations and sediment fluxes (Table S3). Therewere no significant relationships between mean chl aand pheo concentration and sediment O2, PO4
3−,N2-N, or NOx fluxes. However, ΣN fluxes could bepredicted by the mean water column pheo concen-tration from the previous month (p = 0.01, R2 = 0.51),with lower ΣN fluxes at high pheo concentrations.Sediment NH4
+ fluxes were best predicted by themean of the sum of chl a and pheo from the previousmonth (p = 0.04, R2 = 0.30), again with high concen-trations associated with lower NH4
+ fluxes.Sediment chl a and % OM were not significant pre-
dictors of any fluxes (Table S4). However, sedimentpheo concentration was significantly related to sedi-ment ΣN (p = 0.03, R2 = 0.12) and N2-N (p < 0.01, R2 =0.21) fluxes, but not NH4
+ or NOx (Fig. 4, Table S4).
4. DISCUSSION
4.1. Seasonal patterns of benthic−pelagic couplingin oyster habitats
Sediment biogeochemical processes in oyster habi-tats followed seasonal patterns of water column pro-ductivity, with highest ΣN fluxes in April (spring;Fig. 3). O2 fluxes were high in April (spring) whensediment OM was high, then stayed high in July and
101
Chl a Pheo % OM % C % N C:N
Chl a 1.00 0.25 −0.25 −0.33 −0.25 0.11(0.16) (0.20) (0.07) (0.18) (0.56)
Pheo 1.00 0.60 0.50 0.64 −0.46 (<0.01) (0.01) (<0.01) (0.01)
% OM 1.00 0.91 0.95 −0.55 (<0.01) (<0.01) (<0.01)
% C 1.00 0.84 −0.42 (<0.01) (0.02)
% N 1.00 −0.66 (<0.01)
C:N 1.00
Table 2. Pearson correlations between sediment propertiesassociated with benthic−pelagic coupling. For each pair ofnumbers, the top value represents the R-value, and the valuein parentheses is the p-value. Significant relationships areindicated in bold, except 1:1 correlations. Pheo: pheophytin;
OM: organic matter
Mar Ecol Prog Ser 652: 95–109, 2020
August (summer) as sediment metabolism increasedwith temperature, before dropping dramatically inOctober (fall; Fig. 3) as temperature fell and less labileOM was available. Sediment PO4
3− release was high-est in the summer when O2 demand was greatest.
Mean sediment NH4+ release was not significantly
different across seasons (Fig. 3). In Narragansett Bay,most N2 production is from coupled nitrification−denitrification (Seitzinger et al. 1984, Seitzinger &Nixon 1985, Fulweiler & Nixon 2012). It is likely thata significant portion of the NH4
+ produced via remin-eralization in the spring was quickly used in couplednitrification−denitrification, reducing total net NH4
+
efflux. As the availability of labile OM that could beused during denitrification decreased during sum-mer, NH4
+ production fell and coupled nitrification−denitrification simultaneously declined.
Net N2-N fluxes were similar between sites inspring and fall, but more variable in summer, withsome differences between sites (Fig. 3). For example,in summer 2016, we measured only net zero fluxes atAllen Harbor and Bissel Cove, and denitrification inTown Pond, with fluxes measured during the start ofa bloom (Figs. 2 & 3). In summer 2017, fluxes weremeasured before the secondary summer bloom, andboth Town Pond and Allen Harbor displayed net N2
fixation, while Bissel Cove displayed denitrification(Fig. 2 & 3).
We also considered sediment N fluxes in the con-text of ΣN. Using ΣN allowed us to consider the influ-ence of oyster habitats on the overall sediment Nmetabolism and amount of N that is processed,regardless of its form. Seasonal patterns of ΣN fluxeswere driven by N2-N fluxes, with N2-N efflux (deni-
102
Fig. 3. Seasonal patterns of sediment O2, P, ΣN, N2-N, NH4+, and NOx fluxes at oyster habitats in Narragansett Bay. Distinct letters
indicate seasons significantly different (p ≤ 0.05) from one another following least square means tests. Each point indicates a sin-gle flux measurement, with those above the zero-line indicating release to the water column, and those below indicating sedi-ment uptake. The solid line in the middle of each box is the median, the lower and upper edges of the boxes indicate the 25th and75th percentile, and the end of each whisker indicates the smallest and largest value within 1.5 times the interquartile range

trification) in the spring, a net zero N2-N flux in thesummer, and N2-N consumption (N2 fixation) in thefall (Fig. 3). As we hypothesized, denitrification washighest in the spring following biodeposition after (orfrom) the winter−spring bloom. We found that sedi-ment pheo concentration was a significant predictorof net N2-N fluxes, with higher N2-N release atgreater pheo concentrations (Fig. 4). Denitrificationtended to be high when labile OM was available, asin the spring following high biodeposition duringthe winter−spring diatom bloom. As the labile OMin sediments is consumed, leaving behind recalci-trant OM, denitrification slows and N2 fixationshould dominate. Supporting this idea, Fulweiler etal. (2008) observed a ‘N2 fixation threshold’ in Narra-gansett Bay, where sediments switched to N2 fixationwhen OM deposition fell below 0.3 g C m−2 d−1. Wedid not measure rates of C deposition, but calculatedan estimate. Riemann et al. (1989) estimated a g C:g chl a ratio of between 27 and 67 for mixedphytoplankton communities with various growthrates. Using this ratio, we can estimate summertimewater column C the month before sampling as 244.6−607.2 μg C l−1 in summer 2016 and 184.7−458.3 μg Cl−1 in summer 2017. Using an oyster filtration maxi-mum of 0.17 m3 g dry weight [DW]–1 d−1 (Ehrich &
Harris 2015), and an oyster density of 5.93 g DW m−2
(Byron et al. 2011), we can estimate that approxi-mately 1.01 m3 d−1 of water are filtered per every m2
of oyster habitat. If the oysters consumed no C in thatwater, moving all of it instead to the sediments (anunlikely scenario), C loading to sediments wasapproximately 0.25−0.61 g C m−2 d−1 in 2016 and0.19−0.46 g C m−2 d−1 in 2017. In both cases, thelower end estimate of the C:chl a conversion is belowthe N2 fixation threshold of 0.3 g C m−2 d−1 beforeeven including oyster metabolic C re quirements.Newell (1988) estimated that oysters have a summer-time metabolic requirement of 17.3 mg C g DW–1 d−1.If there are 5.93 g DW m−2, this equates to 0.1 g C m−2
d−1, further reducing the summertime sediment Cload. We recorded both net denitrification and net N2
fixation during our summer measurements, reflectiveof the high and low ends of our sediment C loadingestimates, and capturing natural variation aroundthis important threshold.
We expected to record denitrification in the fall following the secondary summer bloom, but weresurprised to measure such strong N2 fixation, espe-cially considering our flux measurements were madewithin a few weeks of the bloom (Figs. 2 & 3). Thereare a few ways this pattern may be explained in a
Ray & Fulweiler: Seasonal benthic−pelagic coupling 103
Fig. 4. Relationship between sediment pheophytin concentration (top 0−1 cm) and fluxes of nitrogen compounds between thesediment and water column. R2 values indicate the result of linear regressions. Each point represents an individual measure-ment, with values above zero indicating release from the sediment to the water column, and points below indicating sediment
uptake. Shaded region around the best fit line: 95% CI

Mar Ecol Prog Ser 652: 95–109, 2020
biogeochemical context, taking seasonal patterns ofsediment physical−chemical properties and oystermetabolism into account. Despite a similar % OMcontent in spring and fall measurements, sedimentC:N ratio was lowest in spring and highest in fall,indicating that OM added to sediments in spring wasmore labile than in fall. This could be driven by dif-ferences in the phytoplankton community and poten-tial OM quality, or high rates of microbial activity insummer decomposing OM more efficiently and leav-ing behind only recalcitrant OM.
4.2. Water column pigments do not predict sediment fluxes in oyster habitats
Decades of data collection in Narragansett Bayshow a tight coupling between mean summer chl aand sediment N2-N flux (e.g. Fulweiler & Heiss2014), and we were surprised not to record similarpatterns here (Table S4). Fulweiler & Heiss (2014)found a strong predictive relationship (p < 0.01, R2 =0.87) between summer water column chl a concen-tration and sediment N2-N fluxes in the main stem ofNarragansett Bay. Using their predictive equation(net N2-N flux = 18.3 × chl a concentration − 33.4), weshould have measured a net N2-N flux of 114.5 μmolm−2 h−1 in summer 2016 but instead recorded a rateabout a quarter of this (35.05 μmol m−2 h−1). In sum-mer 2017, the predicted flux was 125.81 μmol m−2
h−1, but we measured net N2 fixation (−60.28 μmolm−2 h−1). There are several factors that may explainthe difference in the patterns found here comparedto the literature. First, our hand-collected water col-umn pigment concentrations did not closely matchwith those of the long-term Plankton Time Seriesused by Fulweiler & Heiss (2014). Second, oystersmay have consumed significant portions of the chl aand pheo from water column particulates beforemoving biodeposits to the sediment in the summerand fall, changing the loading or quality of depositedOM as described previously. Third, it is possible thatthe dominant phytoplankton species varied acrossseasons, and oysters selectively ingested or rejectedparticulates of different quality OM. Finally, ourmeasurements were made in shallow water (1−2 m),and those from Fulweiler & Heiss (2014) were madeat depth (~7 m) in the main stem of the Bay.
Our measurements of water column chl a and pheofrom embayments did not match those from the Nar-ragansett Bay Time Series, which is collected in themain stem of the Bay. At all of our sampling sites, it islikely that consumption of phytoplankton by oysters
played a role in this difference. On almost everyhand-sampling event, the concentration of hand- collected samples was lower than time series values(Fig. 2). Two of our sampling sites (Bissel Cove andTown Pond) are connected to the main stem of theBay by small channels, so any phytoplankton thatentered the embayment on a rising tide was likelyquickly consumed and was depleted by the time thetide fell. At the third site (Allen Harbor), a series ofoyster cages separated the main stem of the Bay fromour chl a collection site, and it is possible these oys-ters consumed phytoplankton from the water columnbefore it reached our sampling site, reducing chl aand pheo concentrations. Regardless, using the timeseries provides an overview of seasonal patterns ofphytoplankton abundance and can still be used tohelp us understand seasonal dynamics of benthic−pelagic coupling in oyster habitats within the system.
Our measurements of % OM addresses the totalamount of OM available in sediments. It is likely thatas phytoplankton and detritus pass through the oys-ter digestive tract, the most labile OM is digestedfirst, leaving behind recalcitrant OM. In fact, there isrelatively high revival capacity for diatoms that havepassed through an oyster (Barille & Cognie 2000). Asdescribed in the previous section, sediment C load-ing was near the N2 fixation threshold, and denitrifi-cation requires labile OM, while N2 fixation can pro-ceed with more recalcitrant OM. If oysters removethe labile portion of food particles and deposit therecalcitrant portion, N2 fixation may likely still domi-nate, even if C loading is above the N2 fixationthreshold. Finally, variations in the phytoplanktoncommunity, and the associated OM quality, oysterdigestive preferences, and sediment loading mayalso vary seasonally.
4.3. Comparison with studies in other coastal systems
The N2-N flux rates we measured in summer(−2.7 μmol N2-N m−2 h−1) are much lower than summertime rates measured beneath aquaculture(553.6 μmol N2-N m−2 h−1; Ray et al. 2020) in nearbyNinigret Pond (<50 km distance), and lower thannearly all other studies that report N2-N fluxes in oys-ter habitats. Our measured rates of denitrification inspring (48.8 μmol N2-N m−2 h−1), however, are withinthe range reported in other studies (Higgins et al.2013, Hoellein et al. 2015, Onorevole et al. 2018,Smyth et al. 2018). The high rate of N2 fixation wefound in fall (−44.8 μmol N2-N m−2 h−1) is the highest
104

Ray & Fulweiler: Seasonal benthic−pelagic coupling
mean N2 fixation rate ever reported for oyster habi-tats. We are not the first to report N2 fixation in oysterhabitats (Mortazavi et al. 2015, Humphries et al.2016), but are the first to find it consistently.
The majority of studies measuring net sediment N2
fluxes in oyster habitats have been conducted in afew coastal systems on the Atlantic Coast of the USA.Many take place in the summer alone, and often for 1or 2 yr. This limited temporal sampling may drive thelarge variance in reported rates of denitrification inthese studies, due to seasonal and annual patterns ofOM availability in the water column. We can com-pare the work conducted here with seasonallyreported rates from the Chesapeake Bay and BogueSound — 2 systems with multiple studies that reportseasonal rates of sediment denitrification in oysterhabitats.
Kellogg et al. (2013) found sediment denitrificationin restored oyster reefs in the Choptank River tribu-tary of the Chesapeake Bay increased from April toJune, peaked in August, and was lowest in Novem-ber. Denitrification measurements were also taken atan oyster farm located several km nearer the rivermouth 1 yr later, with peak denitrification in June,and a decline in August (Testa et al. 2015). There is along-term water quality monitoring site (ChesapeakeBay Program Water Quality Data, Tidal Water Qual-ity Monitoring Program station ET5.2; http:// data.chesapeakebay. net/ WaterQuality) between the 2sites that records monthly chl a concentrations thatwe can use to roughly estimate peak chl a and deter-mine if denitrification traces this pattern at thesesites. For both locations, the highest denitrificationmeasurements appear to follow the peak in annualsurface chl a concentration. At the restored reef in2010, both the chl a and denitrification peaks were inAugust, and at the oyster farm in 2011, peak denitri-fication was recorded 2 mo after the chl a peak inApril. It appears that, similarly to Narragansett Bay,denitrification in these 2 oyster habitats tended totrack water column productivity. The water columnchl a concentrations in the Choptank River tributarywere often more than twice as high as those in ourstudy, which may explain why sediments werealways net denitrifiers.
In Bogue Sound, 2 studies found that sedimentdenitrification in oyster habitats is lowest in winterand increases in spring to a summer peak beforedeclining in fall (Piehler & Smyth 2011, Smyth et al.2013b). However, a more recent study demonstratedthis pattern does not hold across sites in the estuary(Onorevole et al. 2018). We could not locate anynearby water quality monitoring station data to com-
pare with these studies, but chl a concentrations innearby watersheds vary throughout the year andtend to be highest following peaks in monthly rainfall(Mallin et al. 1991). Taken together, it appears thatacross systems, rates of sediment denitrification inoyster habitats likely track water column productiv-ity, if it is high enough to outpace oyster demand.
4.4. Ecological carrying capacity and oyster- mediated sediment nitrogen cycling
The long-term studies on Narragansett Bay’s pastand present N loading, alongside estimates of oysterpopulations at carrying capacity and past populationsizes, present an opportunity to calculate the im -portance of oysters in the N cycle of NarragansettBay under different oyster population and N loadingscenarios. While the values we use here are specificto Narragansett Bay, the conclusions we make can beextrapolated to other coastal systems.
In Narragansett Bay, less than 1% of the historicoyster population remains (Zu Ermgassen et al.2012), but there are efforts to reverse this trendthrough development of aquaculture and reef resto-ration. A recent model estimate suggests that oysterpopulations in Narragansett Bay could be 625 timeslarger than the 2010 population before the systemreaches ecological carrying capacity (Byron et al.2011). This estimate raises at least 2 important ques-tions in the context of nutrient cycling: How will theBay-wide N budget change if oyster populationsincrease 625 times? How did the N budget for Narra-gansett Bay look before the arrival of colonists andover-exploitation of oyster populations? Further, theinfluence of oyster biodeposition and oyster-drivenchanges in sediment denitrification and N2 fixationmay influence ecological carrying capacity and werenot included in the model.
Using the values presented in Byron et al. (2011),Narragansett Bay at ecological carrying capacitywould have approximately 5.93 g dry oyster tissuem−2 across the entire Bay (355 km2). Assuming thatoyster density is the same in the real world as in thecarrying capacity model, we estimate that oysterscurrently influence 0.568 km2 of sediment area inNarragansett Bay. From 2013 to 2015, the estimatedannual N load to the Bay was 292 Mmol N (Narra-gansett Bay Estuary Program 2017), or 0.8 Mmol Nd−1 if we assume uniform loading throughout theyear. Using the sediment denitrification rates meas-ured in this study and rates of denitrification in oysterdigestive systems from a study conducted in nearby
105

Mar Ecol Prog Ser 652: 95–109, 2020
Ninigret Pond (Ray et al. 2019a), and assuming thatthese rates apply to any oyster habitat regardless ofoyster density, we estimate that at current oysterpopulations, 671 mol N d−1 are removed via denitrifi-cation from oyster habitats in spring — approxi-mately 0.1% of the N load (Table 3). At the modeledcarrying capacity, this removal increases to 52% ofthe present daily N load or 142−175% of the dailyprehistoric N load (assuming denitrification is con-stant despite lower N loading of 89−108 Mmol N yr−1;Nixon 1997).
In the summertime, we observed a near zero netN2-N flux but similarly high rates of NH4
+ recycling.Previously published estimates of summertime oystermetabolic N requirements (51.4 μmol N g DW−1 d−1;Langdon & Newell 1989) indicate that at carryingcapacity, oysters in Narragansett Bay would require108 kmol N d−1— an amount equal to 37−44% of thedaily prehistoric N load, or 14% of the modern Nload. This high N demand (and seasonally importantN removal via denitrification) requires the use ofrecycled N within the system, whichoysters stimulate (Table 3). At carryingcapacity, we estimate that oyster habi-tats recycle 985 082 mol N d−1 to thewater column (Table 3), or 3.3−4.1times the daily N load prior to colo-nization, and 1.2 times the modern Nload, indicating that oysters drive effi-cient use of N in the system whilesimultaneously removing excess N.This recycled N can support additionalphytoplankton growth, providingadditional food for oysters.
Fall N2 fixation in oyster habitats oc -curs at nearly the same rate as springdenitrification, with a current inputof 605 mol N d−1 via N2 fixation or0.4 Mmol N d−1 at carrying capacity(Table 3). At carrying capacity, this N2
fixation more than doubles the daily Nload to prehistoric Narragansett Bayestimated by Nixon (1997), who sug-gested that N2 fixation in the water-sheds surrounding Narragansett Baymay have increased the prehistoric Nload, but made no mention of N2 fixa-tion within the Bay itself. Fulweiler &Heiss (2014) did suggest that N2 fixa-tion may have been important in pre-historic Narragansett Bay. Nixon alsosuggested N from offshore may havebeen an important contributor to the
high productivity of the Bay prior to anthropogeniceffects. More recently, Oczkowski et al. (2016) esti-mated a prehistoric δ15N value for dissolved N in Nar-ragansett Bay of 6‰ using samples from NativeAmerican shell middens. This value is close to theδ15N of dissolved N in the ocean, which is typicallyless than 7‰ (Chaves 2004). The δ15N associatedwith N from N2 fixation is typically near 0‰, which,when combined with terrestrial N sources, could leadto a pooled δ15N of near 6‰. We propose that N2 fix-ation in oyster habitats may have been an importantseasonal contributor to the availability of N and pro-ductivity of prehistoric Narragansett Bay as well asother coastal ecosystems with large oyster popula-tions and low nutrient inputs.
In systems with large oyster populations, keepingnutrients in the system is critical, and it is no surprisethat there is typically little denitrification in oysterhabitats in Narragansett Bay during periods of lowproductivity. Further, oysters may help to balanceproductivity across seasons by regulating sediment
106
Spring Summer Fall
Sediment N removal—currenta 665 −37 −611Sediment N removal—capacity 416000 −23004 −382000Oyster N removal—currentb 6 6 6Oyster N removal—capacity 3493 3493 3493Total N removed—current 671 −31 −605Total N removed—capacity 419493 −19511 −378507Sediment N recycled—current 1557 2053 1514Sediment N recycled—capacity 972984 1283112 946572Oyster N recycled—current 19 19 19Oyster N recycled—capacity 12098 12098 12098Total N recycled—current 1576 2072 1530Total N recycled—capacity 985082 1295210 958670
aOyster habitat area estimated from Byron et al. (2011). They reported5.93 g DW m−2 across the whole of Narragansett Bay (355 km2) at carryingcapacity (625 times current population). We assumed oyster density wouldremain the same for current populations to estimate a current areal coverage of 0.568 km2
bDenitrification can also occur in oyster digestive systems (Smyth et al.2013a, Caffrey et al. 2016, Ray et al. 2019a). Here, we estimated Nremoval and recycling from oysters using published values from an oysterfarm within 20 km of Narragansett Bay (Ray et al. 2019a) of 0.41 μmolN2-N ind.−1 h−1 and 1.42 μmol NH4
+ ind.−1 h−1. Individual oysters in thatstudy weighed 2.93 g DW, and we assumed rates would be the sameacross seasons
Table 3. Daily Narragansett Bay-wide estimates of N fluxes from oyster habi-tats (mol N d−1) for current oyster populations (‘current’), and at ecological car-rying capacity (‘capacity’). Removal values are calculated using net N2-Nfluxes and recycling values using NH4
+ fluxes measured in this study. Nega-tive removal values indicate net N fixation and addition of N to the system. We assumed the modern daily N load to equal 0.8 Mmol N d−1 (Narragansett BayEstuary Program 2017) and the prehistoric daily N load to equal 0.27 Mmol
N d−1 (Nixon 1997)

Ray & Fulweiler: Seasonal benthic−pelagic coupling
denitrification and N2 fixation. It is critical that modelestimates of oyster carrying capacity consider andinclude the role oysters play in changing sediment Ncycling. Byron et al. (2011) did not consider the im -pact of oysters on sediment N-cycling — either re -moval via denitrification or addition by N2 fixation —though the role oysters play in regulating theseprocesses is significant at an ecosystem scale. To beclear, we do not want to discredit Byron et al. (2011),as their estimates drove us to ask the questions pre-sented in this manuscript. However, the evidence wepresent here clearly demonstrates that future modelsof coastal ecosystems with large bi valve populationsshould consider how these organisms regulateN-cycling.
5. CONCLUDING REMARKS
It is clear that sediment biogeochemical processesin oyster habitats are dynamic and may be depend-ent on water column productivity. We show that thenet N2 flux in oyster habitats switches between netremoval via denitrification in the spring to net addi-tion via N2 fixation in the fall. This complexity mayhinder accurate estimates of ecological carryingcapacity and understanding of productivity and eco-system structure in coastal habitats that once had sig-nificant oyster populations. Reducing N loads tocoastal systems with large oyster populations maynot necessarily hinder productivity due to high ratesof N2 fixation. As efforts to include oyster-mediatedsediment denitrification in nutrient managementplanning are further developed, a holistic approachthat considers weekly or even daily patterns of watercolumn chl a and sediment OM quality may be nec-essary for accurate quantification.
Acknowledgements. This research was funded by a RhodeIsland Sea Grant award to R.W.F. and funding from theFrederick S. Pardee Center for the Study of the LongerRange Future at Boston University. N.E.R. was supported bya teaching fellowship from the Biology Department atBoston University and Warren McLeod research fellowshipsfrom Boston University Marine Program. We thank DaveBeutel and Matt Griffin for suggesting sampling locationsand introducing us to oyster farmers and Steve DiPetrillo forletting us sample at his farm. We thank Gretchen McCarthy,Alia Al-Haj, Lucy Zipf, James Garner, Johnny Elguero,Emily Scott, Victoria Momyer, Isabel Sanchez-Viruet,Isabela Trumble, Claire MacGill, Julia Masterman, ClaudiaMazur, Ena Miculinic, and John Rezza for help with fieldand lab work. We are thankful for comments and feedbackfrom Pam Templer, Pete Buston, and 3 anonymous review-ers that helped to improve the manuscript. We thank the
Graduate School of Oceanography for funding and Dr.Tatiana Rynearson for maintaining the Narragansett BayLong-Term Phytoplankton Time Series.
LITERATURE CITED
Arar EJ, Collins GB (1997) Method 445.0: In vitro determina-tion of chlorophyll a and pheophytin a in marine andfreshwater algae by fluorescence. US EnvironmentalProtection Agency, Washington, DC
Barille L, Cognie B (2000) Revival capacity of diatoms inbivalve psedofaeces and faeces. Diatom Res 15: 11−17
Bates D, Maechler M, Bolker B, Walker S (2015) Fitting lin-ear mixed-effects models using lme4. J Stat Softw 67: 1−48
Beck MW, Brumbaugh RD, Airoldi L, Carranza A and others(2011) Oyster reefs at risk and recommendations for con-servation, restoration, and management. Bioscience 61: 107−116
Bernhardt JR, Leslie HM (2013) Resilience to climatechange in coastal marine ecosystems. Annu Rev Mar Sci5: 371−392
Beutel D (2017) Aquaculture in Rhode Island 2017. RhodeIsland Coastal Resources Management Council, Wake-field, RI
Boucher G, Boucher-Rodoni R (1988) In situ measurement ofrespiratory metabolism and nitrogen fluxes at the inter-face of oyster beds. Mar Ecol Prog Ser 44: 229−238
Burgin AJ, Hamilton SK (2007) Have we overemphasizedthe role of denitrification in aquatic ecosystems? Areview of nitrate removal pathways. Front Ecol Environ5: 89−96
Byron C, Link J, Costa-Pierce B, Bengtson D (2011) Calcu-lating ecological carrying capacity of shellfish aquacul-ture using mass-balance modeling: Narragansett Bay,Rhode Island. Ecol Modell 222: 1743−1755
Caffrey JM, Hollibaugh JT, Mortazavi B (2016) Living oys-ters and their shells as sites of nitrification and denitrifi-cation. Mar Pollut Bull 112: 86−90
Chaves JE (2004) Potential use of 15N to assess nitrogensources and fate in Narragansett Bay. PhD dissertation,University of Rhode Island, Kingston, RI
Colt J (1984) Computation of dissolved gas concentrations inwater as functions of temperature, salinity, and pressure.Special Publication No. 14, American Fisheries Society,Bethesda, MD
Dame RF, Spurrier JD, Zingmark RG (1992) In situ metabo-lism of an oyster reef. J Exp Mar Biol Ecol 164: 147−159
Delignette-Muller ML, Dutang C (2015) fitdistrplus: an Rpackage for fitting distributions. J Stat Softw 64: 1−34
Dunnington D (2018) ggspatial: spatial data framework forggplot2. R package version 103
Ehrich MK, Harris LA (2015) A review of existing easternoyster filtration rate models. Ecol Modell 297: 201−212
Fagherazzi S, Mariotti G, Banks AT, Morgan EJ, FulweilerRW (2014) The relationships among hydrodynamics, sed-iment distribution, and chlorophyll in a mesotidal estu-ary. Estuar Coast Shelf Sci 144: 54−64
Foster SQ, Fulweiler RW (2014) Spatial and historic variabil-ity of benthic nitrogen cycling in an anthropogenicallyimpacted estuary. Front Mar Sci 1: 56
Foster SQ, Fulweiler RW (2016) Sediment nitrous oxidefluxes are dominated by uptake in a temperate estuary.Front Mar Sci 3: 40
107

Mar Ecol Prog Ser 652: 95–109, 2020
Foster SQ, Fulweiler RW (2019) Estuarine sediments exhibitdynamic and variable biogeochemical responses tohypoxia. J Geophys Res Biogeosci 124: 737−758
Fulweiler RW, Heiss EM (2014) (Nearly) a decade of directlymeasured sediment N2 fluxes: What can NarragansettBay tell us about the global ocean nitrogen budget?Oceanography (Wash DC) 27: 184−195
Fulweiler RW, Nixon SW (2009) Responses of benthic−pelagic coupling to climate change in a temperate estu-ary. Hydrobiologia 629: 147−156
Fulweiler RW, Nixon SW (2012) Net sediment N2 fluxes in asouthern New England estuary: variations in space andtime. Biogeochemistry 111: 111−124
Fulweiler RW, Nixon SW, Buckley BA, Granger SL (2007)Reversal of the net dinitrogen gas flux in coastal marinesediments. Nature 448: 180−182
Fulweiler RW, Nixon SW, Buckley BA, Granger SL (2008)Net sediment N2 fluxes in a coastal marine system—experimental manipulations and a conceptual model.Ecosystems 11: 1168−1180
Fulweiler RW, Brown SM, Nixon SW, Jenkins BD (2013) Evi-dence and a conceptual model for the co-occurrence ofnitrogen fixation and denitrification in heterotrophicmarine sediments. Mar Ecol Prog Ser 482: 57−68
Hardison AK, Algar CK, Giblin AE, Rich JJ (2015) Influenceof organic carbon and nitrate loading on partitioningbetween dissimilatory nitrate reduction to ammonium(DNRA) and N2 production. Geochim Cosmochim Acta164: 146−160
Higgins CB, Tobias C, Piehler MF, Smyth AR, Dame RF,Stephenson K, Brown BL (2013) Effect of aquaculturedoyster biodeposition on sediment N2 production inChesapeake Bay. Mar Ecol Prog Ser 473: 7−27
Hoellein TJ, Zarnoch CB, Grizzle RE (2015) Eastern oyster(Crassostrea virginica) filtration, biodeposition, and sed-iment nitrogen cycling at two oyster reefs with contrast-ing water quality in Great Bay Estuary (New Hampshire,USA). Biogeochemistry 122: 113−129
Humphries AT, Ayvazian SG, Carey JC, Hancock BT andothers (2016) Directly measured denitrification revealsoyster aquaculture and restored oyster reefs removenitrogen at comparable high rates. Front Mar Sci 3: 74
Ingall E, Jahnke R (1994) Evidence for enhanced phospho-rus regeneration from marine sediments overlain by oxy-gen depleted waters. Geochim Cosmochim Acta 58: 2571−2575
Jackson JBC (2001) Historical overfishing and the recentcollapse of coastal ecosystems. Science 293: 629−637
Kana TM, Darkangelo C, Hunt MD, Oldham JB, BennettGE, Cornwell JC (1994) Membrane inlet mass spectrom-eter for rapid high-precision determination of N2, O2, andAr in environmental water samples. Anal Chem 66: 4166−4170
Kellogg ML, Cornwell JC, Owens MS, Paynter KT (2013)Denitrification and nutrient assimilation on a restoredoyster reef. Mar Ecol Prog Ser 480: 1−19
Kuypers MMM, Marchant HK, Kartal B (2018) The micro-bial nitrogen-cycling network. Nat Rev Microbiol 16: 263−276
Langdon CJ, Newell RIE (1989) Utilization of detritus andbacteria as food sources by two bivalve suspension-feed-ers, the oyster Crassostrea virginica and the mussel Geu -kensia demissa. Mar Ecol Prog Ser 58: 299−310
Lenth R (2018) emmeans: estimated marginal means, akaleast-squares means. R package version 1.2.3
Lunstrum A, McGlathery K, Smyth A (2018) Oyster (Crass-ostrea virginica) aquaculture shifts sediment nitrogenprocesses toward mineralization over denitrification.Estuaries Coasts 41: 1130−1146
Mallin A, Paerl H, Rudek J (1991) Seasonal phytoplanktoncom position, productivity and biomass in the Neuse RiverEstuary, North Carolina. Estuar Coast Shelf Sci 32: 609−623
Mazouni N, Gaertner J, Deslous-Paoli J, Landrein S, D’Oe-denberg M (1996) Nutrient and oxygen exchanges at thewater−sediment interface in a shellfish farming lagoon(Thau, France). J Exp Mar Biol Ecol 205: 91−113
Mortazavi B, Ortmann AC, Wang L, Bernard RJ and others(2015) Evaluating the impact of oyster (Crassostrea vir-ginica) gardening on sediment nitrogen cycling in a sub-tropical estuary. Bull Mar Sci 91: 323−341
Narragansett Bay Estuary Program (2017) The State of Nar-ragansett Bay and its watershed: technical report. Narra-gansett Bay Estuary Program, Providence, RI
Newell RIE (1988) Ecological changes in Chesapeake Bay: Are they the result of overharvesting the American oys-ter, Crassostrea virginica? In: Lynch MP, Krome EC (eds)Understanding the estuary: advances in ChesapeakeBay research. Proceedings of a conference, 29−31 March1988, Baltimore, MD. Publication No. 129, ChesapeakeResearch Consortium, Solomons, MD, p 536−546
Newell R, Fisher T, Holyoke R, Cornwell J (2005) Influenceof eastern oysters on nitrogen and phosphorus regenera-tion in Chesapeake Bay, USA. In: Dame RF, Olenin S(eds) The comparative roles of suspension-feeders inecosystems. Springer, Dordrecht, p 93−120
Nielsen LP, Brotas V, Viaroli P, Underwood G and others(2000) Protocol handbook for NICE: nitrogen cycling inestuaries. A project under the EU research programme: Marine Science and Technology (MAST III). NationalEnvironmental Research Institute, Silkborg
Nixon SW (1997) Prehistoric nutrient inputs and productiv-ity in Narragansett Bay. Estuaries 20: 253−261
Nixon SW, Fulweiler RW, Buckley BA, Granger SL, NowickiBL, Henry KM (2009) The impact of changing climate onphenology, productivity, and benthic−pelagic couplingin Narragansett Bay. Estuar Coast Shelf Sci 82: 1−18
Oczkowski A, Gumbley T, Carter B, Carmichael R, Hum -phries A (2016) Establishing an anthropogenic nitrogenbaseline using Native American shell middens. FrontMar Sci 3: 79
Oczkowski A, Schmidt C, Santos E, Miller K and others(2018) How the distribution of anthropogenic nitrogenhas changed in Narragansett Bay (RI, USA) followingmajor reductions in nutrient loads. Estuaries Coasts 41: 2260−2276
Onorevole KM, Thompson SP, Piehler MF (2018) Livingshorelines enhance nitrogen removal capacity over time.Ecol Eng 120: 238−248
Pebesma E (2018) Simple features for R: standardized sup-port for spatial vector data. R J 10: 439−446
Piehler MF, Smyth AR (2011) Habitat-specific distinctions inestuarine denitrification affect both ecosystem functionand services. Ecosphere 2: art12
Pilson MEQ (1985) On the residence time of water in Narra-gansett Bay. Estuaries 8: 2−14
Prairie YT (1996) Evaluating the predictive power of regres-sion models. Can J Fish Aquat Sci 53: 490−492
R Core Team (2014) R: a language and environment for sta-tistical computing. R Foundation for Statistical Comput-ing, Vienna
108

Ray & Fulweiler: Seasonal benthic−pelagic coupling 109
Ray NE, Henning MC, Fulweiler RW (2019a) Nitrogen andphosphorus cycling in the digestive system and shell bio-film of the eastern oyster Crassostrea virginica. Mar EcolProg Ser 621: 95−105
Ray NE, Maguire TJ, Al-Haj A, Henning M, Fulweiler RW(2019b) Low greenhouse gas emissions from oysteraquaculture. Environ Sci Technol 53: 9118−9127
Ray NE, Al-Haj A, Fulweiler RW (2020) Sediment biogeo-chemistry along an oyster aquaculture chronosequence.Mar Ecol Prog Ser 646: 13−27
Rick TC, Reeder-Myers LA, Hofman CA, Breitburg D andothers (2016) Millennial-scale sustainability of the Che -sapeake Bay Native American oyster fishery. Proc NatlAcad Sci USA 113: 6568−6573
Riemann B, Simonsen P, Stensgaard L (1989) The carbonand chlorophyll content of phytoplankton from variousnutrient regimes. J Plankton Res 11: 1037−1045
Schumann S (2015) Rhode Island’s shellfish heritage: anecological history. University of Rhode Island, Narra-gansett, RI
Seitzinger SP (1988) Denitrification in freshwater andcoastal marine systems: ecological and geochemical sig-nificance. Limnol Oceanogr 334: 702−724
Seitzinger SP, Nixon SW (1985) Eutrophication and the rateof denitrification and N2O production in coastal marinesediments. Limnol Oceanogr 30: 1332−1339
Seitzinger SP, Nixon SW, Pilson MEQ (1984) Denitrificationand nitrous oxide production in a coastal marine ecosys-tem. Limnol Oceanogr 29: 73−83
Smayda TJ, Borkman D (2008) Nutrient and planktondynamics in Narragansett Bay. In: Desbonnet A, Costa-Pierce BA (eds) Science for ecosystem based manage-ment: Narragansett Bay in the 21st century. Springer,New York, NY, p 431−498
Smyth AR, Geraldi NR, Piehler MF (2013a) Oyster-mediatedbenthic−pelagic coupling modifies nitrogen pools andprocesses. Mar Ecol Prog Ser 493: 23−30
Smyth AR, Thompson SP, Siporin KN, Gardner WS,McCarthy MJ, Piehler MF (2013b) Assessing nitrogendynamics throughout the estuarine landscape. EstuariesCoasts 36: 44−55
Smyth AR, Piehler MF, Grabowski JH (2015) Habitat contextinfluences nitrogen removal by restored oyster reefs.J Appl Ecol 52: 716−725
Smyth AR, Geraldi NR, Thompson SP, Piehler MF (2016)Biological activity exceeds biogenic structure in influ-encing sediment nitrogen cycling in experimental oysterreefs. Mar Ecol Prog Ser 560: 173−183
Smyth AR, Murphy AE, Anderson IC, Song B (2018) Differ-ential effects of bivalves on sediment nitrogen cyc ling ina shallow coastal bay. Estuaries Coasts 41: 1147−1163
Testa JM, Brady DC, Cornwell JC, Owens MS and others(2015) Modeling the impact of floating oyster (Crassostreavirginica) aquaculture on sediment−water nutrient andoxygen fluxes. Aquacult Environ Interact 7: 205−222
Weiss RF (1970) The solubility of nitrogen, oxygen andargon in water and seawater. Deep-Sea Res OceanogrAbstr 17: 721−735
Westbrook P, Heffner L, La Peyre MK (2019) Measuring car-bon and nitrogen bioassimilation, burial, and denitrifica-tion contributions of oyster reefs in Gulf coast estuaries.Mar Biol 166: 4
Wickham H (2011) The split-apply-combine strategy fordata analysis. J Stat Softw 40: 1−29
Wickham H (2016) ggplot2: elegant graphics for data analy-sis. Springer-Verlag, New York, NY
Wickham H, Francois R, Henry L, Muller K (2019) dplyr: agrammar of data manipulation. R package version 0.8.3
Yentsch C, Menzel D (1963) A method for the determinationof phytoplankton chlorophyll and phaeophytin by fluo-rescence. Deep-Sea Res Oceanogr Abstr 10: 221−231
Zu Ermgassen PSE, Spalding MD, Blake B, Coen LD andothers (2012) Historical ecology with real numbers: pastand present extent and biomass of an imperilled estuar-ine habitat. Proc R Soc B 279: 3393−3400
Zu Ermgassen PSE, Spalding MD, Grizzle RE, BrumbaughRD (2013) Quantifying the loss of a marine ecosystemservice: filtration by the eastern oyster in US estuaries.Estuaries Coasts 36: 36−43
Zuur A, Ieno E, Walker N, Saveliev A, Smith G (2009) Mixedeffects models and extensions in ecology with R.Springer, New York, NY
Editorial responsibility: Erik Kristensen,Odense, Denmark
Submitted: April 2, 2020; Accepted: September 4, 2020Proofs received from author(s): October 12, 2020