Lars Strömberg - IEA Greenhouse Gas R&D Programme · © Vattenfall AB IEA GHG Workshop on Oxyfuel...
59
© Vattenfall AB IEA GHG Workshop on Oxyfuel Technology choice - Benchmarking Lars Strömberg Vattenfall AB Corporate Strategies Berlin / Stockholm Cottbus 29-30 th November 2005 Cottbus, Germany
Transcript of Lars Strömberg - IEA Greenhouse Gas R&D Programme · © Vattenfall AB IEA GHG Workshop on Oxyfuel...
© Vattenfall AB
IEA GHG Workshop on Oxyfuel Technology choice - Benchmarking
Lars StrömbergVattenfall AB
Corporate StrategiesBerlin / Stockholm
Cottbus 29-30th November 2005Cottbus, Germany
© Vattenfall AB 2
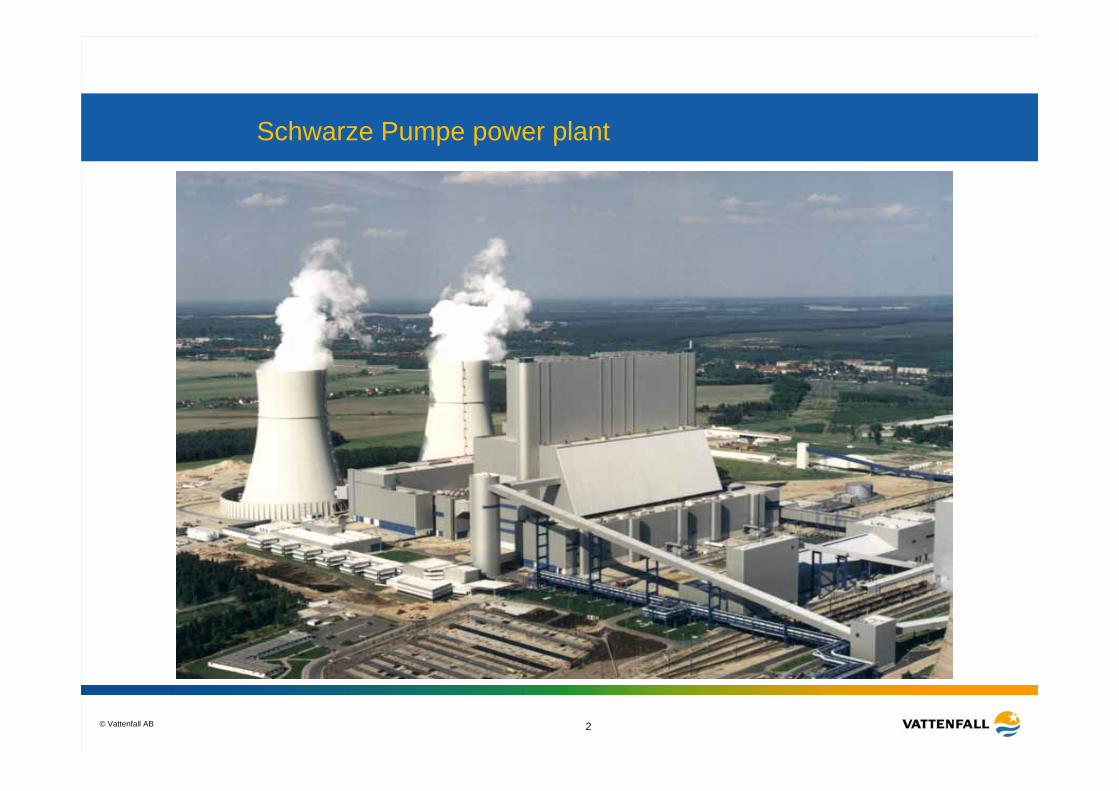
Schwarze Pumpe power plant
© Vattenfall AB 3
Why oxyfuel technology ????
Reduction of CO2
© Vattenfall AB 4
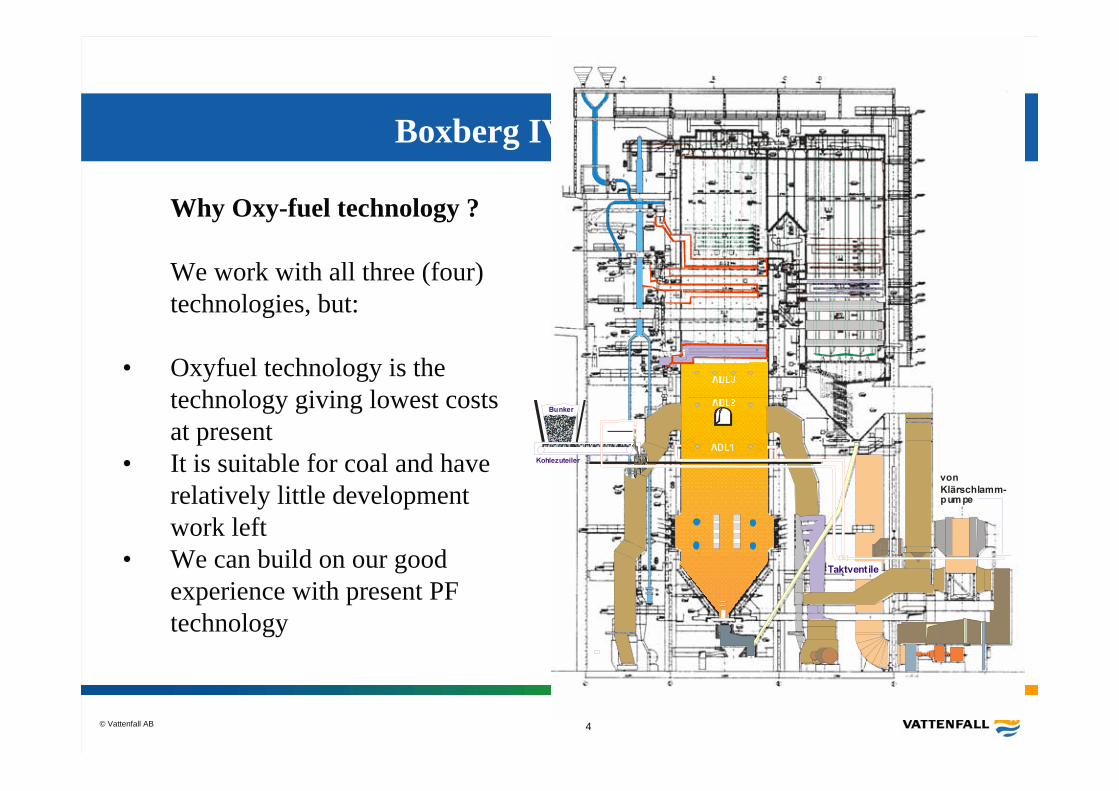
Boxberg IV
Why Oxy-fuel technology ?
We work with all three (four) technologies, but:
• Oxyfuel technology is the technology giving lowest costsat present
• It is suitable for coal and haverelatively little developmentwork left
• We can build on our goodexperience with present PF technology
© Vattenfall AB 5
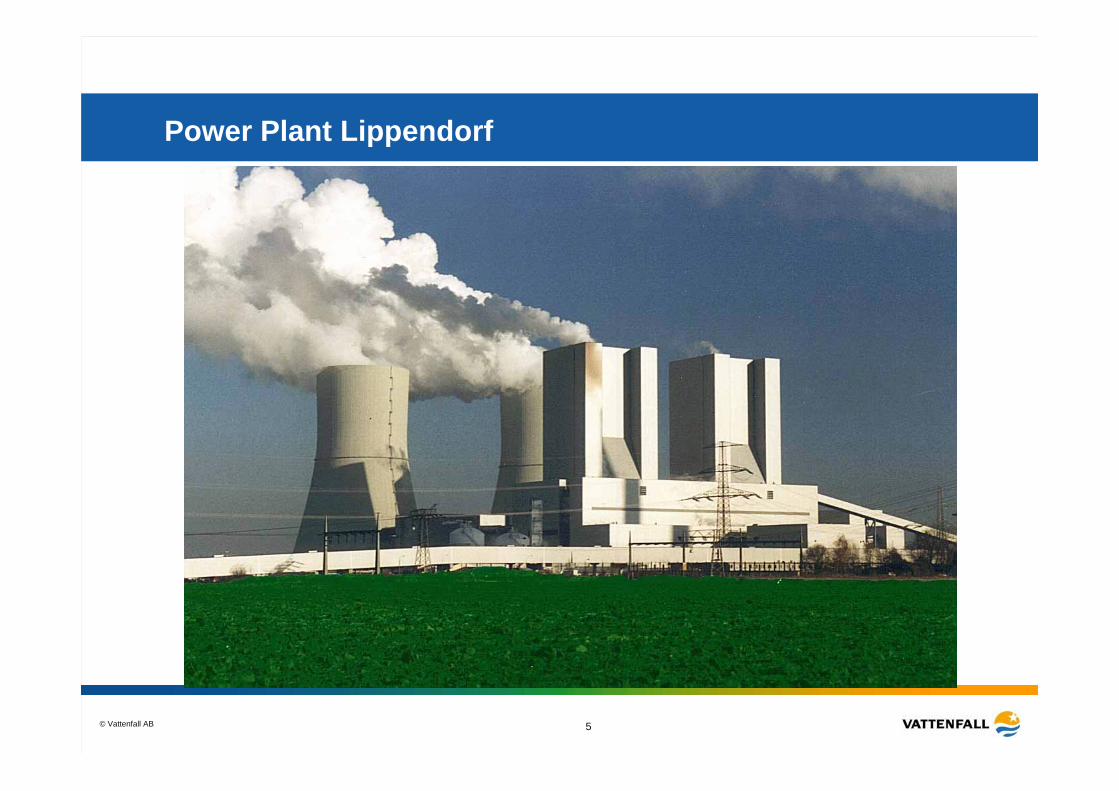
Power Plant Lippendorf
© Vattenfall AB 6
Benchmarking
CO2 free power plant
© Vattenfall AB 7
• Numerous different views on costs for technologies exist.
• Recent IPCC report did not make it better– The IPCC report is based on reviewed papers published in
Journals, not conference papers or real figures from real cases– The IPCC report is obviously wrong in the tables stating present
generation cost of electricity
• Several of the IEA papers are of similar origin, or made on contract
CO2 free power plant - Why different costs ?
© Vattenfall AB 8
• Academic papers report as they should. – What they find in litterature, or in the lab, even if it sometimes is meaningless,
– For example, giving an interval from 7 – 80 €/ton. Correct probably, but misleading
• The costs are treated differently in different papers. – For example, transport is considered costing up to 50 €/ton CO2. We know that it
should cost about 3,7 €/ton from Scwarze Pumpe to Schweinrich. We often talk about the level 5 €/ton of CO2 for transport and 2 €ton for storage for a large case.
– Capital, O&M and Fuel costs differ largely– The way calculations are made differ significantly
• Costs for a small unit is much higher than for a large– There exist a considerable volume dependence. We often talk about a power unit
of up to 750 MW. There is no sense to capture CO2 from a small plant - It is too expensive. Transport costs for the pilot is 21 €/ton CO2
• Cost are different for a Coal and a Gasfired unit, even with similar technology– If costs are expressed as €/ton CO2, reduction from gas is more expensive due to
the higher gas price and the lower amount of CO2 produced– A large part of the cost is due to that it costs energy to separate the CO2. Energy is
taken from the plant. This energy is more expensive when fuel costs are higher. 15 €/ton for a coal plant is eqiuivalent to 50 €/ton for a gas fired unit
CO2 free power plant - Why different costs II
© Vattenfall AB 9
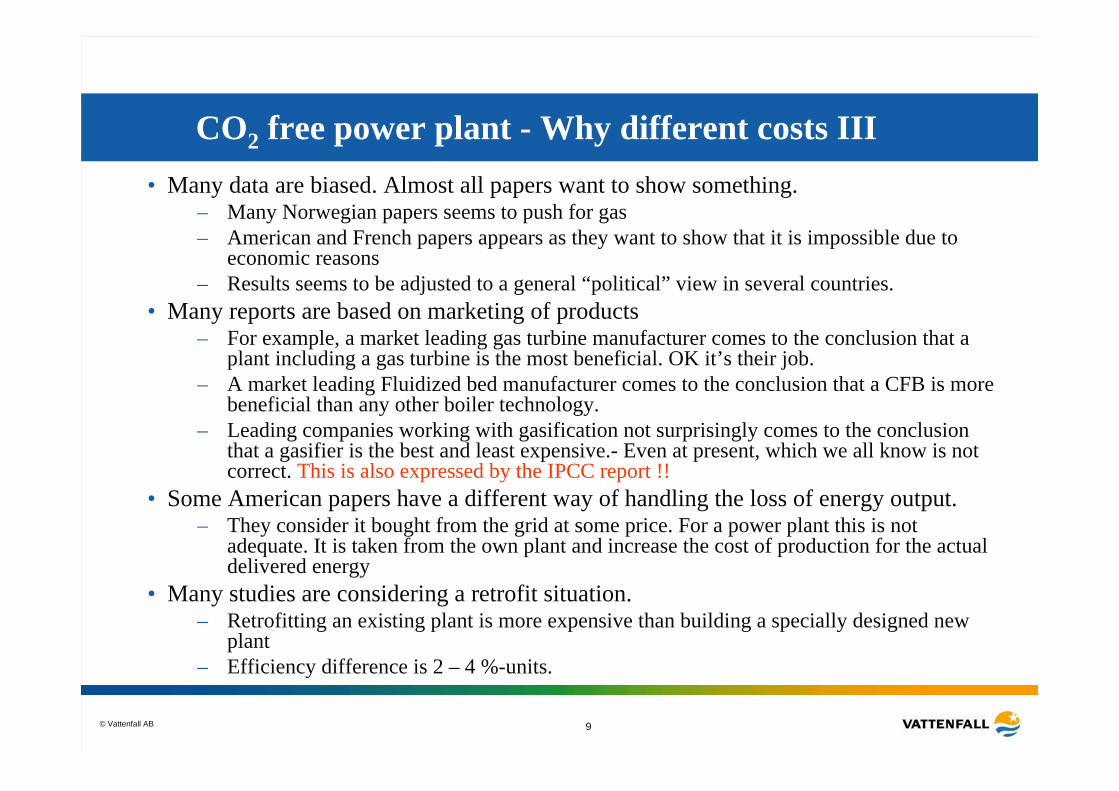
• Many data are biased. Almost all papers want to show something. – Many Norwegian papers seems to push for gas– American and French papers appears as they want to show that it is impossible due to
economic reasons– Results seems to be adjusted to a general “political” view in several countries.
• Many reports are based on marketing of products– For example, a market leading gas turbine manufacturer comes to the conclusion that a
plant including a gas turbine is the most beneficial. OK it’s their job.– A market leading Fluidized bed manufacturer comes to the conclusion that a CFB is more
beneficial than any other boiler technology.– Leading companies working with gasification not surprisingly comes to the conclusion
that a gasifier is the best and least expensive.- Even at present, which we all know is not correct. This is also expressed by the IPCC report !!
• Some American papers have a different way of handling the loss of energy output. – They consider it bought from the grid at some price. For a power plant this is not
adequate. It is taken from the own plant and increase the cost of production for the actual delivered energy
• Many studies are considering a retrofit situation. – Retrofitting an existing plant is more expensive than building a specially designed new
plant– Efficiency difference is 2 – 4 %-units.
CO2 free power plant - Why different costs III
© Vattenfall AB 10
Benchmarking 12001 - 4
CO2 free power plant
© Vattenfall AB 11
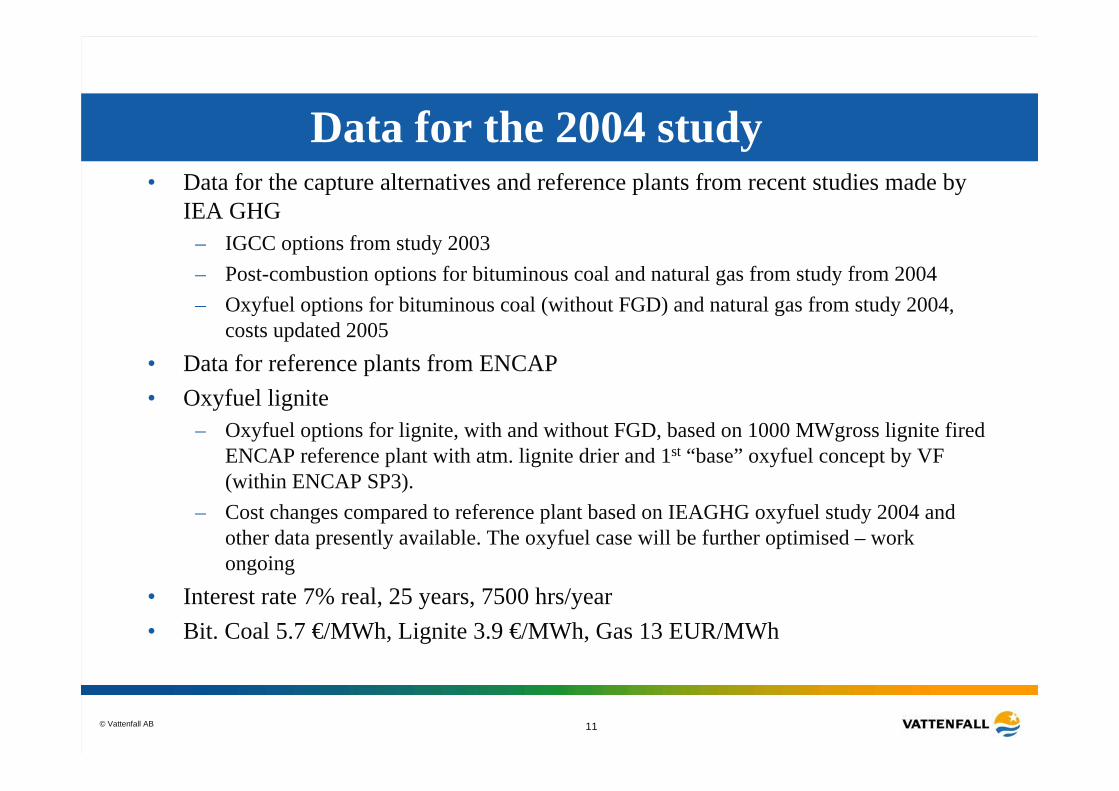
Data for the 2004 study• Data for the capture alternatives and reference plants from recent studies made by
IEA GHG – IGCC options from study 2003– Post-combustion options for bituminous coal and natural gas from study from 2004– Oxyfuel options for bituminous coal (without FGD) and natural gas from study 2004,
costs updated 2005• Data for reference plants from ENCAP• Oxyfuel lignite
– Oxyfuel options for lignite, with and without FGD, based on 1000 MWgross lignite fired ENCAP reference plant with atm. lignite drier and 1st “base” oxyfuel concept by VF (within ENCAP SP3).
– Cost changes compared to reference plant based on IEAGHG oxyfuel study 2004 and other data presently available. The oxyfuel case will be further optimised – work ongoing
• Interest rate 7% real, 25 years, 7500 hrs/year• Bit. Coal 5.7 €/MWh, Lignite 3.9 €/MWh, Gas 13 EUR/MWh
© Vattenfall AB 12
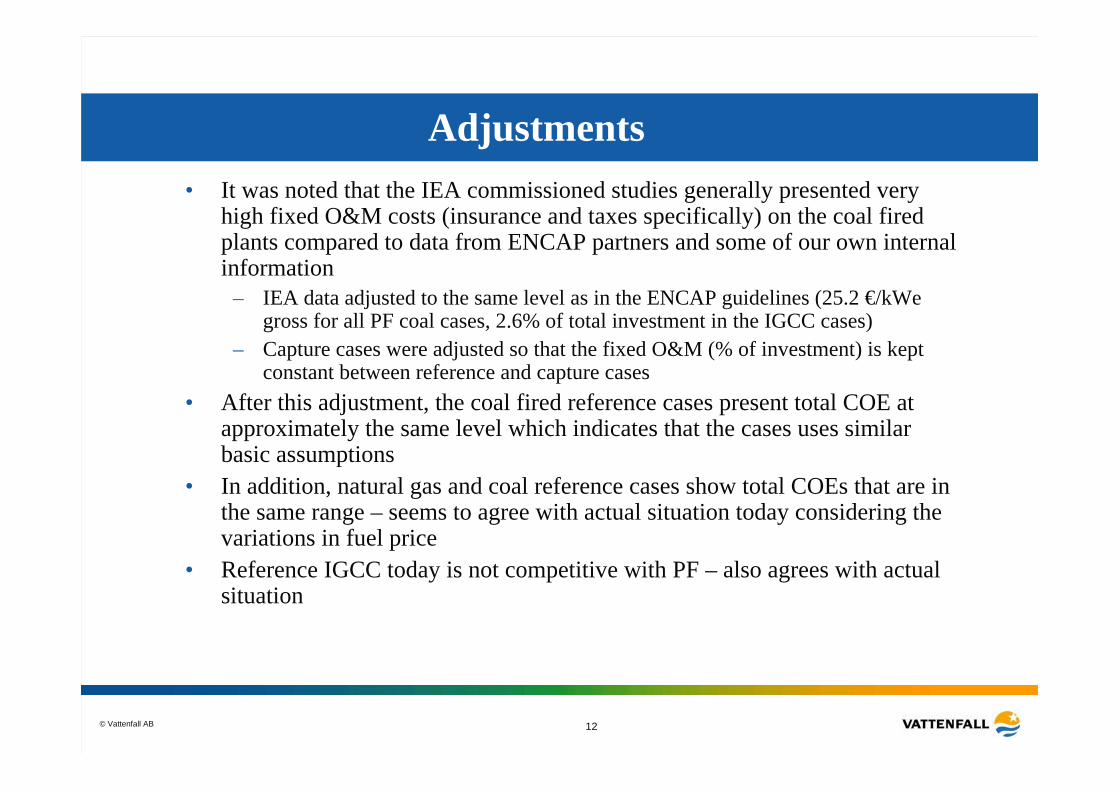
Adjustments• It was noted that the IEA commissioned studies generally presented very
high fixed O&M costs (insurance and taxes specifically) on the coal fired plants compared to data from ENCAP partners and some of our own internal information
– IEA data adjusted to the same level as in the ENCAP guidelines (25.2 €/kWegross for all PF coal cases, 2.6% of total investment in the IGCC cases)
– Capture cases were adjusted so that the fixed O&M (% of investment) is kept constant between reference and capture cases
• After this adjustment, the coal fired reference cases present total COE at approximately the same level which indicates that the cases uses similar basic assumptions
• In addition, natural gas and coal reference cases show total COEs that are in the same range – seems to agree with actual situation today considering the variations in fuel price
• Reference IGCC today is not competitive with PF – also agrees with actual situation
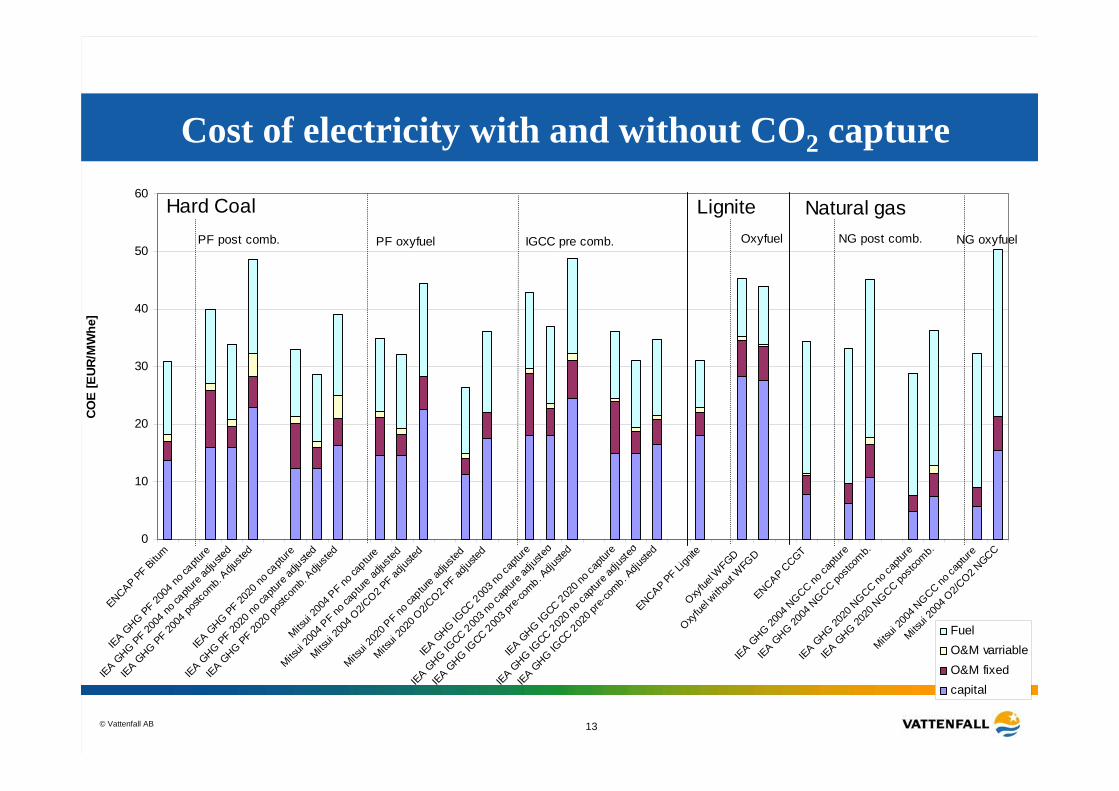
© Vattenfall AB 13
0
10
20
30
40
50
60
ENCAP PF Bitum
IEA GHG PF 20
04 no
captu
re
IEA GHG PF 20
04 no
captu
re ad
justed
IEA GHG PF 20
04 po
stcom
b. Adju
sted
IEA GHG PF 20
20 no
captu
re
IEA GHG PF 20
20 no
captu
re ad
justed
IEA GHG PF 20
20 po
stcom
b. Adju
sted
Mitsui
2004
PF n
o cap
ture
Mitsui
2004
PF n
o cap
ture ad
justed
Mitsui
2004
O2/C
O2 PF ad
justed
Mitsui
2020
PF n
o cap
ture ad
justed
Mitsui
2020
O2/C
O2 PF ad
justed
IEA GHG IG
CC 2003 n
o cap
ture
IEA GHG IG
CC 2003 n
o cap
ture a
djuste
d
IEA GHG IG
CC 2003 p
re-co
mb. Adju
sted
IEA GHG IG
CC 2020 n
o cap
ture
IEA GHG IG
CC 2020 n
o cap
ture a
djuste
d
IEA GHG IG
CC 2020 p
re-co
mb. Adju
sted
ENCAP PF Lign
iteOxy
fuel W
FGD
Oxyfue
l with
out W
FGD
ENCAP CCGT
IEA GHG 20
04 N
GCC no ca
pture
IEA GHG 20
04 N
GCC postc
omb.
IEA GHG 20
20 N
GCC no ca
pture
IEA GHG 20
20 N
GCC postc
omb.
Mitsui
2004
NGCC no
captu
re
Mitsui
2004
O2/C
O2 NGCC
CO
E [E
UR/
MW
he]
FuelO&M varriableO&M fixedcapital
Hard Coal Natural gasPF post comb. PF oxyfuel IGCC pre comb. NG post comb. NG oxyfuel
LigniteOxyfuel
Cost of electricity with and without CO2 capture
© Vattenfall AB 14
0
10
20
30
40
50
60
70
IEA GHG P
F 2004
no ca
pture
IEA GHG P
F 2004
postc
omb.
IEA GHG P
F 2020
no ca
pture
IEA GHG P
F 2020
postc
omb.
Mitsui
2004
PF no cap
ture
Mitsui
2004
O2/C
O2 PF
Mitsui
2020
PF no cap
ture
Mitsui
2020
O2/C
O2 PF
IEA GHG IG
CC 2003
no ca
pture
IEA GHG IG
CC 2003
pre-c
omb.
IEA GHG IG
CC 2020
no ca
pture
IEA GHG IG
CC 2020
pre-c
omb.
ENCAP PF Lign
ite
Oxyfue
l WFGD
Oxyfue
l with
out W
FGD
IEA GHG 20
04 NGCC no c
aptur
e
IEA GHG 20
04 NGCC pos
tcomb.
IEA GHG 20
20 NGCC no c
aptur
e
IEA GHG 20
20 NGCC pos
tcomb.
Mitsui
2004
NGCC no
captu
re
Mitsui
2004
O2/C
O2 NGCC
COE
[EUR
/MW
he]
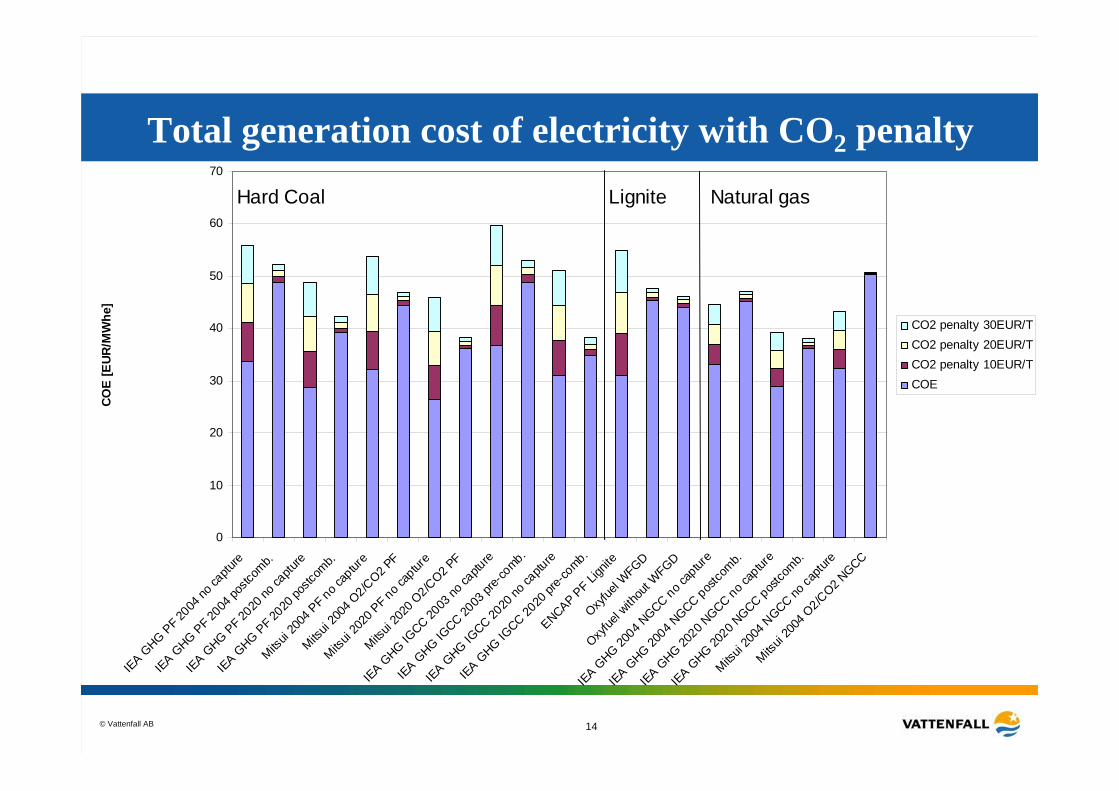
CO2 penalty 30EUR/TCO2 penalty 20EUR/TCO2 penalty 10EUR/TCOE
Hard Coal Natural gasLignite
Total generation cost of electricity with CO2 penalty
© Vattenfall AB 15
0
10
20
30
40
50
60
IEA GHGPF 2004
postcomb.
IEA GHGPF 2020
postcomb.
Mitsui 2004O2/CO2 PF
Mitsui 2020O2/CO2 PF
IEA GHGIGCC 2003pre-comb.
IEA GHGIGCC 2020pre-comb.
OxyfuelWFGD
OxyfuelwithoutWFGD
IEA GHG2004 NGCCpostcomb.
IEA GHG2020 NGCCpostcomb.
Mitsui 2004O2/CO2NGCC
COE
[EUR
/MW
h]
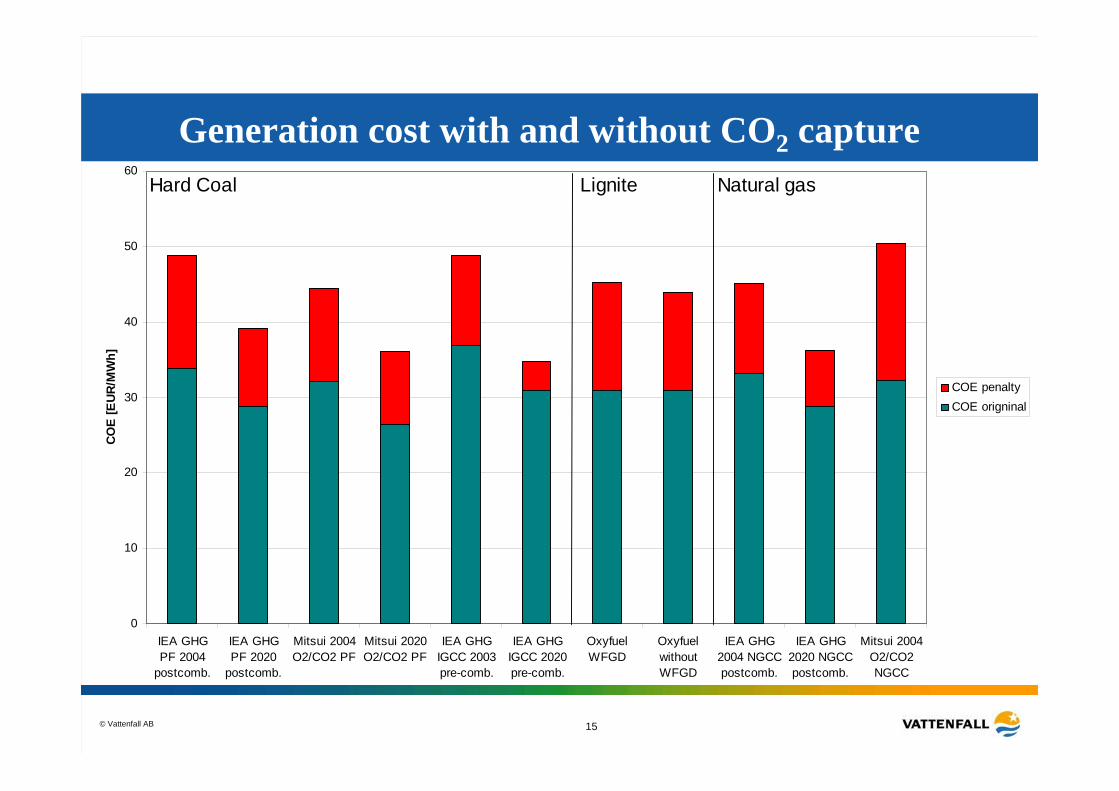
COE penaltyCOE origninal
Hard Coal Natural gasLignite
Generation cost with and without CO2 capture
© Vattenfall AB 16
Gasification ?????
CO2 free power plant
© Vattenfall AB 17
• The objective is to study and compare the physicalwashing step for capturing of CO2 for IGCC.
• To formulate a preferred concept on IGCC with CO2capture.
• To follow up the ENCAP SP2 and COORETEC activitieson IGCC and CO2 capture.
Techno-economical study IGCC
© Vattenfall AB 18
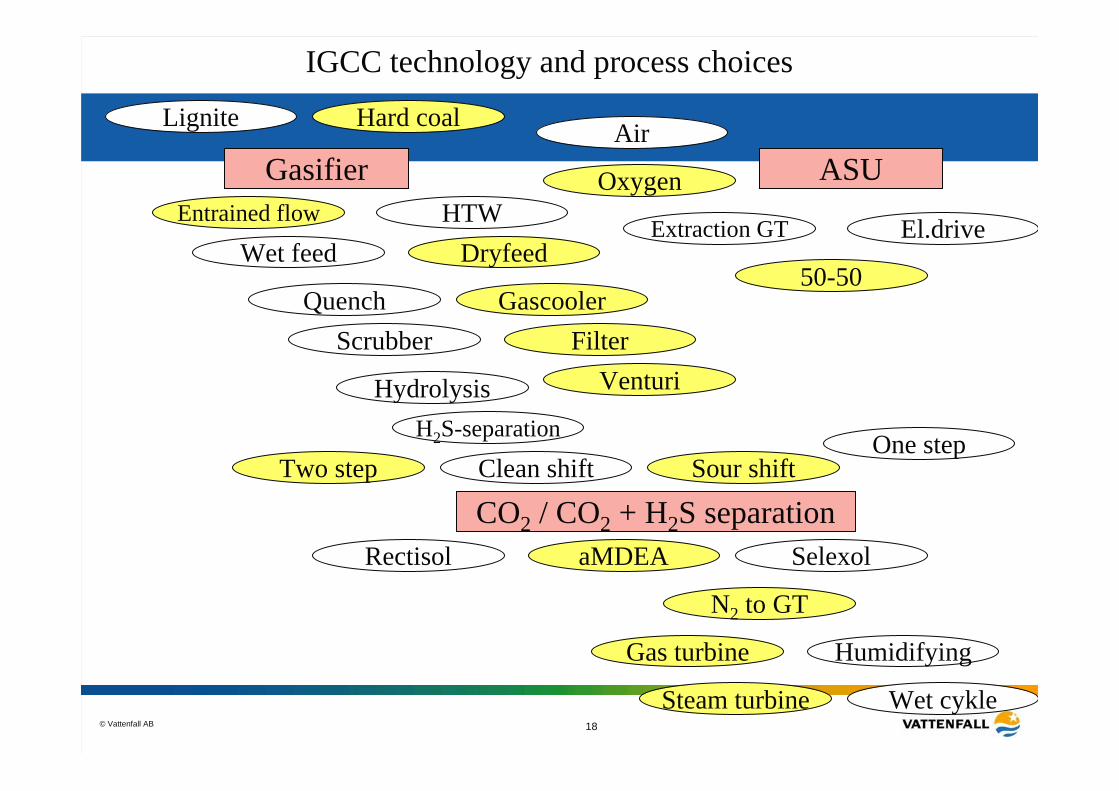
IGCC technology and process choices
Lignite Hard coal
Entrained flow HTWWet feed Dryfeed
Quench Gascooler
Oxygen
Air
Extraction GT El.drive
50-50
Selexol
Steam turbine Wet cykle
Humidifying
Gasifier ASU
Scrubber
H2S-separation
Sour shift
Hydrolysis
Clean shift
VenturiFilter
Gas turbine
One step
Rectisol aMDEA
Two step
CO2 / CO2 + H2S separation
N2 to GT
© Vattenfall AB 19
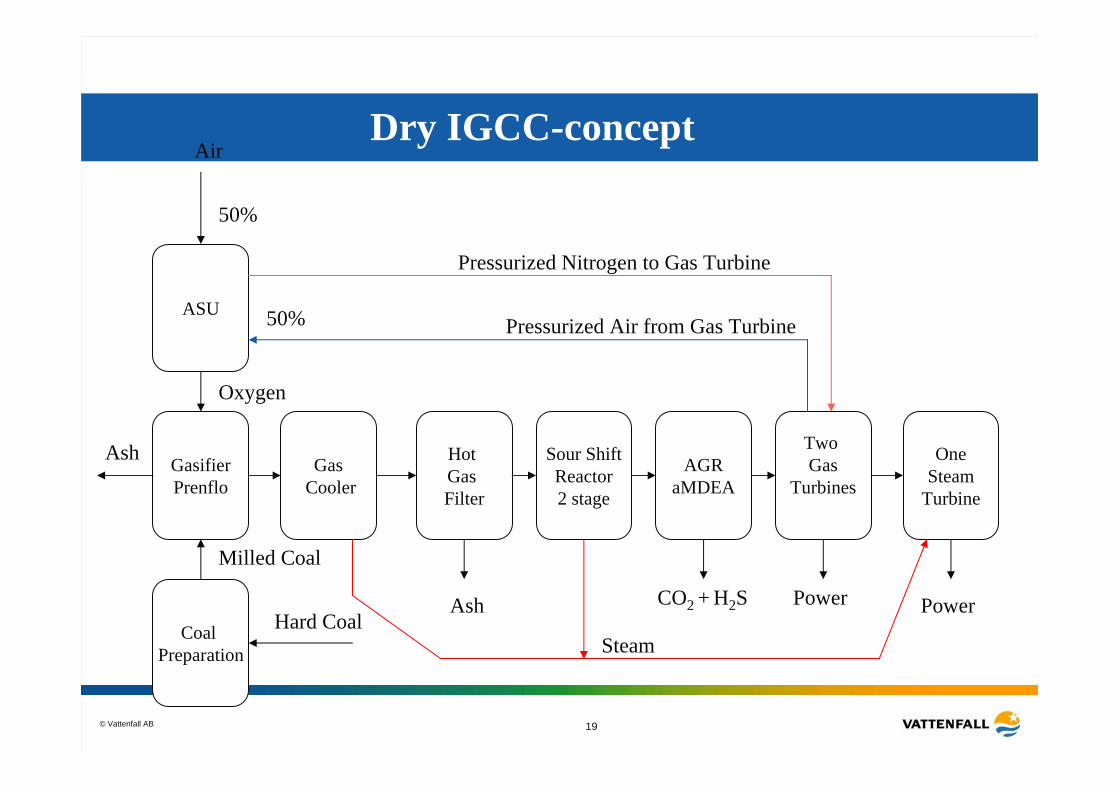
Dry IGCC-concept
ASU
Coal Preparation
GasifierPrenflo
Ash
Air
Oxygen
Milled Coal
Hard Coal
Sour ShiftReactor2 stage
Hot Gas Filter
GasCooler
AGRaMDEA
Two Gas
Turbines
OneSteam
Turbine
Ash CO2 + H2S
Pressurized Air from Gas Turbine
Power Power
Pressurized Nitrogen to Gas Turbine
Steam
50%
50%
© Vattenfall AB 20
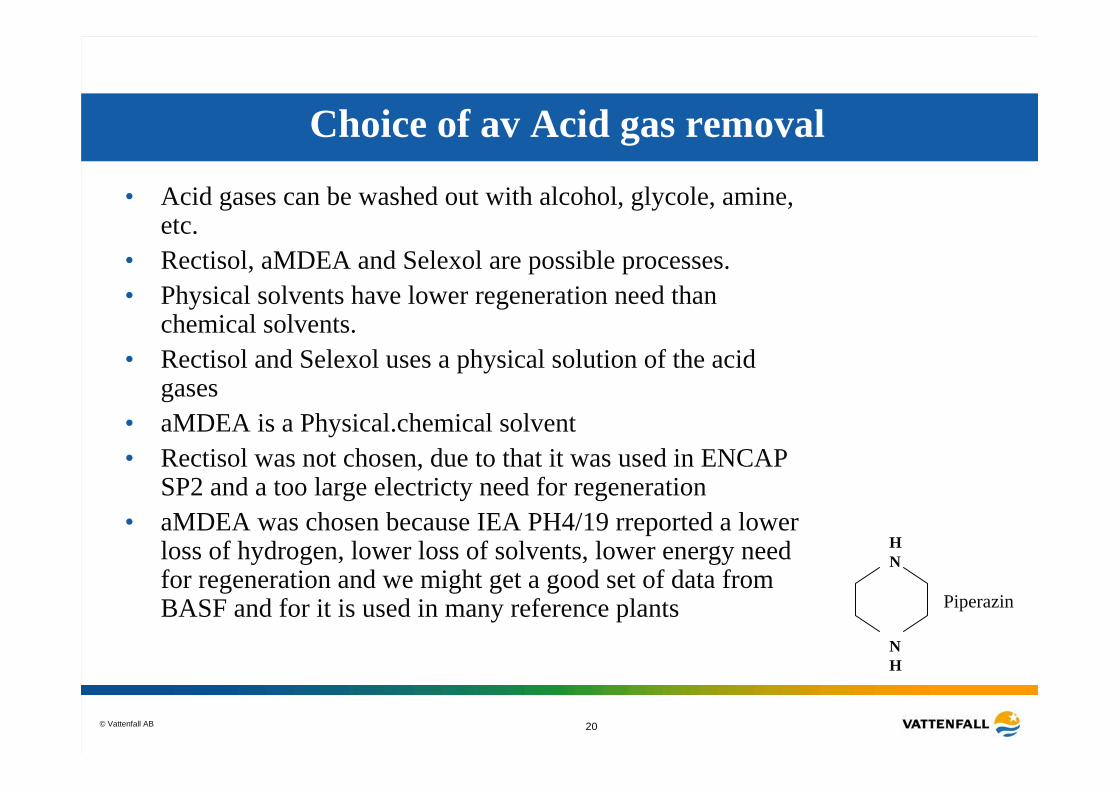
Choice of av Acid gas removal
• Acid gases can be washed out with alcohol, glycole, amine, etc.
• Rectisol, aMDEA and Selexol are possible processes.• Physical solvents have lower regeneration need than
chemical solvents.• Rectisol and Selexol uses a physical solution of the acid
gases • aMDEA is a Physical.chemical solvent• Rectisol was not chosen, due to that it was used in ENCAP
SP2 and a too large electricty need for regeneration • aMDEA was chosen because IEA PH4/19 rreported a lower
loss of hydrogen, lower loss of solvents, lower energy needfor regeneration and we might get a good set of data from BASF and for it is used in many reference plants
NH
HN
Piperazin
© Vattenfall AB 21
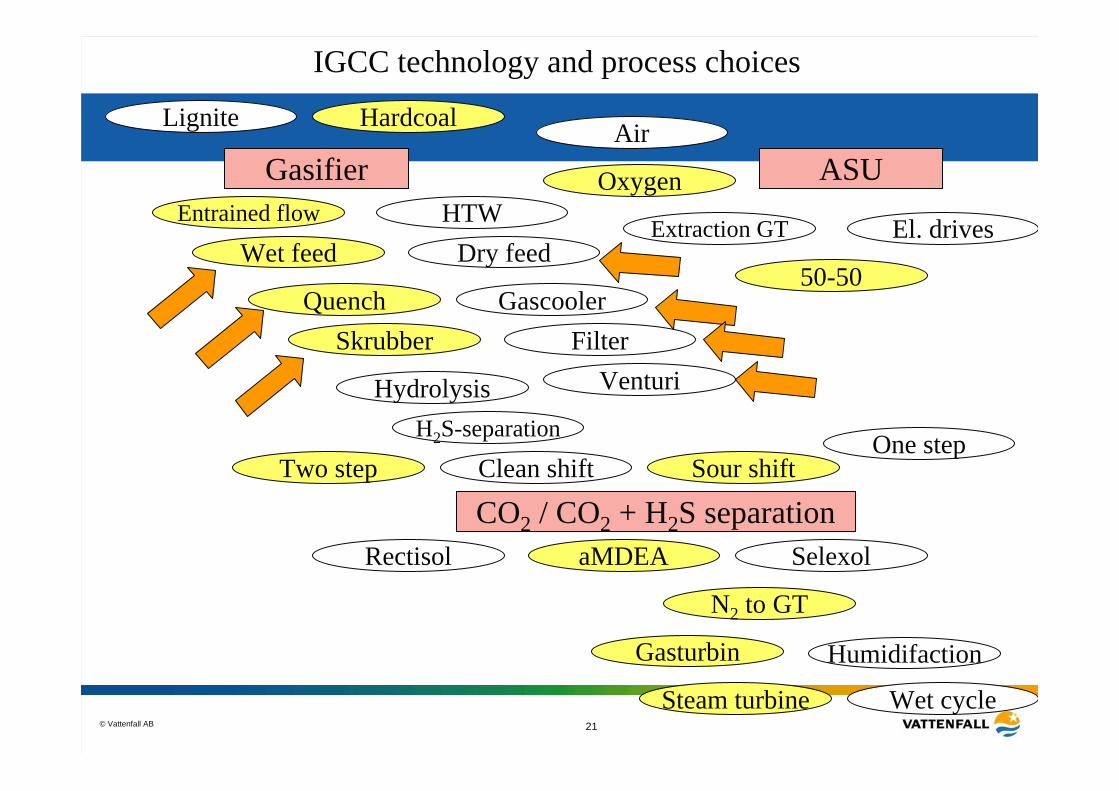
IGCC technology and process choices
Lignite Hardcoal
Entrained flow HTWWet feed Dry feed
Quench Gascooler
Oxygen
Air
Extraction GT El. drives
50-50
Selexol
Steam turbine Wet cycle
Humidifaction
Gasifier ASU
Skrubber
H2S-separation
Sour shift
Hydrolysis
Clean shift
VenturiFilter
Gasturbin
One step
Rectisol aMDEA
Two step
CO2 / CO2 + H2S separation
N2 to GT
© Vattenfall AB 22
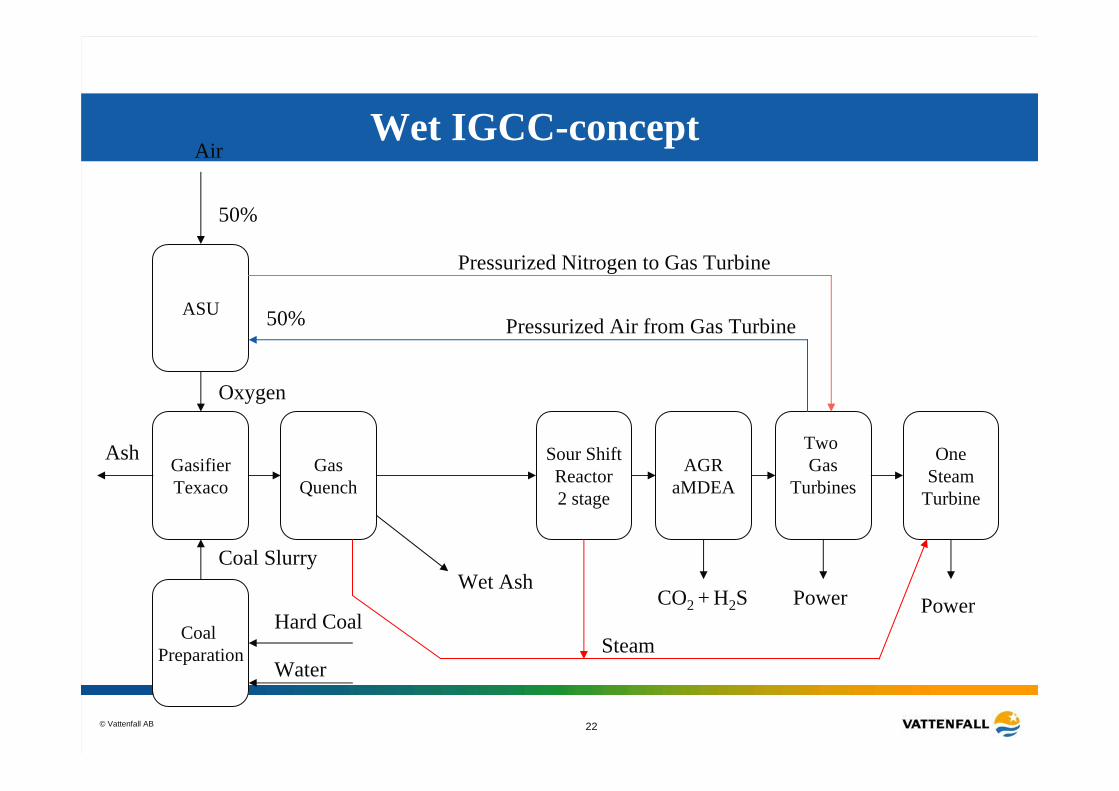
Wet IGCC-concept
ASU
Coal Preparation
GasifierTexaco
Ash
Air
Oxygen
Coal Slurry
Hard Coal
Sour ShiftReactor2 stage
GasQuench
AGRaMDEA
Two Gas
Turbines
OneSteam
Turbine
Wet AshCO2 + H2S
Pressurized Air from Gas Turbine
Power Power
Pressurized Nitrogen to Gas Turbine
Steam
50%
50%
Water
© Vattenfall AB 23
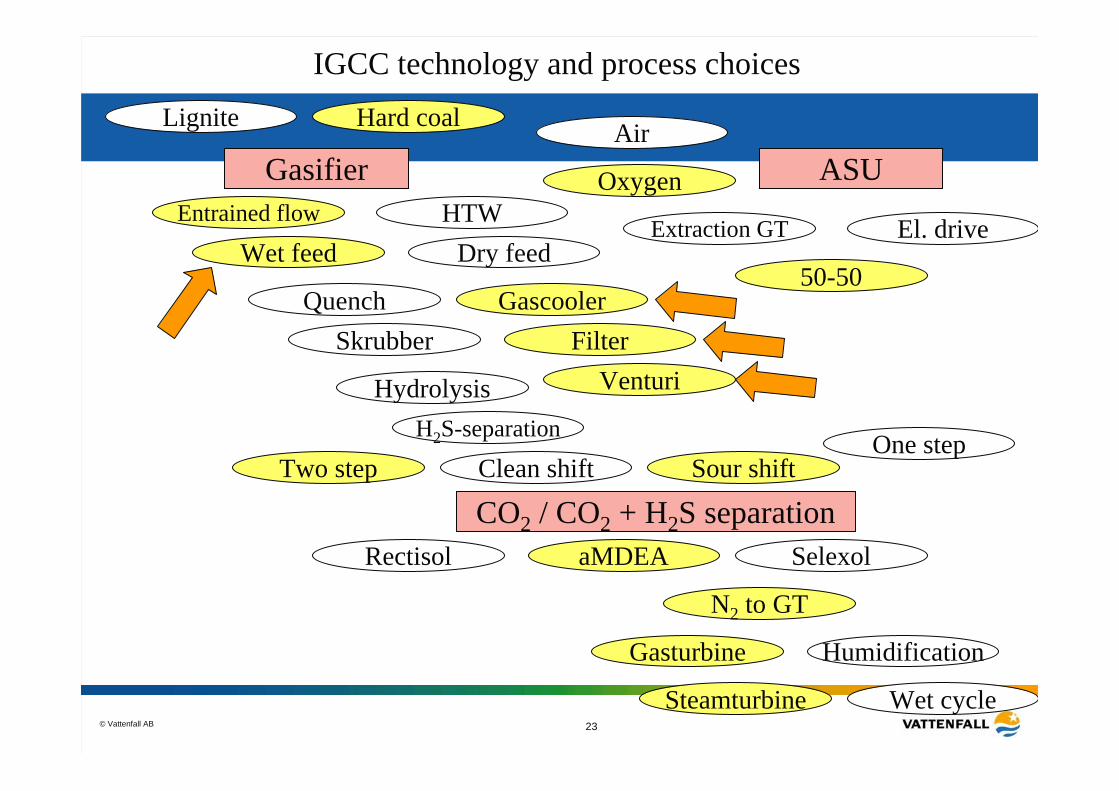
IGCC technology and process choicesLignite Hard coal
Entrained flow HTWWet feed Dry feed
Quench Gascooler
Oxygen
Air
Extraction GT El. drive
50-50
Selexol
Steamturbine Wet cycle
Humidification
Gasifier ASU
Skrubber
H2S-separation
Sour shift
Hydrolysis
Clean shift
VenturiFilter
Gasturbine
One step
Rectisol aMDEA
Two step
CO2 / CO2 + H2S separation
N2 to GT
© Vattenfall AB 24
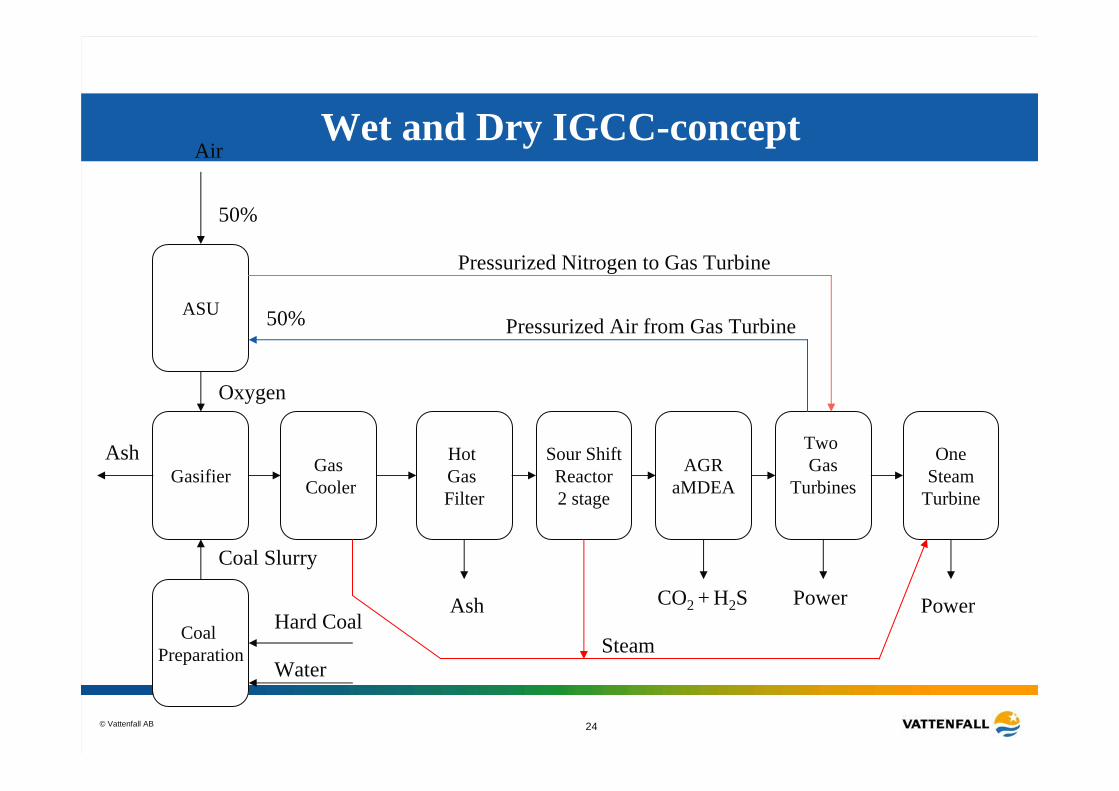
Wet and Dry IGCC-concept
ASU
Coal Preparation
GasifierAsh
Air
Oxygen
Coal Slurry
Hard Coal
Sour ShiftReactor2 stage
Hot Gas Filter
GasCooler
AGRaMDEA
Two Gas
Turbines
OneSteam
Turbine
Ash CO2 + H2S
Pressurized Air from Gas Turbine
Power Power
Pressurized Nitrogen to Gas Turbine
Steam
50%
50%
Water

© Vattenfall AB 25
Technical / economical evaluation
Efficency with and without CO2 capture
25,0
30,0
35,0
40,0
45,0
50,0
PF CoalOxyfuel
VUAB IGCC dryCO2
VUAB IGCCwet CO2
VUAB IGCCwet (no quench)
CO2
IEA IGCC ShellCO2
IEA IGCCTexaco CO2
Effic
ency
[%]
Efficiency penaltyEfficiency with capture
© Vattenfall AB 26
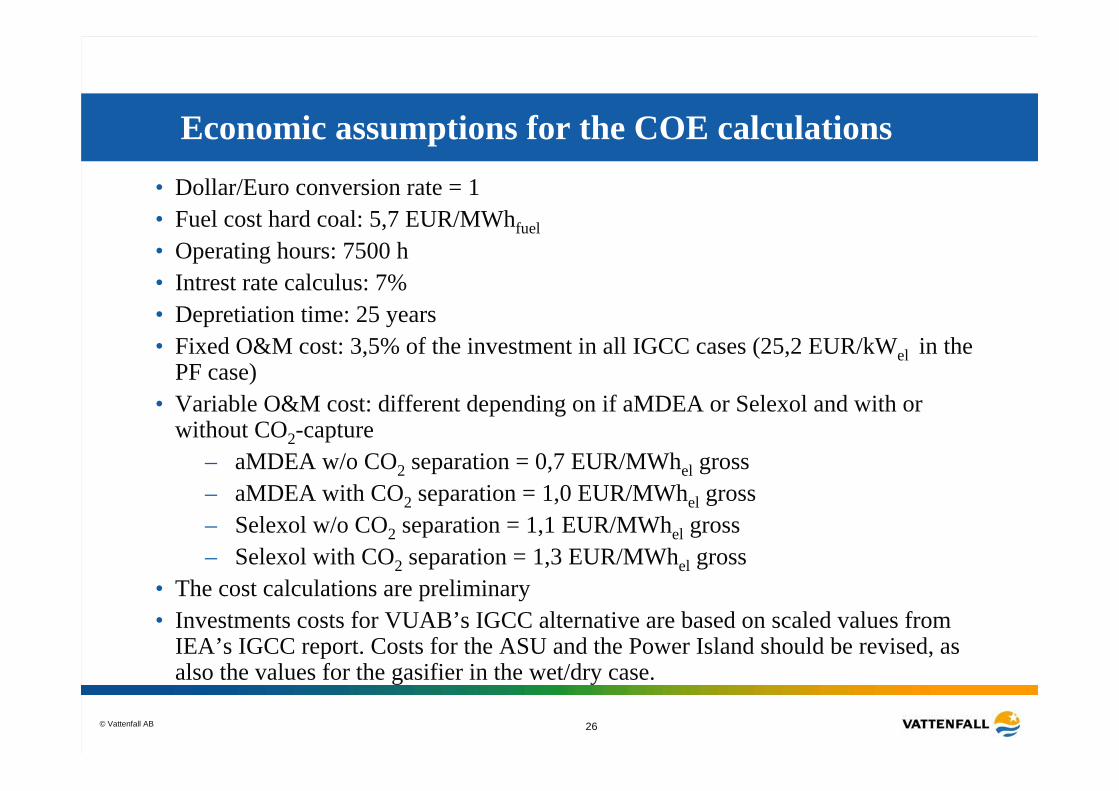
• Dollar/Euro conversion rate = 1• Fuel cost hard coal: 5,7 EUR/MWhfuel• Operating hours: 7500 h• Intrest rate calculus: 7%• Depretiation time: 25 years• Fixed O&M cost: 3,5% of the investment in all IGCC cases (25,2 EUR/kWel in the
PF case)• Variable O&M cost: different depending on if aMDEA or Selexol and with or
without CO2-capture– aMDEA w/o CO2 separation = 0,7 EUR/MWhel gross– aMDEA with CO2 separation = 1,0 EUR/MWhel gross– Selexol w/o CO2 separation = 1,1 EUR/MWhel gross– Selexol with CO2 separation = 1,3 EUR/MWhel gross
• The cost calculations are preliminary• Investments costs for VUAB’s IGCC alternative are based on scaled values from
IEA’s IGCC report. Costs for the ASU and the Power Island should be revised, as also the values for the gasifier in the wet/dry case.
Economic assumptions for the COE calculations

© Vattenfall AB 27
Technical / economical evaluation
Cost of ElectricityPreliminary investment figures for ASU and Power Island in VUAB IGCC cases
0
10
20
30
40
50
60
PF Coa
l toda
yPF C
oal O
xyfue
l
VUAB IGCC dr
y
VUAB IGCC dr
y CO2
VUAB IGCC W
et
VUAB IGCC W
et CO2
VUAB IGCC W
et (no
quen
ch)
VUAB IGCC W
et CO2 (
no qu
ench
)
IEA IG
CC Shell
IEA IG
CC Shell C
O2
IEA IG
CC Texac
o
IEA IG
CC Texac
o CO2
CO
E [E
UR
/MW
hel]
FuelO&M varriableO&M fixedcapital
© Vattenfall AB 28
Benchmarking 22005
”Including recent results ENCAP”
CO2 free power plant
© Vattenfall AB 29
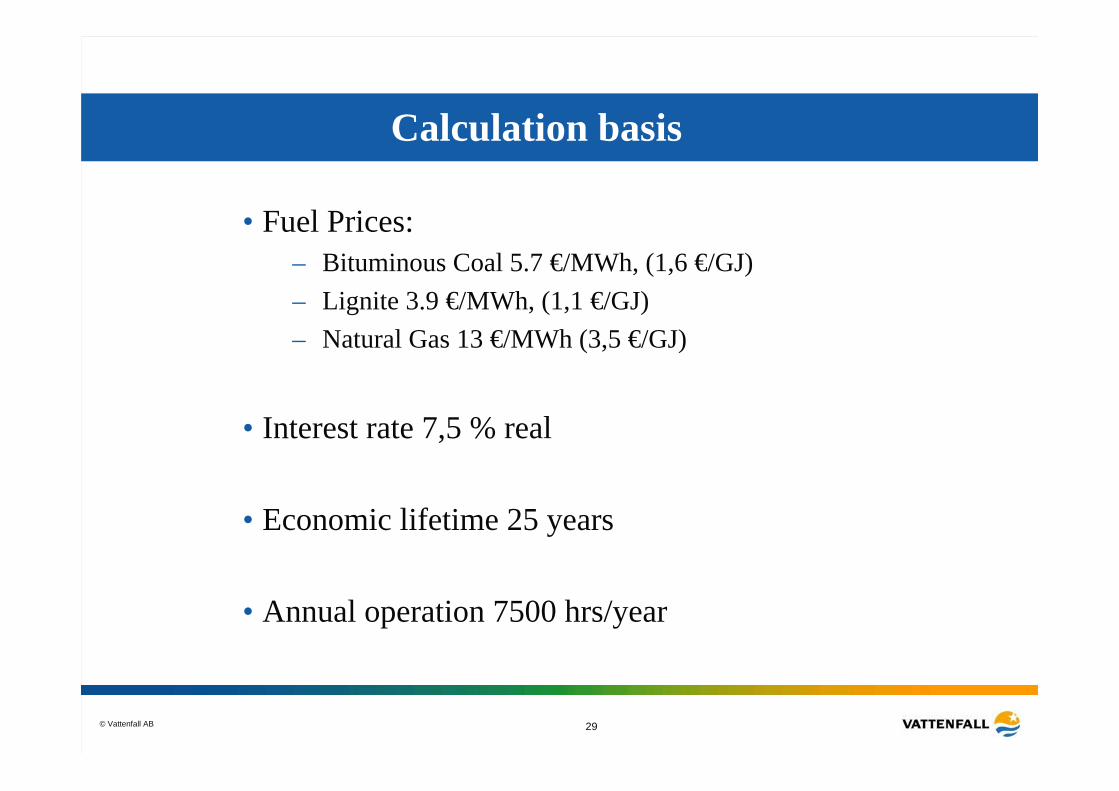
Calculation basis
• Fuel Prices:– Bituminous Coal 5.7 €/MWh, (1,6 €/GJ)– Lignite 3.9 €/MWh, (1,1 €/GJ)– Natural Gas 13 €/MWh (3,5 €/GJ)
• Interest rate 7,5 % real
• Economic lifetime 25 years
• Annual operation 7500 hrs/year
© Vattenfall AB 30
Calculation basis
• The calculations use one number for operating hours: 7500 hours.
• The problem is that operation time per year will be depending on
– Variable cost – dispatch order. – Availability.
• Some units with high variable cost will not be operated during summer in northern Europe. (high gas prices ?)
• Vattenfalls existing ultra supercritical coal fired plants have a very high availability > 95 % including planned overhaul
• The cost of fuels is very uncertain, but coal more stable than gas. Lignite is cost based
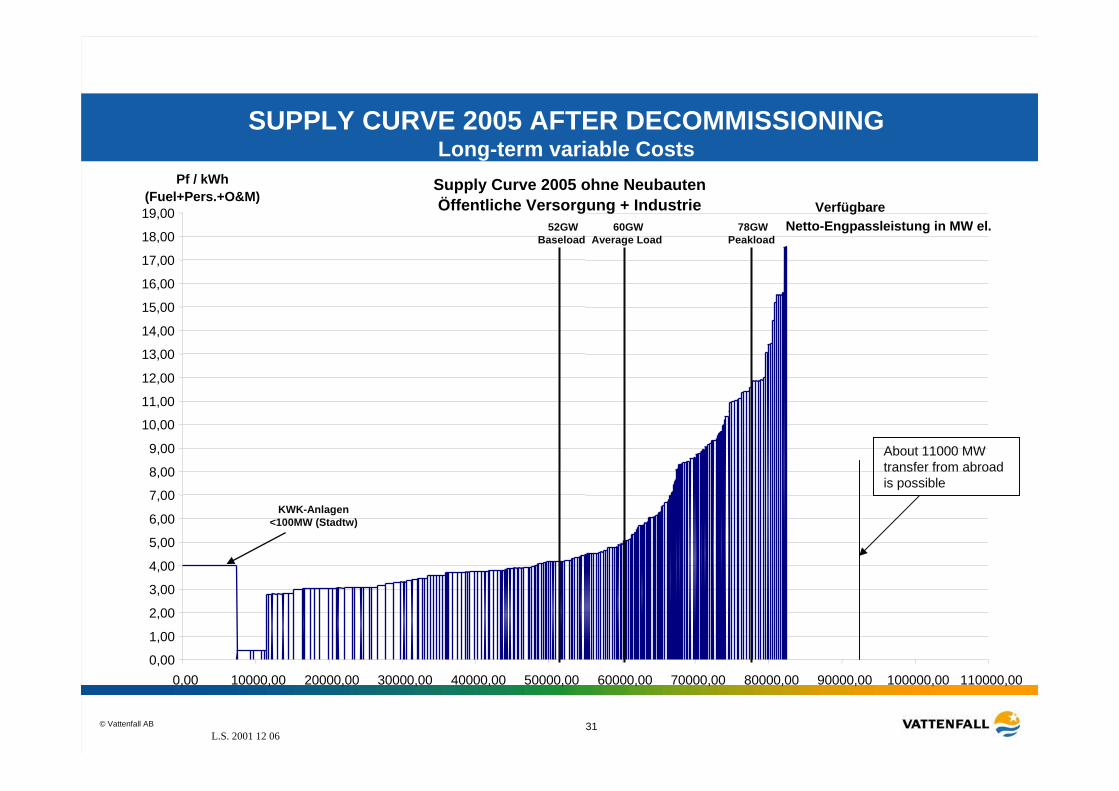
© Vattenfall AB 31
Supply Curve 2005 ohne NeubautenÖffentliche Versorgung + Industrie
0,00
1,00
2,00
3,00
4,00
5,00
6,00
7,00
8,00
9,00
10,00
11,00
12,00
13,00
14,00
15,00
16,00
17,00
18,00
19,00
0,00 10000,00 20000,00 30000,00 40000,00 50000,00 60000,00 70000,00 80000,00 90000,00 100000,00 110000,00
VerfügbareNetto-Engpassleistung in MW el.
Pf / kWh (Fuel+Pers.+O&M)
SUPPLY CURVE 2005 AFTER DECOMMISSIONINGLong-term variable Costs
52GWBaseload
78GWPeakload
KWK-Anlagen<100MW (Stadtw)
60GWAverage Load
About 11000 MW transfer from abroadis possible
L.S. 2001 12 06
© Vattenfall AB 32
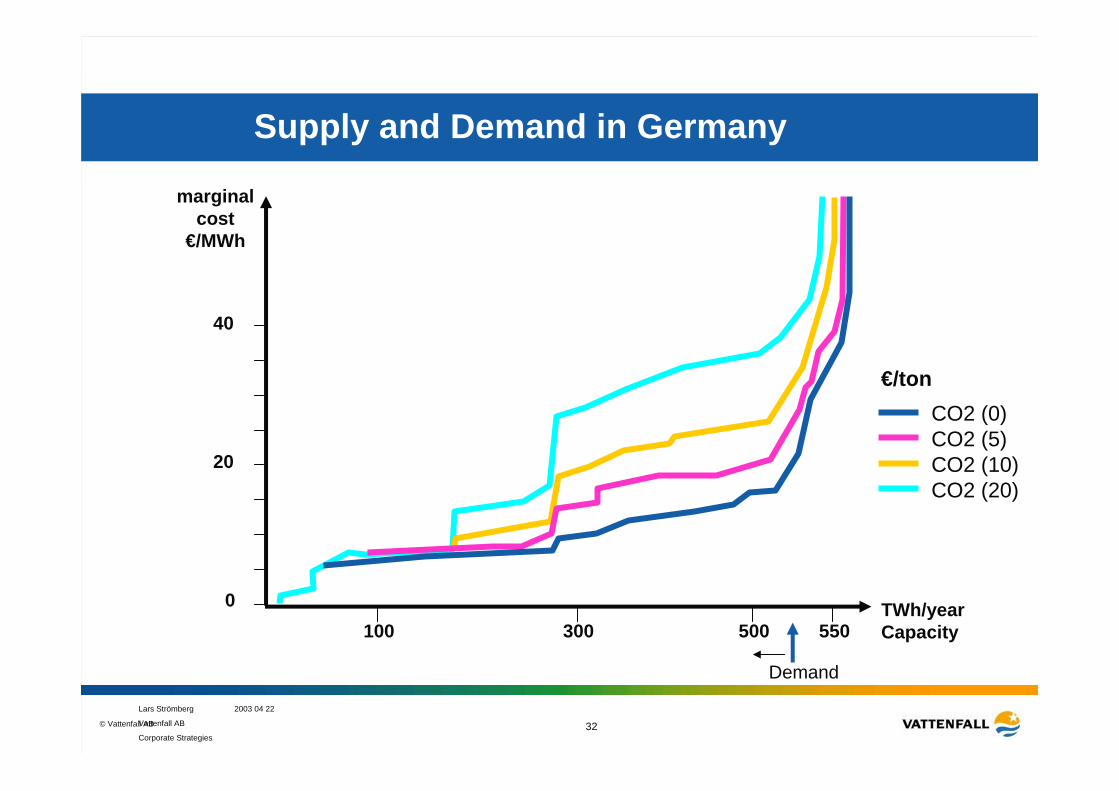
Supply and Demand in Germany
TWh/yearCapacity550500300100
Demand
marginal cost
€/MWh
€/ton
40
20
0
CO2 (0)CO2 (5)CO2 (10)CO2 (20)
Lars Strömberg 2003 04 22
Vattenfall AB
Corporate Strategies

© Vattenfall AB 33
Benchmarking
Oxyfuel alternatives
© Vattenfall AB 34
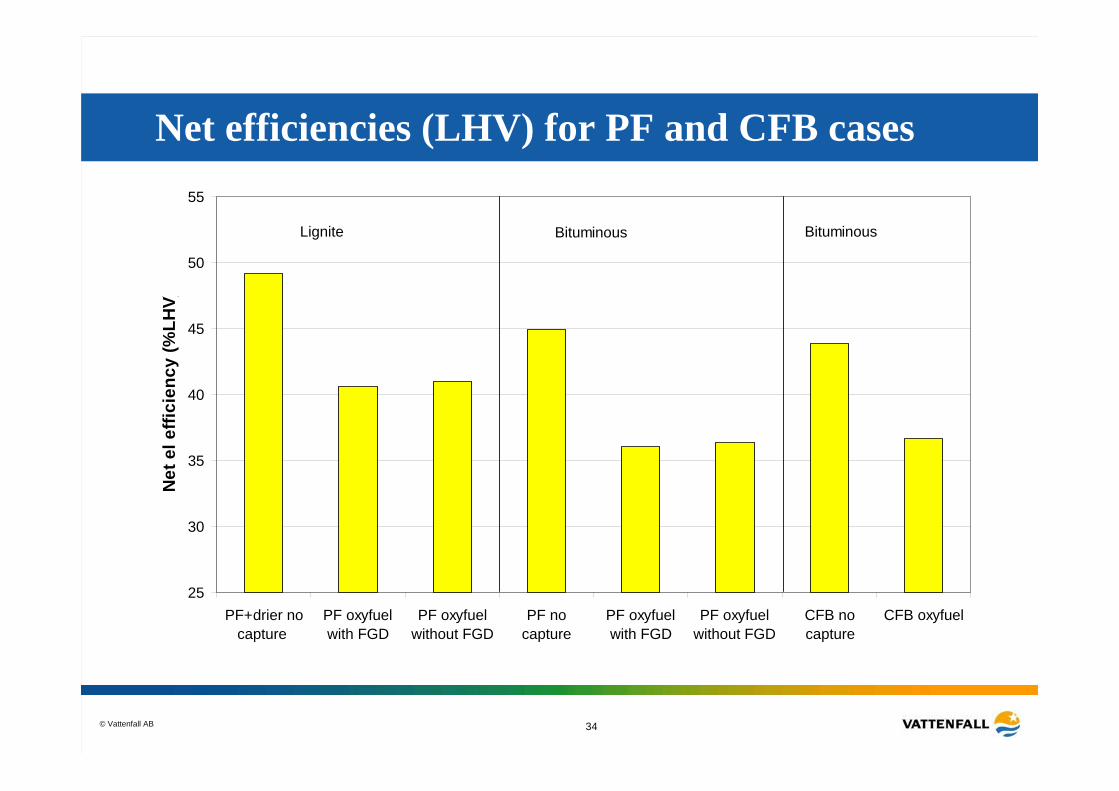
Net efficiencies (LHV) for PF and CFB cases
25
30
35
40
45
50
55
PF+drier nocapture
PF oxyfuelwith FGD
PF oxyfuelwithout FGD
PF nocapture
PF oxyfuelwith FGD
PF oxyfuelwithout FGD
CFB nocapture
CFB oxyfuel
Net
el e
ffici
ency
(%LH
V)
Lignite Bituminous Bituminous
© Vattenfall AB 35
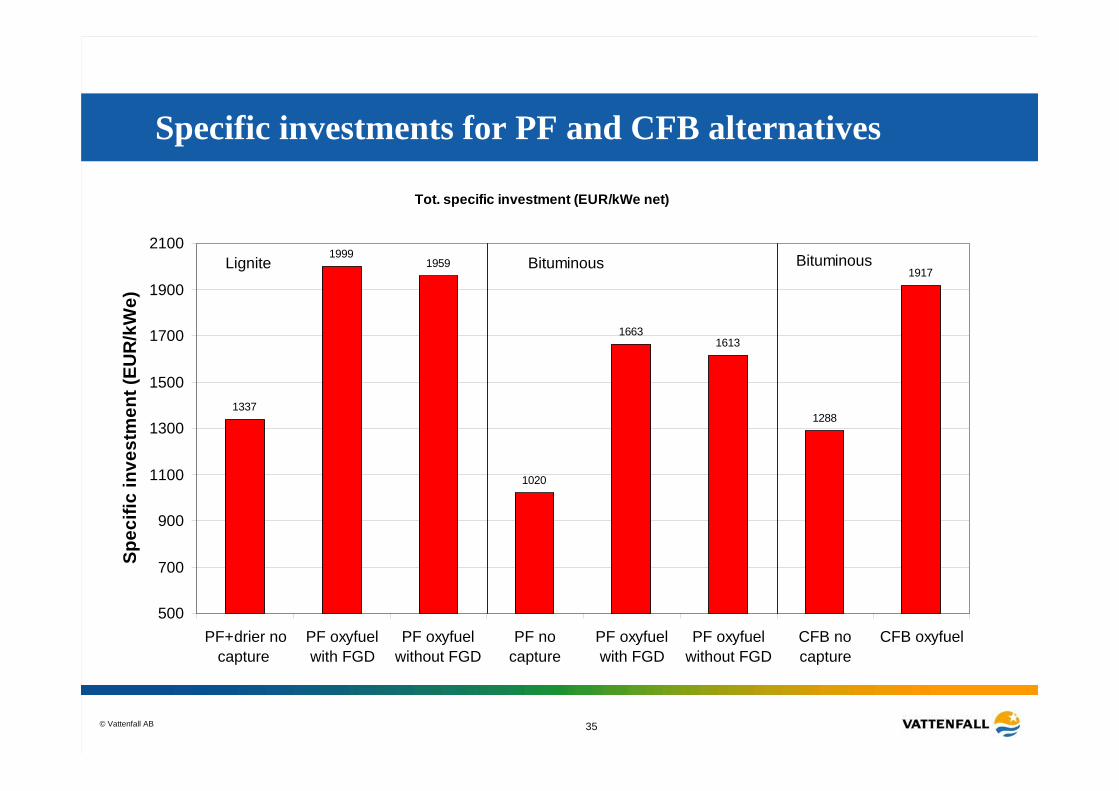
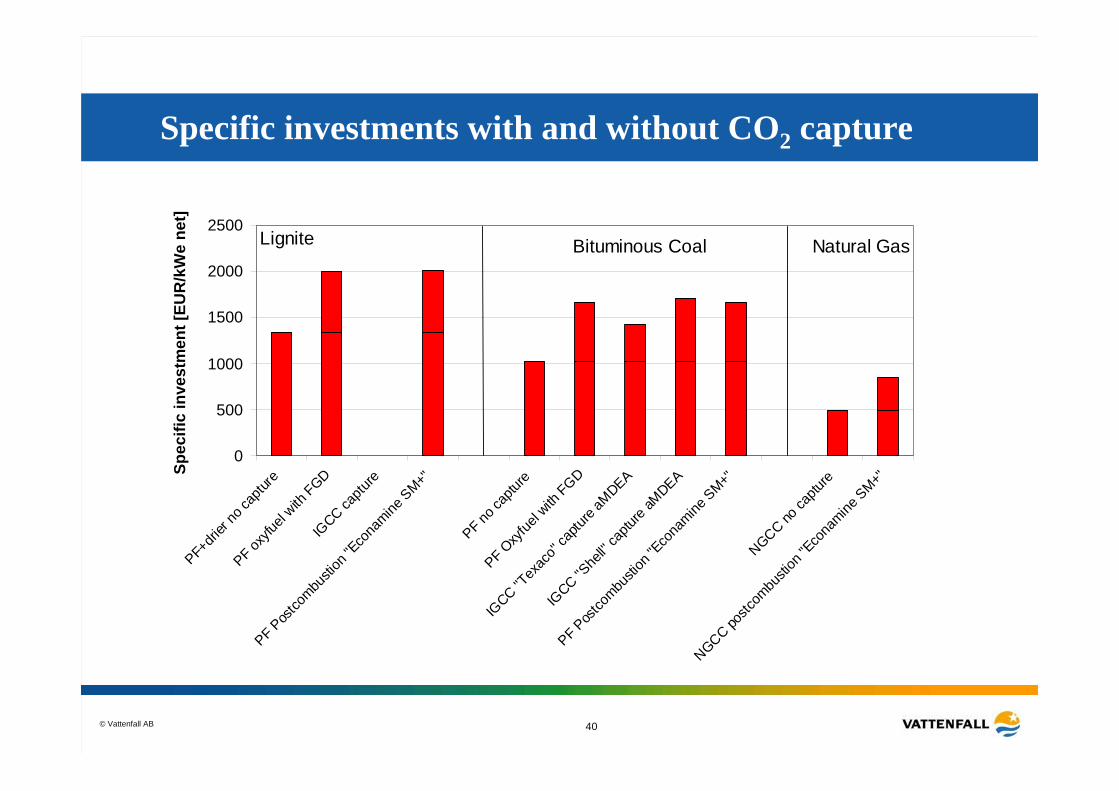
Specific investments for PF and CFB alternatives
Tot. specific investment (EUR/kWe net)
1337
19991959
1020
16631613
1288
1917
500
700
900
1100
1300
1500
1700
1900
2100
PF+drier nocapture
PF oxyfuelwith FGD
PF oxyfuelwithout FGD
PF nocapture
PF oxyfuelwith FGD
PF oxyfuelwithout FGD
CFB nocapture
CFB oxyfuel
Spec
ific
inve
stm
ent (
EUR
/kW
e)
Lignite Bituminous Bituminous
© Vattenfall AB 36
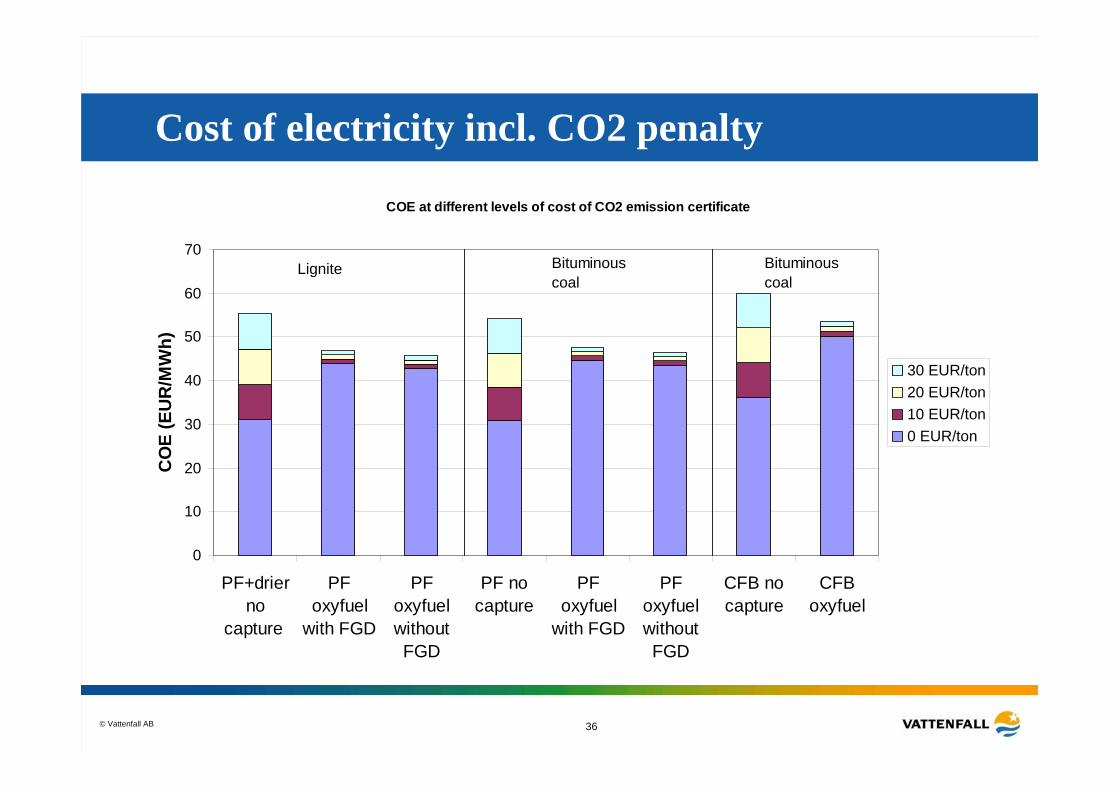
Cost of electricity incl. CO2 penalty
COE at different levels of cost of CO2 emission certificate
0
10
20
30
40
50
60
70
PF+drierno
capture
PFoxyfuel
with FGD
PFoxyfuelwithoutFGD
PF nocapture
PFoxyfuel
with FGD
PFoxyfuelwithoutFGD
CFB nocapture
CFBoxyfuel
CO
E (E
UR
/MW
h)
30 EUR/ton20 EUR/ton10 EUR/ton0 EUR/ton
Lignite Bituminous coal
Bituminous coal
© Vattenfall AB 37
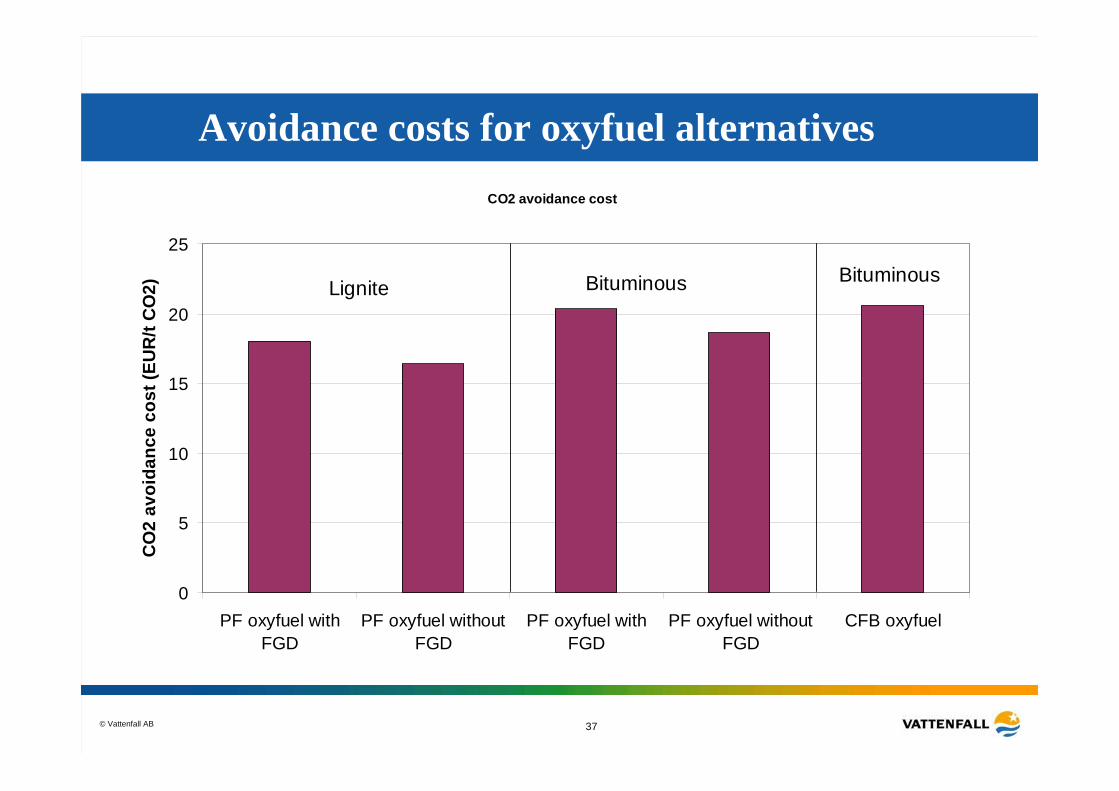
Avoidance costs for oxyfuel alternativesCO2 avoidance cost
0
5
10
15
20
25
PF oxyfuel withFGD
PF oxyfuel withoutFGD
PF oxyfuel withFGD
PF oxyfuel withoutFGD
CFB oxyfuel
CO
2 av
oida
nce
cost
(EU
R/t
CO
2) Lignite Bituminous Bituminous
© Vattenfall AB 38
Benchmarking
Oxyfuel PF alternativevs.
Other generation technologies and fuels
© Vattenfall AB 39
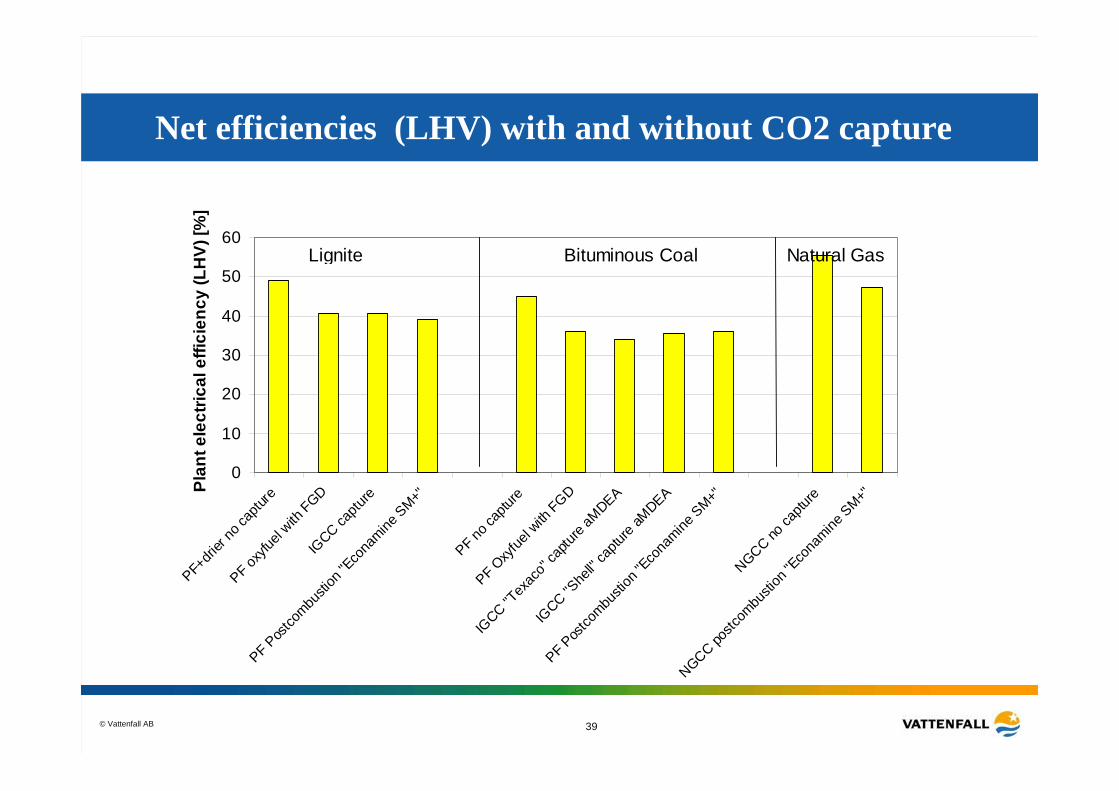
Net efficiencies (LHV) with and without CO2 capture
0
10
20
30
40
50
60
PF+dri
er no
captu
re
PF oxy
fuel w
ith F
GDIG
CC captu
re
PF Pos
tcombu
stion
"Eco
namine
SM+"
PF no c
aptur
e
PF Oxy
fuel w
ith FGD
IGCC "T
exac
o" ca
pture
aMDEA
IGCC "S
hell"
captu
re aM
DEA
PF Pos
tcombu
stion
"Eco
namine
SM+"
NGCC no ca
pture
NGCC postc
ombu
stion
"Eco
namine
SM+"
Plan
t ele
ctric
al e
ffici
ency
(LH
V) [%
]
Natural GasLignite Bituminous Coal
© Vattenfall AB 40
Specific investments with and without CO2 capture
0
500
1000
1500
2000
2500
PF+dri
er no
captu
re
PF oxy
fuel w
ith F
GDIG
CC captu
re
PF Pos
tcombu
stion
"Eco
namine
SM+"
PF no c
aptur
e
PF Oxy
fuel w
ith FGD
IGCC "T
exac
o" ca
pture
aMDEA
IGCC "S
hell"
captu
re aM
DEA
PF Pos
tcombu
stion
"Eco
namine
SM+"
NGCC no ca
pture
NGCC postc
ombu
stion
"Eco
namine
SM+"
Spec
ific
inve
stm
ent [
EUR
/kW
e ne
t]
Natural GasLignite Bituminous Coal

© Vattenfall AB 41
Cost of electricity for different options
0
5
10
15
20
25
30
35
40
45
50
PF+dri
er no
captu
re
PF oxy
fuel w
ith FGD
IGCC ca
pture
PF Pos
tcombu
stion
"Eco
namine
SM+"
PF no c
aptur
e
PF Oxy
fuel w
ith FGD
IGCC "T
exac
o" ca
pture
aMDEA
IGCC "S
hell"
captu
re aM
DEA
PF Pos
tcombu
stion
"Eco
namine
SM+"NGCC no
captu
re
NGCC postc
ombu
stion
"Eco
namine
SM+"
CO
E (€
/MW
he)
Fuel cost EUR/MWheO&M cost variable EUR/MWheO&M cost fixed EUR/MWheCapital cost EUR/MWhe
Lignite Bituminous coal Natural Gas
© Vattenfall AB 42
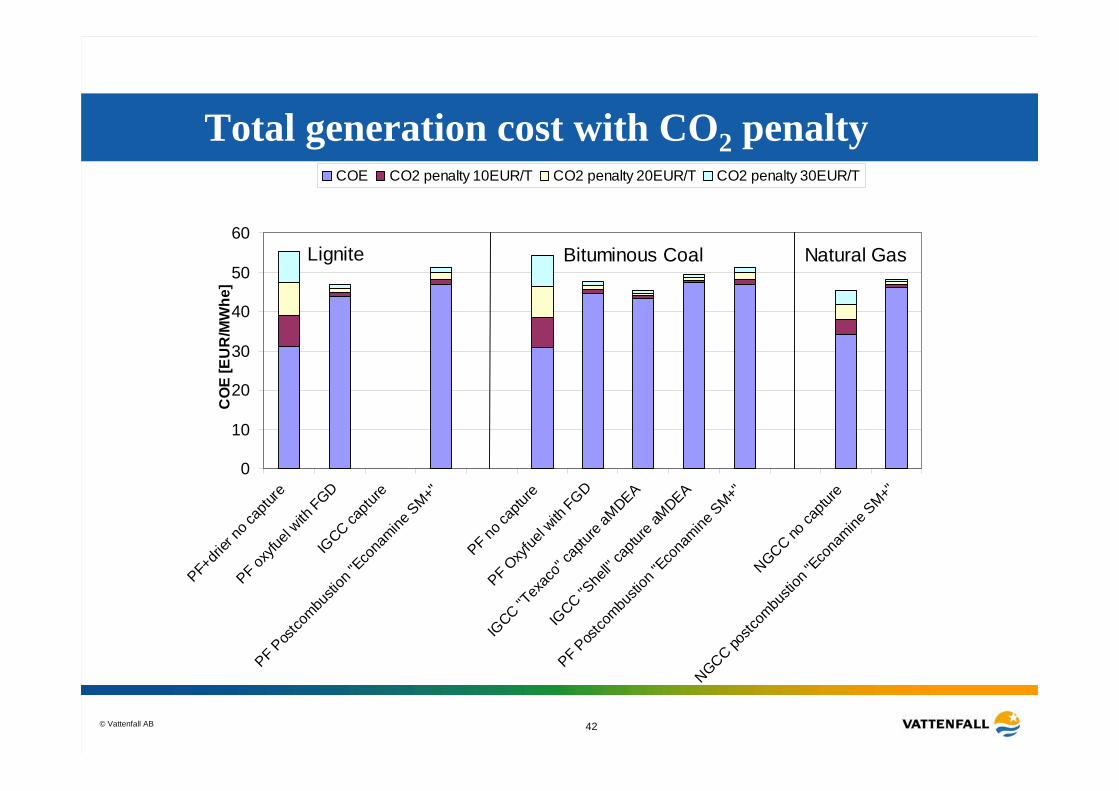
Total generation cost with CO2 penalty
0
10
20
30
40
50
60
PF+dri
er no
captu
re
PF oxy
fuel w
ith FGD
IGCC ca
pture
PF Pos
tcombu
stion
"Eco
namine
SM+"
PF no c
aptur
e
PF Oxy
fuel w
ith FGD
IGCC "T
exac
o" ca
pture
aMDEA
IGCC "S
hell"
captu
re aM
DEA
PF Pos
tcombu
stion
"Eco
namine
SM+"NGCC no
captu
re
NGCC postc
ombu
stion
"Eco
namine
SM+"C
OE
[EU
R/M
Whe
]
COE CO2 penalty 10EUR/T CO2 penalty 20EUR/T CO2 penalty 30EUR/T
Natural GasLignite Bituminous Coal
© Vattenfall AB 43
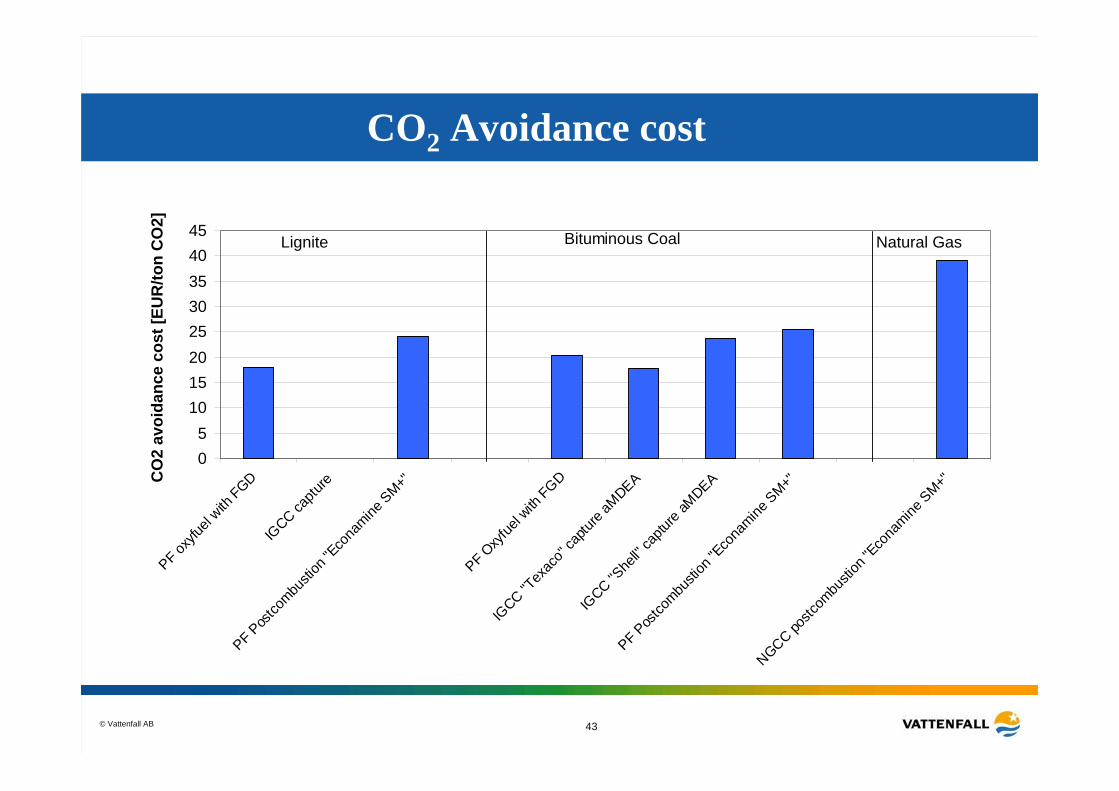
CO2 Avoidance cost
05
1015202530354045
PF oxy
fuel w
ith FGD
IGCC ca
pture
PF Pos
tcombu
stion
"Eco
namine
SM+"
PF Oxy
fuel w
ith FGD
IGCC "T
exac
o" ca
pture
aMDEA
IGCC "S
hell"
captu
re aM
DEA
PF Pos
tcombu
stion
"Eco
namine
SM+"
NGCC postc
ombu
stion
"Eco
namine
SM+"CO
2 av
oida
nce
cost
[EU
R/to
n C
O2]
Natural GasLignite Bituminous Coal
© Vattenfall AB 44
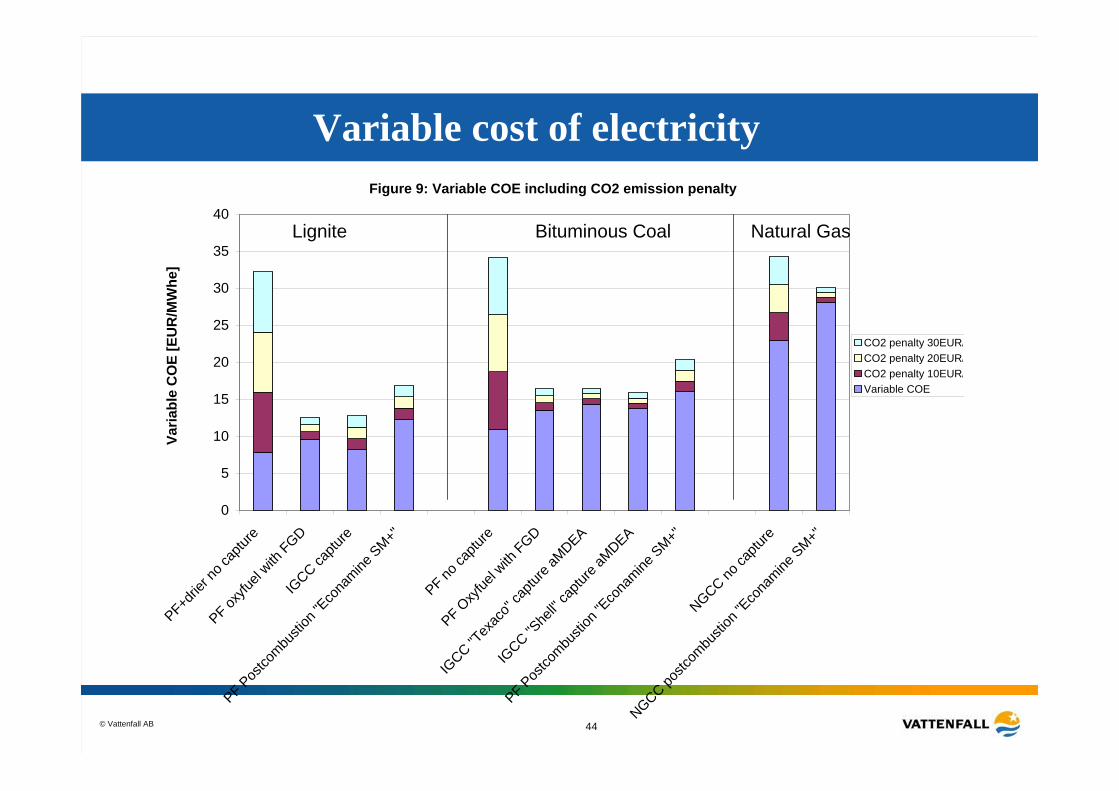
Variable cost of electricityFigure 9: Variable COE including CO2 emission penalty
0
5
10
15
20
25
30
35
40
PF+drie
r no c
aptur
e
PF oxyfu
el with
FGDIG
CC captu
re
PF Pos
tcombu
stion
"Eco
namine
SM+"
PF no ca
pture
PF Oxy
fuel w
ith FGD
IGCC "T
exac
o" ca
pture
aMDEA
IGCC "S
hell"
captu
re aM
DEA
PF Pos
tcombu
stion
"Eco
namine
SM+"
NGCC no ca
pture
NGCC postc
ombu
stion
"Eco
namine
SM+"
Varia
ble
CO
E [E
UR
/MW
he]
CO2 penalty 30EUR/CO2 penalty 20EUR/CO2 penalty 10EUR/Variable COE
Natural GasLignite Bituminous Coal
© Vattenfall AB 45
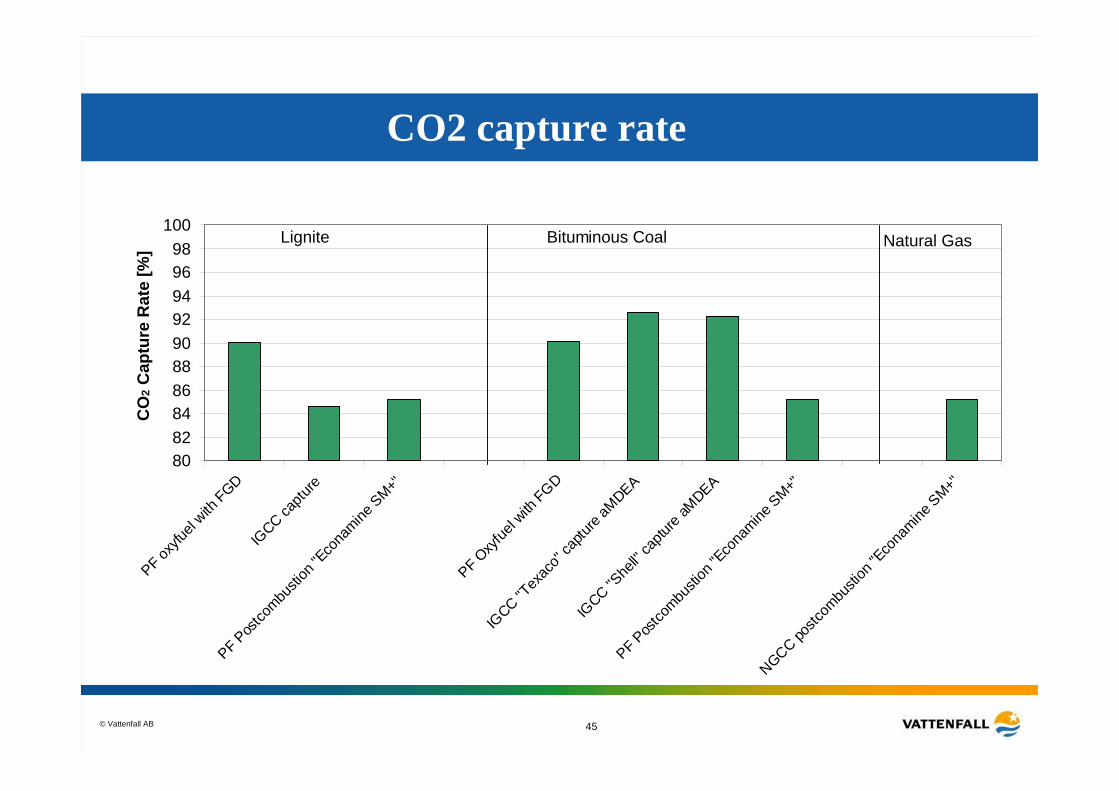
CO2 capture rate
80828486889092949698
100
PF oxy
fuel w
ith FGD
IGCC ca
pture
PF Pos
tcombu
stion
"Eco
namine
SM+"
PF Oxy
fuel w
ith FGD
IGCC "T
exac
o" ca
pture
aMDEA
IGCC "S
hell"
captu
re aM
DEA
PF Pos
tcombu
stion
"Eco
namine
SM+"
NGCC postc
ombu
stion
"Eco
namine
SM+"C
O2 C
aptu
re R
ate
[%] Natural GasLignite Bituminous Coal
© Vattenfall AB 46
Conclusions
Exchange of plants reduction of CO2
© Vattenfall AB 47
Capture technologies
• All capture alternatives based on coal show COEs differing a little (43 - 47 €/MWhe)
– Oxyfuel is a promising alternative – around 45 €/MWhe for both bituminous coal and lignite
• Cost of electricity for capture alternatives with natural gas are at similar level as the the ones for coal, considering the uncertainties in the estimates
• CO2 avoidance cost around 20 €/ton CO2 (16-24 €/ton) for coal– Note that the IGCC case uses IGCC as reference case, the CO2 avoidance cost
increases if PF is used as reference• CO2 avoidance cost around 40 €/ton for natural gas cases
• With a CO2 emission penalty of 20 €/ton, the competition is between coal fired plants with capture and natural gas plants without capture.

© Vattenfall AB 48
Capture technologies year 2020 status
• All capture alternatives based on coal show similar COEs (34 - 38 €/MWhe)– For the oxyfuel case, only improvements in basic steam turbine
technology has been accounted for, there is still a potential to improve process parts related to the oxyfuel conceptand air separation. Oxyfuel is still a promising alternative!
• Capture alternatives for natural gas are at similar level as the the ones for coal, considering the uncertainties in the estimates
• CO2 avoidance cost around 17 -18 €/ton CO2 for PF coal, IGCC 2020 about 7 €/ton
– OBS that IGCC case uses IGCC as reference case, the CO2 avoidance cost increases if PF is used as a reference
• CO2 avoidance cost around 27 €/ton for natural gas cases
© Vattenfall AB 49
1. Numerous different views on costs for technologies exist. Our internal studies point at oxyfuel as the least expensive.
2. We have investigated the IGCC technology thoroughly. We do not see it competitive unless very specific conditions. It is calculated slightly more expensive at present.
– The availability and the reliability must be increased considerably and technical performance must be increased
3. Post combustion is commercially available at present up to the size 500 MW. It is calculated more expensive at present.
– The energy consumption for regenerating the absorbent must come down considerably to make it competitive.
4. We have good experience from PC technology. We operate 7 large supercritical units with hard coal and lignite. We build 3 new at present. Our German competitors also build several new units at present.
CO2 free power plant - Why oxyfuel technology ?
© Vattenfall AB 50
Computer simulation of the new units in Hamburg (Moorburg) 2 x 750 MW hard coal
© Vattenfall AB 51
Computer simulation of the new Boxberg R unit660 MW- lignite
© Vattenfall AB 52
Back up
CO2 free power plant
© Vattenfall AB 53
0
10
20
30
40
50
60
70
IEA GHGPF 2004
postcomb.
IEA GHGPF 2020
postcomb.
Mitsui 2004O2/CO2
PF
Mitsui 2020O2/CO2
PF
IEA GHGIGCC 2003pre-comb.
IEA GHGIGCC 2020pre-comb.
OxyfuelWFGD
OxyfuelwithoutWFGD
IEA GHG2004
NGCCpostcomb.
IEA GHG2020
NGCCpostcomb.
Mitsui 2004O2/CO2NGCC
Plan
t ele
ctri
cal e
ffici
ency
(LHV
) [%
]
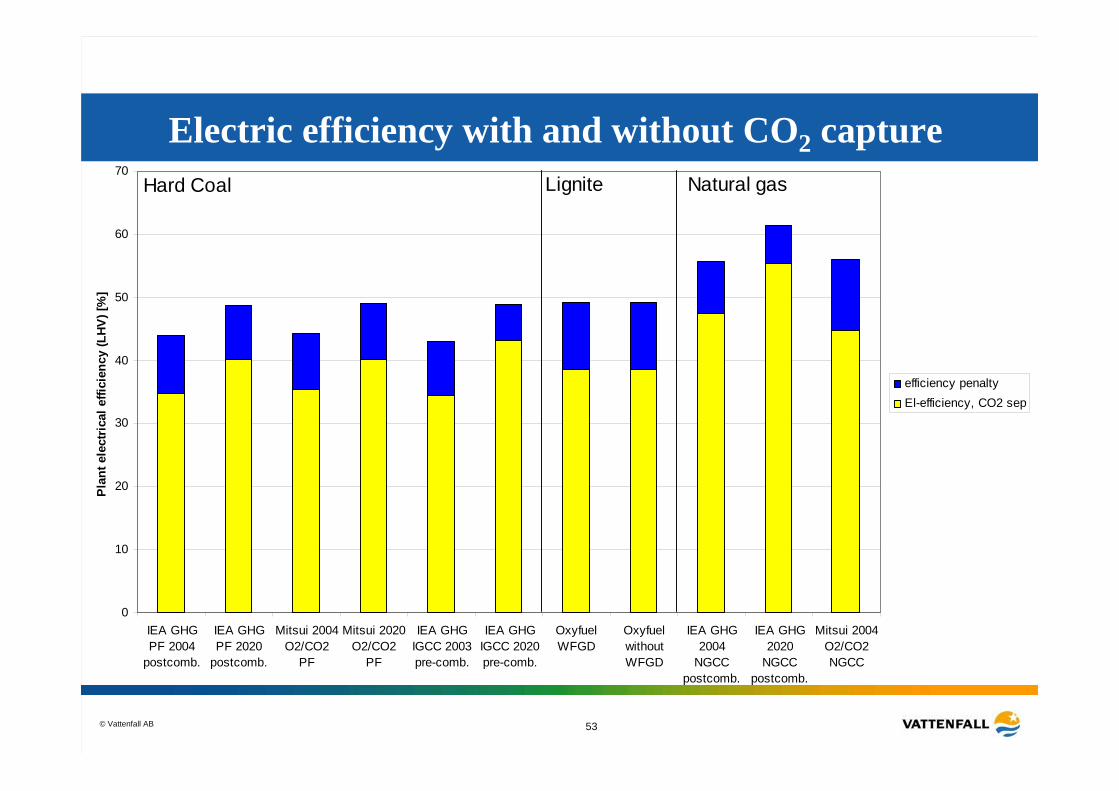
efficiency penaltyEl-efficiency, CO2 sep
Hard Coal Natural gasLignite
Electric efficiency with and without CO2 capture
© Vattenfall AB 54
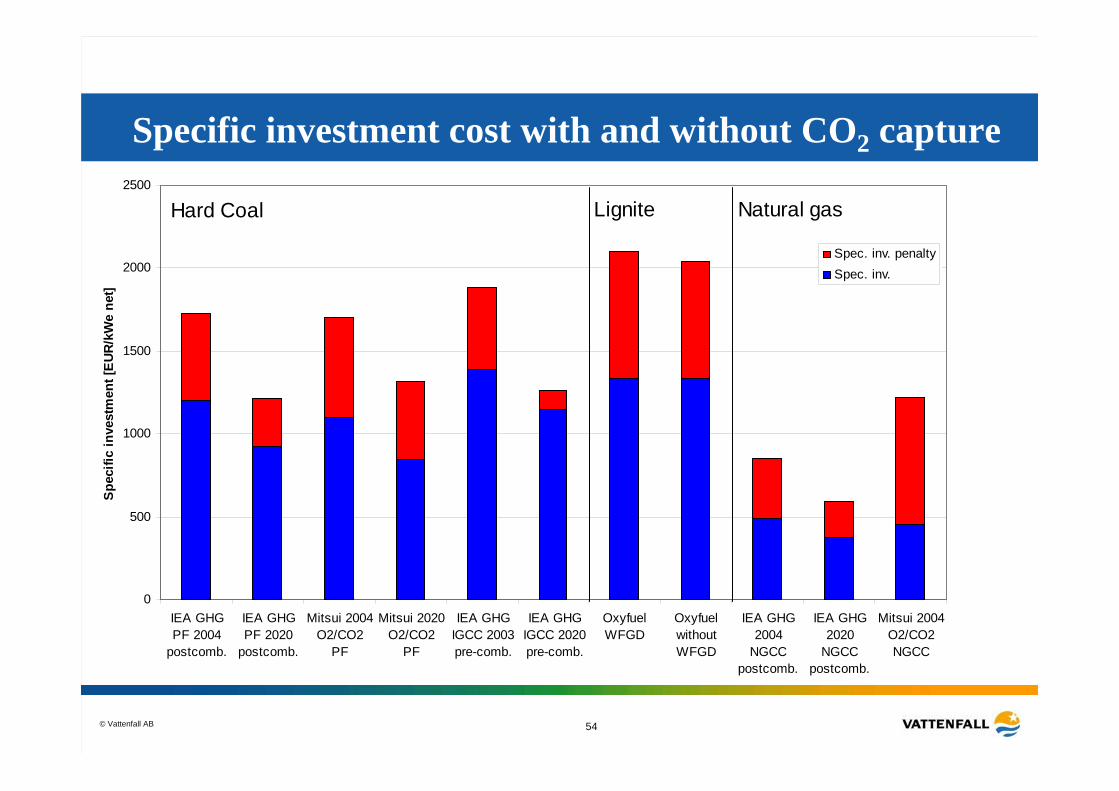
0
500
1000
1500
2000
2500
IEA GHGPF 2004
postcomb.
IEA GHGPF 2020
postcomb.
Mitsui 2004O2/CO2
PF
Mitsui 2020O2/CO2
PF
IEA GHGIGCC 2003pre-comb.
IEA GHGIGCC 2020pre-comb.
OxyfuelWFGD
OxyfuelwithoutWFGD
IEA GHG2004
NGCCpostcomb.
IEA GHG2020
NGCCpostcomb.
Mitsui 2004O2/CO2NGCC
Spec
ific
inve
stm
ent [
EUR/
kWe
net]
Spec. inv. penaltySpec. inv.
Hard Coal Natural gasLignite
Specific investment cost with and without CO2 capture
© Vattenfall AB 55
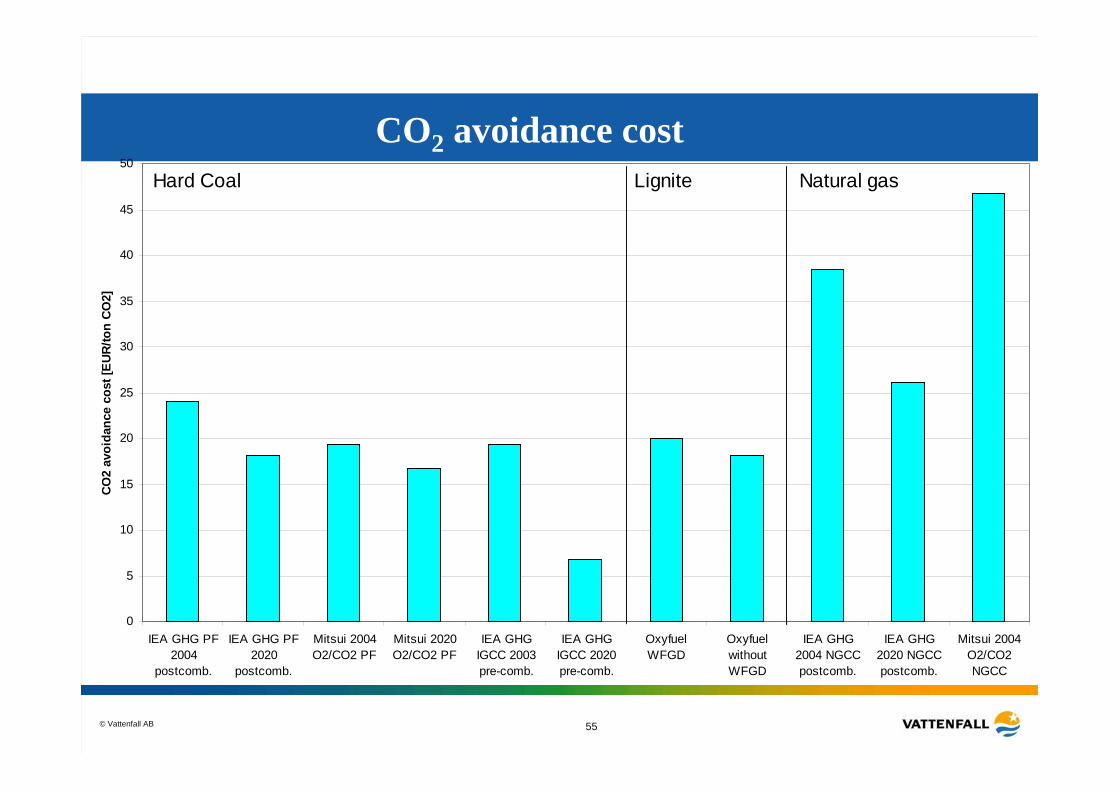
0
5
10
15
20
25
30
35
40
45
50
IEA GHG PF2004
postcomb.
IEA GHG PF2020
postcomb.
Mitsui 2004O2/CO2 PF
Mitsui 2020O2/CO2 PF
IEA GHGIGCC 2003pre-comb.
IEA GHGIGCC 2020pre-comb.
OxyfuelWFGD
OxyfuelwithoutWFGD
IEA GHG2004 NGCCpostcomb.
IEA GHG2020 NGCCpostcomb.
Mitsui 2004O2/CO2NGCC
CO
2 av
oida
nce
cost
[EU
R/to
n CO
2]
Hard Coal Natural gasLignite
CO2 avoidance cost
© Vattenfall AB 56
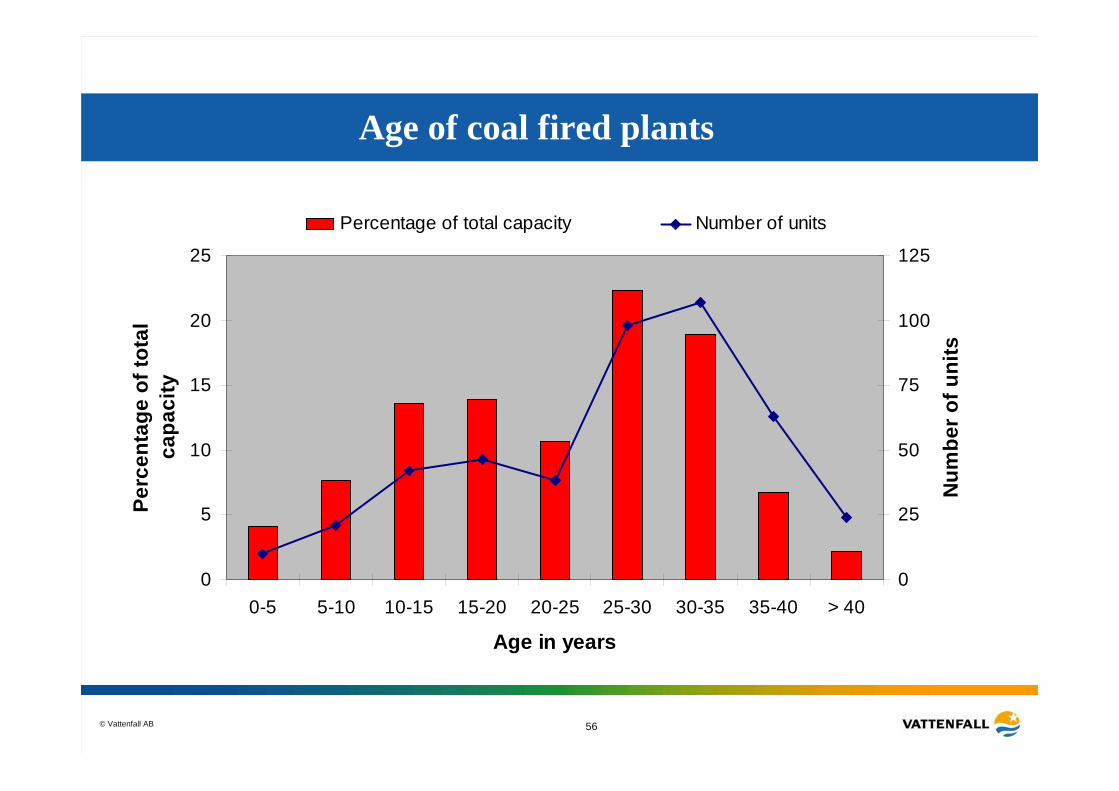
Age of coal fired plants
0
5
10
15
20
25
0-5 5-10 10-15 15-20 20-25 25-30 30-35 35-40 > 40
Age in years
Perc
enta
ge o
f tot
al
capa
city
0
25
50
75
100
125
Num
ber o
f uni
ts
Percentage of total capacity Number of units
© Vattenfall AB 57
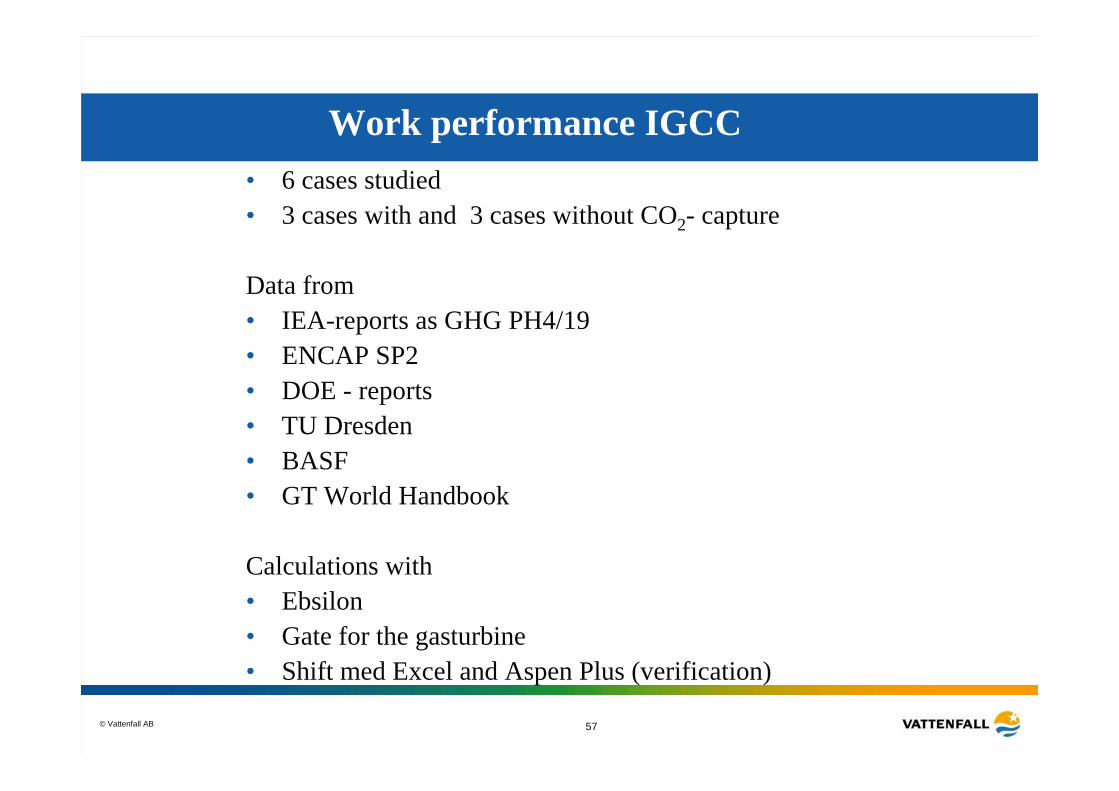
Bas för IGCC-arbete
• 6 cases studied • 3 cases with and 3 cases without CO2- capture
Data from• IEA-reports as GHG PH4/19• ENCAP SP2• DOE - reports• TU Dresden• BASF• GT World Handbook
Calculations with • Ebsilon• Gate for the gasturbine• Shift med Excel and Aspen Plus (verification)
Work performance IGCC
© Vattenfall AB 58
Choice of av Acid gas removal
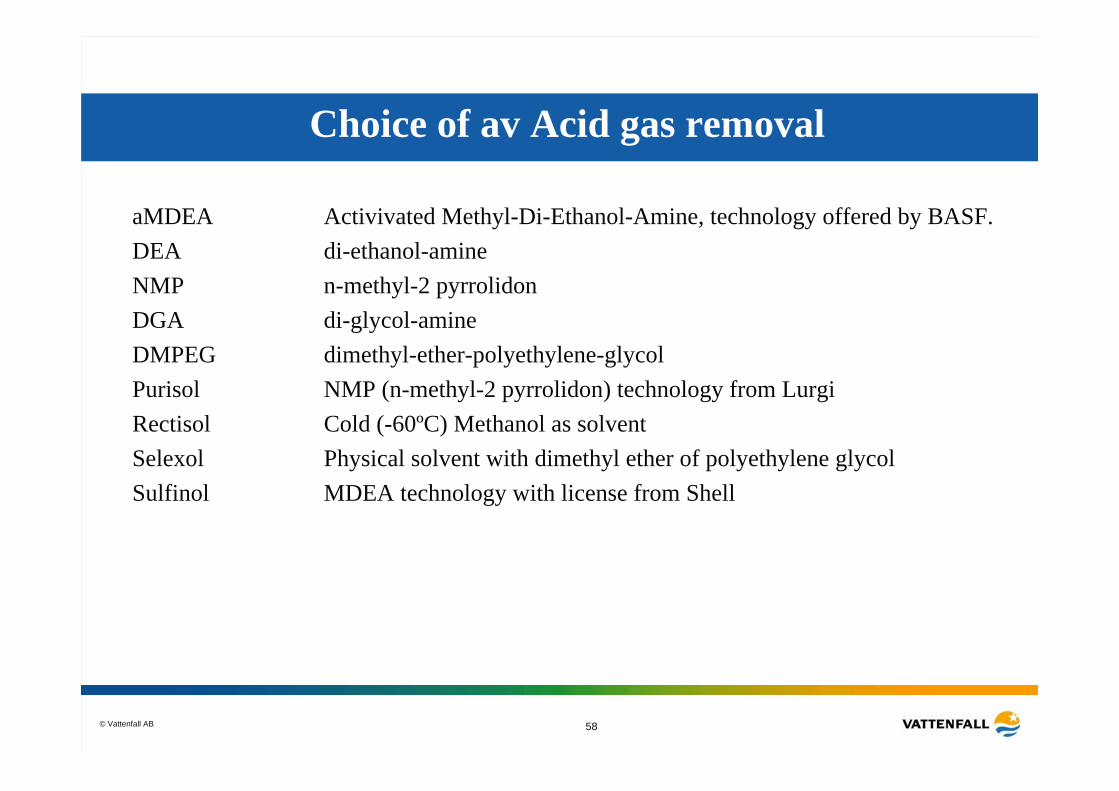
aMDEA Activivated Methyl-Di-Ethanol-Amine, technology offered by BASF.DEA di-ethanol-amineNMP n-methyl-2 pyrrolidonDGA di-glycol-amineDMPEG dimethyl-ether-polyethylene-glycolPurisol NMP (n-methyl-2 pyrrolidon) technology from LurgiRectisol Cold (-60ºC) Methanol as solvent Selexol Physical solvent with dimethyl ether of polyethylene glycolSulfinol MDEA technology with license from Shell
© Vattenfall AB 59
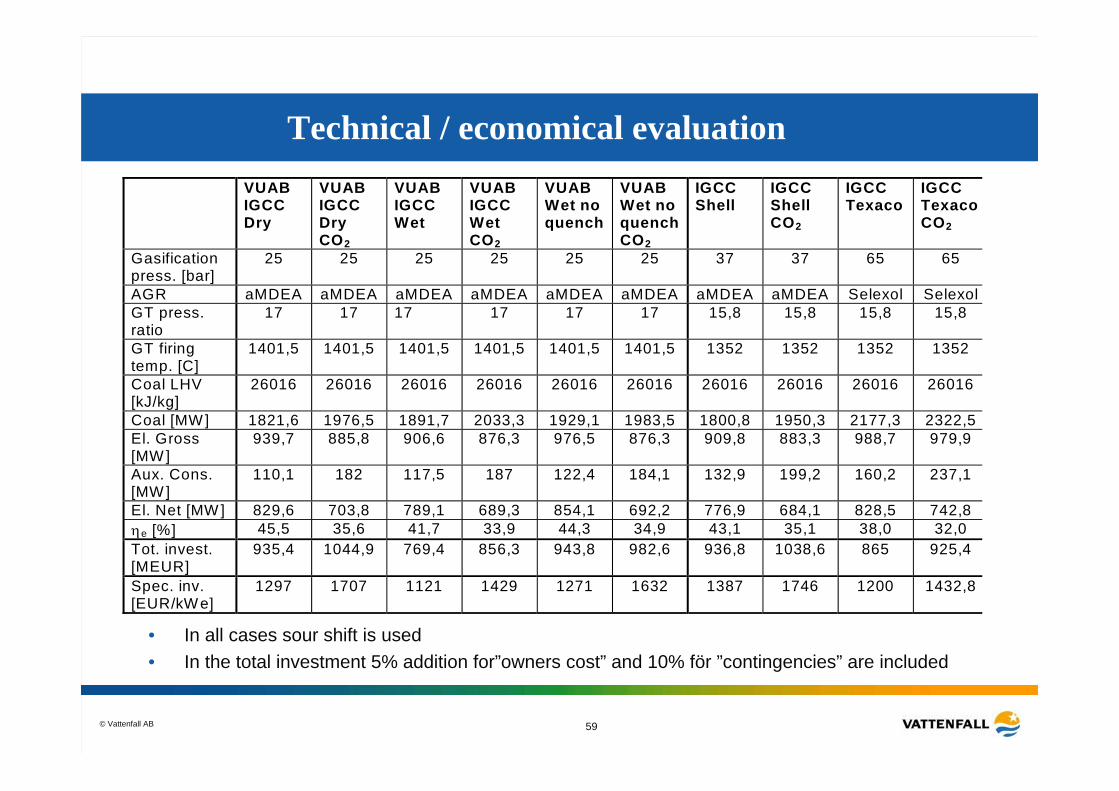
Technical / economical evaluation
• In all cases sour shift is used• In the total investment 5% addition for”owners cost” and 10% för ”contingencies” are included
VUAB IGCC Dry
VUAB IGCC Dry CO2
VUAB IGCC Wet
VUAB IGCC Wet CO2
VUAB Wet no quench
VUAB Wet no quench CO2
IGCC Shell
IGCC Shell CO2
IGCC Texaco
IGCC TexacoCO2
Gasification press. [bar]
25 25 25 25 25 25 37 37 65 65
AGR aMDEA aMDEA aMDEA aMDEA aMDEA aMDEA aMDEA aMDEA Selexol SelexolGT press. ratio
17 17 17 17 17 17 15,8 15,8 15,8 15,8
GT firing temp. [C]
1401,5 1401,5 1401,5 1401,5 1401,5 1401,5 1352 1352 1352 1352
Coal LHV [kJ/kg]
26016 26016 26016 26016 26016 26016 26016 26016 26016 26016
Coal [MW] 1821,6 1976,5 1891,7 2033,3 1929,1 1983,5 1800,8 1950,3 2177,3 2322,5El. Gross [MW ]
939,7 885,8 906,6 876,3 976,5 876,3 909,8 883,3 988,7 979,9
Aux. Cons. [MW ]
110,1 182 117,5 187 122,4 184,1 132,9 199,2 160,2 237,1
El. Net [MW ] 829,6 703,8 789,1 689,3 854,1 692,2 776,9 684,1 828,5 742,8 ηe [%] 45,5 35,6 41,7 33,9 44,3 34,9 43,1 35,1 38,0 32,0 Tot. invest. [MEUR]
935,4 1044,9 769,4 856,3 943,8 982,6 936,8 1038,6 865 925,4
Spec. inv. [EUR/kWe]
1297 1707 1121 1429 1271 1632 1387 1746 1200 1432,8