
Lao STEPS Final Report - who. · PDF file2.7 Instrument and data collection process ... NCD...
186
Lao People’s Democratic Republic Peace, Independence, Democracy, Unity and Prosperity Report on STEPS Survey on Non Communicable Diseases Risk Factors in Vientiane Capital city, Lao PDR Steering Committee - Professor Eksavang Vongvichith M.D.Ph.D. 1 - Professor Dr. Sommone Phounsavath M.D. 1 - Assoc. Prof. Chanphomma Vongsamphane 1 (Lao MoH’s NCD Project Manager) - Assoc. Prof. Bounkong Syhavong M.D. 2 - Assoc. Prof. Bouachanh Rassachack M.D. 2 - Phoukhieng Douangchack M.D. 3 - Assoc. Prof. Khampe Phongsavath M.D. 4 - Supachai Douangchak M.D. 5 (WHO’s NCD Project Manager in Lao PDR) - Other members from the Coordinating and secretariat Committees Research Team - Assoc. Prof. Dr.Vang Chu M.D., Ph.D., FAsCC. 2 Principal Investigator Lao MoH’s NCD Project Manager - Cowan Melanie MPH 5 Technical Officer, WHO, HQ. - Chandavone Phoxay M.D., Ph.D. 1 Research team member - Snong Thongsana MD. MMedSc 3 Research team member - Xaysana Sombandith MD, MMedSc 2 Research team member - Bounmy Sisamouth MD., MMedSc 4 Research team member - Velouvanh Manivong MD., MMedSc 3 Research team member - Itdemer Boundachoundara M.D. 2 Research team member Funding and Technical Assistance: World Health Organization Legend 1. Curative department, Ministry of Health 2. Mahosot hospital, Ministry of Health 3. Mittapab hospital, Ministry of Health 4. Sethathirath hospital, Ministry of Health 5. WHO Final Draft . January 2010
Transcript of Lao STEPS Final Report - who. · PDF file2.7 Instrument and data collection process ... NCD...

Lao People’s Democratic Republic
Peace, Independence, Democracy, Unity and Prosperity
Report on STEPS Survey on Non Communicable Diseases
Risk Factors in Vientiane Capital city, Lao PDR
Steering Committee
- Professor Eksavang Vongvichith M.D.Ph.D.1 - Professor Dr. Sommone Phounsavath M.D. 1 - Assoc. Prof. Chanphomma Vongsamphane1 (Lao MoH’s NCD Project Manager) - Assoc. Prof. Bounkong Syhavong M.D.2 - Assoc. Prof. Bouachanh Rassachack M.D. 2 - Phoukhieng Douangchack M.D.3 - Assoc. Prof. Khampe Phongsavath M.D. 4 - Supachai Douangchak M.D.5 (WHO’s NCD Project Manager in Lao PDR) - Other members from the Coordinating and secretariat Committees
Research Team
- Assoc. Prof. Dr.Vang Chu M.D., Ph.D., FAsCC.2 Principal Investigator Lao MoH’s NCD Project Manager
- Cowan Melanie MPH 5 Technical Officer, WHO, HQ. - Chandavone Phoxay M.D., Ph.D. 1 Research team member - Snong Thongsana MD. MMedSc3 Research team member - Xaysana Sombandith MD, MMedSc2 Research team member - Bounmy Sisamouth MD., MMedSc4 Research team member - Velouvanh Manivong MD., MMedSc3 Research team member - Itdemer Boundachoundara M.D.2 Research team member
Funding and Technical Assistance: World Health Organization
Legend
1. Curative department, Ministry of Health 2. Mahosot hospital, Ministry of Health 3. Mittapab hospital, Ministry of Health 4. Sethathirath hospital, Ministry of Health 5. WHO
Final Draft . January 2010

2
Table of Content
Table of Content ................................................................................................................. 2
Executive Summary............................................................................................................ 5
I Introduction ............................................................................................................... 12
1.1 Background of Lao PDR .................................................................................................... 12
1.2 Chronic Diseases and their risk Factors in Laos................................................................ 12
1.2.1 Chronic Diseases................................................................................................... 12
1.2.2 Non Communicable Diseases Risk Factors........................................................... 14
1.3 Problem Statement .......................................................................................................... 15
1.4 objectives ......................................................................................................................... 16
1.4.1 General Objectives ................................................................................................ 16
1.4.2 Specific Objectives................................................................................................. 16
II Methods ..................................................................................................................... 17
2.1 Scope ................................................................................................................................ 17
2.2 Study Population .............................................................................................................. 17
2.3 Sample size ....................................................................................................................... 17
2.4 Sampling ........................................................................................................................... 18
2.5 Timeframe ........................................................................................................................ 18
2.7 Instrument and data collection process ........................................................................... 19
2.7.1 Instrument.............................................................................................................. 19
2.7.2 Data collection process.......................................................................................... 19
2.8 Data entry......................................................................................................................... 20
2.9 Data Analysis .................................................................................................................... 20
III Results................................................................................................................... 21
3.1 Demographics................................................................................................................... 21
3.2 NCD Risk Factors............................................................................................................... 24

3
3.2.1 Tobacco Use .......................................................................................................... 24
3.2.2 Alcohol Consumption ............................................................................................ 25
3.2.3 Diet ........................................................................................................................ 27
3.2.4 Physical Activity ..................................................................................................... 30
3.2.5 Health History........................................................................................................ 34
3.2.6 Body Mass Index (BMI).......................................................................................... 35
3.2.7 Blood pressure....................................................................................................... 36
3.2.8 Waist and hip circumference................................................................................. 37
3.2.9 Heart rate .............................................................................................................. 37
3.2.10 Combined Risk Factors .......................................................................................... 38
IV Discussion ............................................................................................................. 40
4.1 Representation................................................................................................................. 40
4.2 Key Results and New Knowledge ..................................................................................... 40
V Conclusion and Recommendations ........................................................................... 42
5.1 Conclusions.................................................................................................................... 42
5.2 Recommendations......................................................................................................... 44
VI References............................................................................................................. 45
APPENDICES .................................................................................................................. 49
Appendix A: Kish Method used to randomize participant to this study................................ 49
1 Kish Household List ..................................................................................................... 49
2 Kish Household Coversheet .......................................................................................... 50
Appendix B: Information Sheet and Consent Forms ............................................................. 52
Appendix C Questionnaire form .......................................................................................... 54
Appendix D: Interview Tracking Form.................................................................................... 93
Appendix E: Show Cards ........................................................................................................ 94
Appendix F Workshop on planning and implementation of ............................................... 98
TEPWISE approach to surveillance of chronic Diseases Risk Factors ........................................ 98

4
Appendix G Data Collector Training Workshop Contents................................................... 101
Appendix H: Declarations..................................................................................................... 105
Appendix I: Data collectors training workshop agenda .......................................................... 106
Appendix J: Lao STEPS Data Book............................................................................................ 108
5
Executive Summary
BACKGROUND AND PURPOSE :
Ongoing surveillance of changes in population levels of the major NCD risk factors is crucial if we are to understand the impact of preventive efforts. Previous studies performed in Lao PDR have shown that major chronic diseases were the main causes of death in Laos. The main causes of cardiovascular death have been stroke, heart failure and acute myocardial. No survey on NCD risk factors has ever been conducted in Laos and little data concerning to NCD risk factors is available. An up-to-date National NCD policy/action plan is not yet available. The aim of this
study is to determine the burden of NCD risk factors in Laos.
METHODOLOGY:
The participants were selected from across the 9 health districts of Vientiane Capital City. In order to draw a representative probability sample, a list of all 497 villages within these 9 health districts was obtained from the Vientiane Capital City Health Department. This list was generated in early 2005. Probability proportional to size sampling was used to select 72 villages from this list. For each selected village, a list of households was obtained from the head of each village and between 6 and 222 households, with more households drawn from larger villages were selected from each village using simple random sampling. One participant was then selected from each household using the Kish Method at the time of first contact between the data collector and a member of the household.
The generic STEPS Instrument was slightly modified for use in the Lao STEPS survey. Only STEP 1 and 2 were included in the survey. Step 1 contains questions on the basic demographics of the respondents: age, sex, level of education, ethnicity, employment status and income. Following this section are questions on the key behavioral risk factors for NCDs, these include: tobacco use, alcohol consumption, diet and physical activity. STEP 1 also included questions about history of raised blood pressure and diabetes. Show cards were used for many questions to help participants understand and give appropriate answers. In STEP 2, participants had their height, weight, waist and hip circumference, blood pressure, and heart rate measured.
Data were cleaned and analyzed by the survey coordinator with the assistance of WHO staff during a data analysis workshop held in September 2009. Epi Info was used to complete the descriptive analyses using the standard analysis programs provided by WHO, which ensure unclean records are excluded from each analysis. Sample weights, equal to the inverse of the probability of selection, were calculated for all records using the sampling information. The probability of selection at all stages of sampling (village, household and individual) was included in the calculation of these weights. Since non-response was very low and recent data on the age-sex structure of Vientiane Capital City was not available, weighting for non-response and a post-adjustment for age and sex were not done. Weighted complex sample analyses were completed for all measures and standard errors were used to obtain 95% confidence intervals for all results, which were used to check for significant differences between subgroups.

6
RESULTS
A total of 4180 people, 1691 males (40.5%) and 2489 females (59.5%), aged from 25 to
64 years were included in this study. Most of them (95.7%) were from the Lao Lum ethnic group.
The rate of tobacco smoking was significantly higher in males for all age groups. Among current
smokers, 98.7% are current daily smokers and among daily smokers. Men also use more
smokeless tobacco than women (14.6% vs 1.1%). The rate of alcohol drinking was significantly
higher for males (72% versus 36%). The mean number of standard drinks consumed on a
drinking day was 9. The percentage of current drinkers who drank alcohol on 4 or more days in
the past 7 days were 12.4 for males and 8,3 % for females. Among this same group, 59.2% of
men and 65.2% of the women engaged in binge drinking on any day in the last week. The
percentage of population who consumed less than five standard servings of fruit and/or
vegetables on average per day was 36.6%. The type of oil most used to cook was vegetable oil.
The percentage of population attained a high level of physical activity was 64.1%. Males spent
more time in physical activity than female (4 hours versus 2 hours). Seventy percent of physical
activity is related to work and 68.2% of the population does no physical activity during their
recreational time . Mean waist/hip ratio were 0.9 for both sexes and the percentage of population
with heart rate per minute over 100 was 3.1 % for men and 2.9 % for women. Twenty-seven
percent of the population is overweight and 5.8% is obese. Twenty percent of women and 24.9%
of men have raised blood pressure (SBP≥140 and/or DBP≥90) or are on medication for raised
blood pressure. Percentage with raised blood pressure (SBP ≥160 and/or DBP ≥100 mmHg or
currently on medication for raised BP) was 8.9 %. More than 80% of the people with raised blood
pressure were not on medication. Amongst these individuals, 83.8% are not on medication for
raised blood pressure.
The percentage of the population with one or more of the following risk factors was also
calculated:
• current daily smoker
• less than 5 servings of fruits & vegetables per day
• low level of activity (<600 MET -minutes)
• overweight or obese (BMI ≥ 25 kg/m2)
• raised BP (SBP ≥ 140 and/or DBP ≥ 90 mmHg or currently on medication
for raised BP).
In Vientiane capital city 59.8% of the population has 1 or 2 of these risk factors and an additional
9.2% have 3 or more risk factors.
Conclusion / Recommendations
The survey results show that the most relevant non-communicable diseases risk factors
affecting a considerable part of the population of Vientiane capital city are raised blood pressure,
tobacco use among men, excessive alcohol consumption, low exercise and low fruit and
vegetable intake.

7
Lao National Policy or action plans on non-communicable disease prevention and control
is necessary. Interventional programs to prevent and control these risk factors are required. Mass
education program to prevent chronic diseases should be set up.

8
Vientiane Capital City, Lao PDR
STEPS Survey 2008
Fact Sheet
The STEPS survey of chronic disease risk factors in Vientiane Capital City, Lao PDR was carried out from January, 2008
to April, 2008. Vientiane Capital City, Lao PDR carried out Step 1 and Step 2. Socio demographic and behavioural
information was collected in Step 1. Physical measurements such as height, weight and blood pressure were collected in
Step 2. The STEPS survey in Vientiane Capital City, Lao PDR was a population-based survey of adults aged 25-64. A
multi-stage cluster sample design was used to produce representative data for that age range in Vientiane Capital City,
Lao PDR. A total of 4,180 adults participated in the Vientiane Capital City, Lao PDR STEPS survey. The overall response
rate was 99%. A repeat survey is planned for 2013 if funds permit.
Results for adults aged 25-64 years (incl. 95% CI) Both Sexes Males Females
Step 1 Tobacco Use
Percentage who currently smoke tobacco 19.0%
(15.5 – 22.6)
43.2%
(36.9 – 49.6)
2.0%
(1.0 – 3.0)
Percentage who currently smoke tobacco daily 18.8%
(15.2 – 22.3)
42.6%
(36.3 – 49.0)
2.0%
(1.0 – 3.0)
For those who smoke tobacco daily
Average age started smoking (years) 19.7
(19.1– 20.4)
19.7
(19.0 – 20.3) *
Percentage smoking manufactured cigarettes 84.6%
(15.2 – 22.3)
85.0%
(80.5 – 89.6) *
Mean number of manufactured cigarettes smoked per day 10.6
(9.6 – 11.5)
11.0
(10.0 – 11.9) *
Step 1 Alcohol Consumption
Percentage of abstainers (who did not drink alcohol in the
last year )
44.0%
(40.3-47.8%)
21.3%
(17.1-25.5%)
58.9%
(54.3-63.5)
Percentage of current drinkers (who drank alcohol in the past
30 days)
50.0%
(46.5-53.4%)
72.0%
(66.9-77.1%)
35.6%
(31.9-39.3%)
Among current drinkers

9
Percentage who drank alcohol on 4 or more days in the last
week
10.5%
(7.6.13.5%)
12.4%
(9.3-15.5%)
8.3%
(3.1-13.4%)
Percentage who binge drink (men who had 5 or more /
women who had 4 or more drinks on any day in the last
week)
--
59.3%
(53.1-65.4%)
65.2%
(54.2-76.1%)
Step 1 Fruit and Vegetable Consumption (in a typical week)
Mean number of days fruit consumed
5.1
(5.0-5.3)
4.9
(4.6-5.1)
5.3
(5.1-5.5)
Mean number of servings of fruit consumed on average per
day
3.5
(3.3-3.7)
3.4
(3.1-3.8)
3.6
(3.3-3.8)
Mean number of days vegetables consumed
6.5
(6.3-6.6)
6.4
(6.2-6.5)
6.5
(6.4-6.7)
Mean number of servings of vegetables consumed on
average per day
4.7
(4.3-5.1)
4.7
(4.2-5.3)
4.6
(4.2-5.3)
Percentage who ate less than 5 combined servings of fruit
and/or vegetables on average per day
36.6%
(29.9-43.3)
40.2%
(33.8-46.6)
34.5%
(27.2-41.7)
Step 1 Physical Activity
Percentage with low levels of activity+
14.2%
(11.3 – 17.1)
10.4%
(7.7 – 13.1)
16.7%
(13.0 –
20.3)
Percentage with high levels of activity+
64.1%
(61.1 – 67.1)
72.1%
(68.2 – 76.0)
59.1%
(54.0 –
64.2)
Median time spent in physical activity per day (minutes)
180.0
(60.0 –
450.0)
268.6
(70.0 –
480.0)
132.9
(42.9 –
377.1)
Percentage not engaging in vigorous physical activity
52.8%
(49.7 – 56.0)
34.6%
(30.4 – 38.8)
64.3%
(60.7 –
67.8)
+ For definitions of low and high levels of physical activity, please see the GPAQ Analysis Guide, available at:
http://www.who.int/chp/steps/GPAQ/en/index.html

10
Vientiane Capital City, Lao PDR
STEPS Survey 2008
Fact Sheet
Results for adults aged 25-64 years (incl.
95% CI) Both Sexes Males Females
Step 2 Physical Measurements
Mean body mass index - BMI (kg/m2)
23.5
(23.1-23.9)
23.1
(22.6-23.5)
23.7
(23.3-24.1)
Percentage who are overweight (BMI ≥25
kg/m2)
27.4%
(24.7-30.2)
23.8%
(18.8-28.8)
29.9%
(26.9-32.8)
Percentage who are obese (BMI ≥30 kg/m2)
5.8%
(4.1-7.4)
4.5%
(2.4-6.6)
6.6%
(4.9-8.3)
Average waist circumference (cm) -
76.5
(73.8-79.2)
75.2
(73.2-77.2)
Mean systolic blood pressure - SBP (mmHg),
including those currently on medication for
raised BP
124.6
(123.0-126.3)
128.1
(126.3-
129.9)
122.2
(120.4-124.1)
Mean diastolic blood pressure - DBP (mmHg),
including those currently on medication for
raised BP
76.8
(75.8-77.7)
77.8
(76.8-78.9)
76.1
(75.0-77.1)
Percentage with raised BP (SBP ≥140 and/or
DBP ≥90 mmHg or currently on medication for
raised BP)
22.3%
(18.0-26.5)
24.9%
(20.1-29.7)
20.5%
(16.2-24.8)
Percentage with raised BP (SBP ≥160 and/or
DBP ≥100 mmHg or currently on medication for
raised BP)
8.9%
(5.7-12.1)
7.3%
(5.4-9.1)
10.1%
(4.6-15.5)
11
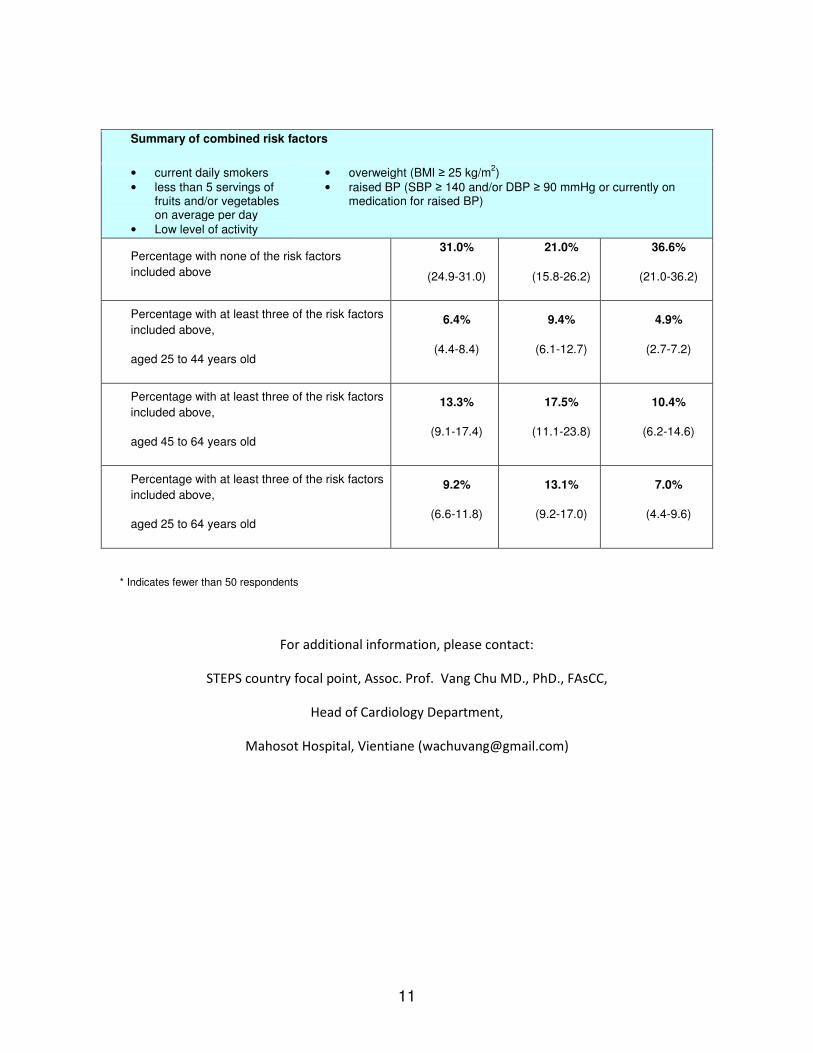
Summary of combined risk factors
• current daily smokers • less than 5 servings of
fruits and/or vegetables on average per day
• Low level of activity
• overweight (BMI ≥ 25 kg/m2)
• raised BP (SBP ≥ 140 and/or DBP ≥ 90 mmHg or currently on medication for raised BP)
Percentage with none of the risk factors
included above
31.0%
(24.9-31.0)
21.0%
(15.8-26.2)
36.6%
(21.0-36.2)
Percentage with at least three of the risk factors
included above,
aged 25 to 44 years old
6.4%
(4.4-8.4)
9.4%
(6.1-12.7)
4.9%
(2.7-7.2)
Percentage with at least three of the risk factors
included above,
aged 45 to 64 years old
13.3%
(9.1-17.4)
17.5%
(11.1-23.8)
10.4%
(6.2-14.6)
Percentage with at least three of the risk factors
included above,
aged 25 to 64 years old
9.2%
(6.6-11.8)
13.1%
(9.2-17.0)
7.0%
(4.4-9.6)
* Indicates fewer than 50 respondents
For additional information, please contact:
STEPS country focal point, Assoc. Prof. Vang Chu MD., PhD., FAsCC,
Head of Cardiology Department,
Mahosot Hospital, Vientiane ([email protected])

12
I Introduction
1.1 Background of Lao PDR
The Lao People’s Democratic Republic is located in Southeast Asia. Laos is a developing
country with an income per capita of $ US 500 (National Statistic Centre, 2005). Consequently,
Laos is ranked as one of the poorest countries in the world. Biomedical medical research has been
under-financed. Little data concerning healthcare issues is available for setting up an appropriate
healthcare prevention program. Although the health status of the population has been improved,
Laos is still marked by low life expectancy with an average of 61 years old. Infectious diseases
such malaria, dengue fever, respiratory infections and gastrointestinal diseases are still the main
healthcare issues. Non communicable diseases such as hypertension and stroke are common in
Laos. Stroke, which is a complication of hypertension account for more than 50% of the cause
cardiovascular mortality (Khamtan A & Vang C, 2004).
1.2 Chronic Diseases and their risk Factors in Laos
1.2.1 Chronic Diseases
The 2005 WHO report showed that the impact of chronic diseases in many low and
middle income countries is steadily growing. It is vital that the increasing importance of chronic
disease is anticipated, understood and acted upon urgently. This requires a new approach by
national leaders who are in a position to strengthen chronic disease prevention and control efforts,
and by the international public health community. It is essential to communicate the latest and
most accurate knowledge and information to front-line health professionals and the public at large
(WHO, 2005a).
The problem is that 80% of chronic disease deaths occur in low and middle income
countries. These deaths occur in equal numbers among men and women. The threat is growing –
the number of people, families and communities afflicted is increasing. This growing threat is an
underappreciated cause of poverty and hinders the economic development of many countries
(WHO, 2005a).
NCDs are steadily growing worldwide and contributed to 60% of all deaths. NCDs share
common risk factors and could be prevented. WHO has suggested that all countries should work

13
together to achieve a 2 % death decrease between now and 2015 to save 36 million lives
worldwide.
It has been reported that heart disease will be the major health challenge of the 21st
century. Unless something is done, it is estimated that by 2020, death due to cardiovascular
diseases will reach 25 million. The greatest rate of increase will be in low and middle-income
countries that can least afford to manage it appropriately. The WHO 2000 health report showed
that in 1999 there were 17 million deaths worldwide due to cardiovascular diseases. About 80 %
of deaths are in low or middle income countries (WHO Health Report, 2000; World Heart
Federation, 2002).
Previous studies performed in Lao PDR have shown that major chronic diseases such as
hypertension, stroke, diabetes, chronic respiratory diseases and lung cancer were the main causes
of death detected in Laos (Phommachanh B & Vang C, 2007). Among cardiovascular
diseases, hypertension was the most common cause of hospitalization (Vang C et al, 2002).
The main causes of cardiovascular death detected have been stroke, heart failure and acute
myocardial infarction (Khamtan A & Vang C, 2004), which are due raised of blood pressure,
glycemia, cholesterol and tobacco smoking (Sombadith X et al, 2005; Inkeomanivong S &
Vang C, 2006; Chuefue CT et al, 2005; Somsamouth B et al, 2005; Yang S et al,2006;
Saytouki S et al, 2007),.
Hypertension, despite its widely recognized high prevalence and associated danger,
remains inadequately treated in the majority of patients (Braunwald, 2001). Research data from
the Mahosot Hospital in Vientiane have shown that hypertension is the most common disease
detected that leads to serious complications such as stroke, cardiac failure and chronic renal
failure (Vang C et al, 1994). Acute stroke, which is closely related to uncontrolled hypertension,
is the common cardiovascular disease admitted to the Coronary Care Unit of the Department of
cardiology of the Mahosot Hospital. The main cause of cardiac mortality detected is due to stroke
(Khamtan A & Vang C. 2004) leading to a significant socio-economic impact (Porsdal & Boysen,
1997; Evers et al, 1997; Jorgensen et al, 1997; Haidinger et al, 1997, Alberts et al. 1996). These
data show that hypertension is a critical issue for the Lao PDR. However, to date, no
epidemiological data is available in Laos concerning why hypertension is so frequent in the Lao
population.
Accordingly, hypertension should be better controlled to prevent stroke morbidity and
mortality in Laos. Many questions remain with no answer. Thus, reliable studies concerning to
hypertension, stroke and their risk factors should be carried out to provide better scientific
evidences on the above health issues to enable the Lao Public Health Ministry to take appropriate
measures or to set up appropriate hypertension and stroke prevention programs to lower the
mortality rate due to stroke in the Lao population.

14
1.2.2 Non Communicable Diseases Risk Factors
Recently the Department of Chronic Diseases and Health Promotion of the World Health
Organization has reported that the impact of chronic diseases in many low and middle income
countries is steadily growing. Previous data have shown that 80% of chronic disease deaths occur
in low and middle income countries (WHO, 2005a).
Common, modifiable risk factors underlie the major chronic diseases. These risk factors
explain the vast majority of chronic disease deaths at all ages, in men and women, and in all parts
of the world. They include: unhealthy diet; physical inactivity; tobacco use (WHO, 2005). WHO
report show that each year at least 4.9 million people die as a result of tobacco use; 1.9 million
people die as a result of physical inactivity; 2.7 million people die as a result of low fruit and
vegetable consumption; 2.6 million people die as a result of being overweight or obese; 7.1
million people die as a result of raised blood pressure and 4.4 million people die as a result of
raised total cholesterol levels (WHO, 2005a).
The emergence of the CVD epidemic in the developing countries during the past two to
three decades has attracted less comment and little public health response, even within these
countries. It is not widely realized that at present, the developing countries contribute a greater
share to the global burden of CVD than the developed countries. (Lopez AD, 1993; Whelton PK,
1995). It has been estimated that 5.3 million deaths attributable to CVD occurred in the developed
countries in 1990, whereas the corresponding figure for the developing countries ranged between
8 to 9 million (i.e., a relative excess of 70%) (Lopez AD, 1993).
Regional estimates of CVD mortality indicate that the difference would be even higher if
the term “developed countries” is restricted to established market economies only and excludes
the former socialist economies. This high, yet inadequately recognized, contribution of
developing countries to the absolute burden of CVD is readily explained by the fact that 78% of
the 49.9 million global deaths (from all causes) in 1990 occurred in regions other than the
established market economies or former socialist economies. Although the relative contribution
of CVD deaths to total mortality was higher in the developed countries (49%) than that in the
developing countries ('23%), the excess total mortality in the latter is translated into excess
absolute CVD mortality due to the large populations involved. Thus, in 1990 the developing
countries contributed 68% of the total global deaths due to non communicable disease and
63%ofworldmortalitydueto CVD (Murray CJL, 1994).
In Laos, Sombadith and colleagues (Sombadith X et al, 2005) reported in their study
that raised blood pressure, dyslipidemia, alcohol consumption and tobacco smoking were the
most common risk factors of stroke in Laos. Tobacco is a major cause of deaths throughout the
world, claiming the lives of an estimated 13 000 persons every day(RITC, 2002).. By 2030 it is
expected to kill 10 million people per year; half aged 35-69. The epidemic is increasingly
affecting developing countries, where most of the world’s smokers (82% or 950 million)
live (World Bank, 1999; 2001). Close to half of all men in low-income countries smoke
daily and this has been increasing. Women’s smoking rates are also increasing fast. By

15
2030, developing countries will account for 70% of all tobacco deaths. Many deaths and
much disease could be prevented by reducing smoking prevalence (World Bank, 1999;
2001).
The burden of chronic non-communicable diseases (NCD), especially heart disease,
stroke, hypertension, diabetes, cancer and chronic respiratory disease, is rising in low and middle-
income countries, particularly in Asia (1). NCD deaths account for 60% of all deaths in the world
and one in two deaths in the Asian region.
In Laos, for example, according to a 1995 study in Vientiane by the World Health
Organization, 41% of males, 15% of females, and overall, 38% of the population over 15 years
old were current daily smokers (WHO, 2005b). A study done at Mahosot Hospital in 2003
showed that 35% of the hospital doctors smoked (Tanya G et al, 2003). Other studies at Mahosot
have shown 50% of patients with an anterior heart attack and 31.4% of patients with a stroke
smoked (Somebandith X & Vang C, 2005).
1.3 Problem Statement
The burden of chronic non-communicable diseases (NCD), especially heart disease, stroke,
hypertension, diabetes, cancer and chronic respiratory disease, is rising in low and middle-income
countries, particularly in Asia (WHO, 2005a, Bonita R, 2009). NCD deaths account for 60% of
all deaths in the world and one in two deaths in the Asian region.
Ongoing surveillance of changes in population levels of the major NCD risk factors is crucial
if we are to understand the success or otherwise of preventive efforts. Many countries embark on
a one-off survey, often with their own definitions, which are not designed to measure secular
trends. To address this problem, WHO developed a STEPwise approach to Surveillance (WHO
STEPS) of a few key modifiable risk factors suitable for use in low and middle-income settings
(Armstrong T & Bonita R, 2003; Bonita R et al, 2003); this methodology is used in this series of
papers. The WHO STEPS approach offers standard methods and measures, as well as
accompanying detailed manuals and training materials to ensure that age and sex trends can be
addressed adequately, as well as to guide quality control (WHO, 2005c). Above all, the WHO
STEPS approach establishes a baseline against which trends in these key risk factors can be
measured through repeated cross-sectional surveys drawn from the same populations.

16
WHO’s STEPS Survey on NCD risk factors has been conducted around the World. However,
no STEPS Survey on NCD risk Factors has been conducted in Laos yet. Little data concerning to
NCD risk factors is available. No up-to-date National NCD policy/action plan is available yet.
While there are several studies that have addressed NCD risk factors in Lao PDR
(Phommachanh B & Vang C, 2007; Sombadith X et al, 2005; Inkeomanivong S & Vang C, 2006;
Chuefue CT et al, 2005; Somsamouth B et al, 2005; Phetsiriseng K & Vang C, 2005; Yang S et
al,2006; Saytouki S et al, 2007), these studies used hospital-based data and their sample sizes
were small and did not represent the Lao population. Accordingly, further studies in this field
should be carried out to provide reliable scientific evidence to enable the Lao Ministry of Health
to set up appropriate programs to prevent chronic diseases in Laos.
1.4 objectives
1.4.1 General Objectives
- To determine the burden of NCD risk factors in Vientiane Capital City, Lao PDR
1.4.2 Specific Objectives
- To determine the prevalence of:
o tobacco use
o raised blood pressure
o physical inactivity
o low fruit and vegetable consumption
o harmful alcohol consumption
o overweight and obesity
17
II Methods
2.1 Scope
In the Lao STEPS survey on NCD risk factors only STEP1 and STEP2 data were
collected. In STEP1 all core and expanded demographic and health behaviour data from the
standard STEPS Instrument were collected. In STEP2 all core and expanded physical measures
were collected, which included height, weight, blood pressure, heart rate, and waist and hip
circumference.
2.2 Study Population
Due to limitation of budget available for this project, the Lao STEPS Survey on NCD risk
factors was a carried out in the rural and urban areas of Vientiane capital city. Lao adults aged 25
to 64 years residing in the 9 districts of Vientiane capital city comprised the target population for
the study. Foreigners, as well as pregnant women and individuals below 25 and above 64 years of
age were excluded from the study. Consent was obtained from each person selected for the study
(Appendix B).
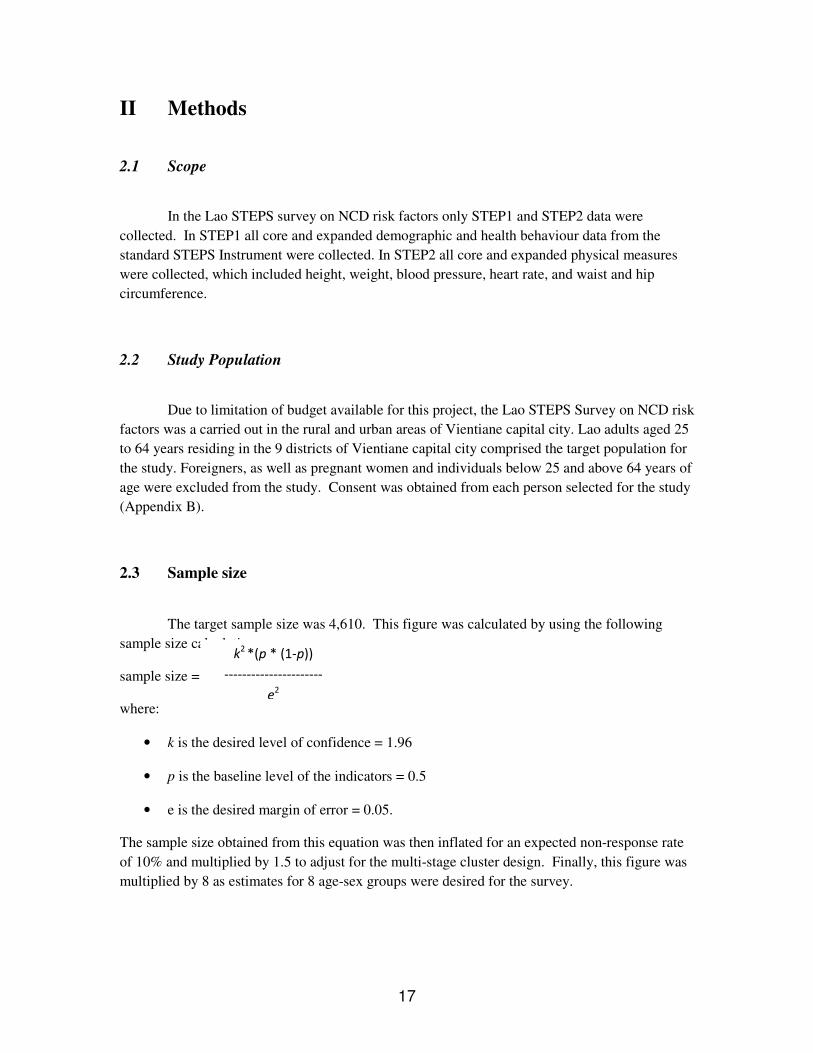
2.3 Sample size
The target sample size was 4,610. This figure was calculated by using the following
sample size calculation:
sample size =
where:
• k is the desired level of confidence = 1.96
• p is the baseline level of the indicators = 0.5
• e is the desired margin of error = 0.05.
The sample size obtained from this equation was then inflated for an expected non-response rate
of 10% and multiplied by 1.5 to adjust for the multi-stage cluster design. Finally, this figure was
multiplied by 8 as estimates for 8 age-sex groups were desired for the survey.
k2
*(p * (1-p))
----------------------
e2
18
2.4 Sampling
The participants were selected from across the 9 health districts of Vientiane Capital City.
In order to draw a representative probability sample, a list of all 497 villages within these 9 health
districts was obtained from the Vientiane Capital City Health Department. This list was
generated in early 2005. Probability proportional to size sampling was used to select 72 villages
from this list. For each selected village a list of households was obtained from the head of each
village and between 6 and 222 households, with more households drawn from larger villages, was
selected from each village using simple random sampling. One participant was then selected
from each household using the Kish Method (See Appendix A) at the time of first contact
between the data collector and a member of the household.
2.5 Timeframe
The Lao STEPS survey on NCD risk factors was planned during a STEPS Survey
Planning Workshop organized by the Lao Ministry of Health held from 28 May 2007 to 1 June
2007 with technical assistance from WHO HQ. After the workshop, a research proposal was
submitted. All budgets and medical devices required for the project were provided by WHO to
the research in October 2007. A Data Collector Training Workshop was held from 3-4 January
2008, a pre-test of the data collection tools was carried out on 7/1/2008, and a meeting to discuss
the pilot test results and resolve matters related to the data collection process was carried out on
8/1/2008. The data entry team was trained using data collected from the pilot test. Data collection
started in January and continued through March 2008. Data management, entry, cleaning and
processing were carried out until October 2008. A data analysis workshop was held from 21-
25/9/2009 to analyze the Lao STEPS data.
2.6 Staff Recruitment and Training
Forty-one data collectors were recruited from across all 9 district health departments of
Vientiane capital city. The data collectors were organized into 10 teams of 4, each comprised of
1 doctor and 3 nurses. They were trained at the Ministry of Health in early January, 2008, just
prior to the beginning of data collection. The training lasted for 3 days and included a 1-day pilot
test in which the data collectors conducted several interviews in their home districts. Please see
appendix F for the complete schedule of the training.
19
2.7 Instrument and data collection process
2.7.1 Instrument
The generic STEPS Instrument was slightly modified for use in the Lao STEPS survey
(Appendices C and D). The final version of the questionnaire is available in the appendix C. Only
STEP 1 and 2 were included in the survey. Step 1 contains questions on the basic demographics
of the respondents: age, sex, level of education, ethnicity, employment status and income.
Following this section are questions are the key behavioral risk factors for NCDs, these include:
tobacco use, alcohol consumption, diet, physical activity. STEP 1 also included questions about
history of raised blood pressure and diabetes. Show cards were used (Appendix E) to help
participants understand better and get appropriate answers in many questions. In STEP 2,
participants had their height, weight, waist and hip circumference, blood pressure, and heart rate
measured.
2.7.2 Data collection process
To collect data, the data collector team went to each selected village. They communicated
with the Head of the village to get someone from the village administration office to guide them
to the selected households. Each team was equipped with necessary data collection tools as
follows:
1. Name tag showing that he/she is a member of the research team
2. Notification of STEPS surveillance visit
3. weight scale
4. Height scale
5. Consent form for STEP 1 &2
6. Interview tracking form
7. STEPS survey questionnaire forms
8. OMRONs (digital blood pressure readers)
9. Show cards
10. List of randomized villages and their respective randomized household
20
11. Kish Household cover sheet
Once the data collectors arrive at a house they introduced themselves and explained the
purpose of their visit. They asked for the age and sex of members of the household aged 25-64
years. This information was used to select one participant from the household using the Kish
method. After selecting the participant, they started to talk to him/her to get him/her involved in
the study. Consent form was read and consent was obtained officially before starting the process
of STEP 1 and STEP2 data collection.
If the randomized person is not available, then they fill in the notification of STEPS
surveillance visit card and make an appropriate appointment to collect data. If the second time
he/she is still not there then, the selected case was dropped from the survey. No person from the
same house was allowed to replace him/her nor could any other household apart from those on
the randomized list be taken to replace temporarily or permanently unoccupied households.
2.8 Data entry
Thirteen data entry staffs were recruited from among staff at Mahosot, Sethathirath and
Mittapab Hospitals. These staffs attended the survey implementation and data collectors training
and then were specifically trained in Epi Data and the entry of STEPS survey data by the survey
coordinator. This data entry training took place during the pilot test for the data collectors where
the the pilot test data was used to practice data entry.
EpiData was used for data entry using tailored templates provided by WHO. Data entry
began about one week after the beginning of data collection. Thus data was entered as it was
received. Double data entry was conducted on a separate computer and the 2 data entry files were
compared to check for consistency. All errors identified during this consistency check were
corrected by checking the original questionnaire forms. Data entry was completed by December
2008 and corrections were completed by June 2009.
2.9 Data Analysis
Data were cleaned and analyzed by the survey coordinator with the assistance of WHO
staff during a data analysis workshop held in September 2009. Epi Info was used to complete the
descriptive analyses using the standard analysis programs provided by WHO, which ensure
unclean records are excluded from each analysis. Sample weights, equal to the inverse of the
probability of selection, were calculated for all records using the sampling information. The
probability of selection at all stages of sampling (village, household and individual) was included
in the calculation of these weights. Since non-response was very low and recent data on the age-
sex structure of Vientiane Capital City was not available, weighting for non-response and a post-
adjustment for age and sex were not done. Weighted complex sample analyses were completed

21
for all measures and standard errors were used to obtain 95% confidence intervals for all results,
which were used to check for significant differences between subgroups.
III Results
A total of 4331 people of the 4610 target people participated in the study. However, the data from
151 participants were excluded from the analysis because data for sex or age was missing or the
age of the participant was out of range. This left a total of 4,180 participants for analysis. The
response rate was 99 %, thus the difference between the total number of interviews completed
and the target is mostly due to selected participants not being available for an interview or due to
empty households being selected. Relevant findings are presented in this section using tables and
charts. Those readers who are interested in the full results may go to Appendix J which contains
the Data Book, or full tabulation of all results.
3.1 Demographics
A total of 4180 people, 1691 males (40.5%) and 2489 females (59.5%), aged from 25 to 64 years
were included in this study (table 1). Most of them (95.7%) were from the Lao Lum ethnic group
(Figure 1).
Table 1: Age-sex Structure of Sample
Age Group Men Women Both Sexes
(years) n % n % n %
25-34 382 34.8 717 65.2 1099 26.3
35-44 512 38.7 811 61.3 1323 31.7
45-54 466 43.8 597 56.2 1063 25.4
55-64 331 47.6 364 52.4 695 16.6
25-64 1691 40.5 2489 59.5 4180 100
22
95.7
3.9 0.4 0.1
0
20
40
60
80
100
% o
f p
op
ula
tio
n
Lao Lum Lao S ung L ao Theung Other
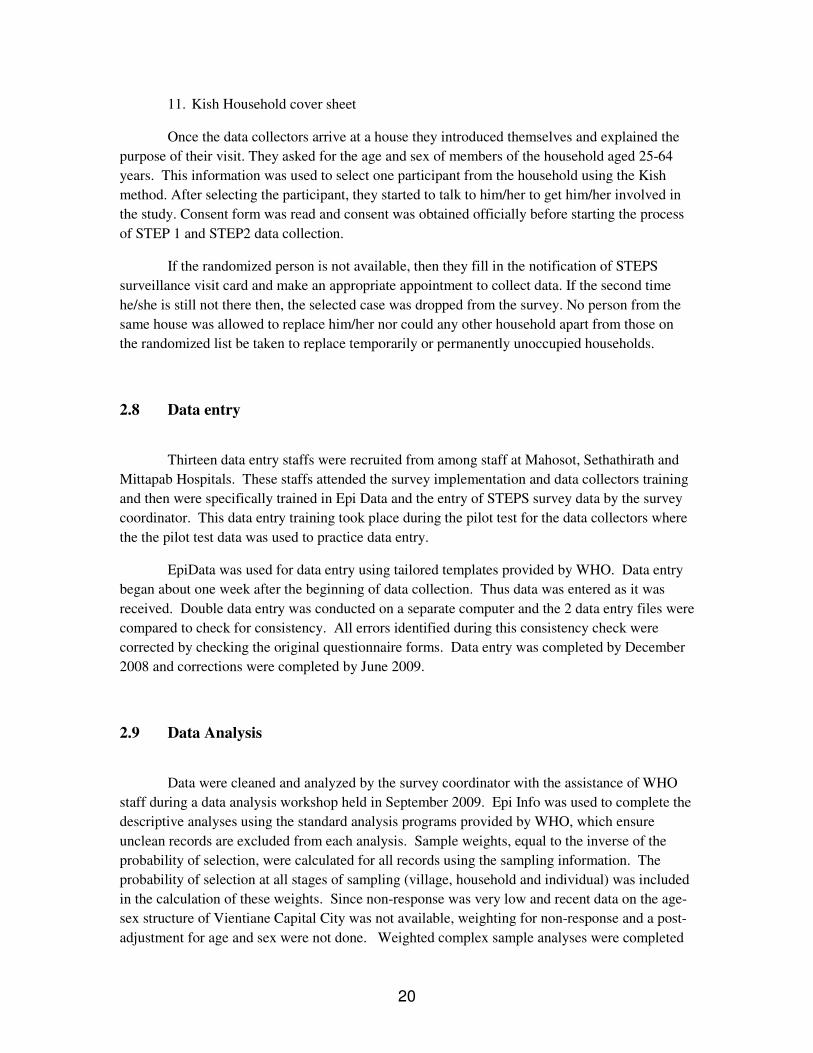
FIGURE 1: Ethnicity (n=4122)
0
5
10
15
20
25
30
% of population
No no
rmal sch
oolin
g
Les than
prim
ary sc
hool
Prim
ary sc
hool commplet
ed
Juno
r high
scho
ol com
pleted
Sen
ior high sc
hool com
pleted
College
/Unive
rsity
com
pleted
Post gra
duate
degr
ee com
plet
ed
Men
Women
Both sexes
FIGURE 2: Highest level of education (n= 4180)
The highest level of education completed is shown in Figure 2. The majority of the
respondents completed either primary, junior high or senior high school education.

23
0
10
20
30
40
50
60%
of
po
pu
lati
on
Government
employee
Non-government
employee
Self-employed Unpaid
FIGURE 3a: Employment status for all respondents (n= 4180)
Employment status is shown in Figure 3a. Government employees account for 11.9% and
non government employees 7.7%. The percentage of self-employed people was 25.1%. More than
half (55.3%) were unpaid people, and in this group home makers account for 74.8% (Figure 3b).
The average income per capita was 777.4 USD.
0 10 20 30 40 50 60 70 80
% of unpaid population
Non-paid
Student
Home maker
Retired
unemployed able to work
Unemployed not able to work
FIGURE 3b: Employment status for all respondents (n= 2291)
24
3.2 NCD Risk Factors
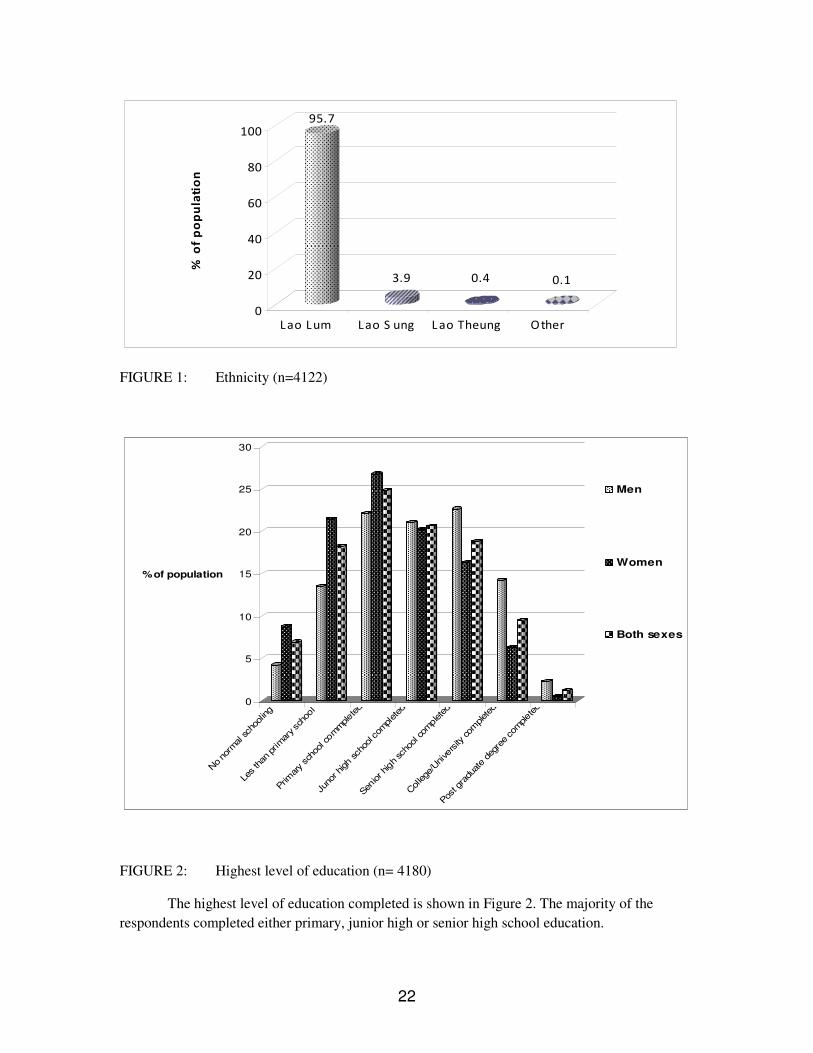
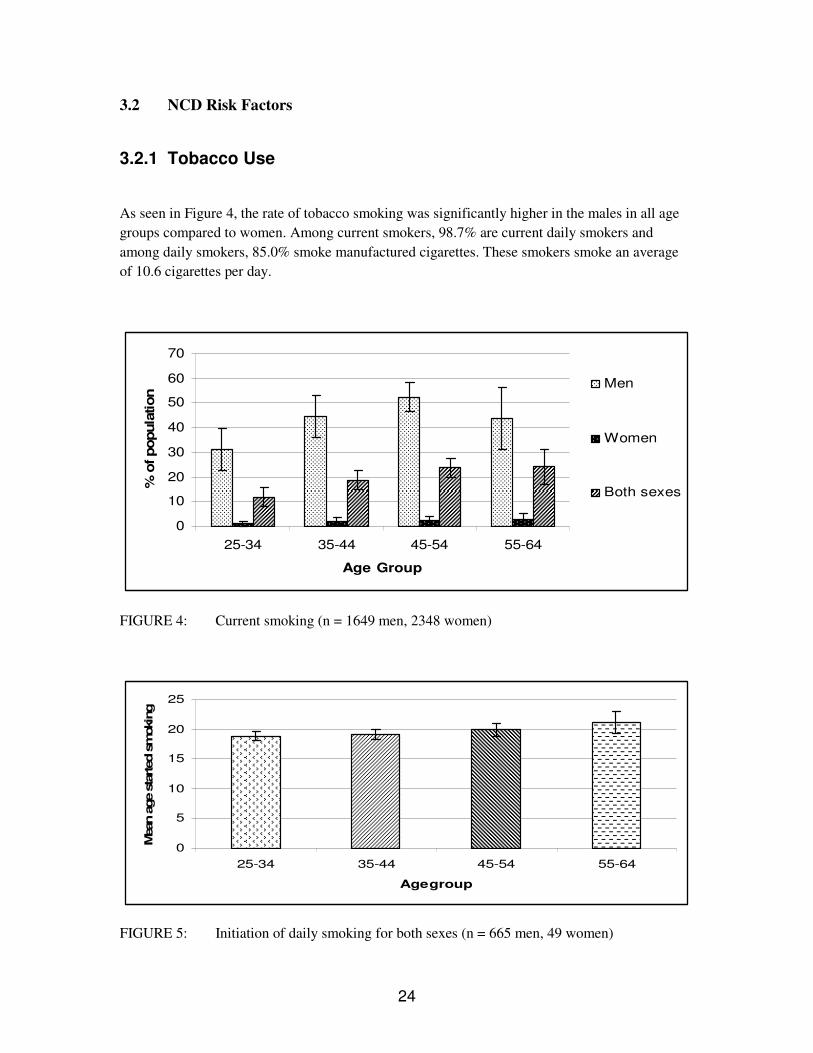
3.2.1 Tobacco Use
As seen in Figure 4, the rate of tobacco smoking was significantly higher in the males in all age
groups compared to women. Among current smokers, 98.7% are current daily smokers and
among daily smokers, 85.0% smoke manufactured cigarettes. These smokers smoke an average
of 10.6 cigarettes per day.
0
10
20
30
40
50
60
70
25-34 35-44 45-54 55-64
Age Group
% o
f popula
tion
Men
Women
Both sexes
FIGURE 4: Current smoking (n = 1649 men, 2348 women)
0
5
10
15
20
25
25-34 35-44 45-54 55-64
Agegroup
Mean a
ge s
tarted s
mokin
g
FIGURE 5: Initiation of daily smoking for both sexes (n = 665 men, 49 women)

25
The mean age for tobacco smoking initiation was 19.7 years old (Figure 5). The rate of smokeless
tobacco use was shown in Figure 6. Men also use significantly more smokeless tobacco than
women (14.6% vs 1.1%).
0
5
10
15
20
25
30
35
25-34 35-44 45-54 55-64
Age group (years)
% o
f popula
tion
Men
Women
Both sexes
FIGURE 6: Smokeless tobacco use (n = 900 men, 812 women)
3.2.2 Alcohol Consumption
0
10
20
30
40
50
60
70
80
90
100
25-34 35-44 45-54 55-64
Age group
% p
opula
tion
Men
Women
Both Sexes
FIGURE 7: Current Drinkers (those who consumed alcohol in the past 30 days with n = 1539
men, 2354 women)

26
As seen in Figure 7, the rate of alcohol drinking was significantly higher among males (72.0% vs
35.6%) and this difference was detected in all age groups. The overall rate of alcohol
consumption for both sexes was slightly higher in the young age group.
0
10
20
30
40
50
60
70
80
90
1 drink 2-3 drinks 4-5 drinks 6+ drinks
% o
f d
rin
ke
rs
Men
Women
Both Sexes
FIGURE 8: Number of Standard Drinks Consumed on a Drinking Day (amongst those who
consumed alcohol in the past 12 months, n = 1102 men, 827 women)
0
2
4
6
8
10
12
14
25-34 35-44 45-54 55-64
Age Group
no. of dri
nks
Men
Women
Both Sexes
FIGURE 9: Mean Number of Standard Drinks Consumed on a Drinking Day amongst those
who consumed alcohol in the past 12 months. (n = 1102 men, 827 women;
Standard drink = 10g of alcohol)
27
0
10
20
30
40
50
60
70
80
Men Women
% c
urr
ent drinkers Drank on 4+ days
5 / 4 + drinks onany day
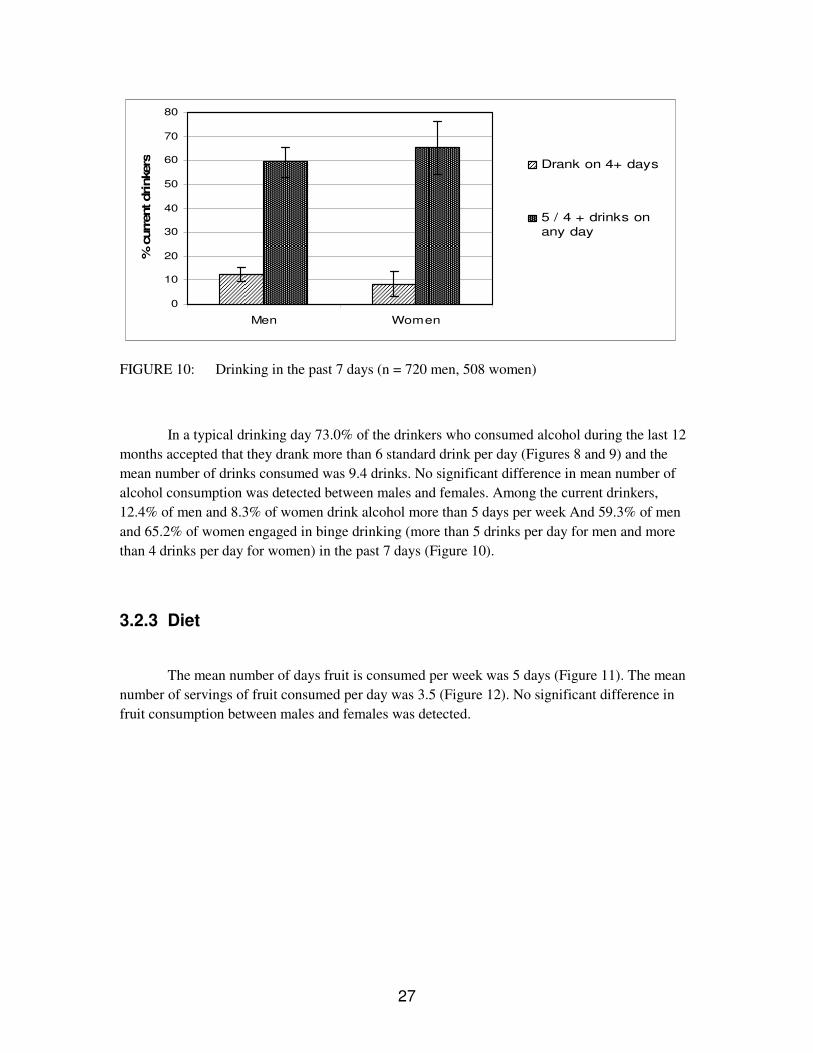
FIGURE 10: Drinking in the past 7 days (n = 720 men, 508 women)
In a typical drinking day 73.0% of the drinkers who consumed alcohol during the last 12
months accepted that they drank more than 6 standard drink per day (Figures 8 and 9) and the
mean number of drinks consumed was 9.4 drinks. No significant difference in mean number of
alcohol consumption was detected between males and females. Among the current drinkers,
12.4% of men and 8.3% of women drink alcohol more than 5 days per week And 59.3% of men
and 65.2% of women engaged in binge drinking (more than 5 drinks per day for men and more
than 4 drinks per day for women) in the past 7 days (Figure 10).
3.2.3 Diet
The mean number of days fruit is consumed per week was 5 days (Figure 11). The mean
number of servings of fruit consumed per day was 3.5 (Figure 12). No significant difference in
fruit consumption between males and females was detected.

28
0
1
2
3
4
5
6
7
25-34 35-44 45-54 55-64
Ag e G oup
Da
ys
Men
Women
B oth S exes
FIGURE 11: Fruit consumption: mean number of days consumed per week (n = 1167 men,
1927 women)
0
1
2
3
4
5
6
7
25-34 35-44 45-54 55-64
Ag e G roup
No
. o
f S
erv
ing
s
Men
Wom en
B oth S exes
FIGURE 12: Fruit Consumption: mean number of servings per day (n = 1167 men, 1927
women)

29
0
1
2
3
4
5
6
7
25-34 35-44 45-54 55-64
Ag e Group
Days
Men
Women
B oth S ex es
FIGURE 13: Vegetable Consumption: mean number of days consumed per week (n = 1142
men, 1900 women)
For vegetable consumption, the mean number of days consumed per week was 6 days
(Figure 13) and the mean number of servings consumed per day was 4.7 (Figure 14). No
significant difference in fruit consumption between males and females was detected.
0
1
2
3
4
5
6
7
25-34 35-44 45-54 55-64
Ag e G roup
No.
of S
erv
ings
Men
Women
B oth S exes
FIGURE 14: Vegetable Consumption: mean number of servings per day (n = 1142 men, 1900
women)

30
0
10
20
30
40
50
60
25-34 35-44 45-54 55-64
Ag e G roup
% o
f p
op
ula
tio
n Men
Women
B oth S exes
FIGURE 15: Consumption of <5 servings of fruit and/or vegetables on average per day
(n = 1188 men, 1944 women)
Thirty-seven percent of the population involved in this study consumed less than five standard
servings of fruit and/or vegetables on average per day (Figure 15). The type of oil most
commonly used to cook was vegetable oil (Table 2)
TABLE 2: type of oil or fat most often used for meal preparation in households
Type of oil or fat most often used for meal preparation in household
n
(house-
holds)
%
Vege-
table oil
95%
CI
%
Lard
95%
CI
%
Butter 95% CI
% Marga-
rine
95% CI
% None used
95% CI
% Other
95% CI
4126 93.0 90.8-
95.3 5.7
3.4-
8.0 0.1
0.0-
0.1 0.0
0.0-
0.0 1.0
0.4-
1.5 0.3
0.4-
1.5
3.2.4 Physical Activity
The following guidelines were used in analysis physical activity. The guidelines provided valuable information on the intensity of physical activity classifications.

31
• MET values are applied to vigorous and moderate intensity variables in the work, transport and recreation domains. These have been calculated using an average of the typical types of activity undertaken. Different types of activities have been grouped together and given a MET value based on the intensity of the activity. Applying MET values to types of activities allows
us to calculate total physical activity. MET values applied in this study were 4 for moderate activities and 8 for vigorous activities. For more information regarding MET values go the STEPS website at www.who.int/chp/steps .
• The calculations below use multiple questions in the physical activity section. To simplify this a bit the questions have been clustered into four groups (as they appear in the Instrument). In the Instrument questions section of the table, only the group label appears. The specific questions for each group are presented below (See Appendix C and J). Activity at work: - Does your work involve vigorous-intensity activity that causes large increases in
breathing or heart rate like [examples] for at least 10 minutes continuously? - In a typical week, on how many days do you do vigorous-intensity activities as part of
your work? - How much time do you spend doing vigorous-intensity activities at work on a typical
day? - Does your work involve moderate-intensity activity, that causes small increases in
breathing or heart rate such as brisk walking for at least 10 minutes continuously? - In a typical week, on how many days do you do moderate-intensity activities as part of
your work? - How much time do you spend doing moderate-intensity activities at work on a typical
day? Travel to and from places:
- Do you walk or use a bicycle for at least 10 minutes continuously to get to and from
places? - In a typical week, on how many days do you walk or bicycle for at least 10 minutes
continuously to get to and from places? - How much time do you spend walking or bicycling for travel on a typical day?
Recreational activities:
- Do you do any involve vigorous-intensity sports, fitness or recreational activities that
cause large increases in breathing or heart rate like [examples] for at least 10 minutes continuously?
- In a typical week, on how many days do you do vigorous-intensity sports, fitness or recreational activities?
- How much time do you spend doing vigorous-intensity sports, fitness or recreational activities on a typical day?
- Do you do any involve moderate-intensity sports, fitness or recreational activities that cause large increases in breathing or heart rate like [examples] for at least 10 minutes continuously?
- In a typical week, on how many days do you do moderate--intensity sports, fitness or recreational activities?

32
- How much time do you spend doing moderate--intensity sports, fitness or recreational activities on a typical day?
Sedentary behaviour :
- How much time do you usually spend sitting or reclining on a typical day?
As shown in Figure 16, more than half of the population was involved in high physical
activity (64.1%). Significantly more men attained a high level of physical activity than women
(72.1% vs 59.1%). Fifty percent of the population in this study achieved 3 hours or less physical
activity on average per day (table 3). Males spent more time on physical activity than female (4hr
28.6min versus 2hr 12.9min).
0
10
20
30
40
50
60
70
80
Low Moderate High
% o
f p
op
ula
tio
n
Men
Women
Both Sexes
FIGURE 16: Total Level of Physical Activity in a typical week (n = 1373 men, 2139 women)
TABLE 3: Median Amount of Physical Activity on a typical day (n = 1373 men, 2139 women)
25th percentile median (50th percentile) 75th percentile
Men 1hr 10min 4hr 28.6min 8hr
Women 42.9min 2hr 12.9min 6hr 17.1min
Both Sexes 1hr 3hr 7hr 30min

33
0% 20% 40% 60% 80% 100%
Both Sexes
Women
Men
% of activity
Work
Transport
Leisure
FIGURE 17: Average Distribution of Physical Activity (n = 1287 men, 1889 women)
'The contribution of work related physical activity to the total physical activity of the
population was 70.5% (Figure 17) and 68.2% of the population did not engage in physical
activity during leisure time (Figure 18). The percentage of people in the 55 to 64 group who had
no vigorous physical activity was 71.6 % (Figure 19)
0
10
20
30
40
50
60
70
80
90
no activity at work no activity for
transport
no activity during
leisure time
% o
f p
op
ula
tio
n
Men
Women
Both Sexes
FIGURE 18: Average Distribution of Physical Activity (n = 1373 men, 2139 women)

34
0
10
20
30
40
50
60
70
80
90
Men Women Both Sexes
% o
f popula
tion
25-34
35-44
45-54
55-64
FIGURE 19: No Vigorous Physical Activity (n = 1373 men, 2139 women)
3.2.5 Health History
As seen in Figure 20, the percentage of population who had been previously diagnosed
with hypertension was 9.3%. No significant difference was detected between males and females
(7.2% vs10.7%) . The percentage of the population previously diagnosed with diabetes was 2.5%.
No significant difference was detected between males and females (1.6% vs 3.1%) either.
0
2
4
6
8
10
12
14
Hypertension ever diagnosed Diabetes ever diagnosed
% o
f popula
tion
Men
Women
Both Sexes
FIGURE 20: Previously Diagnosed Hypertension (n = 1428 men, 2174 women) and Diabetes
(n = 1591 men, 2386 women)

35
3.2.6 Body Mass Index (BMI)
The mean Body Mass Index for both sexes detected was 23.5 and 27.4% are overweight
(BMI ≥25 kg/m2) and 5.8% are obese (BMI ≥30 kg/m2) (FIGURES 21 and 22).
19
20
21
22
23
24
25
26
25-34 35-44 45-54 55-64
Age group
BM
I (k
g/m
2)
Men
Women
Both sexes
FIGURE 21: Mean Body Mass Index (BMI) (n = 2,560 men, 2,333 women)
0.0
5.0
10.0
15.0
20.0
25.0
30.0
35.0
Overweight Obese
% o
f popula
tion Men
Women
Both Sexes
FIGURE 22: Mean Body Mass Index (BMI) Classification (n = 2560 men, 2333 women)
Definitions: Overweight (BMI ≥ 25) and Obese (BMI ≥ 30.0)
36
3.2.7 Blood pressure
0
5
10
15
20
25
30
35
Men Women Both Sexes
% o
f p
op
ula
tio
n
SBP>=140 and/or
DBP>=90 mmHg or
currently on medication
for raised blood
pressure
SBP>=160 and/or
DBP>=100 mmHg or
currently on medication
for raised blood
pressure
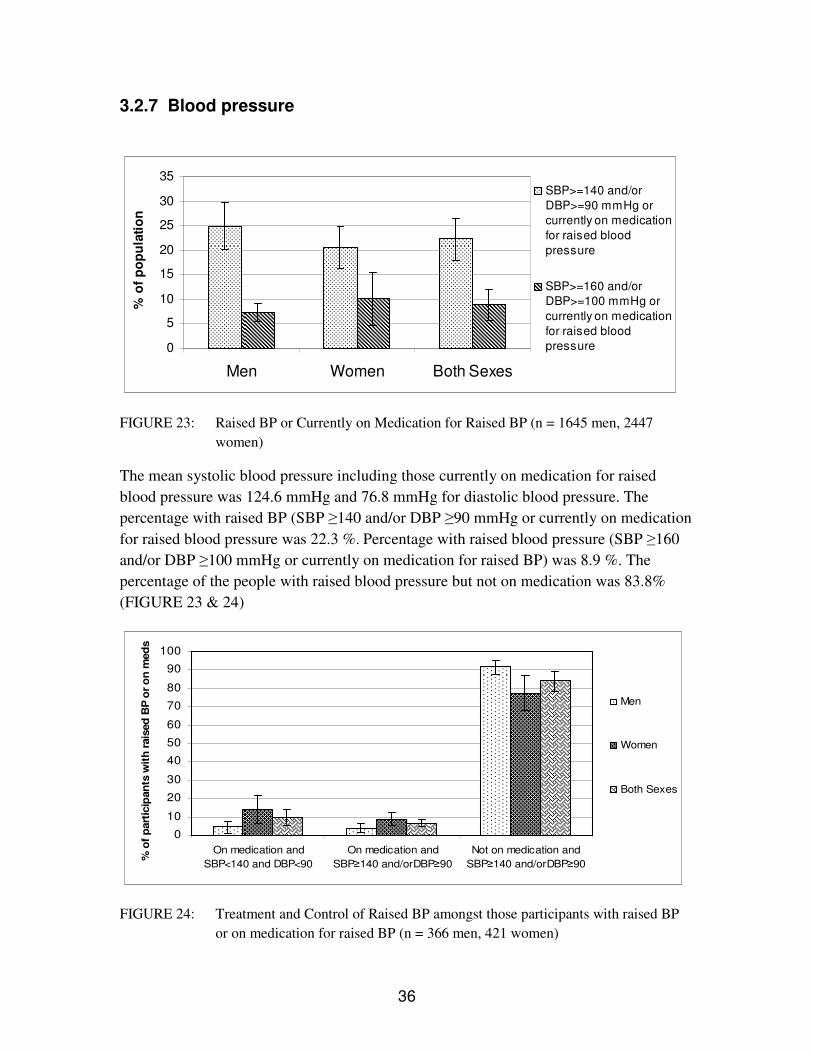
FIGURE 23: Raised BP or Currently on Medication for Raised BP (n = 1645 men, 2447
women)
The mean systolic blood pressure including those currently on medication for raised
blood pressure was 124.6 mmHg and 76.8 mmHg for diastolic blood pressure. The
percentage with raised BP (SBP ≥140 and/or DBP ≥90 mmHg or currently on medication
for raised blood pressure was 22.3 %. Percentage with raised blood pressure (SBP ≥160
and/or DBP ≥100 mmHg or currently on medication for raised BP) was 8.9 %. The
percentage of the people with raised blood pressure but not on medication was 83.8%
(FIGURE 23 & 24)
0
10
20
30
40
50
60
70
80
90
100
On medication and
SBP<140 and DBP<90
On medication and
SBP≥140 and/orDBP≥90
Not on medication and
SBP≥140 and/orDBP≥90
% o
f p
art
icip
an
ts w
ith
rais
ed
BP
or
on
med
s
Men
Women
Both Sexes
FIGURE 24: Treatment and Control of Raised BP amongst those participants with raised BP
or on medication for raised BP (n = 366 men, 421 women)

37
3.2.8 Waist and hip circumference
The mean waist circumference was 76.5 cm for men and 75.2 cm for women and the
mean hip was 92 cm for men and 92.7 cm for women. Mean waist/hip ratio were 0.9 for
both sexes (table 4).
TABLE 4: Mean waist / hip ratio
Mean waist / hip ratio
Age Group Men Women
(years) n Mean 95% CI n Mean 95% CI
25-34 157 0.9 0.8-0.9 302 0.8 0.8-0.9
35-44 211 0.9 0.9-0.9 372 0.8 0.8-0.9
45-54 193 0.9 0.9-0.9 266 0.9 0.9-0.9
55-64 151 0.9 0.9-0.9 171 0.9 0.9-0.9
25-64 712 0.9 0.9-0.9 1111 0.9 0.8-0.9
3.2.9 Heart rate
TABLE 4: Mean beats per minutes
Mean beats per minute
Age Group Men Women Both Sexes
(years) n Mean 95% CI n Mean 95% CI n Mean 95% CI
25-34 367 77.7 76.1-79.2 694 80.9 79.1-82.7 1061 79.8 78.4-81.1
35-44 495 77.6 76.3-78.9 794 80.2 78.5-81.9 1289 79.2 78.2-80.3
45-54 445 79.3 78.1-80.5 584 78.4 75.9-80.8 1029 78.7 77.1-80.4
55-64 319 79.2 76.9-81.4 353 78.8 77.0-80.7 672 79 77.9-80.1
25-64 1626 78.4 77.6-79.2 2425 79.8 78.8-80.7 4051 79.2 78.6-79.9

38
The mean heart beats per minute were 78.4 for men and 79.8 for women. The percentage
of population with heart rate per minute over 100 was 3.1 % for men and 2.9 % for
women (Table 4 and 5)
TABLE 5: Percentage with beats per minute over 100
Percentage with beats per minute over 100
Age Group Men Women Both Sexes
(years) n % 95% CI n % 95% CI n % 95% CI
25-34 367 1.8 0.3-3.3 694 3.5 0.6-6.4 1061 2.9 1.0-4.9
35-44 495 2.4 0.8-3.9 794 2.9 1.0-4.9 1289 2.7 1.3-4.1
45-54 445 4.5 1.3-7.8 584 2.3 0.9-3.7 1029 3.2 1.6-4.8
55-64 319 3.6 1.4-5.9 353 2.8 0.7-4.8 672 3.2 1.6-4.8
25-64 1626 3.1 1.9-4.2 2425 2.9 1.8-4.1 4051 3 2.1-3.8
3.2.10 Combined Risk Factors
To see the burden of NCD risk factors amongst the involved population, the
following five main risk factors of non communicable diseases risk factors were
combined. The NCD risk factor to be combined were as follow
1. Daily smoking
2. <5 servings of fruit and/or vegetables per day
3. Low levels of physical activity
4. Overweight (BMI ≥ 25)
5. SBP ≥ 140 and/or DBP ≥ 90 or on medication for raised blood pressure
Nearly 60% (59.8%) of the population has 1 or 2 risk factors. An additional 9.2% have 3
or more risk factors (Figure 25a, 25b, & 25c)

39
66%
13% 21%
0 risk factors
1-2 risk factors
3-5 risk factors
FIGURE 25a: Combined Risk Factors for men (n = 918)
7%
56%
37%
0 risk factors
1-2 risk factors
3-5 risk factors
FIGURE 25b: Combined Risk Factors for women (n = 1575)
60%
9%31%
0 risk factors
1-2 risk factors
3-5 risk factors
FIGURE 25c: Combined Risk Factors for both sexes (n = 2493)
40
IV Discussion
4.1 Representation
Due to a limited budget, this was a subnational study that covered the population of
Vientiane municipality only and not the whole Lao PDR. The data were weighted according to
probability of selection to make it representative of the population of this capital city of Laos.
An important point to look at is that the population of Lao PDR is composed by many
minority ethic groups previously classified in three main groups: Lao Lum, Lao Sung and Lao
Theung. In this study most of the randomized cases were from the Lao Lum group, which is the
largest group of population in Lao PDR. Thus, it is uncertain that the findings of this study could
be applied to other ethnic groups in Lao PDR.
4.2 Key Results and New Knowledge
Previous tobacco studies conducted in Laos have reported higher smoking prevalence of in Lao population (WHO, 2005a; http://www.cdc.gov/global/GYTS/factsheets/2003/ Laos_PDR_vientiane , MoH, 2006). However, in this study it was detected that 20% of the population involved in this study are current smokers and the rate of tobacco smoking was significantly higher in the male group (43% versus 2%). But it's important to note that even though it's mostly males that smoke, it's still a problem for women as they are exposed to second-hand smoke.
Tobacco use is one of the most important contributors to premature death and avoidable
morbidity in both low-income and high-income countries (Esson KM and Leeder SR, 2004). In
addition, smoking attributable costs represent a significant loss for the entire national economy.
Studies have found that smoking attributable costs have reached 2.1%–3.4% of gross domestic
product (GDP) in Australia, 1.3%–2.2% of GDP in Canada and 1.4%–1.6% of GDP in the United
States (Lightwood J et al, 2000). Smoking attributable costs account for 6–15% of health care
expenditures in high-income countries (World Bank, 1999).
In this study, it was detected that 56% of the population accepted to have consumed
alcohol in the past 12 months. Amongst these drinkers, 73.0% consume 6 or more drinks on a
drinking day. These drinkers indicated they consume an average of 9.4 drinks per drinking day.
Among current drinkers (drank in past 30 days), 65.2% of women and 59.3% of men engaged in
binge drinking in the past week. It is well established that harmful alcohol drinking is a risk factor
for many non communicable diseases (WHO, 2005a). A binge alcohol consumption could lead to
chronic diseases such as gastritis, liver cirrhosis stroke, dilated cardiomyopathy. In addition a
binge alcohol drinking could lead to traffic accident with huge economic impact to the victims,
injury and violent behavior.

41
In this study it was detected that fruit and vegetable consumption is generally high with
fruit consumed an average of 5.2 days per week and vegetables consumed an average of 6.5 days
per week. On average, the population is eating 3.5 servings of fruit and 4.7 servings of vegetables
per day. However, 36.6% of the population is not obtaining the recommended “5 servings per
day”. This one third of the population with low fruit and vegetable intake is at greater risk of non-
communicable disease. Thus, appropriate interventional health promotion program should be
implemented to deal with diet is necessary.
It was found that less than half the population engages in any vigorous physical activity,
which has specific health benefits. In addition, 64.1% of the population are engaging in high
levels of physical activity. Significantly more men (72.1%) than women (59.1%) are reaching this
level of physical activity. The majority of physical activity (70.5%) comes from work-related
activities and 68.2% of the population do no leisure time activity. This could be due to that five of
the nine districts in which data were collected are located in rural area and the randomized cases
performed high physical activity due to their labor. Thus, in the Lao PDR case, physical activity
might be focused on those who live in urban area in which life style is changing due to
civilization. The issue is that as the lifestyle changes to a more urbanized one, levels of physical
activity will likely go down because people are mostly getting their activity from work with few
people getting sufficient physical activity from leisure time activities.
It was detected that 27.4% of the population is overweight and 5.8% is obese. In this
study overweight was defined as a body mass index over 25 to match the WHO’s STEPs survey
on NCD risk factors data performed in other countries. If overweight is defined as a body mass
index over 23 as used for Asian population (Asia Pacific Western Pacific Regional WHO
recommendation; Pheung Chai et al., 2003), then the percentage of overweight would be much
higher. Accordingly, mass education to prevent obesity is also necessary for Lao PDR.
It was revealed in this study that that 20.5% of women and 24.9% of men have raised
blood pressure (SBP≥140 and/or DBP≥90 mmHg) or are on medication for raised blood pressure.
Amongst these individuals, 83.8% are not on medication for raised blood pressure. This could be
a good explanation on why there are too many cases of patients with hypertension leading to
catastrophic complications such as stroke, chronic kidney disease, heart failure (Khamtan A &
Vang C, 2004, Phommachanh B & Vang C, 2007, Sombadith X et al, 2005; Inkeomanivong S &
Vang C, 2006; Chuefue CT et al, 2005; Somsamouth B et al, 2005; Yang S et al,2006; Saytouki S
et al, 2007). This is a very important issue for Lao PDR to deal with to prevent cardiovascular
diseases.
In our study we detected that nearly 60% (59.8%) of the population has 1 or 2 risk factors. An additional 9.2% have 3 or more risk factors. . Clarke and colleagues performed a Cohort study in the England, United Kingdom to examine, in middle-aged men, the relation between expected and actual life expectancy and risk factors for cardiovascular diseases (Clarke et al, 2009). The investigators used data from nearly 19,000 male civil service employees aged 40-69 years in London, England, who originally participated in the Whitehall Study in 1967-1970. At time of baseline enrollment, consenting study subjects completed a standardized questionnaire and had various risk factors for CVD assessed including cigarette smoking, blood pressure (BP), BMI, serum glucose levels, and blood lipids. Mortality follow-up of this large

42
cohort of middle-aged men was excellent and all-cause and cause-specific mortality was assessed through 2005. A total of 13,501 men died over this period and cause of death was able to be ascertained in more than 11,300 cases. A sample of surviving men were also re-examined in 1997. At time of baseline study enrollment, 42% of the men were current smokers, 39% were found to have high BP, and slightly more than one half had an elevated total serum cholesterol level
As expected, men who were current smokers were at markedly increased risk for both vascular causes of death (RR=1.57) and non-vascular mortality (RR=2.1). Moreover, men who were smoking at the time of study entry had a more than six year reduced life expectancy at age 50 compared with non-smoking men. Similarly, persons with elevated BPs at the time of study entry were at increased risk for vascular associated mortality and reduced life expectancy than persons with lower levels of BP (difference in life expectancy of five years) as were persons with high, as compared to those with lower, serum cholesterol levels (approximate two-year reduction in life expectancy) (Clarke et al, 2009). In examining the effects of combinations of the three main risk factors for CHD, the
hazards ratios for vascular mortality increased with an increasing number of CVD risk factors
being present. For example, compared with the 17% of men who did not have any risk factors for
CVD present at the time of study entry, men with all three risk factors present (8%) in the late
1960s experienced a three-fold higher rate of dying from vascular disease, a two-fold higher rate
of dying from non-vascular causes, and a nearly 10-year shorter life expectancy at age 50 (24
years vs 33 years). In addition, in comparison with men who were in the lowest 5% of a
calculated risk score based on cigarette smoking, diabetes, level of BP, BMI, and serum
cholesterol levels, these high risk men had a 15-year shorter life expectancy from age 50 than
those in the lowest fifth percentile (20 vs 35 years) (Clarke et al, 2009).
Despite substantial changes in these risk factors over time, baseline differences in risk factors were associated with 10 to 15 year shorter life expectancy from age 50. This study provide support for the public health policies aimed at achieving modest changes in major risk factors throughout the population to achieve improvements in life expectancy (Clarke et al, 2009).
V Conclusion and Recommendations
5.1 Conclusions
1. Tobacco Use
• Nearly 20% of the population currently smokes tobacco.
• Most of them (98.7%) are daily smokers.
• Smoking rates are markedly higher in men (43.2%).
• Age of initiation of daily smoking has decreased with time (though not significantly).
43
2. Alcohol Consumption
• 56% of the population have consumed alcohol in the past 12 months.
• Amongst these drinkers, 73.0% consume an average of 6 or more drinks on a drinking
day.
• These drinkers indicated they consume an average of 9.4 drinks per drinking day.
• Among current drinkers (drank in past 30 days), 65.2% of women and 59.3% of men
engaged in binge drinking* in the past week.
3. Diet
• Fruit and vegetable consumption is generally high, with fruit consumed an average of 5.2
days per week and vegetables consumed an average of 6.5 days per week.
• On average, the population is eating 3.5 servings of fruit and 4.7 servings of vegetables
per day.
• However, 36.6% of the population is not obtaining the recommended “5 a day”.
4. Physical Activity
• Nearly 2/3rds (64.1%) of the population are engaging in high levels of physical activity.
• Significantly more men (72.1%) than women (59.1%) are reaching this level of physical
activity.
• The majority of physical activity (70.5%) comes from work-related activities and 68.2%
of the population do no leisure time activity.
• Over half the population (52.8%) does no vigorous physical activity.
4. Overweight and Obesity
• 27.4% of the population is overweight and 5.8% is obese.
• There are no significant differences between men and women.
5. Blood Pressure
• 20.5% of women and 24.9% of men have raised blood pressure (SBP≥140 and/or
DBP≥90) or are on medication for raised blood pressure.
• Amongst these individuals, 83.8% are not on medication for raised blood pressure.
6. Combined Risk Factors
• Nearly 60% (59.8%) of the population has 1 or 2 risk factors.

44
• An additional 9.2% have 3 or more risk factors.
5.2 Recommendations
1 Lao National Policy/action plans on NCD Prevention and Control is necessary
2 Interventional programs on the most relevant NCD risk factors are required
– Hypertension
– Tobacco smoking
– Alcohol intake
– Exercise
– Healthy Diet
3 Mass education to prevent chronic diseases is necessary

45
VI References
Alberts MJ, Bennett CA, Rutledge VR. Hospital Charges for Stroke Patients. Stroke 1996;
27(10): 1825-1828.
Armstrong T, Bonita R. Capacity building for an integrated noncommunicable disease
risk factor surveillance system in developing countries. Ethn Dis 2003; 13: S13–8.
Bonita R, Douglas K, Winkelmann R, De Courten M. The WHO STEPwise approach to
surveillance (STEPS) of noncommunicable disease risk factors Global behavioral risk
factor surveillance. McQueen D Puska P London: Kluwer Academic/Plenum; 2003. 9–
22.
Bonita R. Strengthening NCD prevention through risk factor surveillance. Global Health
Action Supplement 1, 2009. DOI: 10.3402/gha.v2i0.2086.
http://creativecommons.org/licenses/by-nc/3.0/),
Chuefue CT, Losangbliayao S, Vang C. Causes of congestive heart failure detected in the
Mahosot hospital from 2002 to 2004. Thesis for the degree of Bachelor Degree. Faculty
of Medical Sciences, National University of Laos, 2005
Clarke R, Emberson J, Fletcher A, Breeze E, Marmot M, Shipley MJ. Life expectancy in
relation to cardiovascular risk factors: 38 year follow-up of 19,000 men in the Whitehall
Study. BMJ 2009; 339: b3513
Esson KM, Leeder SR. The millennium development goals and tobacco control: an
opportunity for global partnership. Geneva: World Health Organization, 2004.

46
Evers SMAA, Engel GL, Ament AJHA. Cost of Stroke in the Netherlands from a Societal
Perspective. Stroke 1997; 28(7): 1375-1381.
http://www.cdc.gov/global/GYTS/factsheets/2003/Laos_PDR_vientiane
Haidinger G, Waldhoer T, Tuomilehto J, Vutuc C. Assessment of Costs Related to
Hospitalization of Stroke Patients in Austria for 1992 and Prospective Costs for the Year 2010.
Cerebrovasc Dis 1997; 7(3): 163-167.
Her Y., Yang B. Yang S. Causes of Atrial Fibrillation Detected in the Mahosot Hospital. Thesis for the degree of Bachelor Degree. Faculty of Medical Sciences, National University of Laos, 2006
Inkeomanivong S., Vang C. Trend of Ischemic Heart diseases Detected in the Mahosot Hospital. Thesis for the degree of Doctor of Medicine. Faculty of Medical Sciences, National University of Laos, 2006
Jorgensen HS, Nakayama H, Raaschou HO, Olsen TS. Acute Stroke Care and Rehabilitation - an
Analysis of the Direct Cost and its Clinical and Social Determinants - the Copenhagen Stroke
Study. Stroke 1997; 28(6): 1138-1141.
Khamtan A & Vang C . Causes of death in the Department of Cardiology from 1999 to
2004 15th ACC , Pattaya, Thailand, 2004
Lao Ministry of Health (MoH): Health Status of the People in Lao PDR 2006
Lightwood J, Collins D, Lapsley H, et al. Estimating the costs of tobacco use. In: Jha P,
Chaloupka FJ, eds. Tobacco control in developing countries, Section I, Chapter 4.
Oxford: Oxford University Press, 2000.
National Statistics Centre. Lao Statistics 2005. Vientiane National Statistics Centre. 2005
Pheung Chai et al. Guidelines for Management of Dyslipidemia; 2003

47
Phetsiriseng K, Vang C. The Siriraj Stroke Score Versus CT scan in Distinguishing Cerebral Infarction from Cerebral Hemorrhage in Acute Stroke. Thesis for the degree of Doctor of Medicine. Faculty of Medical Sciences, National University of Laos, 2005
Phommachanh B. Vang C. The Burden of Chronic Diseases Detected in the Mahosot, Mittapab and Sethathirath Hospitals. Faculty of Medical Sciences, National University of Laos, 2007
Porsdal V, Boysen G. Cost of Illness Studies of Strokes. Cerebrovascular Diseases 1997; 7(5): 258-263. Research for International Tobacco Control (RITC). Bridging the research gaps in global tobacco
control. Report on the meeting in Ottawa, Canada: RITC, November 4–6, 2002.
Saytouki S, Leenaolue T, Singmavong V, Vang C. Causes of Hospitalization of Patients Admitted to The Department of Cardiology of the Mahosot Hospital. Thesis for the degree of Bachelor Degree. Faculty of Medical Sciences, National University of Laos, 2007
Sombandith X & Vang C. Risk factors of stroke detected in the Mahosot Hospital. Thesis for the degree of Doctor of Medicine, Faculty of Medical Sciences, National University of Laos, 2004. Somsamouth B, Vang C Maysay M. Effectiveness of Lao Physicians in the Management of Hypertension. Thesis for the degree of Doctor of Medicine. Faculty of Medical Sciences, National University of Laos, 2005
Vang C, , Philavong V, Souvannavong M. Hypertension: Epidemiological Study among
the Lao Medical Staffs. International Scientific Conference Partnership in Public Health
Development, Vientiane, Laos. 18-10th March 2002; pp 110-115
World Health Organization. Preventing chronic diseases – a vital investment. Geneva :
World Health Organization; 2005a.
World Health Organization. Building blocks for tobacco control. New York: WHO, 2005b.
World Health Organization. WHO STEPS surveillance manual: the WHO STEPwise
approach to chronic disease risk factor surveillance. Geneva : World Health
Organization. Available from: http://who.int/chp/steps; 2005c [cited 4 September 2009].

48
World Heath Organization: WHO Health Report, 2000
World Bank (WB13429). M:\PH Fact Sheets\Latest Versions\tobacco at a glance.doc. March 16,
2001.
World Bank. Curbing the epidemic: Governments and the economics of tobacco control.
Washington, DC: The World Bank; 1999;8:196-201.
World Heart Federation: 4th World Congress on Cardiology, 26-30 Sydney 2002
Yang S., xiong K, Soulisakhone, Vang C. Socio-economic Impact of Stroke in Laos. Thesis for the degree of Bachelor Degree. Faculty of Medical Sciences, National University of Laos, 2006

49
APPENDICES
Appendix A: Kish Method used to randomize participant to this
study
1 Kish Household List
Directions Match the household number assigned to the household with the Kish table below and identify which table from the Kish Summary of Eight Tables should be used.
Household Kish Table Household Kish Table
1 A 26 A
2 A 27 B1
3 B1 28 B2
4 B2 29 C
5 C 30 C
6 C 31 D
7 D 32 D
8 D 33 E1
9 E1 34 E2
10 E2 35 F
11 F 36 F
12 F 37 A
13 A 38 A
14 A 39 B1
15 B1 40 B2
16 B2 41 C
17 C 42 C
18 C 43 D
19 D 44 D
20 D 45 E1
21 E1 46 E2
22 E2 47 F
23 F 48 F
24 F 49 A
25 A etc. etc.

50
2 Kish Household Coversheet
Directions to
fill out Adult
N°
Order the adults 1-6 by: males in order of decreasing age (oldest to youngest) females in order of decreasing age (oldest to youngest) Example:
Sex Age Adult n°
M 45 1
F 47 3
M 25 2
List all persons age 25-64 in household
Sex Age Adult n° Selected Respondent
Selection Table A
If n° of
adults is:
Select
adult n°
1 1
2 1
3 1
4 1
5 1
6 or more 1
Selection Table B1
If n° of
adults is:
Select
adult n°
1 1
2 1
3 1
4 1
5 2
6 or more 2
Selection Table B2
If n° of
adults is:
Select
adult n°
1 1
2 1
3 1
4 2
5 2
6 or more 2
Selection Table C
If n° of
adults is:
Select
adult n°
1 1
2 1
3 2
4 2
5 3
6 or more 3
Household Number ________
Cluster Number__________
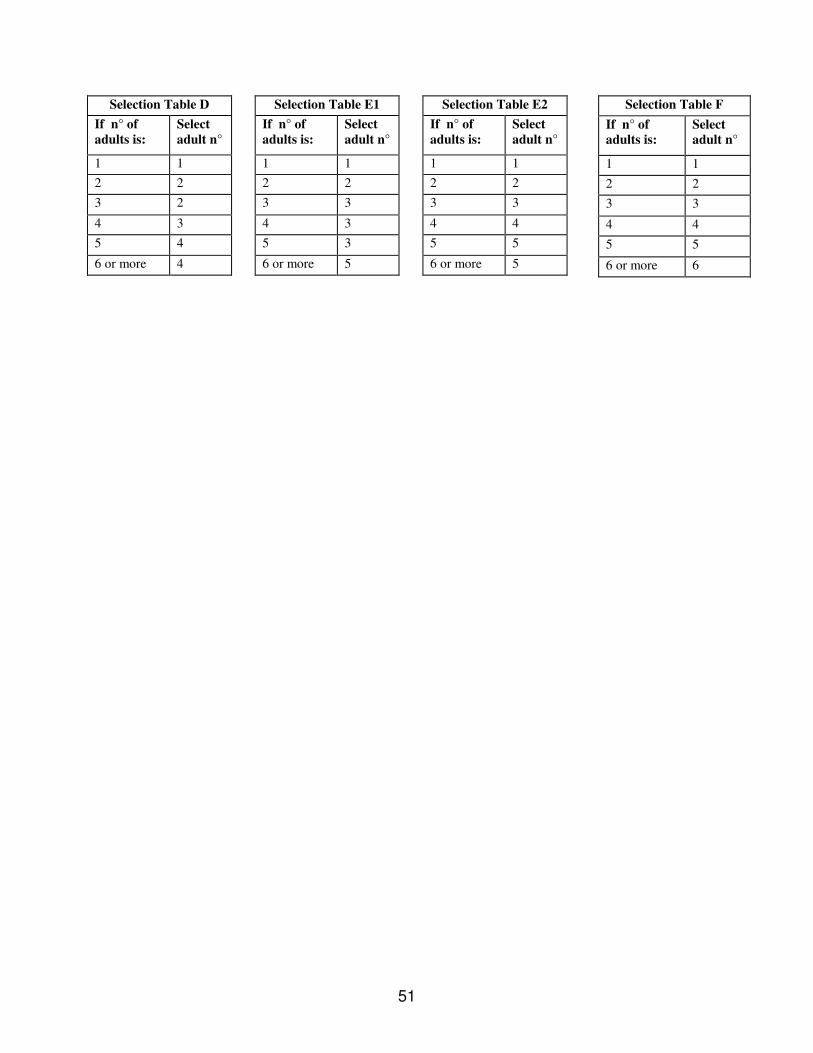
51
Selection Table D
If n° of
adults is:
Select
adult n°
1 1
2 2
3 2
4 3
5 4
6 or more 4
Selection Table E1
If n° of
adults is:
Select
adult n°
1 1
2 2
3 3
4 3
5 3
6 or more 5
Selection Table E2
If n° of
adults is:
Select
adult n°
1 1
2 2
3 3
4 4
5 5
6 or more 5
Selection Table F
If n° of
adults is:
Select
adult n°
1 1
2 2
3 3
4 4
5 5
6 or more 6
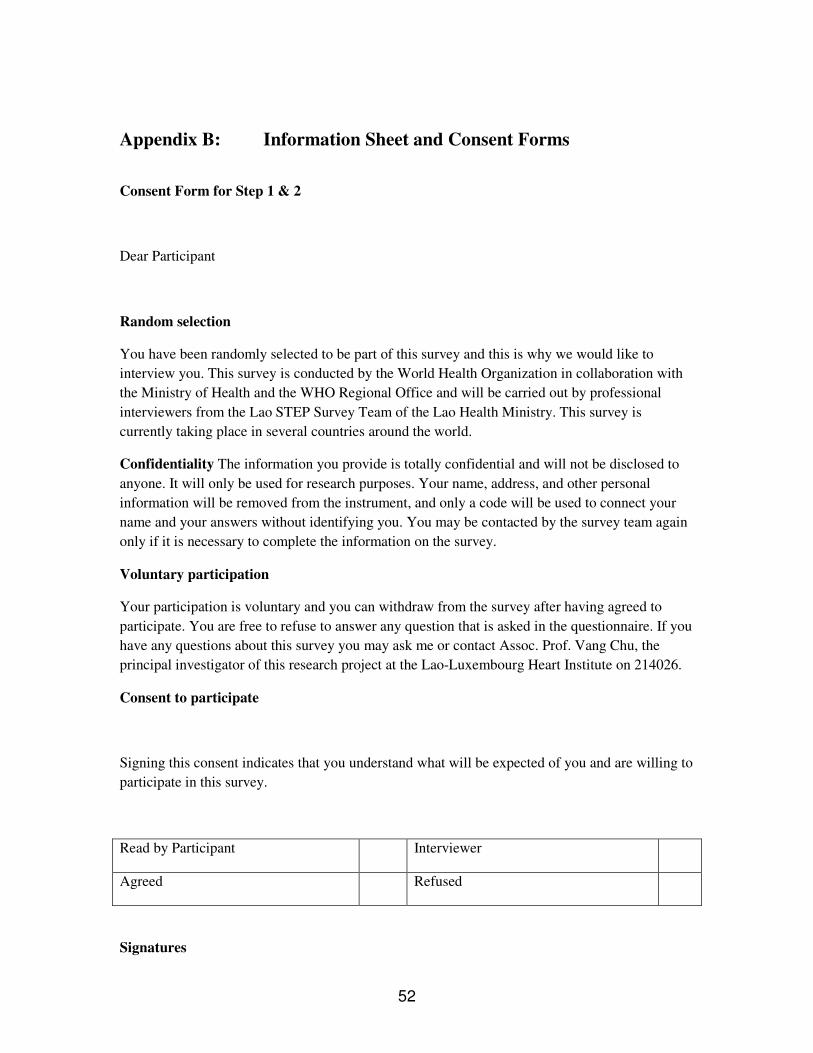
52
Appendix B: Information Sheet and Consent Forms
Consent Form for Step 1 & 2
Dear Participant
Random selection
You have been randomly selected to be part of this survey and this is why we would like to
interview you. This survey is conducted by the World Health Organization in collaboration with
the Ministry of Health and the WHO Regional Office and will be carried out by professional
interviewers from the Lao STEP Survey Team of the Lao Health Ministry. This survey is
currently taking place in several countries around the world.
Confidentiality The information you provide is totally confidential and will not be disclosed to
anyone. It will only be used for research purposes. Your name, address, and other personal
information will be removed from the instrument, and only a code will be used to connect your
name and your answers without identifying you. You may be contacted by the survey team again
only if it is necessary to complete the information on the survey.
Voluntary participation
Your participation is voluntary and you can withdraw from the survey after having agreed to
participate. You are free to refuse to answer any question that is asked in the questionnaire. If you
have any questions about this survey you may ask me or contact Assoc. Prof. Vang Chu, the
principal investigator of this research project at the Lao-Luxembourg Heart Institute on 214026.
Consent to participate
Signing this consent indicates that you understand what will be expected of you and are willing to
participate in this survey.
Read by Participant Interviewer
Agreed Refused
Signatures
53
I hereby provide INFORMED CONSENT to take part in Steps 1 and 2 of the
Risk Factors Study. For participants under 21 years old, a parent or guardian
must also sign this form.
Name: ______________________________ Sign: ______________________________
Witness: _____________________________ Sign: ______________________________

54
Appendix C Questionnaire form
Participant Identification Number └─┴─┘ └─┴─┘└─┴─┘
WHO STEPS Instrument for Chronic Disease Risk Factor Surveillance
Lao PDR, Vientiane Capital City
Respondent Identification, Location and Date
STEPS Q
No.
STEPS Question Choice for answer response Code
Respondent Identification 1-999999 ID
1 District code 1-999
└─┴─┴─┘ I1
2 Centre/Village name Text I2
3 Centre/Village code 1-999
└─┴─┴─┘ I3
4 Interviewer Identification 1-999
└─┴─┴─┘ I4

55
5 Date of completion of the instrument Value entered as date
dd/mm/yyyy
└─┴─┘ └─┴─┘ └─┴─┴─┴─┘ I5
Consent, Interview Language and Name
STEPS Q
No.
STEPS Question Choice for answer response Code
1 Yes
2 No
7 Don't Know
8 Not applicable
6 Consent has been read out to participant
9 Missing
I6
1 Yes 7 Consent has been obtained (verbal or written) If no
consent end 2 No
I7

56
1 English
2 Lao
3 Hmong
8 Interview Language
4 Others
I8
9 Time of interview
(24 hour clock) text
I9
10 Family Name text I10
11 First Name text I11
12 Contact phone number where possible text I12
1 Work
2 Home
3 Neighbour
4 Other (specify)
I13
13 Specify whose phone
Text- Other
1 ___________________________
2 ___________________________
3 ___________________________
4 ___________________________
Text- Other___________________ I13othe
r

57
Step 1: Demographic Information
STEPS Q
No.
STEPS Question Choice for answer response Code
1 Male 14
Sex (Record Male / Female as observed)
2 Female
C1
15 What is your date of birth?
Don't Know 77 777 7777
Value entered as date
dd/mm/yyyy
C2
16 How old are you? 25-64 C3
0-22
77 Don't know
88 Refused
17 In total, how many years have you spent at
school or in full-time study (excluding pre-
school)?
99 Missing
C4

58
1 Lao Lum
2 Lao Sung
3 Lao Theung
4 Other
8 Refused
18 What is your [insert relevant ethnic group /
racial group / cultural subgroup / others]
background?
9 Missing
C5
1 No formal schooling
2 Less than primary school
3 Primary school completed
4 Secondary school completed
5 High school completed
6 College/University completed
7 Post graduate degree
77 Don't know
88 Refused
19 What is the highest level of education you
have completed?
99 Missing
C6
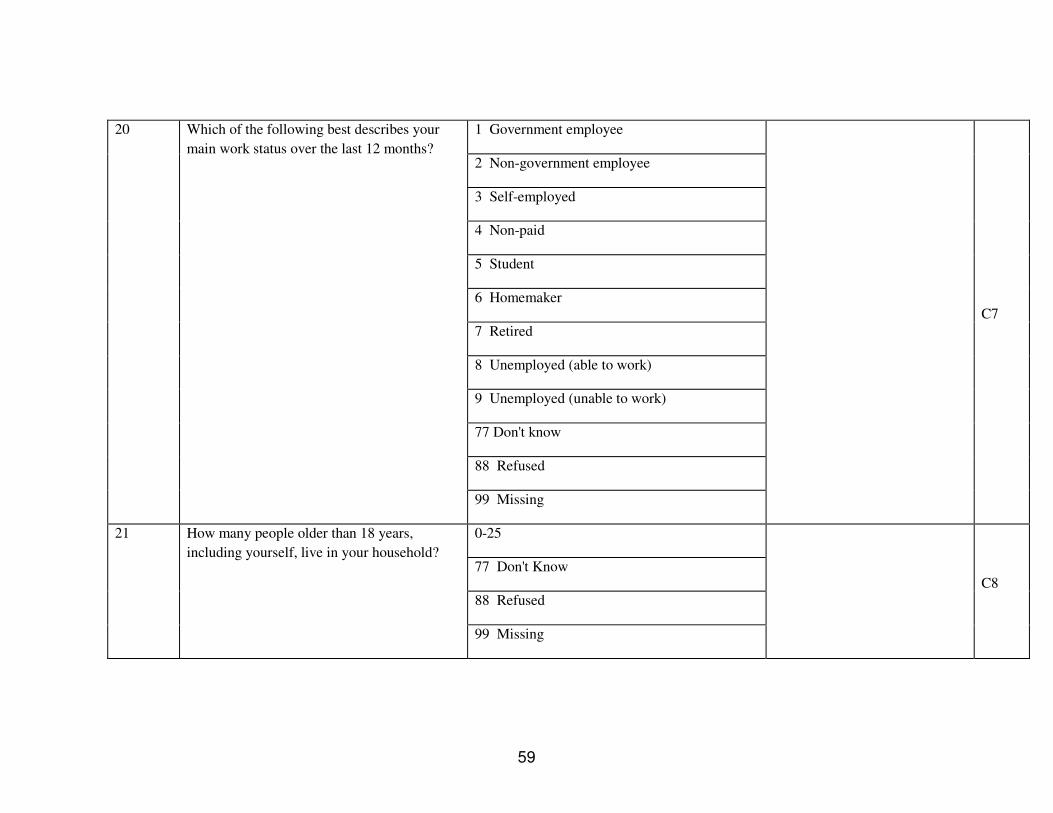
59
1 Government employee
2 Non-government employee
3 Self-employed
4 Non-paid
5 Student
6 Homemaker
7 Retired
8 Unemployed (able to work)
9 Unemployed (unable to work)
77 Don't know
88 Refused
20 Which of the following best describes your
main work status over the last 12 months?
99 Missing
C7
0-25
77 Don't Know
88 Refused
21 How many people older than 18 years,
including yourself, live in your household?
99 Missing
C8

60
1-9999999 Per week
7777777 DK
C9a
1-9999999 Per month
7777777 DK C9b
1-9999999 Per year
7777777 DK
C9c
22 Taking the past year, can you tell me what the
average earnings of the household have been?
(RECORD ONLY ONE, NOT ALL 3)
(If known any of them go to T1)
8 Refused
C9d
1 ≤ 500 USD
2 500-1000 USD
3 1000-1500 USD
4 1500-2000 USD
5 ≥2000 USD
7 Don't Know
8 Refused
23 If you don’t know the amount, can you give
an estimate of the annual household income if
I read some options to you? Is it
9 Missing
C10
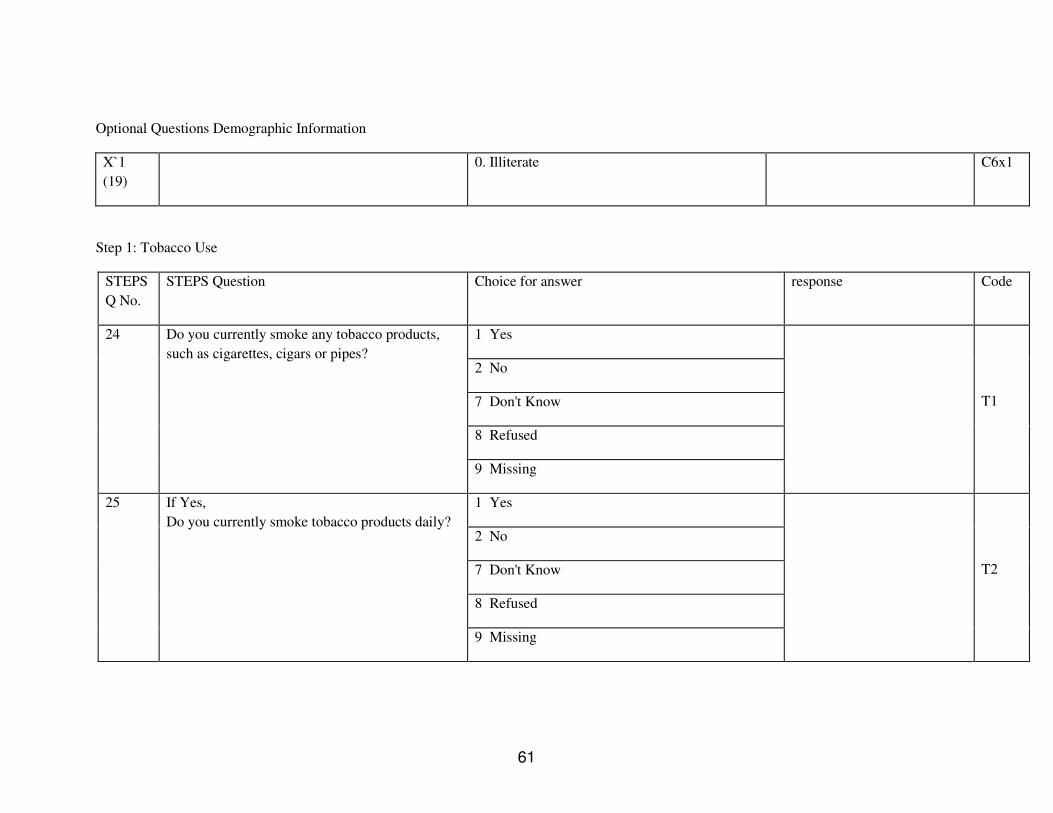
61
Optional Questions Demographic Information
X`1
(19)
0. Illiterate C6x1
Step 1: Tobacco Use
STEPS
Q No.
STEPS Question Choice for answer response Code
1 Yes
2 No
7 Don't Know
8 Refused
24 Do you currently smoke any tobacco products,
such as cigarettes, cigars or pipes?
9 Missing
T1
1 Yes
2 No
7 Don't Know
8 Refused
25 If Yes,
Do you currently smoke tobacco products daily?
9 Missing
T2

62
8-64
77 Don't Know
88 No Applicable
26 How old were you when you first started smoking
daily?
(If known go to T5a)
99 Missing
T3
1-55 (years)
77 Don't Know
88 No Applicable
99 Missing
T4a
1-24 (months)
777 Don't Know
88 No Applicable
99 Missing
T4b
1-48 (weeks)
77 Don't Know
88 No Applicable
27 Do you remember how long ago it was?
(RECORD ONLY 1, NOT ALL 3)
(If known any of the answer of T4a or T4b or
T4c, go to T5a)
99 Missing
T4c

63
1-50
77 Don't know
88 Refused Manufactured cigarettes
99 Missing
T5a
1-50
77 Don't know
88 Refused Hand-rolled cigarettes
99 Missing
T5b
1-50
77 Don't know
88 Refused
Pipes full of tobacco
99 Missing
T5c
1-50
77 Don't know
88 Refused
28 On average, how many of the following do you
smoke each day?
(RECORD FOR EACH TYPE)
(If other go to T5other)
Cigars, cheroots,
cigarillos
99 Missing
T5d

64
1-50
77 Don't know
88 Refused
Other
99 Missing
T5e
Other (please specify): Text T5oth
er
1 Yes
2 No
7 Don't Know
8 Refused
29 In the past, did you ever smoke daily?
(If No go to T9)
9 Missing
T6
10-64
77 Don't Know
88 Refused
30 If Yes, How old were you when you stopped
smoking daily?
(If known go to T9)
99 Missing
T7

65
1-54 (years)
77 Don't Know
88 No Applicable
99 Missing
T8a
1-24 (months)
77 Don't Know
88 No Applicable
99 Missing
T8b
1-48 (weeks)
77 Don't Know
88 No Applicable
31 How long ago did you stop smoking daily?
(RECORD ONLY 1, NOT ALL 3)
(If known go to T9)
99 Missing
T8c

66
1 Yes
2 No
7 Don't Know
8 Refused
32 Do you currently use any smokeless tobacco such
as [snuff, chewing tobacco, betel]?
(If No go to T12)
9 Missing
T9
1 Yes
2 No
7 Don't Know
8 Refused
33 If Yes,
Do you currently use smokeless tobacco products
daily?
(If No go to T12)
9 Missing
T10
1-50
77 Don't know
88 Refused
Snuff, by mouth
99 Missing
T11a
1-50
34 On average, how many times a day do you use
….
(RECORD FOR EACH TYPE)
(If other go to T11other) Snuff, by nose
77 Don't know
T11b

67
88 Refused
99 Missing
1-50
77 Don't know
88 Refused Chewing tobacco
99 Missing
T11c
1-50
77 Don't know
88 Refused
Betel, quid
99 Missing
T11d
1-50
77 Don't know
88 Refused
Other
99 Missing
T11e
Other (please specify): Text T11oth
er

68
1 Yes
2 No
7 Don't Know
8 Refused
35 In the past, did you ever use smokeless tobacco
such as [snuff, chewing tobacco, or betel] daily?
(USE SHOWCARD OR SHOW EXAMPLES)
9 Missing
T12
Step 1: Alcohol Use
STEPS
Q No.
STEPS Question Choice for answer
response Code
1 Yes
2 No
7 Don't Know
8 Refused
36 Have you consumed alcohol (such as beer, wine,
spirits, fermented cider or [add other local
examples] within the past 12 months?
(If No go to D1)
9 Missing
A1
37 In the past 12 months, how frequently have you 1 (Daily) A2

69
2 (5-6 days per week)
3 (1-4 days per week)
4 (1-3 days per month)
5 (Less than once a month)
7 Don't Know
8 Refused
had at least one drink?
(USE SHOWCARD)
9 Missing
Number 1-50
77 Don't Know
88 Refused / NA
38 When you drink alcohol, on average, how many
drinks do you have during one day?
99 Missing
A3
1 Yes
2 No
7 Don't Know
8 Refused
39 Have you consumed alcohol (such as beer, wine,
spirits, fermented cider or [add other local
examples] within the past 30 days?
(USE SHOWCARD OR SHOW EXAMPLES. If
No go to A6)
9 Missing
A4
40 During each of the past 7 days, how many Monday 1-50 A5a

70
77 Don't know
88 Refused
99 Missing
1-50
77 Don't know
88 Refused
Tuesday
99 Missing
A5b
1-50
77 Don't know
88 Refused Wednesday
99 Missing
A5c
1-50
77 Don't know
88 Refused Thursday
99 Missing
A5d
1-50
standard drinks of any alcoholic drink did you
have each day?
(RECORD FOR EACH DAY
USE SHOWCARD)
Friday
77 Don't know
A5e
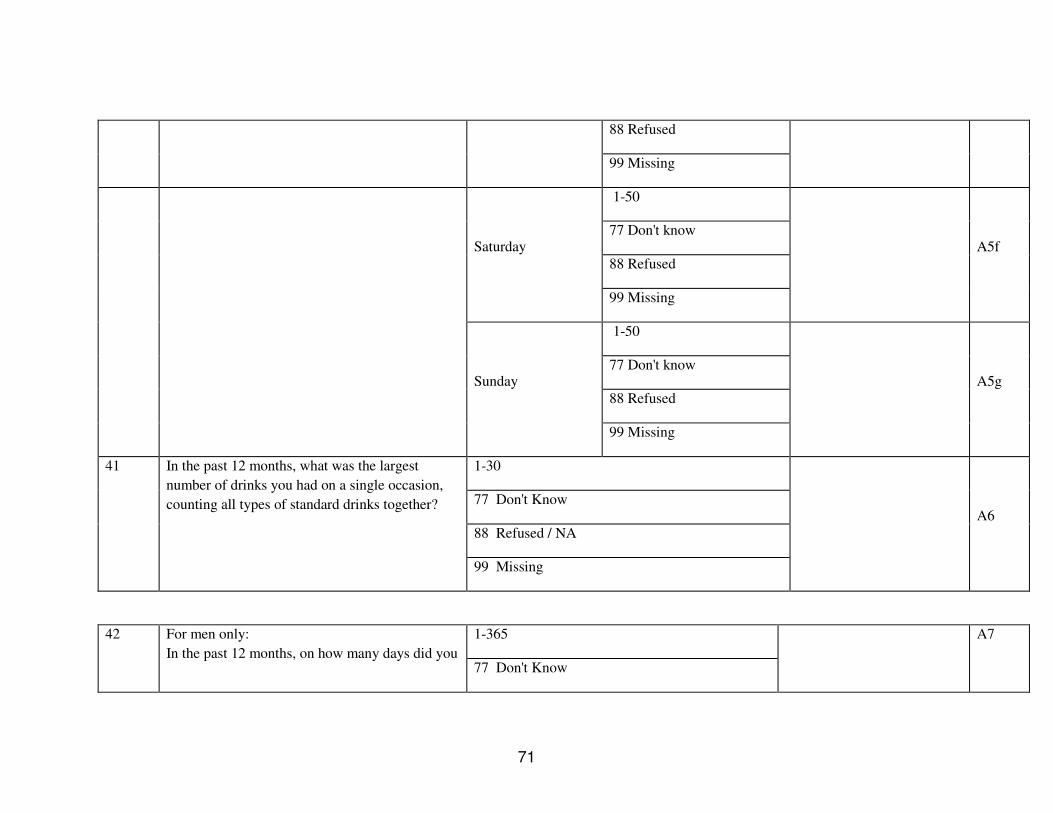
71
88 Refused
99 Missing
1-50
77 Don't know
88 Refused Saturday
99 Missing
A5f
1-50
77 Don't know
88 Refused
Sunday
99 Missing
A5g
1-30
77 Don't Know
88 Refused / NA
41 In the past 12 months, what was the largest
number of drinks you had on a single occasion,
counting all types of standard drinks together?
99 Missing
A6
1-365 42 For men only:
In the past 12 months, on how many days did you 77 Don't Know
A7

72
88 Refused / NA have five or more standard drinks in a single day?
99 Missing
1-365
77 Don't Know
88 Refused / NA
43 For women only:
In the past 12 months, on how many days did you
have four or more standard drinks in a single
day?
(If zero days go to D3) 99 Missing
A8
X2 Do you avoid alcohol intake during Khao Phansa
Period ?
1. Yes
2. No
A 9x2

73
Step 1: Diet
STEPS
Q No.
STEPS Question Choice for answer response Code
Days 0-7 44 In a typical week, on how many days do you eat
fruit? 9 Missing
D1
Number 1-15
77 Don't Know
88 Refused / NA
45 How many servings of fruit do you eat on one of
those days?
(USE SHOWCARD) 99 Missing
D2
Days 0-7 46 In a typical week, on how many days do you eat
vegetables?
(USE SHOWCARD)
(If zero day go to D5)
99 Missing
D3

74
Number 1-15
77 Don't Know
88 Refused / NA
47 How many servings of vegetables do you eat on
one of those days?
(USE SHOWCARD)
99 Missing
D4
1 Vegetable oil
2 Lard or suet
3 Butter or ghee
4 Margarine
5 Other
6 None in particular
7 None used
77 Don’t know
99 Missing
D5
48 What type of oil or fat is most often used for meal
preparation in your household?
(USE SHOWCARD
SELECT ONLY ONE)
(If other go to D5other)
Other (please
specify): Text
D5oth
er

75
Step 1: Physical Activity
STEPS
Q No.
STEPS Question Choice for answer response Code
Activity at work
1 Yes
2 No
7 Don't Know
8 Refused
49 Does your work involve vigorous-intensity activity
that causes large increases in breathing or heart rate
like [carrying or lifting heavy loads, digging or
construction work] for at least 10 minutes
continuously?
(USE SHOWCARD)
(If No go to P4)
9 Missing
P1
Days 1-7 50 In a typical week, on how many days do you do
vigorous-intensity activities as part of your work? 9 Missing
P2

76
Hours 1-24
77 Don't Know
99 Missing
P3A
Minutes 1-60
77 Don't Know
51 How much time do you spend doing vigorous-
intensity activities at work on a typical day?
99 Missing
P3B
1 Yes
2 No
7 Don't Know
8 Refused
52 Does your work involve moderate-intensity
activity, that causes small increases in breathing or
heart rate such as brisk walking [or carrying light
loads] for at least 10 minutes continuously?
(USE SHOWCARD)
(If No go to P7)
9 Missing
P4
Days 1-7 53 In a typical week, on how many days do you do
moderate-intensity activities as part of your work? 9 Missing
P5
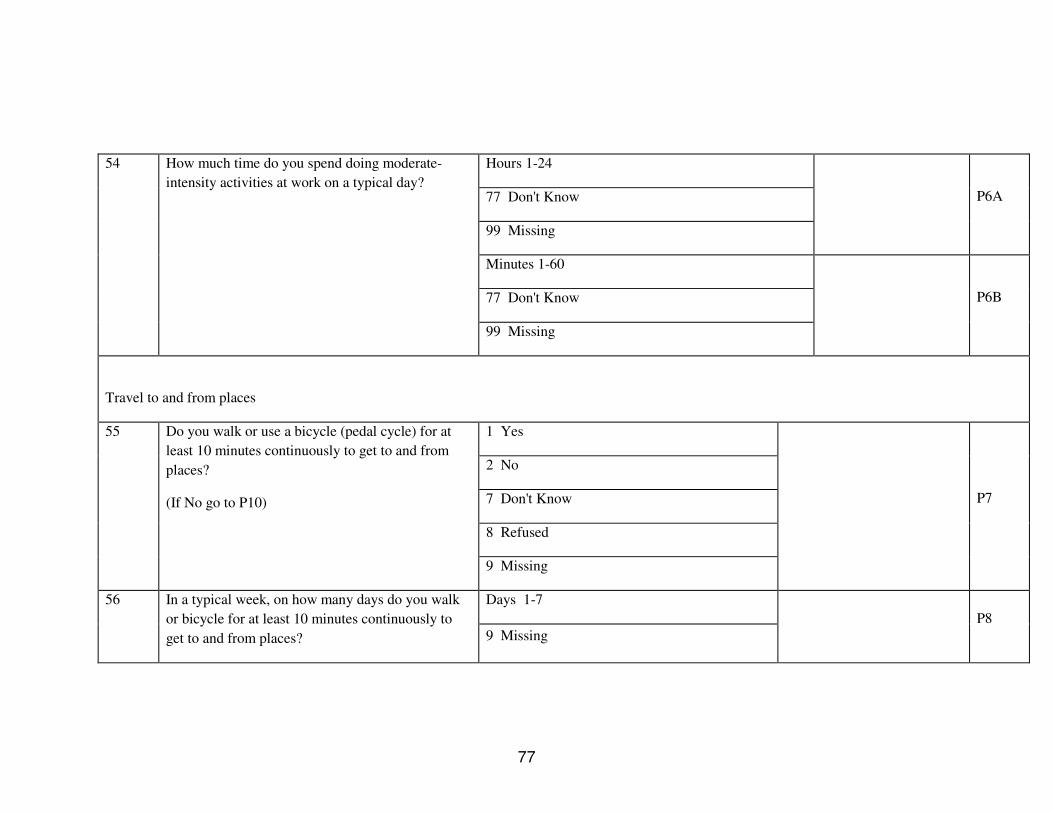
77
Hours 1-24
77 Don't Know
99 Missing
P6A
Minutes 1-60
77 Don't Know
54 How much time do you spend doing moderate-
intensity activities at work on a typical day?
99 Missing
P6B
Travel to and from places
1 Yes
2 No
7 Don't Know
8 Refused
55 Do you walk or use a bicycle (pedal cycle) for at
least 10 minutes continuously to get to and from
places?
(If No go to P10)
9 Missing
P7
Days 1-7 56 In a typical week, on how many days do you walk
or bicycle for at least 10 minutes continuously to
get to and from places? 9 Missing
P8

78
Hours 1-24
77 Don't Know
99 Missing
P9a
Minutes 1-60
77 Don't Know
57 How much time do you spend walking or bicycling
for travel on a typical day?
99 Missing
P9b
1 Yes
2 No
7 Don't Know
8 Refused
58 Do you do any vigorous-intensity sports, fitness or
recreational (leisure) activities that cause large
increases in breathing or heart rate like [running or
football, ] for at least 10 minutes continuously?
(USE SHOWCARD)
(If No go to P13) 9 Missing
P10
Days 1-7 59 In a typical week, on how many days do you do
vigorous-intensity sports, fitness or recreational
(leisure) activities? 9 Missing
P11

79
Hours 1-24
77 Don't Know
99 Missing
P12a
Minutes 1-60
77 Don't Know
60 How much time do you spend doing vigorous-
intensity sports, fitness or recreational activities on
a typical day?
99 Missing
P12b
1 Yes
2 No
7 Don't Know
8 Refused
61 Do you do any moderate-intensity sports, fitness or
recreational (leisure) activities that causes a small
increase in breathing or heart rate such as brisk
walking,(cycling, swimming, volleyball)for at least
10 minutes continuously?
(USE SHOWCARD)
(If No go to P16) 9 Missing
P13
Days 1-7 62 In a typical week, on how many days do you do
moderate-intensity sports, fitness or recreational
(leisure) activities? 9 Missing
P14

80
Hours 1-24
77 Don't Know
99 Missing
P15a
Minutes 1-60
77 Don't Know
63 How much time do you spend doing moderate-
intensity sports, fitness or recreational (leisure)
activities on a typical day?
99 Missing
P15b
Sedentary behaviour
Hours 1-24
77 Don't Know
99 Missing
P16a
Minutes 1-60
77 Don't Know
64 How much time do you usually spend sitting or
reclining on a typical day?
99 Missing
P16b

81
Step 1: History of Raised Blood Pressure
STEPS
Q No.
STEPS Question Choice for answer response Code
1 Within past 12 months
2 (1-5 years ago)
3 Not within past 5 years
7 Don't Know
8 Refused
65 When was your blood pressure last measured by a
health professional?
9 Missing
H1
1 Yes
2 No
7 Don't Know
8 Refused
66 During the past 12 months have you been told by a
doctor or other health worker that you have raised
blood pressure or hypertension?
9 Missing
H2
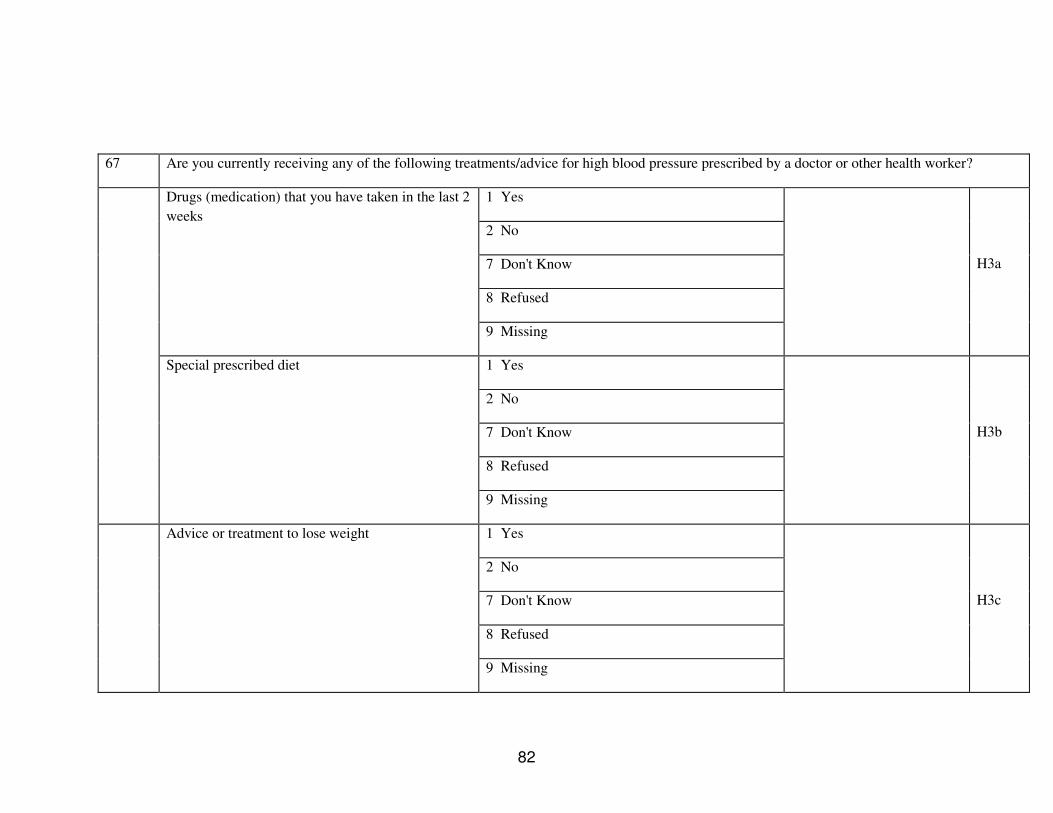
82
67 Are you currently receiving any of the following treatments/advice for high blood pressure prescribed by a doctor or other health worker?
1 Yes
2 No
7 Don't Know
8 Refused
Drugs (medication) that you have taken in the last 2
weeks
9 Missing
H3a
1 Yes
2 No
7 Don't Know
8 Refused
Special prescribed diet
9 Missing
H3b
1 Yes
2 No
7 Don't Know
8 Refused
Advice or treatment to lose weight
9 Missing
H3c
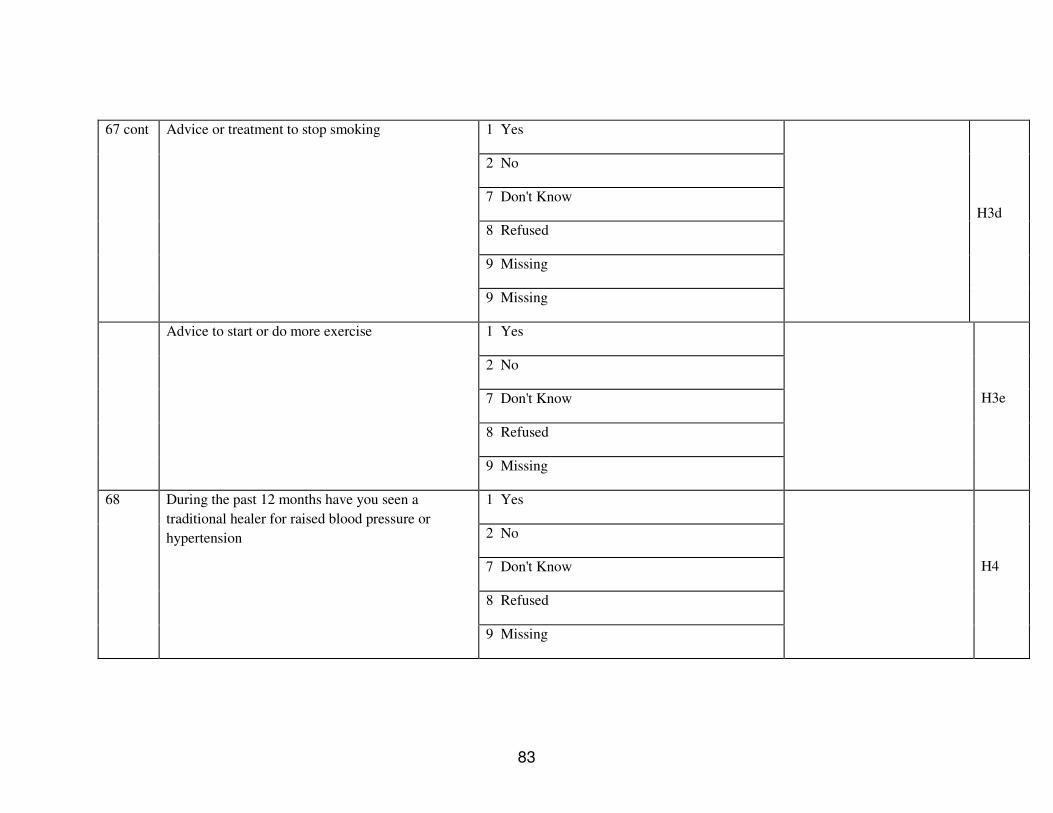
83
1 Yes
2 No
7 Don't Know
8 Refused
9 Missing
67 cont Advice or treatment to stop smoking
9 Missing
H3d
1 Yes
2 No
7 Don't Know
8 Refused
Advice to start or do more exercise
9 Missing
H3e
1 Yes
2 No
7 Don't Know
8 Refused
68 During the past 12 months have you seen a
traditional healer for raised blood pressure or
hypertension
9 Missing
H4

84
1 Yes
2 No
7 Don't Know
8 Refused
69 Are you currently taking any herbal or traditional
remedy for your raised blood pressure?
9 Missing
H5
Step 1: History of Diabetes
STEPS
Q No.
STEPS Question Choice for answer
response Code
1 Yes
2 No
7 Don't Know
8 Refused
70 Have you had your blood sugar measured in the last
12 months?
9 Missing
H6

85
1 Yes
2 No
7 Don't Know
8 Refused
71 During the past 12 months, have you ever been told
by a doctor or other health worker that you have
diabetes?
9 Missing
H7
72 Are you currently receiving any of the following treatments/advice for diabetes prescribed by a doctor or other health worker?
1 Yes
2 No
7 Don't Know
8 Refused
Insulin
9 Missing
H8a
1 Yes
2 No
7 Don't Know
8 Refused
Oral drug (medication) that you have taken in the
last 2 weeks
9 Missing
H8b
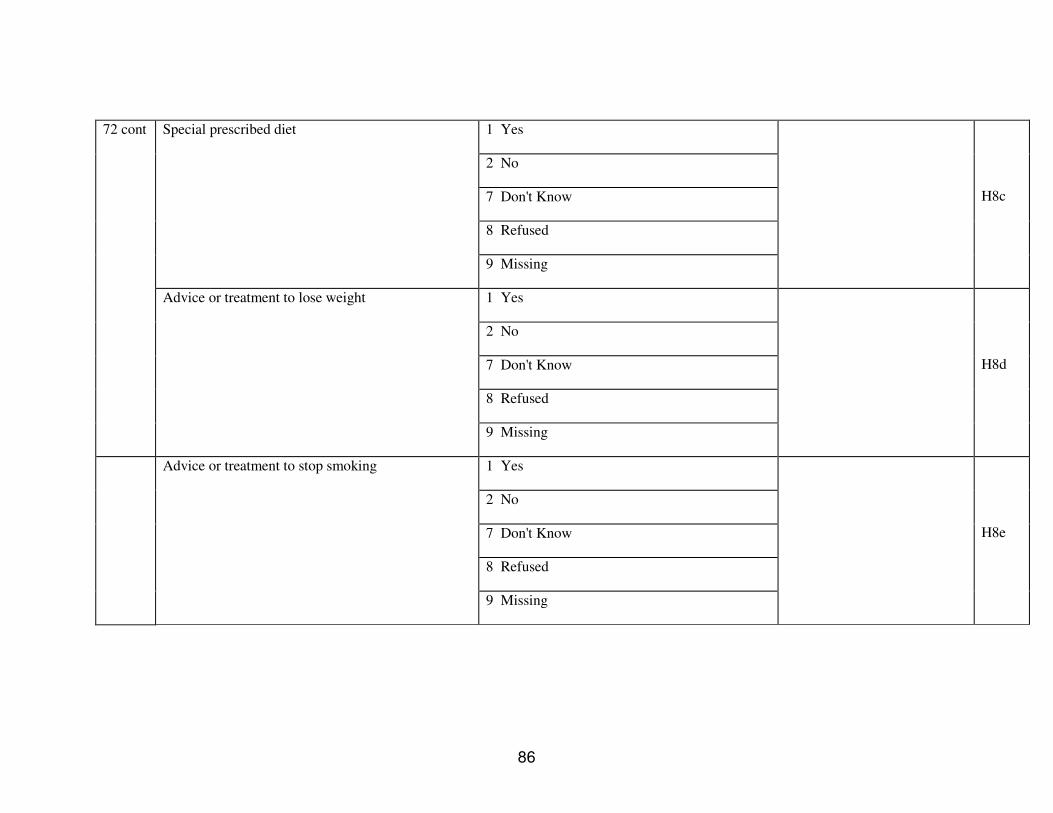
86
1 Yes
2 No
7 Don't Know
8 Refused
Special prescribed diet
9 Missing
H8c
1 Yes
2 No
7 Don't Know
8 Refused
72 cont
Advice or treatment to lose weight
9 Missing
H8d
1 Yes
2 No
7 Don't Know
8 Refused
Advice or treatment to stop smoking
9 Missing
H8e

87
1 Yes
2 No
7 Don't Know
8 Refused
Advice to start or do more exercise
9 Missing
H8f
1 Yes
2 No
7 Don't Know
8 Refused
73 During the past 12 months have you seen a
traditional healer for diabetes?
9 Missing
H9
1 Yes
2 No
7 Don't Know
8 Refused
74 Are you currently taking any herbal or traditional
remedy for your diabetes?
9 Missing
H10

88
Step 2: Physical Measurements
STEPS
Q No.
STEPS Question Choice for answer
response Code
Height and weight
1-900 75 Interviewer ID
999 Missing
M1
1-90 Height
99 Missing
M2a
1-90
76 Device IDs for height and weight
Weight 99 Missing
M2b
100.0-270.0
888.8 Refused
77 Height
999.9 Missing
M3
20.0-350.0
666.6 Too large for scale
888.8 Refused
78 Weight (Avoid measuring if pregnant woman)
999.9 Missing
M4
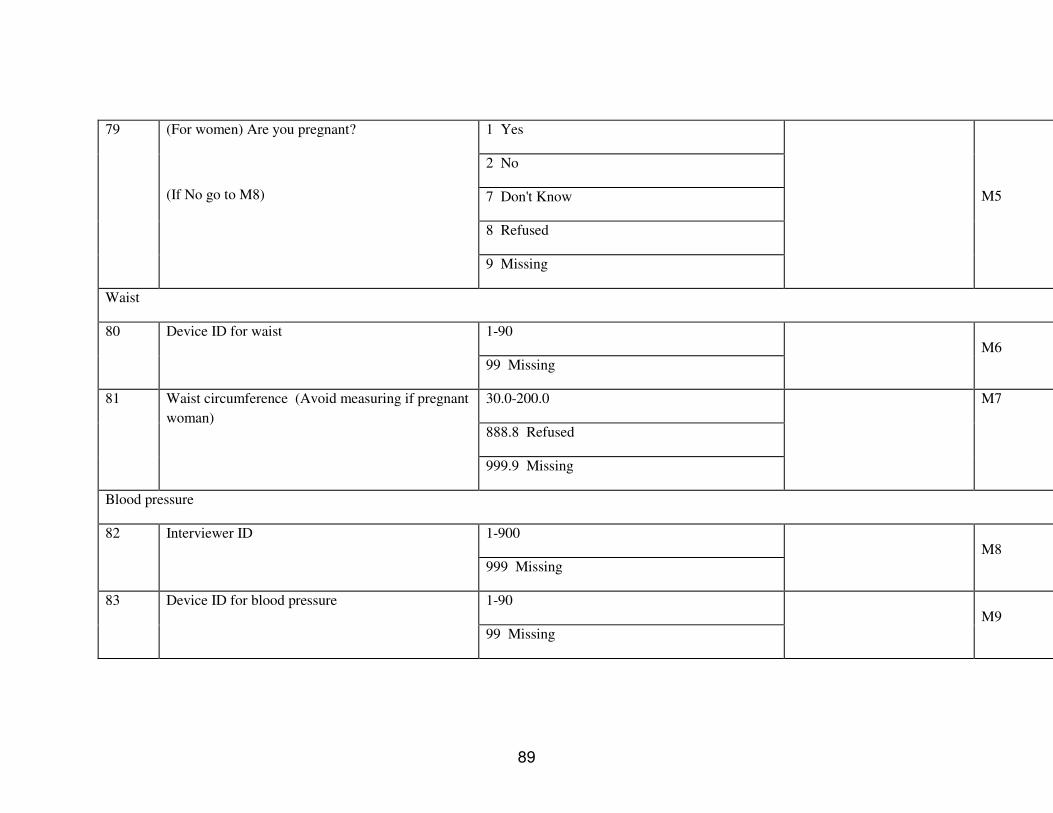
89
1 Yes
2 No
7 Don't Know
8 Refused
79 (For women) Are you pregnant?
(If No go to M8)
9 Missing
M5
Waist
1-90 80 Device ID for waist
99 Missing
M6
30.0-200.0
888.8 Refused
81 Waist circumference (Avoid measuring if pregnant
woman)
999.9 Missing
M7
Blood pressure
1-900 82 Interviewer ID
999 Missing
M8
1-90 83 Device ID for blood pressure
99 Missing
M9

90
1 Small
2 Medium
3 Large
84 Cuff size used
9 Missing
M10
40.0-300
888 Refused Systolic
999 Missing
M11a
30.0-200.0
888 Refused
85 Reading 1
Diastolic
999 Missing
M11b
40.0-300.0
888 Refused Systolic
999 Missing
M12a
30.0-200.0
888 Refused
86 Reading 2
Diastolic
999 Missing
M12b

91
40.0-300.0
888 Refused Systolic
999 Missing
M13a
30.0-200.0
888 Refused
87 Reading 3
Diastolic
999 Missing
M13b
1 Yes
2 No
7 Don't Know
8 Refused
88 During the past two weeks, have you been treated
for raised blood pressure with drugs (medication)
prescribed by a doctor or other health worker?
9 Missing
M14
Hip Circumference and Heart Rate
45.0-300.0
888.8 Refused
89 Hip circumference
999.9 Missing
M15

92
90 Heart Rate (Record if automatic blood pressure device is used)
30.0-200.0
888 Refused
Reading 1
999 Missing
M16a
30.0-200.0
888 Refused
Reading 2
999 Missing
M16b
30.0-200.0
888 Refused
Reading 3
999 Missing
M16c

93
Appendix D: Interview Tracking Form
Interview Tracking Form
House
hold
Number
Number
of
eligible
person
in house
hold
Participant
ID
Visit 1
at home
Visit 2
at home
M
25
to
34
M
35
to
44
M
45
to
54
M
55
to
64
F
25
to
34
F
35
to
44
F
45
to
54
F
45
to
54
F
55
to
64
S
T
E
P
1
E
S
T
E
P
1
Y
S
T
E
P
1
N
S
T
E
P
2
E
S
T
E
P
2
Y
S
T
E
P
2
N
Appoin
tment
time
Individu
al
comme
nt
E= eligible Y= yes N= No M= Male F= Female
Centre (Village/Cluster) Number______________________________________

94
Appendix E: Show Cards
1 List of Tobacco Products
For use with This show card relates to:
STEP Section Items
Step 1, core tobacco use T T1 to T8
Cigarettes
Cigarillos
Cigars
Cheroots
Chuttas
Bidis
Local tobacco products (each country to add to the list)
Local tobacco products (each country to add to the list)
Local tobacco products (each country to add to the list)
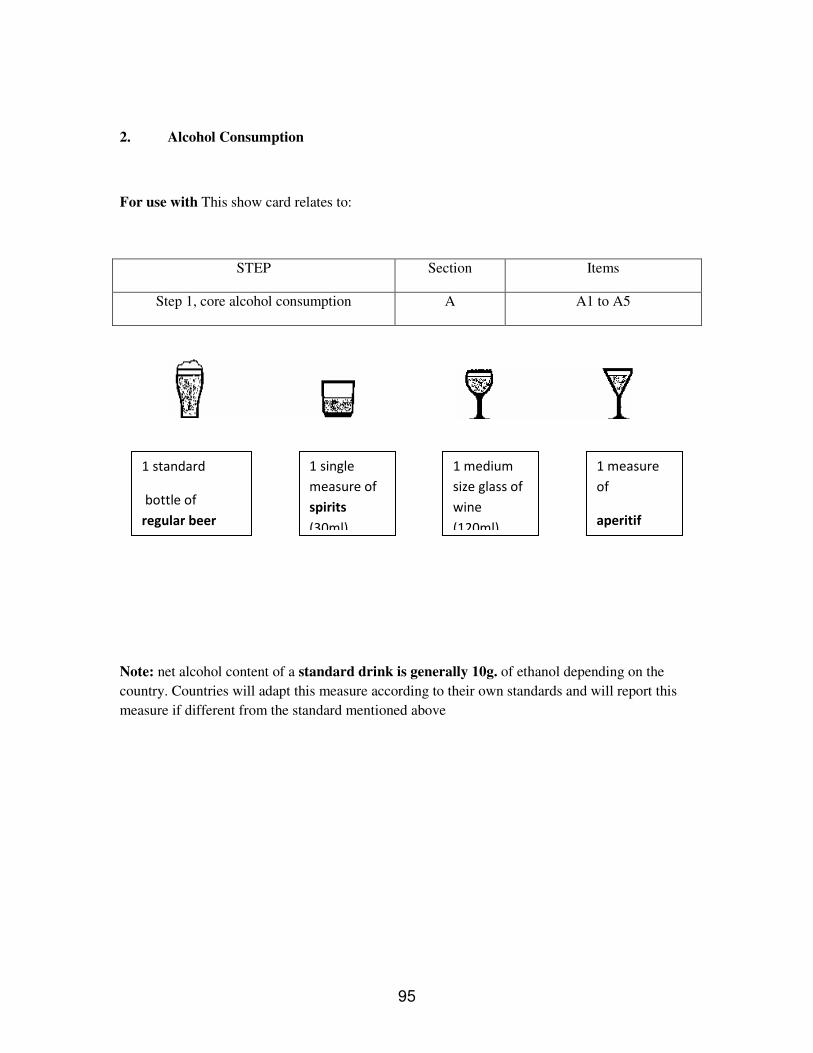
95
2. Alcohol Consumption
For use with This show card relates to:
STEP Section Items
Step 1, core alcohol consumption A A1 to A5
Note: net alcohol content of a standard drink is generally 10g. of ethanol depending on the
country. Countries will adapt this measure according to their own standards and will report this
measure if different from the standard mentioned above
1 standard
bottle of
regular beer
1 single
measure of
spirits
(30ml)
1 medium
size glass of
wine
(120ml)
1 measure
of
aperitif

96
3. Diet (Typical Fruit and Vegetables and Serving Sizes)
For use with This show card relates to:
STEP Section Items
Step 1, core Diet D D1 to D4
VEGETABLES
are considered to be:
1 Serving = Spinach, salad, etc.
Raw green leafy vegetables 1 cup Tomatoes, carrots, pumpkin,
corn,
Chinese cabbage, fresh beans,
onion,
etc.
Other vegetables, cooked or
chopped raw
1/2 cup
Vegetable juice 1/2 cup
FRUIT
Is considered to be:
1 Serving = Examples
Apple, banana, orange 1 medium
size piece
Chopped, cooked, canned fruit 1/2 cup
Fruit juice 1/2 cup Juice from fruit, not artificially
flavoured
97
Serving size
One standard serving = 80 grams (translated into different units of cups
depending on type of vegetable and standard cup measures available in the
country).
WHO recommendation at least
The World Health Organization recommends at least: 400 grams of vegetables and fruits
per day, or 5 servings of 80 grams each.
Note: Tubers such as potatoes and cassava, however, are not included in this
Recommendation

98
Appendix F Workshop on planning and implementation of
TEPWISE approach to surveillance of chronic
Diseases Risk Factors
Workshop on Planning and Implementation of the STEPwise approach to
Surveillance of Chronic Diseases Risk Factors
28 May - 1 June, 2007
Vientiane
MONDAY 28 MAY 2007
13:30 – 14:00 Opening Ceremony
Official opening by WHO representative on NCD in Laos, Dr.
Douangchack
Introductions, objectives of the workshop
Dr. Douangchack and Ms. Melanie Cowan
14:00 - 14:30 NCD Overview in Laos (Dr. Vangchu)
14:30 - 15:00 Overview and rationale of the WHO STEPwise approach to
surveillance
15:00 - 15:30 Break
15:30 - 16:30 Planning and Preparing a STEPS site and survey
16:30 - 17:00 Roles and responsibilities
TUESDAY 29 MAY. 2007
09:00 – 09:15 Review of Day 1 by participant
09:15 - 10:00 Overview of STEPS Survey Tools
10:00 - 10:45 STEPS Instrument (Part I)
10:45 - 11:00 Break
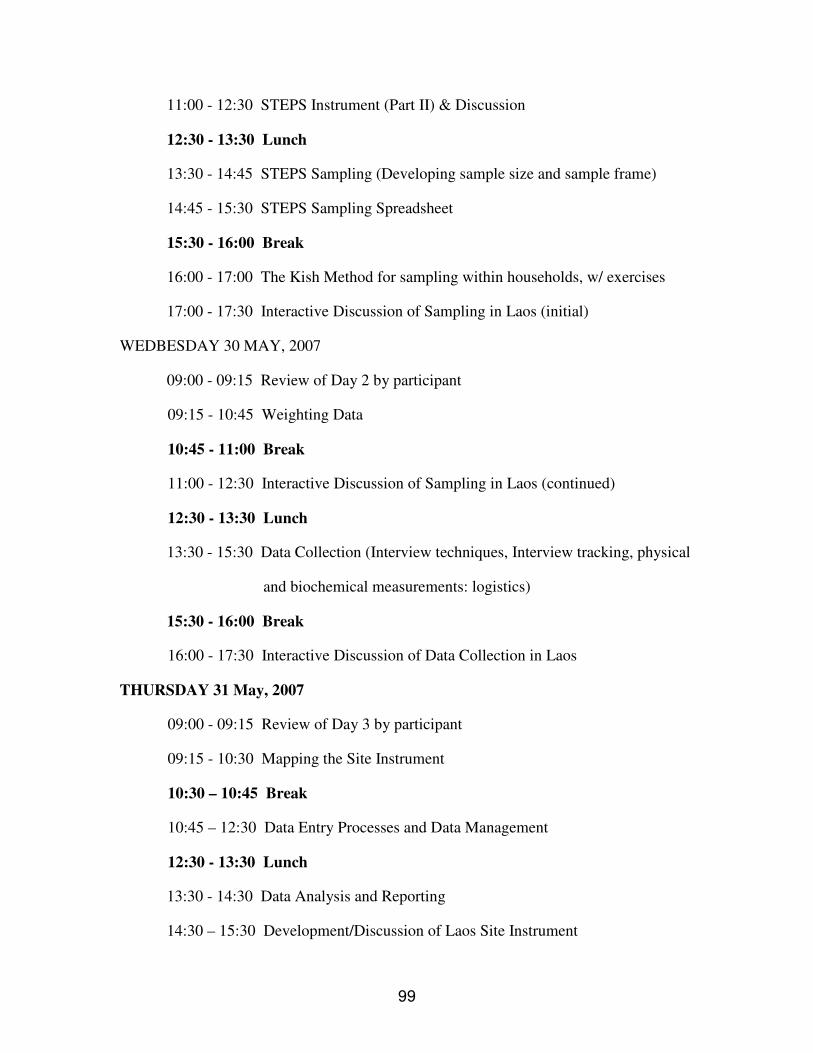
99
11:00 - 12:30 STEPS Instrument (Part II) & Discussion
12:30 - 13:30 Lunch
13:30 - 14:45 STEPS Sampling (Developing sample size and sample frame)
14:45 - 15:30 STEPS Sampling Spreadsheet
15:30 - 16:00 Break
16:00 - 17:00 The Kish Method for sampling within households, w/ exercises
17:00 - 17:30 Interactive Discussion of Sampling in Laos (initial)
WEDBESDAY 30 MAY, 2007
09:00 - 09:15 Review of Day 2 by participant
09:15 - 10:45 Weighting Data
10:45 - 11:00 Break
11:00 - 12:30 Interactive Discussion of Sampling in Laos (continued)
12:30 - 13:30 Lunch
13:30 - 15:30 Data Collection (Interview techniques, Interview tracking, physical
and biochemical measurements: logistics)
15:30 - 16:00 Break
16:00 - 17:30 Interactive Discussion of Data Collection in Laos
THURSDAY 31 May, 2007
09:00 - 09:15 Review of Day 3 by participant
09:15 - 10:30 Mapping the Site Instrument
10:30 – 10:45 Break
10:45 – 12:30 Data Entry Processes and Data Management
12:30 - 13:30 Lunch
13:30 - 14:30 Data Analysis and Reporting
14:30 – 15:30 Development/Discussion of Laos Site Instrument

100
15:30 - 16:00 Break
16:00 - 17:30 Development/Discussion of Laos Site Instrument
FRIDAY 1 JUNE, 2007
09:00 - 09:15 Review day 4 by participant
09:15 - 10: 30 Development of country implementation plans, preparation by
groups
10:30 – 11:00 Break
11:00 – 12:30 Development of country implementation plans (continued)
12:30 – 13:30 Lunch
13:30 - 15:30 Group presentations of country implementation plans
15:30 - 16:00 Break
16:00 - 16:45 Group presentations of country implementation plans / Discussion
16:45 - 17: 15 Discussion & next steps
Closing of workshop

101
Appendix G Data Collector Training Workshop Contents
Agenda of Activities and Venue for Data Collector Training Workshop 3-4/1/2008
Thursday: 3/1/2008
Time Contents Speakers
8:00-8:30 AM Registration
8:30-8:40 Introduction and objectives of the workshop Assoc. Prof.
Chanphomma
8:40-9:00 Overview on the Lao STEP Survey on NCD
Risk Factor Project
Assoc. Prof. Vang Chu
9:00-10:00 AM What should you know as data collectors ?
- How to approach to selected house hold
- How to randomize participant with the Kish method & Exercise cases 1, 2 and 3
- The NCD STEP Consent form 1 &2
Assoc. Prof. Vang Chu
10:00-10:30 AM Coffee Break
10:30-11:30 AM - How to interview using the Lao questionnaire form and show Card + Exercise 1 (STEP 1)
Assoc. Prof. Vang Chu
11:30-12:00 AM - How to measure BP, Weight, Height, Waist, Hip (STEP2)
Dr. Xaysana
12:00-13:00 PM Lunch Break
13:00-14:00 PM - Blood tests procedures (STEP 3) Dr. Xaysana
14:00-14:30 PM - Role of Lao STEP Survey in Lao National NCD prevention and control
- Data quality control and supervision - Data management and report
Assoc. Prof. Vang Chu
14:30-15:00 PM Coffee Break
15:00-16:00 PM Discussion on field trip for data collection Lead by Assoc.Prof.
Bounkong
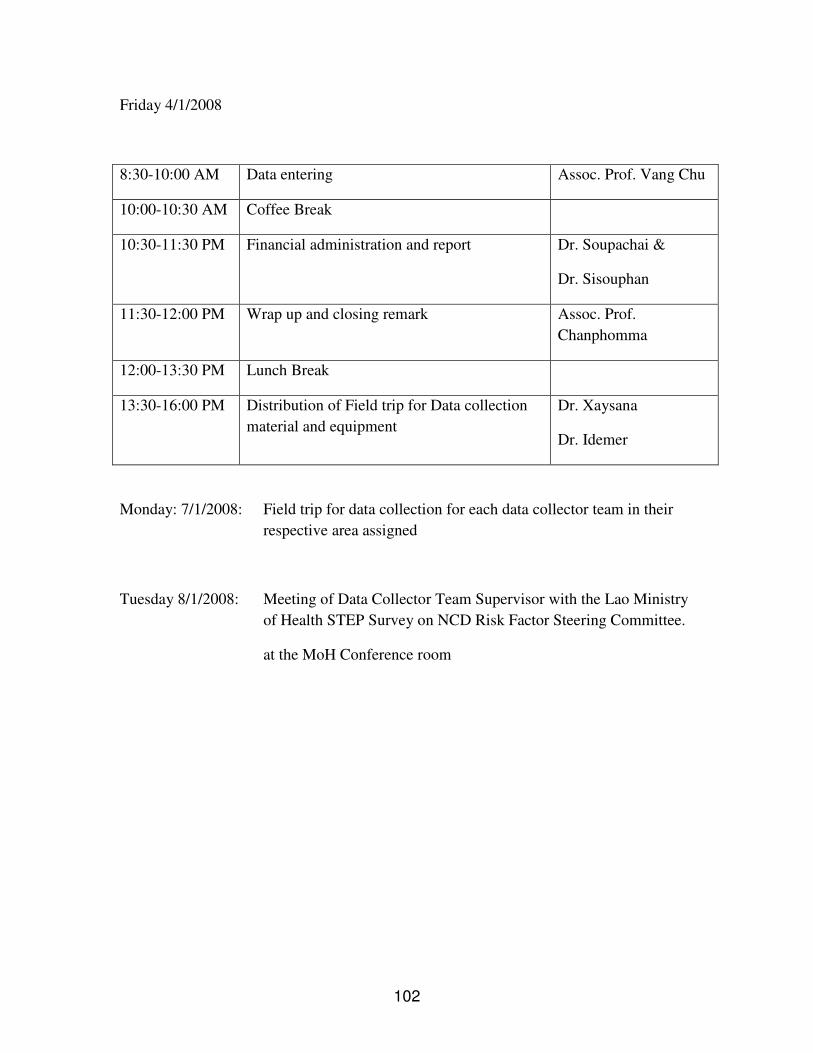
102
Friday 4/1/2008
8:30-10:00 AM Data entering Assoc. Prof. Vang Chu
10:00-10:30 AM Coffee Break
10:30-11:30 PM Financial administration and report Dr. Soupachai &
Dr. Sisouphan
11:30-12:00 PM Wrap up and closing remark Assoc. Prof.
Chanphomma
12:00-13:30 PM Lunch Break
13:30-16:00 PM Distribution of Field trip for Data collection
material and equipment
Dr. Xaysana
Dr. Idemer
Monday: 7/1/2008: Field trip for data collection for each data collector team in their
respective area assigned
Tuesday 8/1/2008: Meeting of Data Collector Team Supervisor with the Lao Ministry
of Health STEP Survey on NCD Risk Factor Steering Committee.
at the MoH Conference room

103
4. Typical Physical Activities
For use with This show card relates to:
STEP Section Items
Step 1, physical activity P P1 to P15
WORK RELATED PHYSICAL ACTIVITY LEISURE/ SPARE TIME RELATED PHYSICAL ACTIVITY
MODERATE
Intensity Activities
Makes you breathe somewhat harder
than normal
VIGOROUS
Intensity Activities
Makes you breathe much harder
than normal
MODERATE
Intensity Activities
Makes you breathe somewhat harder
than normal
VIGOROUS
Intensity Activities
Makes you breathe much harder
than normal
Examples:
• Cleaning (vacuuming, mopping,
polishing, scrubbing, sweeping,
ironing)
• Washing (beating and brushing
Examples:
• Forestry (cutting, chopping, carrying
wood)
• Sawing hardwood
• Ploughing
Examples:
• Cycling
• Jogging
• Dancing
• Horse-riding
Examples
• Soccer
• Rugby
• Tennis
• High-impact aerobics

104
carpets, wringing clothes (by hand)
• Gardening
• Milking cows (by hand)
• Planting and harvesting crops
• Digging dry soil (with spade)
• Weaving
• Woodwork (chiselling, sawing
softwood)
• Mixing cement (with shovel)
• Labouring (pushing loaded
wheelbarrow, operating
jackhammer)
• Walking with load on head
• Drawing water
• Tending animals
• Cutting crops (sugar cane)
• Gardening (digging)
• Grinding (with pestle)
• Labouring (shovelling sand)
• Loading furniture (stoves, fridge)
• Instructing spinning (fitness)
• Instructing sports aerobics
• Sorting postal parcels (fast pace)
• Cycle rickshaw driving
• Tai chi
• Yoga
• Pilates
• Low-impact aerobics
• Cricket
• Aqua aerobics
• Ballet dancing
• Fast swimming

Part 6: Templates and Forms 6-3D-105 Section 3D: Data Book Template WHO STEPS Surveillance
Appendix H: Declarations
A Declaration by Principal Investigator
The information supplied in this application is, to the best of my knowledge and belief, accurate. I
have considered the ethical issues involved in this research and believe that I have adequately addressed
them in this application. I understand that if the protocol for this research changes in any way I must
inform the Research Ethics Review Committee.
Name:__________________________________
Signature:_______________________________
Date:___________________________________
B Declaration by Head of Department
I have read the application and believe it to be scientifically and ethically sound. I approve the
research design. I give my consent for the application to be forwarded to the Ethics Committee.
Name:__________________________________
Signature:_______________________________
Date:___________________________________

Part 6: Templates and Forms 6-3D-106 Section 3D: Data Book Template WHO STEPS Surveillance
Appendix I: Data collectors training workshop agenda
Thursday: 3/1/2008
Time Contents Speakers
8:00-8:30 AM Registration
8:30-8:40 Introduction and objectives of the workshop Assoc. Prof.
Chanphomma
8:40-9:00 Overview on the Lao STEP Survey on NCD
Risk Factor Project
Assoc. Prof. Vang Chu
9:00-10:00 AM What should you know as data collectors ?
- How to approach to selected house hold
- How to randomize participant with the Kish method & Exercise cases 1, 2 and 3
- The NCD STEP Consent form 1 &2
Assoc. Prof. Vang Chu
10:00-10:30 AM Coffee Break
10:30-11:30 AM - How to interview using the Lao questionnaire form and show Card + Exercise 1 (STEP 1)
Assoc. Prof. Vang Chu
11:30-12:00 AM - How to measure BP, Weight, Height, Waist, Hip (STEP2)
Dr. Xaysana
12:00-13:00 PM Lunch Break
13:00-14:00 PM - Blood tests procedures (STEP 3) Dr. Xaysana
14:00-14:30 PM - Role of Lao STEP Survey in Lao National NCD prevention and control
- Data quality control and supervision - Data management and report
Assoc. Prof. Vang Chu
14:30-15:00 PM Coffee Break
15:00-16:00 PM Discussion on field trip for data collection Lead by Assoc.Prof.
Bounkong
Friday 4/1/2008

Part 6: Templates and Forms 6-3D-107 Section 3D: Data Book Template WHO STEPS Surveillance
8:30-10:00 AM Data entering Assoc. Prof. Vang Chu
10:00-10:30 AM Coffee Break
10:30-11:30 PM Financial administration and report Dr. Soupachai &
Dr. Sisouphan
11:30-12:00 PM Wrap up and closing remark Assoc. Prof.
Chanphomma
12:00-13:30 PM Lunch Break
13:30-16:00 PM Distribution of Field trip for Data collection
material and equipment
Dr. Xaysana
Dr. Idemer
Monday: 7/1/2008: Field trip for data collection for each data collector team in their
respective area assigned
Tuesday 8/1/2008: Meeting of Data Collector Team Supervisor with the Lao Ministry of
Health STEP Survey on NCD Risk Factor Steering Committee.
at the MoH Conference room

Part 6: Templates and Forms 6-3D-108 Section 3D: Data Book Template WHO STEPS Surveillance
Appendix J: Lao STEPS Data Book
WHO STEPS
Chronic Disease
Risk Factor Surveillance
Data Book for
Lao PDR, 2008

Part 6: Templates and Forms 6-3D-109 Section 3D: Data Book Template WHO STEPS Surveillance
Demographic Information Results
Age
group
by sex
Description: Summary information by age group and sex of the respondents. Instrument question:
Sex What is your date of birth?
Age group and sex of respondents
Men Women Both Sexes Age Group
(years) n % n %
n %
25-34 382 34.8 717 65.2 1099 26.3
35-44 512 38.7 811 61.3 1323 31.7
45-54 466 43.8 597 56.2 1063 25.4
55-64 331 47.6 364 52.4 695 16.6
25-64 1691 40.5 2489 59.5 4180 100.0
Ethnicity Description: Summary results for the ethnicity of the respondents. Instrument Question:
What is your [insert relevant ethnic group/racial group/cultural subgroup/others] background?
Ethnic group of respondents
Both Sexes Age Group
(years) n % Lao Lum % Lao Sung % Lao Theung % Other
25-34 1083 95.8 3.9 0.3 0.1
35-44 1306 95.6 4.3 0.1 0.0
45-54 1047 94.7 4.2 1.0 0.2
55-64 686 97.1 2.6 0.3 0.0
25-64 4122 95.7 3.9 0.4 0.1
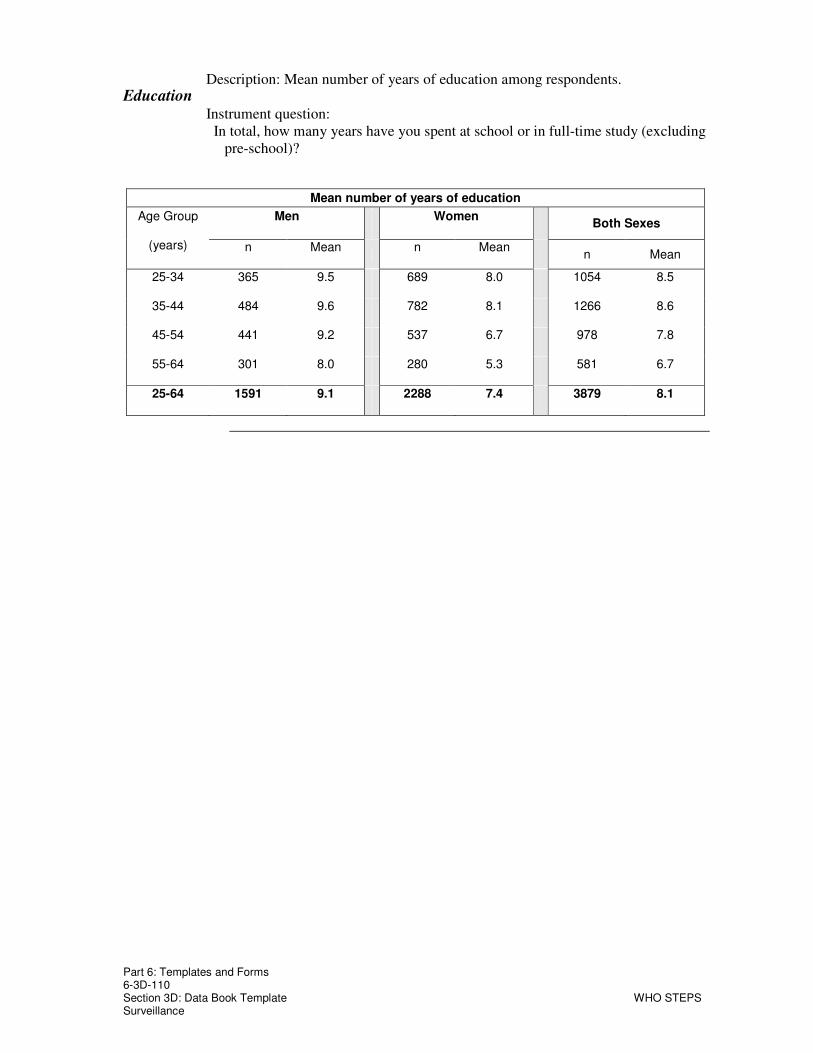
Part 6: Templates and Forms 6-3D-110 Section 3D: Data Book Template WHO STEPS Surveillance
Education Description: Mean number of years of education among respondents. Instrument question:
In total, how many years have you spent at school or in full-time study (excluding pre-school)?
Mean number of years of education
Men Women Both Sexes
Age Group
(years) n Mean
n Mean n Mean
25-34 365 9.5 689 8.0 1054 8.5
35-44 484 9.6 782 8.1 1266 8.6
45-54 441 9.2 537 6.7 978 7.8
55-64 301 8.0 280 5.3 581 6.7
25-64 1591 9.1 2288 7.4 3879 8.1

Part 6: Templates and Forms 6-3D-111 Section 3D: Data Book Template WHO STEPS Surveillance
Highest
level of
education
Description: Highest level of education achieved by the survey respondents. Instrument question:
What is the highest level of education you have completed?
Highest level of education
Men
Age
Group
(years) n
% No
formal
schooling
% Less
than
primary
school
% Primary
school
completed
%
Secondary
school
completed
% High
school
completed
% College/ University completed
% Post graduate degree
completed
25-34 381 1.8 10.0 19.2 24.9 28.9 14.2 1.0
35-44 504 2.8 9.1 20.4 23.2 28.0 14.9 1.6
45-54 463 4.1 16.4 21.6 18.8 19.0 15.3 4.8
55-64 330 9.4 20.3 28.5 16.4 12.4 11.5 1.5
25-64 1678 4.2 13.5 22.1 21.0 22.6 14.2 2.3
Highest level of education
Women
Age
Group
(years) n
% No
formal
schooling
% Less
than
primary
school
% Primary
school
completed
%
Secondary
school
completed
% High
school
completed
% College/ University completed
% Post graduate degree
completed
25-34 712 2.9 13.9 27.9 28.1 19.7 7.0 0.4
35-44 807 3.5 18.3 23.8 24.8 22.3 6.8 0.5
45-54 590 11.9 28.3 28.5 13.4 10.3 6.9 0.7
55-64 352 26.7 31.8 27.8 5.4 5.4 2.6 0.3
25-64 2461 8.7 21.4 26.7 20.2 16.3 6.3 0.5

Part 6: Templates and Forms 6-3D-112 Section 3D: Data Book Template WHO STEPS Surveillance
Highest level of education
Both Sexes
Age
Group
(years) n
% No
formal
schooling
% Less
than
primary
school
% Primary
school
completed
%
Secondary
school
completed
% High
school
completed
% College/ University completed
% Post graduate degree
completed
25-34 1093 2.6 12.5 24.9 27.0 22.9 9.5 0.6
35-44 1311 3.2 14.8 22.5 24.2 24.5 9.9 0.9
45-54 1053 8.5 23.1 25.5 15.8 14.2 10.6 2.5
55-64 682 18.3 26.2 28.2 10.7 8.8 6.9 0.9
25-64 4139 6.9 18.2 24.8 20.6 18.8 9.5 1.2
Employment
status
Description: Proportion of respondents in paid employment and those who are unpaid. Unpaid includes persons who are non-paid, students, homemakers, retired, and unemployed. Instrument question:
Which of the following best describes your main work status over the last 12 months?
Employment status
Men
Age Group
(years) n
%
Government
employee
% Non-
government
employee
% Self-
employed % Unpaid
25-34 379 14.8 17.9 27.4 39.8
35-44 503 18.5 12.3 31.6 37.6
45-54 462 24.5 6.5 32.7 36.4
55-64 328 11.6 4.0 29.3 55.2
25-64 1672 17.9 10.3 30.5 41.2

Part 6: Templates and Forms 6-3D-113 Section 3D: Data Book Template WHO STEPS Surveillance
Employment status
Women
Age Group
(years) n
%
Government
employee
% Non-
government
employee
% Self-
employed % Unpaid
25-34 710 5.1 12.3 19.9 62.8
35-44 806 10.7 4.8 25.3 59.2
45-54 595 10.4 2.7 23.4 63.5
55-64 359 2.2 0.8 13.1 83.8
25-64 2470 7.8 5.9 21.5 64.9
Employment status
Both Sexes
Age Group
(years) n
%
Government
employee
% Non-
government
employee
% Self-
employed % Unpaid
25-34 1089 8.4 14.2 22.5 54.8
35-44 1309 13.7 7.7 27.7 50.9
45-54 1057 16.6 4.4 27.4 51.7
55-64 687 6.7 2.3 20.8 70.2
25-64 4142 11.9 7.7 25.1 55.3

Part 6: Templates and Forms 6-3D-114 Section 3D: Data Book Template WHO STEPS Surveillance
Unpaid
work and
unemployed
Description: Proportion of respondents in unpaid work. Instrument question:
Which of the following best describes your main work status over the last 12 months?
Unpaid work and unemployed
Men
Unemployed Age
Group
(years) n
% Non-
paid % Student
% Home-
maker % Retired
% Able to
work
% Not able
to work
25-34 151 0.7 9.9 31.8 0.0 57.0 0.7
35-44 189 0.5 1.1 51.9 0.0 45.0 1.6
45-54 168 1.2 0.0 68.5 2.4 26.2 1.8
55-64 181 1.7 0.0 52.5 24.3 21.0 0.6
25-64 689 1.0 2.5 51.7 7.0 36.7 1.2
Unpaid work and unemployed
Women
Unemployed Age
Group
(years) n
% Non-
paid % Student
% Home-
maker % Retired
% Able to
work
% Not able
to work
25-34 446 0.0 3.1 80.9 0.2 15.0 0.7
35-44 477 0.6 0.6 87.0 0.0 11.5 0.2
45-54 378 0.8 0.0 88.1 2.4 8.2 0.5
55-64 301 0.7 1.0 82.7 9.0 5.0 1.7
25-64 1602 0.5 1.2 84.8 2.3 10.5 0.7
Unpaid work and unemployed
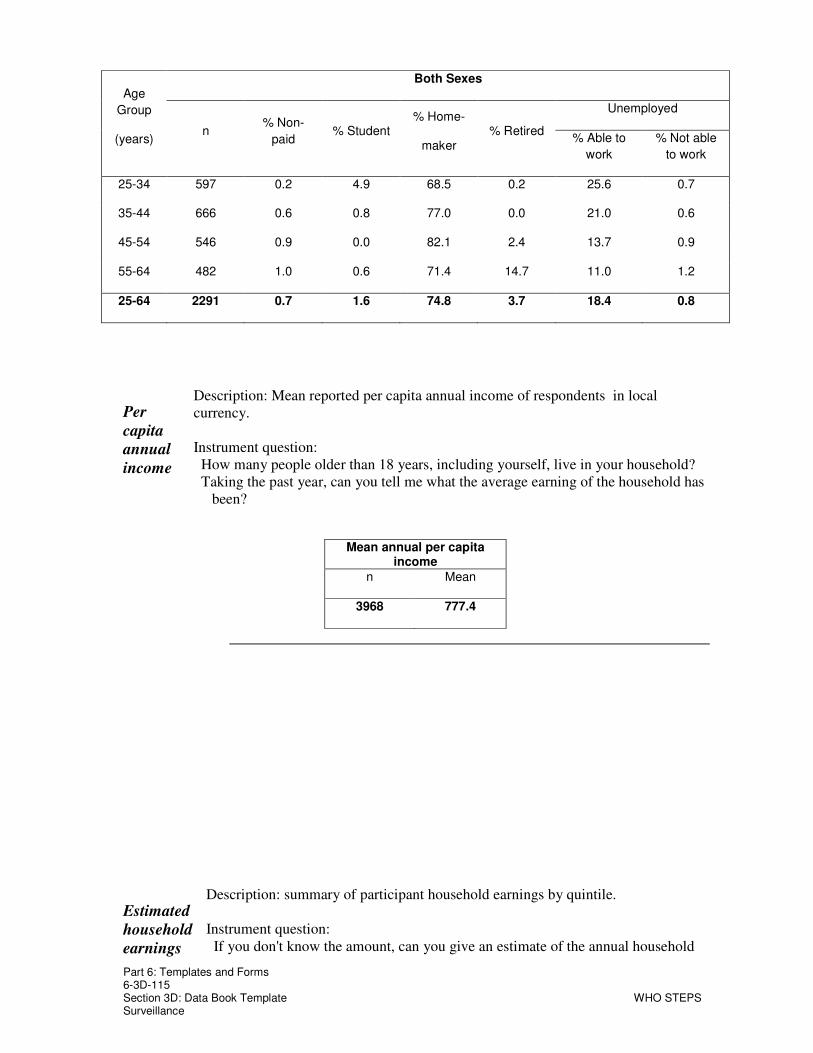
Part 6: Templates and Forms 6-3D-115 Section 3D: Data Book Template WHO STEPS Surveillance
Both Sexes
Unemployed Age
Group
(years) n
% Non-
paid % Student
% Home-
maker % Retired
% Able to
work
% Not able
to work
25-34 597 0.2 4.9 68.5 0.2 25.6 0.7
35-44 666 0.6 0.8 77.0 0.0 21.0 0.6
45-54 546 0.9 0.0 82.1 2.4 13.7 0.9
55-64 482 1.0 0.6 71.4 14.7 11.0 1.2
25-64 2291 0.7 1.6 74.8 3.7 18.4 0.8
Per
capita
annual
income
Description: Mean reported per capita annual income of respondents in local currency. Instrument question:
How many people older than 18 years, including yourself, live in your household? Taking the past year, can you tell me what the average earning of the household has
been?
Mean annual per capita income
n Mean
3968 777.4
Estimated
household
earnings
Description: summary of participant household earnings by quintile. Instrument question:
If you don't know the amount, can you give an estimate of the annual household

Part 6: Templates and Forms 6-3D-116 Section 3D: Data Book Template WHO STEPS Surveillance
income if I read some options to you?
Estimated household earnings
n % Quintile 1:
Under $500
% Quintile 2:
$500-$1000
% Quintile 3:
$1000-$1500
% Quintile 4:
$1500-$2000
% Quintile 5:
Over $2000
46 30.4 58.7 8.7 2.2 0.0
Tobacco Use
Current
smoking
Description: Current smokers among all respondents. Instrument questions:
Do you currently smoke any tobacco products, such as cigarettes, cigars, or pipes?
Percentage of current smokers
Men Women Both Sexes
Age Group
(years) n
%
Current
smoker
95% CI n
%
Current
smoker
95% CI n
% Current smoker
95% CI
25-34 372 31.2 22.7-39.8 682 1.1 0.1-2.0 1054 11.9 8.1-15.7
35-44 498 44.6 36.1-53.1 764 2.0 0.3-3.8 1262 18.7 14.9-22.6
45-54 454 52.3 46.5-58.2 566 2.4 0.8-4.1 1020 23.8 19.8-27.7
55-64 325 43.7 31.3-56.2 336 2.9 0.7-5.2 661 24.1 17.0-31.1
25-64 1649 43.2 36.9-49.6 2348 2.0 1.0-3.0 3997 19.0 15.5-22.6
Smoking
Status
Description: Smoking status of all respondents. Instrument questions:

Part 6: Templates and Forms 6-3D-117 Section 3D: Data Book Template WHO STEPS Surveillance
Do you currently smoke any tobacco products, such as cigarettes, cigars, or pipes? Do you currently smoke tobacco products daily?
Smoking status
Men
Current smoker Age Group
(years) n % Daily 95% CI
% Non-
daily 95% CI
% Does
not smoke 95% CI
25-34 372 30.7 22.2-39.3 0.5 0.0-1.0 68.8 60.2-77.3
35-44 498 43.9 35.5-52.4 0.7 0.0-1.5 55.4 46.9-63.9
45-54 454 51.6 45.8-57.4 0.7 0.0-1.9 47.7 41.8-53.5
55-64 325 43.3 30.8-55.7 0.5 0.0-1.1 56.3 43.8-68.7
25-64 1649 42.6 36.3-49.0 0.6 0.2-1.0 56.8 50.4-63.1
Smoking status
Women
Current smoker Age Group
(years) n % Daily 95% CI
% Non-
daily 95% CI
% Does
not smoke 95% CI
25-34 682 1.1 0.1-2.0 0.0 0.0-0.0 98.9 98.0-99.9
35-44 764 2.0 0.3-3.8 0.0 0.0-0.0 98.0 96.2-99.7
45-54 566 2.4 0.8-4.1 0.0 0.0-0.0 97.6 95.9-99.2
55-64 336 2.9 0.7-5.2 0.0 0.0-0.0 97.1 94.8-99.3
25-64 2348 2.0 1.0-3.0 0.0 0.0-0.0 98.0 97.0-99.0
Smoking status

Part 6: Templates and Forms 6-3D-118 Section 3D: Data Book Template WHO STEPS Surveillance
Both Sexes
Current smoker Age Group
(years) n % Daily 95% CI
% Non-
daily 95% CI
% Does
not smoke 95% CI
25-34 1054 11.7 8.0-15.5 0.2 0.0-0.4 88.1 84.3-91.9
35-44 1262 18.5 14.7-22.3 0.3 0.0-0.6 81.3 77.4-85.1
45-54 1020 23.4 19.5-27.4 0.3 0.0-0.8 76.2 72.3-80.2
55-64 661 23.8 16.8-30.9 0.3 0.0-0.6 75.9 68.9-83.0
25-64 3997 18.8 15.2-22.3 0.3 0.1-0.4 81.0 77.4-84.5
Frequency
of
smoking
Description: Percentage of current daily smokers among smokers. Instrument question:
Do you currently smoke any tobacco products, such as cigarettes, cigars, or pipes?
Do you currently smoke tobacco products daily?
Current daily smokers among smokers
Men Women Both Sexes Age Group
(years) n % Daily
smokers 95% CI n
% Daily
smokers 95% CI
n % Daily smokers
95% CI
25-34 134 98.4 96.7-100.0 141 98.5 96.9-100.0
35-44 217 98.5 96.7-100.0 229 98.6 96.9-100.0
45-54 207 98.6 96.5-100.0 222 98.7 96.7-100.0
55-64 136 98.9 97.4-100.0 147 98.9 97.6-100.0
25-64 694 98.6 97.6-99.5 739 98.7 97.8-99.6
Manufactured
cigarette
Description: Percentage of smokers who use manufactured cigarettes among daily smokers. Instrument question:
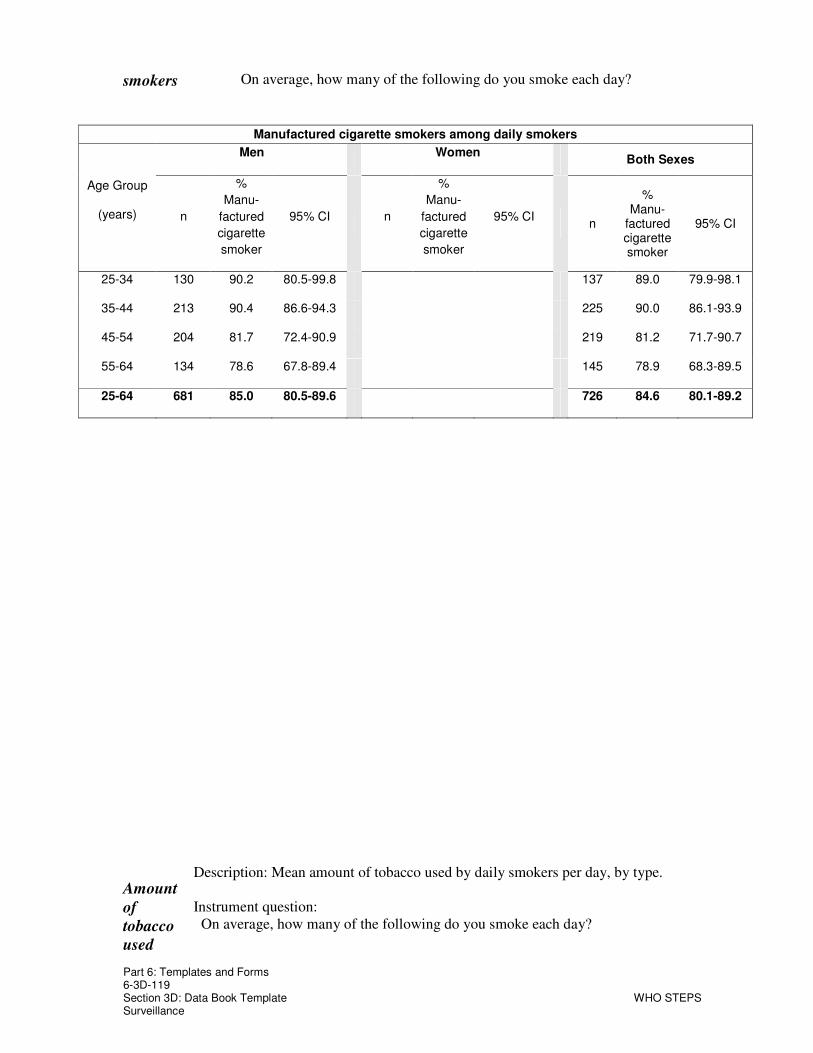
Part 6: Templates and Forms 6-3D-119 Section 3D: Data Book Template WHO STEPS Surveillance
smokers On average, how many of the following do you smoke each day?
Manufactured cigarette smokers among daily smokers
Men Women Both Sexes
Age Group
(years) n
%
Manu-
factured
cigarette
smoker
95% CI n
%
Manu-
factured
cigarette
smoker
95% CI n
% Manu-
factured cigarette smoker
95% CI
25-34 130 90.2 80.5-99.8 137 89.0 79.9-98.1
35-44 213 90.4 86.6-94.3 225 90.0 86.1-93.9
45-54 204 81.7 72.4-90.9 219 81.2 71.7-90.7
55-64 134 78.6 67.8-89.4 145 78.9 68.3-89.5
25-64 681 85.0 80.5-89.6 726 84.6 80.1-89.2
Amount
of
tobacco
used
Description: Mean amount of tobacco used by daily smokers per day, by type. Instrument question:
On average, how many of the following do you smoke each day?
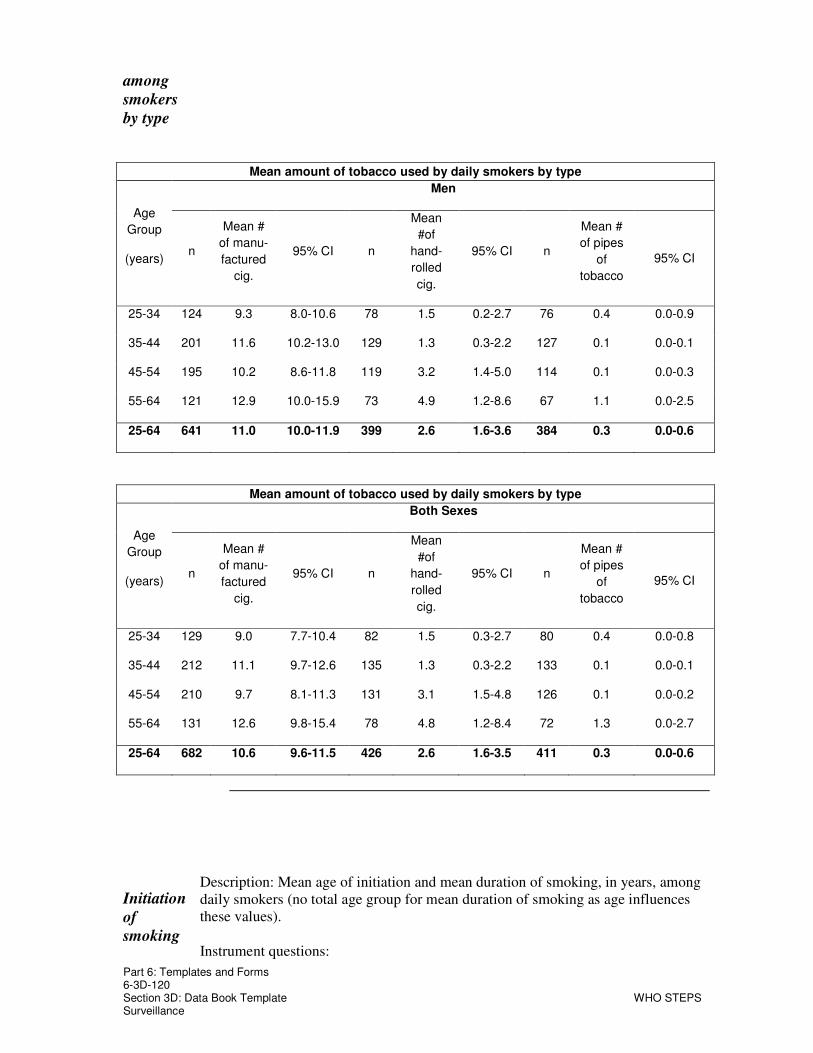
Part 6: Templates and Forms 6-3D-120 Section 3D: Data Book Template WHO STEPS Surveillance
among
smokers
by type
Mean amount of tobacco used by daily smokers by type
Men
Age
Group
(years) n
Mean #
of manu-
factured
cig.
95% CI n
Mean
#of
hand-
rolled
cig.
95% CI n
Mean #
of pipes
of
tobacco
95% CI
25-34 124 9.3 8.0-10.6 78 1.5 0.2-2.7 76 0.4 0.0-0.9
35-44 201 11.6 10.2-13.0 129 1.3 0.3-2.2 127 0.1 0.0-0.1
45-54 195 10.2 8.6-11.8 119 3.2 1.4-5.0 114 0.1 0.0-0.3
55-64 121 12.9 10.0-15.9 73 4.9 1.2-8.6 67 1.1 0.0-2.5
25-64 641 11.0 10.0-11.9 399 2.6 1.6-3.6 384 0.3 0.0-0.6
Mean amount of tobacco used by daily smokers by type
Both Sexes
Age
Group
(years) n
Mean #
of manu-
factured
cig.
95% CI n
Mean
#of
hand-
rolled
cig.
95% CI n
Mean #
of pipes
of
tobacco
95% CI
25-34 129 9.0 7.7-10.4 82 1.5 0.3-2.7 80 0.4 0.0-0.8
35-44 212 11.1 9.7-12.6 135 1.3 0.3-2.2 133 0.1 0.0-0.1
45-54 210 9.7 8.1-11.3 131 3.1 1.5-4.8 126 0.1 0.0-0.2
55-64 131 12.6 9.8-15.4 78 4.8 1.2-8.4 72 1.3 0.0-2.7
25-64 682 10.6 9.6-11.5 426 2.6 1.6-3.5 411 0.3 0.0-0.6
Initiation
of
smoking
Description: Mean age of initiation and mean duration of smoking, in years, among daily smokers (no total age group for mean duration of smoking as age influences these values). Instrument questions:
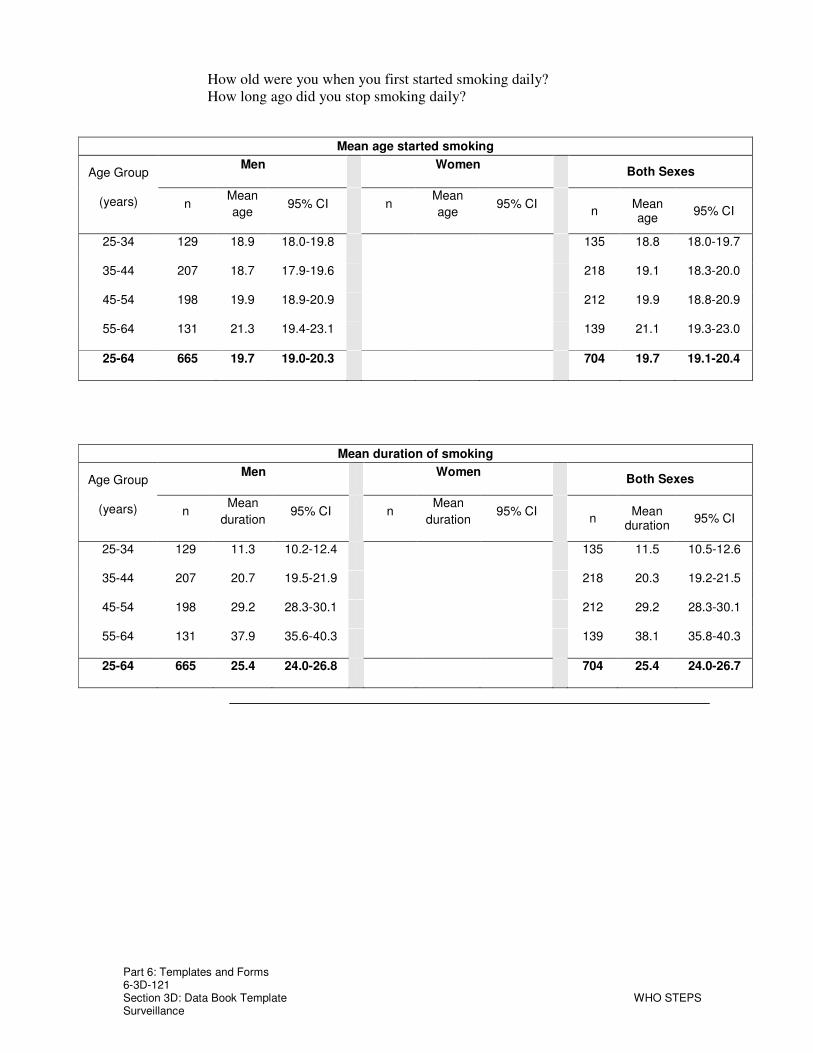
Part 6: Templates and Forms 6-3D-121 Section 3D: Data Book Template WHO STEPS Surveillance
How old were you when you first started smoking daily? How long ago did you stop smoking daily?
Mean age started smoking
Men Women Both Sexes Age Group
(years) n Mean
age 95% CI n
Mean
age 95% CI
n Mean age
95% CI
25-34 129 18.9 18.0-19.8 135 18.8 18.0-19.7
35-44 207 18.7 17.9-19.6 218 19.1 18.3-20.0
45-54 198 19.9 18.9-20.9 212 19.9 18.8-20.9
55-64 131 21.3 19.4-23.1 139 21.1 19.3-23.0
25-64 665 19.7 19.0-20.3 704 19.7 19.1-20.4
Mean duration of smoking
Men Women Both Sexes Age Group
(years) n Mean
duration 95% CI n
Mean
duration 95% CI
n Mean
duration 95% CI
25-34 129 11.3 10.2-12.4 135 11.5 10.5-12.6
35-44 207 20.7 19.5-21.9 218 20.3 19.2-21.5
45-54 198 29.2 28.3-30.1 212 29.2 28.3-30.1
55-64 131 37.9 35.6-40.3 139 38.1 35.8-40.3
25-64 665 25.4 24.0-26.8 704 25.4 24.0-26.7
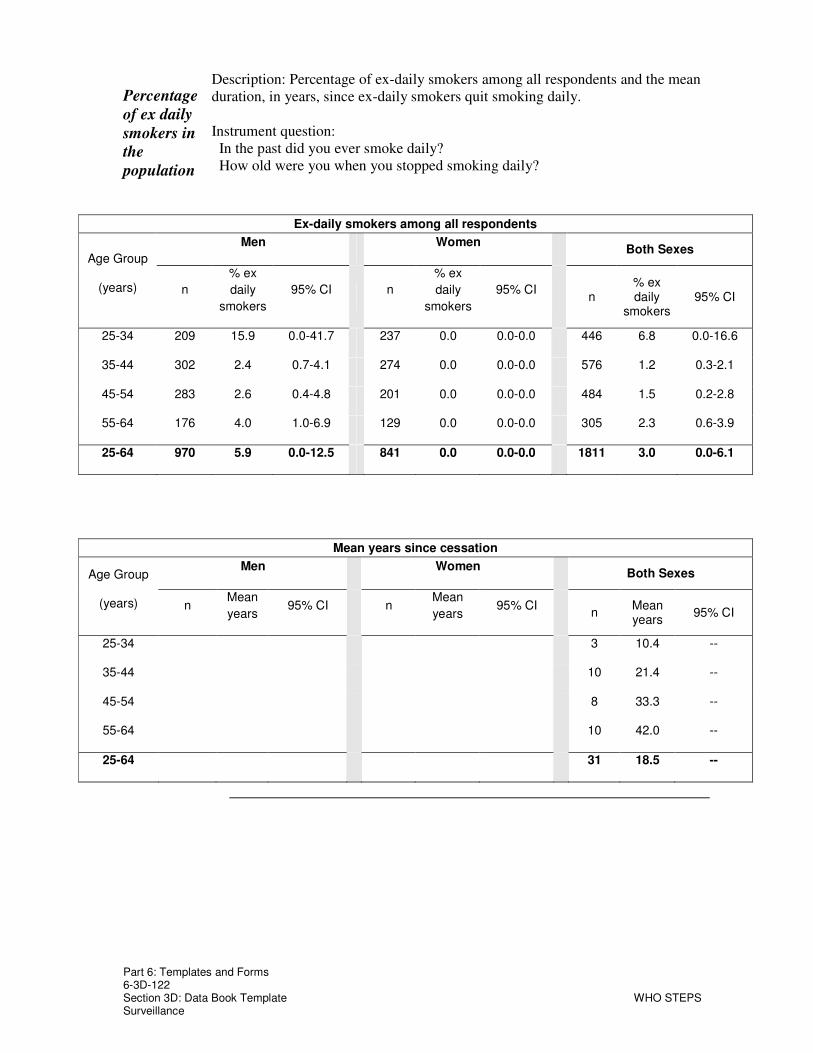
Part 6: Templates and Forms 6-3D-122 Section 3D: Data Book Template WHO STEPS Surveillance
Percentage
of ex daily
smokers in
the
population
Description: Percentage of ex-daily smokers among all respondents and the mean duration, in years, since ex-daily smokers quit smoking daily. Instrument question:
In the past did you ever smoke daily? How old were you when you stopped smoking daily?
Ex-daily smokers among all respondents
Men Women Both Sexes
Age Group
(years) n
% ex
daily
smokers
95% CI n
% ex
daily
smokers
95% CI n
% ex daily
smokers 95% CI
25-34 209 15.9 0.0-41.7 237 0.0 0.0-0.0 446 6.8 0.0-16.6
35-44 302 2.4 0.7-4.1 274 0.0 0.0-0.0 576 1.2 0.3-2.1
45-54 283 2.6 0.4-4.8 201 0.0 0.0-0.0 484 1.5 0.2-2.8
55-64 176 4.0 1.0-6.9 129 0.0 0.0-0.0 305 2.3 0.6-3.9
25-64 970 5.9 0.0-12.5 841 0.0 0.0-0.0 1811 3.0 0.0-6.1
Mean years since cessation
Men Women Both Sexes Age Group
(years) n Mean
years 95% CI n
Mean
years 95% CI
n Mean years
95% CI
25-34 3 10.4 --
35-44 10 21.4 --
45-54 8 33.3 --
55-64 10 42.0 --
25-64 31 18.5 --

Part 6: Templates and Forms 6-3D-123 Section 3D: Data Book Template WHO STEPS Surveillance
Current
Users of
smokeless
tobacco
Description: Percentage of current users of smokeless tobacco among all respondents. Instrument question:
Do you currently use any smokeless tobacco such as snuff, chewing tobacco, betel?
Current users of smokeless tobacco
Men Women Both Sexes
Age Group
(years) n
%
Current
users
95% CI n
%
Current
users
95% CI n
% Current users
95% CI
25-34 199 5.8 1.4-10.3 225 0.9 0.0-2.8 424 3.0 0.6-5.4
35-44 285 16.0 10.5-21.5 266 0.0 0.0-0.0 551 7.9 4.7-11.1
45-54 261 19.6 10.3-29.0 197 1.7 0.0-3.9 458 11.8 5.5-18.0
55-64 155 15.5 5.3-25.7 124 2.9 0.0-7.0 279 9.9 3.7-16.1
25-64 900 14.6 10.0-19.1 812 1.1 0.0-2.2 1712 7.9 4.7-11.0
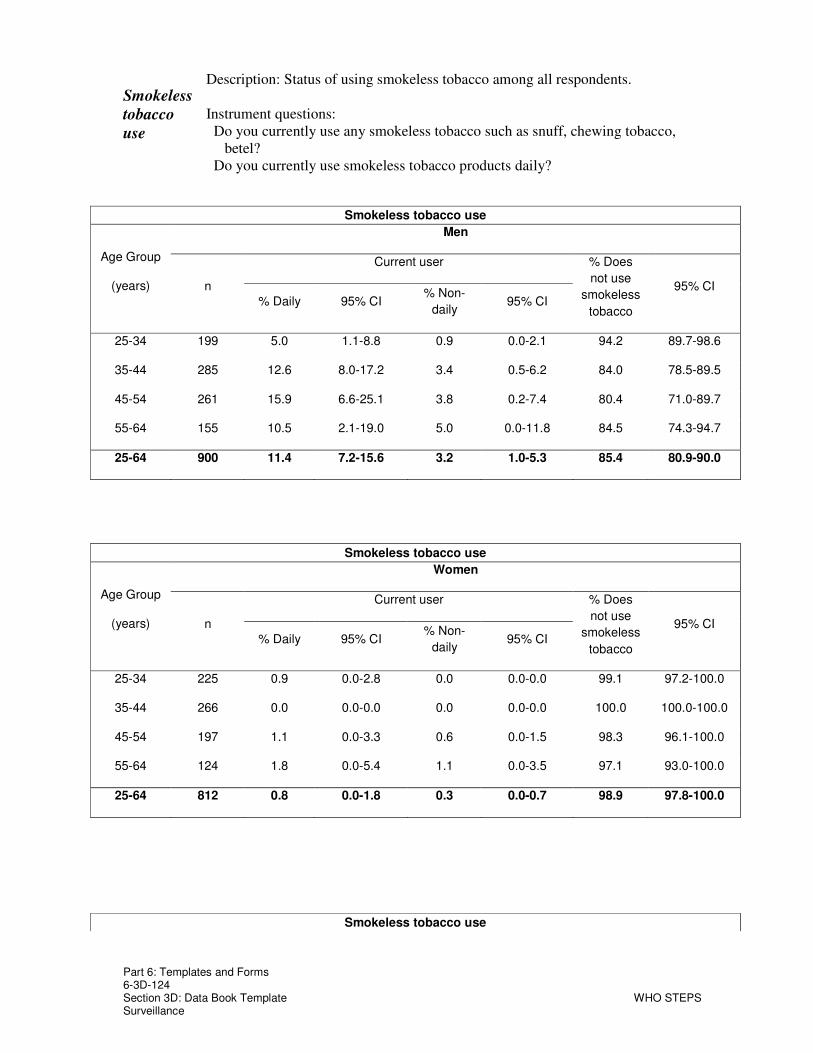
Part 6: Templates and Forms 6-3D-124 Section 3D: Data Book Template WHO STEPS Surveillance
Smokeless
tobacco
use
Description: Status of using smokeless tobacco among all respondents. Instrument questions:
Do you currently use any smokeless tobacco such as snuff, chewing tobacco, betel?
Do you currently use smokeless tobacco products daily?
Smokeless tobacco use
Men
Current user Age Group
(years) n % Daily 95% CI
% Non-
daily 95% CI
% Does
not use
smokeless
tobacco
95% CI
25-34 199 5.0 1.1-8.8 0.9 0.0-2.1 94.2 89.7-98.6
35-44 285 12.6 8.0-17.2 3.4 0.5-6.2 84.0 78.5-89.5
45-54 261 15.9 6.6-25.1 3.8 0.2-7.4 80.4 71.0-89.7
55-64 155 10.5 2.1-19.0 5.0 0.0-11.8 84.5 74.3-94.7
25-64 900 11.4 7.2-15.6 3.2 1.0-5.3 85.4 80.9-90.0
Smokeless tobacco use
Women
Current user Age Group
(years) n % Daily 95% CI
% Non-
daily 95% CI
% Does
not use
smokeless
tobacco
95% CI
25-34 225 0.9 0.0-2.8 0.0 0.0-0.0 99.1 97.2-100.0
35-44 266 0.0 0.0-0.0 0.0 0.0-0.0 100.0 100.0-100.0
45-54 197 1.1 0.0-3.3 0.6 0.0-1.5 98.3 96.1-100.0
55-64 124 1.8 0.0-5.4 1.1 0.0-3.5 97.1 93.0-100.0
25-64 812 0.8 0.0-1.8 0.3 0.0-0.7 98.9 97.8-100.0
Smokeless tobacco use

Part 6: Templates and Forms 6-3D-125 Section 3D: Data Book Template WHO STEPS Surveillance
Both Sexes
Current user Age Group
(years) n % Daily 95% CI
% Non-
daily 95% CI
% Does
not use
smokeless
tobacco
95% CI
25-34 424 2.6 0.4-4.8 0.4 0.0-0.9 97.0 94.6-99.4
35-44 551 6.2 3.5-9.0 1.7 0.2-3.1 92.1 88.9-95.3
45-54 458 9.4 3.1-15.7 2.4 0.4-4.3 88.2 82.0-94.5
55-64 279 6.6 1.3-12.0 3.3 0.0-7.1 90.1 83.9-96.3
25-64 1712 6.1 3.3-9.0 1.7 0.6-2.9 92.1 89.0-95.3
Percentage
of ex daily
users of
smokeless
tobacco in
the
population
Description: Percentage of ex-daily users of smokeless tobacco among all respondents. Instrument question:
In the past, did you ever use smokeless tobacco such as snuff, chewing tobacco, betel daily?
Ex-daily smokeless tobacco users
Men Women Both Sexes
Age Group
(years) N
% Ex
daily
users
95% CI n
% Ex
daily
users
95% CI n
% Ex daily users
95% CI
25-34 184 3.4 0.0-8.0 218 0.0 0.0-0.0 402 1.5 0.0-3.5
35-44 265 4.3 1.2-7.4 250 0.6 0.0-1.8 515 2.4 0.6-4.3
45-54 242 3.7 1.1-6.2 190 0.8 0.0-1.8 432 2.4 0.9-3.8
55-64 129 4.7 0.0-11.7 119 1.2 0.0-3.5 248 3.0 0.0-6.8
25-64 820 4.0 1.6-6.3 777 0.5 0.0-1.1 1597 2.2 0.9-3.5

Part 6: Templates and Forms 6-3D-126 Section 3D: Data Book Template WHO STEPS Surveillance
Current
tobacco
users
Description: Percentage of daily and current (daily plus non-daily) tobacco users, includes smoking and smokeless, among all respondents. Instrument questions:
Do you currently smoke tobacco products daily? Do you currently use smokeless tobacco products daily?
Current tobacco users
Men Women Both Sexes
Age Group
(years) n
%
Current
users
95% CI n
%
Current
users
95% CI n
% Current users
95% CI
25-34 198 49.7 33.2-66.2 221 2.5 0.0-5.2 419 22.5 10.4-34.7
35-44 284 68.5 56.5-80.4 259 5.5 0.7-10.3 543 37.2 28.7-45.7
45-54 261 73.9 64.4-83.4 193 6.9 2.6-11.1 454 44.6 37.4-51.9
55-64 155 78.4 68.4-88.4 123 7.1 1.0-13.1 278 46.7 33.0-60.4
25-64 898 67.3 58.2-76.5 796 5.1 2.1-8.1 1694 36.5 27.2-45.8
Daily tobacco users
Men Women Both Sexes
Age Group
(years) n
%
Daily
users
95% CI n
%
Daily
users
95% CI n
% Daily users
95% CI
25-34 198 48.9 32.6-65.2 221 2.5 0.0-5.2 419 22.1 10.2-34.1
35-44 284 67.8 55.9-79.7 259 5.5 0.7-10.3 543 36.9 28.4-45.3
45-54 261 72.8 63.3-82.2 193 6.5 2.1-10.8 454 43.8 36.5-51.1
55-64 155 77.3 66.9-87.8 123 7.1 1.0-13.1 278 46.1 32.4-59.8
25-64 898 66.4 57.3-75.5 796 5.0 2.0-7.9 1694 36.0 26.8-45.2

Part 6: Templates and Forms 6-3D-127 Section 3D: Data Book Template WHO STEPS Surveillance
Alcohol Consumption
Alcohol
consumption
status
Description: Alcohol consumption status of all respondents. Abstainers have not consumed alcohol in the last 12 months. Instrument questions:
Have you consumed alcohol (such as beer, wine, spirits, fermented cider, or (add other local examples) within the past 12 months?
Have you consumed alcohol (such as beer, wine, spirits, fermented cider, or (add other local examples) within the past 30 days?
Alcohol consumption status
Men
Age Group
(years) n
% Current
drinker
(last 30
days)
95% CI
% Drank
in last 12
months,
not current
95% CI %
Abstainer 95% CI
25-34 357 80.6 73.3-87.9 5.0 2.3-7.6 14.5 9.0-19.9
35-44 467 78.4 72.0-84.7 4.5 1.8-7.2 17.2 11.9-22.5
45-54 412 68.1 61.5-74.6 9.0 4.0-14.0 22.9 17.8-28.1
55-64 303 58.1 47.2-69.0 9.0 2.5-15.5 33.0 23.6-42.3
25-64 1539 72.0 66.9-77.1 6.7 4.6-8.8 21.3 17.1-25.5

Part 6: Templates and Forms 6-3D-128 Section 3D: Data Book Template WHO STEPS Surveillance
Alcohol consumption status
Women
Age Group
(years) n
% Current
drinker
(last 30
days)
95% CI
% Drank
in last 12
months,
not current
95% CI %
Abstainer 95% CI
25-34 681 39.6 34.1-45.2 6.9 3.3-10.5 53.5 45.8-61.2
35-44 773 45.7 39.0-52.4 6.0 3.1-9.0 48.3 42.6-54.0
45-54 569 29.3 22.8-35.9 4.5 2.3-6.6 66.2 58.7-73.6
55-64 331 14.9 7.3-22.6 3.1 0.2-6.0 82.0 73.8-90.2
25-64 2354 35.6 31.9-39.3 5.5 3.6-7.4 58.9 54.3-63.5
Alcohol consumption status
Both Sexes
Age Group
(years) n
% Current
drinker
(last 30
days)
95% CI
% Drank
in last 12
months,
not current
95% CI %
Abstainer 95% CI
25-34 1038 54.1 49.2-58.9 6.2 3.6-8.8 39.7 34.2-45.3
35-44 1240 57.9 52.2-63.6 5.4 3.0-7.9 36.7 31.8-41.5
45-54 981 44.6 38.8-50.3 6.3 3.3-9.2 49.2 42.6-55.7
55-64 634 36.8 30.3-43.3 6.1 2.2-9.9 57.1 51.0-63.2
25-64 3893 50.0 46.5-53.4 6.0 4.2-7.7 44.0 40.3-47.8

Part 6: Templates and Forms 6-3D-129 Section 3D: Data Book Template WHO STEPS Surveillance
Frequency
of alcohol
consumption
Description: Frequency of alcohol consumption in the last year among those respondents who have drank in the last 12 months. Instrument question:
In the past 12 months, how frequently have you had at least one drink?
Frequency of alcohol consumption in the last 12 months
Men
Age
Group
(years) n % Daily 95% CI
% 5-6
days p.
week
95% CI
% 1-4
days
p.
week
95% CI % 1-3
days p. month
95% CI
% < once
a month
95% CI
25-34 313 2.8 1.0-4.6 20.5 3.8-37.3 6.9 3.3-10.4 27.1 18.9-35.2 42.7 31.9-53.5
35-44 398 4.6 2.7-6.5 8.9 4.9-13.0 7.4 4.0-10.7 28.3 21.5-35.1 50.8 41.1-60.4
45-54 343 8.5 4.1-13.0 10.2 6.0-14.5 5.6 2.1-9.1 23.6 17.9-29.3 52.0 44.5-59.5
55-64 186 9.5 4.4-14.6 3.9 0.1-7.8 7.7 1.9-13.5 14.3 7.7-20.9 64.6 51.8-77.3
25-64 1240 6.0 4.3-7.8 11.4 7.1-15.8 6.8 4.3-9.4 24.2 19.1-29.4 51.4 46.2-56.6
Frequency of alcohol consumption in the last 12 months

Part 6: Templates and Forms 6-3D-130 Section 3D: Data Book Template WHO STEPS Surveillance
Women
Age
Group
(years) n % Daily 95% CI
% 5-6
days p.
week
95% CI
% 1-4
days
p.
week
95% CI % 1-3
days p. month
95% CI
% < once
a month
95% CI
25-34 316 4.5 1.2-7.9 1.3 0.1-2.5 3.9 1.5-6.3 9.7 5.5-13.9 80.6 73.4-87.8
35-44 371 3.2 1.2-5.2 5.0 1.7-8.3 4.3 1.7-7.0 15.9 10.8-21.0 71.6 63.5-79.7
45-54 183 6.9 0.0-14.8 5.6 0.1-11.2 4.2 1.4-7.1 8.0 3.7-12.3 75.3 66.6-83.9
55-64 62 4.9 0.0-10.7 12.4 0.0-34.8 6.2 0.0-15.9 11.9 4.2-19.5 64.7 43.1-86.2
25-64 932 4.5 2.4-6.6 4.3 2.0-6.6 4.3 2.7-5.9 11.9 8.8-15.0 75.0 70.4-79.7
Frequency of alcohol consumption in the last 12 months
Both Sexes Age
Group
(years) n % Daily 95% CI
% 5-6
days p.
week
95% CI
% 1-4
days p.
week 95% CI
% 1-3 days p. month
95% CI
% < once
a month
95% CI
25-34 629 3.7 1.8-5.6 10.9 2.5-19.3 5.4 3.0-7.7 18.4 13.2-23.5 61.7 56.3-67.1
35-44 769 3.9 2.6-5.2 7.0 4.0-9.9 5.8 3.6-8.1 22.0 17.5-26.6 61.3 53.6-69.0
45-54 526 7.9 4.2-11.6 8.5 4.9-12.2 5.1 2.5-7.7 17.8 14.1-21.4 60.7 54.8-66.6
55-64 248 8.5 4.3-12.8 5.7 0.0-11.5 7.4 1.4-13.4 13.8 8.4-19.2 64.6 54.0-75.2
25-64 2172 5.4 4.0-6.7 8.3 5.8-10.9 5.7 3.9-7.6 18.9 15.6-22.2 61.7 57.9-65.5
Standard
drinks
Description: Number of standard drinks consumed on a drinking day among those respondents who have drank in the last 12 months.

Part 6: Templates and Forms 6-3D-131 Section 3D: Data Book Template WHO STEPS Surveillance
per
drinking
day
Instrument question: When you drink alcohol, on average, how many drinks do you have during one
day?
Number of standard drinks consumed on a drinking day
Men Age
Group
(years) n
% 1
drink 95% CI
% 2-3
drinks 95% CI
% 4-5
drinks 95% CI % 6+ drinks
95% CI
Mean # of
standard drinks
95% CI
25-34 287 4.0 1.3-6.7 6.1 3.2-9.0 2.7 0.5-4.8 87.2 81.8-92.6 10.7 9.1-12.3
35-44 363 9.4 0.0-19.2 10.9 7.0-14.9 7.3 3.8-10.9 72.3 63.1-81.5 9.0 7.6-10.3
45-54 292 6.6 3.4-9.8 13.3 8.9-17.6 6.4 3.0-9.8 73.7 67.2-80.2 9.6 8.3-10.9
55-64 160 7.3 2.2-12.5 12.2 3.5-20.8 26.4 0.2-52.6 54.1 34.2-73.9 8.3 6.4-10.2
25-64 1102 6.9 4.0-9.7 10.4 7.5-13.3 9.2 4.3-14.0 73.5 67.5-79.5 9.5 8.5-10.4
Number of standard drinks consumed on a drinking day
Women Age
Group
(years) n
% 1
drink 95% CI
% 2-3
drinks 95% CI
% 4-5
drinks 95% CI % 6+ drinks
95% CI Mean #of standard
drinks 95% CI
25-34 284 8.7 3.5-13.8 11.7 6.8-16.7 6.7 3.3-10.1 72.8 64.8-80.8 9.8 7.5-12.2
35-44 333 5.3 1.7-8.8 12.7 8.1-17.3 8.0 3.6-12.4 73.9 66.9-81.0 8.9 7.4-10.3
45-54 159 15.4 6.5-24.3 12.0 3.9-20.2 6.8 0.4-13.2 65.8 54.7-76.8 8.9 6.5-11.3
55-64 51 5.5 0.0-12.9 3.4 0.0-8.2 9.4 0.5-18.2 81.7 68.1-95.3 10.7 8.4-13.0
25-64 827 8.6 5.2-12.1 11.7 7.9-15.5 7.4 5.0-9.8 72.3 67.0-77.5 9.3 7.9-10.7
Number of standard drinks consumed on a drinking day
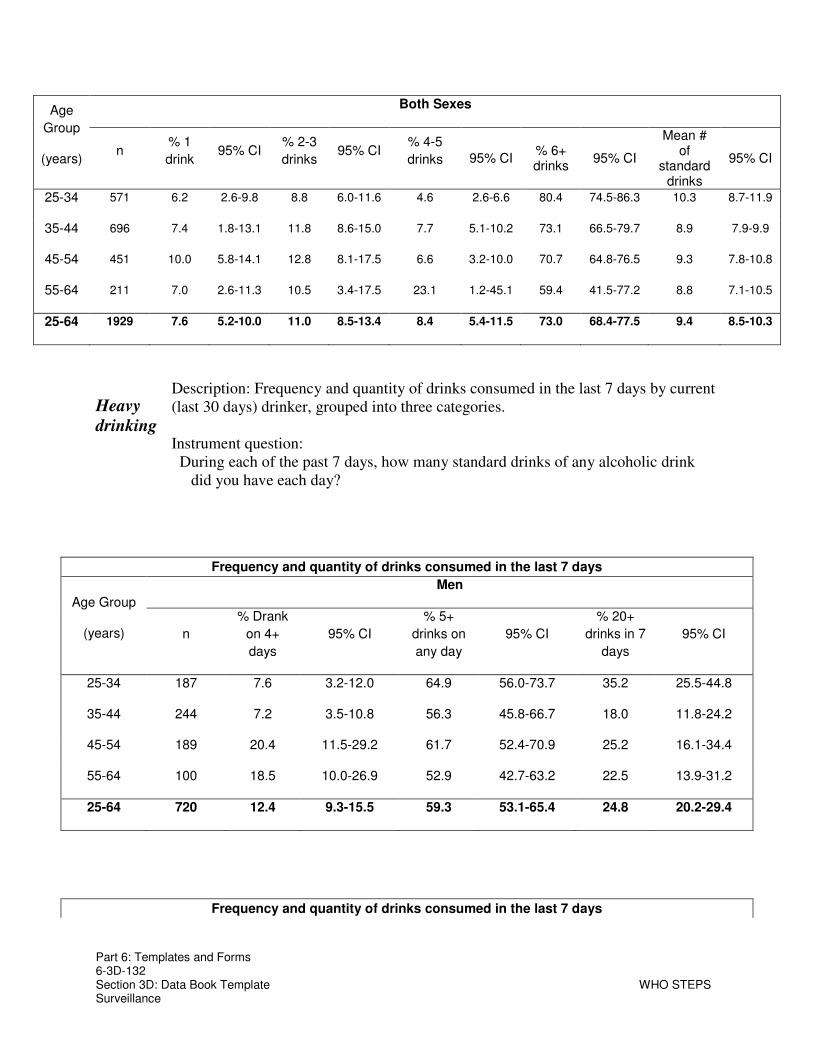
Part 6: Templates and Forms 6-3D-132 Section 3D: Data Book Template WHO STEPS Surveillance
Both Sexes Age
Group
(years) n
% 1
drink 95% CI
% 2-3
drinks 95% CI
% 4-5
drinks 95% CI % 6+ drinks
95% CI
Mean # of
standard drinks
95% CI
25-34 571 6.2 2.6-9.8 8.8 6.0-11.6 4.6 2.6-6.6 80.4 74.5-86.3 10.3 8.7-11.9
35-44 696 7.4 1.8-13.1 11.8 8.6-15.0 7.7 5.1-10.2 73.1 66.5-79.7 8.9 7.9-9.9
45-54 451 10.0 5.8-14.1 12.8 8.1-17.5 6.6 3.2-10.0 70.7 64.8-76.5 9.3 7.8-10.8
55-64 211 7.0 2.6-11.3 10.5 3.4-17.5 23.1 1.2-45.1 59.4 41.5-77.2 8.8 7.1-10.5
25-64 1929 7.6 5.2-10.0 11.0 8.5-13.4 8.4 5.4-11.5 73.0 68.4-77.5 9.4 8.5-10.3
Heavy
drinking
Description: Frequency and quantity of drinks consumed in the last 7 days by current (last 30 days) drinker, grouped into three categories. Instrument question:
During each of the past 7 days, how many standard drinks of any alcoholic drink did you have each day?
Frequency and quantity of drinks consumed in the last 7 days
Men
Age Group
(years) n
% Drank
on 4+
days
95% CI
% 5+
drinks on
any day
95% CI
% 20+
drinks in 7
days
95% CI
25-34 187 7.6 3.2-12.0 64.9 56.0-73.7 35.2 25.5-44.8
35-44 244 7.2 3.5-10.8 56.3 45.8-66.7 18.0 11.8-24.2
45-54 189 20.4 11.5-29.2 61.7 52.4-70.9 25.2 16.1-34.4
55-64 100 18.5 10.0-26.9 52.9 42.7-63.2 22.5 13.9-31.2
25-64 720 12.4 9.3-15.5 59.3 53.1-65.4 24.8 20.2-29.4
Frequency and quantity of drinks consumed in the last 7 days
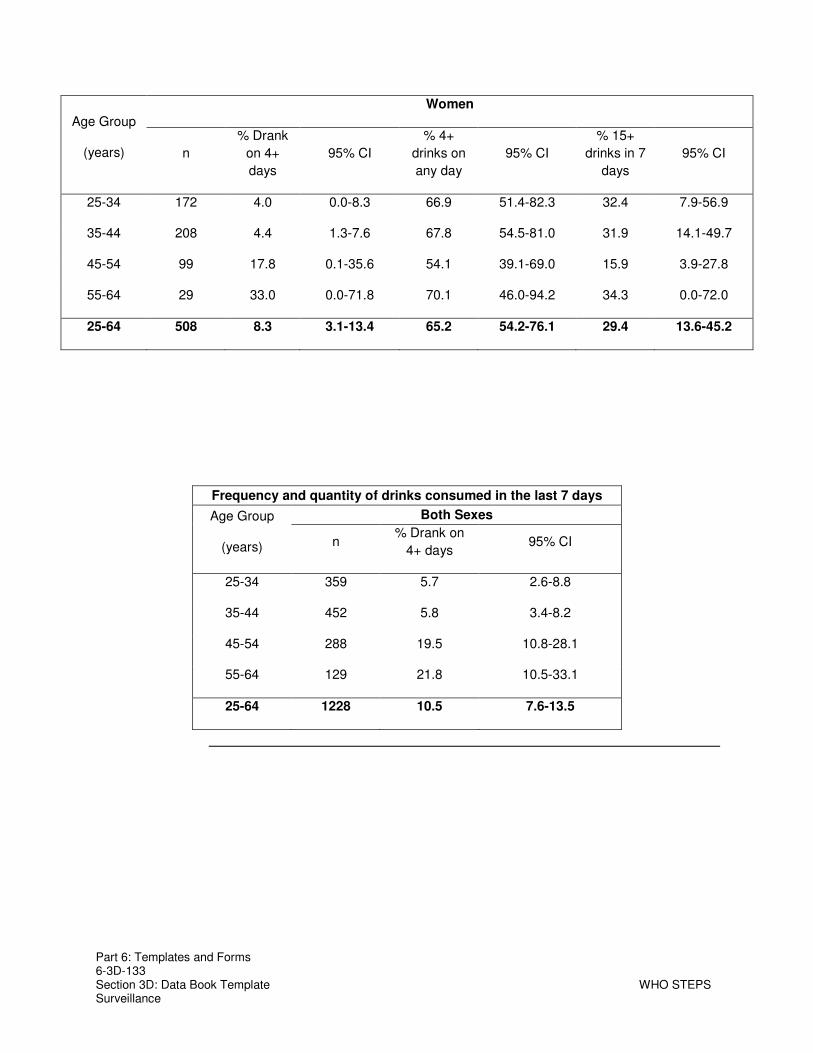
Part 6: Templates and Forms 6-3D-133 Section 3D: Data Book Template WHO STEPS Surveillance
Women
Age Group
(years) n
% Drank
on 4+
days
95% CI
% 4+
drinks on
any day
95% CI
% 15+
drinks in 7
days
95% CI
25-34 172 4.0 0.0-8.3 66.9 51.4-82.3 32.4 7.9-56.9
35-44 208 4.4 1.3-7.6 67.8 54.5-81.0 31.9 14.1-49.7
45-54 99 17.8 0.1-35.6 54.1 39.1-69.0 15.9 3.9-27.8
55-64 29 33.0 0.0-71.8 70.1 46.0-94.2 34.3 0.0-72.0
25-64 508 8.3 3.1-13.4 65.2 54.2-76.1 29.4 13.6-45.2
Frequency and quantity of drinks consumed in the last 7 days
Both Sexes Age Group
(years) n % Drank on
4+ days 95% CI
25-34 359 5.7 2.6-8.8
35-44 452 5.8 3.4-8.2
45-54 288 19.5 10.8-28.1
55-64 129 21.8 10.5-33.1
25-64 1228 10.5 7.6-13.5

Part 6: Templates and Forms 6-3D-134 Section 3D: Data Book Template WHO STEPS Surveillance
Hazardous
and
harmful
drinking
Description: Percentage of current (last 30 days) drinker engaging in hazardous and harmful drinking in the last 7 days. Harmful drinking is defined as ≥60g of pure alcohol on average per day for men and ≥40 g for women. Hazardous drinking is defined as 40-59.9g of pure alcohol on average per day for men and 20-39.9g for women. A standard drink contains approximately 10g of pure alcohol. Instrument question:
During each of the past 7 days, how many standard drinks of any alcoholic drink did you have each day?
Hazardous and harmful drinking in the last 7 days
Men
Age Group
(years) n % harmful
drinking 95% CI
%
hazardous
drinking
95% CI
% <40g
pure
alcohol
per day
95% CI
25-34 187 13.2 8.6-17.9 19.2 11.1-27.2 67.6 58.4-76.8
35-44 244 7.1 3.6-10.6 6.3 2.9-9.6 86.6 81.7-91.6
45-54 189 15.2 5.5-24.8 6.7 2.3-11.0 78.2 69.0-87.4
55-64 100 8.8 3.8-13.9 6.4 1.9-10.9 84.8 77.2-92.5
25-64 720 11.0 8.1-13.9 9.6 6.7-12.4 79.5 75.6-83.3
Hazardous and harmful drinking in the last 7 days

Part 6: Templates and Forms 6-3D-135 Section 3D: Data Book Template WHO STEPS Surveillance
Women
Age Group
(years) n % harmful
drinking 95% CI
%
hazardous
drinking
95% CI
% <20g
pure
alcohol
per day
95% CI
25-34 172 27.7 2.8-52.6 7.2 3.6-10.9 65.0 41.4-88.7
35-44 208 9.7 5.1-14.3 26.9 7.6-46.3 63.4 46.2-80.6
45-54 99 9.0 1.2-16.8 18.6 5.3-32.0 72.3 58.4-86.3
55-64 29 31.0 0.0-69.8 11.3 0.0-25.5 57.7 22.5-92.8
25-64 508 16.8 8.1-25.5 18.0 9.7-26.3 65.2 50.3-80.1
Largest
number
of
drinks
Description: Largest number of drinks consumed during a single occasion in the last 12 months among last 12 month drinker. Instrument question:
In the past 12 months what was the largest number of drinks you had on a single

Part 6: Templates and Forms 6-3D-136 Section 3D: Data Book Template WHO STEPS Surveillance
in last
12
months
occasion, counting all types of standard drinks together?
Mean maximum number of drinks consumed on one occasion in the last 12 months
Men Women Both Sexes
Age Group
(years) n
Mean
maximum
number
95% CI n
Mean
maximum
number
95% CI n
Mean maximum number
95% CI
25-34 195 16.7 13.6-19.7 207 14.2 11.2-17.3 402 15.5 13.4-17.6
35-44 227 15.1 13.2-17.0 241 13.4 10.7-16.2 468 14.2 12.7-15.7
45-54 175 17.4 13.3-21.6 117 11.9 9.6-14.2 292 15.1 12.4-17.8
55-64 102 9.9 7.2-12.7 37 12.8 8.2-17.3 139 10.5 7.6-13.3
25-64 699 15.1 13.2-17.1 602 13.3 11.5-15.2 1301 14.3 12.9-15.8

Part 6: Templates and Forms 6-3D-137 Section 3D: Data Book Template WHO STEPS Surveillance
Five or
more
drinks
on a
single
occasion
Description: Mean number of days in the past 12 months on which consumer drank five or more drinks during a single occasion. Instrument question:
In the past 12 months, on how many days did you have five or more standard drinks in a single day?
Five or more drinks on a single occasion
Men Age Group
(years) n Mean number
of days 95% CI
25-34 306 53.6 41.2-65.9
35-44 387 64.8 56.5-73.2
45-54 320 64.3 56.4-72.2
55-64 176 58.5 44.8-72.2
25-64 1189 60.5 54.7-66.4
Four or
more
drinks
on a
Description: Mean number of days in the past 12 months on which consumer drank four or more drinks during a single occasion. Instrument question:
In the past 12 months, on how many days did you have four or more standard
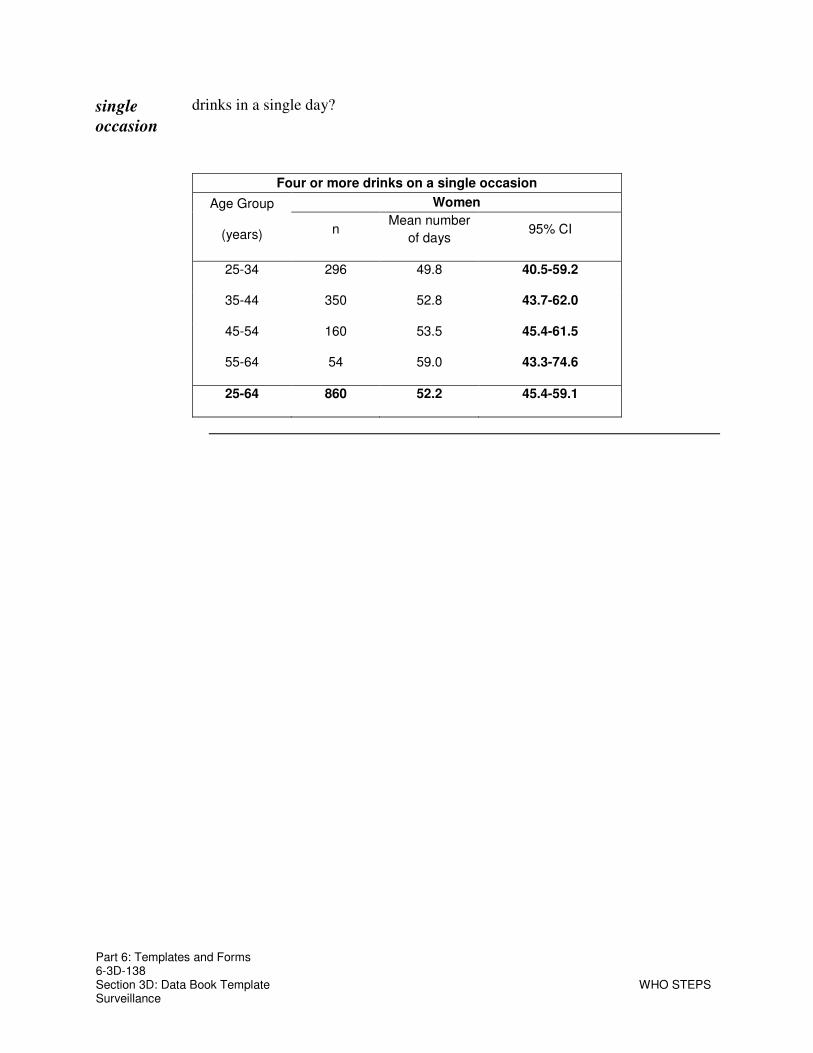
Part 6: Templates and Forms 6-3D-138 Section 3D: Data Book Template WHO STEPS Surveillance
single
occasion
drinks in a single day?
Four or more drinks on a single occasion
Women Age Group
(years) n Mean number
of days 95% CI
25-34 296 49.8 40.5-59.2
35-44 350 52.8 43.7-62.0
45-54 160 53.5 45.4-61.5
55-64 54 59.0 43.3-74.6
25-64 860 52.2 45.4-59.1

Part 6: Templates and Forms 6-3D-139 Section 3D: Data Book Template WHO STEPS Surveillance
Fruit and Vegetable Consumption
Mean
number of
days of fruit
and
vegetable
consumption
Description: mean number of days fruit and vegetables consumed. Instrument questions:
In a typical week, on how many days do you eat fruit? In a typical week, on how many days do you eat vegetables?
Mean number of days fruit consumed in a typical week
Men Women Both Sexes
Age Group
(years) n
Mean
number
of days
95% CI n
Mean
number
of days
95% CI n
Mean number of days
95% CI
25-34 287 5.1 4.5-5.6 587 5.3 5.0-5.7 874 5.2 4.9-5.6
35-44 371 4.7 4.4-5.1 643 5.2 4.9-5.5 1014 5.0 4.8-5.2
45-54 294 4.8 4.3-5.2 444 5.7 5.3-6.0 738 5.3 5.1-5.6
55-64 215 5.0 4.7-5.4 253 4.9 4.4-5.5 468 5.0 4.6-5.3
25-64 1167 4.9 4.6-5.1 1927 5.3 5.1-5.5 3094 5.2 5.0-5.3

Part 6: Templates and Forms 6-3D-140 Section 3D: Data Book Template WHO STEPS Surveillance
Mean number of days vegetables consumed in a typical week
Men Women Both Sexes
Age Group
(years) n
Mean
number
of days
95% CI n
Mean
number
of days
95% CI n
Mean number of days
95% CI
25-34 284 6.3 6.1-6.6 580 6.4 6.2-6.7 864 6.4 6.2-6.6
35-44 366 6.2 6.0-6.4 638 6.5 6.3-6.6 1004 6.4 6.2-6.5
45-54 282 6.6 6.4-6.7 430 6.6 6.5-6.8 712 6.6 6.5-6.7
55-64 210 6.5 6.3-6.7 252 6.6 6.4-6.8 462 6.6 6.4-6.7
25-64 1142 6.4 6.2-6.5 1900 6.5 6.4-6.7 3042 6.5 6.3-6.6

Part 6: Templates and Forms 6-3D-141 Section 3D: Data Book Template WHO STEPS Surveillance
Mean
number of
servings of
fruit and
vegetable
consumption
Description: mean number of fruit, vegetable, and combined fruit and vegetable servings on average per day. Instrument questions:
In a typical week, on how many days do you eat fruit? How many servings of fruit do you eat on one of those days? In a typical week, on how many days do you eat vegetables? How many servings of vegetables do you eat on one of those days?
Mean number of servings of fruit on average per day
Men Women Both Sexes
Age Group
(years) n
Mean
number
of
servings
95% CI n
Mean
number
of
servings
95% CI n
Mean number
of servings
95% CI
25-34 287 3.7 2.9-4.4 587 3.8 3.3-4.3 874 3.8 3.3-4.2
35-44 371 3.4 2.9-3.8 643 3.3 2.8-3.8 1014 3.3 2.9-3.7
45-54 294 3.5 2.9-4.1 444 3.9 3.3-4.4 738 3.7 3.3-4.1
55-64 215 3.1 2.7-3.5 253 3.0 2.4-3.7 468 3.1 2.7-3.4
25-64 1167 3.4 3.1-3.8 1927 3.6 3.3-3.8 3094 3.5 3.3-3.7
Mean number of servings of vegetables on average per day

Part 6: Templates and Forms 6-3D-142 Section 3D: Data Book Template WHO STEPS Surveillance
Men Women Both Sexes
Age Group
(years) n
Mean
number
of
servings
95% CI n
Mean
number
of
servings
95% CI n
Mean number
of servings
95% CI
25-34 284 5.1 4.3-5.9 580 4.7 4.2-5.3 864 4.9 4.3-5.4
35-44 366 4.7 3.9-5.5 638 4.2 3.8-4.7 1004 4.4 4.0-4.8
45-54 282 4.6 3.9-5.2 430 4.9 3.9-6.0 712 4.8 4.0-5.6
55-64 210 4.6 3.6-5.6 252 4.8 3.9-5.8 462 4.7 4.0-5.5
25-64 1142 4.7 4.2-5.3 1900 4.6 4.2-5.0 3042 4.7 4.3-5.1
Mean number of servings of fruit and/or vegetables on average per day
Men Women Both Sexes
Age Group
(years) n
Mean
number
of
servings
95% CI n
Mean
number
of
servings
95% CI n
Mean number
of servings
95% CI
25-34 294 8.5 7.1-10.0 592 8.4 7.5-9.3 886 8.4 7.5-9.3
35-44 380 7.8 6.8-8.7 651 7.4 6.7-8.0 1031 7.5 7.0-8.0
45-54 296 7.8 6.8-8.9 447 8.4 6.9-9.9 743 8.2 7.2-9.2
55-64 218 7.3 6.2-8.5 254 7.8 6.5-9.1 472 7.6 6.6-8.5
25-64 1188 7.9 7.1-8.6 1944 8.0 7.4-8.6 3132 8.0 7.4-8.5

Part 6: Templates and Forms 6-3D-143 Section 3D: Data Book Template WHO STEPS Surveillance
Fruit and
vegetable
consumption
per day
Description: Frequency of fruit and/or vegetable consumption. Instrument questions:
In a typical week, on how many days do you eat fruit? How many servings of fruit do you eat on one of those days? In a typical week, on how many days do you eat vegetables? How many servings of vegetables do you eat on one of those days?
Number of servings of fruit and/or vegetables on average per day
Men Age
Group
(years) n
% no fruit
and/or
vegetables
95% CI % 1-2
servings 95% CI
% 3-4
servings 95% CI % ≥5
servings 95% CI
25-34 294 1.1 0.0-2.3 18.4 12.2-24.5 17.4 11.3-23.6 63.1 53.1-73.1
35-44 380 3.1 1.2-5.0 18.7 13.5-23.8 20.7 14.2-27.2 57.6 49.7-65.5
45-54 296 1.8 0.0-4.2 21.8 15.3-28.3 21.3 14.7-27.9 55.1 49.2-60.9
55-64 218 1.0 0.0-2.6 23.3 13.3-33.3 12.1 6.8-17.3 63.6 51.1-76.2
25-64 1188 1.8 0.9-2.8 20.3 16.5-24.1 18.1 14.2-21.9 59.8 53.4-66.2
Number of servings of fruit and/or vegetables on average per day

Part 6: Templates and Forms 6-3D-144 Section 3D: Data Book Template WHO STEPS Surveillance
Women Age
Group
(years) n
% no fruit
and/or
vegetables
95% CI % 1-2
servings 95% CI
% 3-4
servings 95% CI % ≥5
servings 95% CI
25-34 592 1.2 0.0-2.7 11.5 6.3-16.7 19.6 12.6-26.7 67.7 56.4-79.0
35-44 651 0.4 0.0-0.9 17.3 12.5-22.1 16.9 13.2-20.5 65.4 59.3-71.4
45-54 447 0.7 0.0-1.4 10.8 7.1-14.5 25.6 19.0-32.2 62.9 54.7-71.1
55-64 254 1.6 0.0-3.6 11.8 5.9-17.7 21.1 10.6-31.5 65.6 54.3-76.9
25-64 1944 0.9 0.3-1.5 13.2 9.7-16.7 20.3 16.0-24.7 65.5 58.3-72.8
Number of servings of fruit and/or vegetables on average per day
Both Sexes Age
Group
(years) n
% no fruit
and/or
vegetables
95% CI % 1-2
servings 95% CI
% 3-4
servings 95% CI % ≥5
servings 95% CI
25-34 886 1.2 0.0-2.3 13.8 8.7-18.9 18.9 12.9-24.9 66.2 55.9-76.4
35-44 1031 1.4 0.6-2.1 17.8 13.9-21.7 18.2 14.8-21.6 62.6 57.3-68.0
45-54 743 1.1 0.1-2.1 14.8 11.2-18.4 24.0 19.2-28.9 60.1 54.3-65.9
55-64 472 1.3 0.0-2.9 17.6 10.6-24.5 16.5 10.0-23.0 64.6 54.4-74.8
25-64 3132 1.2 0.6-1.8 15.9 12.5-19.2 19.5 15.8-23.2 63.4 56.7-70.1

Part 6: Templates and Forms 6-3D-145 Section 3D: Data Book Template WHO STEPS Surveillance
Fruit and
vegetable
consumption
per day
Description: Percentage of those eating less than five servings of fruit and/or vegetables on average per day. Instrument questions:
In a typical week, on how many days do you eat fruit? How many servings of fruit do you eat on one of those days? In a typical week, on how many days do you eat vegetables? How many servings of vegetables do you eat on one of those days?
Less than five servings of fruit and/or vegetables on average per day
Men Women Both Sexes
Age Group
(years) n
% < five
servings
per day
95% CI n
% < five
servings
per day
95% CI n
% < five servings per day
95% CI
25-34 294 36.9 26.9-46.9 592 32.3 21.0-43.6 886 33.8 23.6-44.1
35-44 380 42.4 34.5-50.3 651 34.6 28.6-40.7 1031 37.4 32.0-42.7
45-54 296 44.9 39.1-50.8 447 37.1 28.9-45.3 743 39.9 34.1-45.7
55-64 218 36.4 23.8-48.9 254 34.4 23.1-45.7 472 35.4 25.2-45.6
25-64 1188 40.2 33.8-46.6 1944 34.5 27.2-41.7 3132 36.6 29.9-43.3
Type of
oil used
most
Description: type of oil or fat most often used for meal preparation in households (presented only for both sexes because results are for the household not individuals).
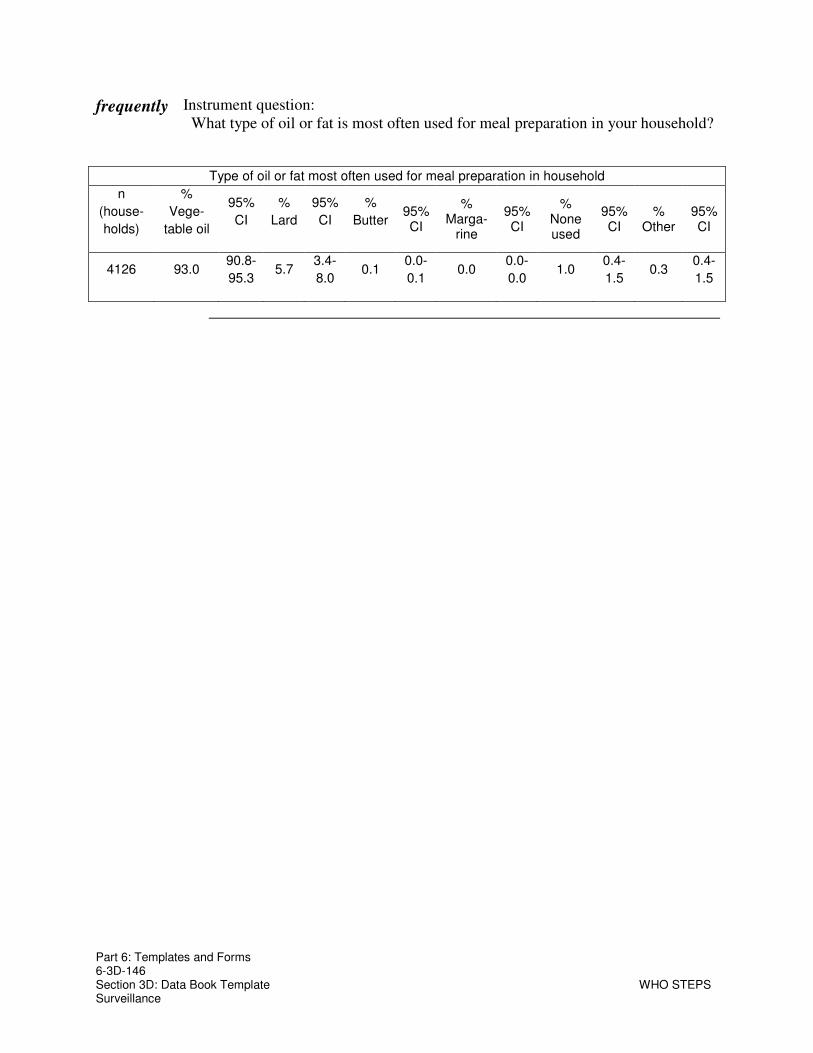
Part 6: Templates and Forms 6-3D-146 Section 3D: Data Book Template WHO STEPS Surveillance
frequently Instrument question: What type of oil or fat is most often used for meal preparation in your household?
Type of oil or fat most often used for meal preparation in household
n
(house-
holds)
%
Vege-
table oil
95%
CI
%
Lard
95%
CI
%
Butter 95% CI
% Marga-
rine
95% CI
% None used
95% CI
% Other
95% CI
4126 93.0 90.8-
95.3 5.7
3.4-
8.0 0.1
0.0-
0.1 0.0
0.0-
0.0 1.0
0.4-
1.5 0.3
0.4-
1.5

Part 6: Templates and Forms 6-3D-147 Section 3D: Data Book Template WHO STEPS Surveillance
Physical Activity
Introduction Analysis physical activity data can be very complicated and the result confusing. The following guidelines will help clarify the results of the physical activity data and will also provide valuable information on the classifications. Make sure you use some of these guidelines when you report physical activity data.
MET values are applied to vigorous and moderate intensity variables in the work, transport and recreation domains. These have been calculated using an average of the typical types of activity undertaken. Different types of activities have been grouped together and given a MET value based on the intensity of the activity. Applying MET values to types of activities allows us to calculate total physical activity. For more information regarding MET values go the STEPS website at www.who.int/chp/steps .
The calculations below use multiple questions in the physical activity section.
To simplify this a bit the questions have been clustered into four groups (as they appear in the Instrument). In the Instrument questions section of the table, only the group label appears. The specific questions for each group are presented below.
Activity at work:
Does your work involve vigorous-intensity activity that causes large increases in breathing or heart rate like [examples] for at least 10 minutes continuously?
In a typical week, on how many days do you do vigorous-intensity activities as part of your work?
How much time do you spend doing vigorous-intensity activities at work on a typical day?
Does your work involve moderate-intensity activity, that causes small increases in breathing or heart rate such as brisk walking for at least 10 minutes continuously?
In a typical week, on how many days do you do moderate-intensity activities as part of your work?
How much time do you spend doing moderate-intensity activities at work on a typical day?
Travel to and from places:
Do you walk or use a bicycle for at least 10 minutes continuously to get to and from places?
In a typical week, on how many days do you walk or bicycle for at least 10 minutes continuously to get to and from places?
Continued on next page
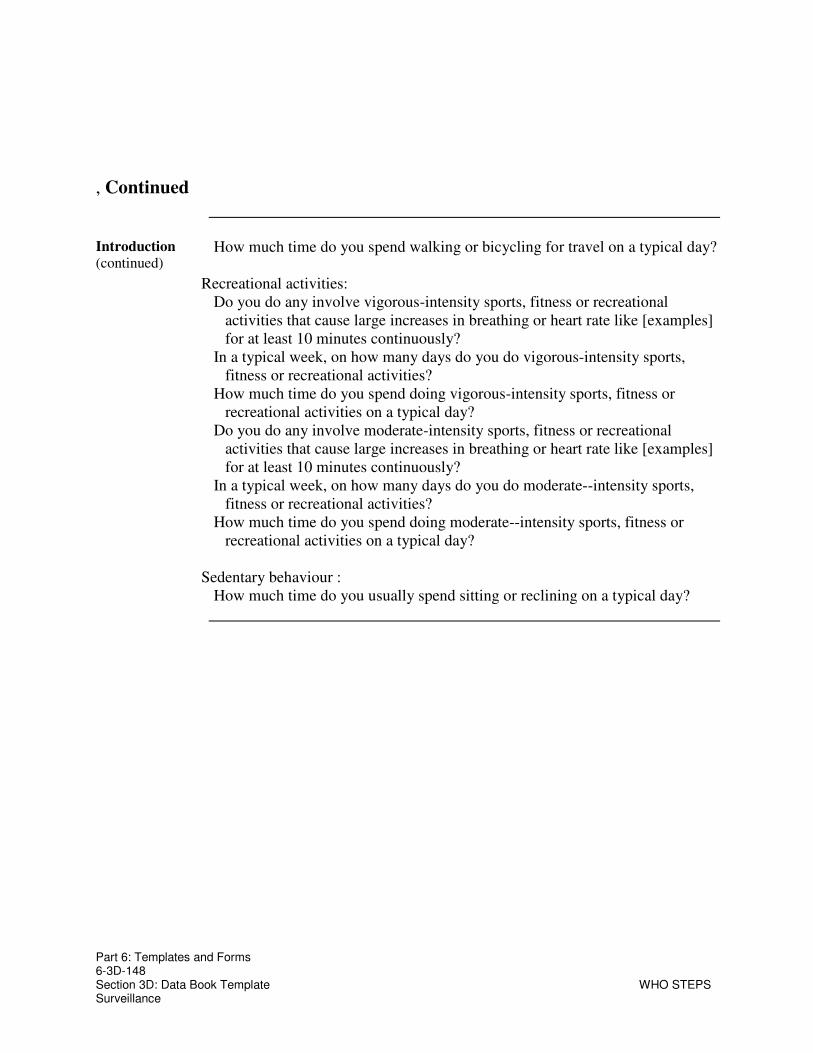
Part 6: Templates and Forms 6-3D-148 Section 3D: Data Book Template WHO STEPS Surveillance
, Continued
Introduction
(continued) How much time do you spend walking or bicycling for travel on a typical day?
Recreational activities: Do you do any involve vigorous-intensity sports, fitness or recreational
activities that cause large increases in breathing or heart rate like [examples] for at least 10 minutes continuously?
In a typical week, on how many days do you do vigorous-intensity sports, fitness or recreational activities?
How much time do you spend doing vigorous-intensity sports, fitness or recreational activities on a typical day?
Do you do any involve moderate-intensity sports, fitness or recreational activities that cause large increases in breathing or heart rate like [examples] for at least 10 minutes continuously?
In a typical week, on how many days do you do moderate--intensity sports, fitness or recreational activities?
How much time do you spend doing moderate--intensity sports, fitness or recreational activities on a typical day?
Sedentary behaviour :
How much time do you usually spend sitting or reclining on a typical day?

Part 6: Templates and Forms 6-3D-149 Section 3D: Data Book Template WHO STEPS Surveillance
Levels
of total
physical
activity
Description: Percentage of respondents classified into three categories of total physical activity. Instrument questions:
activity at work travel to and from places recreational activities
Level of total physical activity
Men Age Group
(years) n % Low 95% CI %
Moderate 95% CI % High 95% CI
25-34 308 9.8 5.4-14.2 7.7 4.6-10.8 82.5 77.0-88.0
35-44 420 8.2 5.4-11.0 12.2 8.1-16.4 79.6 74.8-84.3
45-54 371 9.4 5.6-13.1 15.9 11.5-20.3 74.7 69.1-80.3
55-64 274 15.2 6.3-24.0 38.4 20.8-56.1 46.4 32.7-60.2
25-64 1373 10.4 7.7-13.1 17.5 13.2-21.9 72.1 68.2-76.0
Level of total physical activity
Women Age Group
(years) n % Low 95% CI %
Moderate 95% CI % High 95% CI
25-34 605 16.4 10.2-22.6 21.4 16.4-26.4 62.2 55.8-68.7
35-44 705 15.2 11.3-19.0 20.8 16.9-24.6 64.1 58.4-69.7
45-54 521 13.4 9.1-17.8 30.1 23.8-36.4 56.4 49.4-63.5
55-64 308 26.5 17.9-35.2 28.2 18.3-38.1 45.3 32.0-58.5
25-64 2139 16.7 13.0-20.3 24.3 21.2-27.4 59.1 54.0-64.2

Part 6: Templates and Forms 6-3D-150 Section 3D: Data Book Template WHO STEPS Surveillance
Level of total physical activity
Both Sexes Age Group
(years) n % Low 95% CI %
Moderate 95% CI % High 95% CI
25-34 913 14.1 9.4-18.8 16.7 12.9-20.6 69.1 63.9-74.4
35-44 1125 12.7 10.0-15.4 17.7 15.1-20.3 69.6 65.3-73.8
45-54 892 11.8 8.6-15.0 24.4 20.5-28.3 63.8 59.2-68.4
55-64 582 20.9 13.2-28.6 33.2 25.9-40.6 45.8 40.0-51.7
25-64 3512 14.2 11.3-17.1 21.7 19.5-23.9 64.1 61.1-67.1
Total Description: Mean minutes of total physical activity on average per day.

Part 6: Templates and Forms 6-3D-151 Section 3D: Data Book Template WHO STEPS Surveillance
physical
activity-
mean
Instrument questions activity at work travel to and from places recreational activities
Mean minutes of total physical activity on average per day
Men Women Both Sexes
Age Group
(years) n Mean
minutes 95% CI n
Mean
minutes 95% CI
n Mean
minutes 95% CI
25-34 308 392.8 328.5-457.2 605 263.4 204.5-322.3 913 307.5 255.7-359.4
35-44 420 354.6 312.6-396.5 705 243.8 202.0-285.5 1125 283.1 247.4-318.9
45-54 371 305.4 269.3-341.6 521 205.4 164.3-246.6 892 245.7 217.1-274.3
55-64 274 190.0 134.4-245.5 308 162.1 68.9-255.4 582 175.8 133.4-218.2
25-64 1373 316.9 291.4-342.4 2139 229.3 179.4-279.2 3512 263.1 229.1-297.1
Total
physical
activity-
median
Description: Median minutes of total physical activity on average per day. Instrument questions
activity at work travel to and from places recreational activities
Median minutes of total physical activity on average per day

Part 6: Templates and Forms 6-3D-152 Section 3D: Data Book Template WHO STEPS Surveillance
Men Women Both Sexes
Age Group
(years) n Median
minutes
Inter-quartile
range
(P25-P75)
n Median
minutes
Inter-quartile
range
(P25-P75)
n Median
minutes
Inter-quartile
range
(P25-P75)
25-34 308 411.4 150.0-578.6 605 188.6 60.0-450.0 913 268.6 60.0-490.7
35-44 420 342.9 115.7-488.6 705 150.0 50.0-420.0 1125 194.3 60.0-471.4
45-54 371 270.0 81.4-480.0 521 111.4 50.0-365.7 892 167.1 60.0-441.4
55-64 274 80.0 45.0-80.0 308 70.0 20.0-240.0 582 71.4 30.0-231.4
25-64 1373 268.6 70.0-480.0 2139 132.9 42.9-377.1 3512 180.0 60.0-450.0
Domain-
specific
physical
activity-
mean
Description: Mean minutes spent in work-, transport- and recreation-related physical activity on average per day. Instrument questions:
activity at work travel to and from places recreational activities
Mean minutes of work-related physical activity on average per day
Men Women Both Sexes
Age Group
(years) n Mean
minutes 95% CI n
Mean
minutes 95% CI
n Mean
minutes 95% CI
25-34 308 331.6 263.4-399.8 605 211.4 166.2-256.5 913 252.4 208.7-296.1
35-44 420 302.6 266.2-339.0 705 194.2 157.5-230.9 1125 232.7 202.0-263.5
45-54 371 252.7 219.2-286.3 521 160.4 116.9-204.0 892 197.6 168.5-226.7
55-64 274 152.1 105.1-199.2 308 96.9 70.9-122.8 582 124.1 98.9-149.2
25-64 1373 265.3 239.6-291.1 2139 178.0 141.4-214.6 3512 211.7 184.1-239.2
Mean minutes of transport-related physical activity on average per day

Part 6: Templates and Forms 6-3D-153 Section 3D: Data Book Template WHO STEPS Surveillance
Men Women Both Sexes
Age Group
(years) n Mean
minutes 95% CI n
Mean
minutes 95% CI
n Mean
minutes 95% CI
25-34 308 37.1 14.8-59.3 605 42.7 17.3-68.1 913 40.8 23.9-57.6
35-44 420 32.6 23.8-41.4 705 34.0 26.0-42.0 1125 33.5 26.5-40.5
45-54 371 35.4 28.1-42.7 521 32.3 26.1-38.4 892 33.5 28.3-38.7
55-64 274 26.4 14.7-38.1 308 57.9 0.0-136.3 582 42.4 6.1-78.7
25-64 1373 33.2 25.3-41.0 2139 39.5 22.6-56.4 3512 37.0 27.4-46.7
Mean minutes of recreation-related physical activity on average per day
Men Women Both Sexes
Age Group
(years) n Mean
minutes 95% CI n
Mean
minutes 95% CI
n Mean
minutes 95% CI
25-34 308 24.1 17.1-31.2 605 9.3 5.5-13.1 913 14.4 9.7-19.0
35-44 420 19.4 12.3-26.5 705 15.6 9.5-21.6 1125 16.9 12.3-21.5
45-54 371 17.3 9.4-25.3 521 12.7 9.1-16.4 892 14.6 10.7-18.4
55-64 274 11.4 7.5-15.3 308 7.4 4.7-10.1 582 9.4 6.7-12.0
25-64 1373 18.4 14.3-22.5 2139 11.8 9.2-14.5 3512 14.4 11.7-17.0
Domain-Description: Median minutes spent on average per day in work-, transport- and recreation-related physical activity.

Part 6: Templates and Forms 6-3D-154 Section 3D: Data Book Template WHO STEPS Surveillance
specific
physical
activity -
median
Instrument questions: activity at work travel to and from places recreational activities
Median minutes of work-related physical activity on average per day
Men Women Both Sexes
Age Group
(years) n Median
minutes
Inter-quartile
range (P25-
P75)
n Median
minutes
Inter-quartile
range (P25-
P75)
n
Median
minutes
Inter-
quartile
range (P25-
P75)
25-34 308 360.0 77.1-510.0 605 128.6 25.7-382.9 913 205.7 34.3-480.0
35-44 420 300.0 60.0-445.7 705 107.1 20.0-360.0 1125 137.1 30.0-420.0
45-54 371 205.7 45.0-424.3 521 60.0 20.0-300.0 892 102.9 30.0-364.3
55-64 274 60.0 20.0-180.0 308 32.1 8.6-180.0 582 51.4 11.4-180.0
25-64 1373 205.7 42.9-437.1 2139 81.4 20.0-308.6 3512 120.0 25.7-382.6
Median minutes of transport-related physical activity on average per day

Part 6: Templates and Forms 6-3D-155 Section 3D: Data Book Template WHO STEPS Surveillance
Men Women Both Sexes
Age Group
(years) n Median
minutes
Inter-quartile
range (P25-
P75)
n Median
minutes
Inter-quartile
range (P25-
P75)
n
Median
minutes
Inter-
quartile
range (P25-
P75)
25-34 308 15.0 0.0-30.0 605 12.9 0.0-60.0 913 14.3 0.0-45.0
35-44 420 12.9 0.0-30.0 705 10.0 0.0-30.0 1125 10.0 0.0-30.0
45-54 371 17.1 0.0-40.0 521 14.3 0.0-30.0 892 17.1 0.0-30.0
55-64 274 10.0 0.0-30.0 308 4.3 0.0-30.0 582 7.1 0.0-30.0
25-64 1373 14.3 0.0-30.0 2139 10.0 0.0-34.3 3512 10.0 0.0-30.0
Median minutes of recreation-related physical activity on average per day
Men Women Both Sexes
Age Group
(years) n Median
minutes
Inter-quartile
range (P25-
P75)
n Median
minutes
Inter-quartile
range (P25-
P75)
n
Median
minutes
Inter-
quartile
range (P25-
P75)
25-34 308 0.0 0.0-30.0 605 0.0 0.0-0.0 913 0.0 0.0-8.6
35-44 420 0.0 0.0-25.7 705 0.0 0.0-8.6 1125 0.0 0.0-15.0
45-54 371 0.0 0.0-15.0 521 0.0 0.0-15.0 892 0.0 0.0-15.0
55-64 274 0.0 0.0-8.6 308 0.0 0.0-0.0 582 0.0 0.0-8.6
25-64 1373 0.0 0.0-17.1 2139 0.0 0.0-5.7 3512 0.0 0.0-11.4
No
physical
activity
Description: Percentage of respondents classified as doing no work-, transport- or recreational-related physical activity. Instrument questions:

Part 6: Templates and Forms 6-3D-156 Section 3D: Data Book Template WHO STEPS Surveillance
by
domain
activity at work travel to and from places recreational activities
No work-related physical activity
Men Women Both Sexes
Age Group
(years) n
% no
activity
at work
95% CI n
% no
activity
at work
95% CI n
% no activity at work
95% CI
25-34 308 7.6 3.9-11.4 605 19.6 14.4-24.7 913 15.5 11.8-19.2
35-44 420 6.9 4.0-9.9 705 16.3 11.9-20.7 1125 13.0 9.7-16.3
45-54 371 10.2 6.4-14.0 521 14.6 9.0-20.2 892 12.8 9.0-16.6
55-64 274 11.8 5.8-17.8 308 22.6 14.5-30.7 582 17.3 11.4-23.2
25-64 1373 9.0 6.4-11.5 2139 17.7 14.4-21.1 3512 14.4 11.7-17.1
No transport-related physical activity
Men Women Both Sexes
Age Group
(years) n
% no
activity
for
transport
95% CI n
% no
activity
for
transport
95% CI n
% no activity
for transport
95% CI
25-34 308 34.2 25.7-42.7 605 34.2 23.3-45.1 913 34.2 25.0-43.4
35-44 420 39.6 33.2-46.1 705 36.9 30.1-43.7 1125 37.9 32.5-43.3
45-54 371 30.2 23.5-36.9 521 35.7 29.4-42.0 892 33.5 28.7-38.3
55-64 274 41.0 23.4-58.7 308 47.3 35.9-58.6 582 44.2 36.7-51.7
25-64 1373 36.1 31.8-40.4 2139 37.2 30.1-44.2 3512 36.8 32.3-41.2
No recreation-related physical activity

Part 6: Templates and Forms 6-3D-157 Section 3D: Data Book Template WHO STEPS Surveillance
Men Women Both Sexes
Age Group
(years) n
% no
activity at
recreation
95% CI n
% no
activity at
recreation
95% CI n
% no activity at recreation
95% CI
25-34 308 52.1 38.2-65.9 605 80.4 73.4-87.4 913 70.7 61.4-80.1
35-44 420 58.4 50.0-66.7 705 69.5 64.1-74.8 1125 65.5 61.0-70.0
45-54 371 62.8 56.0-69.6 521 66.5 59.0-74.0 892 65.0 59.6-70.4
55-64 274 70.7 62.2-79.1 308 76.5 68.2-84.8 582 73.6 66.8-80.5
25-64 1373 60.5 53.9-67.1 2139 73.0 68.9-77.2 3512 68.2 63.5-72.9
Composition
of total
physical
activity
Description: Percentage of work, transport and recreational activity contributing to total activity. Instrument questions:
activity at work travel to and from places recreational activities
Composition of total physical activity
Men
Age Group
(years) n % Activity
from work 95% CI
% Activity
for
transport
95% CI
% Activity
during
leisure
time
95% CI
25-34 291 78.4 73.0-83.8 8.9 5.4-12.4 12.7 9.0-16.4
35-44 402 77.1 73.4-80.9 12.4 9.6-15.2 10.5 7.7-13.3
45-54 348 72.9 68.4-77.5 14.8 11.3-18.2 12.3 9.4-15.2
55-64 246 69.0 59.0-79.0 20.6 12.7-28.5 10.4 6.6-14.2
25-64 1287 74.7 71.0-78.4 13.8 11.1-16.5 11.5 9.5-13.5
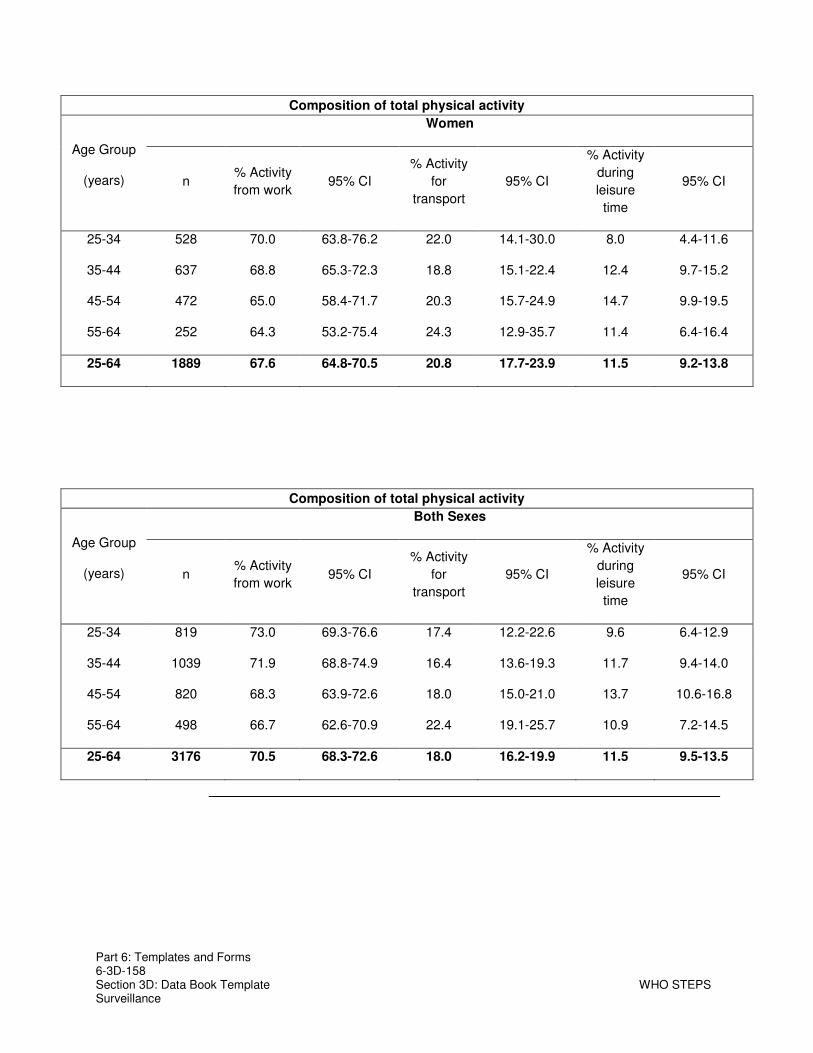
Part 6: Templates and Forms 6-3D-158 Section 3D: Data Book Template WHO STEPS Surveillance
Composition of total physical activity
Women
Age Group
(years) n % Activity
from work 95% CI
% Activity
for
transport
95% CI
% Activity
during
leisure
time
95% CI
25-34 528 70.0 63.8-76.2 22.0 14.1-30.0 8.0 4.4-11.6
35-44 637 68.8 65.3-72.3 18.8 15.1-22.4 12.4 9.7-15.2
45-54 472 65.0 58.4-71.7 20.3 15.7-24.9 14.7 9.9-19.5
55-64 252 64.3 53.2-75.4 24.3 12.9-35.7 11.4 6.4-16.4
25-64 1889 67.6 64.8-70.5 20.8 17.7-23.9 11.5 9.2-13.8
Composition of total physical activity
Both Sexes
Age Group
(years) n % Activity
from work 95% CI
% Activity
for
transport
95% CI
% Activity
during
leisure
time
95% CI
25-34 819 73.0 69.3-76.6 17.4 12.2-22.6 9.6 6.4-12.9
35-44 1039 71.9 68.8-74.9 16.4 13.6-19.3 11.7 9.4-14.0
45-54 820 68.3 63.9-72.6 18.0 15.0-21.0 13.7 10.6-16.8
55-64 498 66.7 62.6-70.9 22.4 19.1-25.7 10.9 7.2-14.5
25-64 3176 70.5 68.3-72.6 18.0 16.2-19.9 11.5 9.5-13.5

Part 6: Templates and Forms 6-3D-159 Section 3D: Data Book Template WHO STEPS Surveillance
No
vigorous
physical
activity
Description: Percentage of respondents not engaging in vigorous physical activity. Instrument questions:
activity at work recreational activities
No vigorous physical activity
Men Women Both Sexes
Age Group
(years) n
% no
vigorous
activity
95% CI n
% no
vigorous
activity
95% CI n
% no vigorous activity
95% CI
25-34 308 17.8 12.1-23.5 605 65.4 59.0-71.9 913 49.2 44.0-54.3
35-44 420 28.3 21.1-35.4 705 59.6 52.5-66.7 1125 48.5 42.7-54.2
45-54 371 32.9 26.8-39.0 521 61.4 50.9-71.9 892 49.9 43.2-56.7
55-64 274 65.5 53.8-77.2 308 77.6 69.6-85.6 582 71.6 63.1-80.2
25-64 1373 34.6 30.4-38.8 2139 64.3 60.7-67.8 3512 52.8 49.7-56.0
Sedentary Description: Minutes spent in sedentary activities on a typical day. Instrument question:
sedentary behaviour

Part 6: Templates and Forms 6-3D-160 Section 3D: Data Book Template WHO STEPS Surveillance
Minutes spent in sedentary activities on average per day
Men
Age Group
(years) n Mean
minutes 95% CI
Median
minutes
Inter-quartile
range
(P25-P75)
25-34 380 83.3 69.0-97.6 60.0 30.0-120.0
35-44 510 64.2 55.1-73.3 60.0 30.0-60.0
45-54 459 69.8 58.1-81.5 45.0 20.0-80.0
55-64 328 65.1 54.3-75.9 30.0 20.0-60.0
25-64 1677 70.4 64.2-76.6 60.0 30.0-90.0
Minutes spent in sedentary activities on average per day
Women
Age Group
(years) n Mean
minutes 95% CI
Median
minutes
Inter-quartile
range
(P25-P75)
25-34 714 83.7 68.9-98.5 60.0 30.0-120.0
35-44 809 72.2 64.1-80.4 60.0 30.0-90.0
45-54 594 70.5 59.9-81.1 60.0 20.0-60.0
55-64 361 91.9 73.1-110.7 60.0 30.0-120.0
25-64 2478 78.0 69.7-86.3 60.0 30.0-120.0
Minutes spent in sedentary activities on average per day
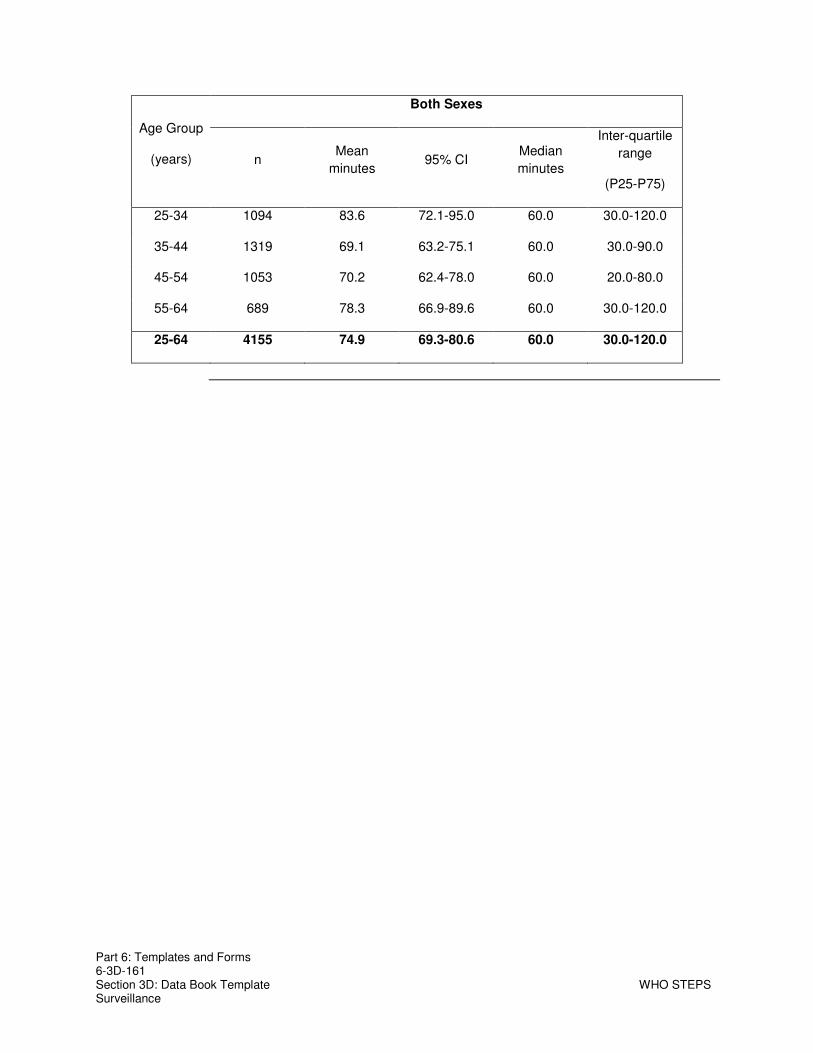
Part 6: Templates and Forms 6-3D-161 Section 3D: Data Book Template WHO STEPS Surveillance
Both Sexes
Age Group
(years) n Mean
minutes 95% CI
Median
minutes
Inter-quartile
range
(P25-P75)
25-34 1094 83.6 72.1-95.0 60.0 30.0-120.0
35-44 1319 69.1 63.2-75.1 60.0 30.0-90.0
45-54 1053 70.2 62.4-78.0 60.0 20.0-80.0
55-64 689 78.3 66.9-89.6 60.0 30.0-120.0
25-64 4155 74.9 69.3-80.6 60.0 30.0-120.0

Part 6: Templates and Forms 6-3D-162 Section 3D: Data Book Template WHO STEPS Surveillance
Blood Pressure and Diabetes History
Blood
pressure
diagnosis
and
treatment
Description: Raised blood pressure diagnosis and treatment results among all respondents. Instrument questions:
Have you ever been told by a doctor or other health worker that you have elevated blood pressure or hypertension?
If yes, was in the past 12 months? Are you currently receiving any of the following treatments/advice for high blood
pressure prescribed by a doctor or other health worker: Drugs (medication) that you have taken in the last 2 weeks?
Raised blood pressure ever diagnosed by doctor or health worker
Men Women Both Sexes Age Group
(years) n %
diagnosed 95% CI n
%
diagnosed 95% CI
n %
diagnosed 95% CI
25-34 338 2.8 0.3-5.3 647 4.0 1.0-7.0 985 3.6 1.2-5.9
35-44 439 5.5 1.4-9.6 715 10.8 6.5-15.2 1154 8.9 5.3-12.5
45-54 378 8.7 5.3-12.1 524 14.2 9.7-18.7 902 12.0 9.0-15.0
55-64 273 13.0 7.3-18.8 288 20.0 12.7-27.3 561 16.4 11.3-21.5
25-64 1428 7.2 5.4-9.1 2174 10.7 8.8-12.6 3602 9.3 7.8-10.9

Part 6: Templates and Forms 6-3D-163 Section 3D: Data Book Template WHO STEPS Surveillance
Raised blood pressure diagnosed by doctor or health worker in last 12 months
Men Women Both Sexes Age Group
(years) n %
diagnosed 95% CI n
%
diagnosed 95% CI
n %
diagnosed 95% CI
25-34 338 2.8 0.3-5.3 647 3.8 0.8-6.8 985 3.4 1.1-5.8
35-44 439 5.5 1.4-9.6 715 10.4 6.1-14.7 1154 8.6 5.0-12.1
45-54 378 8.1 4.9-11.4 524 13.9 9.4-18.4 902 11.6 8.6-14.6
55-64 273 10.5 5.1-15.8 288 16.1 10.0-22.1 561 13.2 8.8-17.5
25-64 1428 6.5 4.7-8.4 2174 9.9 8.0-11.8 3602 8.6 7.0-10.2
Currently taking blood pressure drugs prescribed by doctor or health worker
Men Women Both Sexes Age Group
(years) n % taking
meds 95% CI n
% taking
meds 95% CI
n % taking
meds 95% CI
25-34 370 1.3 0.0-2.8 690 2.0 0.2-3.7 1060 1.7 0.5-2.9
35-44 481 4.3 0.9-7.6 785 6.7 3.6-9.7 1266 5.8 3.1-8.4
45-54 442 6.3 3.5-9.2 577 12.7 7.4-18.0 1019 10.1 6.6-13.6
55-64 317 7.9 3.4-12.3 352 11.9 6.3-17.5 669 9.9 5.7-14.1
25-64 1610 4.8 3.1-6.6 2404 7.4 5.0-9.9 4014 6.4 4.5-8.3

Part 6: Templates and Forms 6-3D-164 Section 3D: Data Book Template WHO STEPS Surveillance
Blood
pressure
lifestyle
advice
Description: Percentage of respondents who received lifestyle advice from a doctor or health worker to treat raised blood pressure. Instrument question:
Are you currently receiving any of the following treatments/advice for high blood pressure prescribed by a doctor or other health worker?
Advised by doctor or health worker to have special prescribed diet
Men Women Both Sexes
Age Group
(years) n % 95% CI n % 95% CI n % 95% CI
25-34 371 1.9 0.1-3.7 687 0.6 0.1-1.1 1058 1.0 0.3-1.8
35-44 481 4.6 1.2-8.0 782 6.1 2.7-9.4 1263 5.5 3.1-7.9
45-54 444 6.5 3.3-9.7 582 12.0 8.0-16.1 1026 9.8 7.0-12.5
55-64 318 7.4 3.3-11.6 351 11.8 7.5-16.2 669 9.6 6.2-13.0
25-64 1614 5.0 3.2-6.8 2402 6.7 5.3-8.1 4016 6.0 4.8-7.3
Advised by doctor or health worker to lose weight
Men Women Both Sexes
Age Group
(years) n % 95% CI n % 95% CI n % 95% CI
25-34 369 1.6 0.0-3.3 688 1.1 0.0-2.2 1057 1.3 0.2-2.3
35-44 479 2.4 0.6-4.2 785 6.6 3.2-10.0 1264 5.1 2.9-7.2
45-54 445 4.9 2.4-7.4 579 7.6 4.1-11.2 1024 6.5 4.3-8.7
55-64 316 6.0 1.9-10.0 351 8.5 4.9-12.2 667 7.3 4.2-10.3
25-64 1609 3.6 2.0-5.2 2403 5.5 4.1-6.8 4012 4.7 3.6-5.8

Part 6: Templates and Forms 6-3D-165 Section 3D: Data Book Template WHO STEPS Surveillance
Advised by doctor or health worker to stop smoking
Men Women Both Sexes
Age Group
(years) n % 95% CI n % 95% CI n % 95% CI
25-34 364 3.3 0.9-5.7 670 0.1 0.0-0.2 1034 1.2 0.4-2.1
35-44 473 2.9 1.2-4.7 748 0.5 0.0-1.3 1221 1.4 0.7-2.2
45-54 429 4.4 2.0-6.7 542 1.0 0.2-1.8 971 2.4 1.2-3.7
55-64 301 5.4 2.0-8.8 335 3.4 1.3-5.4 636 4.4 2.4-6.4
25-64 1567 3.9 2.5-5.3 2295 0.9 0.5-1.3 3862 2.1 1.4-2.8
Advised by doctor or health worker to start or do more exercise
Men Women Both Sexes
Age Group
(years) n % 95% CI n % 95% CI n % 95% CI
25-34 367 6.1 2.7-9.5 680 3.4 1.4-5.4 1047 4.4 2.4-6.3
35-44 477 7.9 3.7-12.0 778 9.1 5.9-12.4 1255 8.7 6.2-11.1
45-54 438 13.3 9.1-17.4 575 8.3 4.8-11.7 1013 10.3 7.9-12.7
55-64 315 11.6 6.8-16.4 346 9.3 4.8-13.7 661 10.5 7.0-13.9
25-64 1597 9.6 7.3-11.9 2379 7.2 5.5-8.9 3976 8.2 6.6-9.7
Blood
pressure
Description: Percentage of respondents who have sought advice or received treatment from traditional healers for raised blood pressure.

Part 6: Templates and Forms 6-3D-166 Section 3D: Data Book Template WHO STEPS Surveillance
advice by
a
traditional
healer
Instrument questions: During the past 12 months have you seen a traditional healer for raised blood
pressure? Are you currently taking any herbal or traditional remedy for your high blood
pressure?
Seen a traditional healer in the last 12 months
Men Women Both Sexes
Age Group
(years) n % 95% CI n % 95% CI n % 95% CI
25-34 368 1.4 0.0-3.1 681 0.2 0.0-0.4 1049 0.6 0.0-1.2
35-44 476 2.2 0.0-5.1 780 3.7 0.8-6.7 1256 3.1 1.0-5.3
45-54 434 3.2 1.2-5.3 573 4.8 1.9-7.7 1007 4.2 2.3-6.1
55-64 316 4.0 1.5-6.6 347 5.1 2.0-8.1 663 4.5 2.7-6.4
25-64 1594 2.7 1.3-4.0 2381 3.1 2.0-4.2 3975 2.9 2.0-3.8
Currently taking herbal or traditional remedy for high blood pressure
Men Women Both Sexes
Age Group
(years) n % 95% CI n % 95% CI n % 95% CI
25-34 369 0.7 0.0-1.6 679 0.1 0.0-0.2 1048 0.3 0.0-0.6
35-44 475 1.8 0.0-4.7 775 1.6 0.0-3.3 1250 1.7 0.2-3.2
45-54 433 3.0 0.3-5.6 569 2.7 0.9-4.5 1002 2.8 1.1-4.5
55-64 316 1.9 0.1-3.6 348 4.2 1.3-7.1 664 3.0 1.4-4.6
25-64 1593 1.8 0.6-3.1 2371 1.8 1.0-2.6 3964 1.8 1.0-2.6
Diabetes
diagnosis
and
treatment
Description: Diabetes diagnosis and treatment results among all respondents. Instrument questions:
Have you ever been told by a doctor or other health worker that you have diabetes? Was it during the past 12 months?

Part 6: Templates and Forms 6-3D-167 Section 3D: Data Book Template WHO STEPS Surveillance
Are you currently taking any of the following treatments/advice for diabetes prescribed by a doctor or other health worker: insulin? oral drugs?
Diabetes ever diagnosed by doctor or health
Men Women Both Sexes Age Group
(years) n %
diagnosed 95% CI n
%
diagnosed 95% CI
n %
diagnosed 95% CI
25-34 364 0.0 0.0-0.0 685 0.1 0.0-0.4 1049 0.1 0.0-0.2
35-44 474 0.5 0.0-1.0 781 2.2 0.0-4.7 1255 1.5 0.0-3.1
45-54 442 2.7 1.0-4.5 572 4.5 0.1-9.0 1014 3.8 1.2-6.4
55-64 311 3.3 1.4-5.2 348 8.8 4.2-13.3 659 6.1 3.6-8.5
25-64 1591 1.6 1.0-2.1 2386 3.1 1.7-4.5 3977 2.5 1.6-3.3
Diabetes diagnosed by doctor or health worker in last 12 months
Men Women Both Sexes Age Group
(years) n %
diagnosed 95% CI n
%
diagnosed 95% CI
n %
diagnosed 95% CI
25-34 364 0.0 0.0-0.0 685 0.1 0.0-0.2 1049 0.0 0.0-0.1
35-44 474 0.4 0.0-0.9 781 2.1 0.0-4.6 1255 1.5 0.0-3.1
45-54 442 2.5 0.8-4.2 572 3.1 1.0-5.3 1014 2.9 1.5-4.3
55-64 311 2.8 1.1-4.5 348 8.5 4.0-13.0 659 5.7 3.2-8.1
25-64 1591 1.4 0.9-1.9 2386 2.7 1.6-3.7 3977 2.1 1.5-2.8
Currently taking insulin prescribed for diabetes by doctor or health worker

Part 6: Templates and Forms 6-3D-168 Section 3D: Data Book Template WHO STEPS Surveillance
Men Women Both Sexes Age Group
(years) n % taking
insulin 95% CI n
% taking
insulin 95% CI
n % taking insulin
95% CI
25-34 363 0.0 0.0-0.1 681 0.1 0.0-0.3 1044 0.1 0.0-0.2
35-44 475 0.1 0.0-0.4 771 0.8 0.0-1.8 1246 0.6 0.0-1.2
45-54 442 1.4 0.1-2.8 571 2.7 0.5-4.9 1013 2.2 0.7-3.6
55-64 316 2.0 0.3-3.6 351 3.3 0.0-6.7 667 2.6 0.6-4.6
25-64 1596 0.8 0.4-1.3 2374 1.4 0.6-2.2 3970 1.2 0.6-1.7
Currently taking oral drugs prescribed for diabetes by doctor or health worker
Men Women Both Sexes Age Group
(years) n % taking
meds 95% CI n
% taking
meds 95% CI
n % taking
meds 95% CI
25-34 364 0.0 0.0-0.1 682 0.1 0.0-0.3 1046 0.1 0.0-0.2
35-44 476 0.4 0.0-1.0 774 0.9 0.0-1.9 1250 0.7 0.1-1.3
45-54 442 3.1 1.2-5.1 571 3.5 1.3-5.6 1013 3.3 1.9-4.8
55-64 318 3.9 1.6-6.1 351 7.0 2.9-11.0 669 5.4 3.0-7.8
25-64 1600 1.8 1.1-2.5 2378 2.2 1.3-3.1 3978 2.0 1.4-2.6
Diabetes
lifestyle
advice
Description: Percentage of respondents who received lifestyle advice from a doctor or health worker to diabetes. Instrument question:
Are you currently taking any of the following treatments/advice for diabetes prescribed by a doctor or other health worker?

Part 6: Templates and Forms 6-3D-169 Section 3D: Data Book Template WHO STEPS Surveillance
Advised by doctor or health worker to have special prescribed diet
Men Women Both Sexes
Age Group
(years) n % 95% CI n % 95% CI n % 95% CI
25-34 366 0.0 0.0-0.1 686 0.2 0.0-0.4 1052 0.1 0.0-0.3
35-44 477 0.6 0.0-1.4 778 2.0 0.0-4.4 1255 1.5 0.0-3.0
45-54 445 4.5 2.0-6.9 577 3.4 1.2-5.7 1022 3.9 1.8-5.9
55-64 318 5.4 2.6-8.3 354 9.1 4.6-13.5 672 7.2 4.6-9.8
25-64 1606 2.5 1.7-3.4 2395 2.8 1.8-3.7 4001 2.7 2.0-3.4
Advised by doctor or health worker to lose weight
Men Women Both Sexes
Age Group
(years) n % 95% CI n % 95% CI n % 95% CI
25-34 365 1.4 0.0-3.1 685 1.0 0.3-1.7 1050 1.1 0.2-2.0
35-44 478 2.0 0.2-3.9 778 4.1 1.3-6.9 1256 3.3 1.3-5.2
45-54 442 4.2 2.2-6.2 578 4.4 1.9-6.8 1020 4.3 2.9-5.6
55-64 316 5.0 1.8-8.2 353 7.3 3.6-11.0 669 6.2 3.7-8.6
25-64 1601 3.1 1.7-4.4 2394 3.7 2.7-4.7 3995 3.4 2.5-4.3
Advised by doctor or health worker to stop smoking

Part 6: Templates and Forms 6-3D-170 Section 3D: Data Book Template WHO STEPS Surveillance
Men Women Both Sexes
Age Group
(years) n % 95% CI n % 95% CI n % 95% CI
25-34 357 2.1 0.5-3.7 678 0.0 0.0-0.0 1035 0.7 0.2-1.3
35-44 469 2.8 1.2-4.4 769 0.1 0.0-0.2 1238 1.1 0.5-1.7
45-54 433 6.1 3.8-8.5 567 0.6 0.0-1.3 1000 2.9 1.8-4.0
55-64 304 5.2 2.3-8.0 341 1.5 0.0-3.2 645 3.4 1.8-5.0
25-64 1563 4.0 2.8-5.2 2355 0.4 0.1-0.7 3918 1.8 1.3-2.4
Advised doctor or health worker to start or do more exercise
Men Women Both Sexes
Age Group
(years) n % 95% CI n % 95% CI n % 95% CI
25-34 365 4.8 2.1-7.5 684 1.9 0.5-3.2 1049 2.9 1.4-4.5
35-44 476 5.2 2.8-7.7 778 4.6 2.0-7.3 1254 4.8 2.8-6.9
45-54 442 8.3 5.8-10.8 579 5.1 2.4-7.8 1021 6.4 4.5-8.3
55-64 316 8.0 4.1-11.9 351 8.3 3.8-12.8 667 8.2 4.9-11.4
25-64 1599 6.5 4.8-8.3 2392 4.4 3.2-5.7 3991 5.3 4.1-6.4
Diabetes
advice by
traditional
healer
Description: Percentage of respondents who are have sought advice or treatment from traditional healers for diabetes. Instrument questions:
During the past 12 months have you seen a traditional healer for diabetes? Are you currently taking any herbal or traditional remedy for your diabetes?

Part 6: Templates and Forms 6-3D-171 Section 3D: Data Book Template WHO STEPS Surveillance
Seen a traditional healer for diabetes in the last 12 months
Men Women Both Sexes
Age Group
(years) n % 95% CI n % 95% CI n % 95% CI
25-34 365 0.0 0.0-0.1 687 0.8 0.0-1.8 1052 0.6 0.0-1.2
35-44 481 0.5 0.0-1.2 779 1.8 0.6-3.1 1260 1.3 0.5-2.1
45-54 445 3.4 0.8-5.9 579 3.9 1.4-6.4 1024 3.7 1.9-5.5
55-64 319 5.9 2.8-8.9 354 6.8 2.9-10.7 673 6.3 4.0-8.7
25-64 1610 2.3 1.3-3.3 2399 2.8 1.8-3.8 4009 2.6 1.9-3.2
Currently taking herbal or traditional treatment for diabetes
Men Women Both Sexes
Age Group
(years) n % 95% CI n % 95% CI n % 95% CI
25-34 365 0.0 0.0-0.0 684 0.4 0.0-0.8 1049 0.2 0.0-0.5
35-44 478 0.0 0.0-0.0 778 0.5 0.0-1.2 1256 0.3 0.0-0.7
45-54 442 2.7 0.2-5.3 578 1.7 0.3-3.1 1020 2.1 0.7-3.6
55-64 314 3.3 1.0-5.7 353 4.5 1.7-7.2 667 3.9 2.1-5.7
25-64 1599 1.4 0.6-2.2 2393 1.3 0.6-2.0 3992 1.4 0.8-1.9

Part 6: Templates and Forms 6-3D-172 Section 3D: Data Book Template WHO STEPS Surveillance
Physical Measurements
Height,
weight
and
BMI
Description: Mean height, weight, and body mass index among all respondent (excluding pregnant women for weight and BMI). Instrument questions:
Height Weight
Mean height (cm)
Men Women Age Group
(years) n Mean 95% CI n Mean 95% CI
25-34 370 163.6 160.3-166.9 698 154.4 153.9-154.9
35-44 490 162.6 160.9-164.3 791 153.5 152.9-154.0
45-54 453 162.1 161.2-163.1 586 152.9 152.1-153.7
55-64 322 160.2 158.8-161.6 355 151.7 150.6-152.8
25-64 1635 162.2 161.5-162.9 2430 153.4 153.0-153.7
Mean weight (kg)
Men Women Age Group
(years) n Mean 95% CI n Mean 95% CI
25-34 359 58.8 56.9-60.6 669 53.8 51.7-55.8
35-44 470 62.1 60.5-63.6 769 57.1 55.9-58.3
45-54 428 60.4 59.0-61.7 575 56.8 55.1-58.5
55-64 318 61.5 59.2-63.8 346 55.1 52.7-57.4
25-64 1575 60.7 59.5-61.9 2359 55.8 54.9-56.6
Mean BMI (kg/m2)

Part 6: Templates and Forms 6-3D-173 Section 3D: Data Book Template WHO STEPS Surveillance
Men Women Both Sexes
Age Group
(years) n Mean 95% CI n Mean 95% CI n Mean 95% CI
25-34 356 21.9 21.6-22.3 662 22.5 21.7-23.3 1018 22.3 21.9-22.7
35-44 466 23.5 22.5-24.5 764 24.2 23.7-24.8 1230 24.0 23.4-24.5
45-54 426 23.0 22.6-23.4 565 24.3 23.7-25.0 991 23.8 23.3-24.2
55-64 312 24.0 22.7-25.2 342 24.0 22.9-25.2 654 24.0 22.9-25.1
25-64 1560 23.1 22.6-23.5 2333 23.7 23.3-24.1 3893 23.5 23.1-23.9
BMI
categories
Description: Percentage of respondents (excluding pregnant women) in each BMI category. Instrument questions:
Height Weight
BMI classifications
Men Age
Group
(years) n
% Under-
weight
<18.5
95% CI
% Normal
weight
18.5-24.9
95% CI % BMI
25.0-29.9 95% CI
% Obese ≥30.0
95% CI
25-34 356 4.9 1.6-8.1 85.3 80.7-89.9 9.3 5.9-12.7 0.6 0.0-1.2
35-44 466 4.4 1.4-7.4 69.2 60.2-78.2 20.2 14.6-25.8 6.2 0.0-14.3
45-54 426 8.2 5.4-11.1 66.5 60.3-72.8 21.2 16.4-26.1 4.0 1.7-6.3
55-64 312 7.0 2.0-12.1 57.9 44.8-70.9 27.8 11.2-44.4 7.3 0.6-14.0
25-64 1560 6.1 4.0-8.1 70.1 65.5-74.7 19.4 15.4-23.3 4.5 2.4-6.6
BMI classifications

Part 6: Templates and Forms 6-3D-174 Section 3D: Data Book Template WHO STEPS Surveillance
Women Age
Group
(years) n
% Under-
weight
<18.5
95% CI
% Normal
weight
18.5-24.9
95% CI % BMI
25.0-29.9 95% CI
% Obese ≥30.0
95% CI
25-34 662 7.0 3.8-10.2 75.3 70.4-80.2 13.5 8.2-18.8 4.2 0.0-8.8
35-44 764 2.3 1.2-3.5 65.1 59.2-71.0 24.8 19.7-29.9 7.8 4.9-10.7
45-54 565 3.8 0.6-7.0 59.4 51.5-67.3 28.3 22.5-34.0 8.6 4.1-13.0
55-64 342 5.5 0.8-10.2 57.9 45.6-70.3 31.1 17.6-44.6 5.5 2.4-8.5
25-64 2333 4.5 3.1-5.9 65.6 62.4-68.8 23.3 20.5-26.1 6.6 4.9-8.3
BMI classifications
Both Sexes Age
Group
(years) n
% Under-
weight
<18.5
95% CI
% Normal
weight
18.5-24.9
95% CI % BMI
25.0-29.9 95% CI
% Obese ≥30.0
95% CI
25-34 1018 6.2 3.8-8.7 78.9 75.3-82.5 11.9 8.2-15.7 2.9 0.0-5.9
35-44 1230 3.1 1.6-4.6 66.6 62.0-71.2 23.1 18.5-27.6 7.2 3.8-10.6
45-54 991 5.6 3.2-8.0 62.3 57.4-67.2 25.4 21.3-29.5 6.7 3.9-9.5
55-64 654 6.3 2.6-9.9 57.9 46.3-69.5 29.4 15.0-43.8 6.4 2.6-10.1
25-64 3893 5.1 3.8-6.4 67.4 65.1-69.8 21.7 19.5-23.9 5.8 4.1-7.4

Part 6: Templates and Forms 6-3D-175 Section 3D: Data Book Template WHO STEPS Surveillance
Waist
circumference
Description: Mean waist circumference among all respondents (excluding pregnant women). Instrument question:
Waist circumference measurement
Waist circumference (cm)
Men Women Age Group
(years) n Mean 95% CI n Mean 95% CI
25-34 206 72.8 69.2-76.5 331 73.4 70.2-76.5
35-44 272 73.9 69.4-78.3 421 73.4 70.6-76.3
45-54 225 78.1 73.2-82.9 312 77.9 74.9-80.9
55-64 172 82.4 78.4-86.5 193 77.8 70.7-84.8
25-64 875 76.5 73.8-79.3 1257 75.2 73.2-77.2
Hip
circumference
Description: Mean hip circumference among all respondents (excluding pregnant women). Instrument question:
Hip circumference measurement
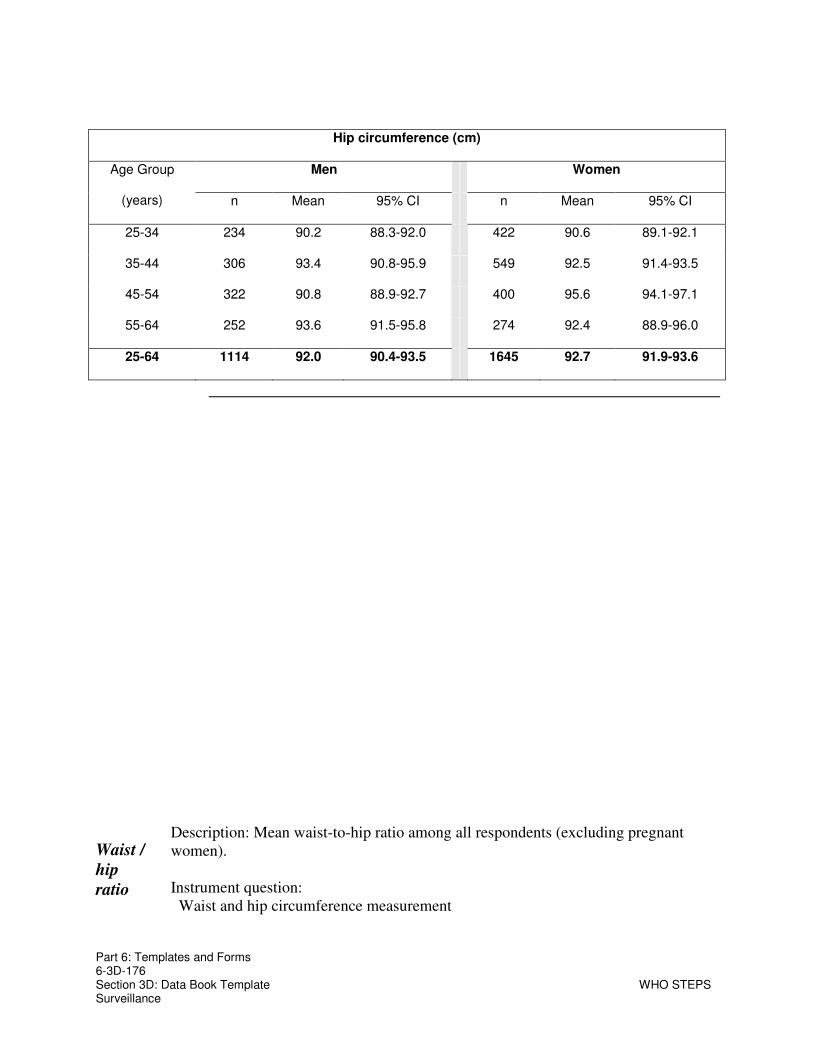
Part 6: Templates and Forms 6-3D-176 Section 3D: Data Book Template WHO STEPS Surveillance
Hip circumference (cm)
Men Women Age Group
(years) n Mean 95% CI n Mean 95% CI
25-34 234 90.2 88.3-92.0 422 90.6 89.1-92.1
35-44 306 93.4 90.8-95.9 549 92.5 91.4-93.5
45-54 322 90.8 88.9-92.7 400 95.6 94.1-97.1
55-64 252 93.6 91.5-95.8 274 92.4 88.9-96.0
25-64 1114 92.0 90.4-93.5 1645 92.7 91.9-93.6
Waist /
hip
ratio
Description: Mean waist-to-hip ratio among all respondents (excluding pregnant women). Instrument question:
Waist and hip circumference measurement

Part 6: Templates and Forms 6-3D-177 Section 3D: Data Book Template WHO STEPS Surveillance
Mean waist / hip ratio
Men Women Age Group
(years) n Mean 95% CI n Mean 95% CI
25-34 157 0.9 0.8-0.9 302 0.8 0.8-0.9
35-44 211 0.9 0.9-0.9 372 0.8 0.8-0.9
45-54 193 0.9 0.9-0.9 266 0.9 0.9-0.9
55-64 151 0.9 0.9-0.9 171 0.9 0.9-0.9
25-64 712 0.9 0.9-0.9 1111 0.9 0.8-0.9
Blood
pressure
Description: Mean blood pressure among all respondents, including those currently on medication for raised blood pressure. Instrument question:
Reading 1-3 systolic and diastolic blood pressure
Mean systolic blood pressure (mmHg)

Part 6: Templates and Forms 6-3D-178 Section 3D: Data Book Template WHO STEPS Surveillance
Men Women Both Sexes
Age Group
(years) n Mean 95% CI n Mean 95% CI n Mean 95% CI
25-34 372 122.2 120.3-124.0 698 116.1 114.0-118.3 1070 118.3 116.6-120.0
35-44 497 125.3 122.8-127.9 801 120.3 118.3-122.2 1298 122.2 120.4-124.0
45-54 451 128.6 126.2-131.1 589 126.0 123.2-128.8 1040 127.1 124.9-129.3
55-64 324 138.0 133.2-142.8 358 133.2 127.1-139.4 682 135.7 130.9-140.4
25-64 1644 128.1 126.3-129.9 2446 122.2 120.4-124.1 4090 124.6 123.0-126.3
Mean diastolic blood pressure (mmHg)
Men Women Both Sexes
Age Group
(years) n Mean 95% CI n Mean 95% CI n Mean 95% CI
25-34 372 74.2 72.8-75.5 698 74.0 72.3-75.8 1070 74.1 73.1-75.1
35-44 497 77.7 75.6-79.7 801 75.9 74.6-77.2 1298 76.6 75.4-77.8
45-54 451 78.6 77.0-80.2 589 77.3 75.6-79.0 1040 77.8 76.5-79.2
55-64 324 81.4 79.0-83.8 358 78.5 75.8-81.2 682 80.0 77.7-82.3
25-64 1644 77.8 76.8-78.9 2446 76.1 75.0-77.1 4090 76.8 75.9-77.7
Raised
blood
pressure
Description: Percentage of respondents with raised blood pressure and percentage on medication for raised blood pressure. Instrument question:
During the past two weeks, have you been treated for raised blood pressure with drugs (medication) prescribed by a doctor or other health worker?
Reading 1-3 systolic and diastolic blood pressure
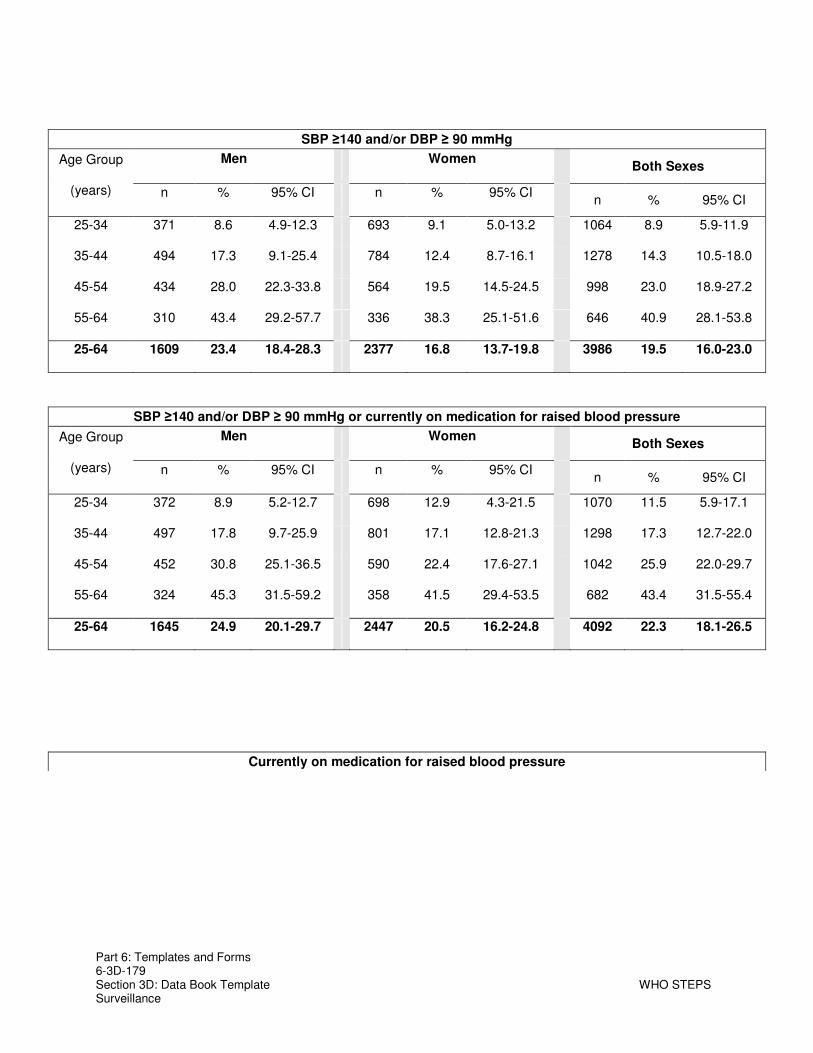
Part 6: Templates and Forms 6-3D-179 Section 3D: Data Book Template WHO STEPS Surveillance
SBP ≥140 and/or DBP ≥ 90 mmHg
Men Women Both Sexes
Age Group
(years) n % 95% CI n % 95% CI n % 95% CI
25-34 371 8.6 4.9-12.3 693 9.1 5.0-13.2 1064 8.9 5.9-11.9
35-44 494 17.3 9.1-25.4 784 12.4 8.7-16.1 1278 14.3 10.5-18.0
45-54 434 28.0 22.3-33.8 564 19.5 14.5-24.5 998 23.0 18.9-27.2
55-64 310 43.4 29.2-57.7 336 38.3 25.1-51.6 646 40.9 28.1-53.8
25-64 1609 23.4 18.4-28.3 2377 16.8 13.7-19.8 3986 19.5 16.0-23.0
SBP ≥140 and/or DBP ≥ 90 mmHg or currently on medication for raised blood pressure
Men Women Both Sexes
Age Group
(years) n % 95% CI n % 95% CI n % 95% CI
25-34 372 8.9 5.2-12.7 698 12.9 4.3-21.5 1070 11.5 5.9-17.1
35-44 497 17.8 9.7-25.9 801 17.1 12.8-21.3 1298 17.3 12.7-22.0
45-54 452 30.8 25.1-36.5 590 22.4 17.6-27.1 1042 25.9 22.0-29.7
55-64 324 45.3 31.5-59.2 358 41.5 29.4-53.5 682 43.4 31.5-55.4
25-64 1645 24.9 20.1-29.7 2447 20.5 16.2-24.8 4092 22.3 18.1-26.5
Currently on medication for raised blood pressure

Part 6: Templates and Forms 6-3D-180 Section 3D: Data Book Template WHO STEPS Surveillance
Men Women Both Sexes
Age Group
(years) n % 95% CI n % 95% CI n % 95% CI
25-34 372 0.3 0.0-1.0 698 4.2 0.0-10.4 1070 2.8 0.0-6.9
35-44 497 0.7 0.0-1.6 801 5.3 1.8-8.9 1298 3.6 1.4-5.7
45-54 451 3.8 1.3-6.4 589 3.5 1.6-5.3 1040 3.6 1.8-5.5
55-64 324 3.4 0.9-5.9 358 5.1 2.5-7.6 682 4.2 2.5-6.0
25-64 1644 2.0 1.2-2.8 2446 4.5 1.9-7.1 4090 3.5 1.9-5.0
Raised
blood
pressure
Description: Percentage of respondents with raised blood pressure and percentage on medication for raised blood pressure. Instrument question:
During the past two weeks, have you been treated for raised blood pressure with drugs (medication) prescribed by a doctor or other health worker?
Reading 1-3 systolic and diastolic blood pressure
SBP ≥160 and/or DBP ≥ 100 mmHg
Men Women Both Sexes
Age Group
(years) n % 95% CI n % 95% CI n % 95% CI
25-34 371 1.6 0.1-3.0 693 3.5 0.0-7.9 1064 2.8 0.0-5.6
35-44 494 2.6 0.9-4.3 784 2.6 1.3-3.9 1278 2.6 1.6-3.6
45-54 434 7.1 3.3-10.9 564 6.2 2.9-9.5 998 6.6 3.7-9.5
55-64 310 11.6 7.3-15.8 336 17.4 2.8-32.0 646 14.4 7.9-20.9
25-64 1609 5.4 3.6-7.1 2377 5.8 2.4-9.3 3986 5.6 3.5-7.8

Part 6: Templates and Forms 6-3D-181 Section 3D: Data Book Template WHO STEPS Surveillance
SBP ≥160 and/or DBP ≥ 100 mmHg or currently on medication for raised blood pressure
Men Women Both Sexes
Age Group
(years) n % 95% CI n % 95% CI n % 95% CI
25-34 372 1.9 0.3-3.5 698 7.5 0.0-17.7 1070 5.5 0.0-12.2
35-44 497 3.2 1.3-5.2 801 7.8 4.2-11.5 1298 6.1 3.9-8.3
45-54 452 10.7 7.0-14.4 590 9.6 6.1-13.0 1042 10.0 7.1-12.9
55-64 324 14.6 9.5-19.6 358 21.6 8.2-35.0 682 18.0 12.3-23.7
25-64 1645 7.3 5.4-9.1 2447 10.1 4.6-15.6 4092 8.9 5.8-12.1
Treatment
and control
Description: Percentage of respondents with treated and/or controlled of raised blood pressure among those with raised blood pressure (SBP ≥140 and/or DBP ≥ 90 mmHg) or currently on medication for raised blood pressure.
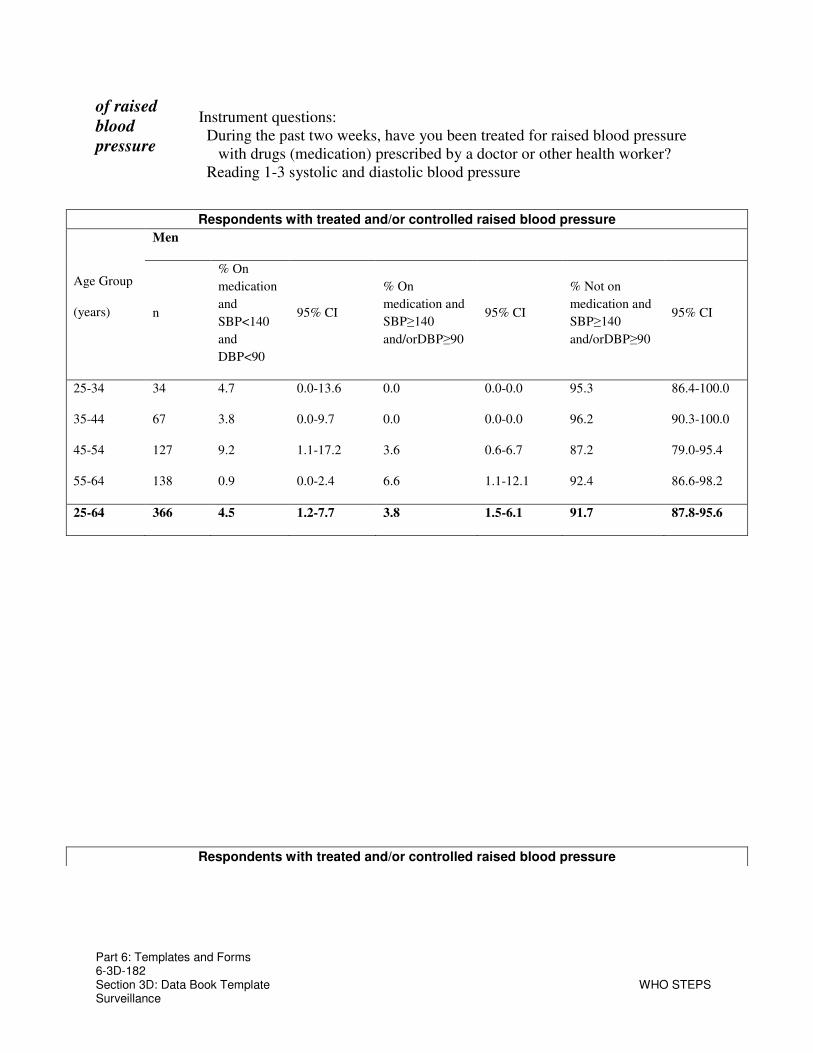
Part 6: Templates and Forms 6-3D-182 Section 3D: Data Book Template WHO STEPS Surveillance
of raised
blood
pressure
Instrument questions: During the past two weeks, have you been treated for raised blood pressure
with drugs (medication) prescribed by a doctor or other health worker? Reading 1-3 systolic and diastolic blood pressure
Respondents with treated and/or controlled raised blood pressure
Men
Age Group
(years) n
% On
medication
and
SBP<140
and
DBP<90
95% CI
% On
medication and
SBP≥140
and/orDBP≥90
95% CI
% Not on
medication and
SBP≥140
and/orDBP≥90
95% CI
25-34 34 4.7 0.0-13.6 0.0 0.0-0.0 95.3 86.4-100.0
35-44 67 3.8 0.0-9.7 0.0 0.0-0.0 96.2 90.3-100.0
45-54 127 9.2 1.1-17.2 3.6 0.6-6.7 87.2 79.0-95.4
55-64 138 0.9 0.0-2.4 6.6 1.1-12.1 92.4 86.6-98.2
25-64 366 4.5 1.2-7.7 3.8 1.5-6.1 91.7 87.8-95.6
Respondents with treated and/or controlled raised blood pressure

Part 6: Templates and Forms 6-3D-183 Section 3D: Data Book Template WHO STEPS Surveillance
Women
Age Group
(years) n
% On
medication
and
SBP<140
and
DBP<90
95% CI
% On
medication and
SBP≥140
and/orDBP≥90
95% CI
% Not on
medication and
SBP≥140
and/orDBP≥90
95% CI
25-34 48 31.3 1.4-61.2 1.2 0.0-3.7 67.5 38.8-96.1
35-44 107 13.9 3.4-24.4 18.7 3.1-34.4 67.4 49.8-84.9
45-54 141 9.7 2.8-16.7 6.8 0.8-12.8 83.5 74.7-92.2
55-64 125 5.2 0.7-9.7 7.2 1.5-13.0 87.6 79.5-95.6
25-64 421 13.7 6.0-21.4 8.9 5.3-12.5 77.4 67.8-86.9
Respondents with treated and/or controlled raised blood pressure
Both Sexes
Age Group
(years) n
% On
medication
and
SBP<140
and
DBP<90
95% CI
% On
medication and
SBP≥140
and/orDBP≥90
95% CI
% Not on
medication and
SBP≥140
and/orDBP≥90
95% CI
25-34 82 24.9 0.0-51.6 0.9 0.0-2.8 74.2 48.1-100.0
35-44 174 10.0 3.2-16.7 11.4 2.6-20.2 78.7 69.0-88.3
45-54 268 9.4 2.5-16.3 5.2 1.8-8.6 85.3 78.0-92.7
55-64 263 2.9 0.4-5.4 6.9 2.5-11.4 90.2 84.6-95.7
25-64 787 9.6 5.0-14.1 6.6 4.5-8.8 83.8 78.6-89.1

Part 6: Templates and Forms 6-3D-184 Section 3D: Data Book Template WHO STEPS Surveillance
Heart rate Description: Mean heart rate among all respondents and percentage with a raised heart rate. Instrument question:
Heart Rate measurement
Mean beats per minute
Men Women Both Sexes
Age Group
(years) n Mean 95% CI n Mean 95% CI n Mean 95% CI
25-34 367 77.7 76.1-79.2 694 80.9 79.1-82.7 1061 79.8 78.4-81.1
35-44 495 77.6 76.3-78.9 794 80.2 78.5-81.9 1289 79.2 78.2-80.3
45-54 445 79.3 78.1-80.5 584 78.4 75.9-80.8 1029 78.7 77.1-80.4
55-64 319 79.2 76.9-81.4 353 78.8 77.0-80.7 672 79.0 77.9-80.1
25-64 1626 78.4 77.6-79.2 2425 79.8 78.8-80.7 4051 79.2 78.6-79.9
Percentage with beats per minute over 100
Men Women Both Sexes
Age Group
(years) n % 95% CI n % 95% CI n % 95% CI
25-34 367 1.8 0.3-3.3 694 3.5 0.6-6.4 1061 2.9 1.0-4.9
35-44 495 2.4 0.8-3.9 794 2.9 1.0-4.9 1289 2.7 1.3-4.1
45-54 445 4.5 1.3-7.8 584 2.3 0.9-3.7 1029 3.2 1.6-4.8
55-64 319 3.6 1.4-5.9 353 2.8 0.7-4.8 672 3.2 1.6-4.8
25-64 1626 3.1 1.9-4.2 2425 2.9 1.8-4.1 4051 3.0 2.1-3.8

Part 6: Templates and Forms 6-3D-185 Section 3D: Data Book Template WHO STEPS Surveillance
Raised Risk
Raised
risk
Description: Percentage of respondents with 0, 1-2, or 3-5 of the following risk factors:
• current daily smoker
• less than 5 servings of fruits & vegetables per day
• low level of activity (<600 MET -minutes)
• overweight or obese (BMI ≥ 25 kg/m2)
• raised BP (SBP ≥ 140 and/or DBP ≥ 90 mmHg or currently on medication for raised BP).
Instrument question: combined from Step 1 and Step 2
Summary of Combined Risk Factors
Men Age Group
(years) n % with 0
risk factors 95% CI
% with 1-2
risk factors 95% CI
% with 3-5
risk factors 95% CI
25-44 510 30.7 21.0-40.3 59.9 51.2-68.6 9.4 6.1-12.7
45-64 408 9.4 5.8-12.9 73.2 65.8-80.5 17.5 11.1-23.8
25-64 918 21.0 15.8-26.2 65.9 60.3-71.6 13.1 9.2-17.0
Summary of Combined Risk Factors
Women Age Group
(years) n % with 0
risk factors 95% CI
% with 1-2
risk factors 95% CI
% with 3-5
risk factors 95% CI
25-44 985 41.4 33.2-49.7 53.6 46.4-60.9 4.9 2.7-7.2
45-64 590 28.6 21.0-36.2 60.9 55.5-66.4 10.4 6.2-14.6
25-64 1575 36.6 29.2-44.0 56.4 50.4-62.4 7.0 4.4-9.6

Part 6: Templates and Forms 6-3D-186 Section 3D: Data Book Template WHO STEPS Surveillance
Summary of Combined Risk Factors
Both Sexes Age Group
(years) n % with 0
risk factors 95% CI
% with 1-2
risk factors 95% CI
% with 3-5
risk factors 95% CI
25-44 1495 37.9 29.9-45.9 55.7 48.7-62.7 6.4 4.4-8.4
45-64 998 20.8 16.3-25.4 65.9 62.6-69.2 13.3 9.1-17.4
25-64 2493 31.0 24.9-37.0 59.8 55.2-64.5 9.2 6.6-11.8


