Landslides Triggered by Hurricane Mitch in Guatemala ... · I N S I V U M E H Landslides Triggered...
40
I N S I V U M E H Landslides Triggered by Hurricane Mitch in Guatemala— Inventory and Discussion by Robert C. Bucknam, Jeffrey A. Coe, Manuel Mota Chavarría, Jonathan W. Godt, Arthur C. Tarr, Lee-Ann Bradley, Sharon Rafferty, Dean Hancock, Richard L. Dart, and Margo L. Johnson Open-File Report 01-443 (also available in Spanish) 2001 U.S. Department of the Interior U.S. Geological Survey
Transcript of Landslides Triggered by Hurricane Mitch in Guatemala ... · I N S I V U M E H Landslides Triggered...
INSIVUMEH
Landslides Triggered by Hurricane Mitch in Guatemala— Inventory and Discussion
by Robert C. Bucknam, Jeffrey A. Coe, Manuel Mota Chavarría, Jonathan W. Godt, Arthur C. Tarr, Lee-Ann Bradley, Sharon Rafferty, Dean Hancock, Richard L. Dart, and Margo L. Johnson
Open-File Report 01-443 (also available in Spanish)
2001
U.S. Department of the Interior U.S. Geological Survey
INSIVUMEH
Landslides Triggered by Hurricane Mitch in Guatemala— Inventory and Discussion
by Robert C. Bucknam,1 Jeffrey A. Coe,1 Manuel Mota Chavarría,2 Jonathan W. Godt,1 Arthur C. Tarr,1
Lee-Ann Bradley,1 Sharon Rafferty,1 Dean Hancock, Richard L. Dart1 and Margo L. Johnson1
This report is based on a cooperative study by the U.S. Geological Survey, Denver, Colorado and the Instituto Nacional de Sismologia, Vulcanologia, Meteorologia e Hidrologia, Guatemala City, Guatemala. Work funded by the U.S. Agency for International Development’s Hurricane Mitch Reconstruction Program.
Open-File Report 01-443
(also available in Spanish)
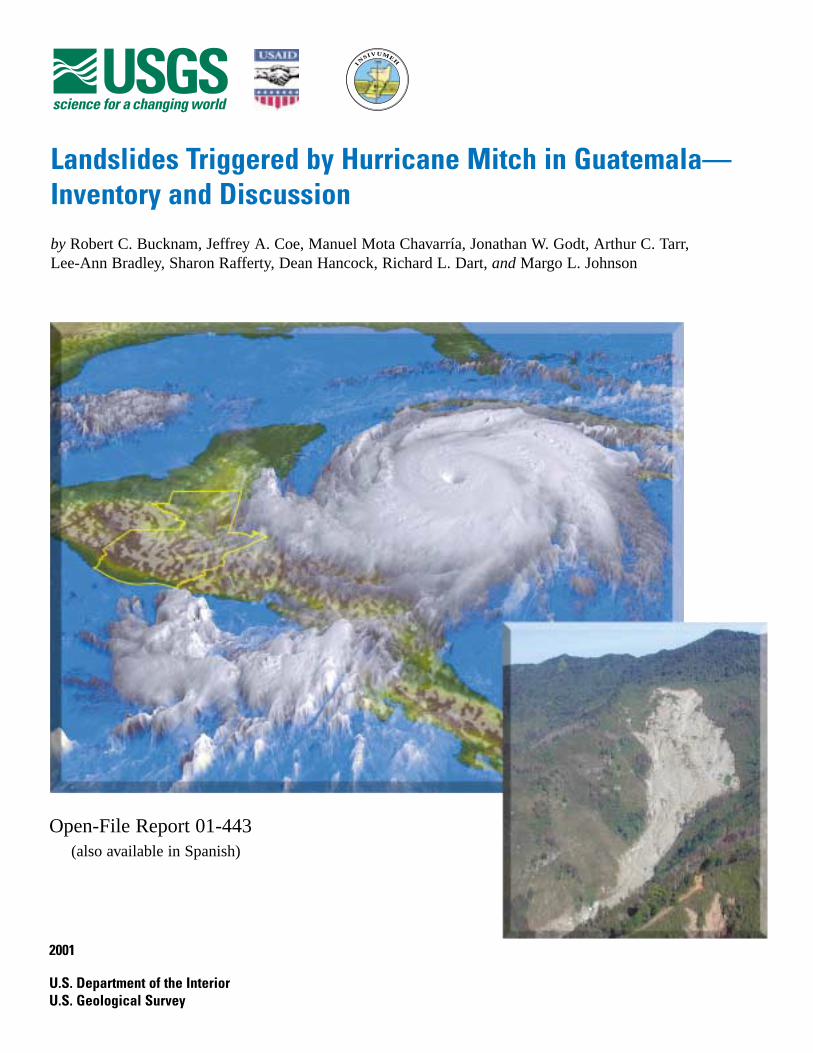
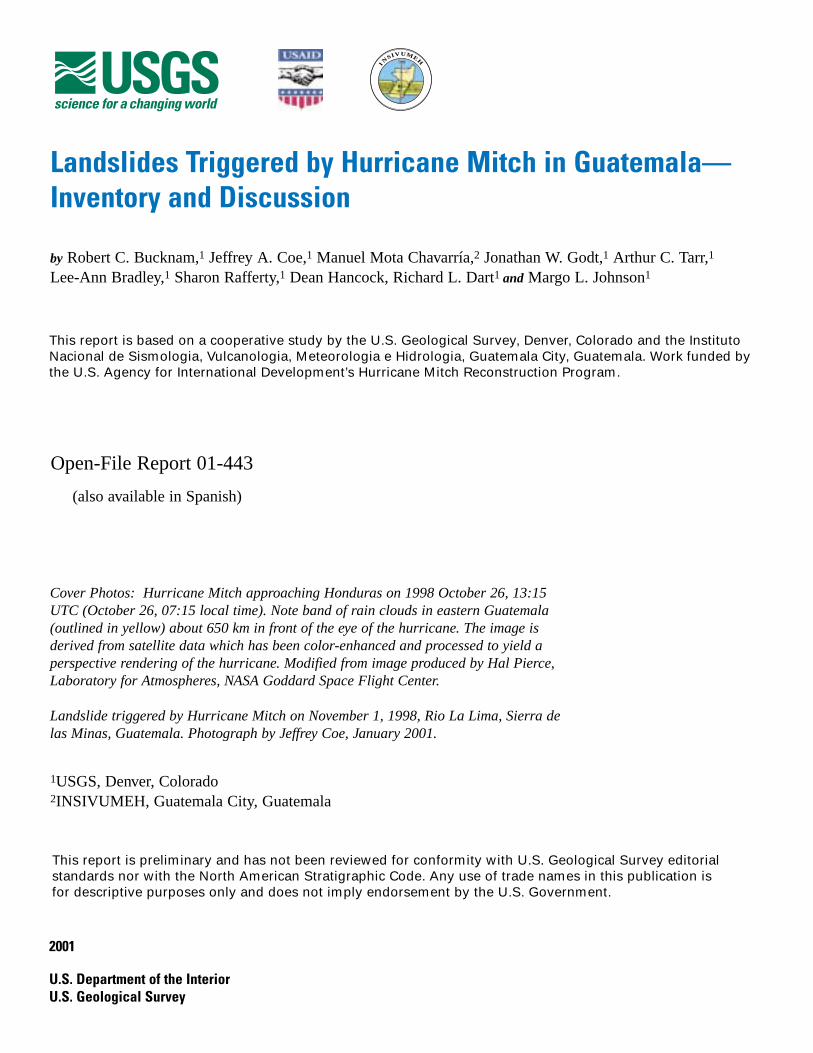
Cover Photos: Hurricane Mitch approaching Honduras on 1998 October 26, 13:15 UTC (October 26, 07:15 local time). Note band of rain clouds in eastern Guatemala (outlined in yellow) about 650 km in front of the eye of the hurricane. The image is derived from satellite data which has been color-enhanced and processed to yield a perspective rendering of the hurricane. Modified from image produced by Hal Pierce, Laboratory for Atmospheres, NASA Goddard Space Flight Center.
Landslide triggered by Hurricane Mitch on November 1, 1998, Rio La Lima, Sierra de las Minas, Guatemala. Photograph by Jeffrey Coe, January 2001.
1USGS, Denver, Colorado2INSIVUMEH, Guatemala City, Guatemala
This report is preliminary and has not been reviewed for conformity with U.S. Geological Survey editorial standards nor with the North American Stratigraphic Code. Any use of trade names in this publication is for descriptive purposes only and does not imply endorsement by the U.S. Government.
2001
U.S. Department of the Interior U.S. Geological Survey

ABSTRACT
The torrential rains that accompanied Hurricane Mitch in October and November of 1998 triggered thousands of landslides in the moderate to steep terrain bordering the Motagua and Polochic Rivers in eastern Guatemala. Using aerial photographs taken between January and March 2000 we mapped all visible landslides larger than about 15 m in minimum dimension in a study area of 10,000 km2 encompassing twenty 1:50,000-scale topographic map quadrangles.
Rainfall from Hurricane Mitch was exceptional because it was geographically widespread, prolonged over a period of about a week, moderate to heavy in intensity, and occurred at the end of the rainy sea-son when the ground already had a high moisture content. As documented in this report, this type of rainfall, on saturated or nearly saturated ground, has the capability to trigger both shallow and deep-seated land-slides over a large area.
We mapped about 11,500 landslides in the study area. The mapped landslides were of two general types: relatively small, translational and rotational landslides that commonly mobilized into debris flows and covered less than several hectares in area (not including flow paths), and large, commonly translational, landslides that sometimes generated debris flows and covered between 15 ha and 25 ha (not including flow paths). The main concentrations of landslides are on moderate-to-steep hillslopes underlain by diverse geologic units. For the purpose of describing the mapped landslides, we divided the study area into five distinct regions based on differing geologic and geomorphic characteristics. These regions include the upper Polochic valley and surrounding high-lands, the central Sierra de las Minas, the hills surrounding La Union and Zacapa, the eastern Sierra de las Minas, and the border region with Honduras. All of these areas received between 200 mm and 600 mm of rain over a 13-day period between October 25 and November 6. The highest rainfall amounts (400 mm to 600 mm) occurred in the Upper Polochic valley and surrounding highlands and in the central Sierra de las
Minas. The lower rainfall amounts (200 mm to 400 mm) occurred in the hills surrounding La Union, the eastern Sierra de las Minas, and in the border region with Honduras. In general, the rainfall received in these areas is roughly equivalent to the aver-age precipitation received in a 1-year period.
We used 10-m digital elevation models (DEMs) generated from contours on two quadrangles in the central Sierra de las Minas to create a map showing areas that were susceptible to landslides during Hurricane Mitch. To create the Hurricane Mitch susceptibility map, we developed a susceptibility threshold equation based on elevation and gradient. The analysis indicates that, at least on two quadrangles, gradients less than 9º were not susceptible to landslides during Hurricane Mitch. The slope of the line defined by the threshold equation indicates that less rainfall was required to initiate landslides on steep gradients than on shallow gradients. Ninety per-cent of the mapped landslides that were triggered by Hurricane Mitch are within the susceptible zone shown on the map. Eighty-six percent of landslides that were mapped as predating Hurricane Mitch, and all land-slides mapped as postdating Hurricane Mitch, are within the susceptible zone.
We used LAHARZ software to model the potential downstream area affected by debris if a large landslide dam on the Río La Lima were to fail. The model shows that the area affected would be similar to the area that was affected by a debris flow that mobilized from a large landslide along the Río La Lima during Hurricane Mitch.
The characteristics of rainfall-triggered landslides described in this report can be used as a partial guide to future landslide activity triggered by rainstorms. On the basis of existing data, hazardous areas include: moderate to steep hillslopes and less steep areas directly below these hill-slopes, drainage channels downslope from landslide prone hillslopes, and alluvial fans at the mouths of drainages along mountain or hillslope fronts. Evidence for, and frequency of, past landslides at individual sites can be used to determine the level of future hazard. That is, one of the best indicators
1

for future landslide activity is evidence of past landslide activity. For this reason, land-slide inventory maps showing Quaternary, historic, and modern landslides are of critical importance and should continue to be compiled.
Useful tools for predicting the occurrence of rainfall-triggered landslides in populated areas are rainfall intensity/duration thresholds. New and existing rainfall and landslide data could be used to develop two thresholds for Guatemala, one for debris flows triggered by intense bursts of rainfall, and one for deep-seated landslides triggered by prolonged rainfall.
INTRODUCTION
Hurricane Mitch, one of the strongest Atlantic hurricanes in history, began as a tropical depression in the western Caribbean Sea on October 22, 1998, and became a hurricane 2 days later several hundred kilometers south-southwest of Jamaica. The hurricane intensified rapidly, and by the 26th it was a category 5 hurricane with maximum sustained surface wind speeds estimated at
290 km per hr and gusts over 320 km per hour (Lott and others, 1999). By October 27, Hurricane Mitch began to weaken and made landfall on the north coast of Honduras on the morning of October 29, but widespread heavy rainfall in advance of the eye of the hurricane (fig. 1) had already caused extensive damage in Honduras, Nicaragua, Guatemala, and El Salvador from flooding and landsliding. By October 30, Hurricane Mitch had weakened to a tropical storm, and by the next day it had become a tropical depression (Guiney and Lawrence, 1998). Rainfall from Hurricane Mitch affected southern Guatemala between October 27 and November 1st (fig. 2). Surface circulation from the storm dissipated near the Guatemala/Mexico border on November 1, but locally heavy rain continued over Central America for the next several days (Guiney and Lawrence, 1998).
Measurements of the amounts of rain that fell during the storm were sparse, particularly at high elevations in mountainous regions where rain gages typically were absent and orographic effects are likely to have enhanced the amount of rainfall. However,
Figure 1. Track of Hurricane Mitch through the western Caribbean and Central America, October 26 to November 1, 1998 (coordinates from National Hurricane Center). Large red circles show locations of low pressure eye of the hurricane at date and time indicated; times (Z) are Universal Time Coordinated. Yellow polygon is area of this study.
2
6
5
9
1 3
4 7
8
2
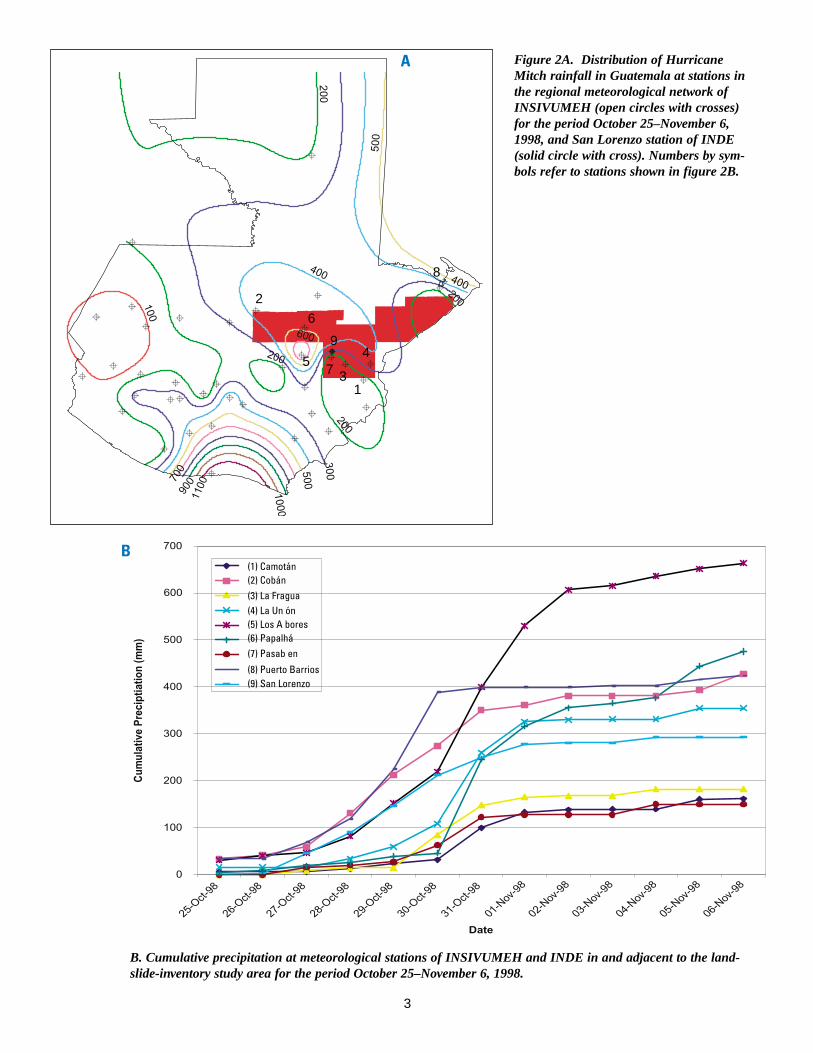
A Figure 2A. Distribution of Hurricane Mitch rainfall in Guatemala at stations in the regional meteorological network of INSIVUMEH (open circles with crosses) for the period October 25–November 6, 1998, and San Lorenzo station of INDE (solid circle with cross). Numbers by symbols refer to stations shown in figure 2B.
B
B. Cumulative precipitation at meteorological stations of INSIVUMEH and INDE in and adjacent to the land-slide-inventory study area for the period October 25–November 6, 1998.
3
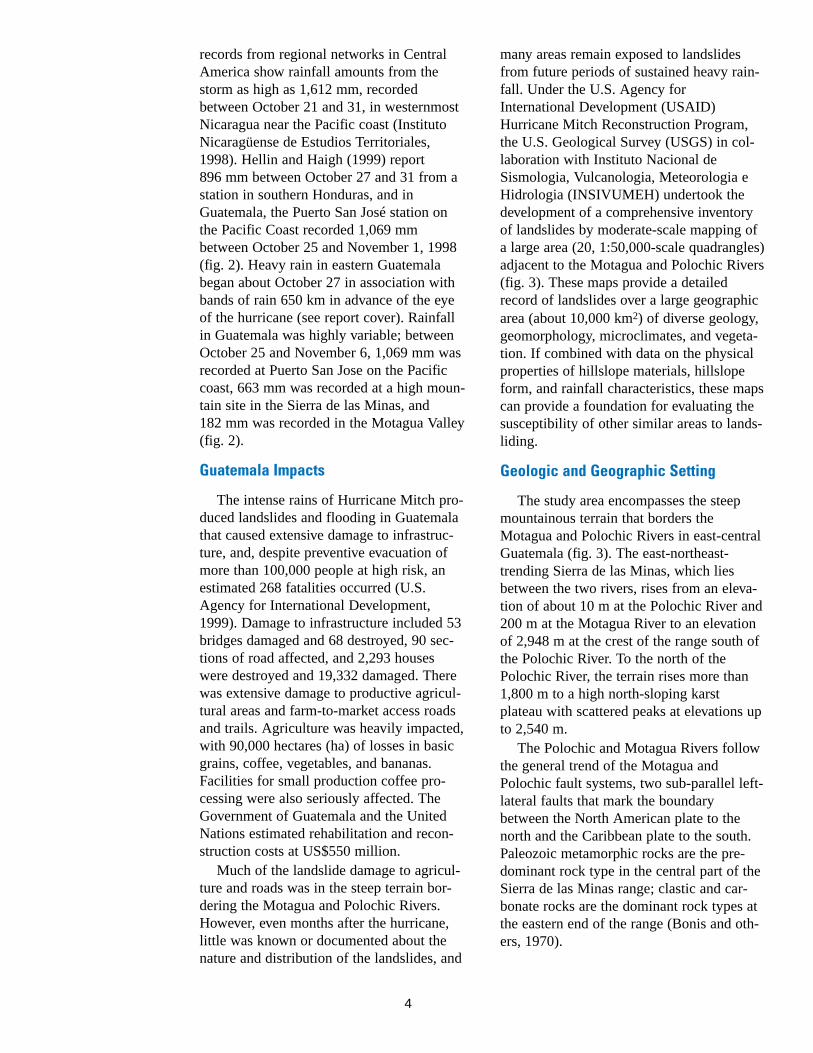
records from regional networks in Central America show rainfall amounts from the storm as high as 1,612 mm, recorded between October 21 and 31, in westernmost Nicaragua near the Pacific coast (Instituto Nicaragüense de Estudios Territoriales, 1998). Hellin and Haigh (1999) report 896 mm between October 27 and 31 from a station in southern Honduras, and in Guatemala, the Puerto San José station on the Pacific Coast recorded 1,069 mm between October 25 and November 1, 1998 (fig. 2). Heavy rain in eastern Guatemala began about October 27 in association with bands of rain 650 km in advance of the eye of the hurricane (see report cover). Rainfall in Guatemala was highly variable; between October 25 and November 6, 1,069 mm was recorded at Puerto San Jose on the Pacific coast, 663 mm was recorded at a high mountain site in the Sierra de las Minas, and 182 mm was recorded in the Motagua Valley (fig. 2).
Guatemala Impacts
The intense rains of Hurricane Mitch produced landslides and flooding in Guatemala that caused extensive damage to infrastructure, and, despite preventive evacuation of more than 100,000 people at high risk, an estimated 268 fatalities occurred (U.S. Agency for International Development, 1999). Damage to infrastructure included 53 bridges damaged and 68 destroyed, 90 sections of road affected, and 2,293 houses were destroyed and 19,332 damaged. There was extensive damage to productive agricultural areas and farm-to-market access roads and trails. Agriculture was heavily impacted, with 90,000 hectares (ha) of losses in basic grains, coffee, vegetables, and bananas. Facilities for small production coffee processing were also seriously affected. The Government of Guatemala and the United Nations estimated rehabilitation and reconstruction costs at US$550 million.
Much of the landslide damage to agriculture and roads was in the steep terrain bordering the Motagua and Polochic Rivers. However, even months after the hurricane, little was known or documented about the nature and distribution of the landslides, and
many areas remain exposed to landslides from future periods of sustained heavy rain-fall. Under the U.S. Agency for International Development (USAID) Hurricane Mitch Reconstruction Program, the U.S. Geological Survey (USGS) in collaboration with Instituto Nacional de Sismologia, Vulcanologia, Meteorologia e Hidrologia (INSIVUMEH) undertook the development of a comprehensive inventory of landslides by moderate-scale mapping of a large area (20, 1:50,000-scale quadrangles) adjacent to the Motagua and Polochic Rivers (fig. 3). These maps provide a detailed record of landslides over a large geographic area (about 10,000 km2) of diverse geology, geomorphology, microclimates, and vegetation. If combined with data on the physical properties of hillslope materials, hillslope form, and rainfall characteristics, these maps can provide a foundation for evaluating the susceptibility of other similar areas to landsliding.
Geologic and Geographic Setting
The study area encompasses the steep mountainous terrain that borders the Motagua and Polochic Rivers in east-central Guatemala (fig. 3). The east-northeast-trending Sierra de las Minas, which lies between the two rivers, rises from an elevation of about 10 m at the Polochic River and 200 m at the Motagua River to an elevation of 2,948 m at the crest of the range south of the Polochic River. To the north of the Polochic River, the terrain rises more than 1,800 m to a high north-sloping karst plateau with scattered peaks at elevations up to 2,540 m.
The Polochic and Motagua Rivers follow the general trend of the Motagua and Polochic fault systems, two sub-parallel left-lateral faults that mark the boundary between the North American plate to the north and the Caribbean plate to the south. Paleozoic metamorphic rocks are the pre-dominant rock type in the central part of the Sierra de las Minas range; clastic and carbonate rocks are the dominant rock types at the eastern end of the range (Bonis and others, 1970).
4
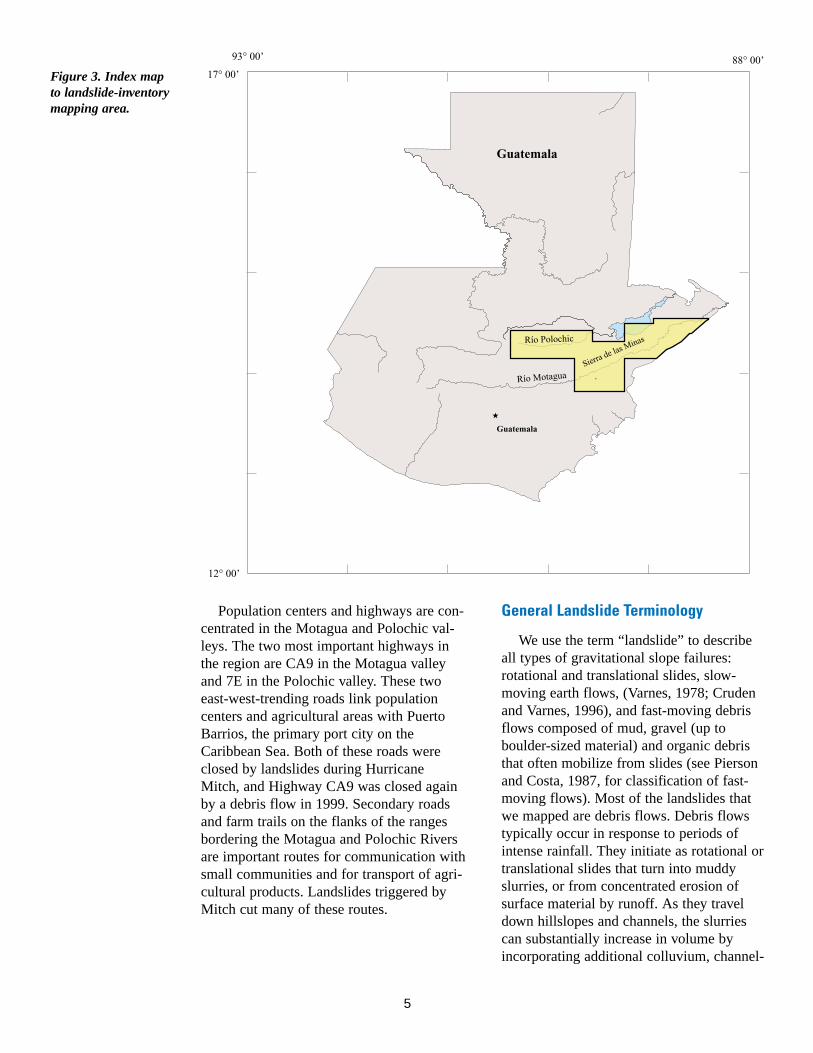
Figure 3. Index map to landslide-inventory mapping area.
Population centers and highways are concentrated in the Motagua and Polochic valleys. The two most important highways in the region are CA9 in the Motagua valley and 7E in the Polochic valley. These two east-west-trending roads link population centers and agricultural areas with Puerto Barrios, the primary port city on the Caribbean Sea. Both of these roads were closed by landslides during Hurricane Mitch, and Highway CA9 was closed again by a debris flow in 1999. Secondary roads and farm trails on the flanks of the ranges bordering the Motagua and Polochic Rivers are important routes for communication with small communities and for transport of agricultural products. Landslides triggered by Mitch cut many of these routes.
General Landslide Terminology
We use the term “landslide” to describe all types of gravitational slope failures: rotational and translational slides, slow-moving earth flows, (Varnes, 1978; Cruden and Varnes, 1996), and fast-moving debris flows composed of mud, gravel (up to boulder-sized material) and organic debris that often mobilize from slides (see Pierson and Costa, 1987, for classification of fast-moving flows). Most of the landslides that we mapped are debris flows. Debris flows typically occur in response to periods of intense rainfall. They initiate as rotational or translational slides that turn into muddy slurries, or from concentrated erosion of surface material by runoff. As they travel down hillslopes and channels, the slurries can substantially increase in volume by incorporating additional colluvium, channel-
5
The aerial photographs used in this study are available from:
U.S. Geological Survey EROS Data Center
Attn: Ron Risty 47914 252 Street Sioux Falls, SD 57198
Telephone: 605 594-6969
E-mail: [email protected]
http://mitchnts1.cr.usgs. gov/data/aerial.html
fill material, and water. Addition of sufficient volumes of water relative to the sediment content can also result in dilution of the debris flow to the consistency of normal streamflow. Debris flows can occur with little warning and are capable of transporting coarse debris (containing fragments 5 m or more in longest dimension) long distances over relatively gentle slope gradients. Debris flows can develop momentum as well as impact forces that can cause considerable destruction. As a result of these characteristics, reducing the hazards of debris flows can be more difficult than those of floods.
METHODS
Digital versions of 1:50,000-scale topographic maps of Guatemala were used as base maps for photogrammetric compilation and presentation of the landslide data. Digital data for most quadrangles were provided by the National Imaging and Mapping Agency (NIMA), which digitally scanned published topographic maps, converted the scanned images to equirectangular projection (a non-conformable projection; see Snyder, 1987), and combined the images into mosaics that were supplied to the USGS. Digital versions of a few quadrangles for which there were newer base maps than those supplied by NIMA were prepared by the USGS or a commercial vendor by scanning the most recent published versions of the quadrangles and georeferencing the scanned images to the same projections and datums as the published maps.
Landslide inventory maps are based on interpretation of 1:40,000-scale black-and-white aerial photographs taken between January 14 and March 6, 2000. The area for which aerial photographs were requested for mapping was based on a reconnaissance helicopter survey of the region in September 1999 by the USGS and INSIVUMEH. The aerial photographs were taken as part of a cooperative map revision project by Instituto Geografico Nacional (IGN) and NIMA. Cloud cover on the photographs was minor except for a few photographs on which clouds covered as much as about 40 percent of the image. Where the ground was
obscured by clouds, the approximate outline of the covered area is shown on the maps.
In areas where the concentration of land-slides was moderate to high, a Kern PG-2 photogrammetric plotter was used to map the landslides. The PG-2 plotter is tradition-ally used to create topographic maps, but also has many geologic applications (Pillmore, 1989). The plotter is a high-resolution optical-mechanical instrument that makes it possible to stereoscopically view aerial photographs at 2x, 4x, or 8x magnification. The plotter has an illuminated marker that is mechanically linked to a pencil mounted on an arm above a base map. Photographs in the PG-2 are registered to a base map using prominent topographic or cultural landmarks. Once registered, features visible in the photographs can be drawn on the base map by tracing the features on the map while stereoscopically observing the illuminated marker on the photographs.
We mapped the landslides from the 1:40,000 scale photographs on transparent polyester overlays registered to 1:50,000- or 1:25,000-scale (2x enlargements of the base maps). The photographs were taken between January and March 2000; thus all mapped landslides occurred prior to this date. The scale of the photography allowed us to accurately identify and map landslide features as small as about 15 m in width. Each land-slide shown on the maps includes a head-scarp, downslope travel path, and the resulting deposits. Landslides were mapped as Hurricane Mitch-caused if features appeared to be fresh, that is, non-vegetated. Hurricane Mitch landslides typically appear as nearly white scars that contrast strongly with the adjacent darker vegetated ground surface. Landslides that were significantly darker in tone or that appeared to have some vegetation, but still appeared to be relatively fresh, were mapped as pre-Hurricane Mitch land-slides. In one instance, on the Río Hondo quadrangle (plate 9), we mapped a group of landslides as post-Mitch because a large debris flow in the drainage below the land-slides closed a major highway on September 17, 1999, nearly a year after Hurricane Mitch. In some quadrangles, we also mapped fresh flood deposits along major
6

rivers and tributary drainages. In general, the downstream extent of debris-flow deposits was not known, and the storm effects mapped in tributary stream channels are likely a mixture of debris-flow deposits, channel scour, and flood deposits.
In areas where the concentration of land-slides was sparse, it was more time efficient to use a desktop mirror stereoscope to map the landslides. Using the stereoscope, photo-graphs were viewed stereoscopically at 3x magnification. Outlines of landslides were transferred from the photographs to the base maps by visual inspection; that is, we identified the landslide on the photographs, found the location of the landslide on the map, and manually drew the outline of the landslide on the map. As with the photogrammetric plotter mapping, we mapped from 1:40,000 scale photographs onto 1:50,000 or 1:25,000 scale base maps onto transparent overlays. In general, only Hurricane Mitch landslides and flood deposits (as defined above) were mapped with the mirror stereoscope.
Accuracy
Accuracy of the mapped landslides is comparable to the accuracy of the 1:50,000-scale topographic maps used as base maps. When scaling the photogrammetric model to the topographic maps, we found that some features, such as the courses of some streams, were generalized or simplified on the maps. Because digital versions of our landslide maps could in the future be transferred to a revised and possibly more accurate base map, we did not modify our map-ping to match local deviations from the topographic base maps.
A conspicuous example of inaccuracy in a base map is shown on the Juyama quadrangle (plate 18) at UTM 294,400 m E, 1,684,600 m N. What is shown on the base map as a single stream is actually two streams separated by a narrow drainage divide. A landslide and its downstream deposits that appear to climb uphill out of a drainage actually stay within a parallel side drainage that is not shown on the base map.
The maps accurately portray the shape, size, and relative location of landslides and related downslope channel deposits.
However, in some locations mapped channel deposits are not well aligned with the drainages as shown on the base maps. This may be due to:
(1) differences between generalized depiction of drainages on the base maps and detailed mapping of landslide channel deposits (as described above),
(2) changes in the courses of streams since the time that the base maps were made,
(3) locally insufficient topographic control to accurately register the aerial photographs to the base maps, and
(4) better exposure of the courses of drainages in some heavily vegetated areas by clearing of trees since the base maps were prepared.
Considering all these potential mapping errors, we estimate that landslide locations mapped using the PG-2 plotter are typically accurate to within 50-100 m. The locations of landslides that were mapped using a mirror stereoscope are estimated to be accurate to within approximately 200 m.
Digital Data Processing
The digital data that comprise each map are publicly available as ArcInfo Export data files. Links to the files are given at http://mitchnts1.cr.usgs.gov/data/landslide.html. Each map may have up to four data layers associated with it in addition to the layer depicting the landslides triggered by Hurricane Mitch. The additional data include (1) clouds in the aerial photographs that obscured the ground surface, (2) the limit and method of mapping, (3) landslides interpreted as having occurred prior to Hurricane Mitch, (4) landslides that occurred after Hurricane Mitch in September of 1999, and (5) landslide initiation locations. Landslide initiation locations are points that were digitized at the upslope end of each landslide polygon. These points are assumed to be landslide initiation locations and are called such throughout the report. Each data file has an alphanumeric file name. The two
7
- -- -
1234567891011121314151617181920
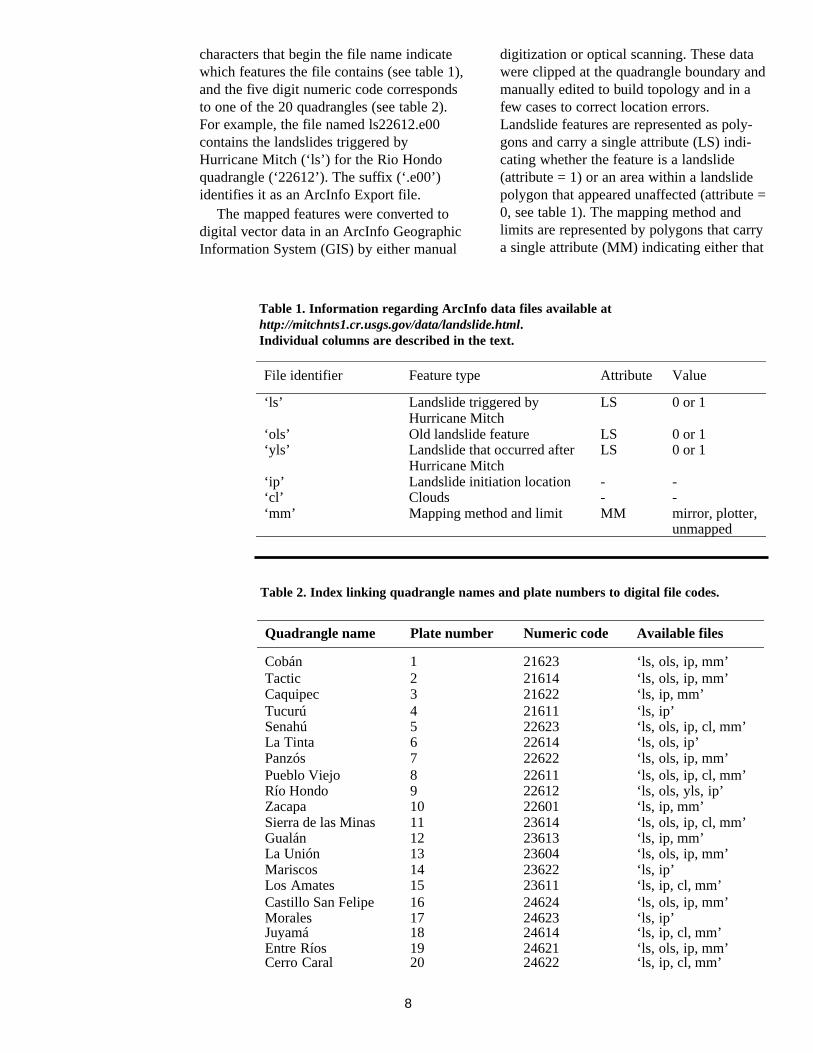
characters that begin the file name indicate which features the file contains (see table 1), and the five digit numeric code corresponds to one of the 20 quadrangles (see table 2). For example, the file named ls22612.e00 contains the landslides triggered by Hurricane Mitch (‘ls’) for the Rio Hondo quadrangle (‘22612’). The suffix (‘.e00’) identifies it as an ArcInfo Export file.
The mapped features were converted to digital vector data in an ArcInfo Geographic Information System (GIS) by either manual
digitization or optical scanning. These data were clipped at the quadrangle boundary and manually edited to build topology and in a few cases to correct location errors. Landslide features are represented as polygons and carry a single attribute (LS) indicating whether the feature is a landslide (attribute = 1) or an area within a landslide polygon that appeared unaffected (attribute = 0, see table 1). The mapping method and limits are represented by polygons that carry a single attribute (MM) indicating either that
Table 1. Information regarding ArcInfo data files available athttp://mitchnts1.cr.usgs.gov/data/landslide.html. Individual columns are described in the text.
File identifier Feature type Attribute Value
‘ls’ Landslide triggered by Hurricane Mitch
‘ols’ Old landslide feature LS 0 or 1 ‘yls’ Landslide that occurred after
LS 0 or 1
LS 0 or 1 Hurricane Mitch
‘ip’ Landslide initiation location‘cl’ Clouds‘mm’ Mapping method and limit MM mirror, plotter,
unmapped
Table 2. Index linking quadrangle names and plate numbers to digital file codes.
Quadrangle name Plate number Numeric code Available files
Cobán 21623 Tactic 21614 Caquipec 21622 Tucurú 21611 Senahú 22623 La Tinta 22614 Panzós 22622 Pueblo Viejo 22611 Río Hondo 22612 Zacapa 22601 Sierra de las Minas 23614 Gualán 23613 La Unión 23604 Mariscos 23622 Los Amates 23611 Castillo San Felipe 24624 Morales 24623 Juyamá 24614 Entre Ríos 24621 Cerro Caral 24622
‘ls, ols, ip, mm’‘ls, ols, ip, mm’‘ls, ip, mm’‘ls, ip’‘ls, ols, ip, cl, mm’‘ls, ols, ip’‘ls, ols, ip, mm’‘ls, ols, ip, cl, mm’‘ls, ols, yls, ip’‘ls, ip, mm’‘ls, ols, ip, cl, mm’‘ls, ip, mm’‘ls, ols, ip, mm’‘ls, ip’‘ls, ip, cl, mm’‘ls, ols, ip, mm’‘ls, ip’‘ls, ip, cl, mm’‘ls, ols, ip, mm’‘ls, ip, cl, mm’
8
the landslide features within the polygon were mapped with a photogrammetric stereoplotter ( = plotter) or a mirror stereoscope (= mirror). If the limit of the study area falls within a quadrangle, the polygon defining the unmapped part is attributed as MM = unmapped.
To prepare the maps, the digital vector data were assembled in ArcMap 8.1 running on a Windows workstation and exported as Encapsulated Postscript (eps) files. The map base for each sheet is an optically scanned image of the published 1:50,000-scale paper map that was georeferenced to the map coordinates of each quadrangle. A georeferenced image maintains a relation between the image pixels and planar-map page coordinates. The base map images were color corrected and sharpened using Adobe Photoshop 6.0 running on a Windows work-station. The final map graphics were assembled in Adobe Illustrator 9.0 running under MacOS 9.0 and are available online as Adobe Portable Document (.pdf) files.
Resolution at map scale
The 1:50,000 scale of the base maps limits the resolution of our mapping. For example, using a carefully sharpened lead in the photogrammetric plotter to map the outline of the landslides produces a line about 0.1 mm wide, and as the lead wears, the line commonly increases to 0.2–0.3 mm width. At a line width of 0.3 mm, features less than about 15 m across cannot be shown without exaggeration, and this represents the typical lower limit of the size of features shown on the maps.
Field observations
We conducted several reconnaissance field reviews (both air and ground based) of our aerial photographic mapping. The purpose of the field observations was to provide comparisons between the characteristics of landslides observed on aerial photographs and their characteristics as observed at low levels from the air and on the ground, to verify the completeness and interpretations of the mapping, to obtain measurements on materials and other characteristics that can-not be obtained from aerial photographs,
and to obtain eyewitness accounts of land-slide events. Ground-based field observations were limited to about a dozen remote landslide sites that had suitable landing areas for a helicopter and sites that had nearby access by road or jeep track.
Completeness
In the areas that we have investigated, we estimate that the maps show greater than 95 percent of all landslides larger than about 15 m in smallest dimension except on very steep hillslopes or in heavily forested areas. On very steep hillslopes, the angle of view near the margins of the aerial photographs can be nearly parallel to the ground surface, and landslides in those cases may not be visible on the photographs. In densely forested areas, small landslides may be obscured by the forest canopy, and the ability to see larger landslides is a complex relationship between the geometry of the aerial photograph, the height and density of the forest canopy, and the direction and amount of slope gradient of the ground surface. At the principal point (center) of a 1:24,000-scale aerial photograph, Pyles and Froehlich (1987) calculated that a landslide would need to be 30 m on a side (1 ha) to be visible. At the edge of the photograph, a land-slide on a 39° (80 percent) hillslope facing away from the principal point would need to be 100 m on a side (1 ha) to be equally visible. Pyles and Froehlich’s (1987) study showed that without knowledge of the true density of landslides in heavily forested areas our maps of landslides cannot be used to draw inferences about the impact of clearing of forests on landslide occurrence from Hurricane Mitch, or by extension, other similar heavy rainfall events.
PRECIPITATION
Intense and/or prolonged rainfall is a principal trigger for debris flows and land-slides. Studies in temperate and humid-tropical environments have shown that there is a threshold in the relationship between rainfall intensity and duration for storm-rainfall-triggered landslides (Caine, 1980; Cannon, 1988; Larsen and Simon, 1993). High-intensity, short-duration rainfall events
9
typically trigger shallow soil slips and debris flows. Long-duration, low-intensity rainfall typically produces large deep-seated land-slides, such as debris avalanches and slumps (Larsen and Simon, 1993). In Guatemala, Hurricane Mitch produced landslides typical of both high-intensity short-duration and long-duration low-intensity rainfall. Small landslides mapped in this study are likely the result of local severe storm cells that formed during the passage of Mitch, where-as the large deep-seated landslides were the result of the prolonged rain during the approximately 6-day passage of Mitch through Guatemala.
General Characteristics of Precipitation in Guatemala
The study area encompasses a wide range of rainfall, most of which falls in the wet season from May through October, when the area receives 80–90 percent of its annual precipitation (Portig, 1976). A regional rain-fall map of Central America shows annual totals in the general area of this study as ranging from less than 100 mm/yr in the low elevations along and south of the Motagua River west of Zacapa (fig. 3), and 200–300 mm/yr in the eastern part of the study area (Portig, 1976), to more than an estimated 600 mm/yr in the Sierra de las Minas north of the Polochic River. Data for the Sierra de las Minas were lacking in Portig’s (1976) study, and orographic effects may result in annual total rainfall higher than he estimated. However, the relationship between elevation and precipitation is likely to be complex. For example, in Costa Rica, large rain-fall totals have been found to be concentrated on the tops of mountains of moderate elevation and on the slopes of the high ranges. Range crests above about 2,500 m receive less than half the precipitation of that on the slopes (Portig, 1976).
Rainfall During Hurricane Mitch
Local heavy storms during the rainy sea-son in Guatemala periodically trigger land-slides each year, but the duration and wide-spread nature of heavy rains from Hurricane Mitch provided the conditions needed to produce landslides over a wide area.
Additionally, Hurricane Mitch struck Guatemala at the end of the rainy season when antecedent soil moisture levels were high. Meteorological stations, which are widely but sparsely distributed across Guatemala, provided a general picture of the precipitation associated with Hurricane Mitch throughout the country, which ranged from 182 mm to 1,069 mm (fig. 2). Two stations, San Lorenzo and Pasabien (fig. 2), provided data adjacent to the core area of dense landslides in an area of high relief— the Sierra de las Minas—which was heavily impacted by landslides and debris flows from Hurricane Mitch. Station San Lorenzo, operated by Instituto Nacional de Electrificación (INDE), is on the south flank of the Sierra de las Minas at an elevation of 1,780 m. The crest of the range lies 9.5 km northwest of the station at an elevation of 2,987 m. Station Pasabien, operated by INSIVUMEH, is at the base of the range at an elevation of 250 m, 6 km south of Station San Lorenzo.
Data from the San Lorenzo and Pasabien gages indicate that rainfall during Mitch was prolonged and moderate to heavy, but not extraordinary during any single day. At Station San Lorenzo, which was at an elevation comparable to that where abundant landslides occurred in the surrounding area, there were 4 consecutive days each with more than 40 mm of rain (figs. 4A and 5). Maximum daily rainfall was 65 mm on October 30. Total cumulative rainfall during Mitch (October 27–November 1) was 275 mm (figs. 4A and 5). At Station Pasabien, at an elevation where debris flows were absent on nearby surrounding hill-slopes (plate 9), there were only 2 consecutive days with rainfall above 20 mm (figs. 4B and 5). Maximum daily rainfall was 60 mm on October 31. Total cumulative rainfall at station Pasabien (October 27– November 1) was 124.5 mm.
Cumulative rainfall amounts at the two stations during the 1998 rainy season were quite different. At Station San Lorenzo , cumulative rainfall prior to Mitch (March 1– October 22, 1998) was 1,082 mm (fig. 5). Daily rainfall on 2 days during this period (67 mm on June 1 and 71 mm on September 6) was greater than rainfall on any day dur-
10
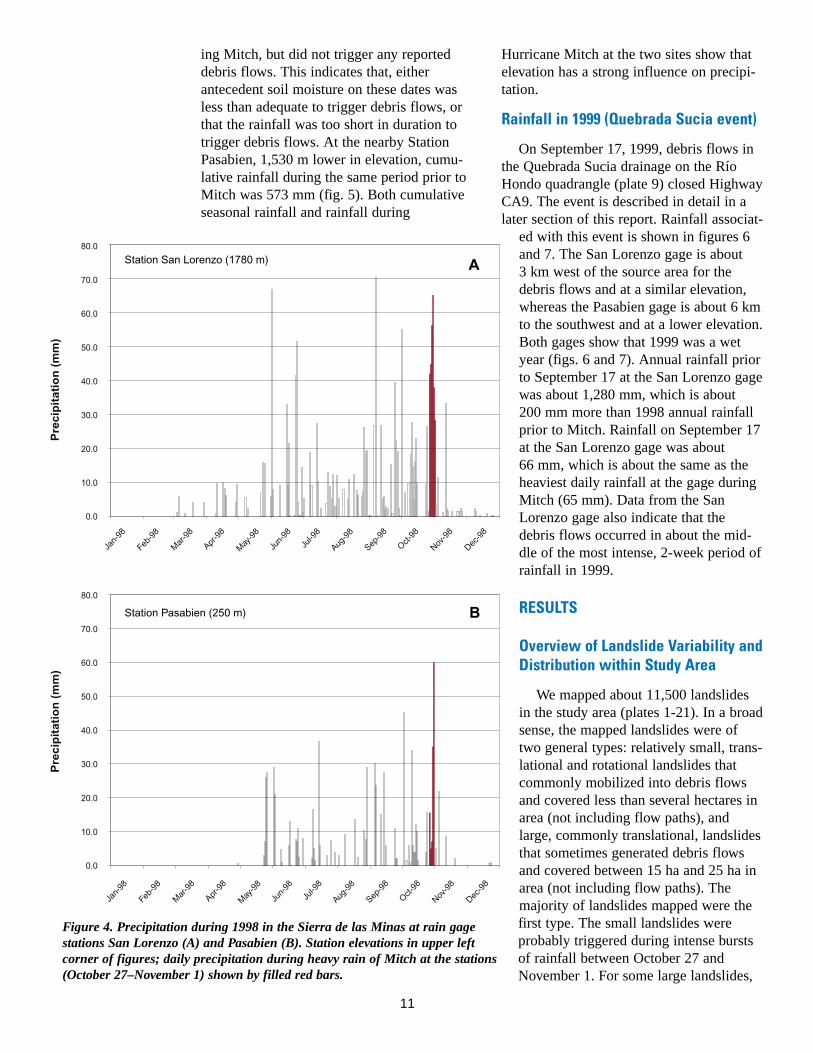
ing Mitch, but did not trigger any reported debris flows. This indicates that, either antecedent soil moisture on these dates was less than adequate to trigger debris flows, or that the rainfall was too short in duration to trigger debris flows. At the nearby Station Pasabien, 1,530 m lower in elevation, cumulative rainfall during the same period prior to Mitch was 573 mm (fig. 5). Both cumulative seasonal rainfall and rainfall during
Hurricane Mitch at the two sites show that elevation has a strong influence on precipitation.
Rainfall in 1999 (Quebrada Sucia event)
On September 17, 1999, debris flows in the Quebrada Sucia drainage on the Río Hondo quadrangle (plate 9) closed Highway CA9. The event is described in detail in a later section of this report. Rainfall associat
ed with this event is shown in figures 6 and 7. The San Lorenzo gage is about 3 km west of the source area for the debris flows and at a similar elevation, whereas the Pasabien gage is about 6 km to the southwest and at a lower elevation. Both gages show that 1999 was a wet year (figs. 6 and 7). Annual rainfall prior to September 17 at the San Lorenzo gage was about 1,280 mm, which is about 200 mm more than 1998 annual rainfall prior to Mitch. Rainfall on September 17 at the San Lorenzo gage was about 66 mm, which is about the same as the heaviest daily rainfall at the gage during Mitch (65 mm). Data from the San Lorenzo gage also indicate that the debris flows occurred in about the middle of the most intense, 2-week period of rainfall in 1999.
Overview of Landslide Variability and Distribution within Study Area
We mapped about 11,500 landslides in the study area (plates 1-21). In a broad sense, the mapped landslides were of two general types: relatively small, translational and rotational landslides that commonly mobilized into debris flows and covered less than several hectares in area (not including flow paths), and large, commonly translational, landslides that sometimes generated debris flows and covered between 15 ha and 25 ha in area (not including flow paths). The majority of landslides mapped were the
Figure 4. Precipitation during 1998 in the Sierra de las Minas at rain gage first type. The small landslides were stations San Lorenzo (A) and Pasabien (B). Station elevations in upper left probably triggered during intense bursts corner of figures; daily precipitation during heavy rain of Mitch at the stations of rainfall between October 27 and (October 27–November 1) shown by filled red bars. November 1. For some large landslides,
RESULTS
11

Figure 5. Cumulative precipitation in the Sierra de las Minas at rain gage stations San Lorenzo and Pasabien during Hurricane Mitch. Station elevations given in the inset; date and elevation of landslide initiation location for two large landslides on the Río la Lima given in insets.
we were able to collect detailed time-of-occurrence information from eyewitnesses. Where we have these data, there is a remarkable coincidence in the documented dates of occurrence; they all occurred on November 1. The upper Río Lima landslide in the Río Hondo quadrangle (plate 9) was one of the large landslides with a documented time of occurrence. The rain gage located near this landslide (the San Lorenzo gage) indicates that 275 mm of rain fell over the 6-day period before the landslide occurred (fig. 5). If we assume that antecedent moisture conditions necessary for the occurrence of landslides had been met before Mitch rainfall started, which is a reasonable assumption because Mitch occurred at the end of the rainy season, then about 275 mm in 6 days (an average of 46 mm/ day) could be considered an estimate for the triggering rainfall for the La Lima landslide. However, because the La Lima landslide occurred in an area of relatively high rainfall compared to the rest of the study area (where other large landslides occurred), the actual triggering threshold for large landslides was probably less than 275 mm in 6 days.
The main concentrations of landslides are on moderate-to-steep hillslopes underlain by various geologic units. For the purpose of describing the mapped landslides, we divide the study area into five distinct regions based on differing geologic and geomorphic characteristics. These regions include the upper Polochic valley and surrounding highlands, the central Sierra de las Minas, the hills surrounding La Union and Zacapa, the eastern Sierra de las Minas, and the border region with Honduras. All of these areas received between 200 mm and 600 mm of rain over a 13-day period between October 25 and November 6 (plate 21). The highest rainfall amounts (400 mm to 600 mm) occurred in the Upper Polochic valley and surrounding highlands and in the central Sierra de las Minas. The lower rainfall amounts (200 mm to 400 mm) occurred in the hills surrounding La Union, the eastern Sierra de las Minas, and in the border region with Honduras. In general, the rainfall received in these areas is roughly equivalent to the average precipitation received in a 1-year period (see precipitation section earlier in report). Below, we describe some of the landslides in each of the five regions.
12
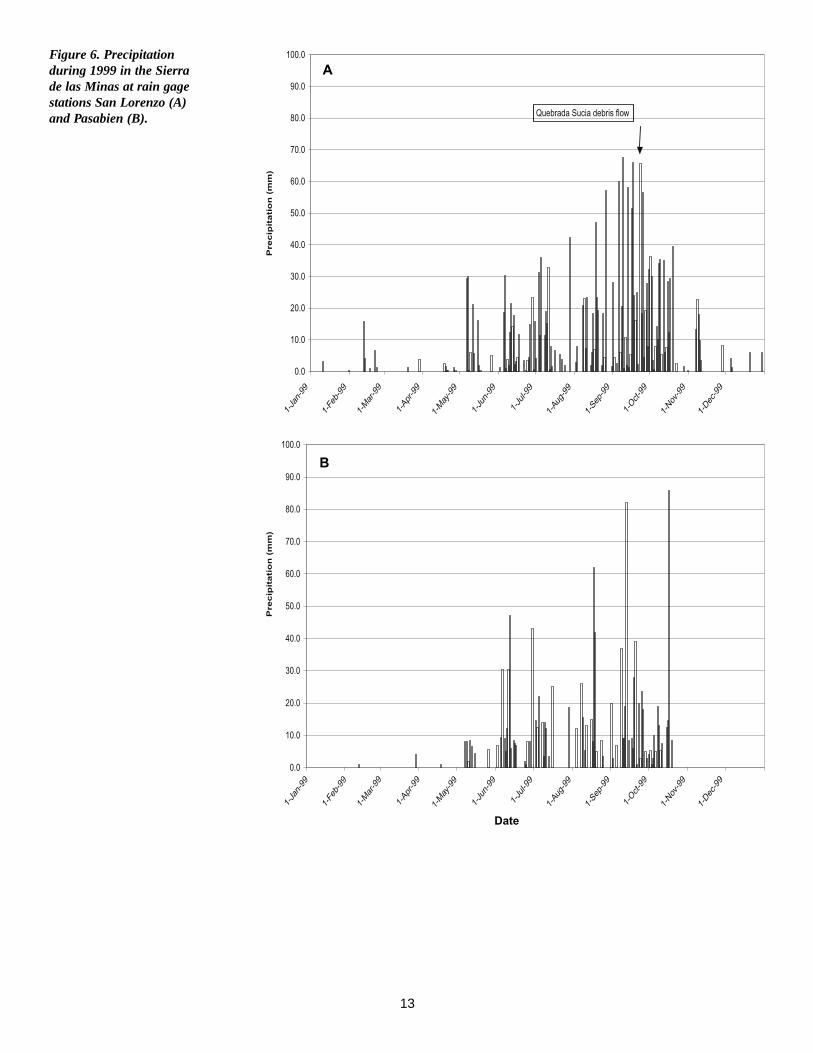
Figure 6. Precipitation during 1999 in the Sierra de las Minas at rain gage stations San Lorenzo (A) and Pasabien (B).
13
14
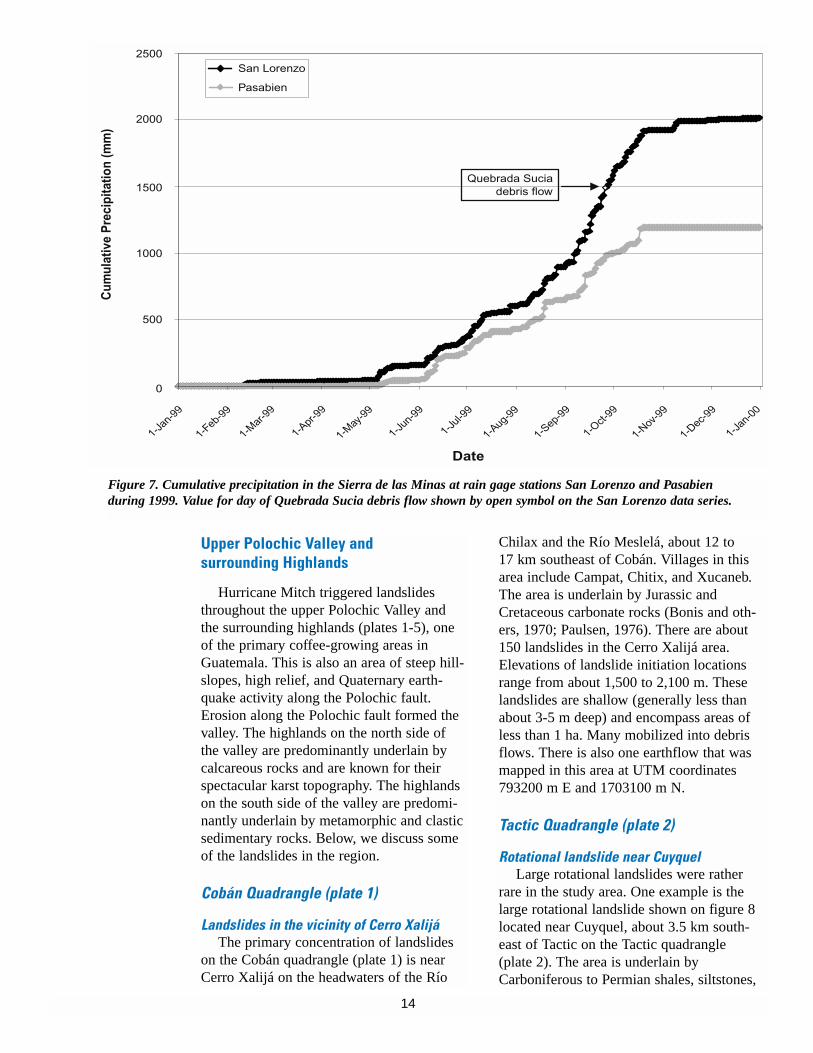
Upper Polochic Valley and surrounding Highlands
Hurricane Mitch triggered landslidesthroughout the upper Polochic Valley andthe surrounding highlands (plates 1-5), oneof the primary coffee-growing areas inGuatemala. This is also an area of steep hill-slopes, high relief, and Quaternary earth-quake activity along the Polochic fault.Erosion along the Polochic fault formed thevalley. The highlands on the north side ofthe valley are predominantly underlain bycalcareous rocks and are known for theirspectacular karst topography. The highlandson the south side of the valley are predomi-nantly underlain by metamorphic and clasticsedimentary rocks. Below, we discuss someof the landslides in the region.
Cobán Quadrangle (plate 1)
Landslides in the vicinity of Cerro Xalijá The primary concentration of landslides
on the Cobán quadrangle (plate 1) is nearCerro Xalijá on the headwaters of the Río
Chilax and the Río Meslelá, about 12 to17 km southeast of Cobán. Villages in thisarea include Campat, Chitix, and Xucaneb.The area is underlain by Jurassic andCretaceous carbonate rocks (Bonis and oth-ers, 1970; Paulsen, 1976). There are about150 landslides in the Cerro Xalijá area.Elevations of landslide initiation locationsrange from about 1,500 to 2,100 m. Theselandslides are shallow (generally less thanabout 3-5 m deep) and encompass areas ofless than 1 ha. Many mobilized into debrisflows. There is also one earthflow that wasmapped in this area at UTM coordinates793200 m E and 1703100 m N.
Tactic Quadrangle (plate 2)
Rotational landslide near CuyquelLarge rotational landslides were rather
rare in the study area. One example is thelarge rotational landslide shown on figure 8located near Cuyquel, about 3.5 km south-east of Tactic on the Tactic quadrangle(plate 2). The area is underlain byCarboniferous to Permian shales, siltstones,
Figure 7. Cumulative precipitation in the Sierra de las Minas at rain gage stations San Lorenzo and Pasabien during 1999. Value for day of Quebrada Sucia debris flow shown by open symbol on the San Lorenzo data series.
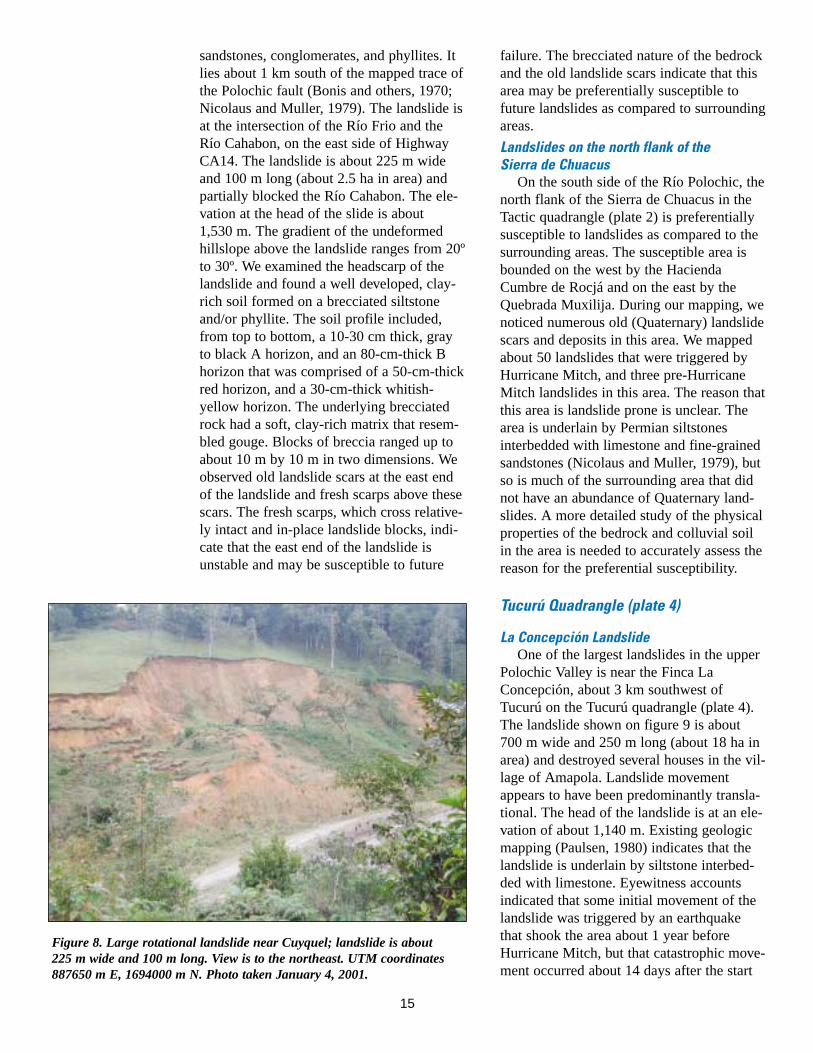
sandstones, conglomerates, and phyllites. It lies about 1 km south of the mapped trace of the Polochic fault (Bonis and others, 1970; Nicolaus and Muller, 1979). The landslide is at the intersection of the Río Frio and the Río Cahabon, on the east side of Highway CA14. The landslide is about 225 m wide and 100 m long (about 2.5 ha in area) and partially blocked the Río Cahabon. The elevation at the head of the slide is about 1,530 m. The gradient of the undeformed hillslope above the landslide ranges from 20º to 30º. We examined the headscarp of the landslide and found a well developed, clay-rich soil formed on a brecciated siltstone and/or phyllite. The soil profile included, from top to bottom, a 10-30 cm thick, gray to black A horizon, and an 80-cm-thick B horizon that was comprised of a 50-cm-thick red horizon, and a 30-cm-thick whitish-yellow horizon. The underlying brecciated rock had a soft, clay-rich matrix that resembled gouge. Blocks of breccia ranged up to about 10 m by 10 m in two dimensions. We observed old landslide scars at the east end of the landslide and fresh scarps above these scars. The fresh scarps, which cross relatively intact and in-place landslide blocks, indicate that the east end of the landslide is unstable and may be susceptible to future
Figure 8. Large rotational landslide near Cuyquel; landslide is about 225 m wide and 100 m long. View is to the northeast. UTM coordinates 887650 m E, 1694000 m N. Photo taken January 4, 2001.
failure. The brecciated nature of the bedrock and the old landslide scars indicate that this area may be preferentially susceptible to future landslides as compared to surrounding areas.
Landslides on the north flank of the Sierra de Chuacus
On the south side of the Río Polochic, the north flank of the Sierra de Chuacus in the Tactic quadrangle (plate 2) is preferentially susceptible to landslides as compared to the surrounding areas. The susceptible area is bounded on the west by the Hacienda Cumbre de Rocjá and on the east by the Quebrada Muxilija. During our mapping, we noticed numerous old (Quaternary) landslide scars and deposits in this area. We mapped about 50 landslides that were triggered by Hurricane Mitch, and three pre-Hurricane Mitch landslides in this area. The reason that this area is landslide prone is unclear. The area is underlain by Permian siltstones interbedded with limestone and fine-grained sandstones (Nicolaus and Muller, 1979), but so is much of the surrounding area that did not have an abundance of Quaternary land-slides. A more detailed study of the physical properties of the bedrock and colluvial soil in the area is needed to accurately assess the reason for the preferential susceptibility.
Tucurú Quadrangle (plate 4)
La Concepción Landslide One of the largest landslides in the upper
Polochic Valley is near the Finca La Concepción, about 3 km southwest of Tucurú on the Tucurú quadrangle (plate 4). The landslide shown on figure 9 is about 700 m wide and 250 m long (about 18 ha in area) and destroyed several houses in the village of Amapola. Landslide movement appears to have been predominantly translational. The head of the landslide is at an elevation of about 1,140 m. Existing geologic mapping (Paulsen, 1980) indicates that the landslide is underlain by siltstone interbedded with limestone. Eyewitness accounts indicated that some initial movement of the landslide was triggered by an earthquake that shook the area about 1 year before Hurricane Mitch, but that catastrophic movement occurred about 14 days after the start
15
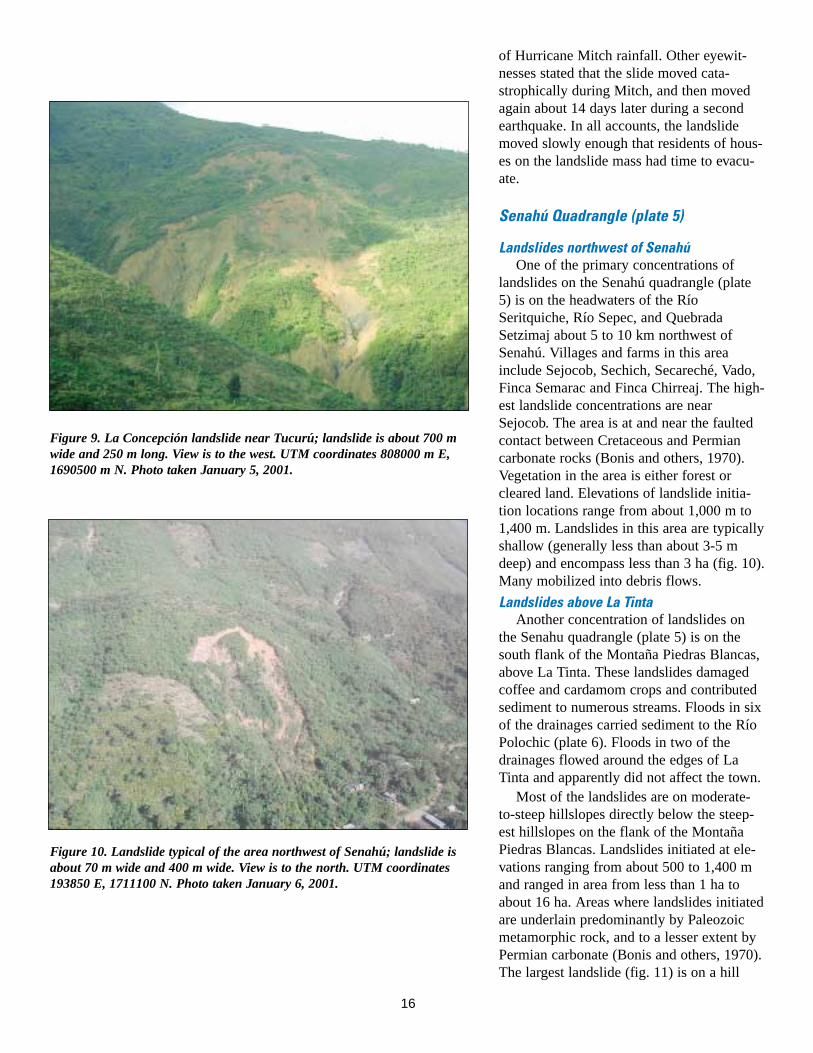
Figure 9. La Concepción landslide near Tucurú; landslide is about 700 m wide and 250 m long. View is to the west. UTM coordinates 808000 m E, 1690500 m N. Photo taken January 5, 2001.
Figure 10. Landslide typical of the area northwest of Senahú; landslide is about 70 m wide and 400 m wide. View is to the north. UTM coordinates 193850 E, 1711100 N. Photo taken January 6, 2001.
of Hurricane Mitch rainfall. Other eyewitnesses stated that the slide moved catastrophically during Mitch, and then moved again about 14 days later during a second earthquake. In all accounts, the landslide moved slowly enough that residents of houses on the landslide mass had time to evacuate.
Senahú Quadrangle (plate 5)
Landslides northwest of Senahú One of the primary concentrations of
landslides on the Senahú quadrangle (plate 5) is on the headwaters of the Río Seritquiche, Río Sepec, and Quebrada Setzimaj about 5 to 10 km northwest of Senahú. Villages and farms in this area include Sejocob, Sechich, Secareché, Vado, Finca Semarac and Finca Chirreaj. The highest landslide concentrations are near Sejocob. The area is at and near the faulted contact between Cretaceous and Permian carbonate rocks (Bonis and others, 1970). Vegetation in the area is either forest or cleared land. Elevations of landslide initiation locations range from about 1,000 m to 1,400 m. Landslides in this area are typically shallow (generally less than about 3-5 m deep) and encompass less than 3 ha (fig. 10). Many mobilized into debris flows.
Landslides above La Tinta Another concentration of landslides on
the Senahu quadrangle (plate 5) is on the south flank of the Montaña Piedras Blancas, above La Tinta. These landslides damaged coffee and cardamom crops and contributed sediment to numerous streams. Floods in six of the drainages carried sediment to the Río Polochic (plate 6). Floods in two of the drainages flowed around the edges of La Tinta and apparently did not affect the town.
Most of the landslides are on moderate-to-steep hillslopes directly below the steepest hillslopes on the flank of the Montaña Piedras Blancas. Landslides initiated at elevations ranging from about 500 to 1,400 m and ranged in area from less than 1 ha to about 16 ha. Areas where landslides initiated are underlain predominantly by Paleozoic metamorphic rock, and to a lesser extent by Permian carbonate (Bonis and others, 1970). The largest landslide (fig. 11) is on a hill
16
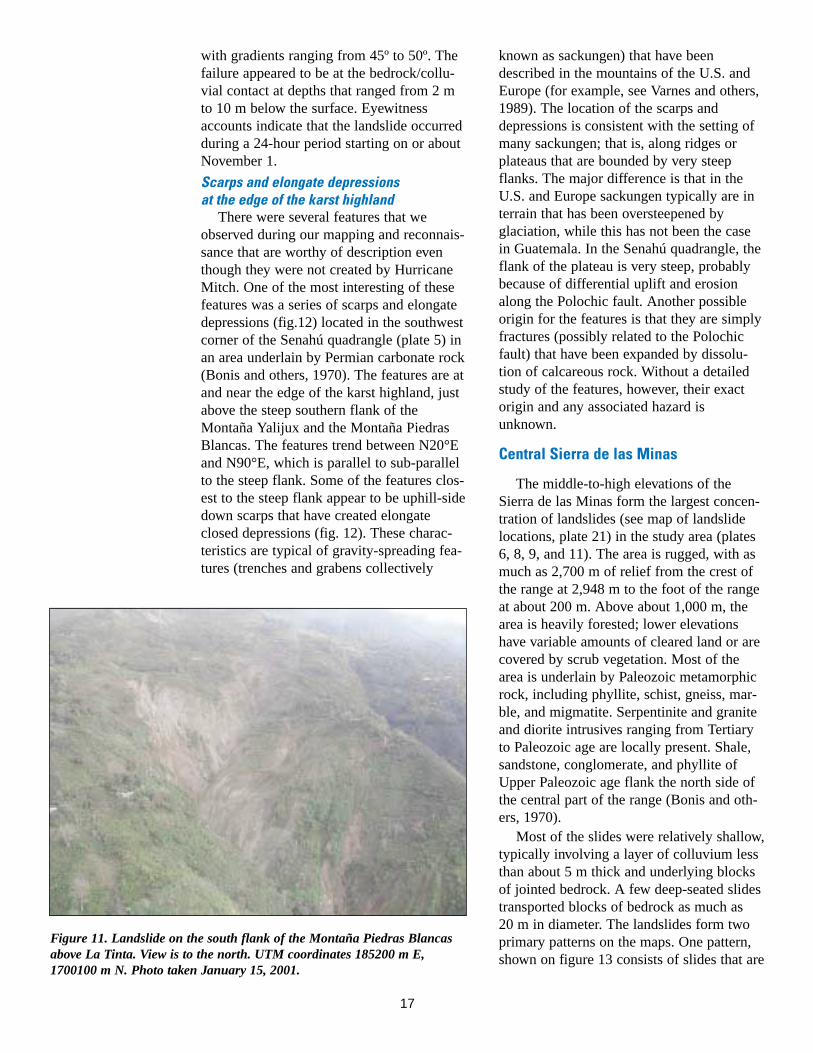
with gradients ranging from 45º to 50º. The failure appeared to be at the bedrock/colluvial contact at depths that ranged from 2 m to 10 m below the surface. Eyewitness accounts indicate that the landslide occurred during a 24-hour period starting on or about November 1.
Scarps and elongate depressions at the edge of the karst highland
There were several features that we observed during our mapping and reconnaissance that are worthy of description even though they were not created by Hurricane Mitch. One of the most interesting of these features was a series of scarps and elongate depressions (fig.12) located in the southwest corner of the Senahú quadrangle (plate 5) in an area underlain by Permian carbonate rock (Bonis and others, 1970). The features are at and near the edge of the karst highland, just above the steep southern flank of the Montaña Yalijux and the Montaña Piedras Blancas. The features trend between N20°E and N90°E, which is parallel to sub-parallel to the steep flank. Some of the features closest to the steep flank appear to be uphill-side down scarps that have created elongate closed depressions (fig. 12). These characteristics are typical of gravity-spreading features (trenches and grabens collectively
Figure 11. Landslide on the south flank of the Montaña Piedras Blancas above La Tinta. View is to the north. UTM coordinates 185200 m E, 1700100 m N. Photo taken January 15, 2001.
known as sackungen) that have been described in the mountains of the U.S. and Europe (for example, see Varnes and others, 1989). The location of the scarps and depressions is consistent with the setting of many sackungen; that is, along ridges or plateaus that are bounded by very steep flanks. The major difference is that in the U.S. and Europe sackungen typically are in terrain that has been oversteepened by glaciation, while this has not been the case in Guatemala. In the Senahú quadrangle, the flank of the plateau is very steep, probably because of differential uplift and erosion along the Polochic fault. Another possible origin for the features is that they are simply fractures (possibly related to the Polochic fault) that have been expanded by dissolution of calcareous rock. Without a detailed study of the features, however, their exact origin and any associated hazard is unknown.
Central Sierra de las Minas
The middle-to-high elevations of the Sierra de las Minas form the largest concentration of landslides (see map of landslide locations, plate 21) in the study area (plates 6, 8, 9, and 11). The area is rugged, with as much as 2,700 m of relief from the crest of the range at 2,948 m to the foot of the range at about 200 m. Above about 1,000 m, the area is heavily forested; lower elevations have variable amounts of cleared land or are covered by scrub vegetation. Most of the area is underlain by Paleozoic metamorphic rock, including phyllite, schist, gneiss, marble, and migmatite. Serpentinite and granite and diorite intrusives ranging from Tertiary to Paleozoic age are locally present. Shale, sandstone, conglomerate, and phyllite of Upper Paleozoic age flank the north side of the central part of the range (Bonis and others, 1970).
Most of the slides were relatively shallow, typically involving a layer of colluvium less than about 5 m thick and underlying blocks of jointed bedrock. A few deep-seated slides transported blocks of bedrock as much as 20 m in diameter. The landslides form two primary patterns on the maps. One pattern, shown on figure 13 consists of slides that are
17

Figure 12. Elongate depressions and scarps at the southern edge of the Montaña Yalijux. View is to the northwest. UTM coordinates at the approximate center of the trench 178350 E, 1698275 N. Photo taken January 6, 2001.
Figure 13. Landslides typical of the central part of the Sierra de las Minas at elevations between 1200 and 1800 m (plate 11). Photograph taken to northwest above the Río Mojanal. Center of view at UTM coordinates 232100 m E, 1679400 m N.
small and isolated, typically 20-50 m wide and as much as 100-200 m long (0.2–1 ha). The other pattern consists of larger slides that mobilized into debris flows and flowed down drainages. These form a dendritic pat-tern on the maps that mimics the drainage pattern. Slides in this group are as much as 25 ha, but on average cover between 1 and 5 ha. Large slides commonly initiated at or near the crest of ridges high on the head-walls of steep, amphitheatre-shaped basins. Prominent examples of these large landslides are at the head of Río La Lima (plate 9, Cover) and on the east side of Cerro Picudo (plate 11).
Landslide scars that pre-date Hurricane Mitch are widely distributed in the central Sierra de las Minas. These pre-Mitch land-slides are abundant on some quadrangles (see, for example, the La Tinta quadrangle, plate 6). The pre-Mitch landslides are expressed as vegetated topographic depressions similar in outline and form to Hurricane Mitch landslides, but with more subdued morphology. Vegetation on the pre-Mitch landslides is smaller and less dense than in adjacent terrain outside the landslide. In general, the material transported downs-lope from the pre-Mitch landslides lacks topographic expression and was not mapped.
Río Hondo Quadrangle (plate 9)
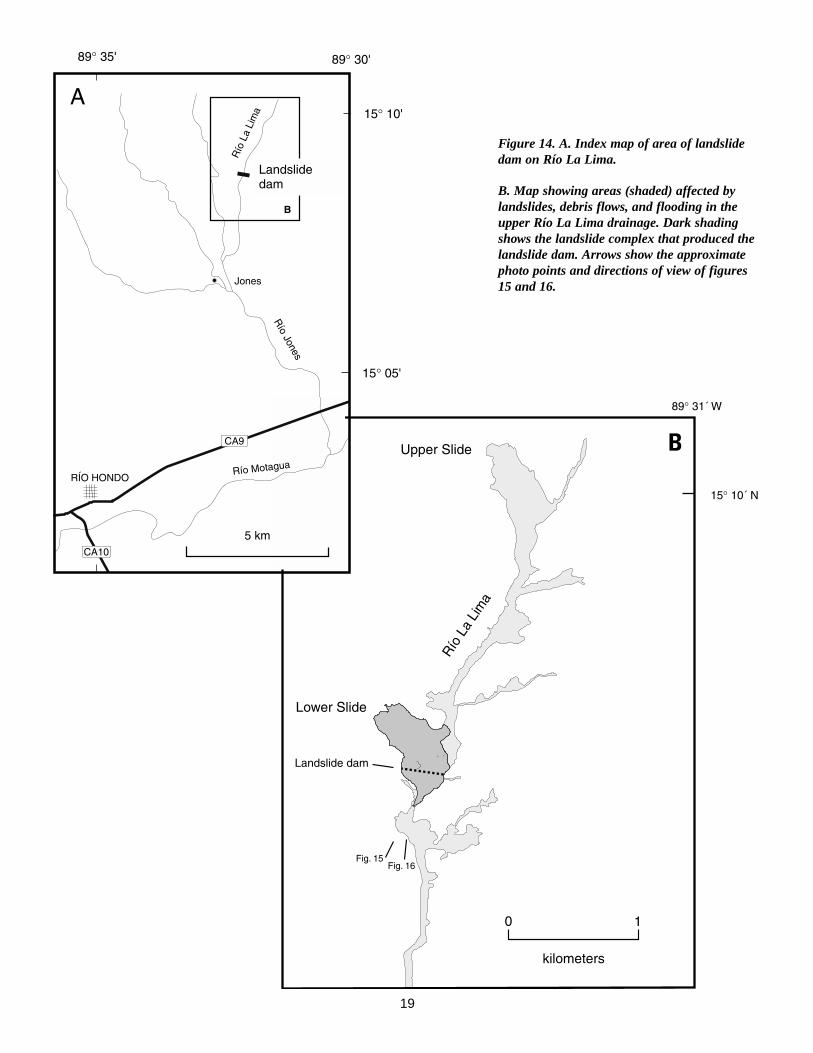
Río La Lima Two landslides along the Río La Lima
upstream from the town of Jones (figs. 14A, B) are the largest landslides in the central part of the Sierra de las Minas. Both of these slope failures were dip-slope, rock and debris slides on steep hillslopes in granitic gneiss (Newcomb, 1978) along the west wall of the canyon of the Río La Lima (Schuster and others, 2001). The lower of the two slides (area about 16 ha; toe location about 4 km north of the town of Jones) dammed the Río La Lima (figs. 15 and 16). The upper of the two slides, shown on the cover, (area about 25 ha; toe location about 5.5 km north of Jones) initiated at the head of the Río La Lima on November 1, 1998, and pre-ceded the lower slide by 1 day (Jorge Mario Aldana Ramirez, personal commun., January 2000). Subsequent erosion of the debris-flow
18
15
B
Figure 14. A. Index map of area of landslide dam on Río
and
La Lima.
B. Map showing areas (shaded) affected by landslides, debris flows, and flooding in the upper Río La Lima drainage. Dark shading shows the landslide complex that produced
16.
the landslide dam. Arrows show the approximate photo points and directions of view of figures
19
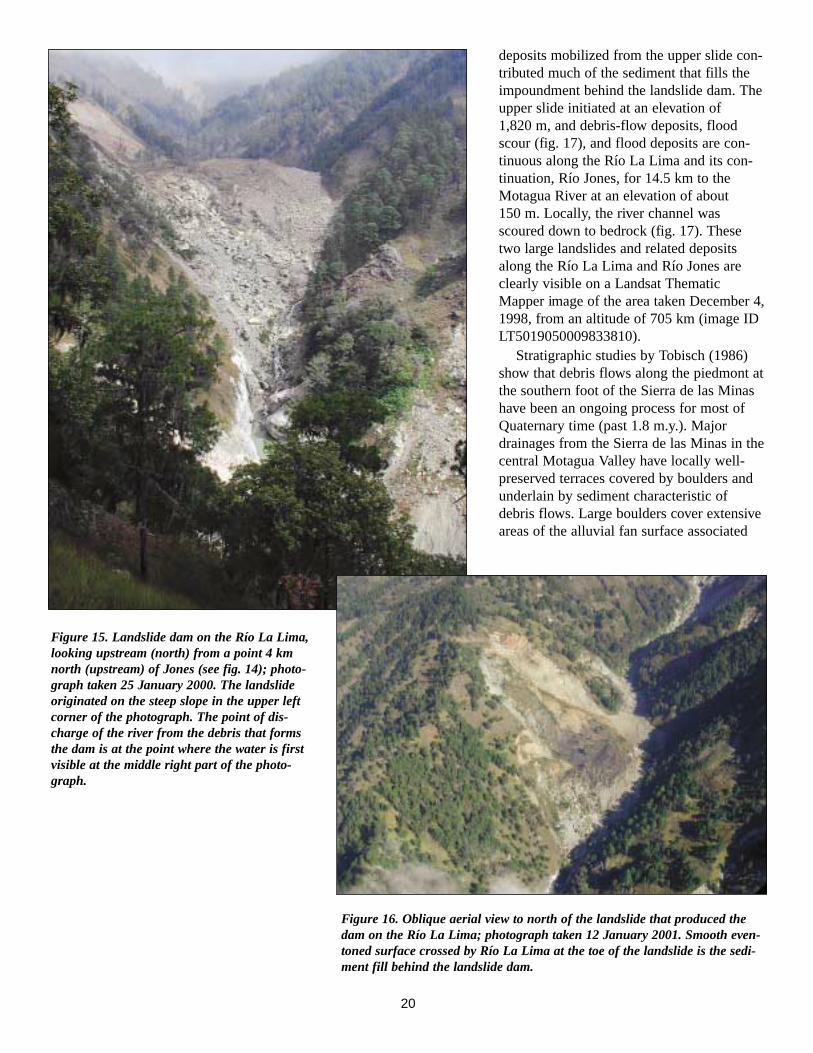
deposits mobilized from the upper slide contributed much of the sediment that fills the impoundment behind the landslide dam. The upper slide initiated at an elevation of 1,820 m, and debris-flow deposits, flood scour (fig. 17), and flood deposits are continuous along the Río La Lima and its continuation, Río Jones, for 14.5 km to the Motagua River at an elevation of about 150 m. Locally, the river channel was scoured down to bedrock (fig. 17). These two large landslides and related deposits along the Río La Lima and Río Jones are clearly visible on a Landsat Thematic Mapper image of the area taken December 4, 1998, from an altitude of 705 km (image ID LT5019050009833810).
Stratigraphic studies by Tobisch (1986) show that debris flows along the piedmont at the southern foot of the Sierra de las Minas have been an ongoing process for most of Quaternary time (past 1.8 m.y.). Major drainages from the Sierra de las Minas in the central Motagua Valley have locally well-preserved terraces covered by boulders and underlain by sediment characteristic of debris flows. Large boulders cover extensive areas of the alluvial fan surface associated
Figure 15. Landslide dam on the Río La Lima, looking upstream (north) from a point 4 km north (upstream) of Jones (see fig. 14); photo-graph taken 25 January 2000. The landslide originated on the steep slope in the upper left corner of the photograph. The point of discharge of the river from the debris that forms the dam is at the point where the water is first visible at the middle right part of the photo-graph.
Figure 16. Oblique aerial view to north of the landslide that produced the dam on the Río La Lima; photograph taken 12 January 2001. Smooth even-toned surface crossed by Río La Lima at the toe of the landslide is the sediment fill behind the landslide dam.
20
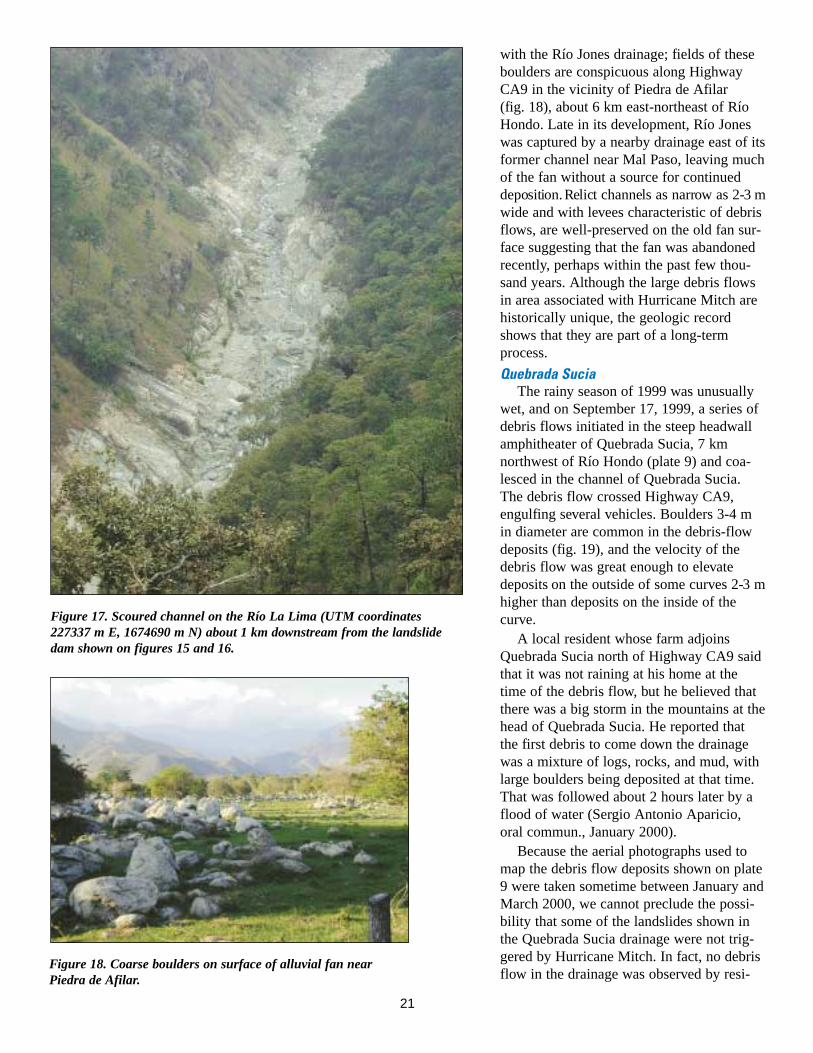
Figure 17. Scoured channel on the Río La Lima (UTM coordinates 227337 m E, 1674690 m N) about 1 km downstream from the landslide dam shown on figures 15 and 16.
Figure 18. Coarse boulders on surface of alluvial fan near Piedra de Afilar.
with the Río Jones drainage; fields of these boulders are conspicuous along Highway CA9 in the vicinity of Piedra de Afilar (fig. 18), about 6 km east-northeast of Río Hondo. Late in its development, Río Jones was captured by a nearby drainage east of its former channel near Mal Paso, leaving much of the fan without a source for continued deposition. Relict channels as narrow as 2-3 m wide and with levees characteristic of debris flows, are well-preserved on the old fan surface suggesting that the fan was abandoned recently, perhaps within the past few thou-sand years. Although the large debris flows in area associated with Hurricane Mitch are historically unique, the geologic record shows that they are part of a long-term process.
Quebrada Sucia The rainy season of 1999 was unusually
wet, and on September 17, 1999, a series of debris flows initiated in the steep headwall amphitheater of Quebrada Sucia, 7 km northwest of Río Hondo (plate 9) and coalesced in the channel of Quebrada Sucia. The debris flow crossed Highway CA9, engulfing several vehicles. Boulders 3-4 m in diameter are common in the debris-flow deposits (fig. 19), and the velocity of the debris flow was great enough to elevate deposits on the outside of some curves 2-3 m higher than deposits on the inside of the curve.
A local resident whose farm adjoins Quebrada Sucia north of Highway CA9 said that it was not raining at his home at the time of the debris flow, but he believed that there was a big storm in the mountains at the head of Quebrada Sucia. He reported that the first debris to come down the drainage was a mixture of logs, rocks, and mud, with large boulders being deposited at that time. That was followed about 2 hours later by a flood of water (Sergio Antonio Aparicio, oral commun., January 2000).
Because the aerial photographs used to map the debris flow deposits shown on plate 9 were taken sometime between January and March 2000, we cannot preclude the possibility that some of the landslides shown in the Quebrada Sucia drainage were not triggered by Hurricane Mitch. In fact, no debris flow in the drainage was observed by resi-
21

dents of the area during Hurricane Mitch, and the large volume of debris transported by the 1999 debris flow suggests that the slides shown in the drainage originated in September 1999.
Sierra de las Minas Quadrangle (plate 11)
Disappearing drainage in the Río Zarquito area
Sediment from a landslide in the north-east quadrant of the Sierra de las Minas quadrangle (plate 11) follows an unnamed drainage to the north-northeast for about 3 km to an abrupt end at a closed depression at a natural barrier in the drainage (UTM 247600 m E, 1693600 m N). There is no ponding or accumulation of sediment in the depression. The area has karst morphology, and the barrier was probably caused by subsidence above a cavern. The channel of a drainage that originates at the foot of a steep hill 1.7 km to the north-northwest is filled with fresh sediment with no apparent source. We infer that sediment was trans-ported underground from where the sedi-
Figure 19. Coarse boulders along margin of debris flow in Quebrada Sucia about 1 km north of Highway CA9. Note sharp trim line at edge of vegetation on left side of photograph. Large boulder in brush is from a previous debris flow. Post-debris flow flooding removed most of finer debris-flow matrix from the upper part of the boulder deposit. Photograph taken January 26, 2000.
ment disappears at the closed depression in the channel to the south-southeast.
La Union and Zacapa Quadrangles (plates 10 and 13)
There were several areas of moderate-to-dense concentrations of landslides in the hills surrounding La Unión and Zacapa (plates 10 and 13). The hills are generally moderate in steepness and reach a maximum elevation of about 1,800 m near the center of the La Unión quadrangle. In general, above elevations of about 1,000 m the area is heavily forested, whereas lower elevations have variable amounts of smaller, less dense vegetation or cleared land. The area is underlain by Paleozoic metamorphic rocks, pre-Permian to Tertiary intrusive rocks, and Tertiary and Quaternary volcanics (Bonis and others, 1970). Most of the landslides occurred in the La Unión quadrangle on hill-slopes underlain by metamorphic rocks. According to residents of La Unión, land-slides closed the road on both sides of the town on the night of October 30 or early in the morning of October 31. The town was then isolated for about 1 month while the landslides were cleared from the road. Below, we describe four main concentrations of landslides, three on the La Union quadrangle and one on the Zacapa quadrangle.
The first concentration of landslides and debris flows is in steep topography on the headwaters of the Río Timushán and the Quebrada Colorado, about 3-7 km south of La Union (plate 13). The landslides initiated from an area underlain by metamorphic rock at elevations between about 1,100 m and 1,500 m. Most of them were probably less than 3 m deep and covered less than 1 ha. Material from these landslides and debris flows was deposited in downstream channels. Flooding and undercutting along these channels contributed to the initiation of several large landslides along the channel banks. Several roads that crossed these channels were washed out by flooding.
The second concentration of landslides is in steep topography in and near the towns of Talquezal and Volcan (plate 13). Most of the landslide activity was 1 to 7 km west of the towns, but we also observed several land-slides near the towns that destroyed coffee
22
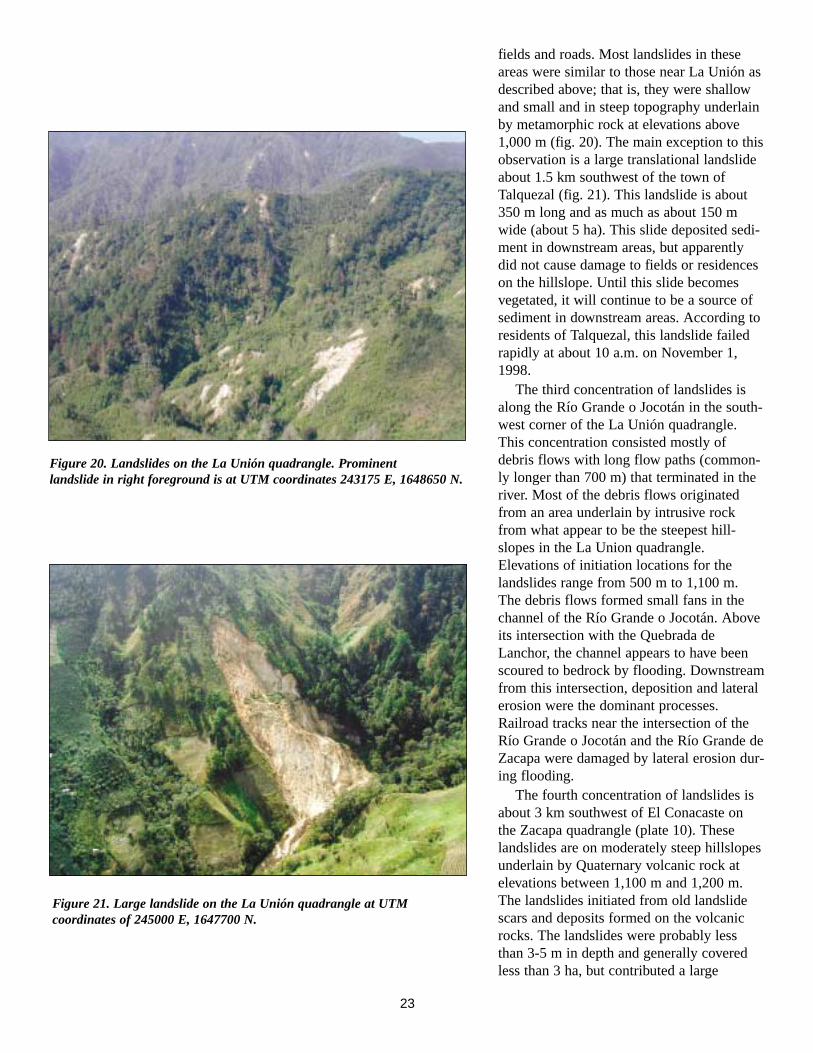
Figure 20. Landslides on the La Unión quadrangle. Prominent landslide in right foreground is at UTM coordinates 243175 E, 1648650 N.
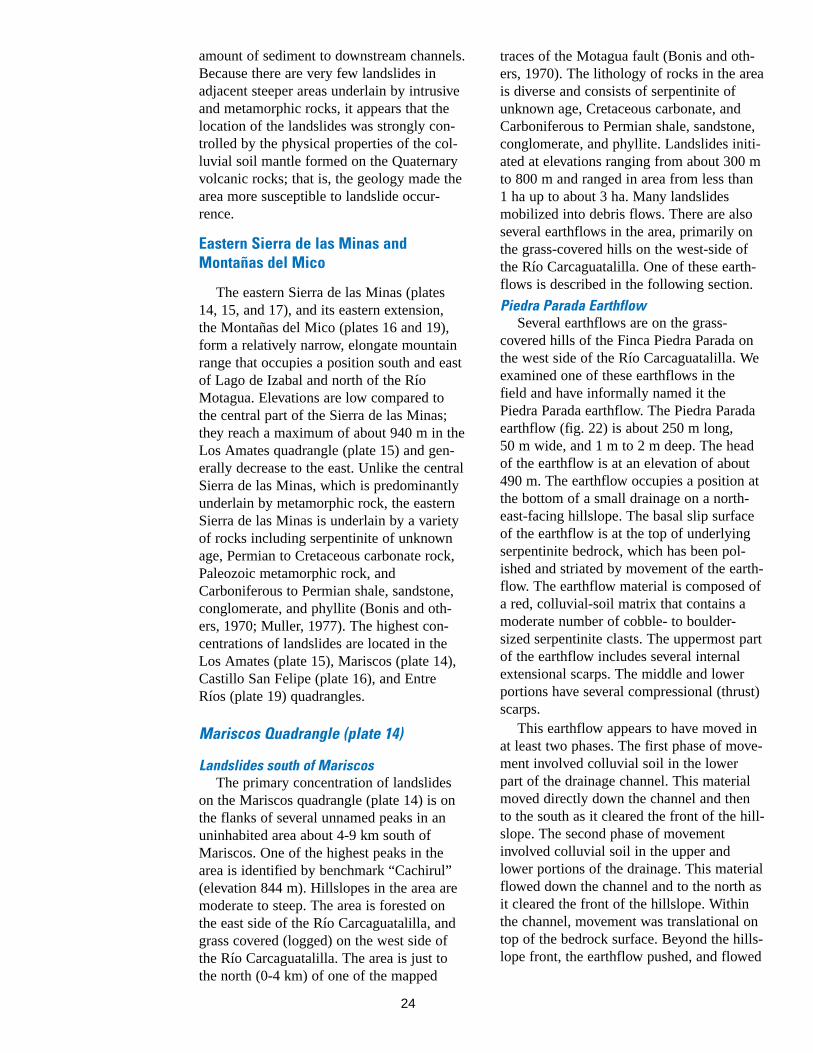
Figure 21. Large landslide on the La Unión quadrangle at UTMcoordinates of 245000 E, 1647700 N.
fields and roads. Most landslides in these areas were similar to those near La Unión as described above; that is, they were shallow and small and in steep topography underlain by metamorphic rock at elevations above 1,000 m (fig. 20). The main exception to this observation is a large translational landslide about 1.5 km southwest of the town of Talquezal (fig. 21). This landslide is about 350 m long and as much as about 150 m wide (about 5 ha). This slide deposited sediment in downstream areas, but apparently did not cause damage to fields or residences on the hillslope. Until this slide becomes vegetated, it will continue to be a source of sediment in downstream areas. According to residents of Talquezal, this landslide failed rapidly at about 10 a.m. on November 1, 1998.
The third concentration of landslides is along the Río Grande o Jocotán in the south-west corner of the La Unión quadrangle. This concentration consisted mostly of debris flows with long flow paths (commonly longer than 700 m) that terminated in the river. Most of the debris flows originated from an area underlain by intrusive rock from what appear to be the steepest hill-slopes in the La Union quadrangle. Elevations of initiation locations for the landslides range from 500 m to 1,100 m. The debris flows formed small fans in the channel of the Río Grande o Jocotán. Above its intersection with the Quebrada de Lanchor, the channel appears to have been scoured to bedrock by flooding. Downstream from this intersection, deposition and lateral erosion were the dominant processes. Railroad tracks near the intersection of the Río Grande o Jocotán and the Río Grande de Zacapa were damaged by lateral erosion during flooding.
The fourth concentration of landslides is about 3 km southwest of El Conacaste on the Zacapa quadrangle (plate 10). These landslides are on moderately steep hillslopes underlain by Quaternary volcanic rock at elevations between 1,100 m and 1,200 m. The landslides initiated from old landslide scars and deposits formed on the volcanic rocks. The landslides were probably less than 3-5 m in depth and generally covered less than 3 ha, but contributed a large
23
amount of sediment to downstream channels. Because there are very few landslides in adjacent steeper areas underlain by intrusive and metamorphic rocks, it appears that the location of the landslides was strongly con-trolled by the physical properties of the colluvial soil mantle formed on the Quaternary volcanic rocks; that is, the geology made the area more susceptible to landslide occurrence.
Eastern Sierra de las Minas and Montañas del Mico
The eastern Sierra de las Minas (plates 14, 15, and 17), and its eastern extension, the Montañas del Mico (plates 16 and 19), form a relatively narrow, elongate mountain range that occupies a position south and east of Lago de Izabal and north of the Río Motagua. Elevations are low compared to the central part of the Sierra de las Minas; they reach a maximum of about 940 m in the Los Amates quadrangle (plate 15) and generally decrease to the east. Unlike the central Sierra de las Minas, which is predominantly underlain by metamorphic rock, the eastern Sierra de las Minas is underlain by a variety of rocks including serpentinite of unknown age, Permian to Cretaceous carbonate rock, Paleozoic metamorphic rock, and Carboniferous to Permian shale, sandstone, conglomerate, and phyllite (Bonis and others, 1970; Muller, 1977). The highest concentrations of landslides are located in the Los Amates (plate 15), Mariscos (plate 14), Castillo San Felipe (plate 16), and Entre Ríos (plate 19) quadrangles.
Mariscos Quadrangle (plate 14)
Landslides south of Mariscos The primary concentration of landslides
on the Mariscos quadrangle (plate 14) is on the flanks of several unnamed peaks in an uninhabited area about 4-9 km south of Mariscos. One of the highest peaks in the area is identified by benchmark “Cachirul” (elevation 844 m). Hillslopes in the area are moderate to steep. The area is forested on the east side of the Río Carcaguatalilla, and grass covered (logged) on the west side of the Río Carcaguatalilla. The area is just to the north (0-4 km) of one of the mapped
traces of the Motagua fault (Bonis and others, 1970). The lithology of rocks in the area is diverse and consists of serpentinite of unknown age, Cretaceous carbonate, and Carboniferous to Permian shale, sandstone, conglomerate, and phyllite. Landslides initiated at elevations ranging from about 300 m to 800 m and ranged in area from less than 1 ha up to about 3 ha. Many landslides mobilized into debris flows. There are also several earthflows in the area, primarily on the grass-covered hills on the west-side of the Río Carcaguatalilla. One of these earth-flows is described in the following section.
Piedra Parada Earthflow Several earthflows are on the grass-
covered hills of the Finca Piedra Parada on the west side of the Río Carcaguatalilla. We examined one of these earthflows in the field and have informally named it the Piedra Parada earthflow. The Piedra Parada earthflow (fig. 22) is about 250 m long, 50 m wide, and 1 m to 2 m deep. The head of the earthflow is at an elevation of about 490 m. The earthflow occupies a position at the bottom of a small drainage on a north-east-facing hillslope. The basal slip surface of the earthflow is at the top of underlying serpentinite bedrock, which has been polished and striated by movement of the earth-flow. The earthflow material is composed of a red, colluvial-soil matrix that contains a moderate number of cobble- to boulder-sized serpentinite clasts. The uppermost part of the earthflow includes several internal extensional scarps. The middle and lower portions have several compressional (thrust) scarps.
This earthflow appears to have moved in at least two phases. The first phase of movement involved colluvial soil in the lower part of the drainage channel. This material moved directly down the channel and then to the south as it cleared the front of the hill-slope. The second phase of movement involved colluvial soil in the upper and lower portions of the drainage. This material flowed down the channel and to the north as it cleared the front of the hillslope. Within the channel, movement was translational on top of the bedrock surface. Beyond the hills-lope front, the earthflow pushed, and flowed
24
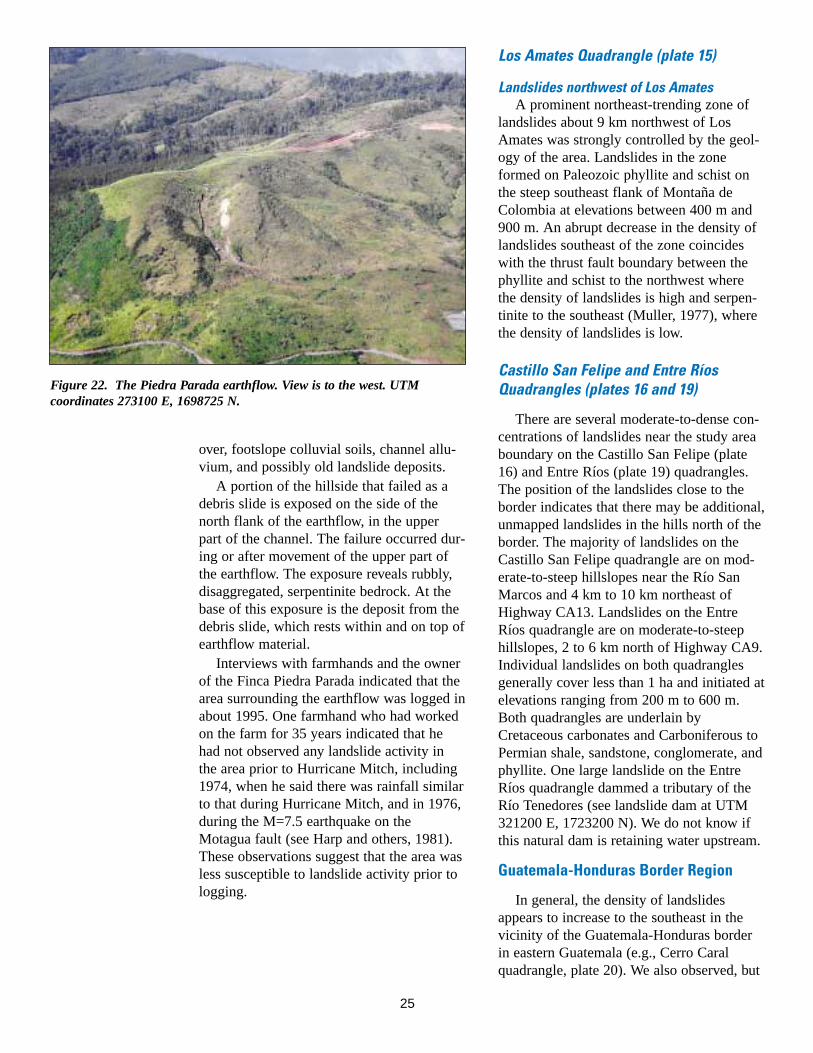
Figure 22. The Piedra Parada earthflow. View is to the west. UTM coordinates 273100 E, 1698725 N.
over, footslope colluvial soils, channel alluvium, and possibly old landslide deposits.
A portion of the hillside that failed as a debris slide is exposed on the side of the north flank of the earthflow, in the upper part of the channel. The failure occurred during or after movement of the upper part of the earthflow. The exposure reveals rubbly, disaggregated, serpentinite bedrock. At the base of this exposure is the deposit from the debris slide, which rests within and on top of earthflow material.
Interviews with farmhands and the owner of the Finca Piedra Parada indicated that the area surrounding the earthflow was logged in about 1995. One farmhand who had worked on the farm for 35 years indicated that he had not observed any landslide activity in the area prior to Hurricane Mitch, including 1974, when he said there was rainfall similar to that during Hurricane Mitch, and in 1976, during the M=7.5 earthquake on the Motagua fault (see Harp and others, 1981). These observations suggest that the area was less susceptible to landslide activity prior to logging.
Los Amates Quadrangle (plate 15)
Landslides northwest of Los Amates A prominent northeast-trending zone of
landslides about 9 km northwest of Los Amates was strongly controlled by the geology of the area. Landslides in the zone formed on Paleozoic phyllite and schist on the steep southeast flank of Montaña de Colombia at elevations between 400 m and 900 m. An abrupt decrease in the density of landslides southeast of the zone coincides with the thrust fault boundary between the phyllite and schist to the northwest where the density of landslides is high and serpentinite to the southeast (Muller, 1977), where the density of landslides is low.
Castillo San Felipe and Entre Ríos Quadrangles (plates 16 and 19)
There are several moderate-to-dense concentrations of landslides near the study area boundary on the Castillo San Felipe (plate 16) and Entre Ríos (plate 19) quadrangles. The position of the landslides close to the border indicates that there may be additional, unmapped landslides in the hills north of the border. The majority of landslides on the Castillo San Felipe quadrangle are on moderate-to-steep hillslopes near the Río San Marcos and 4 km to 10 km northeast of Highway CA13. Landslides on the Entre Ríos quadrangle are on moderate-to-steep hillslopes, 2 to 6 km north of Highway CA9. Individual landslides on both quadrangles generally cover less than 1 ha and initiated at elevations ranging from 200 m to 600 m. Both quadrangles are underlain by Cretaceous carbonates and Carboniferous to Permian shale, sandstone, conglomerate, and phyllite. One large landslide on the Entre Ríos quadrangle dammed a tributary of the Río Tenedores (see landslide dam at UTM 321200 E, 1723200 N). We do not know if this natural dam is retaining water upstream.
Guatemala-Honduras Border Region
In general, the density of landslides appears to increase to the southeast in the vicinity of the Guatemala-Honduras border in eastern Guatemala (e.g., Cerro Caral quadrangle, plate 20). We also observed, but
25
did not map, a high density of landslides in Honduras by scanning aerial photographs from east-west flight lines that extend into Honduras.
Juyamá Quadrangle (plate 18)
In the mountainous part of the Juyamá quadrangle (plate 18), there were no aerial photographs from the IGN-NIMA mapping mission used elsewhere in this study. However, we obtained 1:30,000-scale aerial photographs taken in March 1999 from Aerofoto Centroamericana, S.A. for part of the area and used them to map an area near the Guatemala-Honduras border. The density of landslides in part of the mapped area is the highest seen in our study, with as many as 120 mapped landslides in a 1 km2 area. Much of the mapped area has been cleared of trees; landslides in the cleared areas typically involved only a surface layer of vegetation and an underlying layer of colluvium and weathered bedrock (Paleozoic metamorphic rocks; Bonis and others, 1970) up to 1-2 m thick. Most of the landslides are at elevations between 500 and 1,000 m. By the time of our field visit to the area in January 2001, the landslides scars were revegetated except for the steep scarps at the heads of some slides.
A farmer who lives in the central part of the area (UTM 291 583E, 1 686 039N) reported that following about 8 days of rain, there was an intense rainstorm (“tormenta”) that lasted about 3 hours. When the storm stopped all of the landslides in the area around his farm occurred about a half hour after the storm. At one landslide on his farm, his children were working in a field on the slide and ran out of the field as the hillside began to fail. Failure of the hillside took place within a period of about 5 minutes.
Landslide Susceptibility Mapping on the Pueblo Viejo and Río Hondo Quadrangles
The Pueblo Viejo (plate 8) and Río Hondo (plate 9) quadrangles were selected to demonstrate the utility of landslide-susceptibility mapping because they include abundant pre-Hurricane Mitch, Hurricane Mitch, and post-Hurricane Mitch landslides
that were initiated on a variety of slope gradients and impacted the built environment. Additionally, the La Lima landslide, which is modeled in a later section of this report, is on the Río Hondo quadrangle. The number of mapped landslides that were triggered by Hurricane Mitch in the two quadrangles is 2,951. We have used the Hurricane Mitch landslides to develop a landslide susceptibility map for the prolonged, elevation-con-trolled rainfall associated with Mitch. We have used the pre- and post-Hurricane Mitch landslides to evaluate the susceptibility map.
Landslide susceptibility can be derived using a number of different methods depending on the data that are available (Soeters and van Westen, 1996). In many methods, physical properties of hillslope materials, as well as gradient values from a digital elevation model (DEM), are used in a slope-stability model to estimate varying levels of susceptibility. On the Pueblo Viejo and Río Hondo quadrangles, geologic map-ping is incomplete and physical-property data are not available. Therefore, the susceptibility map that we created was based only on landslide locations and data that were derived from a DEM. In order to determine the factors that contribute to landslide susceptibility, we use the DEM to determine elevation, gradient (slope of ground surface), topographic curvature, and aspect (direction of slope) at each landslide-initiation location. We generate frequency distributions for each data set where frequency is expressed as the percentage of the total number of landslide-initiation locations. The frequency distribution of each landslide-initiation data set (example given, gradients at landslide-initiation locations) is then compared to the frequency distribution of the entire population of data within the two quadrangles (example given, gradients of all 10-m cells within the study area). Finally, a ratio between the frequency distribution for each landslide-initiation data set and the corresponding frequency distribution of population data is computed (see Wieczorek and others, 1988; and Coe and Godt, 2001, for other examples of this approach). The logic behind this comparison is that each land-slide-initiation data set is a subset of the corresponding population data set and that ratio
26
values above a value of one identify areas within the frequency distributions that were preferentially susceptible to landslides during the triggering event. Below, we first describe how our DEM was created, then follow with a description and analysis of elevation, gradient, curvature, and aspect, and lastly present a susceptibility map based on results from our analyses.
Creation of the DEM
We use a 10-m resolution DEM that was generated from 20-m contours on the 1:50,000-scale quadrangles. The DEM was created using a drainage-enforced, inverse-square, weighted-average algorithm. The algorithm assigns elevation values to DEM cells on the basis of proximity to contour lines, that is, the closer a cell is to a contour line, the closer the value of that cell is to the contour value. The algorithm also uses breaklines (lines including varying elevation values) along ridges and drainages, to ensure that the DEM is hydrologically correct. The algorithm produces a DEM that is ideal for flow modeling (see LAHARZ modeling in the next section) but introduces abrupt changes in elevations between DEM cells near contour lines. When the DEM is viewed as a shaded-relief map, the abrupt changes in elevation are visible as steps and terraces on the DEM surface. Because these steps and terraces could adversely affect our analysis of gradient, we processed the DEM used for the gradient analysis as follows. First, we created a gradient grid using the slope function in ArcInfo. The slope function computes a gradient at each grid cell based on the maximum change in elevation from eight surrounding cells. Once the gradient grid was created, we filtered the grid using the focalmean function in ArcInfo. The focalmean function computes a mean value at each grid cell based on the values of neighboring cells. We used a 7 cell (70 m) radius to define the neighboring cells used in the computation of the mean. We found that this processing removed most of the step and terrace artifacts. The original DEM was used for analyses of elevation, topographic curvature, and aspect.
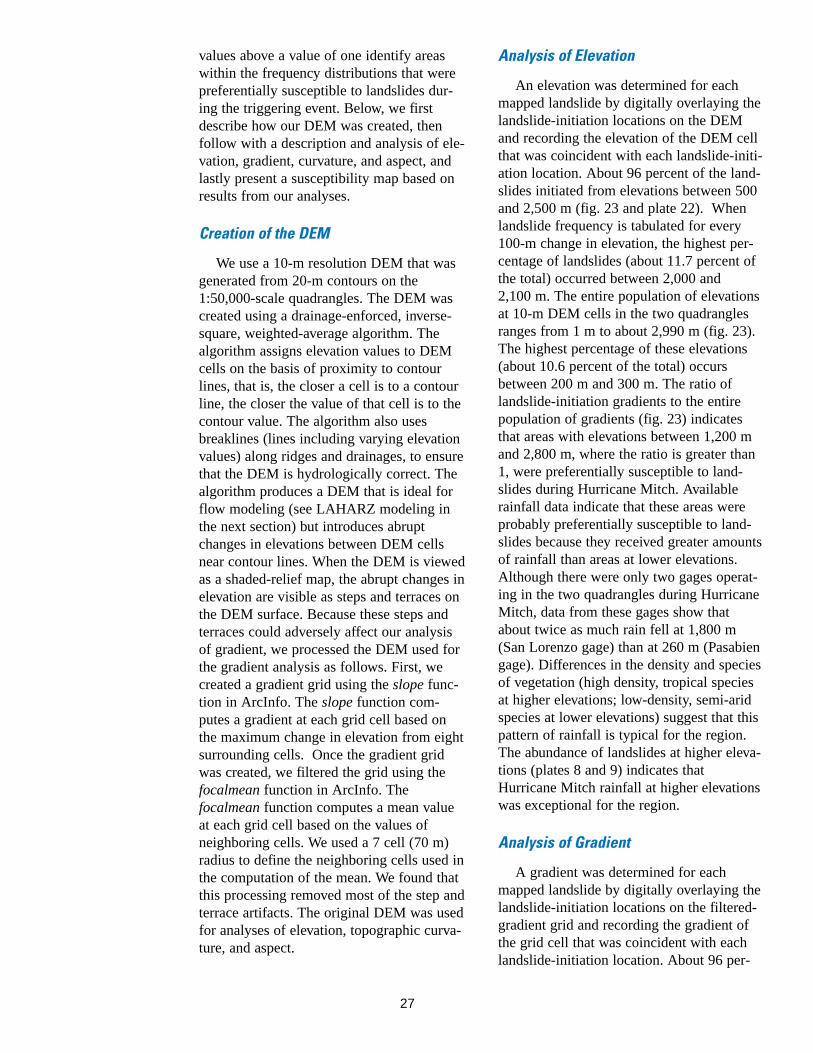
Analysis of Elevation
An elevation was determined for each mapped landslide by digitally overlaying the landslide-initiation locations on the DEM and recording the elevation of the DEM cell that was coincident with each landslide-initiation location. About 96 percent of the land-slides initiated from elevations between 500 and 2,500 m (fig. 23 and plate 22). When landslide frequency is tabulated for every 100-m change in elevation, the highest percentage of landslides (about 11.7 percent of the total) occurred between 2,000 and 2,100 m. The entire population of elevations at 10-m DEM cells in the two quadrangles ranges from 1 m to about 2,990 m (fig. 23). The highest percentage of these elevations (about 10.6 percent of the total) occurs between 200 m and 300 m. The ratio of landslide-initiation gradients to the entire population of gradients (fig. 23) indicates that areas with elevations between 1,200 m and 2,800 m, where the ratio is greater than 1, were preferentially susceptible to land-slides during Hurricane Mitch. Available rainfall data indicate that these areas were probably preferentially susceptible to land-slides because they received greater amounts of rainfall than areas at lower elevations. Although there were only two gages operating in the two quadrangles during Hurricane Mitch, data from these gages show that about twice as much rain fell at 1,800 m (San Lorenzo gage) than at 260 m (Pasabien gage). Differences in the density and species of vegetation (high density, tropical species at higher elevations; low-density, semi-arid species at lower elevations) suggest that this pattern of rainfall is typical for the region. The abundance of landslides at higher elevations (plates 8 and 9) indicates that Hurricane Mitch rainfall at higher elevations was exceptional for the region.
Analysis of Gradient
A gradient was determined for each mapped landslide by digitally overlaying the landslide-initiation locations on the filtered-gradient grid and recording the gradient of the grid cell that was coincident with each landslide-initiation location. About 96 per-
27
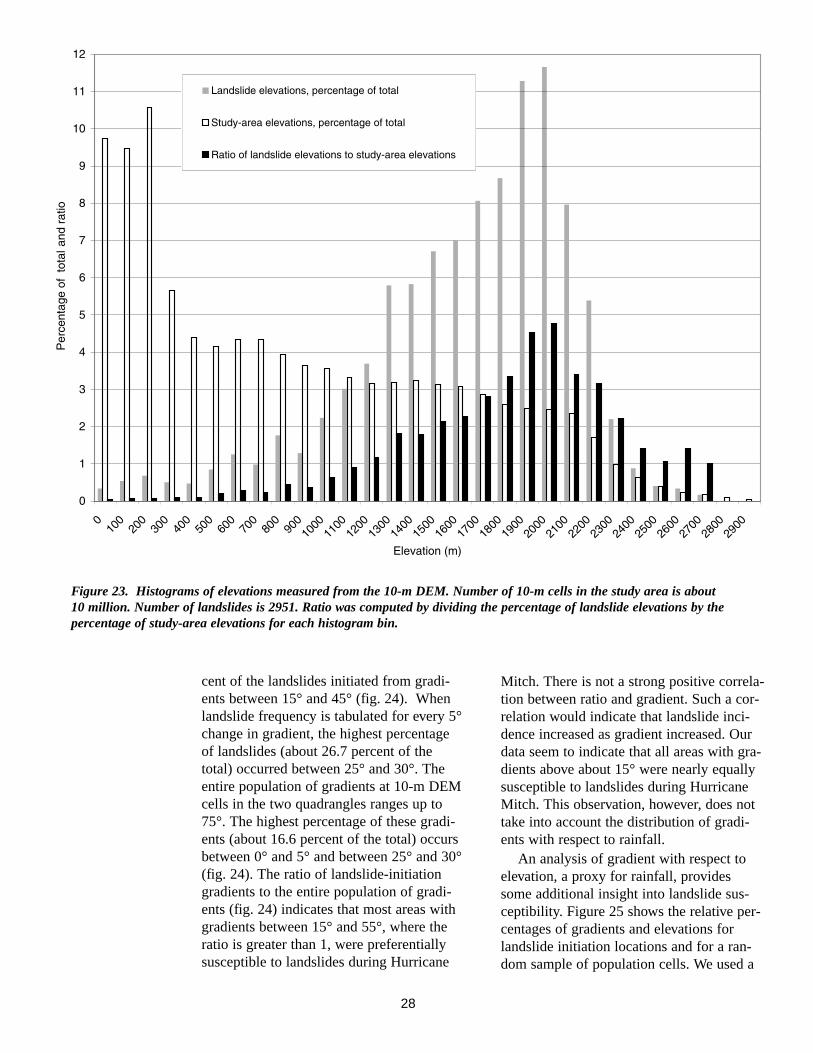
Figure 23. Histograms of elevations measured from the 10-m DEM. Number of 10-m cells in the study area is about 10 million. Number of landslides is 2951. Ratio was computed by dividing the percentage of landslide elevations by the percentage of study-area elevations for each histogram bin.
cent of the landslides initiated from gradients between 15° and 45° (fig. 24). When landslide frequency is tabulated for every 5° change in gradient, the highest percentage of landslides (about 26.7 percent of the total) occurred between 25° and 30°. The entire population of gradients at 10-m DEM cells in the two quadrangles ranges up to 75°. The highest percentage of these gradients (about 16.6 percent of the total) occurs between 0° and 5° and between 25° and 30° (fig. 24). The ratio of landslide-initiation gradients to the entire population of gradients (fig. 24) indicates that most areas with gradients between 15° and 55°, where the ratio is greater than 1, were preferentially susceptible to landslides during Hurricane
Mitch. There is not a strong positive correlation between ratio and gradient. Such a correlation would indicate that landslide incidence increased as gradient increased. Our data seem to indicate that all areas with gradients above about 15° were nearly equally susceptible to landslides during Hurricane Mitch. This observation, however, does not take into account the distribution of gradients with respect to rainfall.
An analysis of gradient with respect to elevation, a proxy for rainfall, provides some additional insight into landslide susceptibility. Figure 25 shows the relative percentages of gradients and elevations for landslide initiation locations and for a random sample of population cells. We used a
28
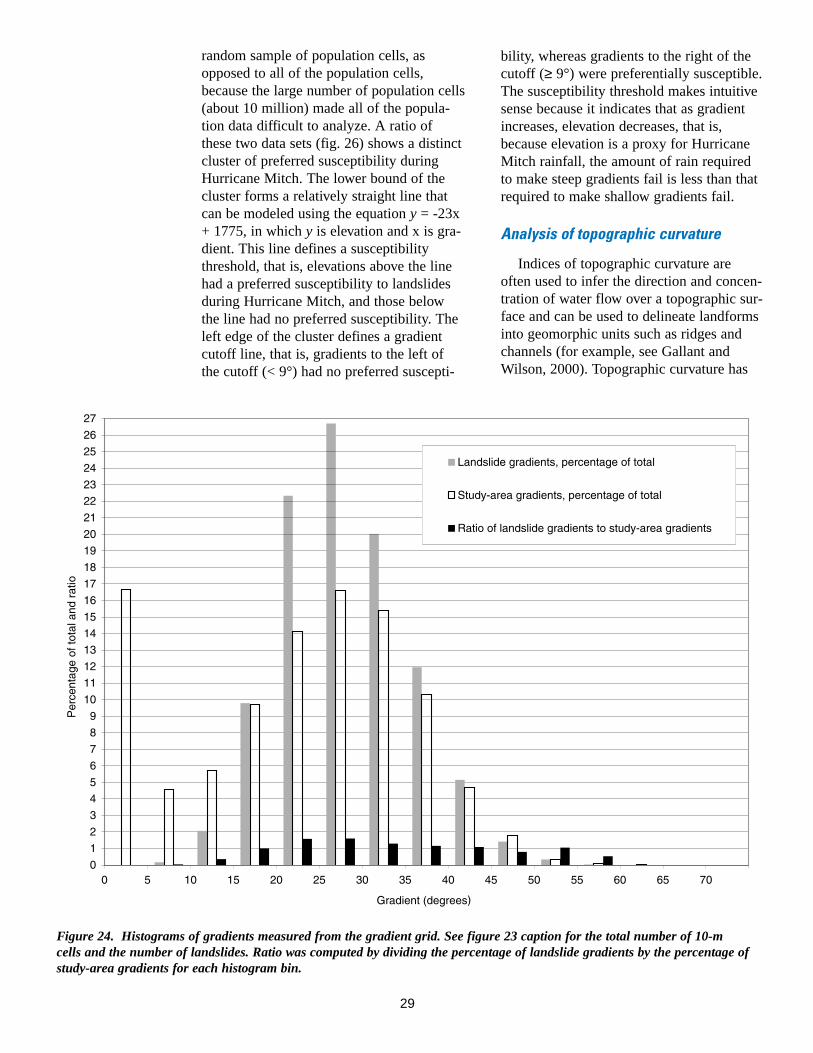
random sample of population cells, as opposed to all of the population cells, because the large number of population cells (about 10 million) made all of the population data difficult to analyze. A ratio of these two data sets (fig. 26) shows a distinct cluster of preferred susceptibility during Hurricane Mitch. The lower bound of the cluster forms a relatively straight line that can be modeled using the equation y = -23x + 1775, in which y is elevation and x is gradient. This line defines a susceptibility threshold, that is, elevations above the line had a preferred susceptibility to landslides during Hurricane Mitch, and those below the line had no preferred susceptibility. The left edge of the cluster defines a gradient cutoff line, that is, gradients to the left of the cutoff (< 9°) had no preferred suscepti
bility, whereas gradients to the right of the cutoff (≥ 9°) were preferentially susceptible. The susceptibility threshold makes intuitive sense because it indicates that as gradient increases, elevation decreases, that is, because elevation is a proxy for Hurricane Mitch rainfall, the amount of rain required to make steep gradients fail is less than that required to make shallow gradients fail.
Analysis of topographic curvature
Indices of topographic curvature are often used to infer the direction and concentration of water flow over a topographic surface and can be used to delineate landforms into geomorphic units such as ridges and channels (for example, see Gallant and Wilson, 2000). Topographic curvature has
Figure 24. Histograms of gradients measured from the gradient grid. See figure 23 caption for the total number of 10-m cells and the number of landslides. Ratio was computed by dividing the percentage of landslide gradients by the percentage of study-area gradients for each histogram bin.
29
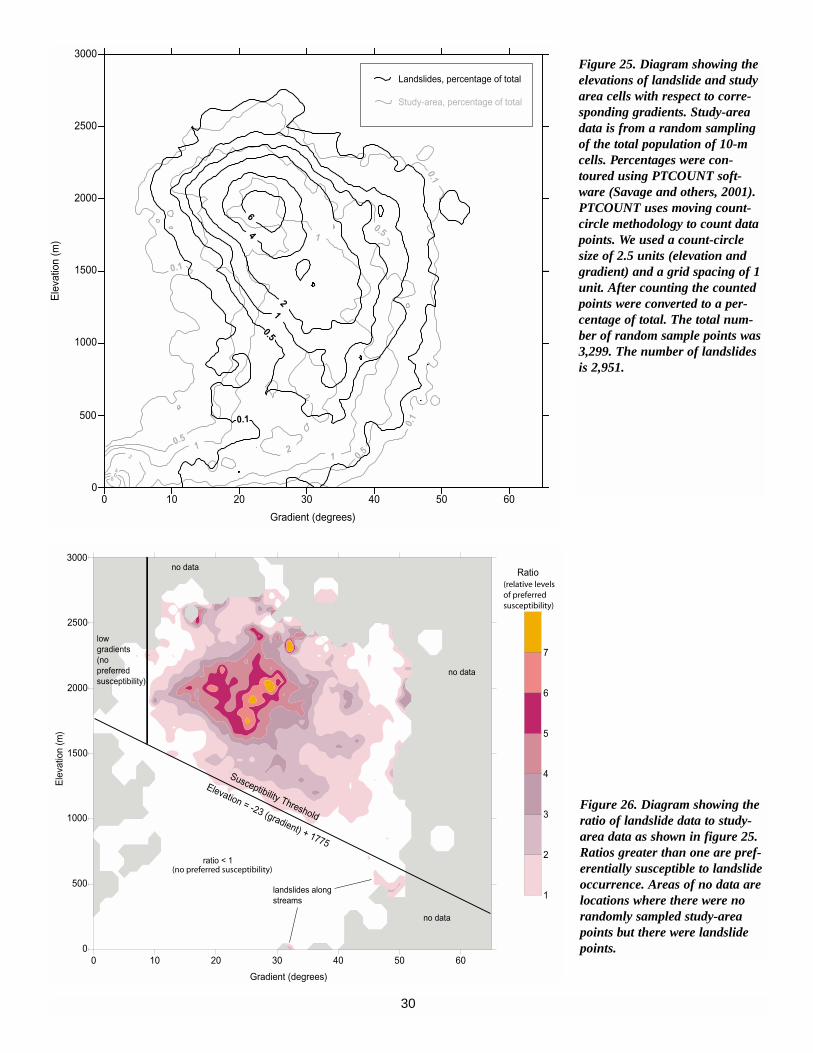
30
Figure 25. Diagram showing theelevations of landslide and studyarea cells with respect to corre-sponding gradients. Study-areadata is from a random samplingof the total population of 10-mcells. Percentages were con-toured using PTCOUNT soft-ware (Savage and others, 2001).PTCOUNT uses moving count-circle methodology to count datapoints. We used a count-circlesize of 2.5 units (elevation andgradient) and a grid spacing of 1unit. After counting the countedpoints were converted to a per-centage of total. The total num-ber of random sample points was3,299. The number of landslidesis 2,951.
Figure 26. Diagram showing theratio of landslide data to study-area data as shown in figure 25.Ratios greater than one are pref-erentially susceptible to landslideoccurrence. Areas of no data arelocations where there were norandomly sampled study-areapoints but there were landslidepoints.
been shown to control the downslope trans-port of colluvial soils, surface runoff, and shallow, sub-surface flow on colluvialmantled hillslopes (Dietrich and others, 1995). Topographic curvature is typically computed from elevations of cells in a DEM. Curvature can be computed for the entire surface surrounding each DEM cell, or the curvature of the surface in a particular direction. In this study, we used the curvature function in ArcInfo to compute the curvature of the DEM surface perpendicular to the aspect (direction of inclination of ground surface) for each cell in the original DEM. ArcInfo refers to this type of curvature as planform curvature. The curvature function computes planform curvature by fitting a fourth-order polynomial to nine elevations contained in a 3x3 window of cells where the center cell is the cell for which curvature is being computed. The units of planform curvature are 1/100 m. Negative values indicate topography that is concave upward and positive values indicate topography that is convex upward. Planar surfaces have a curvature of zero. Materials transported by colluvial processes and surface runoff tend to accumulate in concave areas. As a result, colluvium, colluvial soils, and sediments tend to be thicker in concave areas. Some studies suggest that concave areas are more susceptible to the initiation of shallow land-slides (Dietrich and others, 1986).
We determined a planform-curvature value for each mapped landslide by digitally overlaying the landslide-initiation locations on the grid of curvature cells and recording the curvature of the grid cell that was coincident with each landslide-initiation location. Ninety-nine percent of the landslides initiated from areas that had planform curvatures between –4 and +4 (fig. 27). The highest percentage of landslides (about 10.1 percent of the total) had curvature values of zero (fig. 27) and the landslide curvatures were approximately normally distributed about zero. As with the landslide curvatures, 99 percent of the entire population of 10-m DEM cells had curvatures that ranged from –4 to +4 (fig. 27). The highest percentage of these curvatures (about 17.7 percent of the total) had values of zero and the curvatures were approximately normally distributed
about zero. The ratio of landslide-initiation curvatures to the entire population of curvatures (fig. 27) reveals that both concave (curvatures less than zero) and convex (curvatures greater than zero) areas were about equally susceptible to landslides during Hurricane Mitch.
Analysis of aspect
We used the original DEM to create an aspect (direction of inclination of ground surface) grid using the aspect function in ArcInfo. The aspect function determines the aspect of each DEM cell by identifying the down-slope direction of the maximum rate of change in elevation between the DEM cell and its neighboring cells. Aspect values range from 0° to 359°. An aspect was deter-mined for each mapped landslide by digitally overlaying the landslide-initiation locations on the aspect grid and recording the aspect of the grid cell that was coincident with each landslide-initiation location. When landslide frequency is tabulated for every 10° change in aspect, the highest percentage of landslides (about 6.8 percent of the total) occurred between 90° and 100° (fig. 28). The highest percentage of the entire population of aspects for all 10-m cells in the two quadrangles (about 4.5 per-cent of the total) also occurs between 90° and 100°. The ratio of landslide initiation aspects to the entire population of aspects (fig. 28) indicates that east-, southeast-, and south-facing hillslopes (aspects between 70° and 220°, in fig. 28) were preferentially susceptible to landslides during Hurricane Mitch. The reason for this preference is unclear. However, one possible explanation is that the preference is related to the position and direction of movement of Hurricane Mitch. Between October 30 and November 1, 1998, when the heaviest rain fell in Guatemala, the eye of Hurricane Mitch was south of the two quadrangles and the direction of movement was from east to west (fig. 1). The direction of movement and position of Hurricane Mitch may have caused east-to-south facing hillslopes to receive more rain than west-to-north facing hillslopes.
31
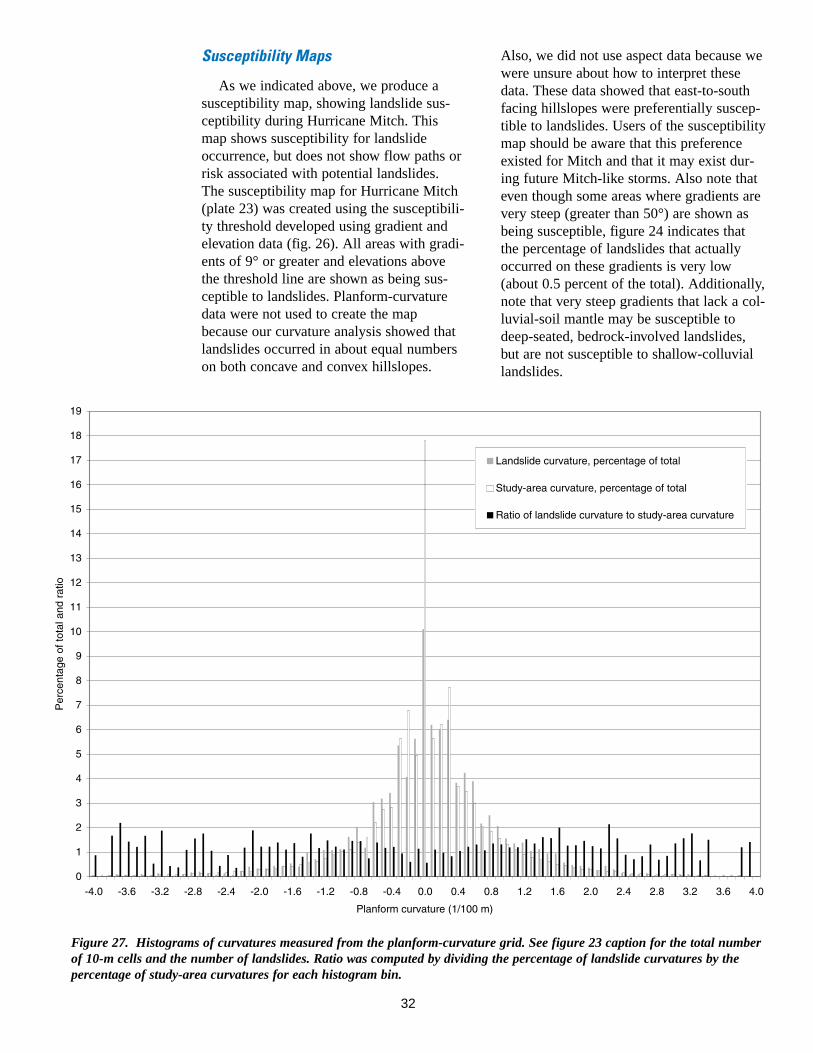
Susceptibility Maps
As we indicated above, we produce a susceptibility map, showing landslide susceptibility during Hurricane Mitch. This map shows susceptibility for landslide occurrence, but does not show flow paths or risk associated with potential landslides. The susceptibility map for Hurricane Mitch (plate 23) was created using the susceptibility threshold developed using gradient and elevation data (fig. 26). All areas with gradients of 9° or greater and elevations above the threshold line are shown as being susceptible to landslides. Planform-curvature data were not used to create the map because our curvature analysis showed that landslides occurred in about equal numbers on both concave and convex hillslopes.
Also, we did not use aspect data because we were unsure about how to interpret these data. These data showed that east-to-south facing hillslopes were preferentially susceptible to landslides. Users of the susceptibility map should be aware that this preference existed for Mitch and that it may exist during future Mitch-like storms. Also note that even though some areas where gradients are very steep (greater than 50°) are shown as being susceptible, figure 24 indicates that the percentage of landslides that actually occurred on these gradients is very low (about 0.5 percent of the total). Additionally, note that very steep gradients that lack a colluvial-soil mantle may be susceptible to deep-seated, bedrock-involved landslides, but are not susceptible to shallow-colluvial landslides.
Figure 27. Histograms of curvatures measured from the planform-curvature grid. See figure 23 caption for the total number of 10-m cells and the number of landslides. Ratio was computed by dividing the percentage of landslide curvatures by the percentage of study-area curvatures for each histogram bin.
32
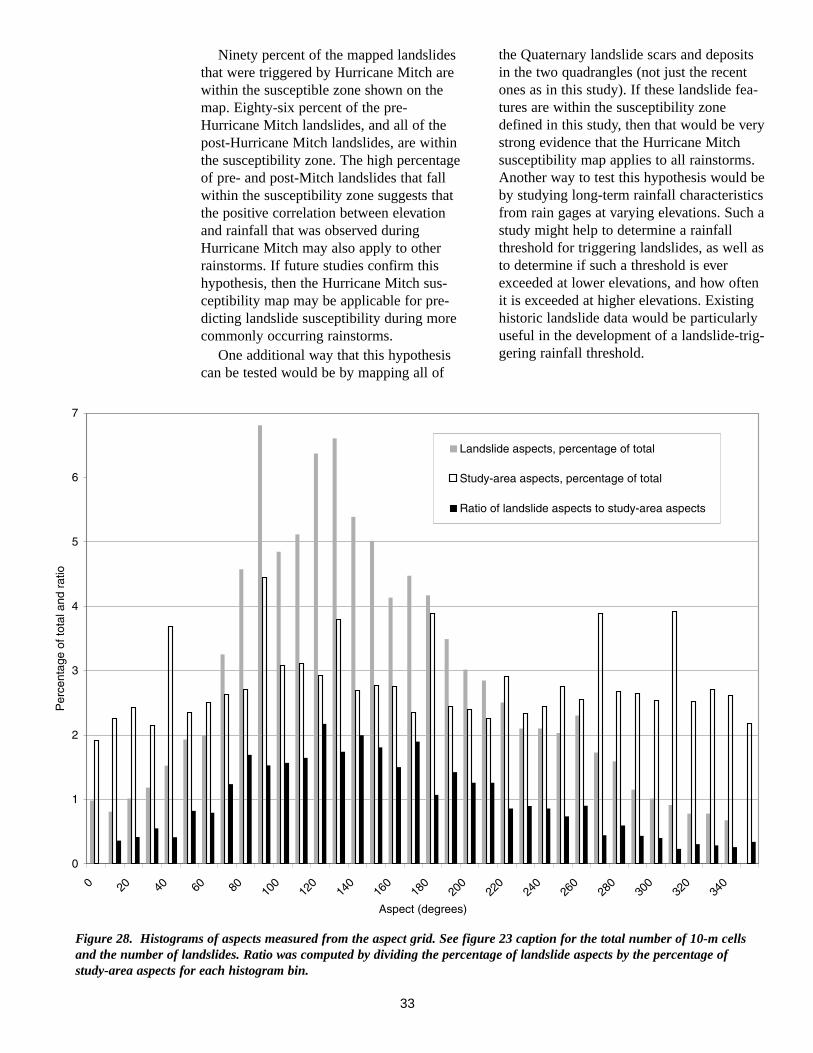
Ninety percent of the mapped landslides that were triggered by Hurricane Mitch are within the susceptible zone shown on the map. Eighty-six percent of the pre-Hurricane Mitch landslides, and all of the post-Hurricane Mitch landslides, are within the susceptibility zone. The high percentage of pre- and post-Mitch landslides that fall within the susceptibility zone suggests that the positive correlation between elevation and rainfall that was observed during Hurricane Mitch may also apply to other rainstorms. If future studies confirm this hypothesis, then the Hurricane Mitch susceptibility map may be applicable for predicting landslide susceptibility during more commonly occurring rainstorms.
One additional way that this hypothesis can be tested would be by mapping all of
the Quaternary landslide scars and deposits in the two quadrangles (not just the recent ones as in this study). If these landslide features are within the susceptibility zone defined in this study, then that would be very strong evidence that the Hurricane Mitch susceptibility map applies to all rainstorms. Another way to test this hypothesis would be by studying long-term rainfall characteristics from rain gages at varying elevations. Such a study might help to determine a rainfall threshold for triggering landslides, as well as to determine if such a threshold is ever exceeded at lower elevations, and how often it is exceeded at higher elevations. Existing historic landslide data would be particularly useful in the development of a landslide-triggering rainfall threshold.
Figure 28. Histograms of aspects measured from the aspect grid. See figure 23 caption for the total number of 10-m cells and the number of landslides. Ratio was computed by dividing the percentage of landslide aspects by the percentage of study-area aspects for each histogram bin.
33
Simulated failure of the landslide dam on the Rio La Lima
Two large landslides triggered by Hurricane Mitch affected the Río La Lima about 4 km upstream from the town of Jones on the Rio Hondo quadrangle (plate 9). The lower landslide dammed the river. The land-slide dam has an estimated volume of 500,000 m3 and impounds an additional 200,000 m3 of water and sediment derived from the upper landslide. The likelihood of failure of the total 700,000 m3 is considered small, but in the event of a strong earth-quake, severe rainstorm, or a combination of the two, catastrophic failure is possible (Schuster and others, 2001). To evaluate the potential hazard from catastrophic failure of the landslide dam, we applied a GIS-based simulation using LAHARZ software (Schilling, 1998) to estimate the plainimetric and cross-sectional area inundated by the resulting debris flow. LAHARZ is written in the ArcInfo Macro Language (AML) that runs within the GRID module of ArcInfo and delimits areas of potential inundation from large debris flows or lahars that originate on the flanks of volcanoes. The soft-ware uses a digital elevation model (DEM) and the results of a scaling and statistical analysis of 27 lahars from nine volcanoes to estimate cross-sectional and planimetric areas of inundation as a function of land-slide volumes (Iverson and others, 1998; Schilling, 1998). The analysis of Iverson and others (1998) and the derived LAHARZ software was not specifically intended for prediction of inundated areas due to catastrophic failure of landslide dams. However, the conditions at the La Lima site are very similar to those that the model was designed to simulate, that is, the potential debris-flow volume is large and reasonably well con-strained, and the debris flow would be largely confined to the Río La Lima channel.
Four simulations were run with debris-flow volumes of 500,000 m3, 700,000 m3, 900,000 m3, and 1,100,000 m3. This range represents failure of the landslide dam (500,000 m3) to failure of the landslide dam, the impounded sediment and the entrainment of additional material from the upper landslide (1,100,000 m3). The results show
that the LAHARZ simulations clearly define hazard zones in areas of low slope adjacent to the channel of the Río La Lima (fig. 29). The extent of these hazard zones could not be delimited by inspection of a topographic map alone, thus demonstrating the utility of this approach. Comparison of the simulation with the mapped extent of the deposit that resulted from the debris flow during Hurricane Mitch shows good agreement with the inundation predicted from a 700,000 m3 debris-flow volume (fig. 29 and plate 9). This result suggests that the volume of the debris flow triggered by Hurricane Mitch in the Río La Lima drainage was at least 700,000 m3.
SUMMARY
Hurricane Mitch triggered about 11,500 landslides in a 10,000 km2 area of east-central Guatemala. On average, this is about one landslide/km2 , but ranged up to as many as 120 landslides/km2. Rainfall from Hurricane Mitch was exceptional because it was geographically widespread, prolonged over a period of about a week, moderate to heavy in intensity, and occurred at the end of the rainy season when the ground already had a high moisture content. As documented in this report, this type of rainfall, on saturated or nearly saturated ground, has the capability to trigger both shallow and deep-seated landslides over a large area. The landsliding documented by this study would probably have been less extensive had Hurricane Mitch occurred early in the rainy season.
We have made a few limited observations regarding rainfall amounts necessary for triggering landslides. Specifically, eyewitness accounts at three of the largest deep-seated landslides indicated that all three occurred on November 1, 1998, near the end of Hurricane Mitch rainfall. Rain gage data collected near one of these landslides indicates that the slide occurred after 6 days of rain that averaged about 46 mm/day. We were also able to document rainfall amounts that triggered shallow landslides that mobilized into debris flows. These data happen to be from debris flows that occurred in
34
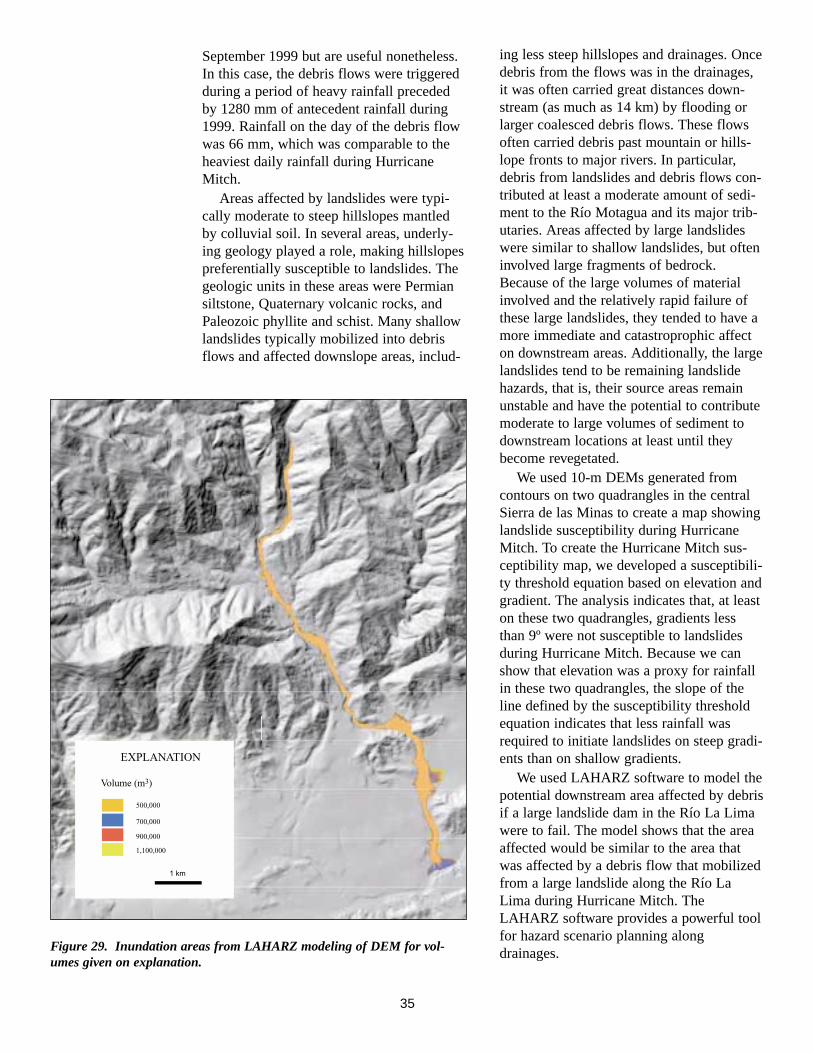
September 1999 but are useful nonetheless. In this case, the debris flows were triggered during a period of heavy rainfall preceded by 1280 mm of antecedent rainfall during 1999. Rainfall on the day of the debris flow was 66 mm, which was comparable to the heaviest daily rainfall during Hurricane Mitch.
Areas affected by landslides were typically moderate to steep hillslopes mantled by colluvial soil. In several areas, underlying geology played a role, making hillslopes preferentially susceptible to landslides. The geologic units in these areas were Permian siltstone, Quaternary volcanic rocks, and Paleozoic phyllite and schist. Many shallow landslides typically mobilized into debris flows and affected downslope areas, includ-
Figure 29. Inundation areas from LAHARZ modeling of DEM for volumes given on explanation.
ing less steep hillslopes and drainages. Once debris from the flows was in the drainages, it was often carried great distances down-stream (as much as 14 km) by flooding or larger coalesced debris flows. These flows often carried debris past mountain or hills-lope fronts to major rivers. In particular, debris from landslides and debris flows contributed at least a moderate amount of sediment to the Río Motagua and its major tributaries. Areas affected by large landslides were similar to shallow landslides, but often involved large fragments of bedrock. Because of the large volumes of material involved and the relatively rapid failure of these large landslides, they tended to have a more immediate and catastroprophic affect on downstream areas. Additionally, the large landslides tend to be remaining landslide hazards, that is, their source areas remain unstable and have the potential to contribute moderate to large volumes of sediment to downstream locations at least until they become revegetated.
We used 10-m DEMs generated from contours on two quadrangles in the central Sierra de las Minas to create a map showing landslide susceptibility during Hurricane Mitch. To create the Hurricane Mitch susceptibility map, we developed a susceptibility threshold equation based on elevation and gradient. The analysis indicates that, at least on these two quadrangles, gradients less than 9º were not susceptible to landslides during Hurricane Mitch. Because we can show that elevation was a proxy for rainfall in these two quadrangles, the slope of the line defined by the susceptibility threshold equation indicates that less rainfall was required to initiate landslides on steep gradients than on shallow gradients.
We used LAHARZ software to model the potential downstream area affected by debris if a large landslide dam in the Río La Lima were to fail. The model shows that the area affected would be similar to the area that was affected by a debris flow that mobilized from a large landslide along the Río La Lima during Hurricane Mitch. The LAHARZ software provides a powerful tool for hazard scenario planning along drainages.
35
IMPLICATIONS FOR LANDSLIDE HAZARDS
The characteristics of rainfall-triggered landslides described in this report can be used as a partial guide to future landslide activity triggered by rainstorms. On the basis of existing data, hazardous areas include: moderate to steep hillslopes and less steep areas directly below these hillslopes, drainage channels downslope from landslide prone hillslopes, and alluvial fans at the mouths of drainages along mountain or hills-lope fronts. Evidence for, and frequency of, past landslides at individual sites can be used to determine the level of future hazard (for example, see Coe and others, 2000). That is, one of the best indicators for future landslide activity is evidence of past land-slide activity. For this reason, landslide inventory maps showing Quaternary, historic, and modern landslides are of critical importance. Areas susceptible to rainfall-triggered landslides are not necessarily the same as those susceptible to earthquake triggered landslides. The reader is referred to Harp and others (1981) for information on landslides triggered by the 1976 Mw = 7.6 earthquake in Guatemala.
RECOMMENDATIONS
Attempts should be made to prevent development of housing and infrastructure in potentially hazardous areas (given in previous section). In order to specifically identify these areas, inventories of landslides should continue to be made after local and wide-spread rainstorms. Additionally, to the extent possible, physical-property information on colluvial soils should be compiled. As stated in the susceptibility section of this report, physical-property data can then be combined with DEM data to produce landslide susceptibility maps. The next step beyond susceptibility maps, would be hazard maps that include downslope areas that lie in landslide flow paths. The creation of hazard maps will require additional mapping of Quaternary and historic landslide and debris-flow deposits.
For hazardous areas that are already inhabited, a method for predicting and deliv
ering landslide warnings can be developed. One of the easiest, and most accurate ways to predict the timing of rainfall-triggered landslides, is by using a rainfall threshold. When such a threshold has been exceeded, or is expected to be exceeded by an approaching storm, a landslide warning can be issued for hazardous areas. The data to develop a preliminary rainfall threshold may already exist. Two thresholds should be developed, one for debris flows that commonly mobilize from shallow landslides during intense bursts of rainfall, and one for deep-seated land-slides that are usually triggered by prolonged rainfall. The primary data needed to develop a rainfall threshold are landslide times of occurrence and rainfall data from a nearby rain gage. Also, of nearly equal importance, are rainfall amounts that do not trigger land-slides. Because the most hazardous types of landslides are typically debris flows, rain gage data used to develop a rainfall threshold for debris flows (shallow landslides) should have at least hourly resolution. For examples of rainfall thresholds see reports by Caine (1980), Cannon (1988), and Larsen and Simon (1993).
REFERENCES CITED
Bonis, S., Bohnenberger, O.H., and Dengo, G., compilers, 1970, Mapa geológico de la Republica de Guatemala: Guatemala, Instituto Geográfico Nacional, scale 1:500,000.
Caine, N., 1980, The rainfall intensity-duration control of shallow landslides and debris flows: Geografiska Annaler, ser. A, v. 62, p. 23-27.
Cannon, S.H., 1988, Regional rainfall-thresh-old conditions for abundant debris-flow activity, in Ellen, S.D., and Wieczorek, G.F. eds., Landslides, floods, and marine effects of the storm of January 3-5, 1982, in the San Francisco Bay region, California: U.S. Geological Survey Professional Paper 1434, p. 35-42.
Coe, J.A., and Godt, J.W., 2001, Debris flows triggered by the El Niño rainstorm of February 2-3, 1998, Walpert Ridge and vicinity, Alameda County, California: U.S. Geological Survey Miscellaneous Field Studies Map MF-2384.
36
Coe, J.A., Michael, J.A., Crovelli, R.A., and Savage, W.Z., 2000, Preliminary map showing landslide densities, mean recurrence intervals, and exceedance probabilities as determined from historic records, Seattle, Washington: U.S. Geological Survey Open-File Report 00-303, 25 p. pamphlet, scale 1:25,000, http://greenwood.cr.usgs.gov/pub/ open-file-reports/ofr-00-0303/.
Cruden, D.M., and Varnes, D.J., 1996, Landslide types and processes, in Turner, A.K., and Schuster, R.L. eds., Landslides, investigation and mitigation: Washington, D.C., National Academy Press, Transportation Research Board Special Report 247, p. 36-75.
Dietrich, W.E., Reiss, R., Hsu, M.-L., and Montgomery, D.R., 1995, A process-based model for colluvial soil depth and shallow landsliding using digital elevation data: Hydrological Processes, v. 9, p. 383-400.
Dietrich, W.E., Wilson, C.J., and Reneau, S.L., 1986, Hollows, colluvium, and landslides in soil-mantled landscapes, in Abrahams, A.D. ed., Hillslope processes: Boston, Allen and Unwin, p. 361-388.
Gallant, J.C., and Wilson, J.P., 2000, Primary topographic attributes, in Wilson, J.P., and Gallant, J.C. eds., Terrain analysis—Principles and applications: New York, Wiley, p. 51-76.
Guiney, J.L., and Lawrence, M.B., 1998, Preliminary report, Hurricane Mitch, 22 October–05 November 1998: http://www.nhc.noaa.gov/1998mitch.html.
Harp, E.L., Wilson, R.C., and Wieczorek, G.F., 1981, Landslides from the February 4, 1976, Guatemala earthquake: U.S. Geological Survey Professional Paper 1204-A, 35 p.
Hellin, J., and Haigh, M.J., 1999, Rainfall in Honduras during Hurricane Mitch: Weather, v. 54, p. 350-359.
Instituto Nicaragüense de Estudios Territoriales, 1998, Las lluvias del siglo en Nicaragua: Managua, Instituto Nicaragüense de Estudios Territoriales, INETER, 159 p.
Iverson, R.P., Schilling, S.P., and Vallance, J.W., 1998, Objective delineation of lahar-inundation hazard zones: Geological Society of America Bulletin, v. 110, p. 972-984.
Larsen, M.C., and Simon, A., 1993, A rain-fall intensity-duration threshold for land-slides in a humid-tropical environment, Puerto Rico: Geografiska Annaler, v. 75 A, p. 13-23.
Lott, N., McCown, S., Graumann, A., and Ross, T., 1999. Mitch—The deadliest Atlantic hurricane since 1780: http://lwf.ncdc.noaa.gov/oa/reports/mitch/ mitch.html.
Muller, P.D., compiler, 1977, Mapa geológico de Guatemala, Los Amates: Guatemala, Instituto Geográfico Militar, Mapa Geológico de Guatemala, Hoja 2361 I-G, scale 1:50,000.
Newcomb, W.E., compiler, 1978, Geologic map of Guatemala, Río Hondo: Guatemala, Instituto Geográfico Nacional, Mapa Geológico de Guatemala, Hoja 2261 II G.
Nicolaus, H.J., and Muller, A., compilers, 1979, Geologic map of Guatemala, Tactic: Guatemala, Instituto Geográfico Nacional, Mapa Geológico de Guatemala, Hoja 2161 IV G, scale 1:50,000.
Paulsen, S., compiler, 1976, Geologic map of Guatemala, Cobán: Guatemala, Instituto Geográfico Nacional, Mapa Geológico de Guatemala, Hoja 2162 III G, scale 1:50,000.
Paulsen, S., compiler, 1980, Geologic map of Guatemala, Tucurú: Guatemala, Instituto Geográfico Nacional, Mapa Geológico de Guatemala Hoja 2161 I G, scale 1:50,000.
Pierson, T.C., and Costa, J.E., 1987, A rheologic classification of subaerial sediment-water flows, in Costa, J.E., and Wieczorek, G.F. eds., Debris flows /avalanches: process recognition, and mitigation: Boulder, Colorado, Geological Society of America, Reviews in Engineering Geology, v. 7, p. 1-12.
Pillmore, C.L., 1989, Geologic photogrammetry in the U.S. Geological Survey: Photogrammetric Engineering and Remote Sensing, v. 55, p. 1,185-1,189.
37

Portig, W.H., 1976, The climate of Central America, in Schwerdtfeger, W. ed., Climates of Central and South America: New York, Elsevier, World survey of climatology, v. 12, p. 405-478.
Pyles, M.R., and Froehlich, H.A., 1987, Rates of landsliding as impacted by timber management activities in northwest-ern California—discussion: Association of Engineering Geologists Bulletin, v. 24, p. 425-431.
Savage, W.Z., Coe, J.A., and Sweeney, R.E., 2001, PTCOUNT—A Fortran-77 computer program to calculate the areal distribution of mapped data points using count-circle methodology: U.S. Geological Survey Open-File Report 01-0002, 10 p., http://greenwood.cr.usgs.gov/pub/ open-file-reports/ofr-01-0002/.
Schilling, S.P., 1998, LAHARZ—GIS pro-grams for automated mapping of laharinundation hazard zones: U.S. Geological Survey Open-File Report 98-638, 80 p.
Schuster, R.L., Bucknam, R.C., and Mota, M.A., 2001, Stability assessment of a Hurricane Mitch-induced landslide dam on the Río la Lima, Sierra de las Minas, eastern Guatemala: U.S. Geological Survey Open-File Report 01-120, 7 p.
Snyder, J.P., 1987, Map projections—A working manual: U.S. Geological Survey Professional Paper 1395, 383 p.
Soeters, R., and van Westen, C.J., 1996, Slope instability recognition, analysis, and zonation, in Turner, A.K., and Schuster, R.L. eds., Landslides— Investigation and mitigation: Washington, D.C., National Academy Press, National Research Council, Transportation Research Board Special Report 247, p. 129-177.
Tobisch, M.K., 1986, Part I, late Cenozoic geology of the central Motagua Valley, Guatemala—Part II, uplift rates, deformation and neotectonics of Holocene marine terraces from Point Delgado to Cape Mendocino, California: Santa Cruz, University of California, Santa Cruz, Ph.D. thesis, 364 p.
U.S. Agency for International Development, 1999, USAID/Guatemala Hurricane Mitch Special Objective: http://hurricane.info.usaid.gov/spogua7.html.
Varnes, D.J., 1978, Slope movement types and processes, in Schuster, R.L., and Krizek, R.J. eds., Landslides, analysis and control: Washington, D.C., National Academy of Sciences, National Research Council, Transportation Research Board Special Report 176, p. 12-33.
Varnes, D.J., Radbruch-Hall, D.H., and Savage, W.Z., 1989, Topographic and structural conditions in areas of gravitational spreading of ridges in the western United States: U.S. Geological Survey Professional Paper 1496, 32 p.
Wieczorek, G.G., Harp, E.L., Mark, R.K., and Bhattacharyya, A.K., 1988, Debris flows and other landslides in San Mateo, Santa Cruz, Contra Costa, Alameda, Napa, Solano, Sonoma, Lake, and Yolo counties, and factors influencing debris-flow distribution, in Ellen, S.D., and Wieczorek, G.F. eds., Landslides, floods, and marine effects of the Storm of January 3-5, 1982, in the San Francisco Bay region, California: U.S. Geological Survey Professional Paper 1434, p. 133-162.
38