
Land Subsidence in the San Joaquin Valley, … Subsidence in the San Joaquin Valley, California, as...
103
Land Subsidence in the San Joaquin Valley, California, as of 1980 By R. L. IRELAND, J. E POLAND, and E S. RILEY STUDIES OF LAND SUBSIDENCE U.S. GEOLOGICAL SURVEY PROFESSIONAL PAPER 437-I Prepared in cooperation with the California Department of Water Resources UNITED STATES GOVERNMENT PRINTING OFFICE, WASHINGTON : 1984 C--040893 (3-040893
Transcript of Land Subsidence in the San Joaquin Valley, … Subsidence in the San Joaquin Valley, California, as...

Land Subsidence in theSan Joaquin Valley, California,as of 1980By R. L. IRELAND, J. E POLAND, and E S. RILEY
STUDIES OF LAND SUBSIDENCE
U.S. GEOLOGICAL SURVEYPROFESSIONALPAPER 437-I
Prepared in cooperation with theCalifornia Department of Water Resources
UNITED STATES GOVERNMENT PRINTING OFFICE, WASHINGTON : 1984
C--040893(3-040893

Magnitude of subsidence at a site i0 mi southwest of Mendota in the San Joaquin Valle~ Calif. Joseph E Poland, principal subsidenceresearcher and coauthor, of report, stands alongside a power pole which shows the approximate position of land surface in 1925,1955,and 1977. Land surface was lowered about 9 m during that perio<Z
C--040894C-040894

DEPARTMENT OF THE INTERIOR
WILLIAM P. CLARK, Secretary
U.S. GEOLOGICAL SURVEY
Dalla~ L. Peck, Director
L~brary of Congress Cataloging in Publication Data
Ireland, R. L.Land subsidence in the San Joaquln Valley, California, ms of 1980
(Studies of land subsidence) (Geological Survey professional paper;437-1) ¯
"Prepared in cooperation with the California Department of Water
Resources."Bibliography: p. 158-160 ~Supt. of Docs. no.: 1 19.16:437-1i. Subsidences (Earth movements)--Callfornla--San Joaquln Valley.
2. Water, Underground--Callfornla--San Joaquin Valley. I.Poland, J. F. (Joseph Falrfield)~ 1908- II. Riley, FrancisS. (Francis Stevenson), 1928- III. California. Dept. ofWater Resources. IV. Title. V. Series. VI. Series:Geological Survey professional paper ; 437-1.
GB485.C2174 1984 551.3’5 84-600081
For sale by the Distribution Branch, Text Products Section,U.S. Geological Survey, 604 South Pickett St., Alexandria, VA 22304
C--040895C-040895

CONTENTS
Pag~
Abstract- ............................................ I 1 Monitoring along the California Aqueduct. ................. 131Introduction. ......................................... 1 Aqueduct subsidence, mile 92 to mile 174_ .............. 37
General statement. ................................. 1 Aqueduct subsidence, mile 174 to mile 218 .............. 39Causes, history, and extent of subsidence ............... 3 Aqueduct subsidence, mile 238 to mile 287 .............. 41Purpose of report. ................................. 5 Elk Hills leveling. .................................. 41
_ Acknowledgments .................................5 Monitoring of compaction and change in head. ..............43Well-numbering system. .............................5 Computer simulation of aquifer-system compaction. .........46
Status of subsidence and water-level change ................7 Computer plots of field records. ..........................50Los Banos-Kettleman City area. .....................7 Compaction-subsidence ratios. ...........................53Tulare-Wasco area. .................................23 Suggestions for continued monitorln~ ....................57Arvin-Maricopa area. ...............................28 Selected reference-s. ....................................58
Establishment and releveling of bench-mark network. ........28
ILLUSTRATIONS
PLATE I. Profiles of land subsidence along the California Aqueduct in the Los Banos-Kettleman City area, south of Kettleman City,and in the Arvin-Maricopa area, California_ .......................................................... In pocket
FIGURE I. Map showing geographic features of central and southern San Joaquin Valley and areas affected by subsidence ............ I 22. Map showing land subsidence in the San Joaquin Valley, California, 1926-70 ........................................ 43. Diagram of well-numbering system_ ......................................................................... 64. Map showing land subsidence, 1926-72, Los Banos-Kettleman City area. ...................... : ................... 85. Graph showing generalized water-level profiles for the lower water-bearing zone beneath the California Aqueduct, 1943 to
1976, showing change from the 1943 level, Los Banos-Kettleman City area. ..................................... 96. Map showing location of California Aqueduct, subsidence profiles, selected observation wells, nearby bench marks, and
boundaries of principal confining beds .................................................................... 107-14. Maps of the Los Banos-Kettleman City area, showing generalized water-level contours for the lower water-bearing zone:
7. Spring and sununer 1943 ........................................................................... 118. April-May 1955 ................................................................................... 129. December 1962 ................................................................................... 13
10. December 1965 ................................................................................... 1411. December 1967 ................................................................................... 1512. January 1972 ..................................................................................... 1613. February 1974 .................................................................................... 1714. December 1976 ................................................................................... 18
15. Generalized water-level change for the lower water-bearing zone, December 1967 to February 1974, in the Los Banos-Kettl~man City area. ......................................................................... 19
16. Graph showing subsidence and artesian-head change, 10 miles southwest of Mendota, and photograph illustrating magni-tude of subsidence at this site ........................................................................... 20
17. Graph showing subsidence and artesian-head change near Cantua Creek. ........................................... 2118. Profiles of subsidence, 1943-7Z Tumey Hills to Mendota. ....................................................... 2219. Profiles of subsidence, 1943-78, Anticline Ridge to Fresno Slough_ ................................................ 23
20-24. Graphs showin~20. Long-term trend of water levels near the town of Cantua Creek, and seasonal high- and low-levels in observation
well 16flS-34N4 since 1960 ....................................................................... 2421. Seasonal fluctuations of water level in well 16/15-34N4 and measured compaction in observation well 16/15-34NI
near Cantua Creek. ............................................................................ 2422. Seasonal fluctuations of water level and measured compaction in well 14f13-11D6 southwest of Mendota. .......... 2523. Seasonal fluctuations of water level and measured compaction in well 17flS-14Q1 south of the town of Cantua Creek- 2524. Seasonal fluctuations of water level and measured compaction in well 20/18-6DI northeast of Huron_ ............. 25
25. Map showing land subsidence, 1926-70, and location of subsidence profiles, Tular~Wasco area- ........................ 2626. Profiles of land subsidence, 1957-74, from bench mark 59S, west of Woody, to 19 miles west of Delano. .................. 2727. Proi~des of land subsidence, 1957-74, from Wasco to near Lost Hills ................................................ 28
v
C--040896C-040896

~0 Graph showing |ongoterrn trend of wa~r [~ ~t~ar Pixley, and seasonal high and low artesian head in observation well P~ge.......................or.ph sho seasonal .ct.at o.s
in observation well 23/25-16N3 and measured compaction in well23/25-16N~ near Pixley ...............29
~0, Map showing |and subsidence, |926-70, ~I tll’,~i,~i|~.~r~;;~;-a~." .................. ~ .................... 30,~t, Graph showing seasonal fluctuations of w~t~r {~w[ alld measured compaction in well IIN/21W-3BI ......................31~, Map showing network of leveling by tho Nath##l~d ([e~detic Survey and three areas of detailed studies of land subsidence ....32&~, Maps showing ~xtant and times o~ levellng:
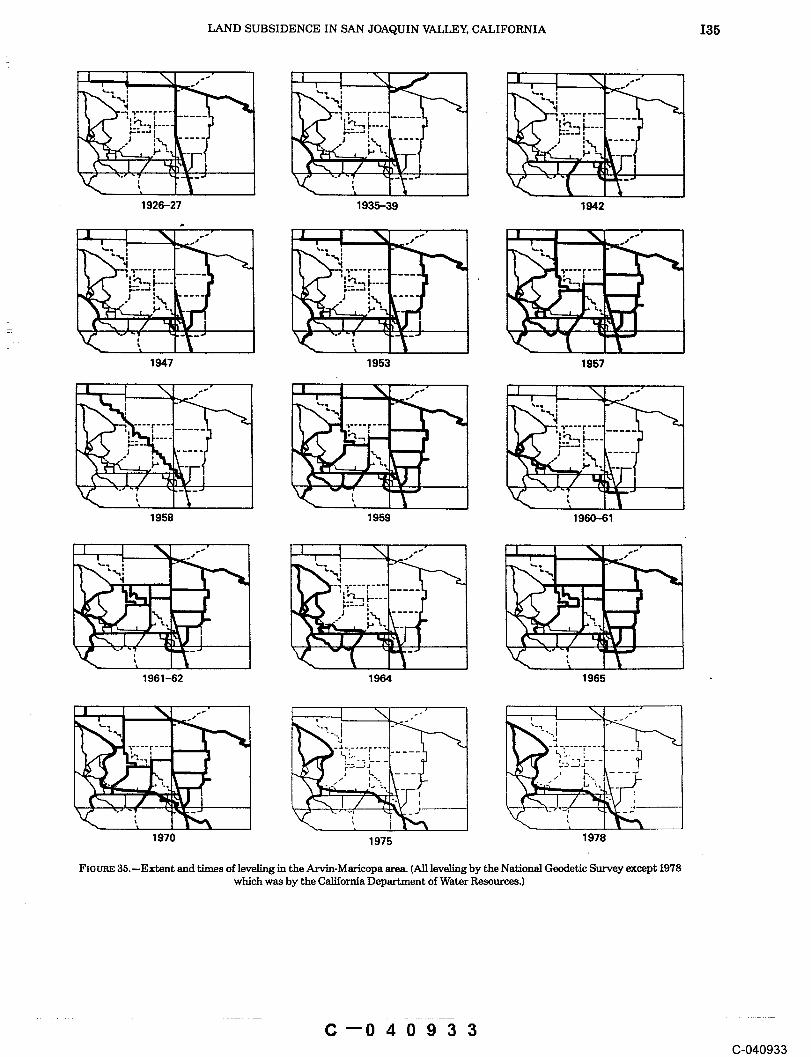
33. Los Banos-Kettleman City area...34. Tulare-Wasco area. ....... ’ ...... 3335. Arvin-Maricopa area. ..... " ......... ; .......................................................... 34
~ Map showing location of California Aqu~d~wi, ~|l~,[dence and water-level prof’des and areas of hydrocompaction in the LosBanos-Kettleman City area. .....
$~, prof’~les of land subsidence along State llJ~hw~’.: -- """ -" ...................................................... 36~ ...... ’~ ~y ~ llear Lost Hills. .......... ~ ................................... 40Map s~owmg areas o~ ~mown nYarOcompacti~t ht tlm Arvin-Maricopa area. ........................................
42Diagram of recording extensometer instali~tl~ ....................... ap o atio of and
it $tt. Con~uter plot~ showing:. ’ . ....................... 45
41. Hydrographs, compaction, and sulmkl~lt~ |I~/1’2.16H. ....................................................6242. Hydrograph, compaction, and subsld,~we, |,’I/|2-20DL ....................................................6343. Hydrogreph, compaction, and sub~kl~i~e~ |~|I~5.35D5 ..........................................
: ......... 6344. Hydrograph, compaction, and stdmJd~|~, 14/|~-I2HL .....................................................6445. Hydrographs, change in applied str~, ~’~ll~t|t~ct|on subsidence and s~-ess strain relationshi 14f13-11D
46..H.y ,drogr~ph, compaction, and subs[d~|i~, ~,~ ~,~’~ ’ i "p ............ 65
47. r~yarogr~ph of well 15/14d4Jl, depth [Jlll} ~ ................................................67
...... ¯ ......................................... 67~ Hydrograph, change in applied stress, ~llltt~act{~n, subsidence, and stress-compaction relationship 15f16-31N3 .......
684~ Hydrogr~phs, change in applied ~tre~, t~tttttpaction, subsidence, casing separation, and stress-strain relationship,16/15o 34N .....................
~ ................................~I. Hydrograph, compaction, and sub~k|,~ti~, lffi|~|’~ ~ ¯ .................................................... 73
)̄3A~. .............. r ..................................... 7352. H.vdrogr~phs, clumge in applied stre~, ~|t|tact[on, subsidence, and stress-strain relationship, 18/19-20P ...........74~. Hydrogr~ph, change in applied stre~, ~ltttt~t, tktn, subsidence, and stress-compaction relationship, 19f16-23P2 ......76~ H.~Irogrsph, compaction, and subs|d,~i~., ~41~/|8~6DL ....................................................77b~..Hydrograph, cvmpaction, stress-c~mtpmq,k~l| l~[atlonship, 20/18-11QL..i ......................................78~ H.~xirogrs~h. change in applied stress0 ~;"llt|tat, tkm, subsidence, and stress-strain relationship, 20f18-11Q3 ...........79~.-". Hydrograph. ch~mge in applied stru~, ~’~tt|t~t~t k~n, and stress-compaction relationship, 22/27-30D2. ..............81.~ .Hydrogrsphs, change in applied str~0 ~’~t~tqt*t~’tion, subsidence, and stress-strain relationship, 23/25-16N ..........82:-~. HTdrogr~phs. dmnge in applied strv~, ~’"~tt|t~c~ion, and stress-strain relationship, 23/25-16N3 and 4 ..............84~. Hzrdrogr~ph. cb, mge in applied strew,, ~tttt|tat,! kin, subsidence, and stress-compaction relationship, 24/26-34FL .....86~:~ .Hydrogr~h ~md change in applied ~tr,~ ,~ ~fV26-1A2, compaction, subsidence, and stress-compaction relationship
~ w~ll 247~3~A2.~.. H’3~n, ~ in applied strv~, ’ ........................................................... 87
~Itttt|tttt,tItlll, and stress-compaction relationship, 25/26-LA2. ............... 89~. --.=ydrogr~ns. ~ in app|led str~0 ~’~t~qt~tction, and stress-compaction relationship, 26/23-16H ................90~-~ ~~n. cY~mge in applied stress, ~’~ttP~clk~n, subsidence, and strdss-compaction relationship, 32/28-20QL .....91~._ :.-HTdro~ph, ~ and subsldu~wt~, |~N;~lW-34QL .................................................92~. --.---T~’t~’~f~n. ~ ~n app|~d str~, ~’"~l||~tw{ {~, subsidence, and stress-cempaction relationship, IIN/21W-3BL...93..~ .~--~ ~ r~h~;ivm ~/c~act~n/subside~w. r~tt~tm to depth at extensometer wells in the San Joaquin Valley .........58
! ABLES
~ Page~-- ~ ~ ~..~n~ ~.,~-~ ~ ~ n~work of |mm’h l|t~tl k~ |~ three subsidence areas by the National Geodetic Sm’vey .........
131¯ ~ d~r~ ~ tl~ joint-usv rcact~ ~{ the, California Aqueduct and estimated ground-water pumpage in the
~ ._~m~s~.~ m _-~3~m~--,~m-rfa..asuring slt~, S~tt ,hmquin Valley .............................................46~ ~ ~L~.~ n: ~r-~Tstem 48~ ~ m ~,~ ~r ~ ~r which rec~trd~ urt~ htclt|dt~d in figures 41-67 ........................................51-~ ~ ~ ~_ ~ ~ ~ fi~r perk~Js .t k*\’~lh~ in the Los Banos-Kettleman City, Tulare-Wasco, and Arvin-Mari-
54
C--040897C-040897

CONTENTS vii
CONVERSION FACTORS
The inch-pound system of units is used in this report. For readers who prefer metric (SI)units, the conversion factors for the terms used are listed below:Multiply By To obtainacre 4047 m’ (square meter)ac~ft (acre-foot) 1233 m* (cubic meter}ft {foot) 0.3048 m (meter)inch {in.) 2.54 cm (centimeter)mi (mile) 1.609 km (kilometer)mi~ {square mile) 2.590 km~ (square kilometer) "
National Geodetic Vertical Datum of 1929 (NGVD ofi929): A geodetic datum derived ~rom a gen-eral adjustment of the first~rder level nets of both the United States and Canada, formerly calledmean sea level NGVD of 1929 is referred to as sea level in this report.
C’040898C-040898

STUDIES OF LAND SUBSIDENCE
LAND SUBSIDENCE IN THE SAN JOAQUIN VALLEY, CALIFORNIA,AS OF 1980
By R. L. IRELAND, J. E POLAND, and E S. RILEY
ABSTRACT thirds of the Central Valley of California It is 250 milong, averages 40 mi in width, and encompasses 10,000
Land subsidence due to ground-water overdraft in the San Joaquin mi~ excluding the rolling foothills that skirt the valleyValley began in the mid-1920’s and continued at increasing rates untilsurface water was imported through major canals and aqueducts in theon three sides. The pertinent geographic features of1950’sandlate1960’s. In areas wbere surface water replaced withdrawalthe area discussed in this report are those in theof ground water, water levels in the confined system rose sharply andsouthern four-fifths of the valley (fig. D.subsidencesiowed or eseentially eased. Land subsidence due to ground-water withdrawalThe three major subsiding areas in the San Joaquin Valley in thisreport are the Los Banos-Kettleman City area, largely in westernbegan in the San Joaquin Valley in the mid-1920’s andFresno County; the Tulare-Wasco area, mostly in Tulare County; andlocally exceeded 28 ft by 1970 IPoland and others,the Arvin-Maricopa area, in Kern County. 1975); in December 1977, subsidence reached a maxi-
The latest areawide leveling was in 1972 in the Los Banos-Kettle-munl of 29.6 ft in western Fresno County. More thanman City area and in1969-70 in the Tularo-Wasco and Arvin-Maricopa5,200 mi= of irrigable land, one-half the entire valley,areas. The 1972 leveling in the Los Banos-Kettleman City area showedthat subsidence rates had decreased sharply with the importation ofhas been affected by subsidence.surface water through the California Aqueduct in the late 1960’s and Subsidence in the San Joaquin Valley probablyearly 1970’s. The California Aqueduct leveling showed a continued de-represents one of the greatest single manmade altera-crem.se, in the rate of subsidence along the aqueduct through 1975, fol-tions in the configuration of the Earth’s surface in theIowed by increased subsidence during the drought years of1976-77,history of man. It has caused serious and costly prob-Leveling by the LOs Angeles Department of Water and Power in theTulare-Wasco area showed that east and west of Delano, subsidencelems in construction and maintenance of water-trans-continued into 1974. In the late 1960’s and early 1970’s, water levels inport structures, highways, and highway structures;wells recovered to levels of the1940’s and1950’s throughout most of thealSO many millions of dollars have been spent on thewestern and southern parts of the valley; in response to decreasedrepair or replacement of deep water wells.°Suhsidence,ground-water withdrawals because of the importation of surface waterbesides changing the gradient and course of valleythrough the California Aqueduct. Concurrently, the borehole extensom-eters recorded decreasing compaction rates. By the mid-1970’s, compac-creeks and streams, has caused unexpected flooding,tion had diminished to near zero at some sites, costing farmers many hundreds of thousands of dol-
Data collected at water-leval and extensometer sites during thelars in recurrent land leveling.1976r77 drought showed the effect of the heavy demand on the ground- Not all the effects of subsidence due to ground-wa-water reservoir. With the water of compaction gone, artesian head de-ter withdrawal have been negative. Benefits attribut-dined 10 to 20 times as fast as during the first cycle of long-termdrawdown that ended in the late1960’s. Extensometersmeasuredcom-able to or associated with subsidence include: (1) Thepaction ranging from 0.1 to 0.5 foot in 1977. In 1978-79 water levels re-tremendous volume of water of compaction released tocovered to or above the 1976 predrought levels. Extensometer responsewells as subsidence progressekt; thus, water levels de-ranged from compaction of a few hundredths of a foot to expansion ofalined more slowly, and pumping Rfts were less thannearly0.20 foot. wou~d have occurred if comparable volumes had been
The report suggests continued monitoring of land subsidence in thewithdrawn from a less compressible aquifer system;San Joaquin Valley, utilizing extensometers, water-level recorders ormeasurements, and periodicreleveling, the compressible deposits of the ground-water reser-
voir have been "preconsolidated" by earlier pumpingstresses--rapidly draining beds to the maximum
INTRODUCTION stresses of the mid-1960’s, slowly draining beds toGENERAL STATEMENT some lesser stress; within the range of stresses in
which preconsolidation has actually been accom-The San Joaquin Valley (fig. 1) is a broad alluvi- plished--which can only be determined by precise field
ated structural trough constituting the southern two measurements--the ground-water reservoir can be
I1
C--040899(3-040899

.~ ~ O~AtL~ OF LAND SUBSIDENCE
managed for cyclic stor.~ without appreciable future ~ and storage characteristics of aqug~ ~ unchr asubsidence; 13) the ba~|a has provided a field labora-] wide range of loading stresses.
tory for testing compro~i~m characteristics of complex After many years of continued ~r~ declineaquifer systems on sita S~d for measuring mechanicaland subsidence, water levels ~ becm~ of the
EXPLANATION ~"~6¯
Outline of vallevDrown chle~y on boundalyo~ consolidated rock~
A~a where subsldenc~ du~to water-level decllnu ~~re than 1 foot
A~a of subsidence due tohvdrocompactlon
Area of Ii~le or no ....35" subsidence
~roximate boun~rv o{ ’ "":’:’:"’" SANp~ncipal confining EM~D~ =====================~d where known ~S
0 10 20 ~ ~ ~ 60 KILOME~RS
0 10 20 ~ ~ MILES
Figta-e L--Geographic features of c~tr.I .nd southern San Joaquin Valley and areas affected by subsidence. Base from U.S. ~ Sur-vey, 11,000,000, State of California map, 1940.
C--040900C-040900

LAND SUBSIDENCE IN SAN JOAQUIN VALLEY, CALIFORNIA I3
importation of surface water and the decrease of Subsidence due to hydrocompaction has occurred inground-water pumping in the late 1960’s and 1970’s.two areas west and southwest of Mendota (Bull, 1964a), aThen, during the drought of 1976-77, heavy ground-smallareajustsouthofKettlemanCity(notshowninfig.water pumping caused renewed subsidence, and water1), and in five areas south and southwest of Bakersfieldlevels declined at a much faster rate than during the.(California Department of Water Resources, 1964, pl. 2;first period of decline because of the reduced storageLofgren, 1975, pl. 3C). The total area known to be suscep-capacity due to compaction of the compressible mate-tible to hydrocompaction is about 225 mi~, of whichrials in the aquifer system, about 145 mi~ is north of Kettleman City (Prokopovich,
1970).CAUSES, HISTORY, AND EXTENT OF SUBSIDENCE The magnitude and extent of land subsidence in the
San Joaquin Valley (fig. 2) from 1926 to 1970 has beenFour types of subsidence occur in the San Joaquincompiled from topographic maps and leveling datm
Valley. In order of decreasing magnitude, they are (1) sub- Agricultural development in the San Joaquin Valleysidence caused by water-level decline (ground-water over-has been intensive, especially since World War II. In thedraft) and consequent compaction of aquifer systems, (2)eastern part of the valley, from Kings River to the north,subsidence related to the hydrocompaction~ of moisture-surface streams from the Sierra Nevada supply most ofdeficient deposits above the water table, (3) subsidencethe water for irrigation but the surface streams are sup-related to fluid withdrawal from off and gas fields, and (4)plemented by ground water, especially after midsummersubsidence caused by deep-seated tectonic movements,when streamflow is deficient. From Kaweah River to theA fifth type, subsidence caused by the oxidation andsouth--except for the Kern River and its alluvial fan--compaction of peat soils, occurs in the Sacramento-Sanand in the west~entral area from Mendota to KettlemanJoaquin Delta area. City, local surfac~water supplies have been small to neg-
The primary causes of subsidence in the San Joaquinligible. Prior to the construction of major canals or a~ue-Valley are aquifer-system compaction due to water-levelducts, irrigation was almost wholly from thousands ofdecline and near-surface hydrocompaction. The data pre-large and deep irrigation wells; conditions of ground-wa-sented in this report are mostly related to these twoter overdraft had prevailed since the 1930’s. Extractionstypes of subsidence. The areas (fig. 1) affected by subsid-of ground water in the San Joaquin Valley for irrigationence caused by water-level decline and hydrocompactionincreased from 3 million acre-ft in 1942 to at least 10 rail-are principally in the western and southern parts of thelion acre-ft in 1966 (Ogilbee and Rose, 1969a, 1969b; Mit-valley where runoff from surface streams is minimal, ten and Ogilbee, 1971).
Most of the subsiding area in the San Joaquin Valley Importation of surface water to areas of serious over-is underlain by a continuous and extensive confining bed;draft on the east side of the valley began in 1950 whenand most of the pumping overdraft and compaction duewater from the San Joaquin River was brought southto head decline occurs in the confined aquifer system be-through the Friant-Kern Canal, which extends to theneath this bed. The approximate boundary of the confin-Kern River (fig. 1). The average annual delivery from thising bed, where known, is shown in figure 1 (Lofgren andcanal is about 1 million aere-ft. Of this total, an average ofKlausing, 1969; Miller and others, 1971; Croft, 1972).750,000 acre-ft per year was delivered to irrigation dis-North of Wasco, the confining bed is the Pleistocene Cot-tricts in the Tulare-Wasco area from 1956 through 1972coran Clay Member of the Tu]are Formation, which also(Poland and others, 1975, table 4).has been called the E-clay by Croft (1972). The boundary Surface-water imports to the northwestern part ofof the confining bed (fig. 1) conforms fairly closely withthe area from the Sacramento-San Joaquin Delta via thethe area affected by subsidence, except in the semicon-Delta-Mendota Canal began in the early 1950’s. Aboutfined system east of Delano (Lofgren and Klausing,two-thirds of the water in the Delta-Mendota Canal that1969). For convenience, the unconfined to semiconfinedis transported southward to the San Joaquin River at thewater-bearing deposits above the confining bed are re-Mendota Pool is used by west-side irrigation companiesferred to as the upper water-bearing zone and the con-in exchange for water formerly taken from the Sanfined system beneath the confining bed as the lowerJoaquin River, thus releasing rights to water behindwater-bearing zone. Friant Dam for east-side deliveries through the Friant-
Kern Canal. The remaining one-third of the water fromthe Delta-Mendota Canal is delivered to irrigation con-
~Hydrocompaction is the process of volume decrease ~nd density increase that occurstractors along the canal (William R. Cooke, U.S. Bureauwhen moisture-deficient deposits become compacted as they are wetted for the first time
of Reclamation, oral commun., 1981).since bm’ial |Prokopovich, 1963; Lofgren, 1969, p. 273). The vertical downward movement of~ land ~ that ~ ~o~ t~ pro~s h~ ~n c~d "s~Uow anb~d~ce" ~n~r- From 1968 to 1971, when surface water from the Cali-Agency Committee on Laud Subsidence in the San Joaquin Valley, 1958, p. 22} and "near-surface subsidence" (Lofgren, 1960; Bull, 1964a). fornia Aqueduct became available to deficient areas on
C--040901(3-040901

the west ~ and to the south end of the valley; extrac-100,000 acre-ft annually. Ground-water levels began to re-.t~ns ofgrotmd water decreased. Ground-water pumpagecover in those areas during 1969-71 and subsidence ratesm the S~n Joaquin Valley as a whole decreased 1 to 2decreased.million ac~e-ft a year from 1969 through the early 1970’s During the drought years, 1976-77, surface water{Mitten, 1976). From 1974 through 1976, pumpage in thewas in short supply; and many new wells were drilled andLo~ Banos-Kettleman City area averaged less thanold wells were reactivated. Estimates by Harris [Pacific
121 ° 120" 119 ° 118°
I
FRESNO°
EXPLANATION
Outline of valleyDrawn chiefly on boundary
of consolidated rocks
Line-of equal subsidence, in feetInterval variable. Compiled from comparison of
Geological Survey topographic maps prior to about1955 and :ub 7equent levelin~ of National GeodeticS, ur~.e,y. $out~ of Bakersfield, compiled wholly from
MTSI::MIGDIO =====================
Mq’S0 5 10 15 20 25 30 KILOMETERSJ l ~ I II
I ii I
o s ~o ~s ~o M~S
FIOUR~: 2.--Land subsidence in the San Joaquin Valley, California, 1926-70. Base from U.S. Geological Survey, 1:1,000,000, State of Catiforaiamap, 1940.
C--040902(3-040902

LAND SUBSIDENCE IN SAN JOAQUIN VALLEY, CALIFORNIA I5
Gas and Electric Co.l (1977) and the Geological Survey The purposes of this report are {1) to review the sta-indicated a steady increase in ground-wa~er pumpage fortus of water-level trends and of subsidence in the Santhe entire San Joaquin Valley from 9V2 million acre-ft inJoaquin Valley through 1979; (2) to present updated wa-1974 to 13 million acre-ft in the drought year 1977. In theter-level, compaction, and subsidence data; 13) to presentLos Banos-Kettleman City area pumpage increased toprofiles of land subsidence along the California Aqueduct470,000 acre-ft, and surface-water deliveries werebased on relevelings since the 1967 or 1970 base leveling,308,000 acre-ft in 1977 compared to 1,337,100 acre-ft inin order to define the extent and magnitude of subsidence1976 (U.S. Bureau of Reclamation, 1978}. that has occurred along the aqueduct and to identify
During 24 years that subsidence and water-levelprobable causes where practicable; and (4) to propose adata were collected, water levels were drawn down to his-continuing surveillance program for monitoring areas oftorical lows in the late 1960’s causing subsidence ratescontinuing or potential subsidence, with special atten-that locally exceeded 1 ft per year. After the delivery oftion to conditions along and near the California Aque-surface water, heads recovered in the middle 1970’s to lev-duct in the San Joaquin Valley. The report incorporatesels of the 1940’s, and subsidence nearly ceased. Duringfield data through December 1979.the drought of 1976-77 renewed demand was imposed onthe aquifer systems. The resulting second cycle of head ACKNOWLEDGMENTSdecline proceeded much more rapidly than the first cyclebecause the water of compaction produced by each foot The writers acknowledge the cooperation of Federal,of head decline was only a small fraction of that producedState, and local agencies, irrigation districts, privateduring the first cycle. Associated with the rapid head de-companies, and individuals. Leveling data used in thecline were subsidence rates typical of those observed dur-preparation of the various subsidence maps and graphsing the late 1960’s. and in calculating magnitude and rates of subsidence
In 1980, when seasonal rainfall was above normalwere almost all by the National Geodetic Survey, a corn-and surface water was available, ground-water levels re-ponent of the National Ocean Survey {formerly the U.S.covered above their pre-drought levels and subsidenceCoast and Geodetic Survey); the 1977-78 leveling alongrates again were low. the California Aqueduct was by the California Depart-
This report is an update of an earlier work. It con-ment of Water Resources.tains data on fluctuation of water levels, associated com- Water-level data used in this report were chiefly frompaction and expansion of the aquifer systems asfield measurements made by the Geological Survey, butmeasured in extensometer wells, and subsidence of thesome records were from the U.S. Bureau of Reclamation,land surface since 1970. Basic-data graphs and computer-the California Department of Water Resources, Pacificplotted stress-strain relationships constitute a majorGas and Electric Co., and irrigation districts. Many Sur-part of this report. They are based on 8-24 years of de-vey workers have contributed to this continuingtailed field measurements of both water-level change andprogram.compaction collected by the U.S. Geological Survey at 24selected locations in the San Joaquin Valley. WELL-NUMBERING SYSTEM
The well-numbering system (fig. 3) used in CaliforniaPURPOSE OF REPORT by the Geological Survey and the State of California
shows the locations of wells according to the rectangularThis report is part of a study of land subsidence insystem for the subdivision of public lands. For example,
California in cooperation with the California Departmentin the number 12/12-16H2, the part of the number preced-of Water Resources; the study has been closely interre-ing the slash indicates the township (T. 12 S.}, the partfated with a Federal research investigation of the me-between the slash and the hyphen shows the range (R. 12chanics of aquifer systems. Subsidence in the SanE.), the number between the hyphen and the letter indi-Joaquin Valley has been studied in this cooperative pro-cates the section (sec. 16), and the letter following the sec-gram since 1956. The Geological Survey published a r~tion number indicates the 40-acre subdivision of theport by Poland and others (1975) that summarized landsection. Within each 40-acre tract, wells are numberedsubsidence in the San Joaquin Valley through 1972. Theserially as indicated by the final digit of the well number.report also contained an annotated bibliography of theThus, well 12/12-16H2 is the second welllisted in the SE ¼principal published reports resulting from the two re-of the NE¼ of sec. 16, T. 12 S., R. 12 E. Except for thesearch studies. The reader interested in learning moreextreme south end of the valley, which is referenced to theabout the scope and findings of those reports is referredSan Bernardino base and meridian, all wells are refer-to Poland’s annotated bibliography, enced to the Mount Diablo base and meridian.
C--040903(3-040903

In this report wells referenced to the Mount Diablowall number for brevity. Wells referenced to the Sanbase and merkiian are all located south and east of theBemardino base and meridian are all north and west ofbase and merkiian, making all township numbers souththe base and meridian and are identified by inclusion ofand a/1 range numbers east. Therefore, as in the examplethe abbreviations N and W in the township-and-rangea/rove, the abbreviations S and E are omitted from thepart of the well number.
F~GURE 3.--Well-numbering system.
C--040904C-040904

LAND "SUBSIDENCE IN SAN JOAQUIN VALLEY, CALIFORNIA I7
STATUS OF SUBSIDENCE AND Banos-Kettleman City area are locally less permeableWATER-LEVEL CHANGE than the deposits forming the semiconfined aquifer sys-
tem of the upper zone. Before surface water was importedLOS BANOS-KETTLEMAN CITY AREA into the Los Banos-Kettleman City area via the Califor-
nia Aqueduct, at least 75-80 percent of the irrigation wa-Land subsidence due to water-level decline in the Loster pumped in the area was from the lower zone (Bull and
Banos-Kettleman City area was reported in GeologicalMiller, 1975} because of the greater thickness of the lower-Survey publications by BUll and Miller (1975), Bull (1975},zone deposits and the generally poorer quality of the wa-and Bull and Poland (1975); a report by Poland and otherster in the upper zone.{1975) updated and summarized subsidence in this area.Seven generalized water-level profiles for the lowerLocation of the area, A, is shown in figure 32. water-bearing zone beneath the California Aqueduct
Land subsidence due to hydrocompaction in the Losfrom 1943 to 1976 in the Los Banos-Kettleman City areaBanos-Kettleman City area was reported by Bullshow the changes from the 1943 level (fig. 5; see fig. 36 for(1964a). location}. These profiles show the water levels declining
The hydrogeology of the ground-water reservoir infrom 1943 through 1967, then recovering to 1976 (usingthe Los Banos-Kettleman City area was described by1943 as a base}. The water-level data on these profiles,Miller and others (1971}. when compared with the subsidence data on plate 1, show
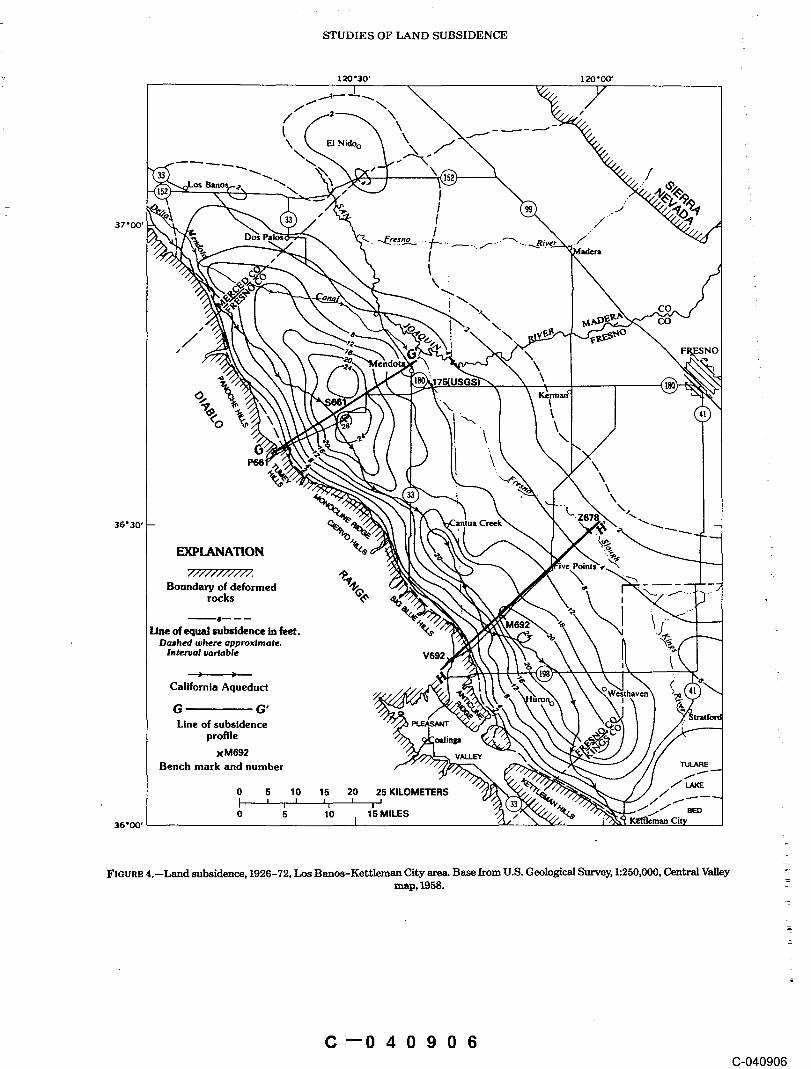
Land subsidence in the Los Banos-Kettleman Citythe changing stresses that produce subsidence or re-area reached a maximum of 29 ft in 1972 and 29.6 ft inbound. These profiles were prepared using maps of the1977. Figure 4 shows the historic subsidence in the Lospotentiometric surface of the lower water-bearing zoneBanos-Kettleman City area from 1926 to 1972, the last(figs. 7-14), constructed by the Geological Survey. Theareawide leveling in the Los Banos-Kettleman City area.water-level contour maps were overlaid on the CaliforniaThe maximum subsidence of 29 ft occurred southwest ofAqueduct alinement and elevations of the potentiometricMendota (within the 28-ft subsidence contour). Three ma-surface were plotted at selected distances along the aque-jot subsidence depressions, alarge area south and west ofduct alinement. Water-level changes at the selected dis-Mendota, an area south and west of the town of Cantuatances were determined by subtracting the 1943Creek, and a large area in the vicinity of Huron, aU showwater-level elevation from the plotted elevation for themore than 20 ft of subsidence. The California Aqueductpotentiometric surface for each of 7 years.traverses all three of these major subsidence depressions.Figure 6 shows the location of subsidence profilesAdditional leveling data are available in the area alongalong and near the California Aqueduct, selected obser-the California Aqueduct and will be discussed later (pl. 1).vation wells, nearby bench marks, and boundaries of theThe aqueduct profiles show substantial subsidence alongprincipal confining beds in the valley.the aqueduct during construction, and decreased subsid-The generalized water-level contours on the potenti~ence after 1968 because of increasing importation of sur-metric surface of the lower water-bearing zone at sevenface water, then increased subsidence during the droughttimes from 1943-76 in the Los Banos-Kettleman Cityyears 1976-77. area are shown in figures 7-14. The water-level maps were
As stated earlier, the unconfined to semiconfined wa-constructed using the topographic elevations mapped inter-bearing deposits above the principal confining bedthe 1920’s; the continuing land subsidence was not sub-are referred to as the upper water-bearing zone, and thetracted from the water-surface elevation except on theconfined system beneath the confining bed as the lower1974 map (fig. 13) where the 1926-72 subsidence (fig. 4)water-bearing zone. The upper water-bearing zone has ahas been subtracted. Thus, the 1974 map shows the ap-water table, and locally the water is unconfined. Theproximate true elevation of the water surface in wells tap-most permeable aquifers in the Los Banos-Kettlemanping the lower zone.City area are in the upper water-bearing zone but are of After the California Aqueduct was completed andlimited extent. Ground water of the upper water-bearingsurface water became available in 1968, many wells werezone generally contains high concentrations of calcium,abandoned, destroyed, or taken out of service for eco-magnesium, and sulfate, except near Fresno Slough IBullnomic reasons. Representative water-leve| measure-and Miller, 1975). ments became more difficult to obtain. Many of the
The lower water-bearing zone is confined by the Cor-casings of the older wells were broken due to compactioncoran Clay Member of the Tulare Formation except in theand compressive failure; some were cut off, capped orsouthwestern part of the Los Banos-Kettleman Cityburied. The large recovery in artesian head in the lowerarea where the Corcoran Clay Member is absent and con-water-bearing zone from 1967 to 1976 almost equalizedfinement is poor or lacking. Deposits forming the lowerwater levels in the upper and lower water-bearing zoneswater-bearing zone aquifer system in the Losin some parts of the area, making it increasingly difficult
C--040905C-040905
STUDIES OF LAND SUBSIDENCE
\
36"30’
EXPLANATION
Boundary of deformed ~’,~ ~*rocks v~,, ,
Line of equal subsidence in feet.Dashed where approximate,
Interval variable V692
California Aqueduct
G G’Line of subsidence
profilexM692 V~.LEY
Bench mark and number TULXRE
0 5 10 15 20 25 KILOMETERS
0 5 10 1~ MILES B~D36°00° J
FIC-UP.E 4.--Land subsidence, 1926-72, Los Banos-Kettleman Cit.y area. Base from U.S. Geological Survey, 1:250,000, Central Valleymap, 1958. :
C--040906(3-040906

FIGURE 5.--GeneraE_~ed water-level profiles for the lower watePbearing zone beneath the California Aqueduct, 1943 to 1976, ~howing change from the1943 level, Los Banos-Kettleman City area.

10 STUDIES OF LAND SUBSIDENCE
o construct an accurate water-level map for the lowerwater levels recovered as much as 200 ft in the 6 yearsrater-bearing zone. During the 1976-77 drought, how-from 1967 to 1974.,ver, many new wells were drilled and many of the old The measured subsidence at .bench mark $661 andyells were repaired and reactivated, artesian-head change in nearby wells, 10 mi southwest of
A map (fig. 15) of the water-level changes shows thatMendota, from 1943 to 1977 is shown in figure 16 (see fig.
121" 120" 119" 118"
: S.
20 E.
o ~ I= anm T, o~’,~s report
R.25E, ~
15Cantua S.
EXPLANATION
Outline of valley R .15 E.Druwn chle]l~ on boundar~ of
consolidated rocks [111= R. 30 E.
Approximate boundaries of Cprincipal confining bedswhere known
T.o3B1 30
S.Observation well and number I~ T.
R.20 E.MT DIABLO BASE
x $661 SAN BERNARDINO T. 1 R. 32 E.35" Bench mark and number BASE T. 11 N. --
~ R. 25 W.::i: TEHACHAPIA B ": 0 MTS
EMIGDIOLine of subsidence profile MrS0 10 20 30 40 50 60 KILOMETERS
0 10 20 30 40 MILES
FmUI~E 6.--Location of California Aqueduct, subsidence profiles, selected observation wells, nearby bench marks, and boundaries of principalconfining beds.
C--040908C-040908

LAND SUBSIDENCE IN SAN JOAQUIN VALLEY, CALIFORNIA Ill
120°30’ 120=00,
37°00’ /
Madera
Firebaugh
FRESNO
36°30,
Ooo
EXPLANATION Five Points
~////////////,///////~Boundary of deformed rocks "~P :"
Water-level contour ~,Generalized contour on the potenti.
ometrfc surface ol the lower water-
beor~ng zone; daahed where approx- .:Imately located. Contour Interval 25feet. Datum Iz sea level. Subsidencearea: land--~urface altitudes u~ed Incomputations are from theGeologlca! Survey topographicmap series of I919-~2 \
VALLEY TULARELAKE
0 5 10 15 20 25 30 KILOMETERS BED
0 5 10 15 MILES
36°00 ] ~ettleman City
FIGURE 7.--Generalized water-level contours for the lower water-bearing zone, spring and summer 1943, in the Los Banos-Kettleman City area.Base from U.S. Geological Survey, 1:250,000, Central Valley map, 1958.
" C--040909(3-040909

C--04091 0(3-040910

LAND SUBSIDENCE IN SAN JOAQUIN VALLEY, CALIFORNIA I13
120"30’
37000, %_% / //"Frem, m 0°°
Madera
Firebaugh
0
C--0409i 1C-040911

STUDIES OF LAND SUBSIDENCE
120030, 120"00"
Los Banos ~ "~
Madera
Firebaugh
¢o
FRESNO
o
’ Five PointsEXPLANATION
~////////////////////~ 6> ~ :.Boundary of deformed rocks .q \
Water-level contour ~ ° r~ff.~Generalized contours on the potenti-
ometr~c surfoee of the lower water-beadng zone; dashed where opprox-lmate. Measurements represent ap.proximate high level for the 1965-66 winter season. Contour interval25 feet. Datum is sea level. Subsld.ence area: land-surface altitudesused in computations are from theU.$. Geological Survey topographicmap series of 1919-~2 VALLEY TULARE
/I5 10 15 20 25 30 KILOMETERS BED},., I i I I, } ,I I
5 10 15 MILES
Kettleman City
10.--Generalized water-level contours for the lower water-bearing zone, December 1965, in the Los Banos-Kettleman City area. Base fromU.S. Geological Survey, 1:250,000, Central Valley map, 1958.
C--04091 2(3-040912

LAND SUBSIDENCE IN SAN JOAQUIN VALLEY, CALIFORNIA I15
120"30’ 120=O0 °
Los Sanos @
"~ .-"37°00’ / /~"
Firebaugh
~o
/ FRESNO
J \
36"30’
% \EXPLANATION Points ;’~
Boundary of deformed rocks ,~ :.
,~5Water-level contour
Generull=ed contour on the potentLomefffc sur~ce of the lower water-bearing zone; dalhed where approx.Imately located; queried wheredoubtful. Contour interval 25 feet.Datum Is sea level. Subeldencearea: land-~urface Mtltude~ u~edcomputatfons are ~rom the U.S.
PLEASAN’I |Geological Survey topographic ~
t\
map =eriem of 1919-32VALLE TULARE
0 5 10 15 2Q 25 30 KILOMETERS LAKEI BED
I I I (
II
I
0 5 10 15 MILES
36"00 I Kettleman City
FIGU~.E 11.--Genera].ized wat~r-]eve] contou~rs for the lower wa~r-bea~L~g zone, December 1967, ~ the Los Ba~os-~ett]ema~ City a~ea. B~se fromU.S. Geological Survey, 1:250,000, Central Valley map, 1958.
C--04091 3C-040913

STUDIES OF LAND SUBSIDENCE
Firebaugh
~o
~uaz 12.--Generalized wate~level contours for the lower water-bearing zone, January 1972, in the Los Banos-Kettlemau City area. Base fromU.S. Geological Survey, 1:250,000, Central Valley map, 1958.
C--04091 4C-040914

LAND SUBSIDENCE IN SAN JOAQUIN VALLEY, CALIFORNIA I17
120~30’ 120=00 ’
Los BanGs G
37"00’ / //"
Madera
Firebaugh
co
/ FRESNOMendota
Creek
EXPLANATION \..
"/////////////////////~ \Boundary of deformed rocks \
.25,Water-level contour "~7 \
GeneralL~ed contour on the poten-~
¯
tlometr~c surface oJ the lowerwater-bearing zone; dashed whereapproximately located. Contour In-renal 25ft. Datum Is ~ea level. Sub- I
sldence area: land-~urface altitude~u~ed In computotion~ are from theU~. Geological Survey topograph. Huron ¯[c map sedes oJ 1919-~2 mlnu=the 192~-72 subsidence making thisthe approximate true elevation oJ \the wa~er surface a~ of 1974
VALLEY TULARELAKE
0 5 10 15 20 25 30 KILOMETERS BEDl I ) I I, I il I
0 5 10 15 MILES
36"00 l Kettleman City
FIGURE 13.--Generalized water-level contours for the lower water-bearing zone, February 1974, in the Los Banos-Kettleman City area. Base fromU.S. Geological Survey, 1:250,000, Central Valley map, 1958.
C--04091 5C-040915

8 STUDIES OF LAND SUBSIDENCE
120°30’ 120°00’
Los Banos ~
/ ~°°°F~no
Madera
Firebaugh
/ \ FRESNO/ \ \,
o \\
Creek
EXPLANATION /
Boundary of deformed rocks ~/ \
Water-level contourGeneralized contour on fl~e potentf-
~"
I Iomeb’fc surface o~ the lower water-bearing sone; dashed where opprox-Imotelp lo~ated. Contour interval 25and 50 j~et. Do,urn is sea level. ~uronSubsldence area: land surface of-t~t~des u~d In ¢omputot~ons are[rom the U~.Geologlcal Surve~ top-ographic map ~e~ o~ 1919~2
~RE
0 5 10 15 20 25 30 KILOME~RS BEDI I I I I~ I i] I
0 5 10 15 MILES
K~leman
14.--G~ wa~P]ev~ ~n~ for ~eU.S. G~]o~ S~e~ 1:250,000, ~ V~ map, 1958.
C--04091 6(3-040916

LAND SUBSIDENCE IN SAN JOAQUIN VALLEY, CALIFORNIA I19
120~’30’ 120"00’
Los Banos ~
37°00, / //Fresno ""
~adera
Firebaugh
FRESNO
Points
EXPLANATION ~ :"
~////////////////////~Boundarv of deformed rocks
Water-level contourLine of equol ~ter-level ctmn~e, 1967-
1974; dashed where n~pro~motel~located. Contour Interval 25 feet
Coalinga \
VALLEY TULARELAKE
0 5 10 15 20 25 30 KILOMETERS BED] 1 ~ 1 1= I ,I0 5 10 15 MILES
~ett|eman City3S’00’
FZGU~.~. 15.--Genera]Jzed wat~r-leve! cha~ge for the lower wa~r-bea_d~g zone, December 1967 t,o Februaz7 1974, J~ the Los Ba~os-Ket, t, lema~ CJ~ym-ea~ Base from U.~. Geo!ol~ca] Sm’vey, 1:250,000, Ce~;raJ Valley map, 1958.
C--04091 7C-040917

6 for location}. Measured change of 27.13 ft at this benchnear the town of Cantua Creek {see fig. 6 for location)mark since 1943, plus 2.5 ft of topographic change fromchanged remarkably during the years from the 1950’s totixe ~L92(}’s through ~943, make this the locus of maximumthe 1960’s. When surface water was imported to replaceknown subsidence in the San Joaquin Valley. The arte-pumpage from wells, water levels rose and the rate of sub-~ian-head decline through 1967-68 illustrates the increas-sidence decreased markedly in the early 1970’s. The rateing stress causing the subsidence. As the artesian headof subsidence in 1976-77 was nearly double that ofrecovered, subsidence rates became progressively lower.1973-75. Evidently, drawdown was substantial in 1977,the bar graph of the subsidence rate clearly shows thebut, unfortunately, the water level in well N1 was not mea-~ffect of the importation of surface water in the latesured in 1977.t960’s and 1970’s. The yearly subsidence rate in 1969-72The historical subsidence southwest of Mendota and~as only about one-third that of 1966-69. During thealong Five Points Road from 1943 to 1977-78 is shown inirought years of 1976-77, subsidence rates averaged 0.12the two transverse subsidence profiles Ifigs. 18 and 19; see:t per year; at this site the water-level drawdown of 120 ftfig. 4 for locations). Water-level decline along both pro-n 1977 was not sufficient to increase the rate offiles was the sole cause of the subsidence (Poland and oth-,ubsidence. ers, 1975). Profile G-G’ Ifig. 18), which extends from the
The magnitude of subsidence at this site, 9 m, fromfoothills of the Diablo Range through Mendota, passes:925 to 1977 is shown in figure 16. The photograph, takenclose to the site of maximum subsidence lbench markn 1979 by the U.S. Geological Survey, shows the approxi-$661}. Profile H-H’ (fig. 19}, which extends northeast-hate position of land surface in 1925, 1955, and 1977.ward along the Five Points Road from Anticline Ridge to
The artesian head and the rates of subsidence Ifig. 17)Fresno Slough, passes close to bench mark M692, the site
~ Subsidence,~- bench mark :.~ $661
~ 25E~*~ /
- , ,,~ loNI\
Static level, E2/
Pumping~ Winter ~level N high I
20
E2, and 25EI
700 25
I
0 ’;"1940 1950 1960 1970 1980
;UPS 16.--Subsidence and artes:i.an-bead change, 10 m~es southwest of Mendota, and photograph illustrat~g mag-.nJtude of suhs~.de~ce a~ ~}dssite. Joseph Poland of the U.S. Geological Survey is pictured standing by the powerpole.
C--04091 8C-040918

LAiND SUBSIDENCE IN SAN JOAQUIN VALLEY, CALIFORNIA I21
ofma,vAmum subsidence on this profile, 21.2 ft, from 1943files show decreasing subsidence in the 1970’s as more~o 1972. This bench mark was not leveled in 1975 orwater was imported into the Los Banos-Kettleman City1977-78. Both profiles show subsidence dux-ing nine peri-area.ods since 1943 and two partial relevelings in 1975 andThe long-term trend of water levels in the confined1977-78 (California Aqueduct leveling, 1977-78}, usingaquifer system near the town of Cantua Creek from 1905the 1943 control as a horizontal reference base. The pro-to 1964 and the seasonal high- and low-water levels at the
~o0
Subsidencebench mark Y883,
1954-72 and~ L885, 1972-78 ~Oo_o,
e level, N1 ~
~7~ ~ 10 ~
O
Water level, wells17/1~21N1, Q1
and 22E1 ~
0194o 195o 196o 1970 198o
FIGURE 17.--Subsidence and artesian-head change near Cantua Creek.
C--04091 9C-040919

STUDIES OF LAND SUBSIDENCE
location in observation well 16/15-34N4 for 1961-80 At the extensometer site 16flS-34Nl near Cantua,own in figure 20 {see fig. 6 for location}. IrrigationCreek, there was an abrupt water-level recovery in wellin this area pump principally from the confined aq-16/15-34N4 following the importation of canal water to~ystem, and observation well 16/15-34N4 is perfo-the area in 1968, and a corresponding gradual cessationin the 1,052- to 1,132-ft depth range in the confinedof compaction (fig. 21; see fig. 6 for location}. Water-levelm. This site is in the trough of maximum subsid-data are from the same site as in figure 20. Water levelsabout 20 mi south of Mendota (fig. 4}. The rate ofrecovered until the drought years of 1976-77, then whenle accelerated from 1905 to 1960; water levels de-the surface-water deliveries stopped, the water levelsi nearly 500 ft. In the early 1960’s, the seasonal lowwere drawn down by intensive pumping of ground water; in the confined aquifer system started dipping be-and the compaction rate for 1977 increased to about thathe base of the clay confining layer. These seasonalof 1970. The extensometer measured a net compaction ofhad a marked effect on the storage characteristics of0.42 ft in the drought year 1977. In 1978 when surfacequifer system. With little or no change in pumpingwater was again available, water levels recovered to pre-;rn, water levels declined very little from 1960 todrought levels, and the extensometer measured a net ex-when canal imports caused an abrupt decrease ofpansion of 0.06 ft. The extensometer measured 0.01 ft ofnd-water pumpage and water-level recovery began,compaction in 1979.~ 1968 to 1976 water levels recovered rapidly about At three other extensometer sites in the Losft, mostly because of reduced pumping rates. ThisBanos-Kettleman City area--southwest o:f Mendotaall trend is rather typical of the heavily pumped ar-(fig. 22}, south of the town of Cantua Creek (fig. 23}, and~f the western and southern parts of the valley, butnortheast of Huron (fig. 24} (see fig. 6 for location}--a sim-lrawdown below the base of confinement is typical offlar trend of water-level recovery and decrease in meas-a few of the most heavily pumped areas. The unwa-ured compaction @as recorded, followed by an abrupt wa-ng below the base of the confining layer indicates ater-level decline a~d renewed compaction during the 1977Etion that could prevail in much of the valley if over-drought. All four! figures {figs. 21-24} show comparable~ continued (Bull and Miller, 1975, fig. 34}. records of measured compaction in response to change in
G -~ ~ G’TUMEY ~lHILLS ~ %9" Mendota
~’661 $661 APRIL 1943 ! 175 (USGS)
Fe~rua~ 1947 ~
8 --
24 ~
~o~75~
0 4 8 12 16 20
DISTANCE, IN MILES
FIGURE 18.--Profiles of subsidence, 1943-77, Tumey Hills to Mendotm
C--040920C-040920

LAND SUBSIDENCE IN SAN JOAQUIN VALLEY, CALIFORNIA I23
artesianheadinthelowerwater-bearingzone.Extensom-tion wells are much deeper in this area. This well iseterwel114/13-11D6 (fig. 22)measured a net compaction oflocated within 100 ft of the California Aqueduct and is0.18 ft in the drought year 1977, 0.07 ft expansion in 1978,strongly influenced by pumping of an irrigation well 150and 0.01 ft expansion in 1979. Extensometer well 17/15-ft to the north, which explains why the seasonal draw-14Q1 (fig. 23) measured a net compaction of 0.54 ft in thedownin well 6D1 was an astonishing 250 ft in the droughtdrought year 1977, 0.20 ft expansion in 1978, and no com-year 1977.paction or expansion in 1979. This site is subject to win-ter flooding and was flooded in 1978, therefore, the recordin 1977 and 1978 is questionable. Extensometer well 20/ TUL~AU~-WXSCO18-6D1 (fig. 24) measured a net compaction of 0.19 ft inthe drought year 1977, 0.09 ft expansion in 1978, and 0.02Land subsidence in the Tulare-Wasco area was re-ft of compaction in 1979. This extensometer supplies onlyported by Lofgren and Klausing (1969). Poland and oth-a partial measurement of the total compaction of the aq-ers (1975) updated and summarized the subsidence in thisuifer system; the extensometer depth is 867 ft and irriga-area. Location of the area, B, is shown on figure 32.
H H’ANTICLINE
~=.~=~
FresnoRIDGE -- Slough
V692 r~ ~ M692 FEBRUARY 1943 Z678]o I~ 1 I I
End of 1978leveling ~ Note: The 1975 leveling shows anapparent land surface rebound of 0.20ft one mile we=t and 0.05 ft two mileswest of bench mark M692. (Bench
20 mark= not shown on profile.) --
0 4 8 12 16 20 24DISTANCE, IN MILES
FIGURE 19.--Profiles of subsidence, 1943-78, Anticline Ridge to Fresno Slough.
C--040921C-040921

STUDIES OF LAND SUBSIDENCE
term
\\ ~ imports
,, hiohe // -Baae of ¢onf,n,ng ¢1a¥ \x ~
WELL 34N4
1910 1920 1930 1940 1950 1960 1970 1980 19<J0
20.--Long-term trend of water levels near the town of Cantua Creek, and seasonal high- and low-levels in observation well 16/15-34N4 shlce 1960.
Water level welldepth 1,1~ h
450-
I ~ ~m~ion depth -- 1.0 z650
.p-o
1955 1950 1965 1970 1975 1980 1985
FIGURE 21.--Seasonal fluctuations of water level in well 16/15-34N4 andmeasured compaction in observation well 16fI5-34N1 near Cantua Creek.
C--040922(3-040922

C--040923(3-040923

STUDIES OF LAND SUBSIDENCE
~tofDelano through1974. Maxirnum subsidenceeast water levels declined~ causing subsidence rates to in-)elano near State Highway 65 was 3.5 ft at bench crease. Subsidence at bench mark E757 was 1.4 ft fromck E757 from 1957 to 1974. Lofgren and Klausing 1964 to 1970 and 1.7 ft from 1970 to 1974. Maximum sub-;9, fig. 50) showed 1-2 ft of subsidence from 1926 to sidence west of Delano at bench mark M541, i mi west of2. Many acres of land were opened up to agriculture in State Highway 43, was 4.3 ft from 1957 to 1974.~ area in the 1960’s and 1970’s {Williamson, 1982). Profiles of land subsidence along State Highway 46ny wells were drilled because surface water was not from Wasco westward to near Lost Hills from 1957 to£1able; ground-water pumping increased, and ground- 1974 (fig. 27) show that subsidence is continuing in this
119" 30’ 119"15’ 119"00’
T. ’8Tul~re
~o / \
\~___
T.
s. ~ \
a6- oo, "~.\I \~I ’~ ,
EXPLANATION-
T. \ ’,~a complexs. \ \’,
- ~ ConsolidatedI ,edimenta~ rock~r. ~d Tertiary24S.
I ~ ~’- - -- ~ub~dence
I KI~R~N CO .D~hed ~he~e ~prwd-J I ! mc/~, inter~l ~
J’
’ / x G873---~" -~- .... I---- l~nch ~ Io~a-
.~873 ’ , Fanmso[ tion and numberI
{ } ’ IR. 22. I::. R. 23 E. R. 24 E. R. 25 E. R. 26 E. R. 27 I:.
0 2 4 6 8 {0 12 KILOMETERSl
I I{{l I {I I I
0 2 4 6 8 MILES ’
u~ 2~.--]L~md ~ub~de~ce, I926-70, ~d location, of ~bs{de~ce pmE[es, ’I~lLre-Wasco ~ Ba~e fi’om U.S. Geolo~cal ~ 1:250,0(X), Ce~t~!~ ~mp, 1968. Co~ from (1) 1948-’/0 ~b~dence (Poland a~d ot3.e~, 19’/5, ~g. 2’/), (2) 1926-62 subsidence (I.,ofgre~ ~-d Kl~usb:tg, 1969,g. ~0), a~d (3) 1962-’/0 s~abside~ce (Pola]~l. ~d others, 19’/5, fig. 24).
C--040924(3-040924

LAND SUBSIDENCE IN SAN JOAQUIN VALLEY, CALIFORNIA I27
C--040925(3-040925

STUDIES OF LAND SUBSIDENCE
.a. West of bench mark T457, subsidence from 1970 toArvin-Maricopa area as of 1970 is shown on figure 30.~4 was more than twice as much as from 1966 to 1970.Maximum subsidence exceeded 9 ft. Levelingin this areaThe generalized trend of water levels in the confinedsince 1970 was along the California Aqueduct. Bench
~tem near Pixley from 1905 to 1958, and seasonal highmarks along the California Aqueduct were surveyed byt low artesian head fore 1958 to 1980 in observation-the National Geodetic Survey in 1970 and 1975, and thel123125-16N3 at the same location are shown in figureElk Hills line was surveyed in 1975 (see figs. 30 and 32 forThis site is in one of the maximum subsidence centerslocation). The California Department of Water Resources
the Tulare-Wasco area (fig. 25). The artesian head de-releveled the California Aqueduct and the Elk Hills linened approximately 130 ft from 1905 to 1959 andin1978.~ched a historic low in the 1977 drought year. The seasonal water-level fluctuation and measured
The seasonal fluctuations of water level in observa-compaction in well llN/21W-3B1, 17 mi east of Maricopan well 23/25-16N3 and measured compaction in wellis shown on figure 31. {See fig. 30 for location.) Measured25-16N1 near Pixley from 1958 to 1980 are shown incompaction was greatest from 1963 through 1970, rang-ure 29. Water-level data are from the same site as oning from 0.30 to 0.45 ft per year as water levels declined~are 28. The compaction rates were greatest in the lateat a steady rate. As surface water from the California50’s and early 1960’s owing to large withdrawals ofAqueduct replaced ground water for irrigation, water lev-)und water. Compaction rates are related inversely toels recovered more than 150 ft from 1970 to 1976. Com-~ amount of surface water available and related di-paction rates decreased from 1970 to 19~76, averaging’.fly to the amount of ground water pumped. Deeperabout 0.09 ft per year. During the 1976-77 drought, theLsonal lows produced greater amounts of compactionartesian head declined 90 ft at this site, causing 0.15 ft of.e fig. 29). compaction in 1976 and 0.23 ft of compaction in 1977. In
1978 water levels recovered and subsidence stopped. InARVIN-MARICOPA AREA fact, approximately 0.02 ft of expansion was measured in
1978 followed ,by 0.02 ft of compaction in 1979.Land subsidence in the Arvin-Maricopa area was re-
~ in Lofgren (1975), and Poland and others (1975) ESTABLISHMENT AND RELEVELING OFdated and summarized the subsidence in this area. Lo- BENCH-MARK NETWORK~ion of the area, C, is shown on figure 32.
The last areawide leveling in the Arvin-Maricopa The bench-mark network in the San Joaquin Valley,a was in 1970. The historical land subsidence in thehas grown irregularly since the early part of 1900. The
K K’
~Z~ ~ ~ 0
1957 ~se State HW ~
~0.5 ~
1.5 Note: all leveling by the NationalGeodetic Suwey except 1974; 1974leveling by Los Angeles CiWDepa~ment of Water and Power
2.00 2 4 6 8 KILOMETERS
0 2 4 MILES
FIGURE 27.--Profiles ofl~d subsidence, 1957-74, ~om W~co to ne~ ~st H~. L~ation sho~ on fi~m 25.
C--040926(3-040926

LAND SUBSIDENCE IN SAN JOAQUIN VALLEY, CALIFORNIA I29
~o50 -- Confined water level
<: 100 ~ ~ Seasonal highs
D ~~ /Weld16N3
~: 150 --O
~ 200---
Seasonal ~ows \o
~1-- 250-WeII16N3~~/ ~~ "
Confining clay ~~ ~ ~ ~ ~. _~_
300 I I I I I ] I" T1900 1910 1920 1930 1940 1950 1960 1970 1980 1990
FIGURE 28.--Long-term trend of water levels near PLxley, and seasonal high and low artesian head in observation well 23/25-16N3. L<)cationshown on figure 25.
network of leveling control in the three subsidence areaslOG I I 1 I t was periodically resurveyed by the National Geodetic
I-tu Water level well depth 430 ft. perforated 360-430 ft Survey (fig. 32). Control is concentrated in the three sub-
~ 150 - bedrock" reference bench marks around the perimeter ofthe valley.
~ The extent and times of leveling in the Los~ 200 Banos-Kettleman City, Tulare-Wasco, and Arvin-Mari-~ copa areas are shown in figures 33-35.~ In the Los Banos-Kettleman the first lev-Cityarea,o~ 250 1.0 ~ eling was done in 1933 and 1935 by the National Geodetic~ "~ Survey. The first extensive leveling, done in 1943, was fol-
lowed by partial levelings in 1947, 1953, and 1954. In 1955~<~: 300 --
~ "r-~ Compaction depth -- 0.s ~ a detailed network .of bench marks was laid out and lev-
~°) I I ] ~ ~ ~~a’~ grameled in cormection with a topographic map revision pro-(fig. 33).~ 0 ~ In the Tulare-Wasco area, the first precise leveling
l I I l I was done by the Geological Survey along the Southern1960 1965 1970 1975 198, Pacific railroad in 1901-02. In 1931, a line of first-order
levels was run along the Southern Pacific railroad by theFIGURE 29.--Seasonal fluctuations of water level in observation well 23/ National Geodetic Survey. In 1948 a detailed network of
25-16N3 and measured compaction in well 23/25-16N1 near Pixley. lines was laid out and leveled throughout the subsidenceLocation shown on figure 25. area (fig. 34). Beginning in 1957, a tie was made to a stable
C 040927C-040927

tI
iT. MILE31 245$. I,
VIaLAKE BED I
I
T.32S.
T. , EXPLANATION12N.
IT.
N.Consolidat~ r~ks
Line of equal subsiden~interval I f~t
T. "10 ¯ .: ..... ¯ ..... Observation we~ and
~nch mark l~ation.. R.18W.
R.23W. R.22W. R.21W. R.2OW. R.19W.0 4 8 12 KILOME~RS
0 4 8 MILESCONTOUR INTERVAL I~ FEET
FIGU~ 30.--~d ~bdden~, 19~6-~0, ~ ~e ~-M~pa ~ ~mp~ ~efly ~ the ~ of: (I) app~ subdd~ ~om 19~6 m 1957 ~mlev~ dam of ~e Na~onM G~e~c S~ey Mong S~m H~hway 99 ~d Mong M~pa ~d ~d (~) 195%~0 ~den~ (Pond ~d o~em, 19~5, ~. 80).

LAND SUBSIDENCE IN SAN JOAQUIN VALLEY, CALIFORNIA I31
TABL~ 1.--Years of leveling control of the network of bench marks in350 { I I I three subsidence areas by the National Geodetic Survey
Well depth1,480 ft
~ ~,00 --i
-- LOs Banos-Kettlera~m City Tu/ar~Wasco Arvin-Maricopa
Z
~
’1948u~ ’1955 .................. 1953
1957-58 ......... 1957 ’1957~ 450 -- 1959-60_. 1958-59 1958-59D 1963 1962 1962u~ 1966 ........ ’1964 1965c~ 1969 1969-70 1970z<~ 5o0- -- 1971-72 ...............
~Year network e~tablished.’Partial re~ of net.
i 5~o~ 1972; and January-May 1975. These relevelings werez_ sometimes partial lengths of the aqueduct, such as the
O~ Compaction d~pth ~ part in the Los Banos-Kettleman City are~~ -
~~-~ ~ ~ ~
- 0 ~The California Aqueduct was leveled by the Califo~
~ ~ nia Department of Water Resources in Novembero~ 1977-April 1978.0
1965 1970 1975 1980
MONITORING ALONG THEF~GURE 31.--Se~onal fluctuations of water level and measured CALIFORNIA AQUEDUCTcompaction in well llN/21W-3B1. Location shown on figure 30.
Profiles of land-surface change (subsidence) alongbench mark at Woody in the Sierra Nevada~ Woodythree segments of the California Aqueduct are included(shown on fig. 32) is about 10 mi due east of State High-in this report (fig. 6, segments A-B, B-C, and D-~. Theway 65 along the easterly projection of the south bound-northern segment is in the Los Banos-Kettleman Cityary of T. 25 S. (Lofgren and Klausing, 1969, fig. 37). area and extends from aqueduct mile 92 at the Fresno-
The LOs Angeles Department of Water and PowerMerced County line to aqueduct mile174 near Kettlemanran levels in 1974 and 1975 from Woody westwardCity Ipl. 1; see fig. 36 for location). The middle segmentthrough Delano and Wasco (fig. 34) to near Lost Hillsextends from mile 174 near Kettleman City southward(shown on fig. 6). past Lost Hills to aqueduct mile 218 (pl. 1; see fig. 6 for
In ~hs Ax~in-Maricopa area, the first precise levelinglocation). The southern segment is in the Arvin-Maricopaby the National Geodetic Sur~ey was done in 1926-27.area and extends from aqueduct mile 238 to aqueductFour subsequent partial surveys were run by 1953. Inmile 287 southwest of Wind Gap Pumping Plant (pl. 1;1957, as a result of coordinated efforts of an Inter-Agencysee fig. 6 for location~.Committee, an extensive network of bench marks was Three types of bench marks are used in preparingestablished throughout the area of suspected subsidencethese aqueduct profiles: bench marks set in the aqueduct(fig. 35). lining, bench marks on aqueduct structures, and bench
Thus, by 1957, detailed bench-mark networks hadmarks adjacent to the aqueduct. Bench marks on aqu~been established in all three of the principal subsidenceduct structures (such as bridges, pumping plants, turn-areas, out-structures, and checks) show more settlement,
Level nets in the subsiding areas were surveyedespecially differential settlement (structure settlementisevery few years, because of the accelerated subsidencegreater on one side than the other), than bench marks inrates during the late 1950’s and 1960’s. TabIe 1 shows, forthe aqueduct lining or bench marks adjacent to the aque-each of the three subsidence areas, the date the networkduct. Examples of differential structure settlement arewas first established and the years of relevelings of theshown on each segment. Bench marks in the aqueductnetwork, lining are used on these profiles, where possible, because
The National Geodetic Survey leveled the Californiathey are more representative of the aqueduct subsidence.Aqueduct in February 1967; November-December 1967; The aqueduct traverses areas of subsidence due toDecember 1968-January 1969; October-November 1969;water-level decline, hydrocompaction, and oilfield sub-November 1970-January 1971; November 1971-Marchsidence, and these areas may also be affected by tectonic
C--040929(3-040929

’~1111,~ OF LAND SUBSIDENCE
20" ~° 118"
C 040930C-040930

LAND SUBSIDENCE IN SAN JOAQUIN VALLEY, CALII~RNIA 133
Los Bsnos 1933 OR 1935 Los Banos 1943 ILo$ Bano$ 1947 t.os Banos 1953 Los Bano$ 1954~ M~lrch-May 1933 ~ December 1~- ~
Ke~l~man Ci~ ~ K~leman CiK~leman
~s Banos 1955 Los Banos 1957 ~os B~nos 19~ ’Januaw-May
Janua~ 1~9 Januaw 1~~ ~b
K~leman CiW~ Keffieman CiW~ K~ Ke~leman CiW Ke~lem
Los Benos 1~ ~s Banos 1~ Los Banos 1~7 Los Banos 1~7
~ O~ober 19~5~~~ ~ "~ ~~ Janu~w-March~ o ~~~~ Janua~March ~N°vem~r-~em~r ~ ~11~
Ke~leman CiW~ K~leman CiW~ Ke~leman CiWe Ke~leman CiW ~ Ke~le
LOs Ban0s Los Bano, 1975 p, eano, 1978 ’~s Banos 1~9 L~s Banos 1970 1972Janua~March Novem~r 19~-~o~r-Novem~r November 197~
972
K~ieman CiW~ Ke~leman Ci~ Ke~leman C Ke~leman C .~
FZGU~ 33.--Exit ~d ~es ~ ~ ~ ~e ~ B~-~t~ ~ty ~ (~ ~ by ~e Na~o~ G~c ~ ~t 1977-78 w~w~ by ~e C~o~ DepOt d Wa~ ~.)
C--040931C-040931

T~J~are ~- 1940 Tulere 1942-43Augu=t-October Decembar-March
1931-1935January-March ~’
Woody ¯ Woody" Woody ¯
1 935 Wasco !WaocO| ~ .
Tulere¯ 1964-66 1969-70 Tulere¯ 1974-75January-March November 1969-
1970
¯
Woody ¯ WoodyWesco
. WeSCO"--1
F~GUR~ 34.--Extent and times of leveling in the Tulare-Wasco are~ (A]I leveling by the National Geodetic Survey except 1974-75which was by the Los An~geles City Department of Water and Power.)
C--040932(3-040932
LAND SUBSIDENCE IN SAN JOAQUIN VALLEY, CALIFORNIA I35
~...,:.. ~--970 1975 1978
35.--Extent and times of leveling in the Arv~-Maricopa area. (All leveling by the National Geodetic Survey except 1978which was by the California Department of Water Resources.)
C--040933C-040933

STUDIES OF LAND SUBSIDENCE
Firebaugh
/FRESNO
105
.Oo
Oo
:0 125 :
* Cantua CreekEXPLANATION
Boundary of deformedrocks
:"Boundary of area historically affected
by or susceptible to hydrocompaction ,4/(data from U,S. Bureau ofReclamation, July 1980)
Line of subsidence profileHurott
Line of water-level profi|e ~PLEASANT
Profiles shown on figure ~dinga5 and plate l, A-B VALLEY ~ TULAR£
’~5 LAKE0 5 10 15 20 25 30 KILOMETERS BED
0 5 10 15 MILES
Kettleman CityMILE 174
-Location of California Aqueduct subsidence aud water-level profiles and areas of hydro¢ot~.’~m in the Los Banos-Kettleman Cityarea. Base from U.S. Geological Surve3~ 1:250,000, Central Valley real
C--040934(3-040934

LAND SUBSIDENCE IN SAN JOAQUIN VALLEY, CALIFOttNIA I37
subsidence. Areas of known hydrocompaction, shown onTABLE 2.--Surface-water d~llverie$ through the joint-use r~ach of the
figure 1, were prewetted along the aqueduct alinementCalifornia Aqueduct and estimated ground-water pumpage in th~prior to construction. Los Bano$-Kettl~m~n City ar~a, 1967-77
AQUEDUCT SUBSIDENCE, MILE 92 TO MILE 174 ~e to Stu Ltti~ ~dce a~ea and tuclude wate~ pumped fxomWater District. Ground-water pumpage for agriculturtl year begiaaing Aim21 a~iendlngMa~h 31 for yea~ 1967 through 19TI and for calendar yem~ 1974 throegh 1977]
Profiles of subsidence along the California AqueductSurface-water Grvm~l-wa~"from mile 92 to mile 174 in the Los Banos-Kettleman yo~ ~,v.~.
City area from 1967 to 1977-78 are shown on plato 1. Theleveling of November-December 1967 was used as the1967, 19 1,04obase instead of the February 1967 leveling because the1968 ............... 2o9 75ocoverage was more complete in December and also to al-1969 ............... 306 685
1970 ............... 478 605low for settlement and stabilization aftor construction of1971 650 515the aqueduct was completed in 1967-68. 1972 ............... 865 No data
Before examining these profiles, it is helpful to re-1973 ................ 856 No dataview major changes taking place in this lO-year period--1974 ..... 1,129 ,194changes in importation of surface water and in regional1975 ....... 1,368 1188
1976 .............. 1,337 ~195pumping of ground water, and the rapid change in the 1977. 308 ~5’42potentiometric surface (artesian head) of the confined aq- ,~.~ ~ t07~-Tz =a~ of p~ ~ W~d~uifer system (lower wator-bearing zone). Total surface-water deliveries to the San Luis service area (includesabout 90 percent of the Los Banos-Kettleman City area}Mendota, (2) near the town of Cantua Creek, and (3) nearincreased from 19,000 acre-ft in 1967 to 1,337,000 acre-ftthe town of Huron (fig. 4). Because of the rapid ratos ofin 1976 and then decreased to 308,000 acre-ft in thesubsidence in the late 1960’s, more freeboard was addeddrought year 1977 (table 2). As a result of the increase into the aqueduct in 1971 from mile 129 to mile 137, southsurface water supplied through the aqueduct, pumpageand east of the town of Cantua Creek. More freeboard willof ground water decreased from 1,040,000 acre-ft in 1967be added to other subsiding areas along this reach in theto about 195,000 acre-ft in 1976, but increased to 542,000near future.acre-ft in 1977, the second drought year (table 2)~. In re-Subsidence rates were greatest from the leveling ofsponse to the reduction in ground-water withdrawalafterNovember-December 1967 to that of December1967, the potentiometric surface (artesian head) of the1968-January 1969. During this 13-month period, subsid-confined systom, which had been drawn down stoadilyence ranged from less than a hundredth of a foot at benchfor 20-30 years, recovered rapidly from 1967 to 1976.mark J1072 at aqueduct mile 92 near the Fresno-MercedThis recovery is demonstrated by the water-level profilesCounty line to a maximum of 1.4 ft at bench mark R1093along the aqueduct (fig. 5), by the regional water-level re-at aqueduct mile 128 west of the town of Cantua Creekcovery in the lower zone from 1967 to 1974 (fig. 15}, and by(pl. 1).the subsidence and extensometer graphs that show theNoto that the subsidence profiles along the aqueductrapid recovery of artesian head and the correspondingare drawn with a vertical scale of 1 in. = 1 ft, whereas thereduction in subsidence rates in the 1970’s (figs. 16, 17,horizontal scale is 1 in. = 2 mi (10,560 ft). Thus, the verti-21-24}. cal scale is 10,560 times as great as the horizontal scale.
The leveling of January-March 1975 to the levelingThis scale difference serves to magnify greatly even veryof November l977-April l978 show that subsidence ratessmall lateral differentials in the magnitude ofincreased as a result of the 1976-77 drought. Field exten-subsidence.someters and water-level data confirm that most of the In 1967 the artesian head in the permeable coaree-subsidence during 1975-77 occurred in 1977, the year ofgrained aquifers was at its historical low. The recovery ofthe greatest pumping drawdown (table 3 and figs. 41-56}.head began in 1968, and during the 1970’s pore pressures
The reach of the California Aqueduct from mile 92 toin the aquifers gradually increased toward equilibriummile 174 has subsided more than any other aqueductwith residual excess pore pressures in the fine-grainedreach. This reach passes through two areas of hydrocom-compressible aquitards. The average effective stress andpaction (fig. 36) and through the three major subsidencethe rate of subsidence decreased at a fairly uniform ratedepressions due to water-level decline--(1) southwest offrom 1968 to 1976.
Compared with the November-December 1967 base,~Ground-water pumpage data for 1935-36 to 1965-66 a~e in Bun and Miner 1~97S,all the successive profiles show continuing subsidence~a~.
with the exception of the January-March 1975 profile.
C--040935C-040935

STUDIES OF LAND SUBSIDENCE
~ ~ mg~s ~42 a~ L5.5, the 1975 profile75, 100, and 125 ft deep on a 100-ft grid were installed in~ ~ ~ m 0_2 ft ~f ~parem rebound from thethe central two-thirds of the ponds to speed water deliv-Novemb~ ~ !972 ~ Ip~ 1}. The wordery to dry deposits. In the preliminary investigation, test"~" i~ mad ~ hecat~e there was someholes, 200 ft deep, were drilled on 1-mi centers to the ap-prvbk~ ia ~ ~ of Nmch-mark elevations forproximate water table to obtain moisture and density de-the L97~ ~ ~kima~ tl~ sam~ procedure was fol-terminations and again, after preconsolidation of the~ ~d~f~g ~a ~ mr~a by the National Geo-aqueduct alinement, to determine whether moisturedetic ~ ~ars in the Los Banos- from preconsolidation ponding had reached the mois-~ ~.. ~-~ ~ a n~t compaction in the 3ture-deficient deposits.years 1972 ~a 19~-,a..~]~ht~h the artesian head of the Maximum subsidence in the northern hydrocompac-lo~er ~ ~r~ meowing r~pidly in that period and mi-tion area was 2½ ft and in the southern hydrocompactionnor rdao~fl ~! l~at~mrred locally, the 1975 pro-area was more than 5 ft in 1 ½ years.fi~ ~houid he viwad ~ ta~tion. The 1972 and 1978 Hall and Carlson (1965} predicted a certain amount of~ ~ ~ he ~ because the values wereresidual hydrocompaction would occur even after 1 ½derived fix~ ~ ~ years of saturation.
~V~h vlm ~ of ff~a t~o areas susceptible to The subsidence profiles define two features withinhytl~v~a~ ~cl ~ minor subsidence of thethe extent of the larger hydrocompaction area that dis-Coalin~a~kti~ gha f~m~ (Bull, 1975, p. F8), all theplay recurring "sags" in the profiles, rel~ated in each re-~ ~ ]a~ ba~appedin t~ Los Banos-Ket-leveling. These sags, centered at aqueduct miles 120 andtl~man ~.. ~a~ ~ r~ I920’s is attn3auted to the128, look li~e major features at the greatly distortinggreat dad~ei~ ~ ~ t~ ctmsequant increase inscale ratio. ~ctuall~ the overall sag at mile 120 is about 1effactiv~ ~ rt~ ~ of the confined aquifermi wide an~ has undergone 2.7 ft of subsidence at benchsyst~ ~ r~ ~ ~asidence of the land sur-mark A1093 since November-December 1967, about 0.9face_ ~i-ml~ r~ r~a ~m msceim~Ie to hydrocompac-ft more than the regional subsidence, at nearby bench~ two ~ of sSasifi~aea ha~ occurred, namely: (1}marks Z1092 and B1093. The sag at mile 128 is about 3 miregional ~ d~ ~ ~luff~r-system compaction,wide and has undergone 3.9 ft of subsidence at benchand {2~ .hy~mxx~0~tm ~ mt~mr~leficient depositsmark R1093 since November-December 1967, whereasbetwe~ ~ ~ ~ ~ ~ater table when first wet-the regional subsidence at nearby bench marks N1093ted by ~ ~ k, rigation water, and T1093 was 2.4 and 3.0 ft, respectively.
Bocaa~ of ~ ~ c~fer~tial subsidence pro- In 1972 the California Department of Water Re-duced by. r~ ~ during many years of irri-sources requested that the Geological Survey examinegatic~ and r~ ~ ~ ~f reid ~ producing more thandifferential changes in elevation of the aqueduct, particu-10 ft of .hy~~ ,Ball. 1964a), the aqueductlarly near these two prominent sag areas, to see if anybm]ck~ bo~...~ t=-~d~ ~ ~-~r~ concluded that the aq-geologic anomalies of possible tectonic origin appearedueduct alS~ama~ ~ :b~ rams subject to hydrocom-to be developing. The physical dimensions of the twopac~a sho-Ad be ~ from land surface to thesags and their systematic growth does not suggest thatwater ~ ~o ~ ~ deposits prior to con-these are geologic anomalies of tectonic origin. It is morestmctkm o~ ~ ~ ~ pr~wetting between aque-likely that these two recurrent sags are caused by contin-duct miles ~ _~-5::3 ~ ~ miles 114-129 (fig. 36 anduing hydrocompaction (consolidation} of two "islands" ofpl_ 1! ~as d~m ~_ ";64:_ ~:~ :2~5. If the prewetting haddeposits (of low vertical permeability} that have not yetachi~-ed ~ ~ ~ deposits underlying thebeen completely wetted. Test holes drilled to the wateraquedu~ ~ ~ ~ .-wo reaches would be pre?.table and careftflly sampled for moisture content couldconsotidm~.L~x~=~2md_~----~cetothewatertable, nodetermine if these are "islands" of continuingaddi~ .h.h.h.h.h.h.h.h.hy~v.~ tumid occur, and none of thehydrocompaction.subsidaace sh~r~..a: _ahm : ~ould be caused by hydro-Measured compaction to a depth of 2,000 ft at exten-com~ someter site 16/15-34N1 (fig. 49} (see fig. 40 for location}
The r,~ ~,-..-r~. ~ areas, aqueduct mileswas 90 percent of the subsidence measured at bench98-103 a~d E~:=~_ ~ .=r:.-~’~nsolidated in the follow-mark G1046 between November-December 1967 and No-ing wa).-s ~]~t~- ~d Carla= :5~-5: U.S. Bureau of Recla-vember 1971-February 1972. The data from the multiplemarion 197,4,. Pr-. -~ " ponds, 400-425 ft wideextensometers at this site show that 0.46 ft of compac-and of~ric~ ~_~_--’.~_~ ~ ~’cr.~ructedto saturate bothtion (table 6) occurred above 503 ft and 1.57 ft occurredthe ~ ~ a:d-2~_~ upon which the aqueductfrom 503 to 2,000 ft, that is, within the confined aquiferembankmam~ ~ro-~ b~.:i~_~d- Ponds were flooded 1 ½-2system. The 10 percent of total subsidence not accountedft deep for 12-~ ~ C_--r~-packed infiltration wellsfor by measured compaction presumably represents
C--040936C-040936

LAND SUBSIDENCE IN SAN JOAQUIN VALLEY, CALIFORNIA I39
compaction below the bottom of the 2,000-ft extensome-198 to mile 207 {pl. 1). The discovery well, drilled in 1910,ter, inasmuch as nearby wells ex~end to 2,750 ft. The datawas completed at a depth of 530 ft. The shallower oil-show that most of the subsidence at this site is caused byproducing horizons are 200-1,300 ft in depth; the deepercompaction of the aquifer system due to the pumping ofhorizons are below a depth of 4,.900 ft.ground water. This extensometer site and bench mark are Leveling surveys of bench marks along State High-¼ mile south of the aqueduct at mile 130, southeast of theway 46 at and near Lost Hills indicate that substantialhydrocompaction area shown on figure 36. subsidence has occurred both before and since the aque-
Bench mark 100.55L, an example of differentialduct was completed in 1967. Profiles of land subsidencebench-mark settlement (pl. 1) is located on the left side ofalong State Highway 46, from 3 mi west of Lost HillsShields Avenue Bridge. This bench mark subsided 1.50 ft(town) to 3½ mi east are shown on figure 37 (see fig. 6 forfrom 1967 to 1978, whereas bench mark 100.55R (notlocation). Subsidence values for surveys prior to 1966shown), located on the right side of the same bridge, sub-(pre-aqueduct) are plotted above the base, and values forsided only 0.88 ft for the same period. Bench mark S1072,subsequent surveys are plotted below the base. The mosta mark in the aqueduct lining one-half mile north ofremarkable feature of this figure is the uniform subsid-Shields Avenue Bridge, and bench mark Z1072, a benchence of 0.4-0.5 ft that occurred from 1953 to 1966 by allmark adjacent to the aqueduct 0.6 mi south of Shieldsthe bench marks in the 4½-mi reach from bench markAvenue Bridge, show 0.99 ft and 1.05 ft for the same peC873 to G873 at the east end of the section. The reasonried. This is a hydrocompaction area and was prewettedfor this uniform subsidence is not known. Lofgren (1975,before construction, p. D13-D15) stated that all bench marks in this area have
a component of apparent subsidence which is not real Allor part of this apparent change (subsidence) from 1953 to
AQUEDUCT SUBSIDENCE, MILE 174 TO MILE 218 1966 may be related to tectonic uplift at supposedly sta-ble bench marks in the Tehachapi Mountains to the
Profiles of land subsidence along the California Aq-south, the Sierra Nevada to the east, and the Coastueduct south of Kettleman City from mile 174 to mile 218Ranges to the west. Note that bench mark G873, at theare shown on plate I (see fig. 6 for location). The base forwest end of the subsidence profile from Wasco to nearthese profiles is October 1967-January 1968. In the 10-Lost Hills (fig. 27), is common to both sets of profiles. Theyear period 1967-77, these profiles show little or nosubsidence of the area 2 mi east of bench mark G8731fig.change from mile 174 to mile 192. Prom aqueduct mile27) from 1957 to 1974 is double that of G873 and was192, the subsidence gradually increases to 1.2 ft betweencaused by increased ground-water development in themile 197 and mile 198. Subsidence then decreases to less1960’s.than 0.5 ft at mile 204, increases to a maximum of 1.45 ft Bench mark Y544 (fig. 37) at Lost Hills and east ofat mile 208, and then gradually decreases to 0.45 ft atthe aqueduct subsided 0.41 ft from 1957 to 1966 and 0.59mile 218. ft from 1967 to 1978. Also bench marks E873 and 153A,
The bench-mark numbers (aqueduct miles) originallyabout 0.5 mi west from Y544 and west of the aqueduct,assigned by the California Department of Water Re-subsided 0.41ft from1953 to1967 and 0.73 ft from1967 tosources and used by the National Geodetic Survey1978. Two miles west of Lost Hills at the axis of the oil-through 1975 for bench marks from aqueduct mile 172field, bench mark 383.7 subsided 1.22 ft from 1935 to 1953near Kettleman City to aqueduct mile 220 were about 2.3and 1.02 ft from 1953 to 1966. These figures in~cate thatmiin error. Corrected mileage and bench-mark numbersthecrestoftheoilfieldduewestofthetownsubsided2.24of the Department of Water Resources are used in thisft from 1935 to 1966 and probably has subsided consider-report, ably more since oil production began in 1910. No surveys
Bench mark X1097, at aqueduct mile 196.75 on awere made between 1910 and 1935, and this bench markturnout structure shown on this profile, is an example ofhas not been resurveyed since 1966.structure settlement that is probably not related to the "From 1967 to 1978, subsidence of the aqueduct paral-areal subsidence. The data show that this structure haslel with the axis of the Lost Hills oilfield (aqueduct milesubsided a maximum of 1.6 ft since construction,198-207, pl. 1) ranged from 0.4 to 1.3 ft. At Lost Hillswhereas bench mark 196.57B, 0.2 mi north, andlocated inItown), the aqueduct has subsided 0.6-0.7 ft since 1967.the aqueduct fining, has subsided 0.9 ft and bench markThis subsidence probably is due in part to continued re-197.05B, 0.3 mi south and located in the aqueduct lining,moval of oilfield fluids and compaction of the shallow oilhas subsided 1.1 ft. zones of the Lost Hills fielcL Prom aqueduct mile 198 to
The axis of the Lost Hills oilfield is approximatelyLost Hills (mile 205), the oilfield subsidence is not knownparallel to the aqueduct, and is 1-1.5 mi southwest. Theand, hence, no comparison can be made with the aque-productive limit of the field extends from aqueduct mileduct subsidence.
C--040937C-040937

STUDIES OF LAND SUBSIDENCE
The mason for the subsidence in aqueduct milesrequirements in the San Joaquin Valley. Water-level195-198 and 207-215 is not known. According to Woodmeasurements made in the 1970’s are available for three!and Davis {1959}, the quality of the ground water beneathwells in the township. In the three wells, water levels arethe Antelope Plain is generally poor, and for this reason,less than 80 ft below land surface and have been rising.:water wells are scarce. The evidence just summarized, although
Ground-water pumpage data from some westsidesuggests that ground-water withdrawal and declinetownships were published for years 1962-66 (Ogilbee andwater levels has not contributed appreciably toRose, 1969a}, 1967-68 IMitten, 1972}, 1969-71 {Mitten,ence of the aqueduct in the reach from aqueduct mile 1901976}, and 1975-77 IMitten, 1980}. The Geological Survey,to aqueduct mile 215.as part of the Central Valley Aquifer Project, has pre- Limited or local deposits susceptible to hydrocom-pared estimates of ground-water pumpage for additionalpaction may be present and may have been wetted andtownships in this area. A review of these data for town-compacted by water leaking from the aqueduct or usedships crossed by the aqueduct from 15 mi north of Lostfor irrigation.Hills (from aqueduct mile 190) to 10 mi south of Lost Hills The State made contracts for preconsolidation of hy-(to aqueduct mile 215) shows that the only township indrocompactible deposits at aqueduct mile 177.4 to 177.7which ground-water pumping is appreciable is T. 27 S., R.(Arroyo Pino Creek), and aleo from aqueduct mile 215.6 to21 E. The north boundary of t~is township extends fromaqueduct mile 239 (pl. 1). Profiles of aqueduct subsidence2 mi east of Lost Hills (town) to 4 mi west. The estimatedwere no.~ drawn for the 20-mi reach- from aqueduct mileannual average ground-water pumpage from this town-218 to 238 because maximum subsidence in the reach didship was 23,400 acre-ft per year for 1961-66 and 18,600not exceed 0.5 ft. Subsidence from 1969-70 to 1978 wasacre-ft per year for 1967-77. These quantities are equiva-0.25 to 0.50 ft from aqueduct mile 218 to mile 230 nearlent to 1 ft and 0.8 ft of water, respectively, if applied toElk Hills and 0.20 to 0.30 ft from aqueduct mile 230 tothe full township acreage (23,040 acres). This amount ofmile 239. Bench marks along this 9-mi length, mile 230 towater is only one-half to one<luarter of the crop irrigationmile 239, show an apparent minor recovery of 0.01-0.03 ft’
C--040938C-040938

LAND SUBSIDENCE IN SAN JOAQUIN VALLEY, CALIFORNIA I41
~m 1975 to 1978 suggesting that the subsidence oc- subsidence due to fluid withdrawal. Subsidence fromcurred from 1970 to 1975. mile 261 to mile 270 ranged from less than 0.2 ft to 0.4 ft,
then reached 0.9 ft at mile 271.5 from 1970 to 1978.AO~UEDUCT SUBSIDENCE, MILE 238 TO MILE 287 Field extensometer LlN/21W-3B1 (fig. 66; see fig. 40
for location), approximately I mi north of the aqueduct atProfiles of land subsidence from 1970 to 1978 alongmile 272, recorded 1.84 ft of compaction versus 2.05 ft of
the California Aqueduct from mile 238 to mile 287, south-subsidence (90 percent} from February 1965 to March 9,west of Wind Gap Pumping Plant are shown on plate 11970, 0.57 ft of compaction versus 0.61 ft of subsidence(see fig. 6 for locationl. The subsidence illustrated by(93 percent} from March 9,1970, to May 3,1975, and 0.45these profiles represents change related to fluid with-ft of compaction versus 0.61 ft of subsidence (73 percent}drawal, hydrocompaction, and probably constructionfrom May 3, 1975, to August 17, 1978.settlement. This extensometer well is 1,480 ft deep and measures
Areas of known hydrocompaction and the area ofmost of the aquifer compaction due to ground-watersubsidence greater than 1 ft due to water-level decline inpumping. The site was disturbed in early 1978 at aboutthe Arvin-Maricopa area are shown on figure 38. Areas ofthe time of the 1978 leveling. The concrete base that is theknown hydrocompaction along the aqueduct alinementreference for all measurements had been undermined bywere from mile 254 to mile 261, mile 274 to mile 280.5, andwater; however, repairs were made and the site restored.mile 282.5 to mile 286 (pl. 1 and fig. 38}. As shown onThe aqueduct subsidence at bench marks 272.00B andplate 1, the State contracted for preconsolidation of hy-272.39A (not shown on pl. 1), approximately 1 mi south,drocompactible deposits from aqueduct mile 255.7 towas 0.31 ft from 1975 to 1978, suggesting a minor datamile 288.7. The regional subsidence greater than 1 ft due.problem at the extensometer site. Extensometer data (ta-to fluid withdrawal from 1926 to 1970 extends from aque-bles 3 and 6} confirm that the measured compaction atduct mile 259 to mile 280. Ipl. 1). well 3B1 from 1970 to 1978 was equal to 83 percent of the
From aqueduct mile 238 to mile 254, the subsidencesubsidence and that most of the subsidence from 1975 towas generally less than 0.25 ft from 1970 to 1978. The1978 occurred during the 1976-77 drought years.profiles along this 17-mi reach show a maximum subsid- Erratic subsidence is demonstrated at bench markence of 0.5-0.6 ft near mile 241. This sag, which is 1-2 mi273.48A. This bench mark located in a concrete over-long, is probably due to construction settlement and (or)chute subsided 1.12 ft from 1970 to 1975 and 0.63 ft fromhydrocompaction (prewetting for the hydrocompaction1975 to 1978 (pl. 1). Bench mark 273.09A, not shown butarea to the northwest stopped at mile 238). The 1978 ele-in the aqueduct lining about 0.4 mi northwest of benchvations show an apparent small land-surface recoverymark 273.48A, subsided 0.44 ft from 1970 to 1975 andfrom aqueduct mile 238 to near mile 243. 0.24 ft from 1975 to 1978. Bench mark 273.75B, in the
" Subsidence again reached on,half foot at mile 254,aqueduct lining 0.27 mi southeast of bench markin the next known hydrocompaction area. From aqueduct273.48A, subsided 0.38 ft from 1970 to 1975 and 0.20 ftmile 254-261 (known hydrocompaction area}, subsidencefrom 1975 to 1978. Other bench marks in this area, notranges from near 0.25 ft to near 1 ft except at benchplotted on plate 1, also show erratic change, suggestingmarks 255.77B and K1210. Bench mark 255.77B in thepossible hydrocompaction, or structure settlement, oraqueduct lining subsided 1.31 ft from 1970 to 1975 andboth.0.91 ft from 1975 to 1978. Bench mark K1210, set in an Another known hydrocompaction area, mile 274 toaqueduct structure (concrete overchute}, shown at aqu~mile 280.5, is also in the area of subsidence due to fluidduct mile 255.75, subsided 1.12 ft from 1970 to 1975 andwithdrawal. Maximum subsidence was 1.1 ft near mile0.98 ft from 1975 to 1978. Bench marks 255.00B and275 and 0.9 ft at mile 277. The settlement in this 6-mi255.36B, in the aqueduct lining to the west, subsidedreach is caused by both subsidence due to fluid with-0.40 and 0.35 ft from 1970 to 1978. Bench marks 256.12Bdrawal and subsidence due to hydrocompaction, chieflyand 256.56B, in the aqueduct lining to the east, subsidedthe ~atter. Subsidence from mile 280.5 to 287 ranged from0.55 and 1.01 ft from 1970 to 1978. The large change at0.2 ft at mile 280 to about 0.4 ft at mile 282, then de-mile 255.77 appears to be due partly to hydrocompactioncreased to about 0.1 ft at mile 287. The southernmostand partly to structure settlement (note that the precon-known hydrocompaction area shows no continuedsolidated area started at mile 255.75). The undulatinghydrocompaction.subsidence in this 7-mi reach from aqueduct mile 254 tomile 261 is attributed to hydrocompaction that has oc- ELK HILLS LEVELINGcurred since 1970 leveling.
The reach from mile 261 to mile 274 is out of the The line of levels (Elk Hills loop) that runs throughknown hydrocompaction area and in the area of regional the Elk Hills from the California Aqueduct at mile 229.7
C--040939(3-040939

H.24F. R.25E. 119°15’ R.26E. R.27E. 119°00’ R.28E. R.29E. R.30E. 118"45’ R.31E.I
MILE
35"15’ ." ~" I
~ M~L~
T. MILEI
31 245s.
]UENA VI~
T.32
T.
EXPLANATION
N.Area of known
hydr~mpaction
Area of subsiden~ ~ater than If~t due to water-level decline,
T. 1926-7010
I
R 23W R 22W. R21W. R.18W.R.2OW. R.1 9W.
0 4 8 12 KILOMETERSI ’ i I I I
CONTOUR INTerVAL 100 F~T
F~OOa~ 38.--A~as ol ~o~ hy~ompae~ion ~ ~he A~-M~ieopa ~a. B~ ~om U.S. G~lo~e~ S~e~ 1:250,000, ~ntr~ V~ey map, ~u~h A~a, 1958.
LAND SUBSIDENCE IN SAN JOAQUIN VALLEY, CALIFORNIA I43
~md ties back to the California Aqueduct at mile 245.09 The accuracy of the compaction record is dependentwas first run in 1964 (see fig. 30 for location). This line waslargely on the ability of the extensometer (cable or pipe)releveled in 1975 by the National Geodetic Survey andto maintain an invariant length between the bottom-holeag.ain in 1978 by the California Department of Water Re-reference point ("depth bench mark") and the above-sources. Maximum subsidence from 1964 to 1978 was atground reference point (fig. 39). Typically this ability isbench marks Y548 (0.83 ft) and 230 + 00 POT CSHDmore or less degraded by frictional coupling between the(1.02 ft) (see fig. 30 for location). The above bench marksideally motionless extensometer cable or pipe and the de-are at Buena Vista oilfield. Other bench marks in the Elkforming well casing, which shortens and moves down-Hills area show a subsidence of 0.20-0.30 ft from 1964 toward in the grip of the compacting sediments. Because of1978. its vastly greater cross section, the pipe extensometer is
more competent than the cable to resist frictionally in-MONITORING OF COMPACTION AND duced length changes. Accordingly, it generally produces
CHANGE IN HEAD a better record in typical wells of moderate depth. Itshould be noted, however, that many other factors be-
Two principal objectives of the cooperative programyond the scope of this discussion need to be considered in"with the California Department of Water Resources onselecting an extensometer design for a specificland-subsidence studies, and essential elements of theinstallation.Federal program on mechanics of aquifer systems, are to At the present time, 9 of the extensometers in thedetermine the depth interval(s} in which compaction isSan Joaquin Valley are equipped with continuous re-occurring and to measure the magnitude and time distri-corders and 16 are visually read periodically. Of the 25bution of the compaction where possible. Such informa-extensometers, only 10 are deep enough to measure a-tion, together with periodic measurement of landlarge percentage of the aquifer-system compaction.subsidence as determined by spirit-level surveys to sur-Other sites supply measurements of compaction repre-face bench marks, is essential for determining the causesenting variable percentages (generally less than 60 per-of subsidence and for monitoring the magnitude and thecent) of total subsidence (table 6).change in rate of subsidence. When coupled with meas- Continuous or periodic water-level measurementsurement of water level or head change in the stressed aq-are also necessary in a subsidence-monitoring program inuifer systems, these supply the data required for stress-order to define the cause-and-effect relationships of thecompaction or stress-strain analysis, subsidence process. Of the 24 water-level monitoring
Since 1955, the Geological Survey has monitored aq-wells collocated with the extensometers, 18 are equippeduifer-system compaction in the San Joaquin Valley bywith continuous recorders and 6 are measured periodi-means of borehole extensometers. At present two typescally. In order to produce reliable stress-strain or stress-of extensometers are in use in 25 wells at l8 compactioncompaction plots that can be utilized to deriveand water-level monitoring sites (see fig. 40 for location),recoverable and nonrecoverable storage (compressibility)Of these, 20 are of the original taut-cable design de-and permeability parameters (Rile:~ 1969), water-levelscribed by Lofgren (1961, p. B49-B51 and figs. 24.1, 24.2)measurements must represent the average change inand 5 are of a newer design that uses a free-standing pipe.stress in the compacting interval being measured. Seven
The cable and the free-standing pipe extensometersof the extensometer/water-level observation-well pairs(fig. 39) are similar in basic concept. In the cable type, anfurnish stress-compaction plots that are adequate to de-anchor weight is attached to the extensometer cable, low-rive useful aquifer-system data.ered into the well, and set below the bottom of the well In addition to defining aquifer-system characteris-casing. This anchor acts as a depth bench mark. The ex-tics and response to pumping stress at specific locations,tensometer cable is maintained under (ideally) constantthe compaction and water-level monitors serve as indica-~ension by a counterweight at the land surface. As thetors of regional subsidence rates and supply observersaquifer system compacts, an equivalent length of cablewith data to use in deciding when areal releveling isapparently emerges from the well; this movement isneeded.measured by a mechanical recorder attached to the corn- Some of the wells used for extensometer and water-paction cable at the land surface. In the free-standinglevel monitors are former irrigation wells converted topipe extensometer, the pipe is lowered into the well andobservation wells. Others were drilled and completed spe-set below the bottom of the well casing. A mechanicalcifically for the monitoring program. Many of the formerrecorder attached to the extensometer pipe measures theirrigation wells are 20 or more years old and have beenmovement of the land surface relative to the nonmovingsubjected to many feet of compaction. The wells whosepipe and thus measures the compaction or expansion ofwell casings have failed and will continue to fail becausethe aquifer system, of casing compression caused by compaction of the aqui-
C--040941C-040941

STUDIES OF LAND SUBSIDENCE
f~r system are lost ~ �~n~ometer and water-levelTable 3 summarizes the net annual compaction or ex-measurements. Five ~ drilled specifically for exten-pansion (negative compaction) at each site through 1979~ometer installatio~ ~ g~mstructed with down-holeand also gives compaction or expansion in six additionalslip-joints to allow far(~l~a~a~ng; this kind of well
depth intervals defined by multiple-depth installations.construction helps to ~ f~e life of the well.For example, at 12/12-16H, wells H2, H3, and H4 are, re
The location of ~ ~1 sites where water-levelspectively, 1,000, 350, and 500 ft deep. The extensometerchanges and compa~�~ ~ I~ water-bearing depositsin well H2 records total compaction from laud surface toare currently being m~,~ and six sites that have beenthe 1,000-ft depth, and the extensometer in H4 measuresabandoned since 1970 ~., ~ on figure 40. the compaction from laud surface to the 500-ft depth. By
RecorderSheaves mo~
in teeter b~
Graduatedcompaction
tape
Steel SteelCounter- _------- table ~" Counterweightweights
Refere~nceReferencepoint point
Fulcrum Bench
Bench mark,mark
Concreteslab
:’...i’:.::’.:’"
’::’: Cable, 1/~-inch!:’i’::’! :: stainless steel ..::.:..:~(;": .:::.:
pipe: "~::
Perforatedcasirtg ;..;.: : :.’.:’:.
:...:::
’(",~(: i ~.: ..-... :..::."; .
:::~::1 I [":! !:’-: casing casing .’::::::,.. ..:::.
A.nchor weig ht.;:~:....
~~inopen hole ..
.:.:::!
..:..’:.!’:;i’’"
~-Reference Reference ~ "!:: Extensometer pipepoint point ~ cemented in open hole
:: :" :...-.;
B
FIGUaE39.--lh~’urd~ng ex~ensometer installations. A, the cable and B, free-standing pipe extensometers.
C--040942(3-040942

LAND SUBSIDENCE IN SAN JOAQUIN VALLEY, CALIFORNIA 145
¯ subtracting the compaction in 1-I4 from that in H2, theSeptember 1958 through 1979 occurred at well 16/15-: compaction of the 500- to 1,000-ft depth interval is34N1 {fig. 49). The well is 2,000 ft deep and is adjacent to_: calculated, the California Aqueduct in the joint-use reach in western
The maximum recorded compaction of 11.69 ft fromFresno County.
R.25E.
T.15
R.15E
EXPLANATION
Dm=~n chle~ on boun4a~consolidated ro~k:
S.T~pe of ob=ervatlon wells
W~te~ lev~l ~ DIABLO BA~E FI. 20 E. !E.35’ ¯ 36A2 BASE T.11 N. :’" --
Extensometer | R.25W. T.
,~1A2 N. SAN R.2OW. MTS
EMIGDIOAbandoned well0 10 20 30 40 ~0 60 KILOMETERS
0 10 20 30 40 MILES
FIGUI~E 40.--Location of water-level and compaction measuring sites. Base from U.S. Geological Survey, 1:1,000,000, State of California map, 1940.
C--040943C-040943
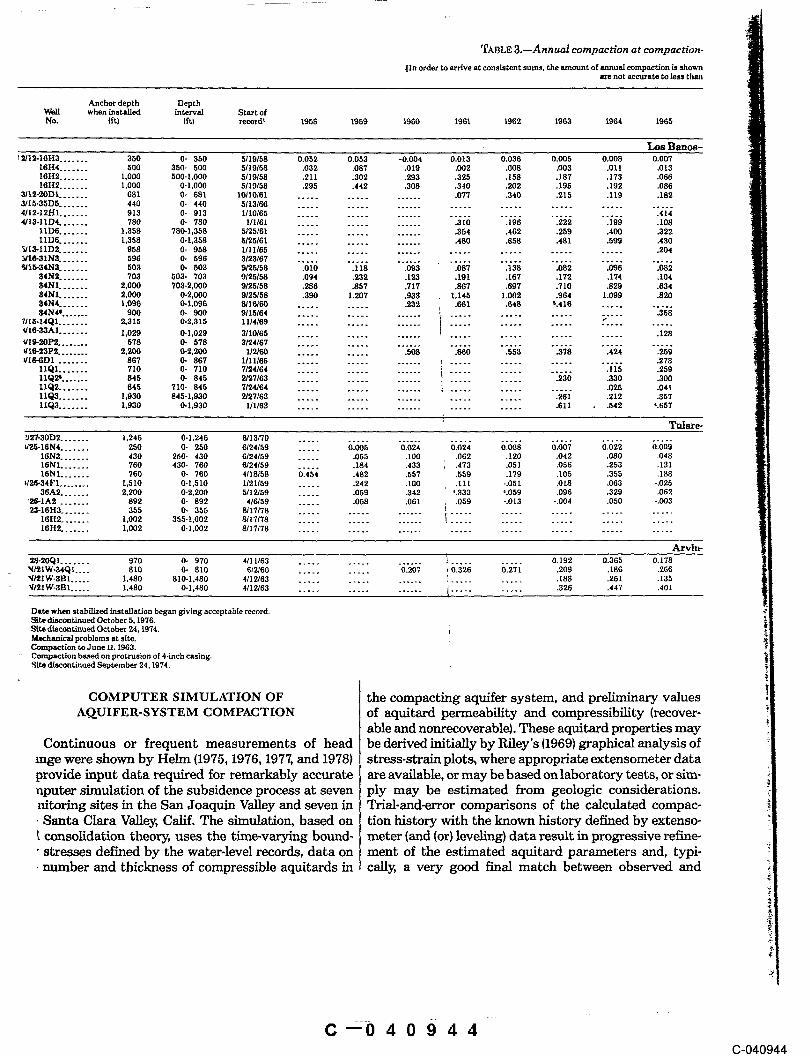
TABLE 3.--Annual compaction at compaction-
order to arrive at consistent sums. the amount of annual compaction is shownm’e not accurate to less than
Anchor depth Depth~ when installed interval Start ofNo. (ft} fit) record~ 1958 1959 1950 1961 1962 1963 1964 1965
Los Banos-’~ ~12-16PI3 ....... 350 0- 350 5/19158 0.052 0.053 -0.004 0.013 0.036 0.005 0.008 0.007
16H4 ....... 500 850. 500 ~119158 .031 .087 .019 .002 .008 .oo3 .o11 .o1316H2 ....... 1,000 500-1,000 5/19/58 .211 .302 .293 .325 .158 .187 .173 .06616112 ....... 1,000 0-I,000 5/19/58 .295 .442 .308 .340 .202 .195 .192 .088
3/12-2001 ....... 881 0. 681 I0110161 ................. 077 .340 .215 .119 .182It15-3505 ....... 440 0- 440 5/13/66 .........................................4/12-12}11 ....... 913 0- 913 1/10/65 ..................................... 4144/13-I I04 ....... 780 0- 780 1/1161 ................. 310 .196 .222 .199 .108
1106 ....... 1,358 780-I,358 5/25161 ................. 354 .462 .259 .400 .3221106 ....... 1,358 0-l,358 5125/6l ................. 480 .658 .481 .599 .430
Ydl3-11D2....... 958 0- 958 I/I 1/85 ..................................... 204,Wl~-31N’3 ....... 596 0- 596 3/23/67~15-34N3....... 503 0- 503 9]25/58 .010 .118 .093 .087 .138 .082 .096 .082
34N~. ...... 708 503- 703 9/25/58 .094 .232 .123 .191 .167 .172 .174 .i04$4N1 ....... 2,000 703-2,000 9/25/58 .286 .857 .717 .867 .697 .710 .829 .63434N1 ....... 2,000 0.2,000 9/25/58 .390 1.207 .933 1,145 1.002 .964 1.099 .82034N4 ....... 1,096 0-1,096 8~16/60 ........... 232 .661 .648 ~.416 ..........34N46 ....... 900 0- 900 9/15/64 ............................... 7,. ..... 358
7115-1401 ....... 2.315 0-2,315 1114169 .........................................1/16-33A1 ....... 1,029 0-1,029 3110165 ..................................... 128~/I~-20P’/. ....... 678 0- 578 3124167 .........................................~I~-~P~........ 2,200 0-2,200 I/2/60 ........... 508 .660 .553 .378 .424 .2591/18-6DI ....... 867 0- 867 1111165 ..................................... 273
I1QI ....... 710 0. 710 7/24/64 ................................ 115 .259I102~ ....... 845 0- 845 2/27/63 ........................... 230 .330 .3001102. ...... 845 710- 845 7/24/64 ................................ 025 .041II03 ....... 1,930 845-i,930 2/27163 .......................... .261 .212 .3571103 ....... 1,930 0.1,930 III163 ........................... 611 . .542 4.657
~27-30D2....... 1,246 0-1,246 8/13170 .........................................t/2,5-16N4 ....... 250 0- 250 6/24/59 ..... 0.005 0.024 0.024 0.008 0.007 0.022 0.009
16N3 ....... 430 250- 430 6/24/59 ...... 055 .100 .062 .120 .042 .080 .04816N1 ....... 760 430- 760 6/24159 ..... .184 .433 , .473 .051 ,056 .253 .!3118N1 ....... 760 0- 760 4118158 0,454 .482 ,557 .559 .179 .I05 .355 ,188
~42:6-34F I ........ 1,510 0-1,510 1/21159 ...... 242 .100 .111 -.051 .0tfl .063 -.02536A2 ....... 2,200 0-2,200 5/12/59 ...... 059 .342 4.333 4.059 .096 .329 .062
,’~l-lA2 ....... 892 0- 892 ’1/6/59 ...... 058 .061 , .059 -.013 -.004 .050 -.00323"16H3 ....... 355 0. 355 8/17/78 ..... I
~6H2 ....... 1,002 355.1,002 ~17178 ..... :~ ~:~: !::~: ~:~ :~::~ ~ ~16H2 ....... 1,002 0-1,002 8/17/78 .........................................
Arvln-2~.2OQ I ....... 970 o- 970 4/11/63 ................ ! .......... o.192 0.365 o.178’(I~IW-3401 .... 810 0- 810 6/2/60 .......... 0.207 ~ 0.326 0.271 .209 .186 .266N/~I W-3 B I ..... 1,480 810- 1,480 411 2/63 ................ i ........... 188 .261 .135N/~IW-3B1 ..... 1,480 0-I,480 4112/63 ................
{ ...........326 .447 .401
Date when stabilized insta!lation began giving acceptable record.Site discontinued October 5,1976.Site discontinued October 24,1974.Mechenical problems at site.Compaction to June IL 1963.Compaction based on protrusion of 4-inch casing.~[te discontinued September 24,1974.
COMPUTER SIMULATION OF the compacting aquifer system, and preliminary valuesA~UIFER-SYSTEM COMPACTION of aquitard permeability and compressibility (recover-
able and nonrecoverable). These aquitard properties mayContinuous or frequent measurements of head be derived initially by Riley’s {1969) graphical analysis of
rage were shown by Helm (1975, 1976, 1977, and 1978} stress-strain plots, where appropriate extensometer dataprovide input data required for remarkably accurate are available, or may be based on laboratory tests, or sim-nputex simulation of the subsidence process at seven ply may be estimated from geologic considerations.nitoring sites in the San Joaquin Valley and seven in Trial-and-error comparisons of the calculated compac-¯ Santa Clara Valley, Calif. The simulation, based on tion history with the known history defined by extenso-~ consolidation theor~ uses the time-varying bound- meter {and (or} leveling} data result in progressive refin~° stresses defined by the water-level records, data on ment of the estimated aquitard parameters and, typi--number and thickness of compressible aquitards in cally, a very good final match between observed and
C 040944(3-040944

LAND SUBSIDENCE IN SAN JOAQUIN VALLEY, CALIFORNIA I47
measuring sites, San Joaquin Valley
to ¯ thousandth of a foot; however, many of the measured yearly valuesa few hundredths of a foot. Minus {-) indicates expanslon.]
Tot~measured
1966 1967 1968 1969 1970 1971 1972 1973 1974 1975 1976 1977 1978 1979 compactionfit}
Kettleman CRy Area0.002 0.004 0.002 0 0.002 0 0 -0.001 0 -0.001 0.004 0.0!3 0 0 0.195.011 .0!3 .015 .008 .007 .013 .007 .016 .001 .002 1.005 ................... 273.125 .105 .075 .060 .060 .050 .039 .020 .034 .026 ..... 2.289.136 .122 .092 .068 .069 .063 .046 .035 .035 .027 .045 .096 .032 .027 2.955.120 .094 .074 .056 .032 .038 .070 .024 3.030 1.471
-.022 .014 .022 .006 .034 .050 .015 .025 .029 .024 .025 .024 .001 .008 .255.336 .239 .139 .097 .164 .100 .083 .085 .099 .067 .058 .132 .0!9 .015 2.047.!94 .160 .071 .001 .013 .013 .007 .014 a.032 ............................. 1.540.279 .326 .157 .073 .078 .057 .036 .016 .020 2.839.473 .486 .228 .074 .091 .070 .043 .030 .052 " "~ "~ "" ".’1"8"~ ~-~ "" .’0"l’~ 4.347.154 .126 .099 .060 .047 .022 .024 .006 0 .002 -.009 .069 -.012 -.022 .770
.088 .120 .092 .032 .055 .001 .045 .097 -.006 ,001 .082 -.038 -.017 .552.085 .090 .101 .130 .I12 .I04 .05! .061 .040 .058 .023 .051 .013 0 1.625.!04 .122 .118 .046 .077 .040 .031 -.010 -.~04 -.037 -.004 .073 -.020 .018 1.811.614 .604 .573 .312 .202 .108 .001 -.006 -.003 -.029 -.011 .298 4-.051 -.010 8.199.803 ,816 ,792 .488 .391 .252 .083 .045 .033 -.008 .008 .422 -.058 .008 11.635
........................................................................ 1.957.320 .340 .334 .233 .210 .231 .075 .017 "~ ..... 2.145
.079 .478 .225 .088 .013 -.032 " "-~ "-~ "" -.~’~ L.199 ~" .... 1.131.210 .186 .124 .034 .094 .060 .073 .023 .036 .009 .004 .099 -.004 -.013 1.063
.026 .070 .036 .065 .082 .065 .014 -.019 .026 .018 .121 -.035 .014 .483.552 ,355 .328 .201 .192 .143 .198 .029 ~.097 4.877.267 .280 .179 .090 .121 .074 .044 .030 -.019 .0!8 -,006 .189 -.093 ~0.022 1.469.240 .225 ,224 .149 .145 .117 .093 .034 -.016 .012 -,016 ,!79 -.025 -.0L9 1.7!6.330 .290 .280 .220 .190 .147 .090 .019 -.023 -.004 -.019 .247 -.053 -.021 2.553.090 .065 ,056 .071 .045 .030 -.003 -.015 -.007 -.016 -.003 .068 -.028 -.002 .417.240 .199 .259 ,207 .160 ~t.133 .026 -.006 -.092 -.039 .007 .308 -.105 -.083 2.044
4.570 .489 .539 .427 .350 ~L280 .116 .013 ’-.115 -.043 -.012 .555 -.158 -.104 4.717
Wasco Area..................... -0.034 0.124 0.316 0.075 0.093 0.086 0.219 0.248 0.028 0.046 1.2010.001 0 0.003 -0.002 0 .007 .004 -.002 -.002 .001 .003 .010 -.003 0 .119
.085 .003 .057 ,005 .033 .022 .058 .005 .016 .019 .039 .053 -.014 .014 .962
.225 .063 .160 .036 .100 .075 .143 .037 .041 .055 .III .146 .019 .023 2.815
.311 .066 .220 .039 .133 .104 .205 .040 .055 .075 .153 .209 .002 .037 4.528
.068 -.031 .038 -.057 ,038 -.009 .023 -.028 -.013 .002 .068 .Ill -.098 -.034 .536~.145 -.045 .168 -,060 .143 .012 .I18 -.016 .089 .017 .196 .339 -.175 -.002 2.031.096 -.012 .018 -.001 .014 -.005 .011 -.010 -.001 -.016 .017 ==.011 .330
.................................................................. -.021 .002 -.0!9
.................................................................. -.066 .038 -.028
................................................................... -.087 .040 -.047
Mar~copa Area0.255 o,219 o,124 o,124 0.095 o.o91 0.096 0.060 o.1o4 o.o66 0.040 =~o.o68 ........... 2.047.197 .13o .o14 .186 .153 .060 .070 .062 =3.o65 ............................. 2.402.229 .184 .344 .152 .149 -.OOl .Oll .o16 .065 1.733.426 .314 ,358 .338 ,302 ,059 .081 .078 .130 .086 .154 .225 ~-,016 .024 3,733
¯Flooded in 1978.~ Site dL~ontinued Sep~embar 25,1974.m Site temporarily out. November Ii, 1979,z~ D¯~ ¯djustment, 1971 annual comp¯ction estimated due to downhole casing problems."Site di~:ontinued 1978.~.t Site discontinued September 19,1974,
calculated compaction. Helm (1977) has shown that con- the aquifer system to compaction and expansion of thestant values of aquitard parameters derived from a few aquitards. Under conditions of virgin compaction atyears of paired extensometer and water-level data can be stresses greater than the maximum past stress, the com-used to predict total compaction with reasonable accu- pressibility of the aquitards so vastly exceeds that of theracy over periods of several decades, aquifers (by two or three orders of magnitude) that the
Helm (1978) tabulated significant parameters de- error introduced by this assumption is wholly insigrdfi-rived from the application of his aquitard compaction cant. However, if stress increases induced by water-levelmodel to data recorded at seven compaction and water- declines do not exceed the maximum past stress, the re-level monitoring sites in the San Joaquln Valley. These suiting elastic responses of the permeable sands (aqui-modeling results, with some modifications and deletions, lets) in the aquifer system may contribute significantlyare presented here in table 4, together with additional to the total deformation recorded by the borehole exten-material inferred from the modeling results and related someters. In addition, at stresses less than maximumdata. Helm’s model ascribes all observed deformation of past stress, the relatively small elastic compressibility of
C--040945C-040945

TASLE 4.--Computer simula~on
Monitoring Mouitored thickness Recoverable {elastic) storage paramete~ o~ the compacting confined aquifer system
$it~ ot compacting sediment~ Component due to skeletal compressibility Total {skeletal plus water compressibility) storage
~ or Aggregate Aggregate Totalslto No. aquifer aquitard monitored Aver~ ~pecific storage Storage coefflciants Average specfic stor~ Storage ccoff’~ient~
Aquifers Aquitsaod~ Aquiterd Aqu~ers Aquitard~ Aquifer Aquifers Aquitards Aquifer Aquifers Aquitsrds Aquifermodel system system system
(ft) (ft) (ft~ (ft-t) (ft-t) (ft-t) { ~ Dimensionless ~ | {ft-~) (ft-~) (ft-~) (~ Dimensiouiess ~)
14J13-11D3,6 304 274 578~
6.53x10⁴ Z01xl0-~ 1.31x10-~ 1.79x10-= 1.92x10-= ~t 7.10x10-~ 3.86xI0-~ 2o83×10.4 1.95×10-: 2.23xI0
16/15-34N4 421 876 1,297
I1’9~×10"~ ~’19xi0"~ I’$1×10"4 1"74×I0"= 1"92x10-I
I~’56xI0"~ 2"03×I0"~ 3"92x10~4 2"24xI0-~ 2"63×I0"~
18~19-20P2 263 154 1417 6.76×10~ Z~xI0"~ 1,13×10⁻⁴ 1.04×10"I 1.15×10-: 7.34xI04 3.29xl04 2ASx10°4 1.13×10"~ 1-37xI0"=19/16-23P2 638 1,324 1,960 1,81×I04 2.01xI0-~ 2.73×I0-~ Z39×10-= 2.66xI0-I 2.38xI0-~ 1.91x10-~ 5.92xI0-4 3.15×10°: 3.74xI0-:~0/18-11Ql 232 388 620 3.74xI04 3.99xI04 1.00xl0-* 1.45xI0-~ 1.55xi0-I 4.31xI0-~ 3.Oixl0-~ 2.16×t0-~ L67×I0-~ L89×10"~2~2~-16NI,3 127 278 405 0.43×10"~ 4.41xI0"~ 4,60xI0~ .546xI0-4 1.22xI0-: 1.28x10-~ 0.93x10~ 4.98×10-~ 3.70xI0"~ 1.18x10⁻⁴ 1.38×10-: 1.50×I0-=
11NI21W-3Bl 303 367 670 ~ 3.64×10"~ 3.99xI0"~ 1.30×10"~ 1.34×10-= 1.47xI0-I ~ 4.21xI0-~ 2.73×10-~ 2.82xI0-4 L54X10-~ 1.83x10-:=Pc/and and other~ (1975) and the pr~ent authors have interpreted the ~~8~te abandoned 1974.
the aquifers and aquitards allows the compressibility of component based on a porosity of 0.4. This value is repre-the pore water to assume a significant role in the total sentative of porosities measured by Johnson and othersspecific storage of the aquifers, and to a lesser extent of {1968) for a large number of cores fron~ aquitards in thethe aquitards. San Joaquin Valley
In recognition of these considerations, an attempt Although the depths, thicknesses, litholog~ andhas been made to estimate the elastic storage parameters stratigraphy of the compacting sediments vary substan-for aquifer and aquitard materials. The procedure in- tially among the seven monitoring sites in the Sanvolves splitting the skeletal component of the aquifer- Joaquin Valle3~ the values of aquitard specific storage aresystem storage coefficient, (S’~.)--derived directly from remarkably similar. The elastic values (S ’,) range fromextensometer data by Riley’s {1969) method of stress- 2.4×10-~ft-~, to Z3×10-~ft-~ and average 4.7×10-~ft-~.
strain analysis--into components attributable to the ag- These value~ differ somewhat from Helm’s model valuesgregate thickness of aquifers and the aggregate for skeletal ~pecific storage (S~.~,) because of inclusion ofthickness of aquitards. The only data available on skel~ por~water compressibility and exclusion of aquifer com-tal compressibility of the aquifers is inferred from the hy- pressibility. The inelastic values (S °~) derived fromdraulic response observed during pumping tests at the Helm’s aquitard model range from 1.4 × 10"ft-’ to?ixley monitoring site {23/25-16N) as reported by Riley 6.7 × 10-fit-~ and average 3.3 × 10-’ft-L For the aquifer sys-md McClelland (1972). For purposes of estimation a reF tern as a whole the tabulated values of elastic specifice~entative value of aquifer specific storage 0.93 × 10-~ft-~ storage {S’,) are even more consistent, ranging only be-vas selected from the range of probable values reported tween 1.9 × 10-~ft-~ and 3.9 × 10-~ft-~. These values for the)y Riley and McClelland. Assuming a porosity of 0.35, entire aquifer system have limited physical significance:he value of the skeletal specific storage for the aquifers because they combine the compressibilities and thick-~t Pixley was calculated to be 0.43 × 10-~ft-~. This value of nesses of aquifer and aquitard materials at each site.~olumetric compressibility has been used to estimate the They are, however, statistically significant in that theyontn%ution of the aquifers to the total elastic deforma- suggest that storage coefficients for the confined aquifer’on observed at all sites in the San Joaquin Valley. In the system and for stress changes in the elastic range may bebsence of site-specific data on the horizontal strain ass~ approximated with some confidence simply from a~ated with pumping, we have assumed that the entire knowledge of aquifer-system thickness.alumetric strain inferred from hydraulic response is r~ The tabulated storage properties of the aquifers and~cted in a vertical thickness change of the aquifers. This aquitards in the compacting aquifer systems are signifi-vcedure probably tends to overestimate somewhat the cant in two related but somewhat different ways. Thentribution of the aquifers to the elastic deformations component of specific storage and storage coefficient at-:orded by the vertical extensometers, tributable to compressl~ility of the granular skeleton
The contribution of aquitard compaction and expan-the sediments determines the magnitude of mechanical,n to the elastic deformation of the entire aquifer sys-deformation resulting from a unit change in head (poreu is determined by subtracting the estimated aquiferpressure}. Thus, these parameters {S,,o, S ;,,, S,o, Sxtribution from the total observed deformation. TheS ’,~, and S ’,~) permit prediction of the ultimate compac-.al Specific storage and storage coefficient values fortion or expansion that would be caused by a given decline, aquitards incorporate a pore-water compressibilityor recovery of water levels. The total storage parameters
c--0-.4 0 9 4 6(3-040946

LAND SUBSIDENCE IN SAN JOAQUIN VALLEY, CALIFORNIA I49
of aqulfer~s~yster~ compaction
Ratio of v~rgin to Vertical hydraulic Time constants Depth to water at whichNonrecoverable (virgin} elastic spe~flc conductivity of for characteristic nonrecoverable compactionstorage for the the aquitards aquitard would begin during a cycle
Aquitard storsge parameters aquitards of renewed drawdown
Sketetel Skeletal Predicted 1974specific mtorage Obas~edstorage coefficient Elastic Virgin High Low 1976-77
(ft-~) (Dimension!ess) (Dimensionless) (ft/yr) (yrs) (yrs) (ft) (ft)
4.3 × 10⁻⁴ 0.12 61 7.7 × 10⁻⁴ 0.67 40 348 426 ~330
~.4 × 10-4 .21 94 5.2 × 10⁻⁴ .44 42 377 520 41~6.7 × 10-~ .10 91 7.0 × 10⁻⁴ 2.2 215 154 163 160:$.0 X 10-4 ,40 126 .2 × 10-~ 10.7 1,350 361 5091.4 × 10-4 .05 32 1.2 × 10⁻⁴ 4.3 140 0 240 310~L3 × 10-4 .06 46 30. × 10-4 .11 5 164 220 180
2.~ × 10-4 .09 59 3.0 × 10⁻⁴ 1.3 75 33 392 < 360
that incorporate not only the skeletal compressibility butthickness. In combination these factors determine thealso the pore water compressibility {S,, S ;, S, S ’) permittime required for pore pressures throughout an aquitardcalculation of the volumes of water that are released fromto approach equilibrium with those in the adjacent aqui-or taken into storage within the confined aquifer systemfers. Thus an aquitard time constant, r, is defined asfor a given decline or recovery of water levels. S’,(b ’/2)2.
When the increasing intergranular stress caused byr = K’ The constant represents the time required
declining pore pressures exceeds the maximum pastto produce about 90 percent of the compaction {or expan-stress at any point in the aquifer system, the nonrecov-sion} that would ultimately result from a given stepwiseerable, or virgin, storage parameters {S :,,, S ’,~) becomeincrement of water-level drawdown (or recovery). Be-operative. Under these circumstances the skeletal corn-cause aquitard thickness (half thickness in the typicalportent of the aquitard storage parameters increases ma-case of an aquitard bounded both above and below bytexially, typically by factors of 50 to 100. With such largeaquifers} enters into the time constant in the secondskeletal compressibility the contribution of pore waterpower, it has a strong influence on the magnitude of thiscompressibility to the total aquitard storage parametersparameter.is relatively insignificant. Thus, when stresses are in the The wide range of thicknesses and permeabilities tovirgin range, the total aquitard storage parameters (S ;~be found among the aquitards at a given site suggestand S’, do not differ measurably from the skeletal stor-that time constants for the individual aquitards willage parameters and therefore are not tabulated. The pos-range through several orders of magnitude. Neverthelesssible role of increased aquifer compressibility at stressesit is useful for comparative purposes to calculate timegreater than maximum past stress is not known but isconstants based on the weighted average thickness andthought to be minor in comparison with the increasedpermeability of the "characteristic" aquitard at eachcompressibility of the aquitards. Therefore, the virginmonitoring site. The tabulated values show that repre-aquitard storage coefficient may be taken as virtuallysentative time constants associated with drawdowns inequivalent to the total aquifer-system storage coefficientthe range of virgin stresses may be very long, typicallywithin the limits of accuracy of the modeling procedure,several decades to several centuries. Time constants as-
It must be emphasized that the thickness and vol-sociated with water-level recovery and with fluctuationsume changes calculated from the aquitard storage pa-in the elastic range of stress are relatively short becauserameters are ultimate values; these values are attainedof the much smaller value of specific storage.only when pore pressures within the aquitards have ad-.If the duration of a given sustained stress (aquiferjusted to equilibrium with those in the adjacent aquifers,drawdown) is substantially less than the calculated timeWhen aquifer heads are drawn down, the attainment ofconstant, it may be anticipated that pore pressuressuch equilibrium depends upon the expulsion of storedwithin the medial regions of the thicker aquitards will bewater from the interior regions of the aquitards to theappreciably higher than those in the bounding aquifers.adjacent aquifers. This flow, which allows the aquitardsUnder these circumstances there is the potential for sig-to compact, is impeded by the very low permeabilitynificant amounts of residual nonrecoverable compactioncharacteristic of the aquitards and by the length of thethat would ultimately occur if that stress were sustainedflow line along which such flow must occur. Additionally,indefinitely.the required volume of flow is governed by the unit The tabulated values of elastic time constants sug-storativity (specific storage) of the aquitard and by itsgest that at many locations in the San Joaquin Valley a
" C--040947C-040947

~ ~,~ pvxnpmg season of 6 months duration is longcharacteristic aquitard. Helm’s estimates are incorpo-enough to permit a substantial fraction of the ultimaterated in table 4 of this report, along with the depths toelastic aqultard storage {S’ } to appear as flow in the aqui-water at which renewed nonrecoverable compaction waslets. However, if seasonal drawdowns create stresses inobserved during the 1976-77 period of increased pumpthe aquitards greater than the maximum past stress, theing. In general, the model was reasonably successful inprogress of transient compaction will then be in accord-predicting a range of water levels associated with the r~ance with the virgin time constants. Under these circum-sumption of perceptible subsidence.stances only a small fraction of the ultimate water ofcompaction will be yielded to wells in the course of a sin- COMPUTER PLOTS OF FIELD RECORDSgie pumping season. Many decades or centuries ofpeated seasonal drawdown and recovery through theThe records of compaction and of depth to water insame range might be required to extract most of the ulti-the extensometer wells or in nearby observation wellsmate nonrecoverable compaction calculated to resulthave been computerized on a daily basis, and computerfrom the maximum drawdown occurring each season,plots of these records through 1979 are included as fig-
In his aquitard drainage model, Helm (1977) calcu-ures 41 through 66 at the end of this report. Plots of sub-lares the time-varying distribution of pore pressuressidence of a surface bench mark located at the measuringwithin a "characteristic" aquitard of weighted averagesite, determined by periodic precise leveling to a stablethickness in response to a known or projected history ofbench mark, are also included for all or part of the periodhead change in the adjacent aquifers. As indicated by theof compaction measurement. Table 5 shpplies pertinenttime constants, the pore-pressure changes in theinformation about the individual wells (figs. 41-66). Siteaqultards will always lag behind those in the aquifers;locations are shown on figure 40.with pore-pressure declines in the virgin range the lag W~th r~spect to the objectives of the cooperativemay be very great. By calculating the excess pore pres-study of la~d subsidence, the primary purpose of includ-sure in the medial regions of a characteristic aquitarding these records is to show graphically the measuredduring aquifer drawdown, the model indicates the magnl-compaction,and subsidence at specific sites, and, so far as~ude of aquifer recovery that would be required to reversepossible, the change in effective stress in the pertinent~he hydraulic gradients in the aquitard and to stop corn-aquifers at these sites, as indicated by the hydrographs.~actiom By "remembering" the minimum pore pressuresBecause of i the confining beds and multiple-aquifer-maximum stresses) attained within the aquitardaquitard systems, it is difficult to obtain water-level~roughout the history of aquifer depletion, the modelmeasurements that specifically represent the mean~etermines whether flow and deformation processes atstress chang~ for the interval in which compaction is be-ny given time are governed by elastic or virgin storageing measured.arameters. Thus the model can compute the points onChange in applied stress and stress-compaction orn aquifer hydrograph at which nonrecoverable compac-stress-strain relationships are plotted for 16 of the 26 fig-.on of a characteristic aquitard would cease during re-ures. In these figures, compaction equals the change in~ and resume during a subsequent drawdown cycle,thickness of the compacting interval, and strain refers toor an aquitard having a longer.time constant that is athe compaction divided by the thickness of the compact-dcker or less permeable stratum, such points would oc-ing interval. Of the 16 relationships included, 7 are in the~r at lesser depths to water than for a characteristicLos Banos-Kettleman City area, 7 are in the Tulare-tuitard. Wasco area, and 2 are in the Arvin-Maricopa area.
Using the procedure just outlined, Helm 11978, tableChange in applied stress was plotted for each site whereestimated for each site a range of the "critical" depthsthe measurements of depth to water were considered towater at which subsidence would resume in the eventdefine, at least approximately, the change in appliedrenewed drawdowns from the recovered water levels ofstress on the aquifer-system thickness interval being~ early 1970’s. The estimates were based on water-levelmeasured by the extensometer.ards avsilable through 1974 and the modeled distribu-At sites where both the water table and the artesiana of residual excess pore pressures at that time. Thehead were measured, as at 16/15-34N Ifig. 49} and 23/25-h {shallow-water level} end of the range was based on16N Ifigs. 58 and 59}, the change in applied stress within acalculated maximum past stresses in the middle ofconfined aquifer system, due to changes in both the wa-thickest aquitard. The low end of the range was basedter table and the artesian head, may be summarized con-alculated maximum past stresses in the middle of thecisely (Poland and others, 1972, p. 6) as
C--040948C-040948

LAND SUBSIDENCE IN SAN JOAQUIN VALLEY, CALIFORNIA I51
T~BLE 5.--Informatlon on wells or sites for which records are included in figures 41-67
[See figure 40 for location of well or site]
Fig. ~ or Type Water-level Depth Perforated Number Number Stre~s-compa~tionNo. site No. of recorder or of interval of of or stress-strain Remarks
exten- ohervation well |ft) compac- hydr~ plot madesometer well (ft) tion graphs
plots
Los Banos-Kettlenum Cit~, Area
16H3 Cable ........... 350 6 ................ Compaction measuredto 350 ft.
16H4 Cable ........... 500 ................ Compaction measured~ to 500 ft (abandoned
1976).16H5 ........ Obs. 720 670-712 ........ 1 ................ Complex head
relations, lower zon~16H6 ........ Obs. 926 770-909 ........ 1 ................ Complex he~d
4S 13/12-20DI Cable Rac. 681 425-665 I 1 ................ PHmerfly oheervation
includ~ only part
4~ 13/15-35D5 Pipe Rec. 440 373-433 I I ................ Compacthm, upper~ hydr~raph
for all str~s-chan~interval.
44 14/12-12H1 Cable Rec. 913 740-936 I ! ................ Primati~ observation
45 14/13-1 ID3 ........ Rec. 240 180-240 ........ 1 ................ Wate~tobl~ well{abandoned 1974}.
to 780 ft (abandoned3 1974}.
11D6 Cable Rac. 1,358 1,133-1,196 Stress-sWain Compaction measuredto 1,358 ft, lowerzone obeervation
46 15/13-11D2 Cable Rec. 960 9@6-960 I 1 ................ PrLmarily observation
compactionmeasurem~mtinclud~ only part of
47 15/14-14JI ........ Rac. 1,010 Unknown ........ i ................ Representativ~ forlower zone(abandoned 1977}.
48 ¯ 15116-31N3 Cable Rec. 596 497-537 1 I Stress-compaction Compaction andhydrograph, upper
34N2 Cable ........... 703 6 ................ Compaction measuredto 703 ft~
34N3 Cable ........... 503 ................ Compaction measured
34N4 ........ Rec. 1,130 1,052-1,112 ........ I ................ Observation veil
34N5 ........ Obs. 300 240-300 .. 1 ................ Water-table well~O 17/15-14QI Cable Rec. 2,315 1,064-I,094 ""I"" 1 ................ Measures casing
deformati~m to 2,315
level51 18/16-33A1 Cable Obs. 1,070 858-1,070 I I ................ Primarily observation
well, lower zone;compactionmeasurementinclude~ only part oflower
52 18/19-20PI ........ Rec. 695 647-687 ........ 1 ................ Lower zmmobservation well
20P2 Cable Rac. 578 497-5.~7 I 1 Stre~strain Compaction and waterlevel upper zon~
20P3 ........ . Reco 222 200-222 ........ 1 ................ Upper zon~observation well
C--040949(3-040949

TABLE 5.--Information on we~ or sites for which recorda are included in figures 41-67--Continued
AP. = -{Ahe -Ah= Ya), Y, is the average specific yield (expressed as a deci-mal fraction) in the interval of water-table
ere fluctuation.
P.is the applied stress expressed in feet of water, At sites where changes in the water table were not knownh~is the head (assumed uniform) in the confined aqui- or were assumed to be zero, the plot of change in applied
fer system, stress is identical in direction and magnitude to theh,is the head in the overlying unconfined aquifer, and change in artesian head (plotted as depth to water) be-
C--040950(3-040950

LAND SUBSIDENCE IN SAN JOAQUIN VALLEY, CALIFORNIA I53
cause {1} both are expressed in feet of water, and {2} thethe gross seasonal compaction and expansion and time ofchange in stress in the confined system is solely a changeinstallation. Well 16H2 recorded 0.040 ft of apparentlyin seepage stress, with magnitude equal to the change innonrecoverable compaction superimposed on 0.097 ft ofvertical distance between the water table and the arte-elastic compression and expansion and 16H3 recordedsian head. 0.002 ft of apparently nonrecoverable compaction super-
Stress-compaction plots are included for seven wellsimposed on 0.030 ft of elastic compression and expansionin which the measured water-level change is consideredduring the 1979 drawdown and recover~to be representative for the compacting zone being meas-ured but where the thickness of the compacting zone isnot known. For example, in well 15]16-31N3 {fig. 48}, the COMPACTION-SUBSIDENCE RATIOSextensometer measures change in thickness between theland surface and the anchor at a depth of 596 ft. Inspec- Table 6 shows the amounts of measured compactiontion of the electric log (not shown} suggests that the de-and measured subsidence (elevation change} at exten-posits to a depth of 320 ft below land surface probably aresometer sites where leveling data are available. The rationot being affected by as much change in stress as is indi-of measured compaction to measured subsidence, ex-cared by the hydrograph and may not be affected by anypressed as a percentage, was computed for the period ofchange in stress. The hydrograph does represent changerecord available. Percentages are sometimes erratic forin applied stress in the depth interval 320-596 ft, and theshort periods of control at some sites; some periods ofcompacting interval is at least 276 ft thick, measured compaction and leveling are combined to make
Stress-strain plots are included for six wells in whichthe compaction/subsidence ratio more consistent, andthe measured water-level change is considered to repre-some are not shown owing to incomplete data or mechan-sent change in applied stress throughout the compactingical problems at the extensometer site.zone being measured, and where the thickness of theAt extensometer site 12/12-16H2 (1,000-ft depth}, thecompacting zone is known. For example, at site 23/25-bench-mark elevation was surveyed five times during the16N {fig. 58), the extensometers in wells N3 and N1 meas-period in which compaction was being measured. The av-ure change in thickness between the land surface and theerage compaction/subsidence ratio for the period of re-anchors at depths of 430 and 760 ft, respectively. The de-cord was 62 percent, with alow of 54 percent from Marchposits between depths of 430 and 760 ft, which are 330 ft1963 to February 1966 and a high of 71 percent from No-thick, are affected by the stress change defined by thevember 1959 to March 1963.hydrographs for wells N3 and N4. Therefore, on the Some sites listed in this table are upper-zone wells,stress-strain plot for this site and depth interval (fig. 58),such as 13/15-35D5 {table 5); the measurements representthe strain has been computed as measured compactiononly a small percentage of the overall subsidence. Otherdivided by 330 ft of thickness, wells, such as 14/12-12H1, which were drilled mainly for
The rising artesian head in the aquifers of the lowerwater-level data, are deep enough to measure only part ofzone in the Los Banos-Kettleman City area has nearlythe compaction of the lower zone.eliminated the pore-pressure differential between aqui- At extensometer site 16fI5-34N1, Cantua Creek, thefers and aquitards, hence the graphs showing a large risecompaction/subsidence ratio was 88 percent from Febru-in head from 1968 through 1979 also show a very markedary 1960 to January 1978. This site is located along thedecrease in rate of compaction. California Aqueduct in one of the maximum subsidence
Extensometer site 26/2346H, northwest of Wascoareas of the valIey. When this well was drilled in 1958,(fig. 63), was added to the subsidence monitoring pro-most irrigation wells in this immediate area were corn-gram in 1978. These wells were drilled by the Los Angelespleted at about the 2,000-ft depth. In the 1960’s, nearbyDepartment of Water and Power in 1974 at their proposedirrigation wells were drilled to depths as great as 2,700 ft,nuclear power site, which has since been abandoned, 10causing compaction in the interval below the 2,000-ftmi west of Wasco. Well 16H2 is an extensometer welltensometer well. The compaction/subsidence ratio from1,002 ft deep, perforated from 938 to 978 ft. Well 16H3 isFebruary 1975 to January 1978 was 72 percent, the low-an extensometer well 355 ft deep, perforated frSm 315 toest of record. The ratio from January 1972 to February335 ft. They were completed at these depths to supply1975 was 97 percent, the highest of record. Owing to thewater-level data for the upper and lower part of the loweradjustment of the 1975 leveling, this ratio suggests thatwater-bearing zone. However, water levels in both we[Isthe adjusted elevation of bench mark G1046 in 1975 mayare nearly the same. Both extensometers have recorded ahave been too high. The small subsidence and compac-net expansion of the aquifer system of a few hundredthstion values are greatly affected by a small change in ei-of a foot since August 1978. This net expansion is due tother value. For example, if the adjusted 1975 elevation of
C--040951C-040951

’I’~1t1,~ 6._Hatio of cvm~ion to ~bsiclenee for peviods of leve~ng in the ~s Ba~s-Kett~man
T~ W~ ~ A~in-Madcopa are~
~~h ~ ~k D~ of Subsid~ ~mpac~on ~o of~ ~ ~ ~ (ft) (ft) ~mp~o~bsiden~
-~- ~ IUI~ - ~151~ 1.256 0.894 71
~ - 1 U~/~ .621 .341 54~ 11~/~ - 0~72 .305 .~3 67
1~1~- 0~0~2 3.~1 1.912 62
~ - 1U~I~ .621 .~ 1~ 1~1~ - 0~2 ,30fi .~1 0I~ I~ll~~ .................~m~-o~s ~.~ .ova
~{~ ~ lV1~ - ~I~ I.~6 .~5 5~1~ - ~ ~79 .052 6~ - 1~ .621 .~6 7~ ~ ~ - o~s ~ .o~ lO
1~67 - 0~69 .137 .~1 59~ - I~69 .1~ .~9 45I~W- l~l .14~ .~7 48~l~ ~II~~ ................ ~- I~71 .614 ~
~ ~ - ~2 .318 .1~
~ [ ~ l~l 0~ - I~67 .916 .536 591Nl~7 - 0~69 ~54 .155 44
1~69 - 1~1 .473 .~1 59
~ - 1~7 .317 .~ 76I~ ] ~ ~]~
~ ................ ~ - 1~77 ~539 1.562 62~6 ~I~ - 0~ 1.985 1.~5 710~ - 1~ 1.611 1.178 731~1~ - 0~2 .393 .~5 62~2 - ~5 .~9 .110 43
t~I~.[ ~I~~ ................ ~I~ - ~5 ~ 4.248 ~938 69
GW~ ~I~ - 0U~I I.~
.5020~ - I~I~ 1.61~ .422
~ ................ ~I~ - 1~1~ 3.5~ .9~ 2611~ 0b~ - 0111~ ~ 1.7~ ~75 210~1~- 01~
~ .~2.052 180~ - 11/1~1 .~2 .078 2711/I~I - 0~1~5 ~ .~ .~0 13
~ ~ ~ To~ ................ ~ - 0~ ~5 2.530 .535~1~ ~1U69 - 0~1~2 .492 ,174~I~2 - 0~1 ~5 " .~0 .133 58
GI~ ~1~ - ~1~ ~.419 3.144 92~1~ - 0~1~ ~.139 ~4~1 U~ - 1 U17/~ 1.703 1.44911/1W67 - OU~ 1.011 .9~ 91OU~ - 01/17~2 I.~3 1.1040~/17ff2 - 0~1~ .154 .149 970~I~5 - 0111~8 .~ .434 72
10q 1 i.~9 9.~ 88GI~ 0~I~ - ~I~ 3.419 .846 250~I~ - 0~IU~ 3.139 .655 21~I U~ - 1 U17/~ 1.703 .375 22I II17/67 - 0U~ 1.011 .~5 2501/~ - 01/17~ i.~3 .501
01/17~2 - 0~1~ .154 .169 1100~1~5 - 01111~8 .~ .167 ~ .
%~ ................ ~151~ - 01111~8 Ii.~9 2.~ 26
C--040952(3-040952

LAND SUBSIDENCE IN SAN JOAQUIN VALLEY, CALIFORNIA I55
TABLE 6.--Ratio of compaction to subsidence for periods of leveling in the Los Banos-Kettleman City, Talare-Wasco, andArvin-Maricopa areas--Continued
Extensometer Depth Bench mark Dates of Subsidence Compaction Ratio ofNo. (ft) No. leveling (ft) (ft) compaction/subsidence
16/15-34N3 503 GI046 02/15/60 - 03/15/63 3.419 .325 I003/15/63, - 02/11/66 3.139 .247 802/11/66 - 11/17167 1.703 .158 911/17/67 - 01/28/69 1.011 .121 1201/28/69 - 01/17/72 1.233 .342 2801117/72 - 02/15/’75 .164 .153 9902/15/75 - 01111/~8 .600 .128 21
Tot, a!. ................ -02/15/60 - 01/11/78 11.259 1.474 13
15/15-34N4 900 G1046 02/11/66- 11/17/67 1.703 .598 3511/17/67 - 01/28/69 1.011 .891 3901/23/69 - 01/17/72 1.233 .660 54
Total ................. 02/11168 - 01/17/72 3.947 1.649 42
17/15-14Q1 2,315 N1216 01/15/71-02/15//5 " .426 .321 175
18/16-33A1 1,029 Y998 02/08/66 - 12/04/67 .526 .369 7012/04/67 - 10/22/69 .233 .160 6910/22/69 - 02/10/72 .079 .11002/10/72 - 02/15/75 + .014 .18702/15/75 - 01/18/"/8 .197 .117 58
Total. ............ -02/08/66 - 10/22/69 and- .............02/15/75 - 01113/78 .965 .646 68
18/19-20P2 578 A516 08/05/69 - 02/20/75 .399 .297 33
10/16-23P2 2,200 Z998 02/08/66 - 02/10/69 1.050 1.087 z10402/10/69 - 02/16/72 .620 .533 86
TotaL ................ .02/08/66 - 02/16/72 1.670 1.620 97
~0/18-6D1 867 F999 02/15/66 - 12/04/67 1.201 .494 4112/04/67 - 01/30/69 .564" .203 3601130/69 - 10;16~69 .220 .085 3910/16/69 - 06/15/75 .430 .264 6106/15/75 - 01/26/78 .474 .178 38
TotaL ................ .02/15/66 - 01/26/78 2.889 1.224 42
~0/18-11QI 710 C999 02/11/66 - 03/10/69 1.755 .676 3903/18/69 - 02/25/75 .827 .520 63
TotaL ................. 02/11/66 - 02/25/75 2.582 1.196 46
20/18-11~2 845 C999 02/11/66 - 03/18~69 1.755 .816 4603118169 - 02/25/75 .827 .534 64
TotaL ................ -02/11/66 - 02/25/75 2.582 1.350 52
20/18-11Q3 1,930 C999 02/11/66 - 03/18/69 1.755 1.561 18903/18/69 - 02/25/75 .827 1.031 125
TotaL ................. 02/11/66 - 02/25/75 2.582 2.592 100
22/27-30D2 1,246 None
2~/25-16NI 760 Q945 02/15/59 - 01/15/62 2.077 1.600 7701/15/62 - 02/15/64 .458 .284 6202/15/64 - 01/29/70 1.989 1.161 58
Total ................ -02/15/59 - 01/29/70 4.524 3.045 67
28/25-16N3 430 ~945 01/15/62 - 02/15/64 .458 .135 3002/15/64 - 01/29/70 1.989 .349 18
TotaL ................ .01/15/62 - 01/29/70 2.447 .484 20
23P25-16N4 250 Q945 01/15/62 - 02/15/64 .458 .037 802/15/64 - 01129/70 1.989 .010 I
Total- ................. 0!/15/62 - 01/29/70 2.447 .047 2
~226-34F1 1,510 $945 02/15/59 - 02/15/70 .568 .403 71
~J26-36A2 2,200 Sl156 01/15162 - 02/05/70 .561 .754
25/26-1A2 892 T945 08/20/64 - 02/05/70 .255 .141 55
C--040953C-040953

STUDIES OF LAND SUBSIDENCE
T~LE 6.--Ratio of compaction to subsidence for periods of l~veling in the Los Banos-Kettleman City, Tulare-Wasco, andA rvin-Maricopa areas--Continued
~ Depth Bench mark Dates of Subsidence Compaction Ratio of~- (ft) No. leveling (ft) (ft) compactio~ubsiden~
$~-I~L2 1,002 Noae
I~’~,I~Q1 970 L365 02/15/65 - 03106/70 1.59t .014 57
I~K~IW-34~I 810 Wl156 01/01/62 -02/15/65 1.398 .716 5102/15/65 - 03/09/70 1.870 .771 41
Total ................ -01/01162 - 03/09/70 3.268 1.487 46
11.~W~IB 1 1,480 M991 02/15/65 - 03/09/70 2.047 1.83603~09/70 - 05/03/75 .614 .572 9305/02/75 - 03/17/78 .613 .448 73
TotaL ................ .02/15/65 - 03/17/78 3.274 2,836 87l~Rmm~mste ~ *~te~ometer measures ca~ng deformation.~ ems~ted because of me~h~ical ~md |o~) data problems at the sit~.
beth mark G1046 had been only 0.015 ft lower (subsid- and Ireland, 1965). This well also me~s casing defor-eoce 1972-75 of 0.169 ft), the 1972-75 ratio would have mation due to aquifer compaction. The compaction/sub-been 88 percent. The sameerror, however, would have in- sidence ratio was 89 percent from February 1966 toczessed the 1975-78 ratio to only 74 percent. March 1969. Mechanical problems occurred at this site
At extensometer site 18/16-33A1, the compaction/ during the winter of 1965-66 and the summer of 1971. Thesubsidence ratio was 70 percent from February 1966 to 1965-66 compaction data were not adjust~t nor includedDece~i~r 1967 and 69 percent from December 1967 to in table 6, but owing to the large unexplained change inOctober 1969. From 1969 to 1972 and 1972 to 1975, meas- 1971, the 1971 compaction data were adjust~l. The com-uredcompaction was larger than subsidence. No compac- pact.ion/subsidence ratio was roughly 100 percent from~subsidence ratios are shown in table 6 for these peri- 1966 to 1975.od~ No maintenance or data problems (except the 1975 At the Pixley extensometer site 23/25-16N1, the corn-leveling adjustment) occttrred at this site and the bench pactionisubsidence ratio was 77 percent from Februarymark was not disturbed. The compaction/subsidence dif- 1959 to January 1962, 62 percent from January 1962 to~ may be related to change below the extensometer February 1964, and 58 percent from February 1964 to~pth of 1,029 ft (rebound of the aquifer system below January 1970. The decreasing compaction/subsidence ra-L029 ft with continuing compaction above 1,029 ft). The rio is directJy related to the amount of ground water~msometer measured 58 percent of the subsidence pumped. As shown in figure 29, small armual water-level~ February 1975 to January 1978 and 68 percent from fluctuation causes small amounts of compaction and,1966 to 1978. presumably, comparable amounts of subsidence. For the
Extensometer site 19/16-23P2, near an active irriga- 11years from February 1959 to January 1970, the averagedon wet1 during the time of record, shows a compaction/ ratio of compaction/subsidence was 67 percent, indicat-mbskie~ ratio of 97 percent from February 1966 toing that one-third of the compaction was occurring below.-’ebruary 1972. Well 19/16-23P2 was drilled as an oil test,the extensometer depth of 760 ft. The extensometer mea-=ased, cemented, and plugged back to 2,200 ft before b~sured 1.03 ft of compaction from January 29, 1970, the .~~g converted to an irrigation well. The well was aban-latest leveling, through December 1979.~.oned owing to low production and the Geological Records for extensometers 23/25-16N3, 430 ft deep,~ converted the well to an extensometer and water-and 16N4, 250 ft deep, are also shown in table 6. For the~ site_ Because of the well construction, the extenso-period 1962-70, 2 percent of the measured subsidence oc-~ measures casing deformation due to aquifer corn-curred above 250 ft, 20 percent above 430 ft, and 59 per-action, cent above 760 ft.
Ex1~msometer site 20/18-11Q3 is also an abandonedAt extensometer 24/26-36A2, 2,200 ft deep, the com-"2 ~est well, cased, cemented, and plugged back to 1,930paction/subsidence ratio was more than 100 percent from:. The Geological Survey converted this well to an exten-January 1962 to February 1970. Because this discrep.~meter and water-level observation site in 1962 (Polandancy was due to mechanical problems at the site, it was
not listed in table 6.
C--040954(3-040954

LAND SUBSIDENCE IN SAN JOAQUIN VALLEY, CALIFORNIA 157
At extensometer site 24/26-34F1, 1,510 ft deep, 21/2compaction/subsidence ratios are somewhat inconsis-mi west of 24/26-36A2, measured compaction equaled 71tent, perhaps because of the time variations in the failurepercent of the subsidence from February 1959 to Febru-characteristics {buckling and (or) shearing) of the deform-ary 1970. ing casings. Both of these extensometers occasionally
At extensometer site llN/2IW-3B1, 1,480 ft deep,produced erratic records that were probably related tomeasured compaction equaled 87 percent of the subsid-intermittent casing failures; compensating adjustmentsence from February 1965 to March 1978. As discussedin the data were considered necessa~, but the accuracyearlier in this report in the section on "Monitoring alongof the compensations is open to question. The third oil-the California Aqueduct," the 1975-78 compaction datatest well converted to an extensometer well, 17f15-14Q1are questionable, owing to flooding. {depth 2,315 ft), measured only 75 percent of the subsid-
A. K. Williamson (oral commun., 1981, U.S. Geologi-ence from 1971 to 1975.cal Survey} noted an interesting relationship in the SanJoaquin Valley between extensometer depth and theSUGGESTIONS FOR CONTINUED MONITORINGcompaction/subsidence ratio as illustrated in figure 67.("Long-term" compaction]subsidence ratios based onMonitoring subsidence in the San Joaquin Valley
the full period of available record were used in preparingsolely by repeated network releveling is difficult and
this figure.) This relationship is surprisingly good consid-costly because of the large area affected by land subsid-ering that it includes locations all over the valley withenee. Monitoring subsidence by occasional releveling ofdifferent sediments, confining layers, pumpage, and wellthe network and by continuing operation of deep-welldepths. Several inferences may be drawn from this rela-tensometers and water-level recorders at selected loca-tion. Almost all the compaction due to ground-watertions is suggested as the most efficient and economicalwithdrawal occurs at depths between 350 to 2,200 ft.method in this are~This is not surprising because most of the water is with- The authors suggest that consideration be given todrawn from this interval. Between these depths, the corn-the following program:pactionisubsidence ratio is shown to approximate a1. Within the next 2-3 years (1983-84L relevel the val-linear function of the logarithm of the depth. The least leywide subsidence network, preferably at thesquares regression equation of this function has an R- time the. California Department of Water Re-squared value of 0.76, which indicates that 76 percent of sources relevels the California Aqueduct. In addi-the variation of the ratio is explained by the equation, tion to releveling the networks in the threewhereas 24 percent of its variation is random (or attribut- principal subsidence areas, this survey should in-able to other factors not considered), dude extension of the networks to known subsid-
For example, on the basis of the relation shown on ing areas not now adequately covered, principallyfigure 67, a 1,000-ft extensometer in a subsidence area in the E1 Nido area, the Hanford area, and the devel-the San Joaquin Valley would record approximately 58 oping area south of Richgrove and east of Statepercent of the total subsidence measured at the well site. Highway 65.A 2,000-ft extensometer would record nearly 100 percent2. Then, relevel at 5-10-year intervals, as necessary,, re-of the total subsidence measured at the well site. This lying primarily on (a} extensometer and water-levelrelation of the extensometer depth to the compaction] data, {b} other leveling in the valley, such as alongsubsidence ratio implies that substantial head decline the California Aqueduct, {c) amount of surface wa-has extended to depths of roughly 2,000 ft within the con- ter available, and {d) ground-water pumpage to de-fined aquifer in all subsiding areas of the San Joaquin termine the need and time for releveling.Valley. This implication apparently applies, at least3. Continue the present field program of monitoringcrudely, even in areas where most irrigation wells are sub- subsidence using deep-well extensometexs and wa-stantially less than 2,000 ft deep. ter-level observation wells, as the least costly
It should be noted, however, that much of the control method of surveillance between relevelings. Theon the deep end of the curve is provided by the three oil- monitoring program should be reviewed periodi-test wells in the Los Banos-Kettleman City area that cally, This review should include consideration ofwere converted to extensometer wells and that measure the geographic coverage of extensometer wells rel-casing deformation due to aquifer compaction. Two of ative to subsidence severity, the depths of exten-these wells, 19/16-23P2 {depth 2,200 ft} and 20]18-11Q3 someter wells relative to the depth interval of(depth 1,930 f0, appear to measure nearly 100 percent of compacting deposits, and the perforated intervalsthe subsidence (fig. 67}. However, as shown in table 6, the of observation wells, relative to the thickness in-
C--040955C-040955

tervals measured by the extensometers. Consider- SELECTED REFERENCESation also should be given to replacingextensometer wells, to replacing extensometer ca-Bul~ W. B., 1964a, Alluvial fans and near-surface subsidence in westernbles with pipes to improve the accuracy of the mea- Fresno Count~ Califorai~ U.S. Geological Survey Professional Pa-
surements, to replacing, at some sites, the entireper 437-A, 71 p.____1964b, Geomorphology of segmented alluvial fans in western
installation with a well of more suitable construc- Fresno Count~ CaIHorniw U.S. Geological Survey Professionaltion, and, finally, to constructing at a few strategic per 352-E, p. 89-129.sites extensometers that penetrate the full thick-______2972, Prehistoric near-surface subsidence cracks in westernhess of compacting sediments. Fresno Count~ Californim U.S. Geological Survey Professional Pa-
per 437-C, 85 p.
I
100 ~’ ~ O
~
RATIO (%1 = 133 Ioglo depth-341.~ ’ /80~¯ --
/ oO ¯
O
60O , _
40 . o/ / oo
_ _
_
O O O Los Banos/Kettleman City area
20 -- ¯ / O ¯ Tulare/Wasco area ~
Arvin/Maricopa area
0 ¯ I I I I0 500 1,000 1,500 2,000 2,500
DEPTH OF EXTENSOMETER, IN FEET
FIGURE 6Z--Relation of compaction/subsidence ratios to depth at extensometer wells in the San Joaquin Valley.
C--040956C-040956

LAND SUBSIDENCE IN SAN JOAQUIN VALLEY, CALIFORNIA I59
¯ ____~1975, Land subsidence due to ground-water withdrawal in theSan Joaquin Valley: Inter-Agency Committee on Land SubsidenceLos Banos-Kettleman City area, California. Part 2, Subsidence in the San Joaquin Valle~ Sacramento, Calif., 60 p.and compaction of deposits: U.S. Geological Survey Professional ___._1958, Progress report on land-subsidence investigations in thePaper 437-F, 90 p. San Joaquin Valley, California, through 1957: Inter-Agency Corn-
Bull, W. B., and Miller, R. E., 1975, Land subsidence due to ground- mittee on Land Subsidence in the San Joaquin Valley, Sacramento,water withdrawal in the Los Banos-Kettleman City area, Califor- Calif., 160 p.nia. Part 1, Changes in the hydrologic environment conducive to Johnson, A. I., Moston, R. P., and Morris, D. A., 1968, Physical andsubsidence: U.S. GeologiCal Survey Professional Paper 437-E, 71 p. hydrologic properties of water-bearing deposits in subsiding areas
Bull, W. B., and Poland, J. F., 1975, Land subsidence due to ground- in central California: U.S. Geological Survey Professional Paperwater withdrawal in the Los Banos-Kettleman City area, Califor- 497-A, 71 p.nia. Part 3, Interrelations of water-level change, change in Lofgren, B. E., 1960, Near-surface land subsidence in western Sanaquifer-system thickness, and subsidence: U.S. Geological Survey Joaquin Valley, California: Journal of Geophysical Research, v. 65,Professional Paper 437-G, 62 p. no. 3, p. 1053-1062.
California Department of Water Resources, 1960, Regional subsidence ~961, Measurement of compaction of aquifer systems in areas ofexploration, debris flow study, in Engineering geology of debris land subsidence, in Geological Survey Research 1961: U.S. Geologi-flows along the southwest side of the San Joaquin Valley, California, cal Survey Professional Paper 424-B, p. B49-B52.1957-59: California Department of Water Resources, Exploration _.____1963, Land subsidence in the Arvin-Maricopa area, San JoaquinSection Report E-3, 31 p. Valle~ California, in Geological Survey Research 1963: U.S. Geolog-
_~__1964, Design and construction studies of shallow land subsidence ical Survey Professional Paper 475-B, p. B171-B175.for the California Aqueduct in the San Joaquin Valley--lnterkn re- _______1966, Tectonic movement in the Grapevine area, Kern County,port~ California Department of Water Resources, 130 p. California, in Geological Survey Research 1966: U.S. Geological
Croft, M. G., 1972, Subsurface geology of the Late Tertiary and Quater- Survey Professional Paper 550-B, p. B6-B11.nary water-bearing deposits of the southern part of the San ~968, Analysis of stresses causing land subsidence, in GeologicalJoaquin Valley, California: U.S. Geological Survey Water-Supply Survey Research 1968: U.S. Geological Survey Professional PaperPaper 1999-H, 29 p. 600-B, p. B219-B225.
Davis, G. H., and Green, J. H., 1962, Structural control of interior drain- ~969, Land subsidence due to the application of water, in Varnes,age, southern San Joaquin Valley, California, in Geological Survey D.J., and Kiersch, George, eds., v. 2 of Reviews in EngineeringResearch 1962: U.S. Geological Survey Professional Paper 450-D, Geology: Boulder, Colo., Geological Society of America, p. 271-303.p. D89-D91. ____1975, Land subsidence due to ground-water withdrawal, Arvin-
Davis, G. H., Green, J. H., Ohnsted, E H., and Brown, D. W., 1959, Maricopa area, California: U.S. Geological Survey Professional Pa-Ground-water conditions and storage capacity in the San Joaquin per 437-D, 55 p.Valley, California: U.S. Geological Survey Water-Supply Paper ~979, Changes in aquifer-system properties with ground-water1469, 287 p. depletion, in Evaluation and Prediction of Subsidence: American
Davis, G. H., Lofgren, B. E., and Mack, Seymour, 1964, Use of ground- Society of Civil Engineers, p. 26-46.water reservoirs for storage of surface water in the San Joaquin Lofgren, B. E., and Klausing, R. L., 1969, Land subsidence due toValley, California: U.S. Geological Survey Water-Supply Paper 1618, ground-water withdrawal, Tular~Wasco area, California: U.S. Geo-125 p. logical Survey Professional Paper 437-B, 103 p.
Davis, G. H., and Poland, J. E, 1957, Ground-water conditions in the Meade, R. H., 1964, Removal of water and rearrangement of particlesMendota-Huron area, Fresno and Kings Counties, California: U.S. during the compaction of clayey sediments--review: U.S. Geologi-Geological Survey Water-Supply Paper 1360-G, p. 409-588. cal Survey Professional Paper 497-B, 23 p.
Hall, C. E., and Carlson, J. W., 1965, Stabilization of soils subject to ~967, Petrology of sediments underlying areas of land subsidencehydrocompaction: Association of Engineering Geologists Bulletin, in central California: U.S. Geological Survey Professional Paperv. 2, no. 2, p. 47-58. 497-C, 83 p.
Harris, R. M., 1977, Ground-water use during the drought: Regional _.____1968, Compaction of sediments underlying areas of land subsid-Water Users Conference, 11th, Fresno, Calif., 1978, 3 p. ence in central California: U.S. Geological Survey Professional Pa-
Helm, D. C., 1975, One-dlmensional simulation of aquifer-system corn- per 497-D, 39 p.paction near Pixley, California. 1, Constant parameters: Water Re- Miller, R. E., Green, J. H., and Davis, G. H., 1971, Geology of the corn-sources Research, v. 11, no. 3, p. 465-478. pacting deposits in the Los Banos-Kettleman City subsidence
__.~1976, One-dimensional simulation of aquifer-system compaction area, California: U.S. Geological Survey Professional Paper 497-E,near PLxley, California. 2, Stress-dependent parameters: Water Re- 46 p.sources Research, v. 12, no. 3, p. 375-391. Mitten, H. T., 1972, Ground-water pumpage, San Joaquin Valley, Caii-
_____.1977, Estimating parameters of compacting fine-grained in-fornia, 1967-68: U.S. Geological Survey open-file report, 6 p.terbeds within a confined aquifer system of one-dimensional simu-~976, Estimated ground-water pnmpage in parts of the Sanlatiou of field observations, in International Symposium on LandJoaquin Valley, California, 1969-71: U.S. Geological Survey open-Subsidence, 2d, Anaheim, California 1976, Proceedings: Intema:file report, 9 p.tional Association of Hydrological Sciences Publication 121, p.__~1980, Estimated agricultural ground-water pumpage in parts of145-156. the San Joaquin Valley, California, 1975-77: U.S. Geological Survey
~978, Field verification of a one-dimensional mathematical modelOpen-File Report 80-1281,11 p.for transient compaction and expansion of a conf’med aquifer sys-Mitten, H. T., and Ogilbeo, William, 1971, Ground-water pumpage intera, in Specialty Conference on Verification of Mathematical and parts of Merced, Madera, Fresno, Kings, and Tulare Counties, Cali-Physical Models in Hydraulic Engineering, College Park, Mary- fornia, 1962-66: U.S. Geological Survey open-file report, 8 p.land 1978, Proceedings: American Society of Civil Engineers, p.Ogilbee, William, and Rose, M. A., 1969a, Ground-water pumpage in189-196. Kern County, San Joaquin Valley, California, 1962-66: U.S. Geologi-
Inter-Agency Committee on Land Subsidence in the San Joaquin Valley,cal Survey Basic-Data Compilation, 5 p.1955, Proposed program for investigating land subsidence in the~969b, Ground-water pumpage on the west side of the San
C 040957C-040957

U~. Geological Survey Basic- ____1970, Regional Geolog~ rev. by Prol~povich, N. P.: U.S. BureauReclamation Central Valley Project, Drawing Number 805-208-
Land subeidence due to with- 1646.&mm~Id~ ~" ~ I~ J., ~mi ~ George, eds., v. 2 ofRiley, E ~, 1969, Analysis of borehole extensometer data from central
Bouide~ Colo., Geological Soci- California, in Tison, L. J., ed., Land subsidence, v. 2: InternationalAssociation of Scientific Hydrology Publication 89, p. 423-431.
l~’d~J-F~m~lF-mmm~,l~E.~1966,Hydrogeclogyandhndsubsid-.____1970, Land-surface tilting near Wheeler Ridge, southern San~-~ ~m~ ~ ~v~ C.,~lii~tmia" in Ba[k~y, E. H., ed., Geology Joaquin V~Hey, Califorula: U.S. Geological Survey Professional Pa-
~ of Mines and Geology per 497-G, 29 p.~ F. S., and McClelland, E. J., 1972, Application of the modified
Sh~tening and protrusion of a theory of leaky aquifers to a compressible multiple-aquifer system:~ ~g ~m~ ~ ~ml~m v~ sediment~ in a subsiding area inU.S. Geological Survey open-file report, 96 p.
tte~m:h I965: U.S. GeologicalU.S. Bureau of Reclamation, 1974, Technical record of design and con-p. B180-B183. struction, Central Valley Project, West San Joaquin Division, San
IN~m~ J~ F~ I~’~�~,K F-~ l~l~d, R. L~ and pugh, R. G., 1975, Land Luis Unit, California, History, general description, and geology" v. 1;~ ~ fl~ ~m J$~l~i~ V~lle~ ~ as of 1972: U.S,164p.
~ 437-H, 78 p. _____1978, 9th Annual Report of Project Effects on Sub-Corcoran Wa-P~i~m~l, J- E, Ld~a i~ F~-~ ~mi II~t~ E S, 1972, Glossary of selectedter Levels in the San Luls Service Area, December 1976 to Decem-
m~h~ics of aquife~ systems and her 1977,11 p.~ U.S. Geological SurveyWilliamson, A. K., 1982, Evapotranspiration of applied water, Central
Valley, California, 1957-78: U.S. Geological Survey Water-Re-Pmlml~k~a N- ~ ~ H~ml~m of eoils along the San Luiseources Investigations 81-15, 56 p.
Com~, C~Yffomia" in Abstracts Wood, P. R., ~nd Davis, G. H., 1959 [1960], GrottoS-water conditions inf~=G~l~i~y dAm~k~ Spechd Paper 73, p. 60. the Avenal-McKittrick area, Kings and Kern Counties, California:
U.S. Geological Survey Water-Supply Paper 1457,141 p.
C--040958C-040958

FIGURES 41-66
C--040959C-040959

COMPACTION, COMPACTION, COMPACTION, COMPACTION, DEPTH TO WATERIN FEET IN FEET IN FEET IN FEET LAND SURF.a~ IN
SUBSIDENCE, IN FEET
C--040960(3-040960

COMPACTION, DEPTH TO WATER BELOWIN FEET LAND SURFACE, IN FEET
~ ~ ~ ~ ~ ~ ~ o COMPAC~ON, DE~ TO WA~R BELOW
~~ IN FE~ ~ND SURFA~, IN FEET
~ SUBSIDENCE,~ IN FEET
SUBSI~N~,
C--040961(3-040961

~’J COMPACTION, DEPTH TO WATER BELOW~ IN FEET LAND SURFACE, IN FEET
~ SUBSIDENCE,~ IN FEET
C--040962(3-040962

CHANGE IN APPLIED STRESS, DEPTH TO WATER BELOWCOMPACTION, IN FEET IN FEET OF WATER LAND SURFACE, IN FEET
--X
~~~ o~ ~, ’
SUBSIDENCE, IN FEET
C--040963C-040963

COMPACTION,IN FEET
CHANGE IN APPUED STRESS, ~ ~ ~ ~ ~ L~ ~ ~IN ~ OF WATER
\ .
° (
C--040964(3-040964

DEPTH TO WATERBELOW LAND
SURFACE. IN FEET ~ COMPACTION. DEPTH TO WA’I"I~R BELOW
~ ~ <~ c~ ~ ~ ~ ~IN FEET LAND SURFACE. IN FEET
,/
~ SUBSIDENCE,~ IN ~
C--040965C-040965

CHANGE In APPLIEDCOMPACTION, STRESS. In FEET OEPTH TO
~ -.,~o o~ IN FEET~ -., .-* OF WATER ~AND SURI~c~,W&’T~RIN I~LOW FEET
_ .
CHANGE iN APPLIEDSTRESS, ~N FEET ~i "
OF WA~R
IN FEET
C--040966C-040966

COMPACTION, CHANGE IN APPLIED STRESS, DEPTH TO WATER BELOWIN FEET COMPACTION. IN FEET IN FEET OF WATER LAND SURFACE, IN FEET
o
/_ ~---
C--040967C-040967

6L61. 8L6/, LL6L 9L6~ qL61. PL6~ ~:L6L ~L6L I.L6L OL6L 696L 896L L96~ 996L �~96L t’96L ~96L Z;96L L96t. 096~ 6.~6L ~6t. ~’~’L
O’&L ~
~ ~ ~9t~OL9 ~euJ qoue9
CO ~ 0°9 z
r~
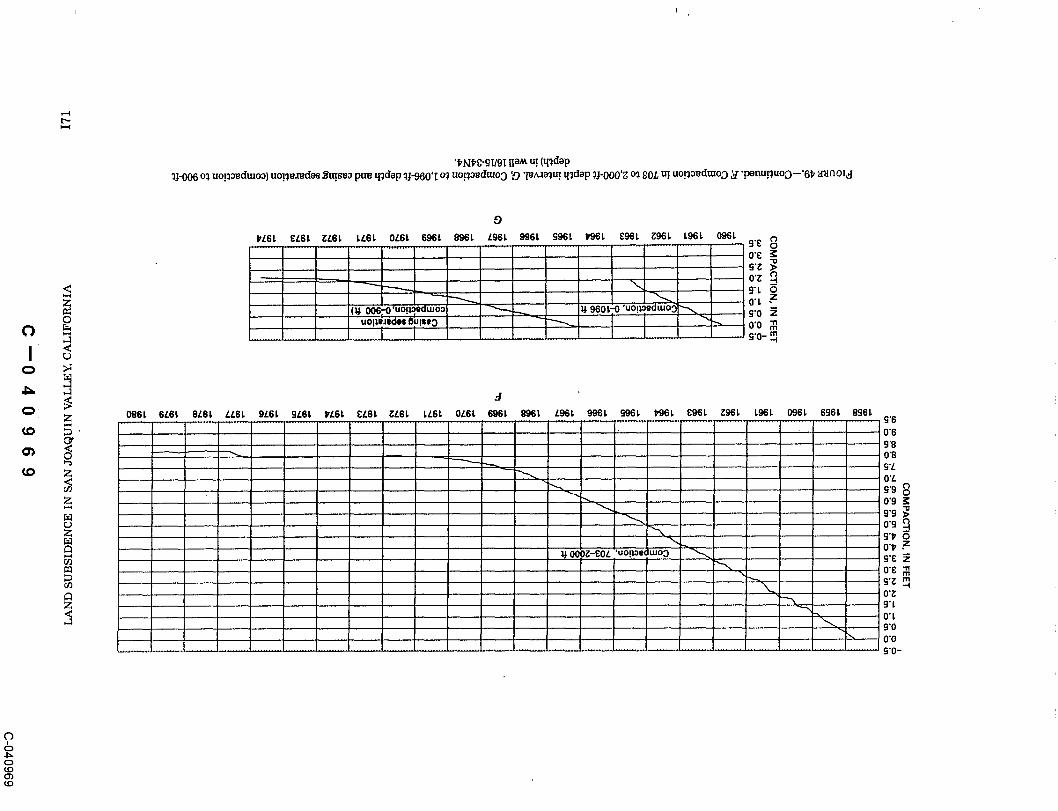


COMPACTION, DEPTH TO WATER BELOWIN FEET LAND SURFACE, IN FEET
I
.~~ ~
IN FEET LAND SURFACE, IN FEET
SUBSIDENCE,IN RET
SUBSIDENCE,IN FEET
C--040971(3-040971

CHANGE INCOMPACTION, APPLIED STRESS, DEPTH TO WATER BELOW DEPTH TO WATER
IN FEET IN FEET OF WATER LAND SURFACe, IN FI~ET LAND SURFACE, IN FEE"
~ ~ ", .....
~ ," ~ ~ LAND SURFACE, IN FEET
-
SUBSIDENCE.
C 040972(3-040972

CHANGE IN APPUED STRESS,IN FEET OF WATER
C--040973C-040973

FIGURE 53.--Hydrograph, change in applied stress, compaction, subsidence, and stress-compaction relationship, 19fI6-23P2. A, Hydrographof well 19f16-23P2. B, Change in applied stress, water table assumed constant. C, Compaction to 2,200-ft depth at well 19fI6-23P2 andsubsidence of bench marks Z888, 575 ft south-southwest, and Z998 at well 19/16-23P2. D, Stress change versus compaction of depositsabove 2,200-ft depth.

~j COMPACTION, DEPTH TO WATER BELOW~ IN FEET LAND SURFACE, IN FEET
-~
SUBSIDENCE, IN FEET
C--040975C-040975

COMPACTION, DEPTH TO WATER BELOW~ IN FEET LAND SURFACE, IN FEET
IN FEET OF WA~R
~ .- -~ - _
.~ ~~"
~...~.
C--040976C-040976

CHANGE INAPPLIED STRESS, DEPTH TO WATER BELOW
COMPACTION, IN FEET COMPACTION, IN FEET IN FEET OF WATER LAND SURFACE, IN FEET
",
~ .........
SUBSIDENCE. IN R~
C--040977C-040977


~ CHANGE IN DEPTH TO WATER~, COMPACTION, APPLIED STRESS, BELOW LAND
o" .o ;~ IN FEET IN FEET OF WATER SURFACE, IN FEET
C--040979(3-040979

CI’IAJ~GE INAPPLIED STRESS, DEPTH TO WATER
COMPACTION, IN FEET COMPACTION, IN FEET IN FEET OF WATER LAND SURFACE, IN
~
SUBSI~ m ~ET
o o~0~8oC-040980

~960~0-0
1,8601’0--0
LAND SUBSIDENCE IN SAN JOAQUIN VALLEY, CALIFORNIA I83

COMPACTION, COMPACTION. CHANGE IN APPLIED DEPTH TO WATER BELOWIN FEET IN FEET STRESS IN FEET OF WATER LAND SURFACE, IN FEET
-
,0
iO
__
~g.~
-
C--040982C-040982

CHANGE IN APPLIED STRESS,IN FEET OF WATER
C--040983C-040983

CHANGE IN DEPTH TO WATERCOMPACTION, APPLIED STRESS, BELOW LAND
IN FEET IN FEET OF WATER SURFACE, IN FEETt
0
¯ ~ ~ ~ <
~ oo
~N~, IN FEET
C--040984 -C-040984

COMPACTION, CHANGE IN APPLIED STRESS, DEPTH TO WATER BELOWIN FEET IN FEET OF WATER LAND SURFACE, IN FEET
SUBSIDENCE,IN FEET
C--040985C-040985

CHANGE IN APPL/ED STRESS,IN FEET OF WATER

COMPACTION, CHANGE IN APPLIED STRESS, DEPTH TO WATER BELOWIN FEET IN FEET OF WATER LAND SURFACE, IN FEET
IN FEET OF WA~R ~ ~ ~ .
(
SUBSIDENCE,IN FEET
C--040987C-040987

CHANGE INCOMPACTION, APPLIED STRESS, DEPTH TO WATER BELOW
IN FEET IN FEET OF WATER LAND SURFACE. IN FEET
CHANGE ~N APPL,ED STRESS.= o ~ "2 .o=~, ~ ,~ ~ ~ o {i ~ o ~ ~ ~ ~ ~n IN FEET OF WA~R ....
, COMPACTION, APPLIED S~ESS, ~ TO WA~R BELOWIN FEET IN FEET OF WA~R ~ND SURFACE, IN FEET
IN FEET OF WAT ER o
C--040988C-040988

CHANGE IN DEPTH TO WATERCOMPACTION, APPLIED STRESS, BELOW LAND
IN FEET IN FEET OF WATER SURFACE, IN FEETCHANGE IN APPLIED STRESS,
IN FEET OF WATER
_
C--040989C-040989

0660’�0-0
06601’0--0
~t UDI~ OF LAND SUBSIDENCE

C--040991C-040991

Studies ofLand Subsidence
GEOLOGICAL SURVEY PROFESSIONAL PAPER 437
This volume was publishedas separate chapters A-I
C 040992C-040992

DEPARTMENT OF THE INTERIOR
WILLIAM P. CLARK, Secretary
U.S. GEOLOGICAL SURVEY
Dallas L. Peck, Director
For sale by the Distribution Branch, Text Products Section,U.S. Geological Survey, {304 South Pickett St., Alexandria, VA 99304
C--040993C-040993

CONTENTS .
(A) Atluvial Fans and Near-Surface Subsidence in Western Fresno County, California, by W-flliamB. Bull.
(B) Land Subsidence due to Ground-Water Withdrawal, Tulare-Wasco Area, California, by B. E.Lofgren and R. L. Klausing.
(C) Preldstoric Near-Surface Subsidence Cracks in Western Presno County, California, By W-flliamB. Bun.
(D) Land Subsidence Due to Ground-Water Withdrawal, Arvin-Maricopa area, California, Ben E.Lofgren.
(E) Land Subsidence Due to Ground-Water Withdrawal in the Los Banos-Kettleman City Area,California, Part 1. Changes in the Hydrologic Environment Conducive to Subsidence, byV~flliam B. Butl and Raymond E. Miller.
(F) Land Subsidence Due to Ground-Water Withdrawal in the Los Banos--Kettleman City Area,California Part 2. Subsidence and ComImction of Deposits, By W’flliam B. Bull
(G) Land Subsidence Due to Ground-Water Withdrawal in the Los Banos-Kettleman City Area,California, Part 3. Interrelations of Water-Level Change, Change in Aquifer-SystemThickness and Subsidence, by William B. Bull and Joseph F. Poland.
(H) Land Subsidence in the San Joaquin Valley, California, ~s of 1972, by J. F. Poland, B. E.Lofgren, R. L. Ireland, and R. G. Pugh.
(D Land Subsidence in the San Joaquin Valley, California, as of 1980, by R. L. Ireland, J. F.Poland, and F. S. Riley.
GPO 787-0421130
C--040994(3-040994

C--040995C-040995


