Land management scenario modeling for alleviating impacts ...
21
Land management scenario modeling for alleviating impacts on water resources Odile Leccia-Phelpin September, 20. 2018
Transcript of Land management scenario modeling for alleviating impacts ...

Land management scenario modelingfor alleviating impacts on water resources
Odile Leccia-PhelpinSeptember, 20. 2018

Contents
Objectives the scenario modeling, part of the IMAS method
Objectives Material Implementation Calibration AnalysisMethods
Which methods ?
As a tool, SUFI2 and PEST
Calibration/validation and sensitivity analysis
The implementation and the case study
Analysis of the main results and conclusion

The objectives of IMAS (Integrated Modelling of Agricultural Scenarios)
Why for the IMAS1 decision making method ?
Supply water managers with an integrated and collaborativeapproach
Assess land-use and farming systems and agricultural practices
Objectives Material Implementation Calibration AnalysisMethods
1(Vernier, Leccia-Phelpin et al. 2017)
-> Thus, the impact of land cover and plant cover on the nutrients, pesticide and hydrological transport in the surface waters has to be defined with spatialized parametrization and the SWAT model calibrated on the most sensitive spatialized parameters

The agricultural practices defined by crop * soil types are implemented and spatialized at the HRU level into mgt files though the Generator of landuse version 2 (GenLU2)
Sensitivity analysis, calibration and validation are lead on a large number of spatialized parameters. Two non-intrusive programs are tested for sensitivity analysis and calibration/validation
Objectives Material Implementation Calibration AnalysisMethods

Hydrological par.
Nitrate par.
Stream flow calibration
Calibrated hydrological parametersCalibrated nitrate parametersCalibrated plant growth parametersCalibrated pesticide parameters
Parameters to calibrate Sensitivity analysis, calibration & validation processes Availibility of obs. data
Plant growth par.
Pesticide par.
Calibrated hydrological parameters
Calibrated hydrological parametersCalibrated nitrate parametersCalibrated plant growth parameters
Water quality monitoring st. (#)Glyphosate 32Metolachlor 42MCPA 44Aclonifen 35Chlorpyriphos-ethyl 44Isoproturon 44Mancozeb 15Methaldehyde 32
Tebuconazole 35
57 water quality stations for nitrate monitoring
4 gauging stations (2006 – 2012)+ 2 at the basin upstream (inland)
Agricultural census refinedat the soil type by expertise
Calibrated hydrological parametersCalibrated nitrate parameters
Nitrate Cc in fresh waters
Crop yields
Pesticide Cc in fresh waters
Objectives Material Implementation Calibration AnalysisMethods
Adapted from Rapport de stage, Santos

Objectives Material Implementation Calibration AnalysisMethods
Methods of calibration of the SWAT model
The Sequential Uncertainty Fitting (SUFI2) algorithm part of SWAT-CUP(Abbaspour, 2013)
PEST: Parameter Estimation and Uncertainty Analysis (PEST) tool (Doherty, 2005)

Optimization method 1: SUFI2
Objectives Material Implementation Validation AnalysisMethods
In User Manual of SwatCup, K. Abbaspour,
Written by K. Abbaspour, dedicated to SWAT calibration and uncertaintyanalysis copies and writes into
SWAT model input files, reads SWAT model
output executes SWAT and
runs it many times (pleasingly parallel)
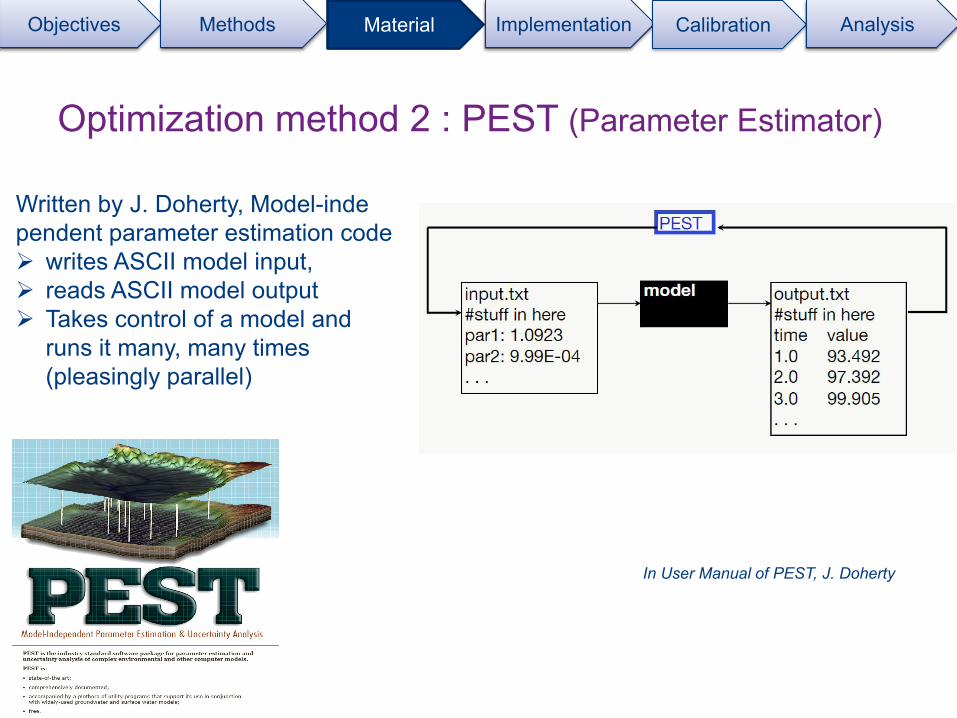
Optimization method 2 : PEST (Parameter Estimator)
Written by J. Doherty, Model-inde pendent parameter estimation code writes ASCII model input, reads ASCII model output Takes control of a model and
runs it many, many times (pleasingly parallel)
Objectives Material Implementation Calibration AnalysisMethods
In User Manual of PEST, J. Doherty

Objectives Material Implementation Calibration AnalysisMethods
Depth, conductivity, porosity...
Dimension, qualité d'eau...Dimension, water quality..
Precipitation, temp., radiation...
Texture, conductivity, porosity...
Cultures, fertilisant, pratique...Crop rotations, mgt op...
SWAT Implementation on a water supply catchment file
Adapted from SWAT User Manual

Objectives Material Implementation Calibration AnalysisMethods
Spatialization of the observed data
Protected drinking water supply basin of Coulonge & St Hippolite (S.-W. France)

Objectives Material Implementation Calibration AnalysisMethods
Weather parameter spatialization
PrecipitationTemperatures (min/max)
HumiditySolar radiationWind speed
Spatialization of daily time serie climate parameters
Water streamsSubbasins

Parameter Physical explanation Spatialisation Number of par.
CN2 Initial SCS runoff curve number for soil moisture condition II By soil type 9
CNOP Updated Curve Number (CN2) in plant, tillage and harvest/ kill operations
By soil type for each crop growing on the HRU 100
CH_N1 Manning’s value for the tributary channels Uniform 1
GW_DELAY Delay time for aquifer recharge By contributory area at each station 4
ALPHA_BF Baseflow alpha factor (1/days) By contributory area at each station 4
GWQMN Threshold depth of water in the shallow aquifer required for return flow to occur By contributory area at each station 4
CHW2 Average width of main channel Uniform 1CHD Depth of main channel Uniform 1
CH_N2 Manning’s value for the main channel Uniform 1ESCO Soil evaporation compensation factor By soil type 9
EPCO Plant uptake compensation factor Different for each crop rotation 37
MSK_X Weighting factor to control impact of the storage time constant for low flow Uniform 1
SURLAG Surface runoff lag coefficient Uniform 1CANMX Maximum canopy storage Different for each crop rotation 37
OV_N Manning’s value for overland flow Different for each crop rotation 37SOL_KSAT Saturatead hydraulic conductivity By soil type 9SOL_AWC Available water capacity of the soil layer By soil type 9SOL_BD Moist bulk densty By soil type 9SOL_Z Depth from siol to bottom of layer By soil type 9BLAI Maximum potenetial leaf area index By crop 16
GW_REVAP Groudwater « revap » coefficient By contributory area at each station 4
Objectives Material Implementation Calibration AnalysisMethods
Calibration on hydrological parameters

Parameter name Physical explanation Spatialization Number of parameters
ANION_EXCL Fraction of soil porosity from which anions are excluded By soil type 9
CDN Denitrification exponential rate coefficient Uniform 1
CMN Rate factor for humus mineralization of active organic nutrients Uniform 1
ERORGN Oragnic N enrichment ratio for loading with sediment Uniform 1
HLIFE_NGW Half-life of itrate in the shallow aquifer (days) By contributive area at each gauging station 4
NPERCO Nitrate percolation coefficient Uniform 1
N_UPDIS Nitrate uptake distribution parameter Uniform 1
RSDCO_PL Residue décomposition coefficient By crop type 16
SDNCO Denitrification threshold water content Uniform 1
SOL_CBN Organic carbon content (% soil weight) By soil type 9
Calibration on nitrate parameters after spatialization
Objectives Material Implementation Calibration AnalysisMethods

Parameter Name t-Stat P-ValueCNOP{..}.mgt 4.09 0.00CANMX.hru 3.86 0.00CNOP{..}.mgt 3.67 0.01SOL_K(..).sol 3.41 0.01CNOP{..}.mgt 3.26 0.01BLAI{..}.crop.dat 3.09 0.01SOL_BD(..).sol 3.05 0.01CANMX.hru 2.95 0.02CNOP{..}.mgt 2.90 0.02SOL_AWC(..).sol 2.86 0.02CH_N2.rte 2.82 0.02CNOP{..}.mgt 2.82 0.02CANMX.hru 2.73 0.02CNOP{..}.mgt 2.71 0.02CNOP{..}.mgt 2.63 0.03SOL_Z(..).sol 2.57 0.03CANMX.hru 2.56 0.03CH_D.rte 2.37 0.04CNOP{..}.mgt 2.25 0.05CNOP{..}.mgt 2.20 0.06SOL_AWC(..).sol 2.18 0.06SOL_Z(..).sol 2.16 0.06CNOP{..}.mgt 2.00 0.08SOL_K(..).sol 1.95 0.08BLAI{..}.crop.dat 1.95 0.08CNOP{..}.mgt 1.82 0.10CNOP{..}.mgt 1.81 0.10CNOP{..}.mgt 1.80 0.10CNOP{..}.mgt 1.79 0.11CNOP{..}.mgt 1.79 0.11
Objectives Material Implementation Calibration AnalysisMethods
Sensitivity analysis Parameter Name t-Stat P-ValueMSK_X.bsn 1.78 0.11BLAI{..}.crop.dat 1.76 0.11CNOP{..}.mgt 1.74 0.12SOL_BD(..).sol 1.71 0.12CANMX.hru 1.69 0.13GWQMN.gw 1.68 0.13CNOP{..}.mgt 1.67 0.13SURLAG.bsn 1.64 0.13CNOP{..}.mgt 1.62 0.14CNOP{..}.mgt 1.60 0.14CNOP{..}.mgt 1.60 0.14CANMX.hru 1.59 0.15CNOP{..}.mgt 1.55 0.15BLAI{..}.crop.dat 1.54 0.16SOL_BD(..).sol 1.49 0.17CNOP{..}.mgt 1.41 0.19CNOP{..}.mgt 1.40 0.19CNOP{..}.mgt 1.32 0.22CNOP{..}.mgt 1.32 0.22CNOP{..}.mgt 1.31 0.22CNOP{..}.mgt 1.31 0.22CNOP{..}.mgt 1.26 0.24CNOP{..}.mgt 1.26 0.24CNOP{..}.mgt 1.20 0.26CANMX.hru 1.18 0.27CN2.mgt 1.12 0.29CNOP{..}.mgt 1.11 0.30CNOP{..}.mgt 1.09 0.30CNOP{..}.mgt 1.06 0.32CANMX.hru 1.06 0.32CN2.mgt 1.01 0.34CNOP{..}.mgt 1.01 0.34
62 parameters with t-stat > 1
33 out of the 62 are CNOP (1)
for each couple of crops*soils
On 240 spatialized parameters
(1) CNOP: updated Curve Number (CN2) in plant, tillage and harvest/ kill operations

Correlation matrix for 100 selected parametersBLAIvine CNOPvineCCNOPvineDCNOPvineDCNOPvineGCNOPvineGCNOPvineTCNOPpratGCNOPpratTCNOPrngeG
Code PEST 113 1131 1133 1134 1135 1136 1137 1505 1507 155BLAIvine 113 1.0E+00 -2.0E-01 4.4E-03 7.9E-03 1.4E-01 3.2E-03 -3.6E-02 4.4E-02 -7.6E-03 1.0E-01CNOPvineChamP 1131 -2.0E-01 1.0E+00 -1.1E-01 1.1E-02 -5.4E-02 9.2E-03 -2.9E-02 -7.6E-02 -2.5E-02 3.0E-02CNOPvineDHyLi 1133 4.4E-03 -1.1E-01 1.0E+00 -6.3E-04 -2.2E-02 1.9E-02 4.1E-02 -1.9E-02 -3.7E-02 4.3E-02CNOPvineDsab 1134 7.9E-03 1.1E-02 -6.3E-04 1.0E+00 -8.5E-03 -1.3E-01 1.1E-02 5.4E-02 -7.0E-04 3.2E-02CNOPvineGrMar 1135 1.4E-01 -5.4E-02 -2.2E-02 -8.5E-03 1.0E+00 -5.3E-02 -1.9E-01 3.2E-02 3.9E-02 -2.2E-02CNOPvineGrSup 1136 3.2E-03 9.2E-03 1.9E-02 -1.3E-01 -5.3E-02 1.0E+00 5.7E-02 -1.8E-01 5.2E-02 -3.3E-02CNOPvineTPBas 1137 -3.6E-02 -2.9E-02 4.1E-02 1.1E-02 -1.9E-01 5.7E-02 1.0E+00 -9.5E-02 5.0E-02 3.1E-02CNOPpratGrMar 1505 4.4E-02 -7.6E-02 -1.9E-02 5.4E-02 3.2E-02 -1.8E-01 -9.5E-02 1.0E+00 -5.0E-01 1.3E-01CNOPpratTPBas 1507 -7.6E-03 -2.5E-02 -3.7E-02 -7.0E-04 3.9E-02 5.2E-02 5.0E-02 -5.0E-01 1.0E+00 9.8E-02CNOPrngeGrMar 155 1.0E-01 3.0E-02 4.3E-02 3.2E-02 -2.2E-02 -3.3E-02 3.1E-02 1.3E-01 9.8E-02 1.0E+00
Nom param
Extraction of 10 * 10 parameters out of 100 * 100
Objectives Material Implementation Calibration AnalysisMethods
33 out of the 62 are CNOP for each couple of crops*soils
In Rapport de stage, L. Santos

With min. sensitivity 10-3
Correlated parameters
(Absolute coefficient > 0.5)
Objectives Material Implementation Calibration AnalysisMethods
Sensitivity analysis with PEST Parameter_1 Parameter_2 Coeff Abs Coef.
SOL_BD GrSup SOL_AWC DHyLi 0.99 0.99
CHW2 SOL_KSAT ChamS -0.88 0.88
SOL_BD ChamP SOL_KSAT ChamP -0.82 0.82
SOL_AWC GrMar SOL_Z GrMar 0.82 0.82
ALPHA_BF Reste GW_DELAY Reste 0.73 0.73
OV_Nrngb OV_Nvine 0.72 0.72
EPCOpppf OV_Ncbot 0.71 0.71
SOL_AWC VaMaT SOL_Z VaMaT -0.65 0.65
OV_Nfrst CNOPrngbDHyLi 0.65 0.65
BLAIvine CANMXvine -0.61 0.61
CNOPrngbChamP CNOPsunfChamP -0.61 0.61
CANMXprap EPCOrngb 0.6 0.6
EPCOvine EPCOrngb -0.59 0.59
ALPHA_BF Né SOL_Z ChamS 0.59 0.59
CNOPrngeGrMar ESCO GrMar -0.58 0.58
CNOPfrstTPBas CNOPsunfTPBas -0.56 0.56
ALPHA_BF Né SOL_AWC VaMaT 0.55 0.55
SOL_AWC ChamS CNOPsunfChamS 0.52 0.52
CNOPvineDHyLi CNOPrngeVaMaT -0.51 0.51
CNOPwcanChamP CNOPsunfVaMaT -0.51 0.51
CNOPpratGrMar CNOPpratTPBas -0.5 0.5
SOL_Z TPBas SOL_BD TPBas 0.5 0.5

Both methods produced acceptable fit at two stations with certain measures.
They differ at two other stations with more doubts on the measures: SUFI
performed better than PEST and vice versa.
Objectives Material Implementation Calibration AnalysisMethods
PEST SUFI2
Gauging station NSE of log Q NSE of natural Q NSE of natural Q R²
Antenne_SBV_23 0.33 0.43 0.50 0.64
Charente_SBV_ 26 0.85 0.67 0.83 0.85
Né_SBV_59 0.84 0.73 0.57 0.71
Seugne_SBV_54 lembeyre 0.70 0.74 0.65 0.70
SUFI2 vs PEST: Calibration & validation results

Stream flow calibration
Nitrate Cc in fresh waters
Pesticide Cc in fresh waters
Hydrological parameters
Plant growth parameters
Nitrate parameters
Calibrated hydrological parametersCalibrated nitrate parameters
Calibrated hydrological parametersCalibrated nitrate parametersCalibrated plant growth parametersCalibrated pesticide parameters
Calibrated parameters Calibration and validation process Results (ex.)
Gaugingstations
Calibration(1995 – 2005)
NSE
Validation(2006-2012)
NSEAntenne 0.34 0.43Charente 0.85 0.67Né 0.84 0.73Seugne 0.70 0.74
Calibrated hydrological parameters
Calibrated hydrological parametersCalibrated nitrate parametersCalibrated plant growth parameters
Pesticide parameters
Crop yields
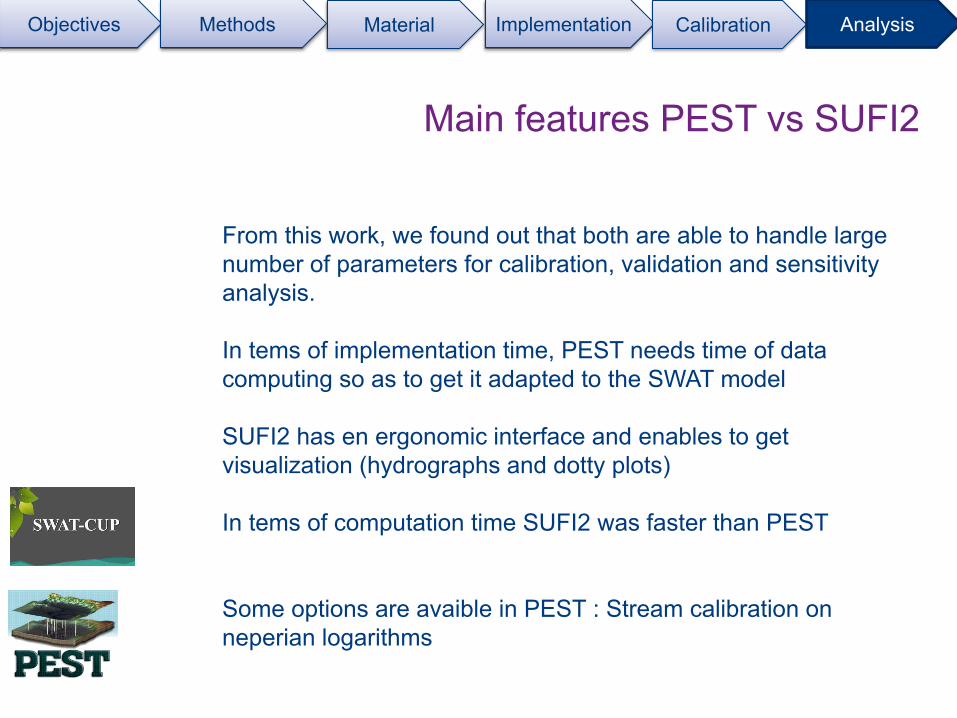
Main features PEST vs SUFI2
Objectives Material Implementation Calibration AnalysisMethods
From this work, we found out that both are able to handle large number of parameters for calibration, validation and sensitivityanalysis.
In tems of implementation time, PEST needs time of data computing so as to get it adapted to the SWAT model
SUFI2 has en ergonomic interface and enables to getvisualization (hydrographs and dotty plots)
In tems of computation time SUFI2 was faster than PEST
Some options are avaible in PEST : Stream calibration on neperian logarithms

This soil*crop discretization has generated a high number parameters
used for calibration validation.
Risk of equifinality, of over-fitting and the need for soft data
Strong parameter interdependence
=> Numerical optimization but also expert knowledge
-> The importance of sampling, of parametrization when calibrating
-> The necessary role of sensitivity analysis
Objectives Material Implementation Calibration AnalysisMethods
In conclusion, a few learnings

Thank you !
Special acknowledgements :
Léonard Santos, hydrologist
Françoise Vernier, agronomist
Jean-Marie Lescot, agro-economist