Lake Pepin Watershed TMDL Site Specific … Pepin Watershed TMDL Site Specific Eutrophication...
26
Lake Pepin Watershed TMDL Site Specific Eutrophication Criteria Development September 2008 Lake Pepin Photo by Guy Schmickle
Transcript of Lake Pepin Watershed TMDL Site Specific … Pepin Watershed TMDL Site Specific Eutrophication...

Lake Pepin Watershed TMDLSite Specific Eutrophication
Criteria Development
September 2008
Lake Pepin Photo by Guy Schmickle

Lake Pepin Compared to North Central Hardwoods Forest & Western Corn Belt Plains Thresholds. Listed in 2002
< 0.7> 32> 90WCP
1.025198Pepin mean1991-2000
< 1.1> 18> 45CHF
Secchi m
Chl-a ppb
TP ppb
Ecoregion & Lake

#
#
#
#
Lake PepinM781.2O
M775.6Q
M771.2P
M766.0I
Two somewhat distinct segments
1. “Upper” – shallow inflow segment: 40% of lake by area, 28% by volume short Tw -2-3 days
2. “Lower” – deeper segment: 60% by area, 72 % by volume
LTRMP monitoring is primary source of data.
Consists of 4 “fixed sites” with 1 in upper and 3 in lower along thalweg of lake.

Lake Pepin characteristics compared to ecoregion reference lakes
Table 2. Lake Pepin morphometric and watershed characteristics as compared to interquartile range for CHF (n=38) & WCP (n=12) ecoregion reference lakes. Parameter Pepin CHF (25th-75th) WCP (25th-75th) Surface area (mi2) 39.7 0.62 – 1.38 0.43 – 0.59 Mean depth (ft) 17.7 21 - 26 8 - 11 Maximum depth (ft) 56 43 - 73 10 - 27 Maximum width (mi) 1-2 -- -- Length (mi) 20.8 -- -- Volume (acre-ft) 448,340 49,027 – 142,090 7,547 – 22,152 Watershed Area (mi2) 48,634 4 - 12 2 - 3 Watershed: lake surface area 1,225:1 6 - 9 4 - 7 Mean Hydraulic Retention Time 0.04 year
(16 days) 9.3 years (mean)
4.8 years (mean)
(Heiskary & Vavricka 1993)
(Heiskary & Wilson 2005)

Table 4a. Summer-mean flow statistics based on long-term (80-year) and recent (30-year) record (based on USGS June-Sept. readings at Prescott). Most recent year in that flow range noted.
Percent exceedance 95th
90th
75th
50th
25th
10th
Long (1928-2007)
5,296 7,610 10,600 17,595 24,700 31,109
Example year 1932 1961 2006 1967 1997 1984 Recent (1978-2007) 9,330 10,145 16,411 22,358 25,886 31,374 Example year 1989 2006 1982 1994 1995 1984
Table 4b. Comparison of 10th percentile flows based on continuous 72-year (1936-2007) and 30-year (1978-2007) records for three primary tributaries to Pepin.
River 30-year 72-year Upper Mississippi 4,499 3,688 St. Croix 2,174 2,149 Minnesota 3,236 1,033
Flow Record

Northern Lakes and Forests
North-Central Hardwood Forests
Western Corn Belt Plains
Northern Glaciated
Plains
Driftless Area
Northern Minnesota Wetlands
Minnesota Pollution Control Agency
Ecoregions of the Lake Pepin Watershed
Ecological Regions2.0% Driftless Area
32.0% North Central Hardwood Forests
13.4% Northern Glaciated Plains
30.8% Northern Lakes and Forests
<0.1% Northern Minnesota Wetlands
21.7% Western Corn Belt Plains
Lake Pepin
¯
Table 3. Lake Pepin watershed ecoregion composition. Estimated areal composition, flow contribution, and 25th percentile stream TP based on minimally-impacted streams for each ecoregion (McCollor and Heiskary, 1993). Estimated “background” TP for Lake Pepin based on ecoregion area and flow-based estimates.
Region Area % Flow % TP µg/L
area-based
flow-based
NLF 31% 42% 30 9 13 CHF 32% 38% 70 22 27 WCP 22% 16% 210 46 34 NGP 13% 4% 160 21 6
Mean 99 79

Lake Pepin residence time. Estimated based on summer-mean flow at Prescott
0
10
20
30
40
50
60
0
5,000
10,00
0
15,000
20,00
0
25,00
0
30,00
0
35,00
0
40,00
0
45,000
50,00
0
55,00
0
60,00
0
65,00
0
cfs
days
1976 & 1988
1990
2006
1993
2000

View as a continuum, “lake or reservoir-like” over ~60% of flows
Flow Duration Frequency vs. Pepin Residence Time
0
10
20
30
40
50
60
70
80
0 10 20 30 40 50 60 70 80 90 100
Flow Duration Frequency (%)
Res
. tim
e da
ys
1928 1976
Lake-likeRiver-like
2006
1988
FlowTarget
~Reservoir-like~

Lake Pepin Chl-a vs Flow Duration Frequency: 1978 - 2006 (n=21 summers)
R2 = 0.68
0
10
20
30
40
50
60
70
0 10 20 30 40 50 60 70 80 90 100
Flow Duration Interval (%)
Chl
-a u
g/L
High Low
Chlorophyll (algal production) is inversely related to river flow

1990-2002 LTRMP Data (relatively high flow years)
Recent (1990-2002) mean & median chlorophyll-a by site
0
5
10
15
20
25
30
35
40
45
50
Dam Upper Lower Outlet
ppb
Mean Med Max

Regression equation based on rivers is a better descriptor of TP & chlorophyll-a relationship for Pepin as compared to “glacial” lake regression
TP vs.chl-a regressions for reference lakes & rivers relative to Upper & Lower Lake Pepin
Rivers: y = 1.66x - 2.21R2 = 0.87
Lakes: y = 1.27x - 0.90R2 = 0.87
0.0
0.5
1.0
1.5
2.0
2.5
0.5 0.8 1.0 1.3 1.5 1.8 2.0 2.3 2.5 2.8
Log TP ug/L
Log
chl-a
ug/
L
Lakes Rivers Upper Pepin Lower Pepin Linear (Rivers) Linear (Lakes)
(100 200 316)
32
10

Algal composition available for model development
•Lake users respond to BG blooms;
•Blue-greens low % of algal community in most summers
0%
10%
20%
30%
40%
50%
60%
70%
80%
90%
100%
1992 (47%) 1994 (70%) 1995 (83%) 1996 (59%) 1997 (75%) 1998 (53%) 2006 (24%)
Upper L.P. - yes - Average of % BG Upper L.P. - yes - Average of % Greens
Upper L.P. - yes - Average of %Diatoms

0%
10%
20%
30%
40%
50%
60%
70%
80%
90%
100%
1992(47%)
1994(70%)
1995(83%)
1996(59%)
1997(75%)
1998(53%)
2005(65%)
2006(24%)
Lower L.P. - yes - Average of % BG Lower L.P. - yes - Average of % Greens
Lower L.P. - yes - Average of %Diatoms
Lower Lake

Table 4. Diatom-inferred pre-European phosphorus concentrations for Lake Pepin and lakes from adjacent ecoregions Pepin CHF-deep CHF-shallow WCBP-deep WCBP-shallow 35-40 ppb 1 25 ± 3 39 ± 4 47 ± 6 67 ± 11 # of lakes 35 6 5 6 1 Engstrom et al. (in press)
0
20
40
60
80
100
1762 1800 1860 1904 1921 1940 1964 1976 1988 1996
Year
Perc
ent o
f Dia
tom
s
0.00
0.05
0.10
0.15
0.20
0.25
Tota
l Pho
spho
rus
(mg/
L)
Planktonic Diatoms Benthic Diatoms TP Estimate #1 TP Estimate #2

Limno Tech’s RCA Model
Scenario viewer allows for an overview of in-lake & river response to various load reduction scenarios;Variable response noted among low flow years;Focus on range of response for 3 low flow years: 1987, 1989, 2006 and one median flow year: 1998;Use to inform criteria selection & frame necessary reductions;
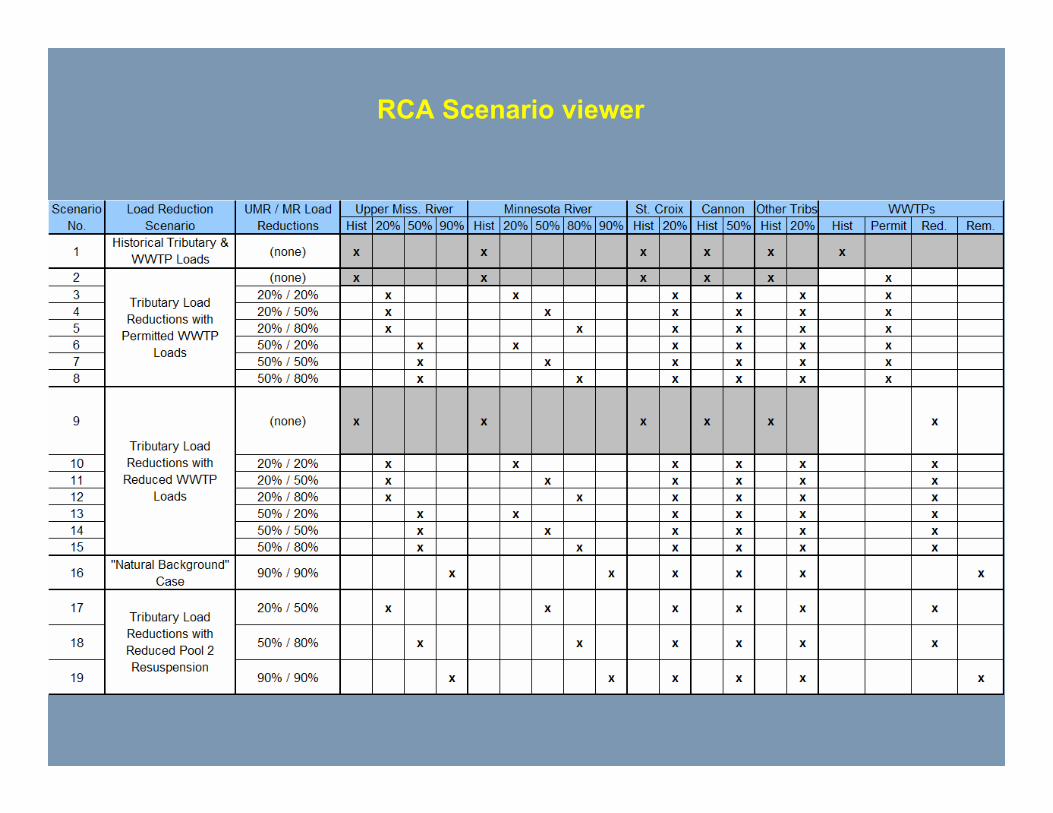
RCA Scenario viewer

Summer-mean Chl-a as a function of TP
0
5
10
15
20
25
30
35
40
0.000 0.050 0.100 0.150 0.200 0.250
TP ug/L
Chl
-a u
g/L
1998 (28%) 1987 (14%) 2006 (10%) 1989 (3%)
In-lake response as a function of 3 low flow years& 1 median flow year; with 19 reduction scenarios per year

Days with Chl-a >50 ug/L as a function of summer-mean TP
0
10
20
30
0.000 0.050 0.100 0.150 0.200 0.250
TP ug/L
days
1998 (28%) 1987 (14%) 2006 (10%) 1989 (3%)

Days with Chl-a >50 ug/L as a function of summer-mean chl-a
0
5
10
15
20
25
30
0 5 10 15 20 25 30 35 40
Summer-mean ug/L
Day
s >5
0 ug
/L
1998 (28%) 1987 (14%) 2006(10%) 1989 (3%)

Blue-green algal biomass as a function of summer-mean TP
0
5
10
15
20
25
0.000 0.050 0.100 0.150 0.200 0.250
TP ug/L
BG
bio
mas
s %
1998 (28%) 1987 (14%) 2006 (10%) 1989 (3%)

Summer-mean Secchi as a function of TP
0.0
0.2
0.4
0.6
0.8
1.0
1.2
1.4
1.6
1.8
0.00 0.05 0.10 0.15 0.20 0.25
TP ug/L
SD m
1998 (28%) 1987 (14%) 2006 1989 (3%)

Summer-mean Secchi as a function of chlorophyll-a
0.00.20.40.60.81.01.21.41.61.8
0 5 10 15 20 25 30 35 40
Chl-a ug/L
Secc
hi m
1998 (28%) 1987 (14%) 2006 (10%) 1989 (3%)

Table 7. Draft Lake Pepin site specific criteria as compared to Minnesota’s lake eutrophication criteria for adjacent ecoregions. Ecoregion – lake type (use classification1) TP Chl-a Secchi
µg/L µg/L meters
Lake Pepin site specific goals: whole lake 100 32 0.8CHF – Aquatic Rec. Use – Deep (Class 2B) 40 14 1.4CHF – Aquatic Rec. Use – Shallow (Class 2B) 60 20 1.0WCP&NGP – Aquatic Rec. Use – Deep (Class 2B)
65 22 0.9
WCP&NGP – Aquatic Rec. Use - Shallow (Class 2B)
90 30 0.7

Site-specific Considerations
TP – 100 ug/L is in range of diatom-inferred TP c1900-1960. Slightly above 90 ug/L WCP criteria; however results in lower chl-a because Pepin produces less chl-a per unit TP;Chl-a 32 ug/L – slightly above 30 ug/L but deemed “protective of aquatic recreational use” since it results in a lower frequency of severe nuisance blooms & BG algae comprise a small proportion of blooms;Secchi – 0.8 m should ensure Secchi of 0.5-0.6 in upper (allow for growth of SAV) & in lower Secchi should average 0.9-1.0 m – consistent with criteria for deep WCP and shallow CHF lakes;

Evaluating Lake Pepin for attainment of criteria
Use LTRMP fixed site network (4 sites) as primary basis for assessment;Assess on a biennial basis as a part of 303(d) assessment; use most recent 10 years of data;Assess for summers when “reservoir-lake-like” – corresponds to flows of ~10,145-20,000 cfs;

Pepin Draft Site Specific Criteria (Eutrophication Impairment)
In-lake TP 100 μg/L ~ c1900-1960 based on diatom-reconstructed P;Viable chl-a 32 μg/L - met over majority of flows, seeks to minimize chlorophyll-a >50 ug/L;Secchi 0.8 m (upper & lower), allow for SAV in upper;Summer average June-Sept.Flow range ~10,145 cfs (10% recurrence) –20,000 cfs (Res. Time ~11 days) based on recent 30-year record