LAKE LABERGE 1991, 1999, 2004, 2009 - Environment Yukon · Lake Trout Population Assessment: Lake...
12
LAKE TROUT POPULATION ASSESSMENT LAKE LABERGE 1991, 1999, 2004, 2009 Prepared By: Lars Jessup
Transcript of LAKE LABERGE 1991, 1999, 2004, 2009 - Environment Yukon · Lake Trout Population Assessment: Lake...

LAKE TROUT POPULATION ASSESSMENT
LAKE LABERGE 1991, 1999, 2004, 2009
Prepared By: Lars Jessup

LAKE TROUT POPULATION ASSESSMENT LAKE LABERGE
1991, 1999, 2004, 2009 Yukon Fish and Wildlife Branch
TR-11-18
Acknowledgements Aaron Foos, Angela Milani, Nathan Millar, Susan Thompson, Matt Larsen, Kelsey Russell, Coralee Johns, and Lars Jessup collected the data. Nathan Millar, Jean Carey and Rob Florkiewicz reviewed the report. © 2011 Yukon Department of Environment Copies available from: Yukon Department of Environment Fish and Wildlife Branch, V-5A Box 2703, Whitehorse, Yukon Y1A 2C6 Phone (867) 667-5721, Fax (867) 393-6263 Email: [email protected] Also available online at www.env.gov.yk.ca Suggested citation: JESSUP, L. 2011. Lake Trout Population Assessment: Lake Laberge 1991, 1999, 2004, 2009. Yukon Fish and Wildlife Branch Report TR-11-18, Whitehorse, Yukon, Canada

Summary Environment Yukon has been conducting assessments of important fish stocks since 1991. Priority lakes are identified for survey based on accessibility, sensitivity, and management concern. Environment Yukon works with user groups, First Nations and RRCs to establish priorities for assessment. Assessments focus on lake trout, which are considered an indicator species of the health of northern aquatic ecosystems.
For those lakes with important fisheries like Laberge, regular monitoring of fish populations is desired. Surveys on Lake Laberge were done in 1991, 1999, 2004 and 2009. We could not detect any increase or decrease in lake trout numbers over this time. Average weight, length, and condition of lake trout also remained unchanged.
The methods used in this study were found to be sensitive enough to measure only large (+89% / -63%) changes in the lake trout population, which is not sufficient for management purposes. We recommend that future population assessments use methods which could detect true changes in lake trout abundance with more confidence.
Key Findings We did not detect any changes in the Lake Laberge lake trout population
between 1991 and 2009.
Current methods are coarse; only large changes in the population can be detected.
Average length, weight, and condition of lake trout did not change between survey years.
Lake Trout Population Assessment: Lake Laberge 1991, 1999, 2004, 2009 i

Table of Contents Acknowledgements......................................................................... Inside Cover Summary......................................................................................................... i Key Findings .................................................................................................... i Table of Contents ............................................................................................ ii List of Tables................................................................................................... ii List of Figures ................................................................................................. ii Introduction.................................................................................................... 1 Study Area...................................................................................................... 1 Methods.......................................................................................................... 2 Data Analysis.................................................................................................. 3 Results and Discussion................................................................................... 4
Lake Trout Catch and Effort ......................................................................... 4 Biological Characteristics of Lake Trout ........................................................ 5 Other Fish Species ....................................................................................... 6 Factors Affecting Results .............................................................................. 8
Recommendations........................................................................................... 8 References ...................................................................................................... 8
List of Tables Table 1. Sampling information from Lake Laberge surveys. ............................. 2 Table 2. Distribution of lake trout catch in net sets in Lake Laberge in 1991,
1999, 2004, and 2009.. ............................................................................. 3 Table 3. Length and weight data for lake trout from Lake Laberge. .................. 5 Table 4. Summary of catch data from Lake Laberge......................................... 6
List of Figures Figure 1. Location of Lake Laberge, Yukon. ..................................................... 2 Figure 2. Mean CPUE with 95% confidence interval for each survey year......... 5
Lake Trout Population Assessment: Lake Laberge 1991, 1999, 2004, 2009 ii

Fish Population Assessment: Lake Laberge 1991; 1999; 2004; 2009 1
Introduction Since 1991, Environment Yukon has surveyed over 100 Yukon lakes using standardized methods. Assessments focus on lake trout which is considered an indicator species of the health of northern aquatic ecosystems. Lakes are chosen for assessment based on the level of the active commercial, recreational or aboriginal subsistence fisheries, as well as the level of available fisheries information. Lakes with significant harvest pressure are surveyed on a regular basis. The survey consists of setting small-mesh gillnets at different locations around the lake and recording biological information about the catch. To allow comparison of results among years the same methods are used each time the survey is done. The survey typically determines:
the relative abundance of lake trout compared to past surveys; and
length and weight of individual lake trout as well as other species.
We conducted fisheries surveys on Lake Laberge in 1991, 1999, 2004, and 2009; here we report on data from all 4 study years.
Study Area Lake Laberge is a large lake located in the Southern Lakes region, about 15 km north of Whitehorse along the Klondike Highway (Figure 1). It is approximately 50 km long and covers an area of 201 km2. The lake has an average depth of 54 m and a maximum depth of 146 m. The lake is fed by the Yukon River and several other large creeks and small streams. The lake is drained by the Yukon River, which is known as the Thirty Mile River from the outlet of Laberge downstream to Hootalinqua at the confluence of the Teslin River.
Lake Laberge is in the overlapping traditional territories of the Ta’an Kwäch’än and the Kwanlin Dün First Nations. Commercial harvest quotas were retired in 1990 and the lake is managed with general fisheries regulations. These regulations are the most liberal regulations and provide some limited protection to large fish by allowing the retention of only one large fish of each species. The catch limit for lake trout is 3 fish per day and only one may be longer than 65 cm. The possession limit is 6 fish. The catch limit for Arctic grayling is 5 fish per day and only one may be longer than 40 cm. The possession limit is 10 fish. The catch limit for northern pike is 5 fish per day and only one over 75 cm can be kept. The possession limit is 10 fish. General catch and possession limits also apply to the other species.

Methods We used commonly applied techniques (adapted from Lester et al. 1991) to measure relative abundance of lake trout in this study. Fish were captured using small-mesh, multi-filament gill nets set during the day. In small-mesh nets, lake trout tend to be caught by their teeth and jaws rather than by their gills and few lake trout are killed or injured using this method. Aiming to reach a net set density of 0.75 sets per square kilometer of lake surface area, we set gillnets at between 80 and 154 locations around the lakeshore (Table 1).
Figure 1. Location of Lake Laberge, Yukon.
Table 1. Sampling information from Lake Laberge surveys.
Water Temperature (oC) Year Dates Number of Sets
Set Density (sets/km2) Average Range
2009 June 22 – July 04 154 0.77 12 5.8 – 16.2 2004 June 01 – June 19 153 0.76 9.5 3.9 – 18.5 1999 June 15 – July 07 142 0.71 8.9 3.0 – 14.1 1991 June 05 – July 09 80 0.40 7.8 3.5 – 14.0
Lake Trout Population Assessment: Lake Laberge 1991, 1999, 2004, 2009 2

Each net was 69 m long and 2.4 m deep, and was made up of 3 23 m panels with stretched mesh sizes of 3.8, 6.4, and 7.6 cm (in that order). Nets were set perpendicular to the shoreline with the near-shore end in at least 2.4 m of water. The offshore end was sunk with anchors to ensure the net ran along the bottom of the lake. We alternated between setting the small (3.8 cm) and large (7.6 cm) mesh panels closest to shore to address the issue of net configuration bias (Lester et al. 1991). We checked the nets after one hour. For each net set we recorded location, surface water temperature, and the depth of the offshore anchor.
We used the number of fish caught to estimate catch per unit effort (CPUE), defined as the number of fish (of a certain species) caught per unit time. We used CPUE as an index of abundance (i.e., relative abundance) and compared it between years to detect population change. Note that we cannot use this method to estimate the absolute abundance (number) of fish in a lake.
For each fish caught we noted the size of mesh in which it was caught, species, length, and weight. We released all fish at or near the sampling location. For the few fish that died, we recorded sex and maturity, collected the stomach contents for diet analysis and the otoliths to determine age. Data on diet, age, sex and maturity are not reported here but can be obtained from Environment Yukon.
Data Analysis CPUE is calculated as the number of fish caught per 1 hour (the standard duration of 1 net set, or effort). The frequency distribution of CPUE data is heavily right-skewed with many data points at zero (Table 2). Because of the non-normality of the data, we used the non-parametric Kruskal-Wallis test to compare CPUE among years.
Table 2. Distribution of lake trout catch in net sets in Lake Laberge in 1991, 1999, 2004, and 2009. For example, in 2009, 129 sets had 0 lake trout, 21 sets had 1 lake trout, and 4 sets contained 2 lake trout.
1991 1999 2004 2009 Number caught
Number of sets
Percent Number
of sets Percent
Number of sets
Percent Number
of sets Percent
0 68 85% 105 74% 129 84% 129 84% 1 11 14% 26 18% 18 12% 21 14% 2 1 1% 11 8% 5 3% 4 3% 3 4 1 1% 5
Lake Trout Population Assessment: Lake Laberge 1991, 1999, 2004, 2009 3

To estimate statistical power and required sample size a priori for the 2009 survey, we simulated possible catch distributions using a Poisson distribution (manipulating the mean to simulate different effect sizes) then compared these distributions to data from previous years. We used bootstrap methods to run the simulations 1000 times and calculated power as the proportion of significant results of those 1000 tests. Statistical power is the chance of detecting a change when it exists and for our management purposes a power of 0.8 (80%) is considered reasonable. Predicted power at current sample sizes (150 sets) to detect a 50% increase in CPUE was 0.65 and a 50% decrease was 0.38. We predicted that we would have sufficient power (0.80) to detect a 67% increase or a 70% decrease. Increasing sample size would marginally increase power but the benefit of doing so would not outweigh the cost of the increased effort required.
We used regression analysis to detect trends in CPUE over time, but because we had only 4 years of data, the results provide limited statistical information. Therefore, little weight is placed on the result of the regression analysis.
We used ANOVA to compare the length and weight of lake trout between years. The relationship between a fish’s weight and length can be described by its condition factor (K) and is calculated as: K = (Weight (g)/Length (cm)3) x 100 (Ricker 1975). The heavier a fish is at a given length, the better its condition. At the individual level, K can be an indication of fish health. We averaged K over the entire catch and used it this as an indication of overall condition of lake trout within the population.
Results and Discussion
Lake Trout Catch and Effort
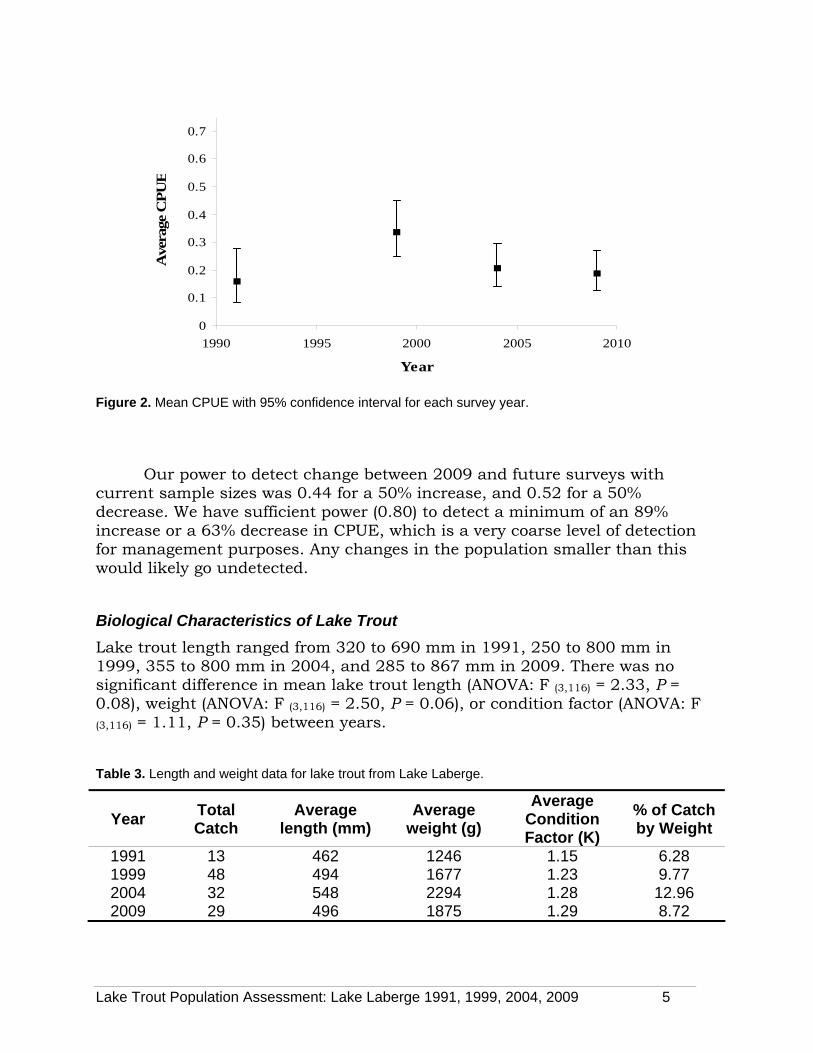
Mean CPUE (95% C.I.) in 2009, 2004, 1999, and 1991 was 0.19 (0.13 - 0.27), 0.21 (0.14 – 0.30), 0.34 (0.25 -0.45), and 0.16 (0.09 – 0.28), respectively (Figure 2). We detected a difference in CPUE among years (Kruskal-Wallis: X2(df = 2) = 7.96, P = 0.05). However, pairwise comparisons (using Bonferroni corrections to compensate for propagation of type 1 error) did not detect significant differences between years, and regression of CPUE against year found no trend in CPUE through time (b (slope) = -0.002, F = 0.269, P = 0.604). Therefore, we cannot conclude with confidence that lake trout CPUE has increased or decreased over the course of the surveys. It should be noted that a P-value of 0.05 (Kruskal-Wallis test) is a marginally significant result; it also represents a 5% chance of concluding that CPUE has changed between years when there was no real difference (a type 1 error).
Lake Trout Population Assessment: Lake Laberge 1991, 1999, 2004, 2009 4
0
0.1
0.2
0.3
0.4
0.5
0.6
0.7
1990 1995 2000 2005 2010
Year
Ave
rage
CP
UE
Figure 2. Mean CPUE with 95% confidence interval for each survey year.
Our power to detect change between 2009 and future surveys with current sample sizes was 0.44 for a 50% increase, and 0.52 for a 50% decrease. We have sufficient power (0.80) to detect a minimum of an 89% increase or a 63% decrease in CPUE, which is a very coarse level of detection for management purposes. Any changes in the population smaller than this would likely go undetected.
Biological Characteristics of Lake Trout
Lake trout length ranged from 320 to 690 mm in 1991, 250 to 800 mm in 1999, 355 to 800 mm in 2004, and 285 to 867 mm in 2009. There was no significant difference in mean lake trout length (ANOVA: F (3,116) = 2.33, P = 0.08), weight (ANOVA: F (3,116) = 2.50, P = 0.06), or condition factor (ANOVA: F (3,116) = 1.11, P = 0.35) between years.
Table 3. Length and weight data for lake trout from Lake Laberge.
Year Total Catch
Average length (mm)
Average weight (g)
Average Condition Factor (K)
% of Catch by Weight
1991 13 462 1246 1.15 6.28 1999 48 494 1677 1.23 9.77 2004 32 548 2294 1.28 12.96 2009 29 496 1875 1.29 8.72
Lake Trout Population Assessment: Lake Laberge 1991, 1999, 2004, 2009 5

Other Fish Species
On average, most of the total catch in all years was lake whitefish, followed by longnose sucker, round whitefish and least cisco (Table 4). Arctic grayling, broad whitefish, burbot, inconnu, lake trout and northern pike were all captured in smaller numbers.
Table 4. Summary of catch data from Lake Laberge.
Species Year Total
Number of Sets
Total Catch
Average length (mm)
Average weight
(g)
CPUE (# fish caught
per hour net set)
Proportion of Total
Catch (#)
Proportion of Total Catch
(Weight)
2009 154 14 257 219 0.09 0.02 0.01 2004 153 19 269 264 0.12 0.03 0.01 1999 142 5 256 390 0.04 0.00 0.00 1991 80 8 218 119 0.10 0.01 0.00
Arctic grayling
Average 132 12 250 248 0.09 0.02 0.01
2009 154 32 405 897 0.21 0.04 0.05 2004 153 25 453 1379 0.16 0.03 0.06 1999 142 40 417 1036 0.28 0.03 0.06 1991 80 18 362 496 0.23 0.03 0.03
Broad whitefish
Average 132 29 409 952 0.22 0.03 0.05
2009 154 1 900 0.01 0.00 0.00 2004 153 2 649 1400 0.01 0.00 0.00 1999 142 31 427 558 0.22 0.02 0.02 1991 80 2 425 450 0.03 0.00 0.00
Burbot
Average 132 9 500 827 0.07 0.01 0.01
2009 154 19 666 3354 0.12 0.02 0.11 2004 153 9 688 3767 0.06 0.01 0.06 1999 142 4 539 1800 0.03 0.00 0.01 1991 80 1 550 1400 0.01 0.00 0.01
Inconnu
Average 132 8 611 2580 0.06 0.01 0.04
2009 154 29 496 1875 0.19 0.04 0.09 2004 153 32 548 2294 0.21 0.04 0.13 1999 142 48 494 1677 0.34 0.04 0.10 1991 80 13 462 1246 0.16 0.02 0.06
Lake trout
Average 132 31 500 1773 0.22 0.03 0.10
Lake Trout Population Assessment: Lake Laberge 1991, 1999, 2004, 2009 6
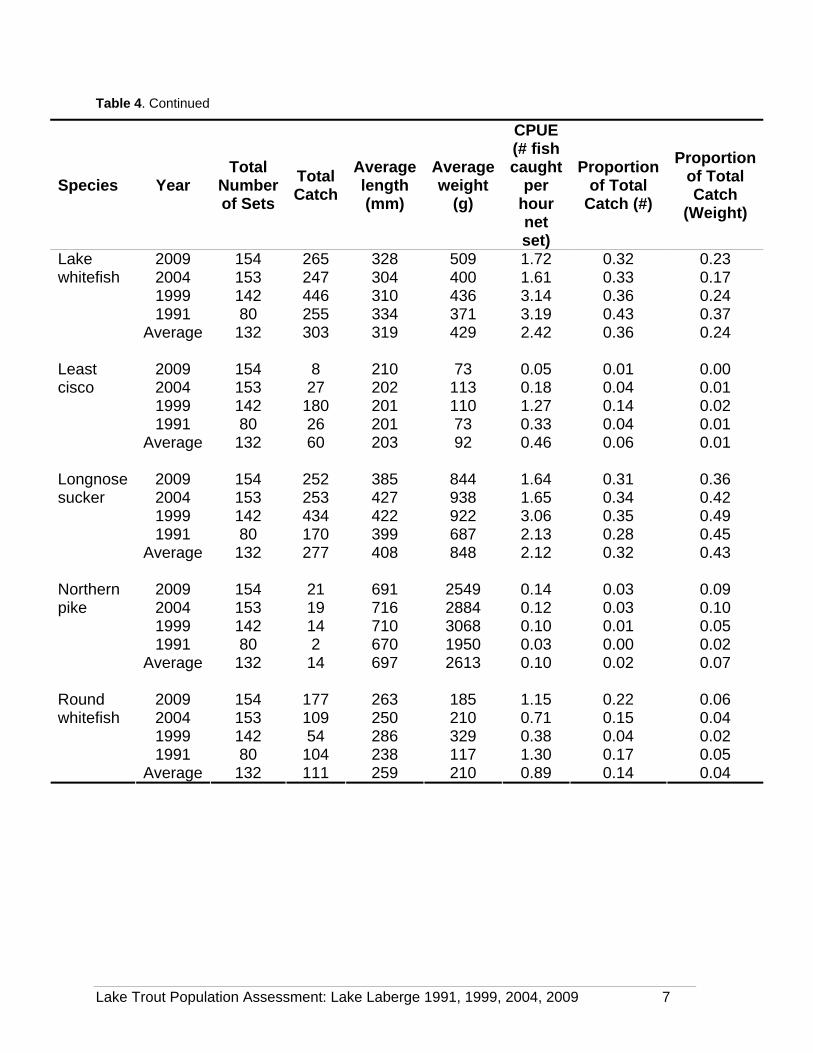
Table 4. Continued
Species Year Total
Number of Sets
Total Catch
Average length (mm)
Average weight
(g)
CPUE (# fish caught
per hour net set)
Proportion of Total
Catch (#)
Proportion of Total Catch
(Weight)
2009 154 265 328 509 1.72 0.32 0.23 2004 153 247 304 400 1.61 0.33 0.17 1999 142 446 310 436 3.14 0.36 0.24 1991 80 255 334 371 3.19 0.43 0.37
Lake whitefish
Average 132 303 319 429 2.42 0.36 0.24
2009 154 8 210 73 0.05 0.01 0.00 2004 153 27 202 113 0.18 0.04 0.01 1999 142 180 201 110 1.27 0.14 0.02 1991 80 26 201 73 0.33 0.04 0.01
Least cisco
Average 132 60 203 92 0.46 0.06 0.01
2009 154 252 385 844 1.64 0.31 0.36 2004 153 253 427 938 1.65 0.34 0.42 1999 142 434 422 922 3.06 0.35 0.49 1991 80 170 399 687 2.13 0.28 0.45
Longnose sucker
Average 132 277 408 848 2.12 0.32 0.43
2009 154 21 691 2549 0.14 0.03 0.09 2004 153 19 716 2884 0.12 0.03 0.10 1999 142 14 710 3068 0.10 0.01 0.05 1991 80 2 670 1950 0.03 0.00 0.02
Northern pike
Average 132 14 697 2613 0.10 0.02 0.07
2009 154 177 263 185 1.15 0.22 0.06 2004 153 109 250 210 0.71 0.15 0.04 1999 142 54 286 329 0.38 0.04 0.02 1991 80 104 238 117 1.30 0.17 0.05
Round whitefish
Average 132 111 259 210 0.89 0.14 0.04
Lake Trout Population Assessment: Lake Laberge 1991, 1999, 2004, 2009 7

Lake Trout Population Assessment: Lake Laberge 1991, 1999, 2004, 2009 8
Factors Affecting Results
Catch can vary within a lake when netting is done under different environmental conditions. To be comparable, it is important that all surveys are done when fish are equally susceptible to being caught. Although the 2009 survey occurred later in the season and average water temperatures were higher, it was apparent that lake trout were still susceptible to capture and any potential effect on survey results is unknown.
Recommendations We found that we could only very large changes (+89% or -63%) in the lake trout population. This level of precision is not sufficient for management purposes. Increasing the sample size may increase power but would substantially increase the effort required which is not desired. Therefore, further monitoring of lake trout in Lake Laberge using the methods and sample sizes of these studies is not recommended.
Future sampling of Lake Laberge should be conducted using a method that can detect true variations in lake trout abundance with more certainty and with sample sizes that are feasible.
References LESTER, N., M. PETZOLD , W. DUNLOP , B. MONROE , S. ORSATTI , T. SCHANER, AND D.
WOOD. 1991. Sampling Ontario lake trout stocks: issues and standards. Lake trout synthesis sampling issues and methodology working group, Ontario Ministry of Natural Resources. <http://www.mnr.gov.on.ca/226944.pdf>. Accessed 2009 March 23.
RICKER, W.E. 1975. Computation and interpretation of biological statistics of fish populations. Bulletin of the Fisheries Research Board of Canada 191: 1-382.