LAERS INESTNT & TRA MARKET SURVEY · SWOT Analysis ... Fish and shellfish are harvested...
41
FLANDERS INVESTMENT & TRADE MARKET SURVEY THE AGRICULTURE SECTOR IN CROATIA
Transcript of LAERS INESTNT & TRA MARKET SURVEY · SWOT Analysis ... Fish and shellfish are harvested...

FLANDERS INVESTMENT & TRADE MARKET SURVEY
THE AGRICULTURE SECTOR
IN CROATIA

The agricultural sector in Croatia | June 2015 1
THE AGRICULTURE SECTOR IN CROATIA
Written and compiled by: Concetta Civello (October 2012)
Adapted by: Nina Alvir (June 2015)
___________________________________________________________________________________________________________________
Belgian Trade Office [email protected] Belgian Embassy T: +385 1 457 74 44 Pantovcak 125b1 F: +385 1 457 74 45 HR – 10000 Zagreb (Croatia)
2
Table of Contents
1. Introduction .......................................................................................................................................................................................... 3 2. General overview of Croatia ...................................................................................................................................................... 3
2.1. General figures ........................................................................................................................................................................... 4 2.2. Economy ....................................................................................................................................................................................... 5
3. State of the Croatian Agriculture sector 6 3.1. General situation ...................................................................................................................................................................... 6 3.2.Features of the Croatian Agricultural sector........................................................................................................... 7 3.3. Agro – Industry National Policy Framework. ......................................................................................................... 7 3.4. Legal framework ...................................................................................................................................................................... 8 3.5. SWOT Analysis ........................................................................................................................................................................... 9
4. Land use and farm structure .................................................................................................................................................... 9 4.1. Land use and quality ............................................................................................................................................................. 9 4.2. Land ownership and privatization. ............................................................................................................................ 10 4.3. Farm structure ......................................................................................................................................................................... 11
5. Crop production .............................................................................................................................................................................. 12 5.1. Main cereals ............................................................................................................................................................................... 12 5.2. Fruits and vegetables .......................................................................................................................................................... 13 5.3. Industrial crops....................................................................................................................................................................... 14
6. Livestock and fishing 14 6.1 Livestock ....................................................................................................................................................................................... 15 6.2 Fishing ........................................................................................................................................................................................... 19 6.2.1. Seawater fishing ................................................................................................................................................................. 20 6.2.2. Freshwater fishing............................................................................................................................................................ 23
7. The Prices of agriculture 25 8. Import and export ........................................................................................................................................................................ 29
8.1. EU agricultural trade with Croatia............................................................................................................................. 29 8.2. Trade regulation ................................................................................................................................................................... 30 8.2.1. WTO accession...................................................................................................................................................................... 31 8.2.2. Trade performance. .......................................................................................................................................................... 31 8.3. Food safety................................................................................................................................................................................ 31 8.3.1. Certification and quality control. ............................................................................................................................ 32 8.4. Export/Import documentation procedures. ....................................................................................................... 32
9. Agricultural fairs............................................................................................................................................................................. 32
The agricultural sector in Croatia | June 2015 3
1. Introduction
Agriculture (grazing and tilling) occupies less than one-fourth of Croatia’s land and contributes less than one-tenth to the country’s gross domestic product (GDP). Most agricultural land is privately held, but many landholdings are too small for profitable production. The Croatian agricultural produce is exported mainly to nearby countries, particularly Bosnia and Herzegovina, Italy, Slovenia, and Serbia.
Slavonia, the granary of Croatia, is the most fertile agricultural region. Farming there is characterized by capital-intensive, market-oriented production and larger landholdings. Most of the land previously under social ownership has been nationalized by the Croatian government and is leased to farmers. The major crops of the region are sugar beets, corn (maize), wheat, potatoes, barley, soybeans, sunflowers, and tobacco. Oats, rye, millet, rice, beans, peas, and chicory are also grown. Pigs, cattle, and poultry are important to the economy of the region, while there is also some beekeeping and silkworm breeding.
The hills of the western part of the para-Pannonian region are characterized by smallholdings, mixed farming, and generally low yields. Fruit growing, viticulture, and cattle and pig breeding are typical agricultural occupations.
The central mountain belt contains some of the poorest land and climate for agriculture. The large areas of meadow and pasture, however, are suitable for raising sheep and cattle, and there is also some cultivation of barley, oats, rye, and potatoes. Fruits grown include plums, apples, pears, sour cherries, sweet cherries, peaches, and apricots.
The Adriatic littoral of Istria and Dalmatia is characterized by rocky soil and long periods of drought, with small parcels of arable land and poor pasture. Sheep and goats are raised, while grapes, olives, almonds, figs, tangerines, and other Mediterranean fruits and vegetables round out the agriculture of this region. Beekeeping is also of some commercial importance, especially on the islands.
Croatia’s large forests, covering about two-fifths of the country’s area, form the basis of the wood and pulp industry. Fish and shellfish are harvested commercially in the waters off the Adriatic coast, although fish stocks in the sea declined in the late 20th and early 21st centuries. Around nine-tenths of the fish catch comprises small oily fish (e.g., anchovies and pilchards), much of which is consumed locally, but there is also an increasing demand for non-oily fish, or white-fish (e.g., sea bass). Aquaculture, or fish farming, is of growing importance, with sea bass, tuna, and mussels all popular. Almost all commercially sold freshwater fish is raised in ponds as well, though freshwater fishing has some significance for tourism. Farmed fish are exported to countries such as Spain and Japan, while canned fish is sold mainly to surrounding countries.
2. General overview of Croatia
Croatia is a Central Eastern European country of 4.24 million inhabitants. The major cities are
Zagreb, Split, Rijeka and Osijek. The country has borders with Slovenia and Hungary to the North,
Bosnia and Herzegovina to the Southeast, Serbia and Montenegro to the East. It was part of the
Socialist Federal Republic of Yugoslavia until 1991, when the country became independent and
adopted a parliamentary democracy. Croatia has significant natural endowments and a long
business tradition in a wide range of sectors. Therefore, the country was able to recover quickly
from a four-year regional war.
4
Since that time, Croatia has enjoyed an exponential growth with a sustained increasing GDP of
4% to 5% per year and stable macroeconomic factors like low inflation rate and a low Croatian
Kuna/Euro rate (7.4)-Croatian Kuna/USD rate (6.1). Due to these factors, Croatia managed to attract
foreign investment and successfully progressed with efforts to join the European Union by signing
the Stabilization and Association Agreement in 2001. This agreement enabled the beginning of the
negotiations for full EU membership in 2005. However, the country still has some challenges to
face in the future, including high unemployment, heavy dependence on hospitality and tourism, a
growing trade deficit and growing external debt.
Croatia is a member of the United Nations, the Council of Europe, NATO, the World Trade
Organization (WTO) and CEFTA since 2001. Croatia has become the 28th member state of the
European Union on July 1st 2013.
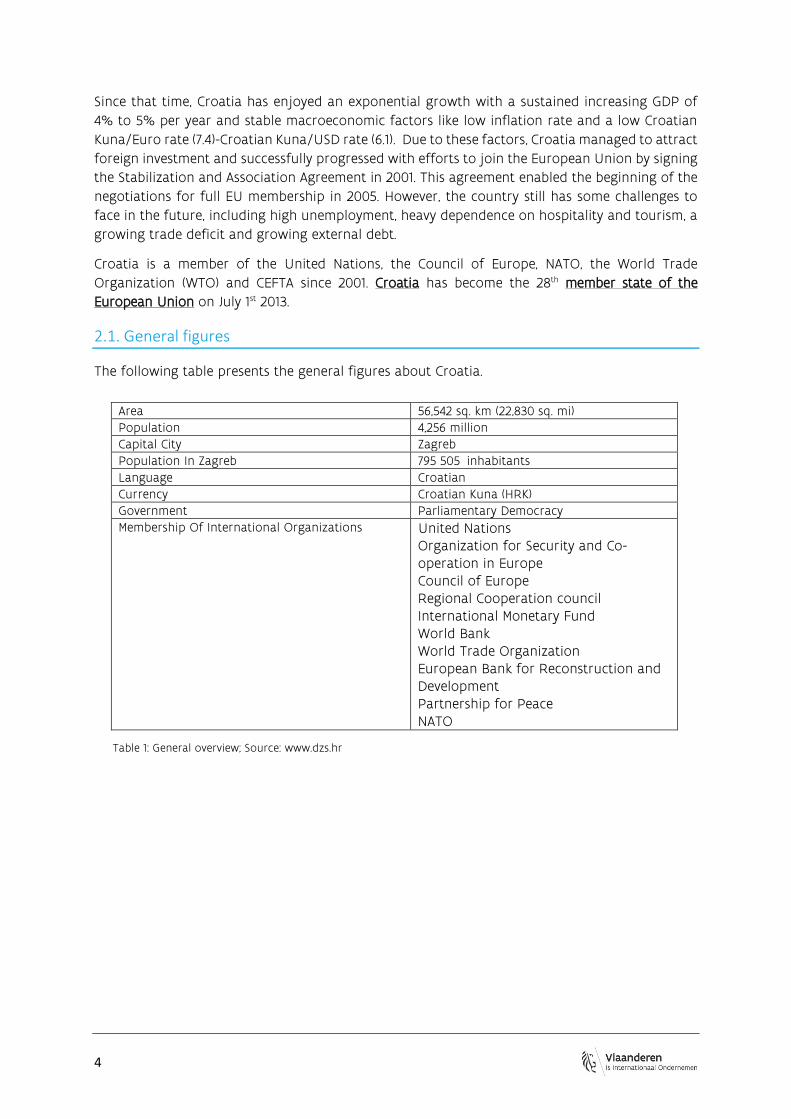
2.1. General figures
The following table presents the general figures about Croatia.
Area 56,542 sq. km (22,830 sq. mi)
Population 4,256 million
Capital City Zagreb
Population In Zagreb 795 505 inhabitants
Language Croatian
Currency Croatian Kuna (HRK)
Government Parliamentary Democracy
Membership Of International Organizations United Nations Organization for Security and Co-operation in Europe Council of Europe Regional Cooperation council International Monetary Fund World Bank World Trade Organization European Bank for Reconstruction and Development Partnership for Peace NATO
Table 1: General overview; Source: www.dzs.hr
The agricultural sector in Croatia | June 2015 5
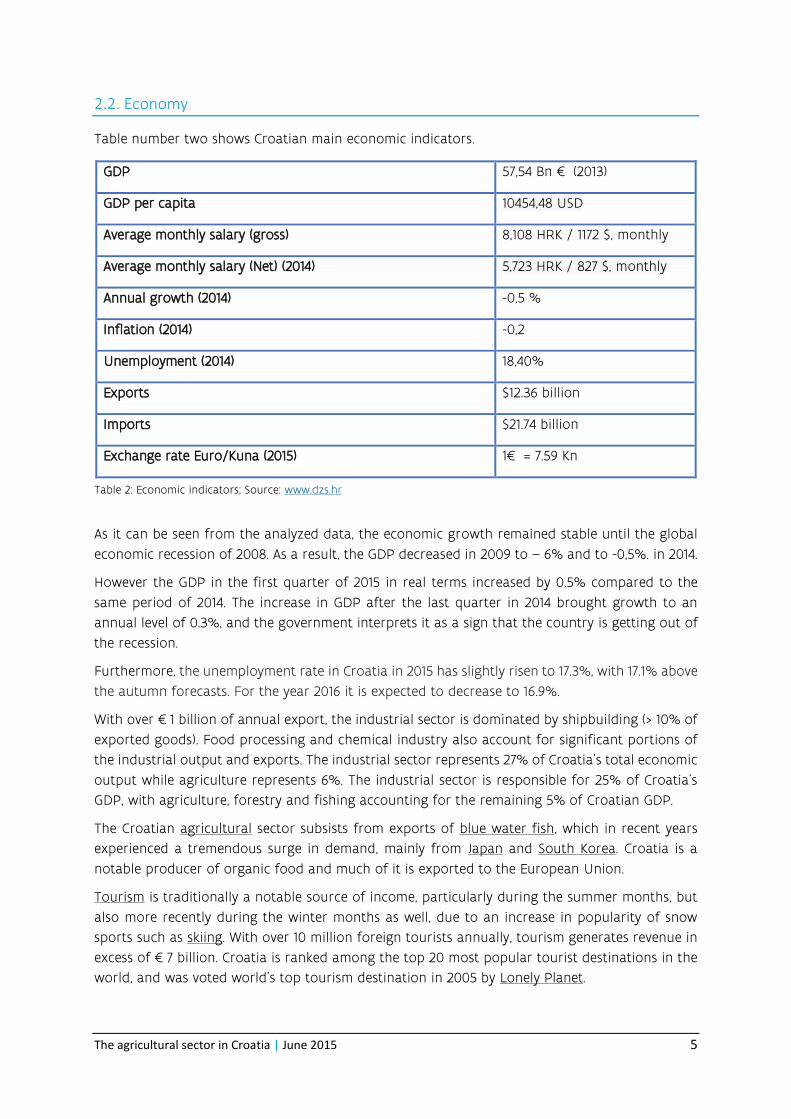
2.2. Economy
Table number two shows Croatian main economic indicators.
GDP 57,54 Bn € (2013)
GDP per capita 10454,48 USD
Average monthly salary (gross) 8,108 HRK / 1172 $, monthly
Average monthly salary (Net) (2014) 5,723 HRK / 827 $, monthly
Annual growth (2014) -0,5 %
Inflation (2014) -0,2
Unemployment (2014) 18,40%
Exports $12.36 billion
Imports $21.74 billion
Exchange rate Euro/Kuna (2015) 1€ = 7.59 Kn
Table 2: Economic indicators; Source: www.dzs.hr
As it can be seen from the analyzed data, the economic growth remained stable until the global
economic recession of 2008. As a result, the GDP decreased in 2009 to – 6% and to -0,5%. in 2014.
However the GDP in the first quarter of 2015 in real terms increased by 0.5% compared to the
same period of 2014. The increase in GDP after the last quarter in 2014 brought growth to an
annual level of 0.3%, and the government interprets it as a sign that the country is getting out of
the recession.
Furthermore, the unemployment rate in Croatia in 2015 has slightly risen to 17.3%, with 17.1% above
the autumn forecasts. For the year 2016 it is expected to decrease to 16.9%.
With over €1 billion of annual export, the industrial sector is dominated by shipbuilding (> 10% of
exported goods). Food processing and chemical industry also account for significant portions of
the industrial output and exports. The industrial sector represents 27% of Croatia’s total economic
output while agriculture represents 6%. The industrial sector is responsible for 25% of Croatia's
GDP, with agriculture, forestry and fishing accounting for the remaining 5% of Croatian GDP.
The Croatian agricultural sector subsists from exports of blue water fish, which in recent years
experienced a tremendous surge in demand, mainly from Japan and South Korea. Croatia is a
notable producer of organic food and much of it is exported to the European Union.
Tourism is traditionally a notable source of income, particularly during the summer months, but
also more recently during the winter months as well, due to an increase in popularity of snow
sports such as skiing. With over 10 million foreign tourists annually, tourism generates revenue in
excess of €7 billion. Croatia is ranked among the top 20 most popular tourist destinations in the
world, and was voted world's top tourism destination in 2005 by Lonely Planet.

6
3. State of the Croatian agriculture sector
The economic importance of agriculture is still relatively high in Croatia despite a declining trend
in the last few years. The same trend can be observed for the food processing industry. Both
sectors play an important role on the labour market as a significant percentage of the population
in working age earn their income from agriculture and the food industry.
Croatia has an unfavourable structure of agricultural holdings with a lot of small family farms
(the official large average farm size in Croatia is 5.6 ha) and some large state owned agri-
businesses. A large majority of family farms are extremely fragmented and the cultivated land is
divided in different parcels often located very far from each other. The small parcel size is one
reason for a general inefficient agricultural production.
Despite the good climate conditions for growing many varieties, the country suffers from deficit
in the agri-food sector. Croatia is currently self-sufficient in the production of only a few products:
potatoes, poultry meat, eggs, corn, wine, sugar and wheat.
Therefore, Croatia is a net importer of agricultural commodities. Current policy looks at promoting
and increasing production of several agricultural products.
3.1. General situation
Croatia can be divided into three geographic and climatic zones: the lowland zone in the North of
the country, which has a continental climate, the Mediterranean coastal zone in the South, and
the mountainous zone stretching across the central part of the country. Various types of climate,
relief and soil, are favourable for the production of a wide range of agricultural products, from
field and industrial crops to vineyards, continental and Mediterranean fruits and vegetables.
Agriculture and fishing generate 8.1% of the Croatian GDP.
Of a total of 3.15 million hectares of agricultural land, 68 % is cultivated and the rest is pasture
land. 83.3% of the cultivated land is privately owned. The Agricultural Land Act regulates
concessions for the exploitation of agricultural land owned by the state. Farming covers domestic
needs for cereals and sugar, as well as industrial crops to a large extent. The total area used for
vineyards amounts to 59,000 hectares. Wine production is represented by 30 larger winemaking
companies, 35 production co-operatives and about 250 family businesses. Wines made of
indigenous grape varieties are becoming increasingly popular on the European and world markets.
Cattle-raising has always played an important role in this region. Some world famous products
are slavonski kulen (famous Slavonian salami), dalmatinski pršut (Dalmatian smoked ham), istarski
pršut (Istrian smoked ham) and paški sir (cheese from the Island of Pag). Fishing and fish
processing have traditionally been the most important activities along the coastal part of Croatia
and on the islands. There are currently 15 fish-processing factories in Croatia, which produce 15,000
tonnes of various fish products per year. In 2013, the output of fresh-water fish amounted to about
7051 tonnes, and salt-water fish and other sea food to about 85 713 tonnes. A new production line,
tuna breeding for the Japanese market, was launched in 1997. Large quantities of fish are exported.
The agricultural sector in Croatia | June 2015 7
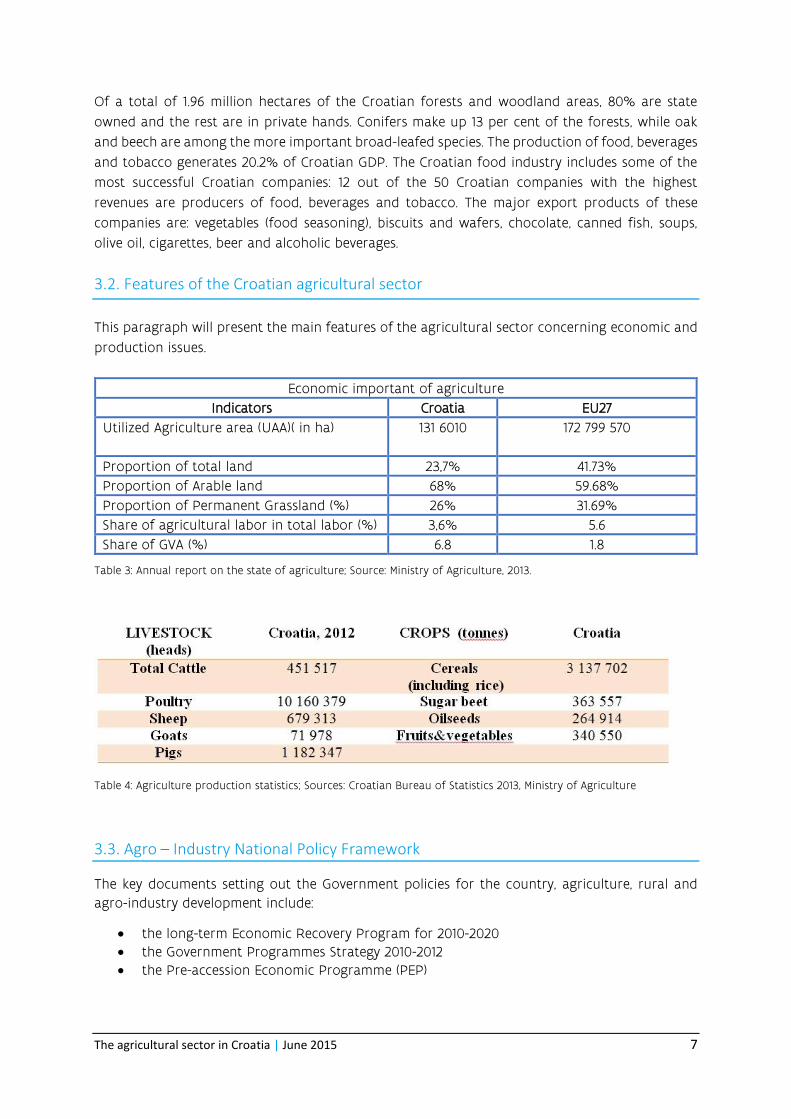
Of a total of 1.96 million hectares of the Croatian forests and woodland areas, 80% are state
owned and the rest are in private hands. Conifers make up 13 per cent of the forests, while oak
and beech are among the more important broad-leafed species. The production of food, beverages
and tobacco generates 20.2% of Croatian GDP. The Croatian food industry includes some of the
most successful Croatian companies: 12 out of the 50 Croatian companies with the highest
revenues are producers of food, beverages and tobacco. The major export products of these
companies are: vegetables (food seasoning), biscuits and wafers, chocolate, canned fish, soups,
olive oil, cigarettes, beer and alcoholic beverages.
3.2. Features of the Croatian agricultural sector
This paragraph will present the main features of the agricultural sector concerning economic and
production issues.
Economic important of agriculture
Indicators Croatia EU27
Utilized Agriculture area (UAA)( in ha) 131 6010 172 799 570
Proportion of total land 23,7% 41.73%
Proportion of Arable land 68% 59.68%
Proportion of Permanent Grassland (%) 26% 31.69%
Share of agricultural labor in total labor (%) 3,6% 5.6
Share of GVA (%) 6.8 1.8
Table 3: Annual report on the state of agriculture; Source: Ministry of Agriculture, 2013.
Table 4: Agriculture production statistics; Sources: Croatian Bureau of Statistics 2013, Ministry of Agriculture
3.3. Agro – Industry National Policy Framework
The key documents setting out the Government policies for the country, agriculture, rural and
agro-industry development include:
the long-term Economic Recovery Program for 2010-2020 the Government Programmes Strategy 2010-2012
the Pre-accession Economic Programme (PEP)

8
the Agricultural Policy framework with a Strategic Plan was adopted for 2010-2013 on the reform of the national support system and further alignment with the common agricultural policy (CAP)
the Strategy of Rural Development for 2008-2013 the Action Plan for Organic Agriculture Development for 2001-2016 the Strategy for e -Governance Development the National Strategy for the Development of the Intellectual Property System for the
period 2010-2012 the Programme of Consolidation of Agricultural Land in the Republic of Croatia 2009–
2021 the National Consumer Protection Programme
the Phytosanitary strategy
Croatia made a progress by setting up a paying agency and establishing an integrated
administration and control system (IACS) including a land parcel identification system (LIPS) as
well as the Central Veterinary Information System (CVIS), the fisheries monitoring centre (FMC), the
Vineyard Register and the Farm Accountancy Data network (FADN) that became operational in
2011.
3.4. Legal Framework
Croatia has adopted a number of laws to encourage agricultural and agro-industry growth and
rural development, among which:
the Act on Agriculture, the Law on State support for Agriculture to reform the current system the Law on Budget
the Act on Competition
the Act on Agricultural Land the Act on Regulation of the Agricultural, Products Market the Act on State Aid to Agriculture and Rural Development
the Ordinance on obtaining the right to insurance support from possible damages in agriculture, fishery and forestry
the Act on Structural Support and Market Regulation in Fisheries the Act on Designation of Originality, Designation of Geographical Origin and Designation
of Traditional Reputation of Agricultural and Food Products the Law on GMOs, Act on Marine Fishing
the Act on Wine
The agricultural sector in Croatia | June 2015 9
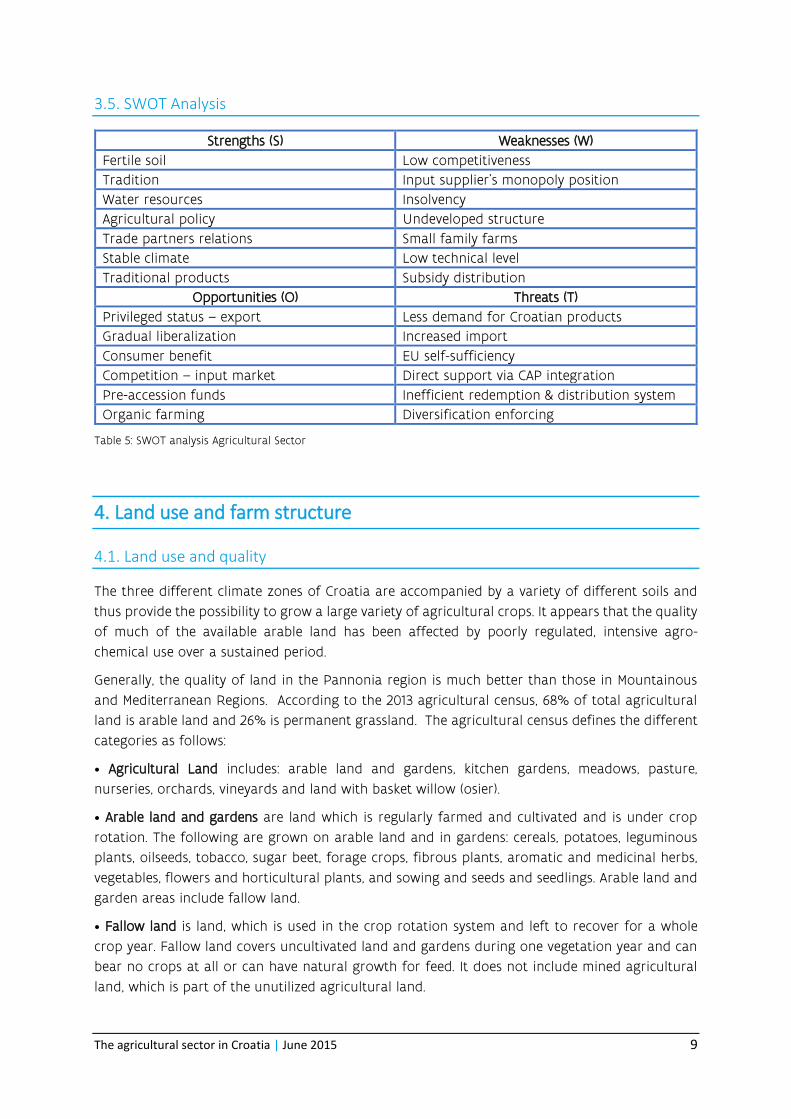
3.5. SWOT Analysis
Strengths (S) Weaknesses (W)
Fertile soil Low competitiveness
Tradition Input supplier’s monopoly position
Water resources Insolvency
Agricultural policy Undeveloped structure
Trade partners relations Small family farms
Stable climate Low technical level
Traditional products Subsidy distribution
Opportunities (O) Threats (T)
Privileged status – export Less demand for Croatian products
Gradual liberalization Increased import
Consumer benefit EU self-sufficiency
Competition – input market Direct support via CAP integration
Pre-accession funds Inefficient redemption & distribution system
Organic farming Diversification enforcing
Table 5: SWOT analysis Agricultural Sector
4. Land use and farm structure
4.1. Land use and quality
The three different climate zones of Croatia are accompanied by a variety of different soils and
thus provide the possibility to grow a large variety of agricultural crops. It appears that the quality
of much of the available arable land has been affected by poorly regulated, intensive agro-
chemical use over a sustained period.
Generally, the quality of land in the Pannonia region is much better than those in Mountainous
and Mediterranean Regions. According to the 2013 agricultural census, 68% of total agricultural
land is arable land and 26% is permanent grassland. The agricultural census defines the different
categories as follows:
• Agricultural Land includes: arable land and gardens, kitchen gardens, meadows, pasture,
nurseries, orchards, vineyards and land with basket willow (osier).
• Arable land and gardens are land which is regularly farmed and cultivated and is under crop
rotation. The following are grown on arable land and in gardens: cereals, potatoes, leguminous
plants, oilseeds, tobacco, sugar beet, forage crops, fibrous plants, aromatic and medicinal herbs,
vegetables, flowers and horticultural plants, and sowing and seeds and seedlings. Arable land and
garden areas include fallow land.
• Fallow land is land, which is used in the crop rotation system and left to recover for a whole
crop year. Fallow land covers uncultivated land and gardens during one vegetation year and can
bear no crops at all or can have natural growth for feed. It does not include mined agricultural
land, which is part of the unutilized agricultural land.
10
• Unutilized Agricultural Land is agricultural land, which is no longer farmed for economic, social
or other reasons. Neither is it used for crop rotation. This land could be re-transformed to utilized
agricultural land.
Croatia’s agricultural development has been strongly and negatively affected not only by structural
changes following the break-up of the former Republic of Yugoslavia (50% of land was previously
farmed by large, vertically and horizontally integrated agricultural holdings), but also by major
demographic changes caused by the war. Today, two thirds of arable land belongs to family farms.
It is important to notice that in the Mediterranean and mountainous regions of the country today
more than half of the useable agricultural land area is not regularly cultivated. There are many
reasons for this and among the most relevant is the fact that many surface areas were under land
mines and, consequently these rural areas faced an intensive outgoing migration of the population
and low profitability of production on small-scale plots on the remaining farms. Many rural areas
were severely damaged by the war in the mid-nineties. According to data from the Croatian Mine
Action Centre (www.hcr.hr/en/index.asp), the total surface of the mined land covers 1174 sq. km.
(117,400 ha) or 2.08% of total continental land. The highest pollution is seen in the wooded areas
(63,350 ha), then in agricultural-arable areas (20,120 ha), followed by the areas covered with thicket
(13,190 ha) and pastures (10,880 ha).
In some regions, mined land pre-dominates. The recovery of these areas grossly determines the
land availability and quality in the affected regions. Beyond their direct impact on agriculture,
minefields obstruct the development of the rural population’s living standard in the affected areas
in many indirect ways.
4.2. Land ownership and privatization
Family farms cultivate approximately two thirds of the total agricultural land while the remaining
third is state-owned. The private share of arable land is slightly larger (approximately 75% - 80%).
The slow process of privatization of state-owned agricultural enterprises has contributed to create
large areas of uncultivated agricultural land.
Until 2001, the majority of state land (93%) was leased. The remainder was privatized (3%), leased
on long-term leases (2%), or donated (2%). In 2001, the Law on Agricultural Land (Official Gazette
66/01, 87/02, 48/05 and 90/05) was adopted (and later amended on several occasions in the period
2001–2005). According to the Agricultural Land Law in force today, local self-government units (i.e.
municipalities and cities) have to prepare programmes for the disposal (i.e. privatisation or lease)
of state-owned agricultural land under their jurisdiction.
If they fail to do so, regional self-government units (i.e. counties) should prepare programmes for
the state-owned land within their territory. Based on cadastral maps and records, such
programmes have to contain information on the areas allocated for restitution, selling, concession,
leasing and other uses.
State-owned agricultural land can only be disposed of by applying public bidding procedures.
Agricultural family farms and craftsmen, which are registered for VA, have priority rights to
purchase or lease state-owned agricultural land, if they meet other tender conditions stipulated
by the Law on Agricultural Land. Business entities have priority rights for concession to the usage
of state-owned agricultural land. Restitution procedures are regulated by the Law on the return

The agricultural sector in Croatia | June 2015 11
of the property confiscated during former Yugoslav communist government (Official Gazette
92/96). The Ministry of Justice (MOJ) is responsible for the implementation of this restitution
process.
The decision to invite bids for buying or leasing state-owned agricultural land falls under
respective municipal or town councils, which are also responsible for the selecting of the best bid.
However, decisions have to be approved by the Ministry of Agriculture. State-owned agricultural
land may be sold only in those areas where the land registry records and cadastral records have
been adjusted to the situation on the ground. If the land, which is under the "Programme for
Disposal of State-owned Agricultural Land" assigned to sale, is not adequately accorded with land
book and cadastral records, it can be leased until the situation is clarified.
By the end of 2002, the government approved 133 of 242 local government programmes of state
land allocation. Total area under approved programmes was 278,059.36 ha. The biggest share
according to the programmes was allocated for sale (44%), then for long-term lease (24%), rental
(17%) and for other purposes (15%).
Today, agricultural support services are insufficient and agricultural producers are not organized
in associations or other interest groups, agricultural cooperatives stagnate and contracts between
the farmers and the agro-processing industry are almost non-existing. As a consequence large
private enterprises originating from the agro-processing or agro-food sector have gradually been
turning again into vertically and horizontally integrated companies in order to secure their supply
of raw materials.
The main constraint to the development of an effective land market in Croatia is the inefficient
land administration system, which results in unclear land titles.
The development of an efficient land registration system, including a digital mapping system,
remains priority for Croatia to ensure the creation of a well-functioning land market.
In the absence of an effective land market, an active informal market has emerged providing short-
term leases, particularly among private farmers, and a low level of unregistered land sales. Efforts
have been started by the government to improve the situation. The Agriculture Act supports the
land privatization process and the land administration system is currently being substantially
improved through further investment (see above). The ‘Council Decision of the European Union
on principles, priorities and conditions contained in the Accession Partnership with Croatia’ (OJ L
55 of 25.2.2006) in February 2006 stated that adopting and implementing a restructuring plan for
the acquisition of real estate is one of the key short-term priorities in the Accession Partnership
with Croatia.
4.3. Farm Structure
The official average farm size in Croatia is 5.6 ha and almost 300,000 agricultural holdings (i.e.
65% of all holdings) are smaller than 2 ha. These farms are mostly engaged in (semi-) subsistence
agriculture. This underlines the importance of subsistence and semi-subsistence farming for
Croatia. For most commodities a large number of small farms are involved in the production of
small volumes of product for markets. Most of those agricultural holdings are small-scale with
mixed production systems. Such a family farm might provide for limited crops for food & feed

12
and a small marketable surplus in e.g. fruits & vegetables or livestock production (e.g. milk, eggs
or meat).
The register shows that about 150,000 people are working in registered farms and that there are
less than 100,000 full time farmers. This is clearly an under-representation of the actual situation.
In contrast to this, the agricultural census in 2013, recorded a total of 233 280 agricultural holdings.
The reason for this is that a very small farm size was eligible (category ‘less than 0.1 ha’ was
included in the questionnaire) in order to be counted as ‘agricultural households’. According to
the agricultural census of 2010, from the total number of agricultural holdings of 99% or 231,070
of holdings acts as a family farm, and only 1% or 2 210 farms act as a legal entity. In 2010, a farm
is an average 5.6 hectares of agricultural land. Compared with the data on the structure of
agricultural holdings from 2007 to 2010 the number of farms increased by 29%, while the average
size of farms increased 0.2 hectares, which expressed in relative terms means an increase of 4%.
Less than 5% of the total family holdings have more than 10 ha. These few large family farms on
the other hand accounted for more than 400,000 ha (some 40% of the UAA - Utilized Agricultural
Area). Farms registered as business entities mostly farmed larger areas of land. Business entities
have on average 159.2 ha UAA. Family farms and business entities together (both bigger than 10
ha) account for 5% of the total farms but farm more than 50% of total UAA. These more
commercially viable family farms are likely to be the driving force in the future agricultural
development of the country.
5. Crop production
Besides its significant domestic importance, Croatia’s crop production contributes significantly to
marketable production in most Western Balkan countries, especially as far as cereals (esp. maize)
are concerned.
Croatia’s farms represent, on average, slightly more than 1% of the total crop area of the EU,
achieving yields (in t) of slightly less than 1% compared to the total production of the EU. This
relation as well as the fact that the major crop, cereals, account for almost 2/3 of the UAA but
contribute only 20% to overall GAO lead to the conclusion that Croatia’ crop production is
currently less competitive than the EU’s. The following sub-sections analyse in more detail the
most important commodities. There appears to be a general declining trend in crop areas for all
leading crops.
5.1. Main Cereals
Cereals dominate crop production in Croatia, accounting for about 64% of total arable land. Maize
and wheat are the most important commodities in the cereals sector. Barley, the third biggest
commodity generates only some 4% of the accumulated GAO (Gross Agricultural Output) of these
three commodities. During the period 2008 to 2012, cereals were produced on an average of
559,916 hectares and production on average totalled 3,137,702 tons.
The agricultural sector in Croatia | June 2015 13
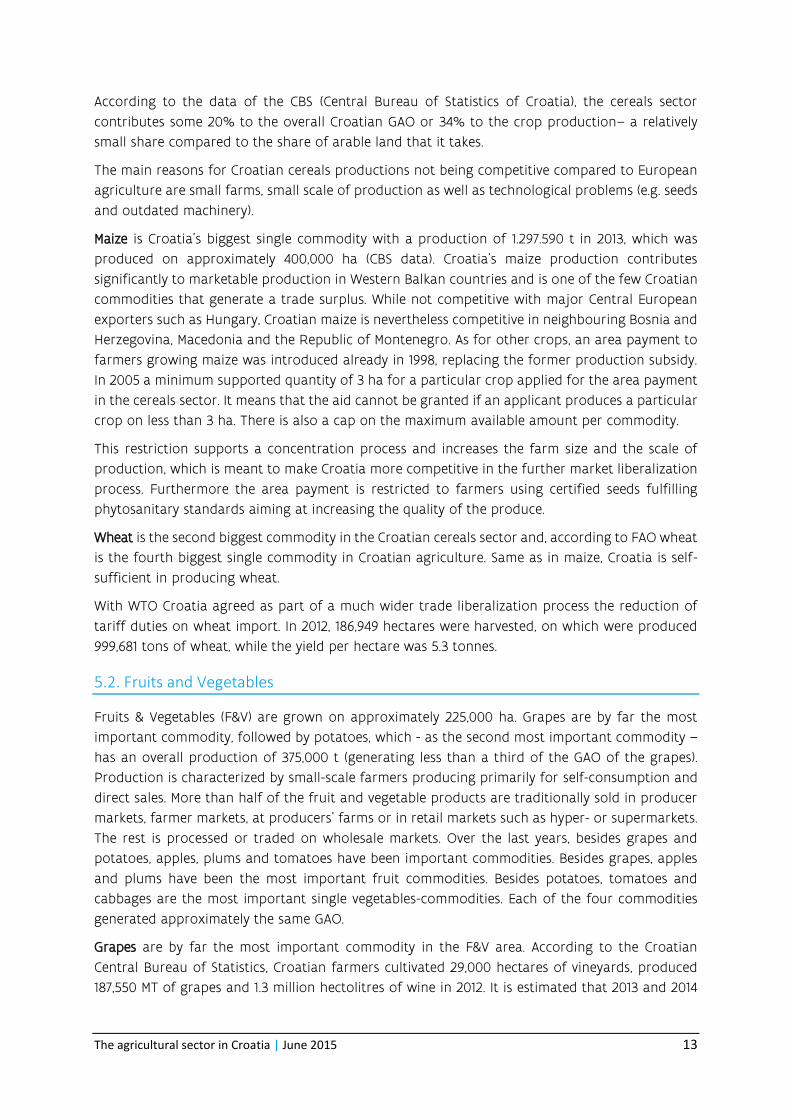
According to the data of the CBS (Central Bureau of Statistics of Croatia), the cereals sector
contributes some 20% to the overall Croatian GAO or 34% to the crop production– a relatively
small share compared to the share of arable land that it takes.
The main reasons for Croatian cereals productions not being competitive compared to European
agriculture are small farms, small scale of production as well as technological problems (e.g. seeds
and outdated machinery).
Maize is Croatia's biggest single commodity with a production of 1.297.590 t in 2013, which was
produced on approximately 400,000 ha (CBS data). Croatia’s maize production contributes
significantly to marketable production in Western Balkan countries and is one of the few Croatian
commodities that generate a trade surplus. While not competitive with major Central European
exporters such as Hungary, Croatian maize is nevertheless competitive in neighbouring Bosnia and
Herzegovina, Macedonia and the Republic of Montenegro. As for other crops, an area payment to
farmers growing maize was introduced already in 1998, replacing the former production subsidy.
In 2005 a minimum supported quantity of 3 ha for a particular crop applied for the area payment
in the cereals sector. It means that the aid cannot be granted if an applicant produces a particular
crop on less than 3 ha. There is also a cap on the maximum available amount per commodity.
This restriction supports a concentration process and increases the farm size and the scale of
production, which is meant to make Croatia more competitive in the further market liberalization
process. Furthermore the area payment is restricted to farmers using certified seeds fulfilling
phytosanitary standards aiming at increasing the quality of the produce.
Wheat is the second biggest commodity in the Croatian cereals sector and, according to FAO wheat
is the fourth biggest single commodity in Croatian agriculture. Same as in maize, Croatia is self-
sufficient in producing wheat.
With WTO Croatia agreed as part of a much wider trade liberalization process the reduction of
tariff duties on wheat import. In 2012, 186,949 hectares were harvested, on which were produced
999,681 tons of wheat, while the yield per hectare was 5.3 tonnes.
5.2. Fruits and Vegetables
Fruits & Vegetables (F&V) are grown on approximately 225,000 ha. Grapes are by far the most
important commodity, followed by potatoes, which - as the second most important commodity –
has an overall production of 375,000 t (generating less than a third of the GAO of the grapes).
Production is characterized by small-scale farmers producing primarily for self-consumption and
direct sales. More than half of the fruit and vegetable products are traditionally sold in producer
markets, farmer markets, at producers’ farms or in retail markets such as hyper- or supermarkets.
The rest is processed or traded on wholesale markets. Over the last years, besides grapes and
potatoes, apples, plums and tomatoes have been important commodities. Besides grapes, apples
and plums have been the most important fruit commodities. Besides potatoes, tomatoes and
cabbages are the most important single vegetables-commodities. Each of the four commodities
generated approximately the same GAO.
Grapes are by far the most important commodity in the F&V area. According to the Croatian
Central Bureau of Statistics, Croatian farmers cultivated 29,000 hectares of vineyards, produced
187,550 MT of grapes and 1.3 million hectolitres of wine in 2012. It is estimated that 2013 and 2014

14
wine and grape production levels will be similar to 2012. Statistical data on planted varieties show
a marked preference for white grape varieties (almost 69%).
They are the third most important single commodity. According to the Grape and Wine Producers
Register 14,436 producers were engaged in registered grape and wine production in Croatia in
2005. Most producers (2,973) are located in the County of Split-Dalmatia. Out of the total number
of producers, 451 have controlled origin protection and produce 1,219 different wines with
controlled origin mark.
5.3. Industrial Crops
The area used for the production of sugar beet has increased by approximately 20% in the last
years, amounting to more than 2% of the arable land. The preferences given to Croatia and other
countries in the Western Balkans for sugar exports to the EU resulted in a gradual increase of
sugar production. Still the importance of sugar beet production in the overall Croatian agriculture
is limited (approximately 1.2% of total GAO). According to the Agricultural Census, approximately
2,450 family farms and 173 business entities have been cultivating sugar beet. On average, these
producers have a farm size of 9.3 ha, which is above Croatian average in the crop sector (the size
of a family farm was on average 4.4 ha and for business entities 78.4 ha).
In 2012, the production of sugar beet was carried out on 23,502 hectares, while the quantity
produced was 960,000 tones. In 2013 the percentage change was 9.45%, increasing the production
with approximately 100 000 tones.
Sugar beet yields have been erratic, mostly due to the weather conditions and relatively poor
technology.
Tobacco was produced, according to the Agricultural Census, by 2,077 family farms and 28 business
entities. Almost 90% of tobacco grown is the ‘Virginia’ variety.
As regards family farms dealing with tobacco growing, the majority of tobacco is produced by
farms having the size of 5 to 20 ha (> 50% of the farms).
Out of 28 registered business entities, 7 among them grow tobacco on more than 100 ha, and a
further 11 on areas covering 11 to 30 ha. The total tobacco produced amounted to 11,000 t, which
equalled a share of tobacco in the overall Croatian GAO of approximately 1%.
6. Livestock and Fishing
Agriculture is also based on two other sectors:
1. Livestock 2. Fishing
In the livestock sector, small production units predominate, especially for cattle, pig, sheep, goat
and horse keeping. Poultry production on the other hand is characterized by large-scale
production units (for poultry meat and eggs). During the war period (1991-1995) the number of
cows decreased significantly. This has obviously reduced the production volume but also slowed

The agricultural sector in Croatia | June 2015 15
the structural adjustment of the sector. Croatia is neither self-sufficient in beef production nor in
milk production.
The estimated national product from the Croatian fishing sector in terms of average annual
income over the period 1995 - 2005 amounted to €139 million.
6.1 Livestock
Croatia is neither self-sufficient in beef production (self-sufficiency rate is less than 80%) nor in
milk production (approximately 85%).
During the war period (1991-1995) the number of cows and pregnant heifers decreased by
approximately 125,000. This has obviously reduced the production volume but more importantly
slowed structural adjustment of the sector. The size of the herd has grown slowly but steadily in
the period from 2001-2005. From 2004 onwards, support programmes arose from the Croatian
Government increased efforts to boost the sub-sector.
The ‘Programme for Development of Bovine Production’ was launched in 2004, aiming at
increasing the profitability, efficiency and competitiveness of the sector by co-financing the
procurement of breeding females and males in cattle breeding.
It targets all small/medium-sized agricultural holdings with 20–100 cattle in order to increase
(inter alia) self-sufficiency in the sector. The impact of the scheme on productivity and overall
production has not yet been analysed.
According to the Census of Agriculture, in 2009 there were a total of 97.887 farms with cattle in
the Republic of Croatia, among which 75.134 have mixed production, and with only one type of
production or keeping of domestic animals engaged in the 23,679 farms.
Domestic cattle breeders are, however, nearly 50,000, and the number of cattle 451.898. And yet,
the number of milk producers for the market fell from 60,000 to 27,000 only in the last nine years.
At the same time the quality of milk doubled: it is now in 72%of the EU in line with this standard.
The CLC, however, say that domestic drilling, native breed cows, no longer threatened with
extinction, as well as the Istrian boškarin, a considerable number of farmers and sheep, 17.328 of
them, who grow almost 750.000 sheep.
Now it is known that 265 wild fowl breeders have some 81.637 units. These are pheasants,
partridges, pigeons, and other birds that are primarily used for hunting.
On the other hand, breeding ostriches ten years ago experienced a great boom, 32 owners are
now registered. The number of horses continues to grow because of fewer owners (2.412, holding
nearly 11,000 horses). But, fortunately, the actual number of horses is now much higher, about
15,000, although fifteen years ago that number was only half.
The aim of the register of farms was to monitor every movement of domestic animals that needs
to be justified and documented in accordance with the Veterinary and Animal Welfare Act. In this
way, an end could be put to the destruction of domestic livestock, especially calves, because the
penalty for breaking the law was losing the incentives, announced the veterinary inspection.
Specifically, within seven days after birth, the calf must be registered on the farm, or get an ear
tag. After the cattle, the labelling system was applied to pigs, sheep and goats.

16
The Farm Register is the basis for monitoring the health of domestic animal breeding and
selection, classification of carcasses, and future support (IACS). Specifically, the EU farm subsidies
are per share, or throat, not per production unit.
In 2014, as compared to the 2013 final data, the increase of cattle was by 8%, of pigs by 5% and,
of sheep was by 23% higher while that of goats was by 27% lower. The production of poultry also
decreased, by 8%, compared to the previous year. As compared to the same period of the previous
year, the production of cows' milk decreased by 1%, the production of sheep’s milk by 23% and
of goats’ milk by 20%. The production of wool decreased by 8% and the production of hens’ eggs
by 6%.
The following table presents the livestock production in 2011. As can been seen, the data confirm
the growth mentioned above.
Unit of measure
Total Indices 2011. 2010.
Production in 2013 Production in 2014
Cattle t 78 406 72 335 92
Pigs t 138 095 131 033 95
Sheep t 8 643 10 595 123
Goats t 1 261 915 73
Poultry t 94 137 86 682 92
Cows’ milk ‘000 l 696 101 690 463 99
Sheep’s milk '000 l 8 908 6 874 77
Goats’ milk '000 l 12 500 10 044 80
Wool t 1 026 941 92
Eggs '000 p/st 605 553 570 333 94
Honey t 2 088 2 832 136
Table 6: Livestock production, 2011; Source: www.dzs.hr
The data concerning the price indices of stock, poultry and animal production output, provided
by the Croatia Bureau of Statistics, are summarized in the table below.

The agricultural sector in Croatia | June 2015 17
2005 = 100
2008 2009 2010
Animal Production 102,6 99,4 94,6
Cattle 104,6 103,7 97,8
Pigs 92,6 98,4 83,2
Horses 112,4 123,7 123,4
Sheep and goats 111,4 113,0 106,2
Poultry 94,4 91,2 90,6
Other animals 61,1 58,6 57,3
Milk 120,3 101,9 105,4
Eggs 108,1 98,4 97,0
Table 7: Price indices of livestock, poultry and animal products output; Source: www.dzs.hr
18
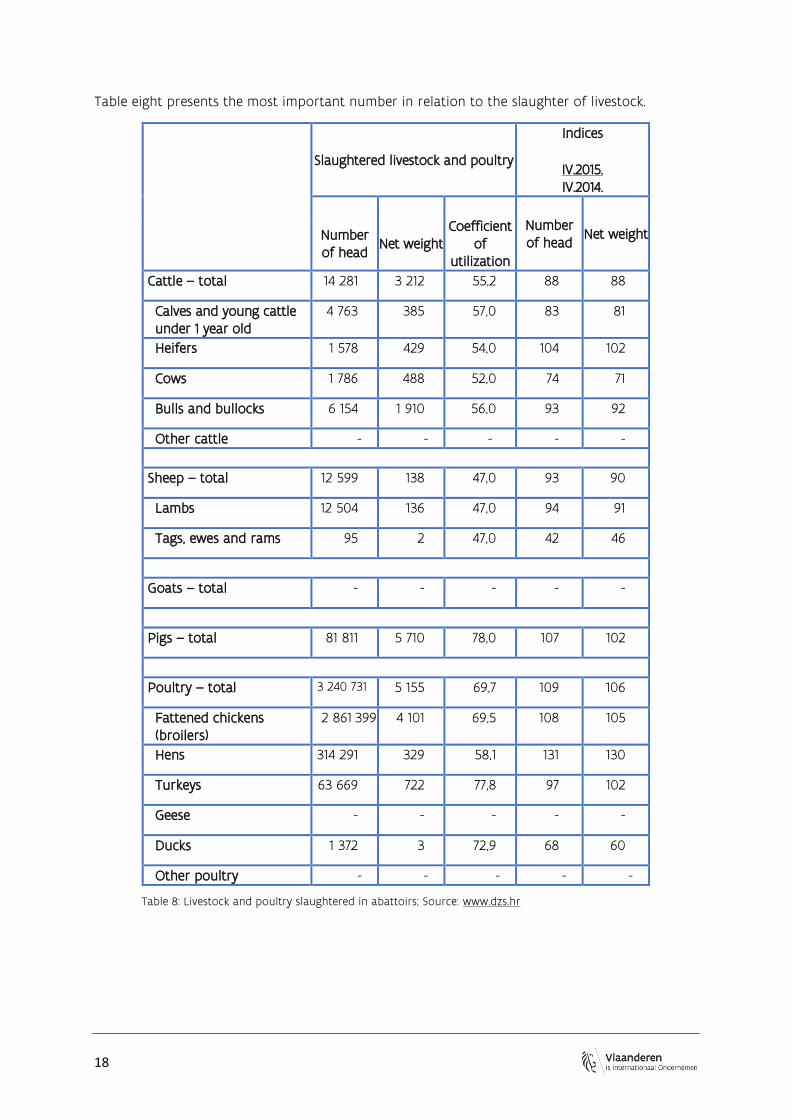
Table eight presents the most important number in relation to the slaughter of livestock.
Slaughtered livestock and poultry
Indices
IV.2015. IV.2014.
Number of head
Net weight Number of head
Net weight Coefficient
of utilization
Cattle – total 14 281 3 212 55,2 88 88
Calves and young cattle under 1 year old
4 763 385 57,0 83 81
Heifers 1 578 429 54,0 104 102
Cows 1 786 488 52,0 74 71
Bulls and bullocks 6 154 1 910 56,0 93 92
Other cattle - - - - -
Sheep – total 12 599 138 47,0 93 90
Lambs 12 504 136 47,0 94 91
Tags, ewes and rams 95 2 47,0 42 46
Goats – total - - - - -
Pigs – total 81 811 5 710 78,0 107 102
Poultry – total 3 240 731 5 155 69,7 109 106
Fattened chickens (broilers)
2 861 399 4 101 69,5 108 105
Hens 314 291 329 58,1 131 130
Turkeys 63 669 722 77,8 97 102
Geese - - - - -
Ducks 1 372 3 72,9 68 60
Other poultry - - - - -
Table 8: Livestock and poultry slaughtered in abattoirs; Source: www.dzs.hr

The agricultural sector in Croatia | June 2015 19
6.2 Fishing
The coastal length of Croatia is approximately 6.000 km what accounts for nearly 9% of the total
Mediterranean coastline. The total surface of the coastal and territorial sea is approximately
31.000 km². Along the Adriatic Sea coasts there are 718 large and small islands, 389 cliffs and 78
reefs. Moderate temperatures and an unpolluted environment provide extensive possibilities for
mariculture activities. Croatia lies in the FAO-GFCM Geographical Sub Area 17. Marine and
freshwater fishing is an important segment of Croatia's economy. The estimated national product
from the Croatian fishing industry in terms of average annual income over the period 1995-2005
amounted to 180 million USD.
Croatia’s domestic fisheries production in 2012 was approximately 74.664 tons, of which 63.997
from capture fisheries and 10.667 from aquaculture (FAO, 2012).
According to data provided by the Croatian Bureau of Statistics, export of fish and fish products
represents 1.0-1.5% of total Croatian exports. Aquatic food import makes 3.71% of total agriculture
and food import. Exports only makes up 0.56% in quantity, but 11.03% in value. Most of the high
value export concerns tuna production.
Sea bass and sea bream are the dominant farmed species in Croatia. The two main shellfish
species cultured in Croatia are the European flat oyster and the Mediterranean mussel.
The following table depicts the general figures of the fishing sector in Croatia.
Total fisheries production (t) 2012*** 74644
Capture production (t) 2012*** 63997
Aquaculture production (t) 2012*** 10667
Per caput fish supply (kg/year, 2003-2005)*** 14.2
Production (tonnes in live weight) 2003-2005*** 39797
Non-food uses (tonnes in live weight) 2003-2005*** 3853
Imports (tonnes in live weight) 2003-2005*** 64548
Exports (tonnes in live weight) 2003-2005*** 36294
Food supply (tonnes in live weight) 2003-2005*** 64197
Imports (US$ 1.000) 2006*** 112487
Exports (US$ 1.000) 2006*** 159382
Net balance 2006*** 46895
Fishery exports as a percentage of agricultural exports (%) 2003*** 14.6
Fishery exports as a percentage of total merchandise exports (%) 2006***
1.5
Table 9: Fisheries data; Source: http://www.faoadriamed.org
*UNDP. Human Development Report

20
**The World Bank
***FAO Yearbook of Fishery Statistics - 2012
6.2.1. Seawater Fishing
The total catches and production of sea fish and other sea organisms in 2013 amounted to 85.713
tonnes, which means that it increased by 18% compared to the previous year. The catches and
production of pelagic fish increased by 21%, of other fish by 13% and of crustaceans by 41%, while
the catches and production of oysters, other molluscs and shellfish decreased by 15%, all
compared to the previous year.
Table ten shows the catches and production of the sea fish, crustaceans, oysters and other
molluscs and shellfish in 2013.
Catches and production, t Indices, total
2013. 2012.
2012 2013
Total Total Catches Production
Total 72 714 85 713 75 229 10 484 118
Fish 67 727 81 190 72 706 8 484 120
Pelagic fish 58 687 71 008 68 392 2 616 121
Pilchard 43 527 53 085
- - 122
Anchovy 8 109 8 904 - - 110
Bluefin tuna 2 280 3 005 389 2 616 132
Mixed small fish 3 552 4 667 4 667 - 131
Other species 1 219 1 347 1 347 - 111
Other fish 9 040 10 182 4 314 5 868 113
Hake 919 1 138 1 138 - 124
Red mullet 1 318 1 104 1 104 - 84
Grey mullet 94 112 112 - 119
Conger 41 50 50 - 122
Seabass 2 460 2 832 6 2 826 115
Gilthead seabream 2 247 3 055 77 2 978 136
Picarels 194 162 162 - 84
Bogue 143 98 98 - 69
Sole 191 253 253 - 132
Other species 1 433 1 378 1 378 64 96
Crustaceans 487 685 685 - 141
Spiny lobster 10 13 13 - 88

The agricultural sector in Croatia | June 2015 21
Norway lobster 260 300 300 - 115
Prawn and other crustaceans
217 372 372 - 171
Oysters and other molluscs and shellfish
4 500 3 838 1 838 2000 85
Oysters, mussels and other shellfish
3 335 2 475 475 2000 74
Squid 320 391 391 - 122
Cuttlefish 182 189 189 - 104
Octopus 166 191 191 - 115
Cephalopods 497 592 592 - 119
Table 10: Catches and Production of the Sea Fish, Crustaceans, Oysters and other Molluscs and Shellfish Source: www.dzs.hr
The catches of sea fish, crustaceans, oysters, other molluscs and shellfish is also visualized through the graph below.
Figure 1: Catches of Sea Fish, Crustaceans, Oysters and other Molluscs and Shellfish; Source: www.dzs.hr, 2013
22
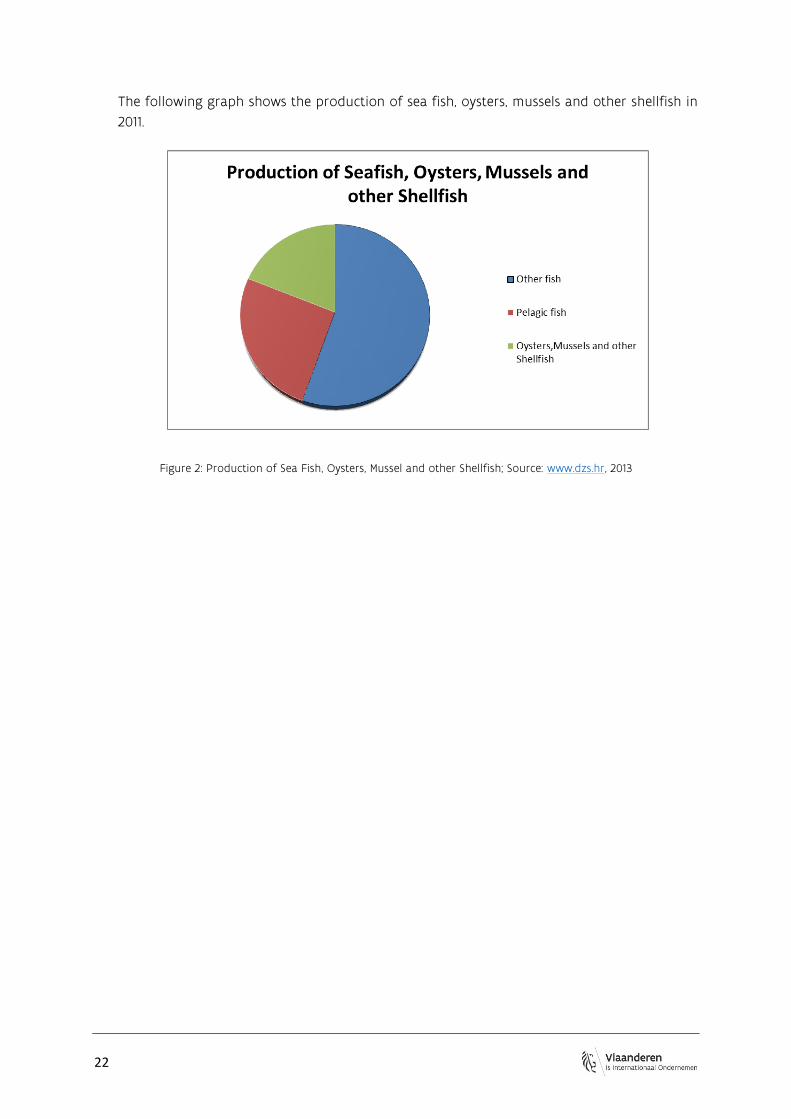
The following graph shows the production of sea fish, oysters, mussels and other shellfish in
2011.
Figure 2: Production of Sea Fish, Oysters, Mussel and other Shellfish; Source: www.dzs.hr, 2013

The agricultural sector in Croatia | June 2015 23
6.2.2. Freshwater Fishing
The total production of freshwater fish in 2013 amounted to 3.235 tonnes, which represents the
decrease of 23% compared to 2012.
In 2013, as compared to 2012, the production of consumer fish in trout fishponds amounted to
2885 tonnes, which means that it decreased by 10%, while the production in carp fishponds
amounted to 350 tonnes, which represents a decrease of 65%.
Out of the total fish production 65% was carp and 11% trout.
The general overview of this sector will be presented by tables and graphs representing
respectively:
Fishponds area in exploitation:
Area
2012 2013
Indices
2013. 2012.
Carp fishponds, ha 10 650 10 521 99
Trout fishponds, m2 49 897 38 407 77
Table 11: Fishponds area in exploitation; Source: www.dzs.hr, 2013
Production of milt:
Production, t
2012 2013
Indices
2013. 2012.
Total 3 322 3 816 115
Carp 2 684 3 149 117
Other fish 638 667 105
Table 12: Production of Milt; Source: www.dzs.hr, 2013
24
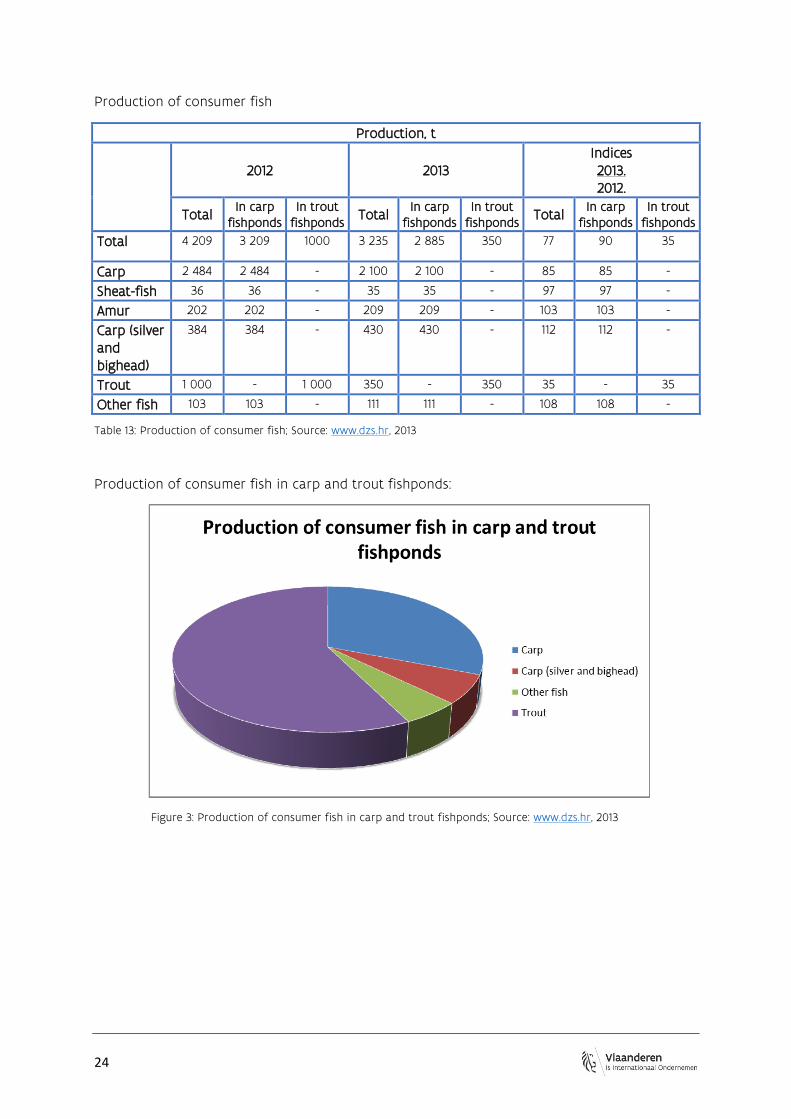
Production of consumer fish
Production, t
2012 2013 Indices 2013. 2012.
Total In carp
fishponds In trout
fishponds Total
In carp fishponds
In trout fishponds
Total In carp
fishponds In trout
fishponds
Total 4 209 3 209 1000 3 235 2 885 350 77 90 35
Carp 2 484 2 484 - 2 100 2 100 - 85 85 -
Sheat-fish 36 36 - 35 35 - 97 97 -
Amur 202 202 - 209 209 - 103 103 -
Carp (silver and bighead)
384 384 - 430 430 - 112 112 -
Trout 1 000 - 1 000 350 - 350 35 - 35
Other fish 103 103 - 111 111 - 108 108 -
Table 13: Production of consumer fish; Source: www.dzs.hr, 2013
Production of consumer fish in carp and trout fishponds:
Figure 3: Production of consumer fish in carp and trout fishponds; Source: www.dzs.hr, 2013
The agricultural sector in Croatia | June 2015 25
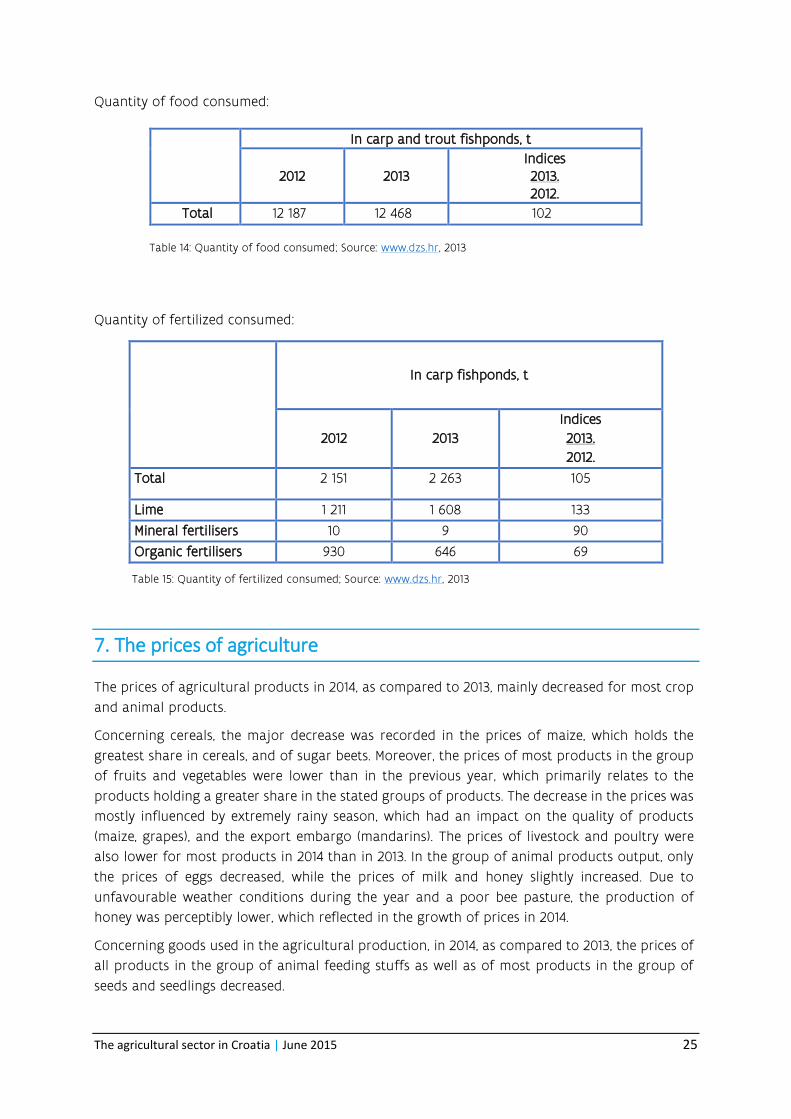
Quantity of food consumed:
Quantity of fertilized consumed:
In carp fishponds, t
2012 2013
Indices
2013.
2012.
Total 2 151 2 263 105
Lime 1 211 1 608 133
Mineral fertilisers 10 9 90
Organic fertilisers 930 646 69
Table 15: Quantity of fertilized consumed; Source: www.dzs.hr, 2013
7. The prices of agriculture
The prices of agricultural products in 2014, as compared to 2013, mainly decreased for most crop
and animal products.
Concerning cereals, the major decrease was recorded in the prices of maize, which holds the
greatest share in cereals, and of sugar beets. Moreover, the prices of most products in the group
of fruits and vegetables were lower than in the previous year, which primarily relates to the
products holding a greater share in the stated groups of products. The decrease in the prices was
mostly influenced by extremely rainy season, which had an impact on the quality of products
(maize, grapes), and the export embargo (mandarins). The prices of livestock and poultry were
also lower for most products in 2014 than in 2013. In the group of animal products output, only
the prices of eggs decreased, while the prices of milk and honey slightly increased. Due to
unfavourable weather conditions during the year and a poor bee pasture, the production of
honey was perceptibly lower, which reflected in the growth of prices in 2014.
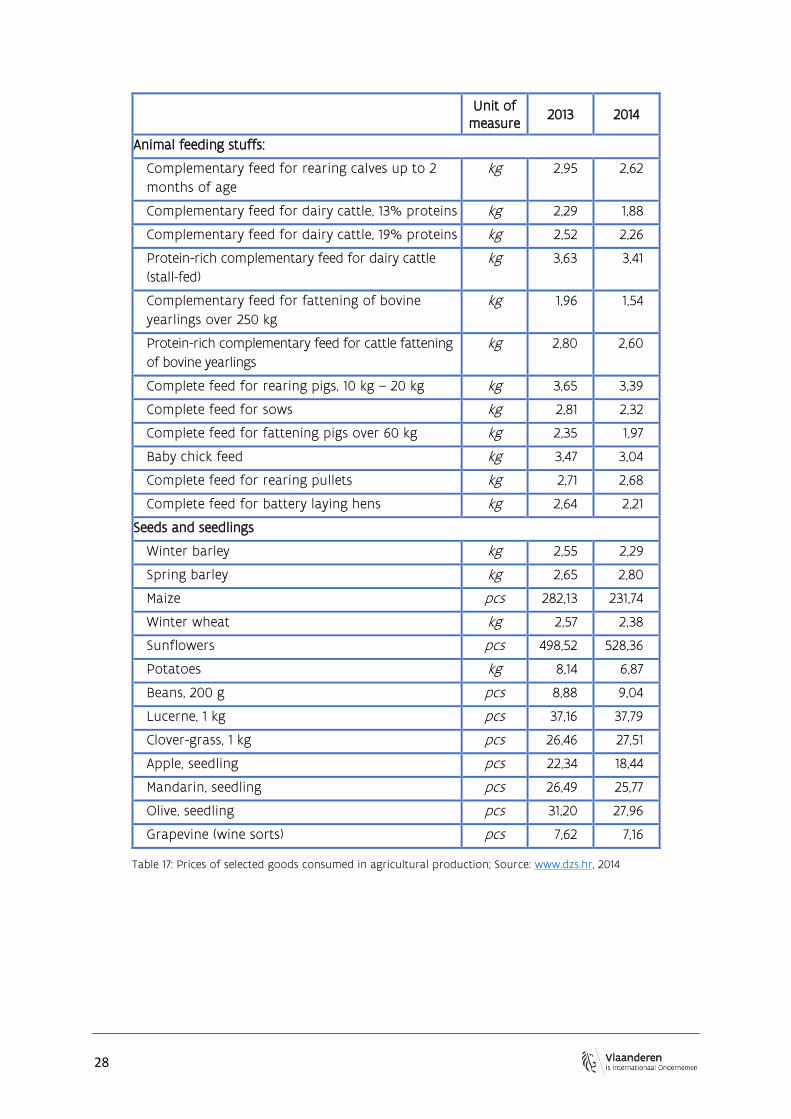
Concerning goods used in the agricultural production, in 2014, as compared to 2013, the prices of
all products in the group of animal feeding stuffs as well as of most products in the group of
seeds and seedlings decreased.
In carp and trout fishponds, t
2012 2013 Indices 2013. 2012.
Total 12 187 12 468 102
Table 14: Quantity of food consumed; Source: www.dzs.hr, 2013
26
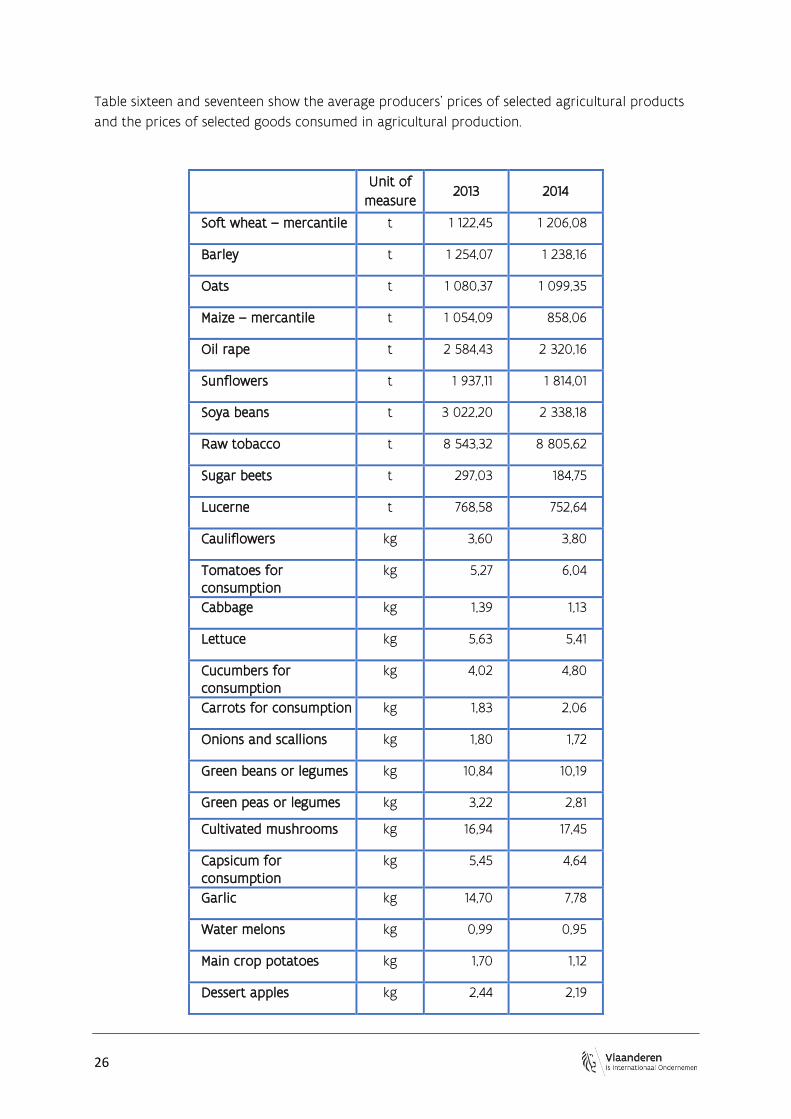
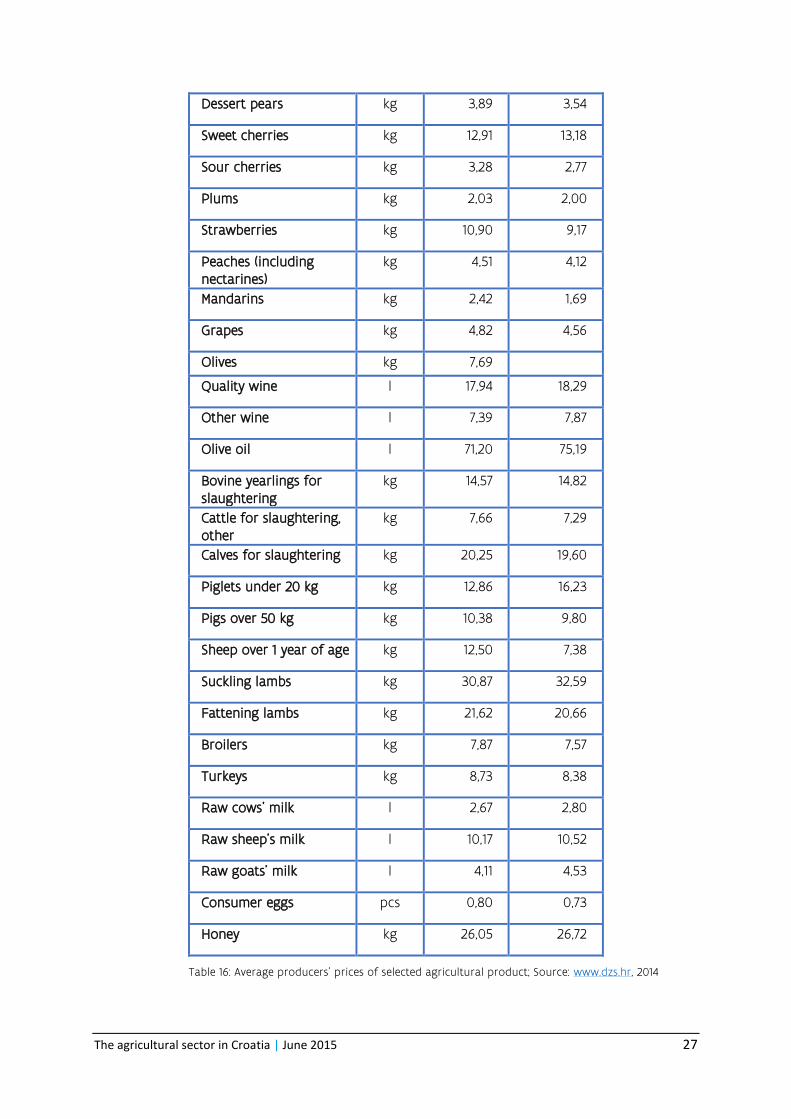
Table sixteen and seventeen show the average producers’ prices of selected agricultural products
and the prices of selected goods consumed in agricultural production.
Unit of
measure 2013 2014
Soft wheat – mercantile t 1 122,45 1 206,08
Barley t 1 254,07 1 238,16
Oats t 1 080,37 1 099,35
Maize – mercantile t 1 054,09 858,06
Oil rape t 2 584,43 2 320,16
Sunflowers t 1 937,11 1 814,01
Soya beans t 3 022,20 2 338,18
Raw tobacco t 8 543,32 8 805,62
Sugar beets t 297,03 184,75
Lucerne t 768,58 752,64
Cauliflowers kg 3,60 3,80
Tomatoes for consumption
kg 5,27 6,04
Cabbage kg 1,39 1,13
Lettuce kg 5,63 5,41
Cucumbers for consumption
kg 4,02 4,80
Carrots for consumption kg 1,83 2,06
Onions and scallions kg 1,80 1,72
Green beans or legumes kg 10,84 10,19
Green peas or legumes kg 3,22 2,81
Cultivated mushrooms kg 16,94 17,45
Capsicum for consumption
kg 5,45 4,64
Garlic kg 14,70 7,78
Water melons kg 0,99 0,95
Main crop potatoes kg 1,70 1,12
Dessert apples kg 2,44 2,19
The agricultural sector in Croatia | June 2015 27
Dessert pears kg 3,89 3,54
Sweet cherries kg 12,91 13,18
Sour cherries kg 3,28 2,77
Plums kg 2,03 2,00
Strawberries kg 10,90 9,17
Peaches (including nectarines)
kg 4,51 4,12
Mandarins kg 2,42 1,69
Grapes kg 4,82 4,56
Olives kg 7,69
Quality wine l 17,94 18,29
Other wine l 7,39 7,87
Olive oil l 71,20 75,19
Bovine yearlings for slaughtering
kg 14,57 14,82
Cattle for slaughtering, other
kg 7,66 7,29
Calves for slaughtering kg 20,25 19,60
Piglets under 20 kg kg 12,86 16,23
Pigs over 50 kg kg 10,38 9,80
Sheep over 1 year of age kg 12,50 7,38
Suckling lambs kg 30,87 32,59
Fattening lambs kg 21,62 20,66
Broilers kg 7,87 7,57
Turkeys kg 8,73 8,38
Raw cows' milk l 2,67 2,80
Raw sheep’s milk l 10,17 10,52
Raw goats' milk l 4,11 4,53
Consumer eggs pcs 0,80 0,73
Honey kg 26,05 26,72
Table 16: Average producers' prices of selected agricultural product; Source: www.dzs.hr, 2014
28
Unit of measure
2013 2014
Animal feeding stuffs:
Complementary feed for rearing calves up to 2
months of age
kg 2,95 2,62
Complementary feed for dairy cattle, 13% proteins kg 2,29 1,88
Complementary feed for dairy cattle, 19% proteins kg 2,52 2,26
Protein-rich complementary feed for dairy cattle
(stall-fed)
kg 3,63 3,41
Complementary feed for fattening of bovine
yearlings over 250 kg
kg 1,96 1,54
Protein-rich complementary feed for cattle fattening
of bovine yearlings
kg 2,80 2,60
Complete feed for rearing pigs, 10 kg – 20 kg kg 3,65 3,39
Complete feed for sows kg 2,81 2,32
Complete feed for fattening pigs over 60 kg kg 2,35 1,97
Baby chick feed kg 3,47 3,04
Complete feed for rearing pullets kg 2,71 2,68
Complete feed for battery laying hens kg 2,64 2,21
Seeds and seedlings
Winter barley kg 2,55 2,29
Spring barley kg 2,65 2,80
Maize pcs 282,13 231,74
Winter wheat kg 2,57 2,38
Sunflowers pcs 498,52 528,36
Potatoes kg 8,14 6,87
Beans, 200 g pcs 8,88 9,04
Lucerne, 1 kg pcs 37,16 37,79
Clover-grass, 1 kg pcs 26,46 27,51
Apple, seedling pcs 22,34 18,44
Mandarin, seedling pcs 26,49 25,77
Olive, seedling pcs 31,20 27,96
Grapevine (wine sorts) pcs 7,62 7,16
Table 17: Prices of selected goods consumed in agricultural production; Source: www.dzs.hr, 2014
The agricultural sector in Croatia | June 2015 29
8. Import and Export
Due to the limited domestic market and a loss of traditional markets, the Croatian economic
development today is export oriented, with an important role for agriculture.
Croatian agriculture experienced numerous transitional problems: the mentioned loss of
traditional markets, failures in privatizing state-owned land, poorly organized markets,
technological and educational limitations, producer insolvency, an export-import deficit, etc.
In 2012 Croatia exported agricultural and food products to 109 countries. Most agro-food products
were exported to Bosnia and Herzegovina, Italy, Slovenia, Serbia and Hungary.
In 2012 Croatia imported agricultural and food products from 172 countries. In that year, most
agricultural and food products were imported from Germany, Italy, the Netherlands, Brazil and
Hungary.
Neighbouring markets are very important for Croatia and there is a positive foreign trade balance
in agricultural and food products exchange with Bosnia and Herzegovina, Montenegro, Slovenia
and Serbia, and a negative one only with Macedonia.
8.1. EU Agricultural Trade with Croatia
Since Croatia is part of the EU the country now has access to a single internal market with no
barriers (physical, administrational…). Advantages of this access are a deduction of the cross-
border business costs, increased competition and free market access for Croatian businessmen to
all member states and market countries with which the EU has trade agreements. With its
membership Croatia became a party to all preferential trade agreements that the European Union
concludes with third countries.
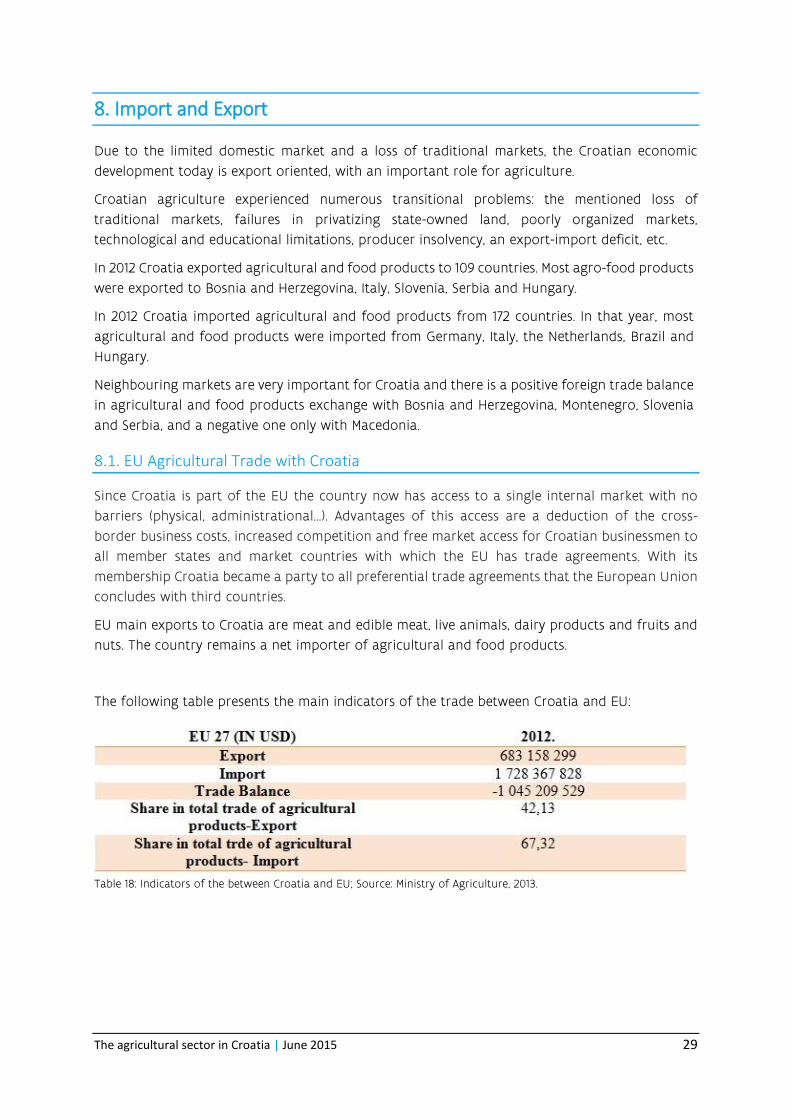
EU main exports to Croatia are meat and edible meat, live animals, dairy products and fruits and
nuts. The country remains a net importer of agricultural and food products.
The following table presents the main indicators of the trade between Croatia and EU:
Table 18: Indicators of the between Croatia and EU; Source: Ministry of Agriculture, 2013.
30
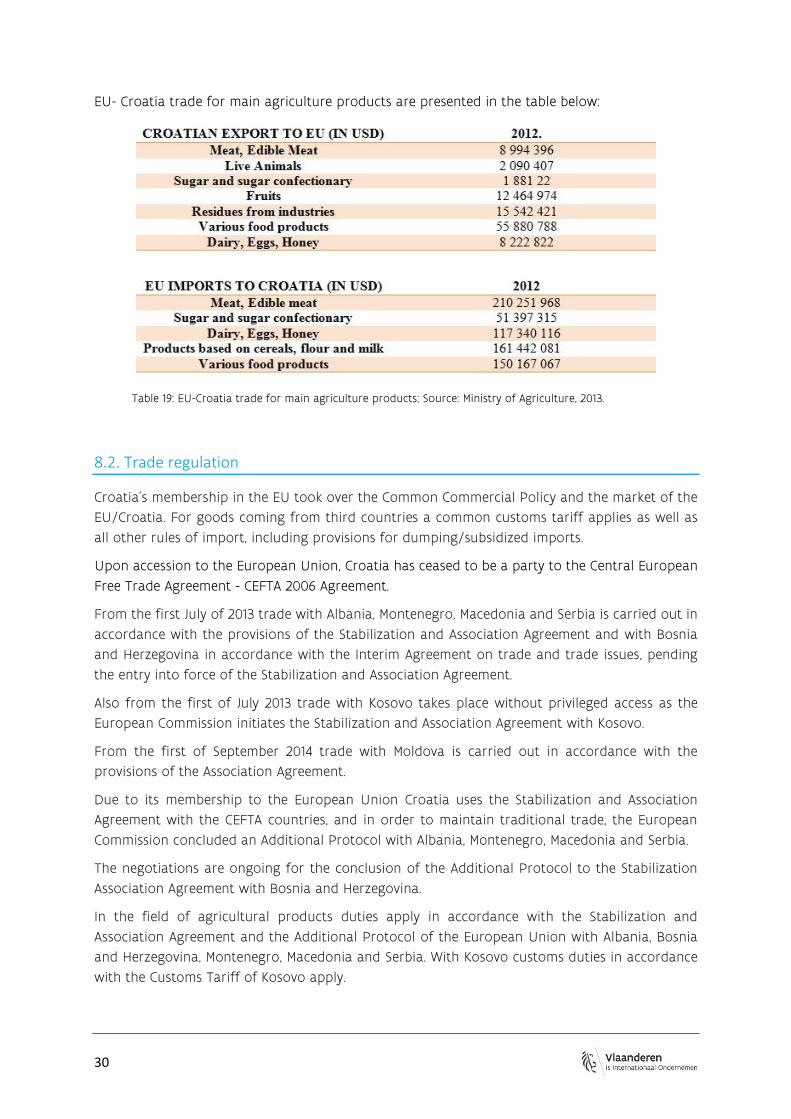
EU- Croatia trade for main agriculture products are presented in the table below:
Table 19: EU-Croatia trade for main agriculture products; Source: Ministry of Agriculture, 2013.
8.2. Trade regulation
Croatia’s membership in the EU took over the Common Commercial Policy and the market of the
EU/Croatia. For goods coming from third countries a common customs tariff applies as well as
all other rules of import, including provisions for dumping/subsidized imports.
Upon accession to the European Union, Croatia has ceased to be a party to the Central European
Free Trade Agreement - CEFTA 2006 Agreement.
From the first July of 2013 trade with Albania, Montenegro, Macedonia and Serbia is carried out in
accordance with the provisions of the Stabilization and Association Agreement and with Bosnia
and Herzegovina in accordance with the Interim Agreement on trade and trade issues, pending
the entry into force of the Stabilization and Association Agreement.
Also from the first of July 2013 trade with Kosovo takes place without privileged access as the
European Commission initiates the Stabilization and Association Agreement with Kosovo.
From the first of September 2014 trade with Moldova is carried out in accordance with the
provisions of the Association Agreement.
Due to its membership to the European Union Croatia uses the Stabilization and Association
Agreement with the CEFTA countries, and in order to maintain traditional trade, the European
Commission concluded an Additional Protocol with Albania, Montenegro, Macedonia and Serbia.
The negotiations are ongoing for the conclusion of the Additional Protocol to the Stabilization
Association Agreement with Bosnia and Herzegovina.
In the field of agricultural products duties apply in accordance with the Stabilization and
Association Agreement and the Additional Protocol of the European Union with Albania, Bosnia
and Herzegovina, Montenegro, Macedonia and Serbia. With Kosovo customs duties in accordance
with the Customs Tariff of Kosovo apply.
The agricultural sector in Croatia | June 2015 31
Croatia is the beneficiary of a GSP scheme and therefore today benefits reductions under the GSP
scheme of the following countries: Canada, Japan, Australia, New Zealand, Russia and Belarus.
8.2.1. WTO accession
Croatia has been a member of WTO since November 2000 and an observer to the Agreement of
Government Procurement (GPA) accession with a 0.169% contribution to WTO budget in 2011. The
average of imports duties for agricultural goods applied in 2009 was 10.7%.
8.2.2. Trade Performance
In 2012 Croatia imported agro-food products worth 2,567.3 million US dollars, while exports of
agricultural and food products were worth 1,621.5 million US dollars, leading to a deficit of 945.8
million US dollars.
The country remains a net importer of agricultural and food products, but it is a net exporter of
cereals. The main exports products are beverages, meat and edible meat, live animals, tobacco and
cigarettes, sugar, cigarettes, vegetables, salted anchovies, beer, olive oil, canned sardine, instant
soups and tuna fish. They account for about 65% of total fresh and frozen fish exports. Major
imported products include oil cakes, cigarettes, sugar, mineral water, frozen pork, etc.
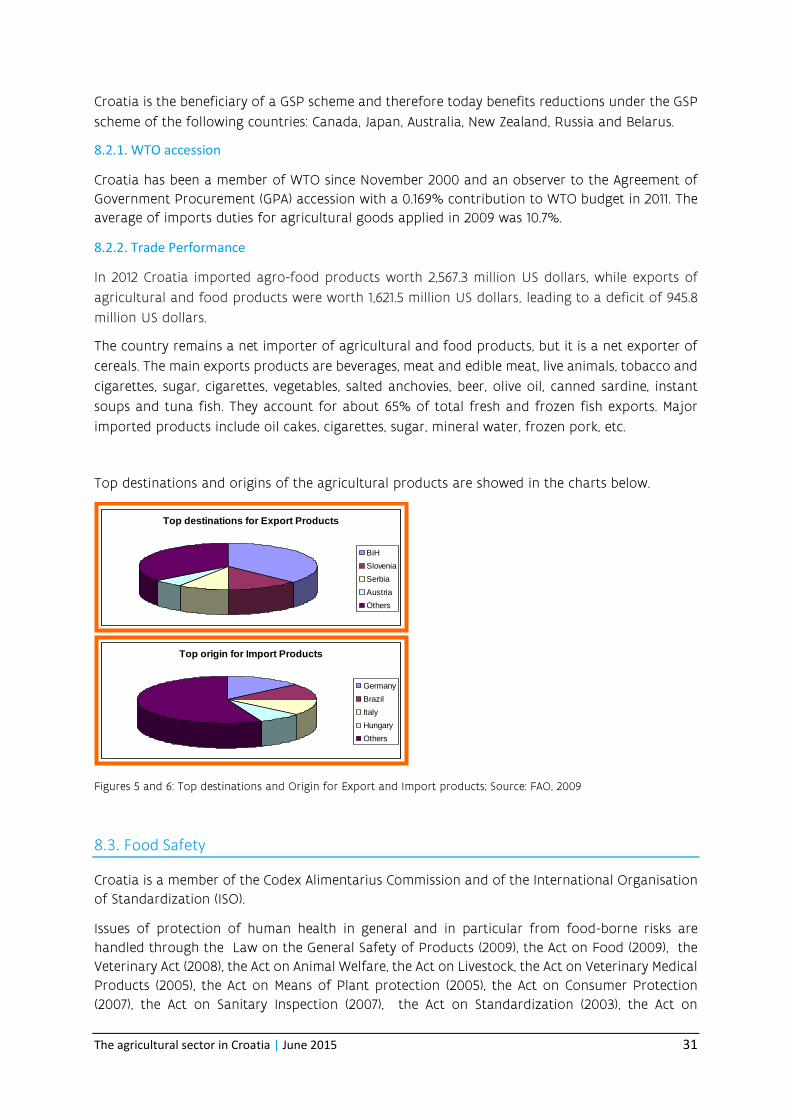
Top destinations and origins of the agricultural products are showed in the charts below.
Figures 5 and 6: Top destinations and Origin for Export and Import products; Source: FAO, 2009
8.3. Food Safety
Croatia is a member of the Codex Alimentarius Commission and of the International Organisation
of Standardization (ISO).
Issues of protection of human health in general and in particular from food-borne risks are
handled through the Law on the General Safety of Products (2009), the Act on Food (2009), the
Veterinary Act (2008), the Act on Animal Welfare, the Act on Livestock, the Act on Veterinary Medical
Products (2005), the Act on Means of Plant protection (2005), the Act on Consumer Protection
(2007), the Act on Sanitary Inspection (2007), the Act on Standardization (2003), the Act on
Top destinations for Export Products
BiH
Slovenia
Serbia
Austria
Others
Top origin for Import Products
Germany
Brazil
Italy
Hungary
Others
32
Technical Requirements for Products and Conformity Assessment (2010), the Act on Accreditation
(2009) and the Act on Metrology (2007).
Croatia has adopted implementing secondary legislation aligned with the EU acquis in all sectors.
The Ordinance on the rapid alert system for food and feed has been created and an efficient
system of consumer protection in line with all the international standards has been developed.
8.3.1. Certification and Quality Control
The Croatian Standards Institute (HZN) has transposed nearly all European standards. The HZN
became a full member of the European Committee for Standardization (CEN) in 2010. By 2010 the
Croatian Accreditation Agency accredited 1,551 laboratories, certification and inspection bodies.
Six food products have been certified to testify of their genuine and original characteristics or
geographical origin according to the Act on Designation of Originality, Designation of
Geographical Origin and Designation of Traditional Reputation of Agricultural and Food Products
(2008).
Since 2003 under the Act of Food the HACCP system of quality control became an obligatory
procedure.
8.4. Export/Import documentation procedures
Information on the export and import certificates required by the Government of Croatia for
processed food, agricultural food products, live animals (cattle, pets, etc), products for animal
consumption and feed can be found on this website http://www.mps.hr/default.aspx?id=3631
9. Agricultural Fairs
Participating in a fair is the easiest way of establishing the first contact with prospective partners
and are a meeting place for professionals.
Fairs are places to get acquainted with existing trends, places where one can simultaneously see,
compare, assess and at the same moment obtain feedback about the product or service and can
directly analyse the company and its position towards its competition.
The significance of fairs is increasingly growing. Therefore many companies use fairs as their basic
and most important advertising element.
Fairs
AGRICULTURAL AND ENTREPRENEURIAL IDEAS
Organized by:
Slavonski Brod and Posavina County
Administrative Department for Agriculture, Forestry and Water Resources Management
Kralja Petra Krešimira IV br.1, HR-35000 Slavonski Brod
T: +385 35 216-132
F: +385 35 216-239
E-mail: [email protected]

The agricultural sector in Croatia | June 2015 33
AGRO ARCA
Organized by:
Croatian Innovators’ Association
Dalmatinska 12, HR-10000 Zagreb
T: +385 1 4886-540
F: +385 1 4886-549
E-mail: [email protected]
AGRO ZEMLJA
Organized by:
Katava d.o.o.
Šetalište Franje Šepera 1/d, HR-31000 Osijek
T: +385 31 209-000
F: +385 31 209-333
E-mail: [email protected], [email protected]
CATTLE - BREEDING SHOW
Organized by:
Municipality of Drenovci
Vukovar - Srijem County
Administrative Dept. of Agriculture and Forestry
Glagoljaška 27/i, HR-32100 Vinkovci
Dragomir Lukadinović
T: +385 32 344-036
F: +385 32 344-033
E-mail: [email protected]
COUNTY CATTLE SHOW
Organized by:
Association of Cattlemen and Farmers - Rural Economy Popovača
Vjekoslav Posarić
T/F: +385 44 679-138
E-mail: [email protected]
COUNTY EXHIBITION OF SMALL ANIMALS and NATIONAL EXHIBITION OF SMALL BREEDS
Organized by:
Association “Mali uzgajatelj” (“Small Breeder”)
Trg Stjepana Radića 9, HR-43000 Bjelovar
T: +385 43 211-879
F: +385 43 237-294
E-mail: [email protected]
COUNTY LIVESTOCK SHOW POŽEGA 1893-2012
Organized by:
County Office of Croatian Farming Agency
34
Županijska 7, HR-34000 Požega
T: +385 34 312-537, 312-538
E-mail: [email protected], [email protected],
www.hpa.hr
CROFISH
Organized by:
Ministry of Agriculture, Fisheries and Rural Development, town of Umag
Paolo Dragan
T: +385 52 743-297
F: +385 52 720-846
DALMATIA WINE EXPO
Organized by:
Dalmatinska vinska izložba d.o.o. (Dalmatian Wine Fair)
Nataša Dević
Mob: +385 99 7025-948
E-mail: [email protected]
www.dalmacijawineexpo.com
DROBNICA FEST
Organized by:
Drobnica Association
Goran Marević
Mob: +385 91 9449-482
FARMING FAIR CVELFERIJE
Organized by:
Municipality of Drenovci
Toljani 1, HR-32257 Drenovci
Jakša Šestić
T: +385 32 861-306
F: +385 32 861-243
E-mail: [email protected]
FISHING DAYS
Organized by:
Municipality Board of Kopačevo
Šandora Petefija 2, HR-31327 Kopačevo
Atila Varga
T: +385 31 752-105
F: +385 31 752-105
FRUITS OF DALMATIA
Organized by:
CEPOS - Centre for Promotion of Entrepreneurship and Crafts
The agricultural sector in Croatia | June 2015 35
Kralja Zvonimira 17/XI, HR-21000 Split
Dezire Mikšin
T: +385 21 323-051
F: +385 21 323-052
E-mail: [email protected]
www.cepos.hr
GAST
Organized by:
Sajam d.o.o.
Zoranićeva 61a, HR-21210 Solin
Stipe Šamija
T: +385 21 435-530
F: +385 21 435-533
E-mail: [email protected]
www.gastfair.com
www.sajamsplit.hr
GRASSLAND DAYS
Organized by:
PORA - Development Agency of Podravina and Prigorje for Promotion and Implementation of
Development Activities of Koprivnica and Križevci County
Ulica braće Radića 2/1, HR-48000 Koprivnica
T: +385 48 621-978
F: +385 48 621-957
E-mail: [email protected]
GREEN AND BLUE
Organized by:
Riječki sajam d.o.o.
Trg Viktora Bubnja 2, HR-51000 Rijeka
T: +385 51 406-777
F: +385 51 406-700
E-mail: [email protected]
HORSE-BREEDING SHOW - National Livestock Show
Organized by:
Municipality of Sunja
Josip Kozarić
T: +385 44 833-011
F: +385 44 833-468
E-mail: [email protected]
www.sunja.hr
36
HUNTING AND FISHING
Organized by:
Riječki sajam d.o.o.
Trg Viktora Bubnja 2, HR-51000 Rijeka
T: +385 51 406-777
F: +385 51 406-700
E-mail: [email protected]
INTERNATIONAL AUTUMN FAIR IN BJELOVAR
Organized by:
Bjelovarski sajam d.o.o. (Bjelovar Fair)
Dr. A. Starčevića 8, HR-43000 Bjelovar
T: +385 43 238-840
F: +385 43 238-841
E-mail: [email protected]
INTERNATIONAL FRUIT-GROWING FAIR 2012
Organized by:
Municipality of Donji Kraljevec
Kolodvorska 52d, HR-40320 Donji Kraljevec
T: +385 40 655-281
E-mail: [email protected]
INTERNATIONAL HUNTING, FISHING AND TOURISM FAIR
Organized by:
‘VALL 042’ d.o.o.
I. Cankara 9, HR-42000 Varaždin
T: +385 42 212-330
F: +385 42 212-336
E-mail: [email protected]
www.vall042.com
INTERNATIONAL SPRING FAIR AND AGRICULTURAL EQUIPMENT FAIR
Organized by:
Bjelovarski sajam (Bjelovar Fair) d.o.o.
Dr. A. Starčevića 8, HR-43000 Bjelovar
T: +385 43 238-840
F: +385 43 238-841
E-mail: [email protected]
JASKA WINE FESTIVAL
Organized by:
Town of Jastrebarsko Tourist Board
Strossmayerov trg 4, HR-10450 Jastrebarsko
T: +385 1 6272-940
E-mail: [email protected]
The agricultural sector in Croatia | June 2015 37
www.tzgj.hr
KUTINA WINE SHOW
Organized by:
Lujo Miklaužić Fruits and Wine Growers’ Association of Moslavina
Biserka Stojić, Dane Šimunić
T: +385 44 681-920, 670-450
Mob: +385 98 262-439
LIVESTOCK EXHIBITION OF KRAPINA and HORSE EXHIBITION OF KRAPINA
Organized by:
Krapina-Zagorje County
Magistratska 1, HR-49000 Krapina
T: +385 49 329-111
F: +385 49 329-211
OSIJEK SPRING FAIR
Organized by:
Osječki sajam d.o.o. (Osijek Fair)
Šandora Petefija bb, HR-31000 Osijek
T: +385 31 302-433
F: +385 31 303-108
E-mail: [email protected]
PLOUGHING COMPETITION OF KRAPINA
Organized by:
Croatian Agricultural Chamber
Agricultural -Advisory Service Krapina
PRODUCTS OF THE CROATIAN VILLAGE
Organized by:
AGRARNO SAVJETOVANJE d.o.o.
Dotrščinska 16, HR-10000 Zagreb
Damir Kovačić
T: +385 1 2923-149
F: +385 1 2923-145
RIBOLOVCI SVOME GRADU
Organized by:
Town of Koprivnica Tourist Board
Trg bana Jelačića 7, HR-48000 Koprivnica
T: +385 48 621-433
F: +385 48 623-178
www.koprivnicatourism.com
38
SALORI
Organized by:
Osječki sajam d.o.o. (Osijek Fair)
Šandora Petefija bb, HR-31000 Osijek
T: +385 31 302-433
F: +385 31 303-108
E-mail: [email protected]
SHEEP EXHIBITION OF LIKA-SENJ COUNTY IN UDBINA
Organized by:
Croatian Agricultural Agency Gospić
A. Starčevića 17, HR-53000 Gospić
Davor Korečić, Head
T: +385 53 560-535
F: +385 53 574-387
E-mail: [email protected]
SLAVONSKI BROD FAIR
Organized by:
Slavonski Brod-Posavina County
Administrative Department of Agriculture, Forestry and Water Resources Management
Kralja Petra Krešimira IV 1, HR-35000 Slavonski Brod
T/F: +385 35 216-152, 216-239
E-mail: [email protected]
TRADITIONAL CATTLE FAIR IN BENKOVAC
Organised by:
Town of Benkovac
T: +385 23 684-880
F: +385 23 684-882
TUBERFEST
Organized by:
Tourist Board of Municipality Oprtalj
Matka Laginje 21, HR-52428 Oprtalj
Aleksandar Krt, predsjednik TZ
Marisela Štokovac Vižintin
T: +385 52 644-150
F: +385 52 644-077
E-mail: [email protected]
URBANOVO - INTERNATIONAL WINE DAYS
Organized by:
Municipality of Štrigova Tourist Board
Štrigova 22a, HR-40312 Štrigova
T/F: +385 40 851-325
The agricultural sector in Croatia | June 2015 39
E-mail: [email protected]
VINCEKOVO
Organized by:
Zagreb County
Administrative Dept. of Agriculture, Rural Development and Forestry
Ulica grada Vukovara 72/V, HR-10000 Zagreb
T: +385 1 6009-426
F: +385 1 6009-474
www.zagrebacka-zupanija.hr
VINISTRA
Organized by:
‘VINISTRA’ - Association of Istrian Wine-Growers
Carla Huguesa 8, HR-52440 Poreč
Krešimir Juričić
T/F: +385 52 621-698
Mob: +385 99 2125-111
E-mail: [email protected]
www.vinistra.hr
VINOKAP
Organized by:
Wine Grape and Fruit Growers’ Association of Kaptol Municipality
Školska 3, HR-34334 Kaptol
Ferdinand Novak
T: +385 34 313-105
F: +385 34 231-069
Mob: +385 98 452-111
E-mail: [email protected]
VINOVITA
Organised by:
ZAGREBAČKI HOLDING d.o.o., Zagreb Fair Branch
Avenija Dubrovnik 15, HR-10000 Zagreb
Igor Rađenović, Head (acting)
T: +385 1 6503-111
F: +385 1 6550-619
E-mail: [email protected]
www.zv.hr
VIROEXPO
Organized and sponsored by:
CCE Virovitica County Chamber
Trg kralja Tomislava 6, 33000 Virovitica
40
T: +385 33 725-150
F: +385 33 722-150
E-mail: [email protected]
VIVODINA WINE EXHIBITION
Organized by:
Association of Wine-Growers, Wine-Makers and Fruit- Growers Ozalj
T: +385 47 731-923
F: +385 47 731-172
WINE - A TRADITIONAL PART OF LIVING
Organized by:
Dubrovnik-Neretva County, Association of Dubrovnik-Neretva County winegrowers
Ivica Prović, Pavo Miličić
T: +385 20 672-673
Mob: +385)98 344-084
E-mail: [email protected], [email protected], [email protected]
www.edubrovnik.org
WINE EXHIBITION OF KRAPINA-ZAGORJE COUNTY
Organized by:
Municipality of Bedekovčina
Trg A. Starčevića 4, HR-49221 Bedekovčina
T: +385 49 213-963
F: +385 49 213-040
ZAGREB WINE GOURMET FESTIVAL
Organized by:
Laniva d.o.o.
Zagreb Wine Gourmet Festival
Ingrid Badurina Danielsson, manager
Mob: +385 98 228-386, 99 2221-561
E-mail: [email protected] , [email protected]
www.zagrebwinegourmet.com