
Laboratory of Image Processing Pier Luigi Mazzeo [email protected].
18
-
Upload
josef-sarsfield -
Category
Documents
-
view
221 -
download
2
Transcript of Laboratory of Image Processing Pier Luigi Mazzeo [email protected].

• Given a grayscale image, its histogram consists of the histogram of its gray levels; that is, a graph indicating the number of times each gray level occurs in the image.
• We can infer a great deal about the appearance of an image from its histogram.
• In a dark image, the gray levels would be clustered at the lower end
• In a uniformly bright image, the gray levels would be clustered at the upper end.
• In a well contrasted image, the gray levels would be well spread out over much of the range.
• Problem: Given a poorly contrasted image, we would like to enhance its contrast, by spreading out its histogram. There are two ways of doing this.
Histograms
2

Let k be an integer from 0 to 255 and represent a shade for a pixel at some location (i,j) in an mxn image matrix, u. Define a histogram of the image u to be the function from integers 0:1:255 to the integers 0:1:mn given by
h(k) = number of pixels whose shade equals k (u(i,j) = k).
The normalized histogram is H(k) = h(k)/(mn).
Histogram Calculation
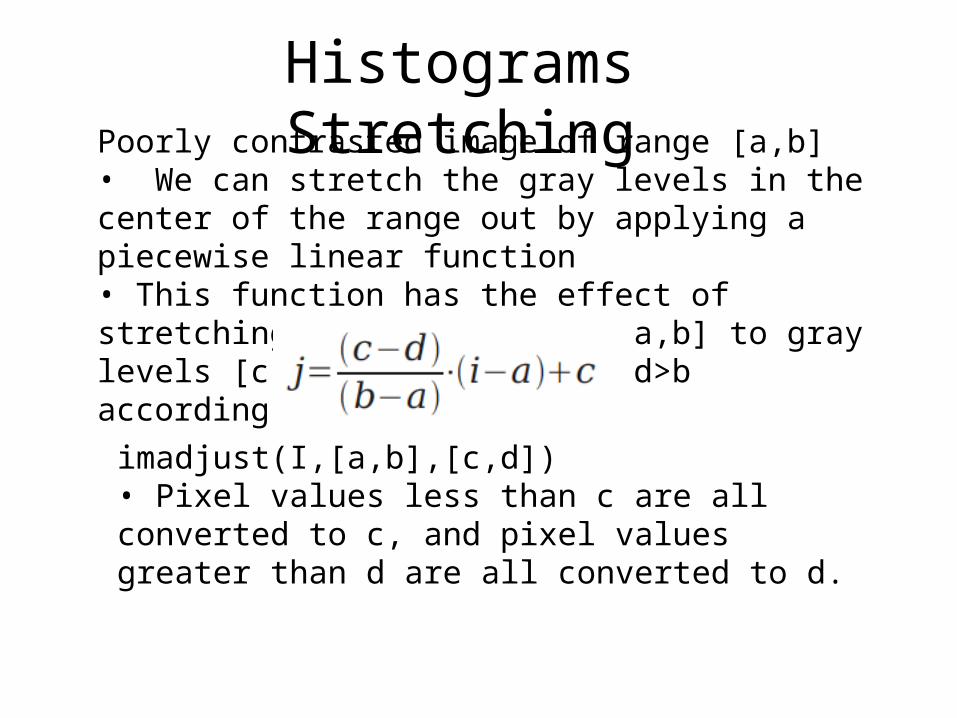
Poorly contrasted image of range [a,b]• We can stretch the gray levels in the center of the range out by applying a piecewise linear function• This function has the effect of stretching the gray levels [a,b] to gray levels [c,d], where a<c and d>b according
imadjust(I,[a,b],[c,d])• Pixel values less than c are all converted to c, and pixel values greater than d are all converted to d.
Histograms Stretching

Histograms Stretching

[nx ny] = size(u) nshades = 256; r1 = 80; s1 = 10; % Transformation by piecewise linear function.r2 = 140; s2 = 245; for i = 1:nx for j = 1:ny if (u(i,j)< r1)
uspread(i,j) = ((s1-0)/(r1-0))*u(i,j) end if ((u(i,j)>=r1) & (u(i,j)<= r2)) uspread(i,j) = ((s2 - s1)/(r2 - r1))*(u(i,j) - r1)+ s1; end if (u(i,j)>r2) uspread(i,j) = ((255 - s2)/(255 - r2))*(u(i,j) - r2) + s2; end end end hist= zeros(nshades,1); %Histogram Calculationend plot(hist); pollenspreadmat = uint8(uspread); imwrite(pollenspreadmat, 'pollenspread.jpg');
WombatsStretching.m

Imadjust and imhistTry to use imadjust and imhist
I = imread('pout.tif'); J = imadjust(I); figure, imshow(I), figure, imshow(J) K = imadjust(I,[0.3 0.7],[]); figure, imshow(K) RGB1 = imread('football.jpg'); RGB2 = imadjust(RGB1,[.2 .3 0; .6 .7 1],[]); figure, imshow(RGB1), figure, show(RGB2)
I = imread('pout.tif'); imhist(I)
Try to use imhist

The trouble with the previous method of histogram stretching is that they require user input.• Histogram equalization, is an entirely automatic procedure.• Suppose an image has L different gray levels 0,1,2,...,1-L and that gray level i occurs ni times in the image. Suppose also that the total number of pixels in the image is n so that n0+n1+n2+...nL=n. To transform the gray levels to obtain a better contrasted image, we change gray level i to:
and this number is rounded to the nearest integer.• A roughly equal number of pixels is mapped to each of the L levels, so that the histogram of the output image isapproximately flat.
Histograms Equalization

I = imread('tire.tif'); J = histeq(I); figure, imshow(I), figure, imshow(J) figure; imhist(I), figure, imhist(J)
Histograms Equalization with matlab
Practice: Create a darker image with imdivide, displayed it, and apply histogramEqualization. SHOW the Results.

adapthisteq enhances the contrast of images by transforming the values in the intensity image I. Unlike HISTEQ, it operates on small data regions (tiles), rather than the entire image. Each tile's contrast is enhanced, so that the histogram of the output region approximately matches the specified histogram. The neighboring tiles are then combined using bilinear interpolation in order to eliminate artificially induced boundaries. The contrast, especially in homogeneous areas, can be limited in order to avoid amplifying the noise which might be present in the image.
Contrast-limited Adaptive Histogram Equalization (CLAHE)

I = imread('tire.tif'); A = adapthisteq(I,'clipLimit’, 0.02,'Distribution','rayleigh'); figure, imshow(I); figure, imshow(A);
Contrast-limited Adaptive Histogram Equalization (CLAHE)

HSV and RGB Color SpaceThe HSV color space (hue, saturation, value) is often used by people who are selecting colors (e.g., of paints or inks) from a color wheel or palette, because it corresponds better to how people experience color than the RGB color space does. The functions rgb2hsv and hsv2rgb convert images between the RGB and HSV color spaces.
The function rgb2hsv converts colormaps or RGB images to the HSV color space. hsv2rgb performs the reverse operation. These commands convert an RGB image to HSV color space.
RGB = imread('flowers.tif');HSV = rgb2hsv(RGB);

HSV Color SpaceAs hue varies from 0 to 1.0, the corresponding colors vary from red, through yellow, green, cyan, blue, and magenta, back to red, so that there are actually red values both at 0 and 1.0. As saturation varies from 0 to 1.0, the corresponding colors (hues) vary from unsaturated (shades of gray) to fully saturated (no white component). As value, or brightness, varies from 0 to 1.0, the corresponding colors become increasingly brighter.

For closer inspection of the HSV color space, the next block of code displays the separate color planes (hue, saturation, and value) of an HSV image.
RGB=reshape(ones(64,1)*reshape(jet(64),1,192),[64,64,3]);HSV=rgb2hsv(RGB);H=HSV(:,:,1);S=HSV(:,:,2);V=HSV(:,:,3);imshow(H)figure, imshow(S);figure, imshow(V);figure, imshow(RGB);
HSV and RGB Color Space

Results of transformation

Other color space transformationC = makecform(type) creates the color transformation structure C that defines the color space conversion specified by type. To perform the transformation, pass the color transformation structure as an argument to the applycform function.

[X MAP] = imread('shadow.tif');
RGB = ind2rgb(X,MAP); % convert indexed image to truecolor format cform2lab = makecform('srgb2lab'); LAB = applycform(RGB, cform2lab); %convert image to L*a*b color space L = LAB(:,:,1)/100; % scale the values to range from 0 to 1 LAB(:,:,1) = adapthisteq(L,'NumTiles',[8 8],'ClipLimit',0.005)*100; cform2srgb = makecform('lab2srgb'); J = applycform(LAB, cform2srgb); %convert back to RGB figure, imshow(RGB); %display the results figure, imshow(J);
Apply CLAHE to Color Image

Exercises (Now It is up to you)
The transformation matrix to convert a truecolor image from RGB to YIQ (also note as NTSC ) is the inverse of the following matrix:
Calculate the inverse of this matrix and transform the RGB to YIQ. Are there differences with rgb2gray?