Lab on a Chip - szu.edu.cn
7
Lab on a Chip PAPER Cite this: DOI: 10.1039/d1lc00012h Received 6th January 2021, Accepted 14th March 2021 DOI: 10.1039/d1lc00012h rsc.li/loc Fiber optic hydrogen sensor based on a Fabry– Perot interferometer with a fiber Bragg grating and a nanofilm† Junxian Luo, ab Shen Liu, * ab Peijing Chen, ab Shengzhen Lu, ab Qiang Zhang, ab Yanping Chen, ab Bin Du, ab Jian Tang, ab Jun He, ab Changrui Liao ab and Yiping Wang ab Hydrogen is widely used in industrial production and clinical medicine, and as fuel. Hydrogen becomes explosive when the hydrogen–air mixture ranges from 4 to 76 vol%; thus, a rapid hydrogen concentration measurement is particularly important in practical applications. We present a novel fiber optic hydrogen sensor with fast response fabricated from a graphene–Au–Pd sandwich nanofilm and an ultrashort fiber Bragg grating. The response time is only 4.3 s at a 3.5 vol% hydrogen concentration. When the measured hydrogen concentration was increased from 0 to 4.5 vol%, the optical resonance dip in the sensor near 1550 nm shifted by 290 pm. In addition, the sensor has an insertion loss of only −2.22 dB, a spectral contrast of 10.8 dB, and a spectral finesse of 5. Such a flexible, fast-response sensor is expected to be used in the development of hydrogen sensors with low power consumption. 1. Introduction Greenhouse gases emitted in the process of worldwide industrialization have caused irreversible impacts. 1,2 Hydrogen is considered one of the most promising clean energy sources to replace fossil fuels. Hydrogen releases energy and produces water without greenhouse gas emission during combustion. Detecting hydrogen concentration is crucial in many applications. Examples include detecting leakage of stored hydrogen, monitoring hydrogen production from hydrogen generators, 3 detection of hydrogen in oil transformers for fault diagnosis, 4–6 and hydrogen detection in fuel cell rooms in electric vessels. 7 Because a hydrogen–air mixture of 4 to 76 vol% is explosive, the response at 4 vol% is an extremely important index for determining the performance of hydrogen sensors. 8 Although hydrogen sensors with electrical readout have low detection limits, 9,10 they usually cannot be used for detection of hydrogen concentrations greater than 4 vol% due to the risk of local explosions caused by electric sparks. In the past few decades, a variety of methods have been applied for optical hydrogen sensors to improve the performances of those sensors. Among them, surface plasmon resonance (SPR) has attracted a great amount of attention in optical detection. 11–15 After Liu et al. experimentally demonstrated a surface plasmon resonance (SPR) sensor with perfect absorption in the SPR structure, 16 many hydrogen sensors that use perfect absorption and SPR have been proposed. 17–21 Such optical hydrogen sensors with perfect absorption provide low insertion loss and high spectral contrast, which contribute to their high sensitivity and low detection limit. However, these sensors need bulky optical setups to ensure that the input and readout signals are properly coupled to optical detectors. In contrast, an optical fiber hydrogen sensor, such as that based on an interferometer, 22–25 a fiber Bragg grating (FBG), 26,27 a long period fiber grating 28,29 and a fiber evanescent field structure, 30–32 does not need additional optical alignment. Xiong et al. prepared a polymer micro-scale cantilever at the end of a single mode fiber (SMF) to form a Fabry–Perot interferometer (FPI) and deposited a 120 nm thick palladium (Pd) film on the cantilever to detect hydrogen. Pd undergoes reversible lattice expansion from a metal to a metal hydride (PdH x ) when exposed to hydrogen. After a period of exposure to a certain concentration of hydrogen, the Pd film reaches adsorption equilibrium and no longer expands. The extent of lattice expansion is highly dependent on the hydrogen concentration, making Pd suitable for hydrogen sensing. 33,34 However, because the reflectivity of the fiber end facet is approximately 3.5%, this kind of optical fiber FPI has the inherent disadvantages of high insertion loss and low Lab Chip This journal is © The Royal Society of Chemistry 2021 a Shenzhen Key Laboratory of Photonic Devices and Sensing Systems for Internet of Things, College of Physics and Optoelectronic Engineering, Shenzhen University, Shenzhen 518060, China. E-mail: [email protected] b Guangdong and Hong Kong Joint Research Centre for Optical Fibre Sensors, Shenzhen University, Shenzhen 518060, China † Electronic supplementary information (ESI) available. See DOI: 10.1039/ d1lc00012h Open Access Article. Published on 16 March 2021. Downloaded on 3/29/2021 1:55:44 AM. This article is licensed under a Creative Commons Attribution-NonCommercial 3.0 Unported Licence. View Article Online View Journal
Transcript of Lab on a Chip - szu.edu.cn

Lab on a Chip
PAPER
Cite this: DOI: 10.1039/d1lc00012h
Received 6th January 2021,Accepted 14th March 2021
DOI: 10.1039/d1lc00012h
rsc.li/loc
Fiber optic hydrogen sensor based on a Fabry–Perot interferometer with a fiber Bragg gratingand a nanofilm†
Junxian Luo,ab Shen Liu, *ab Peijing Chen,ab Shengzhen Lu,ab Qiang Zhang,ab
Yanping Chen,ab Bin Du,ab Jian Tang,ab Jun He,ab
Changrui Liao ab and Yiping Wangab
Hydrogen is widely used in industrial production and clinical medicine, and as fuel. Hydrogen becomes
explosive when the hydrogen–air mixture ranges from 4 to 76 vol%; thus, a rapid hydrogen concentration
measurement is particularly important in practical applications. We present a novel fiber optic hydrogen
sensor with fast response fabricated from a graphene–Au–Pd sandwich nanofilm and an ultrashort fiber
Bragg grating. The response time is only 4.3 s at a 3.5 vol% hydrogen concentration. When the measured
hydrogen concentration was increased from 0 to 4.5 vol%, the optical resonance dip in the sensor near
1550 nm shifted by 290 pm. In addition, the sensor has an insertion loss of only −2.22 dB, a spectral
contrast of 10.8 dB, and a spectral finesse of 5. Such a flexible, fast-response sensor is expected to be used
in the development of hydrogen sensors with low power consumption.
1. Introduction
Greenhouse gases emitted in the process of worldwideindustrialization have caused irreversible impacts.1,2
Hydrogen is considered one of the most promising cleanenergy sources to replace fossil fuels. Hydrogen releasesenergy and produces water without greenhouse gas emissionduring combustion. Detecting hydrogen concentration iscrucial in many applications. Examples include detectingleakage of stored hydrogen, monitoring hydrogen productionfrom hydrogen generators,3 detection of hydrogen in oiltransformers for fault diagnosis,4–6 and hydrogen detection infuel cell rooms in electric vessels.7 Because a hydrogen–airmixture of 4 to 76 vol% is explosive, the response at 4 vol% isan extremely important index for determining theperformance of hydrogen sensors.8 Although hydrogensensors with electrical readout have low detection limits,9,10
they usually cannot be used for detection of hydrogenconcentrations greater than 4 vol% due to the risk of localexplosions caused by electric sparks.
In the past few decades, a variety of methods have beenapplied for optical hydrogen sensors to improve the
performances of those sensors. Among them, surfaceplasmon resonance (SPR) has attracted a great amount ofattention in optical detection.11–15 After Liu et al.experimentally demonstrated a surface plasmon resonance(SPR) sensor with perfect absorption in the SPR structure,16
many hydrogen sensors that use perfect absorption and SPRhave been proposed.17–21 Such optical hydrogen sensors withperfect absorption provide low insertion loss and highspectral contrast, which contribute to their high sensitivityand low detection limit. However, these sensors need bulkyoptical setups to ensure that the input and readout signalsare properly coupled to optical detectors. In contrast, anoptical fiber hydrogen sensor, such as that based on aninterferometer,22–25 a fiber Bragg grating (FBG),26,27 a longperiod fiber grating28,29 and a fiber evanescent fieldstructure,30–32 does not need additional optical alignment.Xiong et al. prepared a polymer micro-scale cantilever at theend of a single mode fiber (SMF) to form a Fabry–Perotinterferometer (FPI) and deposited a 120 nm thick palladium(Pd) film on the cantilever to detect hydrogen. Pd undergoesreversible lattice expansion from a metal to a metal hydride(PdHx) when exposed to hydrogen. After a period of exposureto a certain concentration of hydrogen, the Pd film reachesadsorption equilibrium and no longer expands. The extent oflattice expansion is highly dependent on the hydrogenconcentration, making Pd suitable for hydrogen sensing.33,34
However, because the reflectivity of the fiber end facet isapproximately 3.5%, this kind of optical fiber FPI has theinherent disadvantages of high insertion loss and low
Lab ChipThis journal is © The Royal Society of Chemistry 2021
a Shenzhen Key Laboratory of Photonic Devices and Sensing Systems for Internet of
Things, College of Physics and Optoelectronic Engineering, Shenzhen University,
Shenzhen 518060, China. E-mail: [email protected] and Hong Kong Joint Research Centre for Optical Fibre Sensors,
Shenzhen University, Shenzhen 518060, China
† Electronic supplementary information (ESI) available. See DOI: 10.1039/d1lc00012h
Ope
n A
cces
s A
rtic
le. P
ublis
hed
on 1
6 M
arch
202
1. D
ownl
oade
d on
3/2
9/20
21 1
:55:
44 A
M.
Thi
s ar
ticle
is li
cens
ed u
nder
a C
reat
ive
Com
mon
s A
ttrib
utio
n-N
onC
omm
erci
al 3
.0 U
npor
ted
Lic
ence
.
View Article OnlineView Journal

Lab Chip This journal is © The Royal Society of Chemistry 2021
spectral finesse. Finesse is a parameter of an optical cavitythat is as important as the insertion loss and contrast; it canbe calculated using F = FSR/FWHM, where FWHM is the fullwidth half maximum of a resonance dip in the FPI, and FSRis the free spectral range of the resonance dip. In general,optical cavity sensors with high finesse have highersensitivity and resolution than those with low finesse, asmentioned in previous reports.35–39
A novel probe-type FPI-based fiber optic hydrogen sensorwith a graphene–Au–Pd sandwich structure film and an FBGis proposed and experimentally demonstrated in this study.The FPI is formed by covering the hollow cavity at the fibertip with the graphene–Au–Pd film (the thickness of thegraphene–Au–Pd film is ∼128 nm and the thickness of thePd film is ∼13 nm), and an FBG is inscribed into the SMFcore using line-by-line femtosecond (fs) laser etching. TheFPI-based fiber optic hydrogen sensors fabricated by thefabrication method proposed in this paper have the spectralcharacteristics of low insertion loss, high finesse, and highcontrast. The hydrogen sensing characteristics of theproposed hydrogen sensor are studied in this paper.
2. Sensor fabrication
Fig. 1(a) illustrates the schematic of the proposed hydrogensensor. Taking sample-1 as an example, the sensor isfabricated as follows.
In the first fabrication step, a section of a hollow corefiber (HCF, 75 μm internal diameter) was spliced to an SMFend facet with a commercial fusion splicer. The HCF had awell-cleaved end facet and a short length of ∼31 μm. The
short hollow cavity length and cleaved end of the HCF caneffectively reduce the divergence losses and thus theinsertion loss of the sensor.
In the second step, a multilayer graphene film (6CarbonTechnology, 6–8 layers, approximately 2 nm thick) wastransferred to the end of the HCF with a wet transfer technique.The details on this procedure are described in ref. 40.
Fig. 2(a) shows the microscopy image of the graphene-covered end facet of the fiber tip. Fig. 2(b) shows theobtained Raman spectrum of the transferred graphene film(the area marked by the green circle in Fig. 2(a) wasilluminated with a 532 nm laser). The reflection from the twosurfaces of the SMF end facet and the graphene film formsan FPI with low reflectivity, and the reflection spectrum wasmeasured using a circulator, a broadband light source (BBS),and an optical spectrum analyzer (OSA, Yokogawa, AQ6317C)with a 0.02 nm resolution; the results are shown in Fig. 3(a).The FPI has low reflection, a high insertion loss of −16.37 dB,and a low contrast of 4.56 dB.
In the third step, a layer of Au film and Pd film weresuccessively deposited onto the graphene on the tip of thesensor via magnetron sputtering. The Au–Pd film was used toensure that the sensor had higher reflectivity, and the Pd filmexhibited reversible expansion via adsorption of hydrogen.
While the sensor was being coated, a glass slide was placedadjacent to the sensor and coated with an Au–Pd film of thesame thickness to allow its thickness to be measured (seeFig. 4(a)). A small area of the glass slide was covered, whichwas denoted as A1. Then, a layer of gold film with the samethickness as the sensor was coated on the slide except for A1.Part of the coated area was covered, which was denoted as A2.The remaining area was denoted as A3, and a Pd film with thesame thickness as the sensor was coated on A3. Thethicknesses of coatings A2 and A3 were measured with asurface profilometer (BRUKER, DEKTAK XT) with a verticalresolution of 0.1 nm, and the results are shown inFig. 4(b) and (c), respectively. The Au film thickness wasmeasured to be ∼113 nm, and that of the Pd film was ∼13 nm.
The reflection spectrum of sample-1 (after coatinggraphene with the Au–Pd film) is shown in Fig. 3(b). The highreflectivity of the Au–Pd film reflector provided a much lowerinsertion loss of −1.42 dB in sample-1, compared to an
Fig. 1 (a) Schematic of the probe-type FPI-based fiber optic hydrogensensor with a graphene–Au–Pd sandwich structure film and an FBG. (b)Enlarged microscopy image of the FBG inscribed using line-by-lineetching. (c) Scanning electron microscopy (SEM) image of thegraphene–Au–Pd film covered on the fiber end facet.
Fig. 2 (a) Multilayer graphene-covered fiber-tip end facet, where thegreen circle shows the selected area for Raman spectroscopy. (b)Raman spectrum from the suspended multilayer graphene (6–8 layers)measured using a 532 nm laser.
Lab on a ChipPaper
Ope
n A
cces
s A
rtic
le. P
ublis
hed
on 1
6 M
arch
202
1. D
ownl
oade
d on
3/2
9/20
21 1
:55:
44 A
M.
Thi
s ar
ticle
is li
cens
ed u
nder
a C
reat
ive
Com
mon
s A
ttrib
utio
n-N
onC
omm
erci
al 3
.0 U
npor
ted
Lic
ence
.View Article Online

Lab ChipThis journal is © The Royal Society of Chemistry 2021
insertion loss of −16.37 dB without the Au–Pd film. The lossof −1.42 dB was caused by beam divergence and thesubsequent escape, as well as the absorption in thegraphene–Au–Pd film. However, because much more lightwas reflected from the graphene–Au–Pd film than from theSMF end facet, the spectral fringe contrast in sample-1 wasonly approximately 1.37 dB.
In the final step, an ultrashort line-by-line FBG with apitch of 1.063 nm and ∼250 μm length was inscribed in theSMF core close to the fiber tip using a 1.7 mW fs laser (514nm wavelength, 290 fs pulse width, and 200 kHz repetitionrate); the beam was focused with a 100× oil objective (NA =1.34). The Bragg resonant wavelength λ of the mth order FBGcan be calculated using the following formula:41
mλ = 2neffΛ
where neff is the effective refractive index of the SMF core,and Λ is the grating pitch. Fig. 1(b) shows an enlarged partialview of the inscribed FBG, revealing that the FBG has a pitchof 1.063 μm, corresponding to a second order Bragg resonantwavelength of 1538 nm. The reflection spectrum of sample-1after this step is shown in Fig. 3(c).
The FBG, as a semi-transparent reflector, reflects a certainbandwidth of light centered at the Bragg resonantwavelength. It also interferes with light reflected from thegraphene–Au–Pd film forming an FPI. As the grating pitch isincreased, the Bragg reflection intensity also graduallyincreases. When the Bragg reflection intensity is almost equalto the graphene–Au–Pd film reflection intensity, theinterference fringe contrast is large. After the final stepprocess, the high resolution (1.5 pm) reflection spectrum ofsample-1 was measured using a circulator, a computer (PC), atunable laser (Agilent Technologies, 81940A), and a powermeter (Agilent Technologies, N7744A). Sample-1 exhibits ahigh spectrum contrast of 16.07 dB (equivalent to 68.9–1.7%of the incident light intensity), a finesse of 6.4, and a lowinsertion loss of −1.62 dB, as shown in Fig. 3(d). Due to thehigh reflectivity of the Au–Pd film and the semi-transparentFBG, the fiber optic FPI has a much lower insertion loss, ahigher contrast, and a higher finesse than other fiber opticFPIs prepared from graphene,42 silica43–45 or polymers.46 Thefinesse and insertion loss of the sensor based on the opticalcavity is limited by the loss mechanisms that allow light toleak out of the cavity.47 The main escape routes are throughthe FBG and hollow cavity, as well as via the absorption inthe graphene–Au–Pd film.48
3. Hydrogen concentration sensingand discussion
The response of the sensor was measured at differenthydrogen concentrations. The experimental setup is shownin Fig. 5. For the hydrogen concentration measurements,nitrogen and hydrogen were provided from a compressednitrogen cylinder and hydrogen generator, respectively. Thevolume ratio of nitrogen and hydrogen gases was controlledwith two gas mass flow controllers (Seven Star, D07) and aPC, and the gases were mixed using a T-shaped three-wayplastic tube (5 mm internal diameter) to obtain differenthydrogen concentration values. The full control range of twoSeven Star D07 series mass flow controllers is 500 SCCM(standard cubic centimeters per minute) and 30 SCCM,
Fig. 3 Reflection spectra after (a) the graphene was transferred to theend facet of the fiber-tip, (b) Au and Pd were successively deposited onthe graphene, and (c) an ultrashort line-by-line FBG was inscribed in theSMF core close to the fiber tip. (d) Enlarged view of the blue area in (c).
Fig. 4 (a) Schematic diagram of the glass slide used to measure thethicknesses of the Au and Au–Pd films; (b) and (c) height profiles of theAu and Au–Pd films, respectively.
Lab on a Chip Paper
Ope
n A
cces
s A
rtic
le. P
ublis
hed
on 1
6 M
arch
202
1. D
ownl
oade
d on
3/2
9/20
21 1
:55:
44 A
M.
Thi
s ar
ticle
is li
cens
ed u
nder
a C
reat
ive
Com
mon
s A
ttrib
utio
n-N
onC
omm
erci
al 3
.0 U
npor
ted
Lic
ence
.View Article Online
Lab Chip This journal is © The Royal Society of Chemistry 2021
respectively, and the control error is less than ±1%. The D07–1 with a full range of 500 SCCM was used for nitrogen flowcontrol and the D07–2 with 30 SCCM was used for hydrogenflow control, and the error between the actual and sethydrogen concentration of mixed gas is less than ±5%. Thesensor was fixed in the vertical channel of the T-shapedthree-way plastic tube to detect the changes in the hydrogengas concentration. During this experiment, the total gas flowwas set to 500 SCCM.
Here, the sensing mechanism of hydrogen detection is asfollows: the suspended graphene–Au–Pd film deforms due tothe Pd lattice expansion caused by hydrogen adsorption, andthe axial displacement of the film can be resolved bymeasuring a shift in the resonance dip in the fiber optic FPI.The extent of film deformation is highly dependent on thehydrogen concentration.33,34 Therefore, the hydrogenconcentration can be detected by reading the dip change.The schematic diagram of the hydrogen-induced outwardarching and recovery of the film is shown in Fig. 5(b). Inaddition, the effect of the possibility of gas entering thecavity on the sensor results can be ignored, because thedifference of the refractive indexes of nitrogen and hydrogenis small, and is in the order of 10−4.49,50
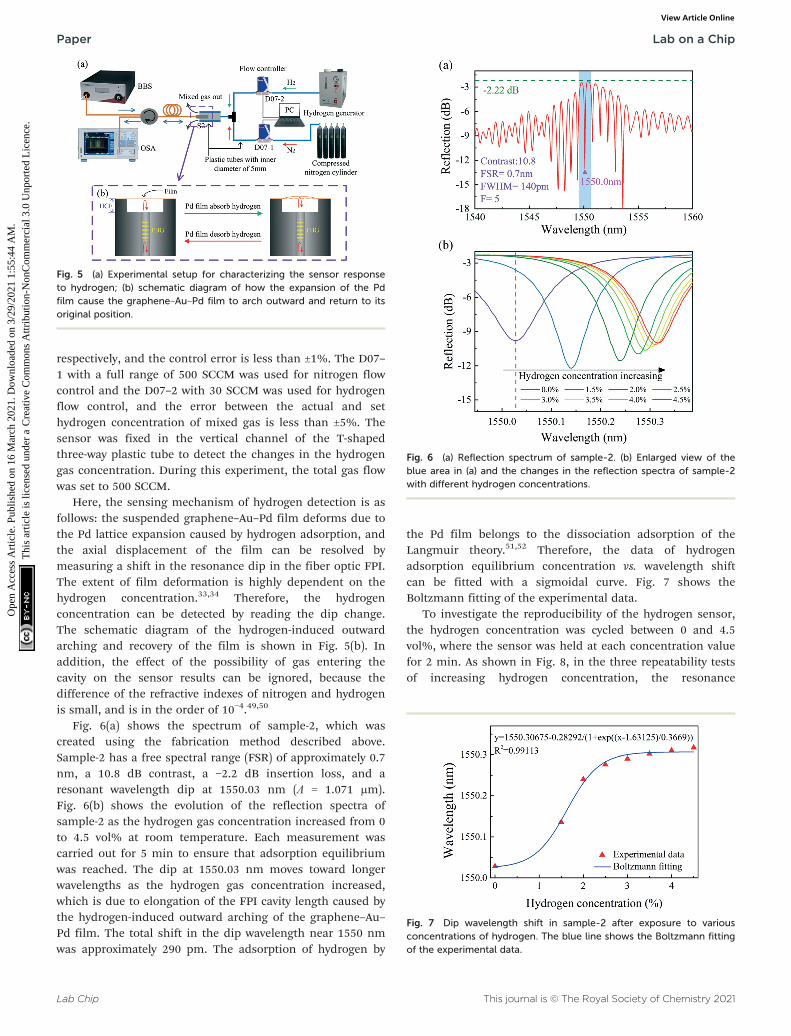
Fig. 6(a) shows the spectrum of sample-2, which wascreated using the fabrication method described above.Sample-2 has a free spectral range (FSR) of approximately 0.7nm, a 10.8 dB contrast, a −2.2 dB insertion loss, and aresonant wavelength dip at 1550.03 nm (Λ = 1.071 μm).Fig. 6(b) shows the evolution of the reflection spectra ofsample-2 as the hydrogen gas concentration increased from 0to 4.5 vol% at room temperature. Each measurement wascarried out for 5 min to ensure that adsorption equilibriumwas reached. The dip at 1550.03 nm moves toward longerwavelengths as the hydrogen gas concentration increased,which is due to elongation of the FPI cavity length caused bythe hydrogen-induced outward arching of the graphene–Au–Pd film. The total shift in the dip wavelength near 1550 nmwas approximately 290 pm. The adsorption of hydrogen by
the Pd film belongs to the dissociation adsorption of theLangmuir theory.51,52 Therefore, the data of hydrogenadsorption equilibrium concentration vs. wavelength shiftcan be fitted with a sigmoidal curve. Fig. 7 shows theBoltzmann fitting of the experimental data.
To investigate the reproducibility of the hydrogen sensor,the hydrogen concentration was cycled between 0 and 4.5vol%, where the sensor was held at each concentration valuefor 2 min. As shown in Fig. 8, in the three repeatability testsof increasing hydrogen concentration, the resonance
Fig. 5 (a) Experimental setup for characterizing the sensor responseto hydrogen; (b) schematic diagram of how the expansion of the Pdfilm cause the graphene–Au–Pd film to arch outward and return to itsoriginal position.
Fig. 6 (a) Reflection spectrum of sample-2. (b) Enlarged view of theblue area in (a) and the changes in the reflection spectra of sample-2with different hydrogen concentrations.
Fig. 7 Dip wavelength shift in sample-2 after exposure to variousconcentrations of hydrogen. The blue line shows the Boltzmann fittingof the experimental data.
Lab on a ChipPaper
Ope
n A
cces
s A
rtic
le. P
ublis
hed
on 1
6 M
arch
202
1. D
ownl
oade
d on
3/2
9/20
21 1
:55:
44 A
M.
Thi
s ar
ticle
is li
cens
ed u
nder
a C
reat
ive
Com
mon
s A
ttrib
utio
n-N
onC
omm
erci
al 3
.0 U
npor
ted
Lic
ence
.View Article Online

Lab ChipThis journal is © The Royal Society of Chemistry 2021
wavelengths redshifted by 290 pm, 260 pm, and 270 pm,respectively. The desorption processes on the sensor showhysteresis. The blueshift in the resonance dip is differentfrom the redshift in the cycle test with the hydrogenconcentration increasing and then decreasing. However, inthe increasing hydrogen concentration test, the drift trendwas similar for all 3 cycles.
An experimental setup was used to measure the responsetime of the hydrogen sensor. A tunable laser was used as asource of light with an output set to 0.7 mW at 1550.03nm, which is located at a minimum in the reflectionspectrum. For clarity, the detecting laser is highlighted witha pink dashed line in Fig. 6(b). The detecting laser entersthe sensor through the circulator, and the reflected lightwas received by a photodetector (PD). The PD converts thelight intensity into a voltage that is fed to an oscilloscope.When the sensor was exposed to hydrogen, the dipwavelength redshifted and the reflected laser intensityincreased, resulting in a higher voltage.
Fig. 9(a) shows the voltage measured with theoscilloscope in the time domain at different hydrogenconcentrations. The sensor response time is defined as thetime interval for the sensor to reach 90% of its steady stateresponse. Due to the high finesse (= 5) of sample-2, the1550.03 nm laser intensity reflected from the sensor waslikely saturated when the hydrogen concentration reached 4vol%, even though the adsorption of hydrogen by the Pdfilm has not yet reached saturation, as shown in Fig. 9(b),which is the enlarged view of the blue dashed box inFig. 9(a). For clarity, a red line was used in Fig. 9(b) to showthe result of smoothing the data. Note that the saturation ofreflected 1550.03 nm laser intensity does not mean that thePd film adsorption of hydrogen already reached saturation.The sensor was able to detect 4.5 vol% hydrogen in thewavelength drift dominated hydrogen detection, as shown inFig. 6(b). In other words, there may be a deviation betweenthe measured response time and the actual response time atconcentrations of 4 vol% and 4.5 vol%. Therefore, it isobjective to define the fastest response time of the sensor
using the approximately 4.3 s response time at 3.5 vol%hydrogen concentration.
The response time vs. hydrogen concentration in sample-2is plotted in Fig. 10. The response time is the longest whenthe concentration of hydrogen is 1.5 vol%, which is 28.7 s.The response time measured at 4.5 vol% hydrogenconcentration is the shortest, reaching 2.88 s, although thisis slightly shorter than the actual response time. Here, wedefined the inverse of the response time (T) as the initial
Fig. 8 The reproducibility data of sample-2 as the hydrogenconcentration increase was cycled between 0 and 4.5 vol% for threecycles. Three cycle data (a) arranged beside each other and (b)overlapping each other.
Fig. 9 (a) Temporal response test results from sample-2 for varioushydrogen concentrations. (b) Enlarged view of the blue dashed box inFig. 9(a); the red line was obtained by smoothing the experimentaldata. (c) and (d) Enlarged views of the temporal response at 3.5 and4.5 vol% hydrogen, respectively.
Fig. 10 Response time of sample-2 for different hydrogenconcentrations. The red squares are experimental data. The greentriangles are the inverse of the response time, which has a linearcorrelation to the concentration of hydrogen.
Lab on a Chip Paper
Ope
n A
cces
s A
rtic
le. P
ublis
hed
on 1
6 M
arch
202
1. D
ownl
oade
d on
3/2
9/20
21 1
:55:
44 A
M.
Thi
s ar
ticle
is li
cens
ed u
nder
a C
reat
ive
Com
mon
s A
ttrib
utio
n-N
onC
omm
erci
al 3
.0 U
npor
ted
Lic
ence
.View Article Online
Lab Chip This journal is © The Royal Society of Chemistry 2021
hydrogen adsorption rate (1/T). The results show that theconcentration of hydrogen is inversely proportional to theresponse time and has a linear relationship with the initialhydrogen adsorption rate. The response time behavior of thesensor is consistent with the sensing behavior of devicesconstructed from decorated Pd, which can be described usingthe Langmuir adsorption theory.53,54
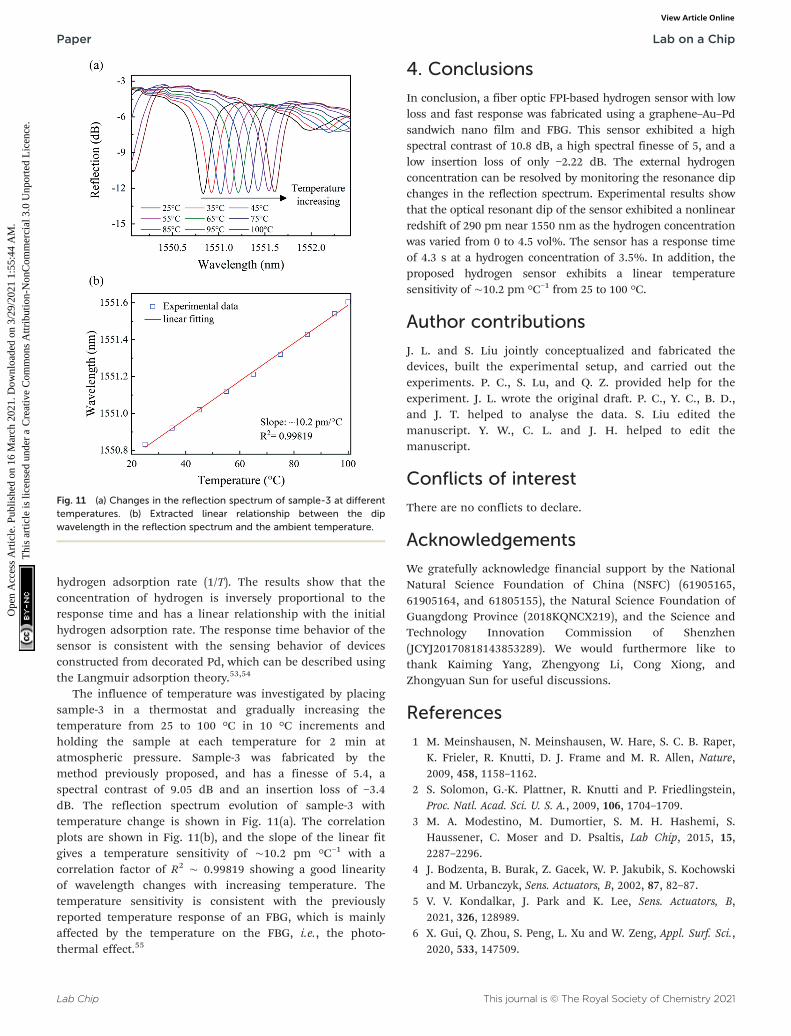
The influence of temperature was investigated by placingsample-3 in a thermostat and gradually increasing thetemperature from 25 to 100 °C in 10 °C increments andholding the sample at each temperature for 2 min atatmospheric pressure. Sample-3 was fabricated by themethod previously proposed, and has a finesse of 5.4, aspectral contrast of 9.05 dB and an insertion loss of −3.4dB. The reflection spectrum evolution of sample-3 withtemperature change is shown in Fig. 11(a). The correlationplots are shown in Fig. 11(b), and the slope of the linear fitgives a temperature sensitivity of ∼10.2 pm °C−1 with acorrelation factor of R2 ∼ 0.99819 showing a good linearityof wavelength changes with increasing temperature. Thetemperature sensitivity is consistent with the previouslyreported temperature response of an FBG, which is mainlyaffected by the temperature on the FBG, i.e., the photo-thermal effect.55
4. Conclusions
In conclusion, a fiber optic FPI-based hydrogen sensor with lowloss and fast response was fabricated using a graphene–Au–Pdsandwich nano film and FBG. This sensor exhibited a highspectral contrast of 10.8 dB, a high spectral finesse of 5, and alow insertion loss of only −2.22 dB. The external hydrogenconcentration can be resolved by monitoring the resonance dipchanges in the reflection spectrum. Experimental results showthat the optical resonant dip of the sensor exhibited a nonlinearredshift of 290 pm near 1550 nm as the hydrogen concentrationwas varied from 0 to 4.5 vol%. The sensor has a response timeof 4.3 s at a hydrogen concentration of 3.5%. In addition, theproposed hydrogen sensor exhibits a linear temperaturesensitivity of ∼10.2 pm °C−1 from 25 to 100 °C.
Author contributions
J. L. and S. Liu jointly conceptualized and fabricated thedevices, built the experimental setup, and carried out theexperiments. P. C., S. Lu, and Q. Z. provided help for theexperiment. J. L. wrote the original draft. P. C., Y. C., B. D.,and J. T. helped to analyse the data. S. Liu edited themanuscript. Y. W., C. L. and J. H. helped to edit themanuscript.
Conflicts of interest
There are no conflicts to declare.
Acknowledgements
We gratefully acknowledge financial support by the NationalNatural Science Foundation of China (NSFC) (61905165,61905164, and 61805155), the Natural Science Foundation ofGuangdong Province (2018KQNCX219), and the Science andTechnology Innovation Commission of Shenzhen(JCYJ20170818143853289). We would furthermore like tothank Kaiming Yang, Zhengyong Li, Cong Xiong, andZhongyuan Sun for useful discussions.
References
1 M. Meinshausen, N. Meinshausen, W. Hare, S. C. B. Raper,K. Frieler, R. Knutti, D. J. Frame and M. R. Allen, Nature,2009, 458, 1158–1162.
2 S. Solomon, G.-K. Plattner, R. Knutti and P. Friedlingstein,Proc. Natl. Acad. Sci. U. S. A., 2009, 106, 1704–1709.
3 M. A. Modestino, M. Dumortier, S. M. H. Hashemi, S.Haussener, C. Moser and D. Psaltis, Lab Chip, 2015, 15,2287–2296.
4 J. Bodzenta, B. Burak, Z. Gacek, W. P. Jakubik, S. Kochowskiand M. Urbanczyk, Sens. Actuators, B, 2002, 87, 82–87.
5 V. V. Kondalkar, J. Park and K. Lee, Sens. Actuators, B,2021, 326, 128989.
6 X. Gui, Q. Zhou, S. Peng, L. Xu and W. Zeng, Appl. Surf. Sci.,2020, 533, 147509.
Fig. 11 (a) Changes in the reflection spectrum of sample-3 at differenttemperatures. (b) Extracted linear relationship between the dipwavelength in the reflection spectrum and the ambient temperature.
Lab on a ChipPaper
Ope
n A
cces
s A
rtic
le. P
ublis
hed
on 1
6 M
arch
202
1. D
ownl
oade
d on
3/2
9/20
21 1
:55:
44 A
M.
Thi
s ar
ticle
is li
cens
ed u
nder
a C
reat
ive
Com
mon
s A
ttrib
utio
n-N
onC
omm
erci
al 3
.0 U
npor
ted
Lic
ence
.View Article Online
Lab ChipThis journal is © The Royal Society of Chemistry 2021
7 L. E. Klebanoff, J. W. Pratt and C. B. LaFleur, Int. J. HydrogenEnergy, 2017, 42, 757–774.
8 M. Matuschek, D. P. Singh, H.-H. Jeong, M. Nesterov, T.Weiss, P. Fischer, F. Neubrech and N. Liu, Small, 2018, 14,1702990.
9 D. Khan, H. Li, D. Gajula, F. Bayram and G. Koley, ACS Sens.,2020, 5, 3124–3132.
10 U. T. Nakate, R. Ahmad, P. Patil, Y. Wang, K. S. Bhat, T.Mahmoudi, Y. T. Yu, E.-K. Suh and Y.-B. Hahn, J. AlloysCompd., 2019, 797, 456–464.
11 A. Tittl, X. Yin, H. Giessen, X.-D. Tian, Z.-Q. Tian, C.Kremers, D. N. Chigrin and N. Liu, Nano Lett., 2013, 13,1816–1821.
12 C. Perrotton, R. J. Westerwaal, N. Javahiraly, M. Slaman, H.Schreuders, B. Dam and P. Meyrueis, Opt. Express, 2013, 21,382–390.
13 N. Liu, M. L. Tang, M. Hentschel, H. Giessen and A. P.Alivisatos, Nat. Mater., 2011, 10, 631–636.
14 V. N. Konopsky, D. V. Basmanov, E. V. Alieva, D. I. Dolgy,E. D. Olshansky, S. K. Sekatskii and G. Dietler, New J. Phys.,2009, 11, 063049.
15 N. Strohfeldt, A. Tittl and H. Giessen, Opt. Mater. Express,2013, 3, 194–204.
16 N. Liu, M. Mesch, T. Weiss, M. Hentschel and H. Giessen,Nano Lett., 2010, 10, 2342–2348.
17 A. Tittl, P. Mai, R. Taubert, D. Dregely, N. Liu and H.Giessen, Nano Lett., 2011, 11, 4366–4369.
18 M. Serhatlioglu, S. Ayas, N. Biyikli, A. Dana and M. E.Solmaz, Opt. Lett., 2016, 41, 1724–1727.
19 A. Tittl, H. Giessen and N. Liu, Nanophotonics, 2014, 3,157–180.
20 S. Bagheri, N. Strohfeldt, F. Sterl, A. Berrier, A. Tittl and H.Giessen, ACS Sens., 2016, 1, 1148–1154.
21 E. Herkert, F. Sterl, N. Strohfeldt, R. Walter and H. Giessen,ACS Sens., 2020, 5, 978–983.
22 J. Ma, Y. Zhou, X. Bai, K. Chen and B.-O. Guan, Nanoscale,2019, 11, 15821–15827.
23 C. Xiong, J. Zhou, C. Liao, M. Zhu, Y. Wang, S. Liu, C. Li, Y.Zhang, Y. Zhao, Z. Gan, L. Venturelli, S. Kasas, X. Zhang, G.Dietler and Y. Wang, ACS Appl. Mater. Interfaces, 2020, 12,33163–33172.
24 M. Wang, D. N. Wang, M. Yang, J. Cheng and J. Li, Sens.Actuators, B, 2014, 202, 893–896.
25 B. Wu, C. Zhao, B. Xu and Y. Li, Sens. Actuators, B, 2018, 255,3011–3016.
26 G. Wang, S. Yang, J. Dai, Y. Dai, T. Zou, J. Roths and M.Yang, Sensors, 2019, 19, 4775.
27 J. Dai, M. Yang, Y. Chen, K. Cao, H. Liao and P. Zhang, Opt.Express, 2011, 19, 6141–6148.
28 X. T. Wei, T. Wei, H. Xiao and Y. S. Lin, Sens. Actuators, B,2011, 152, 214–219.
29 C. Caucheteur, M. Debliquy, D. Lahem and P. Megret, Opt.Express, 2008, 16, 16854–16859.
30 Z. L. Poole, P. R. Ohodnicki, A. Yan, Y. Lin and K. P. Chen,ACS Sens., 2017, 2, 87–91.
31 Y. Qi, Y. Zhao, H. Bao, W. Jin and H. L. Ho, Optica, 2019, 6,570–576.
32 K. Schroeder, W. Ecke and R. Willsch, Opt. Laser Eng.,2009, 47, 1018–1022.
33 T. C. Narayan, A. Baldi, A. L. Koh, R. Sinclair and J. A.Dionne, Nat. Mater., 2016, 15, 768–774.
34 R. Griessen, N. Strohfeldt and H. Giessen, Nat. Mater.,2016, 15, 311–317.
35 O. Arcizet, P. F. Cohadon, T. Briant, M. Pinard, A.Heidmann, J. M. Mackowski, C. Michel, L. Pinard, O.Francais and L. Rousseau, Phys. Rev. Lett., 2006, 97, 133601.
36 G. Gagliardi, M. Salza, S. Avino, P. Ferraro and P. De Natale,Science, 2012, 335, 286.
37 M. Ding, M. Komanec, D. Suslov, D. Dousek, S. Zvanovec,E. R. N. Fokoua, T. D. Bradley, F. Poletti, D. J. Richardsonand R. Slavik, J. Lightwave Technol., 2020, 38, 2423–2427.
38 M. Li, W. H. P. Pernice, C. Xiong, T. Baehr-Jones, M.Hochberg and H. X. Tang, Nature, 2008, 456, 480–484.
39 Y. Tan, W. Jin, F. Yang, Y. Qi, C. Zhang, Y. Lin and H. L. Ho,J. Lightwave Technol., 2017, 35, 2887–2893.
40 J. Ma, W. Jin, H. L. Ho and J. Y. Dai, Opt. Lett., 2012, 37,2493–2495.
41 J. Luo, S. Liu, Y. Zhao, Y. Chen, K. Yang, K. Guo, J. He, C.Liao and Y. Wang, Opt. Lett., 2020, 45, 507–510.
42 B. C. Zheng, S. C. Yan, J. H. Chen, G. X. Cui, F. Xu and Y. Q.Lu, Laser Photonics Rev., 2015, 9, 517–522.
43 M. Haque, K. K. C. Lee, S. Ho, L. A. Fernandes and P. R.Herman, Lab Chip, 2014, 14, 3817–3829.
44 S. Liu, Y. Wang, C. Liao, Y. Wang, J. He, C. Fu, K. Yang, Z.Bai and F. Zhang, Sci. Rep., 2017, 7, 1–9.
45 N. Gaber, M. Malak, F. Marty, D. E. Angelescu, E. Richalotand T. Bourouina, Lab Chip, 2014, 14, 2259–2265.
46 M. Li, Y. Liu, R. Gao, Y. Li, X. Zhao and S. Qu, Sens.Actuators, B, 2016, 233, 496–501.
47 S. Zaitsev, A. K. Pandey, O. Shtempluck and E. Buks, Phys.Rev. E: Stat., Nonlinear, Soft Matter Phys., 2011, 84, 046605.
48 R. R. Nair, P. Blake, A. N. Grigorenko, K. S. Novoselov, T. J.Booth, T. Stauber, N. M. R. Peres and A. K. Geim, Science,2008, 320, 1308.
49 K. Li, N. Zhang, N. M. Y. Zhang, G. Liu, T. Zhang and L. Wei,Opt. Lett., 2018, 43, 679–682.
50 L. Jiang, L. Zhao, S. Wang, J. Yang and H. Xiao, Opt. Express,2011, 19, 17591–17598.
51 H. Swenson and N. P. Stadie, Langmuir, 2019, 35, 5409–5426.52 H. Rauscher, Surf. Sci. Rep., 2001, 42, 207–328.53 Y. Sun and H. H. Wang, Adv. Mater., 2007, 19, 2818–2823.54 S. F. Yu, U. Welp, L. Z. Hua, A. Rydh, W. K. Kwok and H. H.
Wang, Chem. Mater., 2005, 17, 3445–3450.55 C. Liao, L. Xu, C. Wang, D. N. Wang, Y. Wang, Q. Wang, K.
Yang, Z. Li, X. Zhong, J. Zhou and Y. Liu, Opt. Lett., 2013, 38,4473–4476.
Lab on a Chip Paper
Ope
n A
cces
s A
rtic
le. P
ublis
hed
on 1
6 M
arch
202
1. D
ownl
oade
d on
3/2
9/20
21 1
:55:
44 A
M.
Thi
s ar
ticle
is li
cens
ed u
nder
a C
reat
ive
Com
mon
s A
ttrib
utio
n-N
onC
omm
erci
al 3
.0 U
npor
ted
Lic
ence
.View Article Online