LA-UR- 0 NUMEBICAL THERMAL STABILITY STUDIES OF THE ...
28
LA-UR- 0 Title : Author(s): Submitted to: NUMEBICAL THERMAL STABILITY STUDIES OF THE NATIONAL IGNITION FACILITY FINAL OPTICS ASSEMBLY Lucie Parietti Richard A. Martin 1998 ASME Fluids Engineering Division Summer Meeting, June 21-25, 1998, Washington, DC R Los Alamos National Laboratory. an affirmative actionlequal opportunity employer, is operated by the Unwersity o! Californla for the U S Department of Energy under cOntracl W-7405-ENG-36 By acceptance of this article, the publisher recognizes that the U S Government retains a nonexcluslve.royalty iree license to publish or reproduce the published form of this contribution or to allow others to do so, tor U S Government purposes The Los Alamos Na:ional Laboratory requests that the publisher identify this article as work performed under the auspices of the U S Depanment of Energy Form No 836 R5 ST 2629 10/91
Transcript of LA-UR- 0 NUMEBICAL THERMAL STABILITY STUDIES OF THE ...

LA-UR- 0
Title :
Author(s):
Submitted to:
NUMEBICAL THERMAL STABILITY STUDIES OF THE NATIONAL IGNITION FACILITY FINAL OPTICS ASSEMBLY
Lucie Parietti Richard A. Martin
1998 ASME Fluids Engineering Division Summer Meeting, June 21-25, 1998, Washington, DC
R
Los Alamos National Laboratory. an affirmative actionlequal opportunity employer, is operated by the Unwersity o! Californla for the U S Department of Energy under cOntracl W-7405-ENG-36 By acceptance of this article, the publisher recognizes that the U S Government retains a nonexcluslve. royalty iree license to publish or reproduce the published form of this contribution or to allow others to do so, tor U S Government purposes The Los Alamos Na:ional Laboratory requests that the publisher identify this article as work performed under the auspices of the U S Depanment of Energy
Form No 836 R5 ST 2629 10/91

DISCLAIMER
This report was prepared as an account of work sponsored by an agency of the United States Government. Neither the United States Government nor any agency thereof, nor any of their employees, makes any warranty, express or implied, or assumes any legal liability or responsibility for the accuracy, completeness, or use- fulness of any information, apparatus, product, or process disclosed, or represents that its use would not infringe privately owned rights. Reference herein to any spe- cific commercial product, process, or service by trade name, trademark, manufac- turer. or otherwise does not necessarily constitute or imply its endorsement, rrcom- mendation. or favoring by the United States Government or any agency thereof. The views and opinions of authors expressed herein do not necessarily state or reflect those of the United States Government or any agency thereof.

DISCLAIMER
Portions of this document may be illegible in electronic image products. Images are produced from the best avaiiable original document.
Proceedings of FEDSM’OI 1998 ASME Fluids Engineering Division Summer Meeting
June 21-25,1998, Washington, DC
FEDSM98-4816
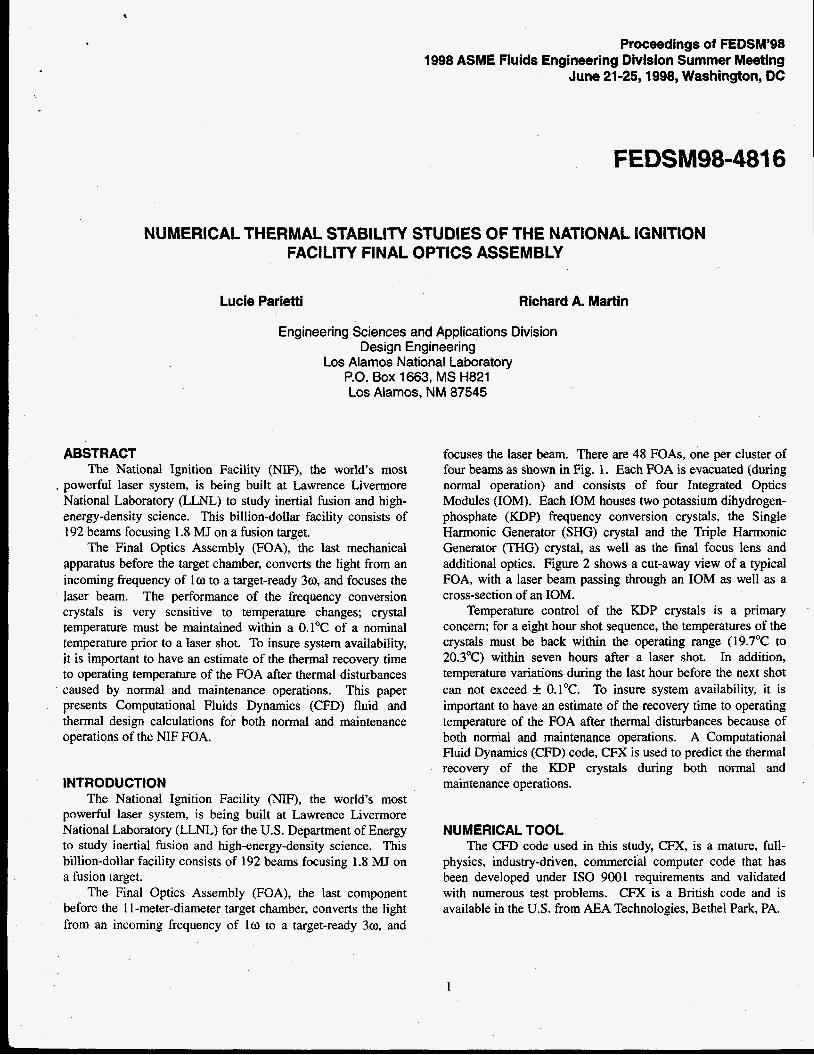
NUMERICAL THERMAL STABILITY STUDIES OF THE NATIONAL IGNITION FACILITY FINAL OPTICS ASSEMBLY
Lucie Parietti Richard A. Martin
Engineering Sciences and Applications Division Design Engineering
Los Alamos National Laboratory P.O. Box 1663, MS H821 Los Alamos, NM 87545
ABSTRACT The National Ignition Facility (NIF), the world’s most
. powerful laser system, is being built at Lawrence Livermore National Laboratory (LLNL) to study inertial fusion and high- energy-density science. This billion-dollar facility consists of 192 beams focusing 1.8 MJ on a fusion target.
The Final Optics Assembly (FOA), the last mechanical apparatus before the target chamber, converts the light from an incoming frequency of lo to a target-ready 3 0 , and focuses the laser beam. The performance of the frequency conversion crystals is very sensitive to temperature changes; crystal temperature must be maintained within a 0.1OC of a nominal temperature prior to a laser shot. To insure system availability, it is important to have an estimate of the thermal recovery time to operating temperature of the FOA after thermal disturbances caused by normal and maintenance operations. This paper presents Computational Fluids Dynamics (CFD) fluid and thermal design calculations for both normal and maintenance operations of the NIF FOA.
INTRODUCTION The National Ignition Facility (NIF), the world’s most
powerful laser system, is being built at Lawrence Livermore National Laboratory (LLNL) for the U.S. Department of Energy to study inertial fusion and high-energy-density science. This billion-dollar facility consists of 192 beams focusing 1.8 MJ on a fusion target.
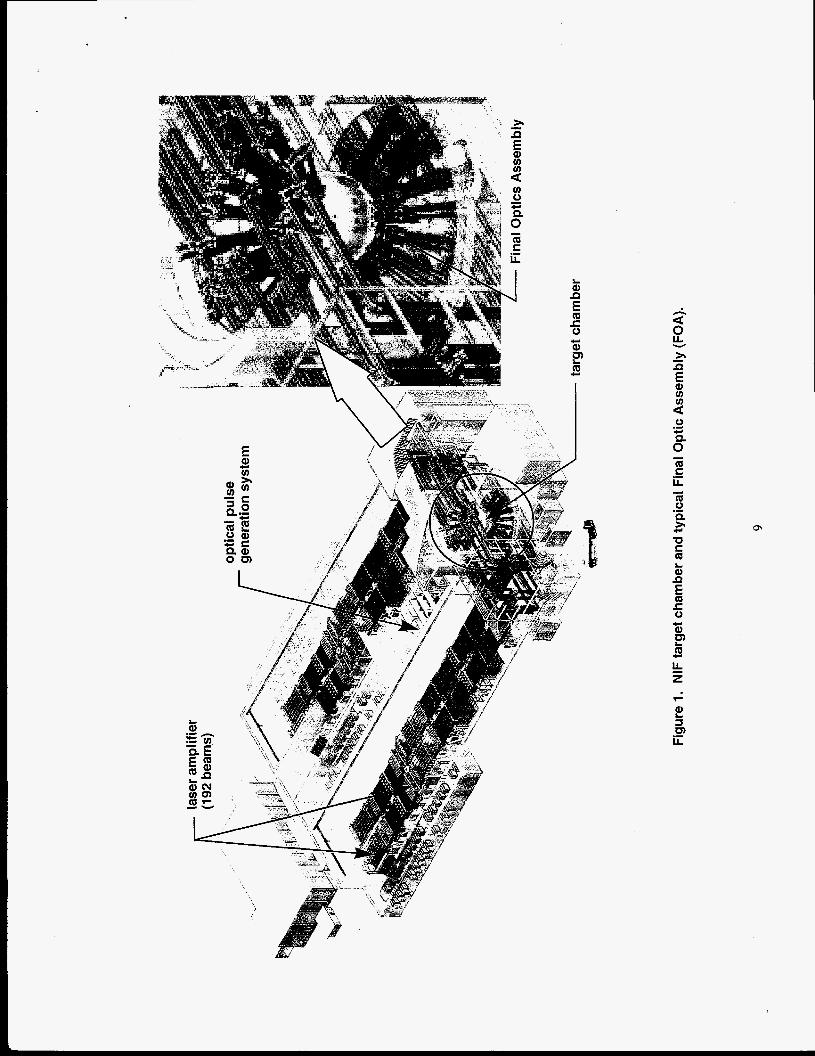
The Final Optics Assembly (FOA), the last component before the 1 1-meter-diameter target chamber, converts the light from an incoming frequency of lo to a target-ready 30, and
focuses the laser beam. There are 48 FOAs, one per cluster of four beams as shown in Fig. 1. Each FOA is evacuated (during normal operation) and consists of four Integrated Optics Modules (IOM). Each IOM houses two potassium dihydrogen- phosphate (KDP) frequency conversion crystals, the Single Harmonic Generator (SHG) crystal and the Triple Harmonic Generator (THG) crystal, as well as the final focus lens and additional optics. Figure 2 shows a cut-away view of a typical FOA, with a laser beam passing through an IOM as well as a cross-section of an IOM.
Temperature control of the KDP crystals is a primary concern; for a eight hour shot sequence, the temperatures of the crystals must be back within the operating range (19.7OC to 20.3OC) within seven hours after a laser shot. In addition, temperature variations during the last hour before the next shot can not exceed k 0.1OC. To insure system availability, it is important to have an estimate of the recovery time to operating temperature of the FOA after thermal disturbances because of both normal and maintenance operations. A Computational Fluid Dynamics (CFD) code, CFX is used to predict the thermal recovery of the KDP crystals during both normal and maintenance operations.
NUMERICAL TOOL The CFD code used in this study, CFX, is a mature, full-
physics, industry-driven, commercial computer code that has been developed under IS0 9001 requirements and validated with numerous test problems. CFX is a British code and is available in the U.S. from M A Technologies, Bethel Park, PA.
1

CFX is a finite-volume, implicit, Navier-Stokes solver that uses a revised version of the Semi-Implicit Method for Pressure-Linked Equations (SIMPLE) technique for the solution of three-dimensional parabolic flows (Patankar, 1980). This revised SIMPLE algorithm was developed by Van Doormal and Raithby and is called SIMPLEC (Van Doormal and Raithby, 1984). In addition, CFX uses several well- developed differencing schemes to discretize the governing differential equations.
All models were generated using Meshbuild, a standard CFX mesh generator that uses a multi-block scheme with body- fitted grid structure.
NORMAL OPERATION During normal operation (short duration laser shot), the
frequency conversion crystals absorb a small portion of the energy from the incident beam which results in temperature rises from 0.13"C to 0.32"C. This energy must be removed during a period of three hours subsequent to the shot (for a four hour shot sequence) to bring the temperature of the crystals back within acceptable range. Since the FOA is evacuated during operation, radiation is the dominant mode of heat transfer and a temperature regulation system for the crystals based on radiative heat transfer to the IOM housing is used. The cool-down of the KDP crystals during a period of four hours after a shot is simulated using the CFD software package, CFX.
Model Geometry and Material Properties Each FOA consists of four similar subassemblies
designated as IOMs. Only one of these IOM modules (located in the north-east corner of Fig. 3) is modeled and appropriate boundary conditions are used to account for symmetries with the other three modules. For a typical IOM, all optical components, i.e. the SHG, the THG, the final focus lens, the diffractive optic and the debris shield are modeled as flat rectangular plates as shown in Fig. 3. The first four of these optical components are supported by a moveable aluminum frame with open top and open bottom. This aluminum frame is designated as the Final Optic Cell (FOC) frame. Thermal contact resistances are included in the model to account for imperfect conduction between the FOC frame and its optics components. Alignment stepping motors are omitted in the model since these motors are assumed to constitute a poor conduction path. The inside of the IOM is normally evacuated
The thermal properties input in the model for the various IOM components are summarized in Table 1. For the final focus lens, the diffractive optic and the debris shield, typical properties for fused-quartz are used. All optics components are assumed to be specular, while the IOM housing and the FOC frame are assumed to be 50% diffuse.
to TO^.
Grid and Boundary Conditions The entire 3-D grid contains a total of 122,000 cells; a
sample cross-section is shown in Fig. 4. A minimum of five cells across each conducting medium is used.
For this study, the operating temperature of the crystals is assumed to be 20°C and the ambient air temperature is assumed to be exactly 20°C. The north and east walls of the IOM aluminum housing are covered by an exterior water cooling jacket (see Fig. 2) which maintains these walls at 20.00"C. Those walls are therefore set to a constant temperature of 20.OO0C (see Fig. 3 for geographic orientation). To account for symmetries in the problem, the south and west walls are assumed adiabatic. The top of the IOM housing sees the ambient temperature and is therefore set to 20.00"C. The bottom surface of the IOM housing is also set to 20.00"C. An emissivity of 1.0 was assigned to this bottom surface in the model.
The only heat load considered in this analysis is the energy absorbed by the KDP crystals from the 20,000 J incident beam during a single NIF shot. The SHG absorbs about 6% of the incident beam (1200 J), while the THG absorbs about 2% (400 J). The energy absorbed by the SHG and the THG result in temperature offsets from ambient of 0.32"C and 0.13"C, respectively. Therefore, the SHG and THG are initially set to nominal temperatures of 20.32"C and 20.13"C, respectively.
Solver Parameters The temperature field is expected to be and is therefore
treated as a 3-D, transient field. Both conduction and radiative heat transfer are taken into account. A discrete Shah radiation model (Shah, 1979) was generated. The discretized domain was subdivided into 1,766 radiation zones (a maximum of 4 x 4 ~ 4 cells per radiation zone was used). The radiation exchange equations were integrated over 32 paths emanating from each zonal radiation surface.
The problem was run in double precision because of the very small temperature differences, simulating a four hour time period with 120 s time steps at 50 iterations each. It took 31 hours and 30 minutes of CPU time on an SGI Indigo I1 workstation (256 Mb RAM, 250 MHz IP22 processor, MIPS R4010 Rev 0 floating point chip, and a MIPS R4400 Rev 6.0 processor chip) to run the problem to completion.
To gain confidence in the results, studies were performed to test the numerical stability of the solution. The desired solution is independent of time step, numerical scheme, number of iterations within each time step, mesh density and radiation model. No significant differences were observed between solutions using time steps of 10 s or 120 s. A higher order numerical scheme was used without significant effect on the predicted temperatures. The number of iterations within each time step was doubled and the temperatures predicted remained unchanged. The number of radiation zones was also doubled and no significant changes in the predicted results were observed.
2

Results Temperature distributions in the IOM at 112, one, two and
three hours after the shot are shown in Fig. 5. Initially, the SHG and the THG crystals are at 293.32K and
293.13K3, respectively. The warmer crystal (SHG) then starts to give off heat by radiation to the top of the IOM housing and the cooler crystal (THG). During the first 30 minutes after the shot, the temperature of the SHG decreases to 293.19K while the temperature of the THG increases slightly to 293.14K. The heat lost by radiation to the top of the IOM housing is removed by conduction through the aluminum walls of the housing. Since these walls are relatively very conductive, no significant temperature gradient across the walls is observed. The THG crystal is in turn giving off heat by radiation to the final focus lens, which warms up to 293.04K. After a one hour period, the two KDP crystals have already cooled to about 293.11K. A small portion of the total energy is also removed by conduction through the crystals and the box containing the optics components and then radiated from this box to the IOM housing. This heat warms the box to 293.03K. After two hours, both crystals have cooled down below 293.1013. The THG crystal, trapped between the SHG crystal and the final focus lens, is warmer than the SHG. The final focus lens is losing heat to the difiactive optic plate, which warms up slightly. After 3 hours, the THG crystal is still losing heat to the final lens; these two components have almost reached thermal equilibrium.
Figure 6 shows temperature contours on the top surface of the SHG crystal. After two hours, the SHG crystal has cooled down below 293.10K. At this time, no temperature gradient can be seen across the crystal.
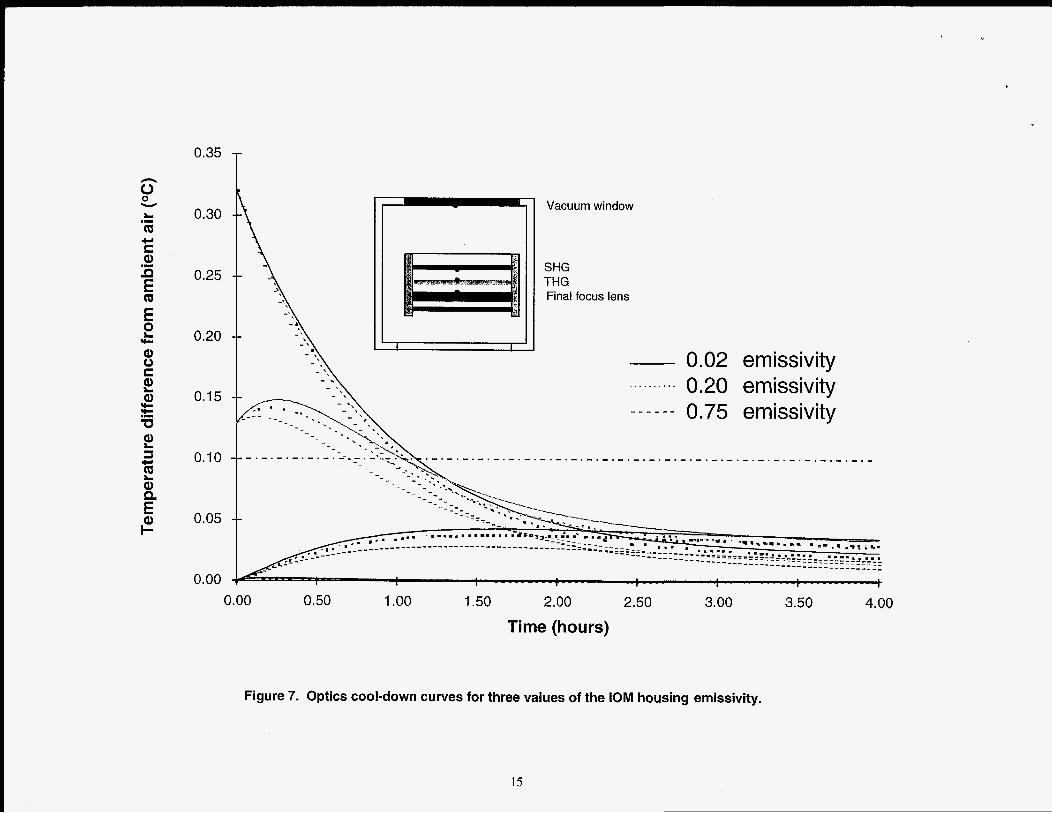
The effect of the IOM housing surface emissivity on the KDP crystal cool-down was investigated. Temperature time histones of the KDP crystals for several housing emissivities (0.02, 0.2 and 0.75) are illustrated in Fig. 7. Locations of the points where the temperature is monitored are shown schematically in Fig. 7. As the aluminum housing emissivity increases, the KDP crystals cool down faster. If the aluminum of the IOM housing is anodized (0.75 emissivity), the crystals cool-down to within 0.1OC of the ambient air temperature and cooling water in less than 1 hour, as opposed to 1 hour and 20 minutes for a clean polished aluminum surface (0.02 emissivity). After a two hour period, the temperature of the crystals is within 0.035”C of the equilibrium temperature in the case of anodized aluminum as opposed to 0.06”C for a non- treated aluminum surface. This difference in cool-down temperature can become significant after several shots because the temperature of the crystals will build up after each shot. Treating the IOM aluminum housing to obtain a higher emissivity is, therefore, preferable from a thermal standpoint.
MAINTENANCE OPERATIONS Under normal operation (laser shot), the NIF Final Optics
Assembly (FOA) is evacuated. Each FOA needs to be vented to
atmospheric pressure before any maintenance operation (such as, debris shield replacement) can be performed, and then evacuated before the next shot can take place. Venting and pump-down of an FOA cause heating and cooling of the gas by adiabatic compression and adiabatic expansion, respectively. It is therefore necessary to know the recovery time for the FOA to return to operating temperature before the system is available following a maintenance operation.
The purpose of this maintenance operation study is to simulate the thermal upset of the KDP crystals as well as the pressure and flow fields inside the FOA during pump-down using the CFD package, CFX. Thermal upset during venting is also being studied, but is not reported here.
Pump-Down Scenario During the NIF construction Title I1 design phase, a few
design changes were made so that the FOA design becomes even more modular. Each IOM now contains two separate modules bolted to one another, the Optics Module (containing the vacuum window, the FOC, and the alignment motors), and the Debris Shield Module. The diffiactive optic plate was also moved from the Final Optics Cell to the Debris Shield Module. In the probable FOA final design, a kapton membrane isolates the Optics Module from the Debris Shield Module for cleanliness purposes (see Fig. 8). A 10 Torr pressure differential between modules helps prevent particles located below the debris shield from migrating towards the Optics Module. For this reason, the volume located above the Debris Shield Module is designated as the clean volume, while the volume located below it is designated as the contaminated volume as shown in Fig. 8.
During pump-down of the FOA, the four clean volumes and the contaminated volume will be simultaneously evacuated from atmospheric pressure down to 10” Torr. The one way- valve (not shown) separating the 3-0 calorimetry chamber from the target chamber will then be opened and the additional gas load coming from the 3-0 chamber will be absorbed by the target chamber vacuum system at
A slow pump-down is preferred from a cleanliness standpoint; the effects of a 10 minute pump-down are investigated in this maintenance operation study.
Torr.
Model Geometry and Material Properties As the four clean volumes and the contaminated volume
are evacuated simultaneously, only a single clean volume (Optics Module) needs to be modeled to investigate the thermal upset caused by a slow pump-down. The pump-down model therefore consists of the clean volume from the vacuum window to the mid-flange as shown on Fig. 8. The debris shield cassette is not included in the model since we are not interested in predicting the thermal upset in this area, and including this cassette would make the flow field more complicated to solve.
3

All optics components are again modeled as flat rectangular plates as shown in Fig. 9. Contact resistances are included to account for the imperfect conduction between the FOC frame and the three optics. Thermal contact resistances of 0.025 m2 WW, 0.05 m2 WW, and 0.025 m2 WW are used for the SHG, the THG, and the final lens, respectively. Circular corner channels are cut in the FOC frame to evacuate air between optics components. These corner channels are modeled as square channels of the same area as the circular ones. A square 22 mm x 22 mm port, located in the center of the east wall and at a vertical location close to the flange, is used for this pump-down simulation. This port has the same cross-section area as a circular 25 mm port.
The thermal properties input in the pump-down model are summarized in Table 2.
~
Grid and Boundary Conditions The grid for the pump-down model contains 96,000 cells
(see Fig. 10). A discrete Shah radiation model with 1,850 zones was generated (a maximum of 4 x 4 ~ 4 cells per radiation zone was used).
The north and east walls of the Optics Module housing, surrounded by a water cooling jacket, are set at 20.0O0C, while the south and west walls are assumed adiabatic. The top of the Optics Module which sees ambient temperature is set to 20.00"C as well. Since both clean and contaminated volumes are evacuated at the same time, it is unlikely that the debris shield will give off or receive heat to its surroundings, so the bottom surface of the clean volume is, therefore, assumed to be adiabatic. Initially, the air inside the clean volume is assumed to be at 20.00"C. An exponential pressure drop is applied at the outlet to simulate a 10 minute pump-down.
Problem Physics and Solver Parameters The physics of this problem is very complicated. The flow
field is expected to be and is treated as a 3-D, transient, fully- compressible, buoyant, flow of a perfect gas.
The flow field is compressible since the density of the gas is dropping as mass is evacuated from the clean volume. The continuum equations are valid as long as the molecular mean free path is smaller than the characteristic length of the Optics Module (Roth, 1982), which is true as long as the pressure does not drop below 7.8 x Torr. Therefore, since the Optics Module is only evacuated to Torr, the continullm flow equations are appropriate to describe the gas behavior. In addition, as long as the pressure is higher than the range of rarefied gas flow, the viscosity as well as the thermal conductivity of a gas is independent of pressure. In this study, the gas properties within each cell vary as a function of the gas temperature only.
Note that laminar heat transfer prevails on all surfaces except in the outlet region. For this reason, the flow is assumed laminar to accurately predict the cooling of the crystals.
All three modes of heat transfer, conduction, convection, and radiation, have to be taken into account. Initially, convection is the dominant mode of heat transfer. During the first five seconds, forced convection dominates. Next, free convection overcomes forced convection as the temperature of the gas drops rapidly because of the expansion process and as the crystal temperatures lag behind. The temperature of the gas reaches a minimum, and starts to warm back-up as natural convection overtakes the expansion cooling. The convection will eventually die out as the temperature differences between the crystals and the gas decrease and as the gas becomes less dense. At some point, convection will be negligible compared to conduction in the gas and radiation heat transfer. Conduction and radiation will ultimately cause temperature recovery of the crystals.
When convection becomes negligible compared to other heat transfer modes, the flow equations no longer have to be solved and the problem can be run as a coupled radiation- conduction problem. This allow the CFX code to take bigger time steps than was possible when the flow field was being solved.
Because the solution needs to be time-accurate, for each time step, a severe convergence criteria based on the residuals was set. To provide an indication of convergence as the solution evolves, residuals are computed at each time step in each cell of the mesh. Each dependent variable, y, is solved for in algebraic equations of the form
where F is a forcing function. The global residual for the variable y is the absolute difference between the left hand side and the right hand side of equation (l), summed over the whole grid.
As the flow equations were solved, the convergence criteria was that the sum of the enthalpy residuals (for all the domain cells) divided by the total enthalpy leaving the system as well as the sum of the mass residuals divided by the total mass leaving the system was less than 1%. To meet this convergence criteria, very small time steps (between 0.02 s and 0.04 s) were taken with an average of 40 iterations per time step. Because of these very small time steps, the problem was very CPU time intensive. It took three months on a DEC Alpha (1Gb RAM - 500 MHz Alpha 21164A processor) to run the first three minutes of the pump-down. For the conduction-radiation solution, no flow was leaving the system so the convergence criteria had to be modified. The ratio of the sum of the enthalpy residuals over the total heat dissipated in the system had to be smaller than 1%. During that phase of the run, the time step used was increased from 0.02 s to 2 s. Time steps of 3 s were used when radiation overtook conduction and became the dominant heat transfer mode. Once the flow was turned off, ten more days were needed to run the conduction-radiation problem to completion and simulate four hours of real time.
4

To gain confidence in the solution, several studies were undertaken. A finer grid containing 360,000 cells (almost four times as many cells as the coarse grid) was developed and run for the first ten seconds of the pump-down. No significant changes in the predicted solution were observed. In addition, the flow solution for the coarse grid was run between 116 s and 11 8 s of real time with different solver parameters. The time step independence was tested by using twice as small time steps (0.02 s) during that time period. No significant changes were observed on the crystal temperatures whether a 0.04 s time step or a 0.02 s time step was used. The convergence criteria for the enthalpy and mass residuals was also tightened to 0.1% without observing any change in the predicted temperatures. The number of rays emanating from each surface panel was increased from 36 to 144 without significant effect on the predicted results. The radiation zones were also increased from 1,766 zones to 4,014 zones (by using a maximum of 3 x 3 ~ 3 cells per zone instead of 4 x 4 ~ 4 cells) and no significant changes in the solution were observed.
Results The Optics Module pump-down flow solution is run for the
first 2 min 52 s. At this time, convection and radiation are of the same order of magnitude; and the temperature of the THG and the final lens are barely decreasing (0.00Ol"C per second), while the temperature of the SHG is starting to increase back up. The flow solution is then turned off and a conduction- radiation run is started to simulate the recovery time of the optics.
Figures 11 and 12 show velocity and temperature contours on a vertical plane passing through the outlet at 1 s, 40 s, 80 s and 120 s of a 10 minute pump-down, respectively.
Initially, the flow is forced-convection dominated while air is being pulled out through the outlet. At first, the temperature field inside the Optics Module is very uniform. The gas begins to cool slightly because of the expansion process, but the optics have not cooled down yet.
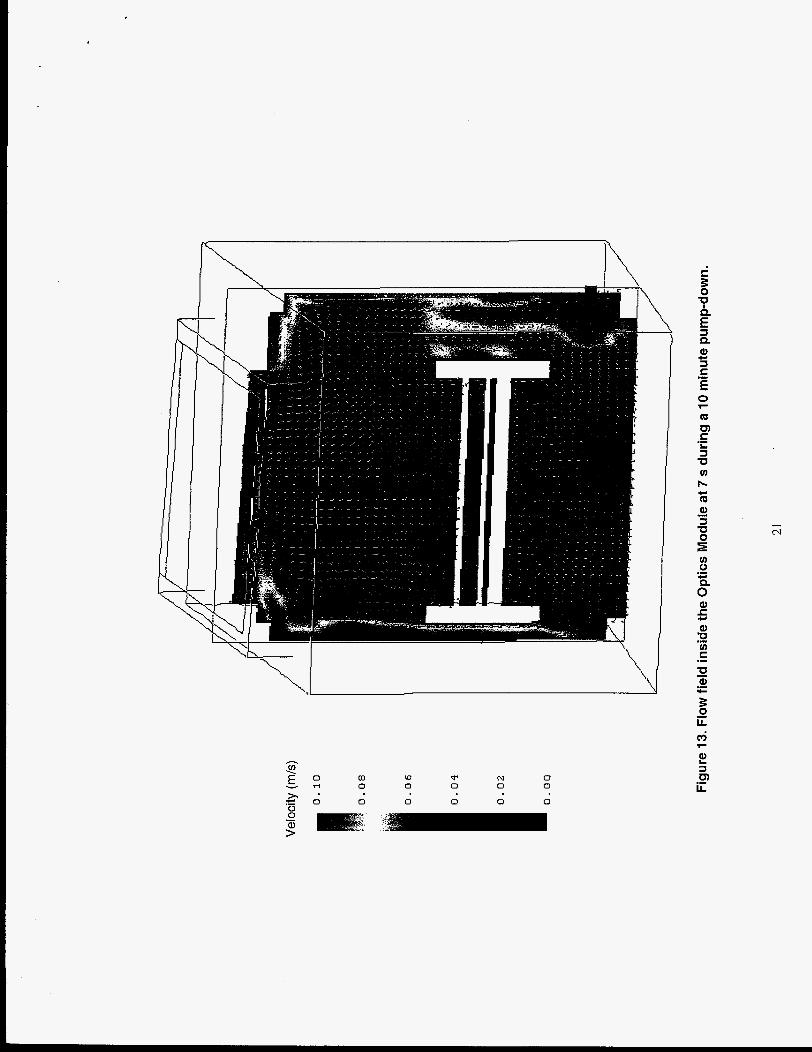
After the first 5 s, the flow becomes free-convection dominated. The temperature difference between the gas and the crystals rapidly increases, inducing buoyant flow along the walls of the Optics Module housing and the FOC frame (see Fig. 13) and causing a chimney effect in the corner channels of the FOC (see Fig. 14). The average gas temperature reaches a minimum of -7°C at 40 s. At that point, the optics are cooling down steadily and the SHG crystal has already cooled-down by 0.14OC. The pressure has almost dropped by a factor of two (see Fig. 15). The air progressively warms up as it circulates along the warmer walls of the IOM housing and the FOC frame. At 80 s, the average air temperature has increased by 10°C from its minimum temperature and is about 3°C. The gas located below the final lens is stagnant and, therefore, tends to warm up more slowly than the air in the upper part of the Optics Module since it is blocked by the FOC.
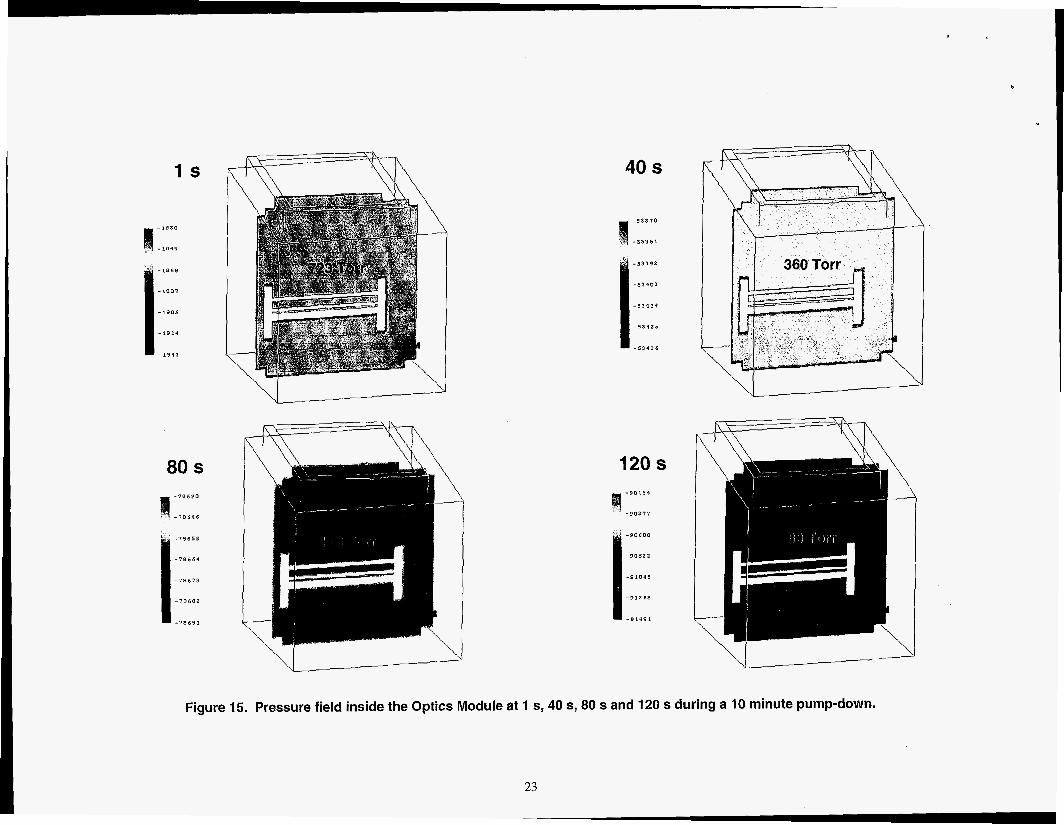
Figure 15 shows the pressure distribution in the Optics Module at 1 s, 40 s, 80 s and 120 s during the pumpdown process. The pressure field is seen to be uniform throughout the pump-down. This implies that the comer channels are large enough not to create any pressure gradients across the optics. The maximum pressure differential across an optic is about 10 Pa.
The average temperature of the optics during a 10 minute pump-down is shown on Fig. 16. All three optics do not cool down at the same rate. The uppermost crystal (SHG) is cooling down faster since it sees cooler air on its upper surface. In addition, the gas rises freely above the SHG inducing buoyant flows that enhance convection. The THG crystal gives off very little heat to the gas that surrounds it as the gas located in the small volumes in between the optics remain warm throughout the pump-down process (see Fig. 12). The gas located in these volumes does not mix very well with the cooler gas outside of the FOC since it is trapped between two warm optics and has to exit through the comer channels to mix with the cooler air. The final lens is cooling even slower than the middle crystal since its thermal mass is about twice that of the THG crystal.
The SHG crystal is warming faster than the other optics since it upper surface "sees" primarily the walls of the Optics Module housing as well as the vacuum window which are warmer and maintained at 20.00"C. The average temperature of the SHG crystal returns to operating temperature after 45 minutes. However, while the optics temperature is relatively uniform 45 minutes after the pump-down begins, in-plane temperature gradients across the optics begin to develop at that time. These temperature gradients develop because the FOC frame, initially warmer than the SHG crystal, does not warm up to ambient temperature as fast as the optics because of its low emissivity (0.02). Figure 17 shows temperature contours in a horizontal section across the Optics Module at a vertical location corresponding to the upper surface of the SHG crystal at 49 minutes, two, three and four hours after the beginning of a 10 minute pump-down. The temperature differential across the SHG crystal peaks at 0.073"C after about two hours and decreases slowly thereafter. After four hours, the temperature differential is still 0.047"C. These temperature gradients are likely to be reduced significantly if a higher emissivity for the FOC frame is used.
CONCLUDING REMARKS The CFX model used to predict the recovery time of the
FOA optics after a laser shot indicates that the KDP crystals will cool-down to within 0.1"C of the ambient air and cooling water temperatures within a two hour period. The normal operation model shows that a temperature regulation system based on radiative heat transfer to the IOM housing is adequate and can provide the required temperature regulation for the KDP crystals. This is under provision that the W A C system will be able to maintain the ambient air temperature at exactly 20°C and that the water running through the cooling jackets
5

will be maintained at 20°C as well. The cool-down of the crystals under more pessimistic boundary conditions was later investigated and showed that the crystals were still able to return to operating temperature within a 2 hour time period. Furthermore, this full-physics 3-D model was used to calibrate a simpler lumped-capacitance model used to predict the optics temperatures during a muiti-shot sequence. New studies have also shown that the initial temperature rise for the KDP crystals after a laser shot should not be as high as previously envisioned. Under such conditions, the KDP crystals should recover within 40 minutes under the worst conditions even if a 0.02 emissivity is used for the walls of the IOM housing.
Because of machine CPU speed limitations, the off-normal operation model has not proven to be the versatile design tool we hoped for. Nevertheless, this model provided useful information regarding the recovery time of the crystals during a slow pump-down. It also gave us a better understanding of the effect of the FOC frame emissivity on the optics recovery time and temperature gradients. The full-physics CFX model is used to calibrate a simpler lumped-capacitance model. This simpler model then serves as a realistic design tool to predict the effects of longer pump-down rates or to perform sensitivity studies.
ACKNOWLEDGMENTS The authors gratefully acknowledge the technical support
and consulting department staff at AEA Technology for help with CFX modeling. This work was supported by the U.S. Department of Energy.
REFERENCES Patankar, S. V., 1980, Numerical Heat Transfer and Fluid
Flow, McGraw-Hill, NY. Roth .A., 1982, Vacuum Technology, Elsevier Science
Publishers B.V., Amsterdam, The Netherlands. Shah N.G., 1979, “New Method of Computation of
Radiation Heat Transfer in Combustion Chambers,” Ph.D. thesis, Imperial College of Science and Technology, London, England.
Van Doormal, J. P. and Raithby, G. D., 1984, “Enhancements of the SIMPLE Method for Predicting Incompressible Fluid Flows,” Num. Heat Trans., Vo1.7, pp.147- 163.
6
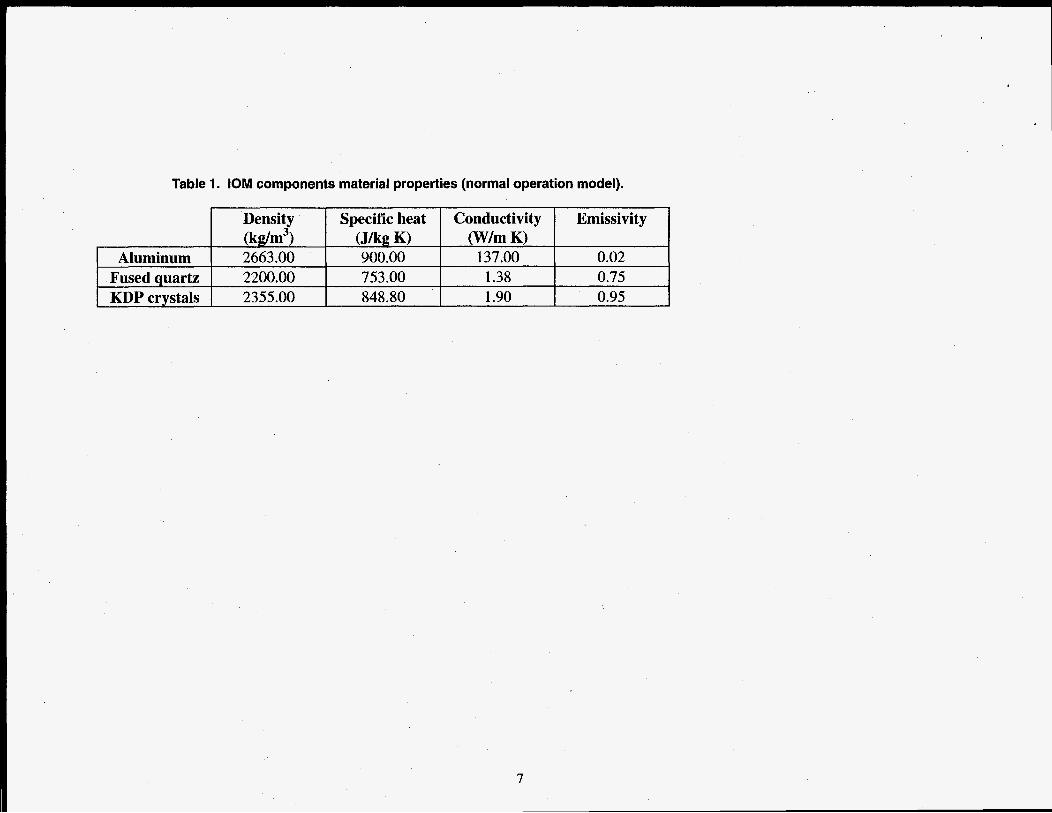
Table 1. IOM components material properties (normal operation model).
I Density I Specific heat I Conductivity I Emissivity I - (kglm3) (Jkp: K) (W/m K)
Aluminum 2663.00 900.00 137.00 0.02 Fused quartz 2200.00 753.00 1.38 0.75 KDP crystals 2355.00 848.80 1.90 0.95
7
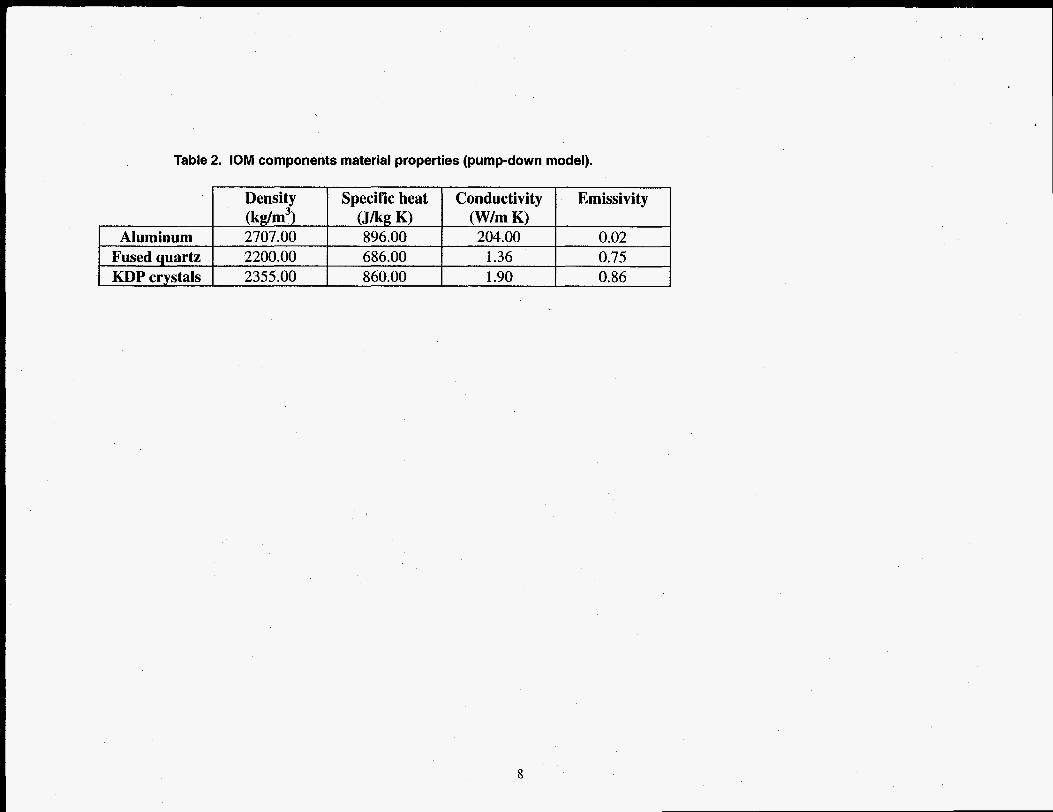
Table 2. IOM components material properties (pump-down model).
I Density I Specific heat I Conductivity I Emissivity (kdmJ) (Jkg K) (W/m K)
[ Aluminum 2707.00 896.00 204.00 0.02 ~ I Fused auartz I 2200.00 I 686.00 I 1.36 I 0.75
I KDPcrystals I 2355.00 860.00 1.90 0.86
8
- 0 0 P %
._ c
z E n Q C 0 Q) c
c P

0
Q .- IC,
0
Q
O Y-
S m 0 .c

5 . c
E 0 al w
€ E c .-
C 0 .- c f P 0

E ii, c 0

smoy E
000- €62 OTO . E6Z OZO’E6Z OEO * €62 OPO ’ €6 2 OGO’E62 090 €62
080.C.62 060’€62 OOT. * E6 2 OTTC’E6Z
smoy z

I Q K E
+ T-
o
4 0 C u) m L
c yl Q m
0 3 .I-
ui a S S .I-
.- E 0 0
Q c
UJ S 0 c
L
c
8 2 S .I-
f z a c
3 0 v L .- a
Vacuum window i=--il SHG THG Final focus lens
0.02 emissivity .......... 0.20 emissivity - - - - - - 0.75 emissivity
0.00 0.50 1 .oo 1.50 2.00
Time (hours) 2.50 3.00 3.50 4.00
Figure 7. Optics cool-down curves for three values of the IOM housing emissivity.
15

3 &
I

d

S
5 x E S Q rc 0 z L w 0 rc
0 7-
co 3

v) 0
cn 0 cu r
0 0
0
cn 0 00

Is
80 s
40 s >
\ r r - \ \
Temperature (K) 293.15
287.72
282.29
276.86
271.44
266.01
260.58
255.15
Figure 12. Temperature field inside the Optics Module at 1 s, 40 s, 80 s and 120 s during a 10 minute pump-down.
20
4 I
h
W 2 E O 0 0 0 0 0
0 0 0 0 0
v r l
h . .= 0
m N 0
Q S S +,
.- E z m a S
S U
.- L
u) r- m c
Q U u) S .- .-
ii
2
ii 3 a

1
I
c
I s
- 1 9 3 0
-1049
- 1 8 6 8
-1887
-190s
- 1 9 2 4
-1943
80 s -78638
- 7 8 6 4 6
- 7 8 6 5 5
-78664
-78673
- 7 8 6 8 1
- 7 8 6 9 1
40 s
-53370
-53381
-53392
-53403
- 5 3 4 1 4
- 6 3 4 1 5
-53436
120 s - 9 0 1 5 4
-90377
- 9 0 6 0 0
- 9 0 8 2 2
- 9 , 0 4 5
.O,Zb*
- 9 1 4 9 1
Figure 15. Pressure field inside the Optics Module at 1 s, 40 s, 80 s and 120 s during a 10 minute pump-down.
23

f
0 * (v
0
cv 7
0 03 7
0 Ln -r
0 (v T-
O 0
0 ((3
0 c9
0
e
x E 3 Q Q)
3 S
c
.- E

$ x 0
E S P Q) S S 4-
.- E
I? S 0 c L S 0 Y-
IE] S m Q) Q) L
5
.. c .- E
10 N
E 3 LT) U .-