'l I - Transportation Research Boardonlinepubs.trb.org/Onlinepubs/hrr/1968/243/243-003.pdf · s l...
15
s l I 'l '1 .i I I I ! I Comparison of Laboratory and Field Values Of cy for Boston Blue Clay LESLIE G. BROMWELL and T.'WILLIAM LAMBE, Massachusetts Institute of Technology Laboratory values of cu" (the coefficient of consolidation for swelling) for Boston btué clay aÌe compared with the value back-figured from piezometer observations at a large building excavation. The fieid value is shown to be six times larger than the average laboratory value. Possible reasons for the large discreparicy between the laboratory and field values are sample disturbance, errors in laboratory test procedures, errors in field measurements, and three-dimensional consoli- dation effects. Of these four items, errors in laboratory test procedures, particularly the difficulty of meazuring cys from oedometer tests, can contribute signi{icantly to the discrepancy. In addittion, it is shown that three-dimensionalconsolidation effects can account for the differences between laboratory and field values. .SETTLEMENT predictions, although one of the most common tasks of the soil engi- neer, a.re subiect to very large errors. Estimating rafe of settlement is generallyeven more haaardous than estimating total settlement. This paper compares the laboratory value of cu" (the coefficient of consolidation for swelling) for Boston blue clay with the value back-figured from piezometer observations at a large building excavation. The field data were taken under a program known as FERMIT (Foundation Evaluation and Research, M.I.T.), which is qronsoredby the M.I.T. Office of Physical Plant. The building under study is the Julius A. Stratton Building, the M.I.T. Siudent Center. DESCRIPTION OF FOUNDATION AND SUBSOILS The M.I.T. Student Center is a five-story reinforced concrete frarne structure. It was constructed on the west side of the campus during 1963-64. The location is shown in Figure 1. The building has a floating foundation and rests on a 3 to 10-ft thick con- crete mat constructed on a sand-gravel layer. Figure 2 shows the average soil profile at the site. The Boston blue clay, which is 60 to ?5 ft thick in this area, is overconsolidated at the top (OCR- 6). The amount of overconsolidation decreases with depth, and the bottom half of the clay is normally consolidated. The rezults of extensive soil tests on the clay have been reported by Ladd andLuscher (!). The soil parameter of interest to this paper is the coefficient of consolidation for swelling, cu". Values of cvs are shown in Figure 2 and are zummarized in Table 1. AIso given in Table 1 are values of cys, the coefficient of consolidation for compression. The values in Table 1 are averages of vafues computed by both the log time ard the square root of time-fitting methods from 40 tests. The average value of cys for th-e first stress decrement from the maximum pastpres- sure, õy,'1¡ is 60 * 39 x 10-n cm'/sec. In addition, cysdecreases with increasing OCR. For an OCR = 4, the average value of cys = 30 + 10 x 10-" cm"/sec. Thus, the upper Iayer of Boston blue clay, which is overconsolidated, should have a lower value of cyg Poper sponsored by Committee on Soil ond Rock Properties ond presented ot the 47th Anriuql Meeting. 23
Transcript of 'l I - Transportation Research Boardonlinepubs.trb.org/Onlinepubs/hrr/1968/243/243-003.pdf · s l...

sl
I
'l'1
.iI
I
I
!I
Comparison of Laboratory and Field ValuesOf cy for Boston Blue ClayLESLIE G. BROMWELL and T.'WILLIAM LAMBE,
Massachusetts Institute of Technology
Laboratory values of cu" (the coefficient of consolidation forswelling) for Boston btué clay aÌe compared with the valueback-figured from piezometer observations at a large buildingexcavation. The fieid value is shown to be six times largerthan the average laboratory value. Possible reasons for thelarge discreparicy between the laboratory and field values aresample disturbance, errors in laboratory test procedures,errors in field measurements, and three-dimensional consoli-dation effects. Of these four items, errors in laboratory testprocedures, particularly the difficulty of meazuring cys fromoedometer tests, can contribute signi{icantly to the discrepancy.In addittion, it is shown that three-dimensionalconsolidationeffects can account for the differences between laboratory andfield values.
.SETTLEMENT predictions, although one of the most common tasks of the soil engi-neer, a.re subiect to very large errors. Estimating rafe of settlement is generallyevenmore haaardous than estimating total settlement. This paper compares the laboratoryvalue of cu" (the coefficient of consolidation for swelling) for Boston blue clay with thevalue back-figured from piezometer observations at a large building excavation. Thefield data were taken under a program known as FERMIT (Foundation Evaluation andResearch, M.I.T.), which is qronsoredby the M.I.T. Office of Physical Plant. Thebuilding under study is the Julius A. Stratton Building, the M.I.T. Siudent Center.
DESCRIPTION OF FOUNDATION AND SUBSOILS
The M.I.T. Student Center is a five-story reinforced concrete frarne structure. Itwas constructed on the west side of the campus during 1963-64. The location is shownin Figure 1. The building has a floating foundation and rests on a 3 to 10-ft thick con-crete mat constructed on a sand-gravel layer.
Figure 2 shows the average soil profile at the site. The Boston blue clay, which is60 to ?5 ft thick in this area, is overconsolidated at the top (OCR- 6). The amount ofoverconsolidation decreases with depth, and the bottom half of the clay is normallyconsolidated.
The rezults of extensive soil tests on the clay have been reported by Ladd andLuscher(!). The soil parameter of interest to this paper is the coefficient of consolidation forswelling, cu". Values of cvs are shown in Figure 2 and are zummarized in Table 1.AIso given in Table 1 are values of cys, the coefficient of consolidation for compression.The values in Table 1 are averages of vafues computed by both the log time ard thesquare root of time-fitting methods from 40 tests.
The average value of cys for th-e first stress decrement from the maximum pastpres-sure, õy,'1¡ is 60 * 39 x 10-n cm'/sec. In addition, cysdecreases with increasing OCR.For an OCR = 4, the average value of cys = 30 + 10 x 10-" cm"/sec. Thus, the upperIayer of Boston blue clay, which is overconsolidated, should have a lower value of cyg
Poper sponsored by Committee on Soil ond Rock Properties ond presented ot the 47th Anriuql Meeting.23

'!'
24
Lc.gri ( l..l I
o r00 200 u aoo 5æ
Figure l. Plon of "*t-, *.,.t. cqmpus.
than the normally consolidated clay. This variability in la.boratory values of cos has
not been considered in the análysii of the field data. The point is, however, that the
fa"gã variabitity of laboratory values will in itself preclude the possibility of accurate
rate predictions based on a few laboratory tests'
CONSTRUCTION HISTORY
A plan view of the foundation excavation Ís shown in Figure 3. The excavation was
made in two stages:
1. Stage 1, from Elev. +22to Elev. +15, during the period september 21-30, 1963.
No dewatering was required during this excavation'- -2.- Stage ã, t"otn Élev. +15toblev. +?.5, duringtheperiod October ?-16, 1963.
Steady puirplng from a well-point system located in the sand-gravel layer above the
ctay uegan on october 4 and continued throughout the stage 2 excavation.
The total vertical stress release from the excavation (EIev. +22 to Elev. +?.5) was
Jãut 0.82 kg/cm2. The foundation mat, which constitutes about one-third of the struc-tura"l dead lõad, was poured in four sections between November 23, 1963, and February15,1964.
i
lI
J.:.
TABLE 1
SUMMARY OF COEFFTCIENT OF CONSOLIDATION DATAFoR BOSTON BLUE CLAYa
cu, l0-'cm¿/sec
FOUNDATION INSTRUMENTATION
The foundation instrumentation atthe Student Center included eight pi-ezometers (Casagrande tYPe), sixheave roads, and aPermanent bench-mark. Thelocations of these instru-ments are showninFigure 3. Severaladditional heave and settlement point swere installed during later stages ofconstruction. An observation well islocated 100 ft north of the site.
CALCULATION OF FIELD cyg
The measured pore Pressuresfrompiezometers 1 through 4 have been
Coefficient
1. Compression, cvc, atõvo
Overconsolidated
Normally consolidated
2. Swelling, cr"From õy¡ to tfzi
vm
Flom %ovm totfqõvm
Flom /o õyp to Ys or r¿u õtt
40¡2020+ 10
60+30
30*1020! 10
oFrom Lodd ond Lwcher (l ),

.h
SOIL PROFILEAT
æEFFICIeNT tr CON$LIoATION hró,ñêdExpANStoil tNoEx p-4 cñz/.e sFr strqthãoupnÉssrou lñocx ExpaNsroN RECoMPRESS& lo/çû2
ts
z2ôtr
¿
30
4O
90
roo
WATER CONTENT IN CÁ COMPRESSION INO€X RECOMPRSS¡ON INDEX . EXPANSION RECOMPRESS&
o
-50
tut Ê Pæry silr
llt r r r r
L
!t
.l
î
rl'Ii¡îlrji!
lailii' ¡r,
t)l
I
ô
,üLl\I
èÁ
I
I
I
sI
I
.t
l+
t----€+t+t+
t+
l+
}+
rto
o
-to
-60
Still lo
- CloY
$fr
_ clov
- &tbñ d cþyt
ffim ol clotr
- Glæ'ol T¡¡l(5' b ro')
Sho¡.
Studant c4Þ.. aFnlion ¡ndrr for
dc- 16+1.5 htc
o RecomF3lion iúex7
"lrÀ,/I i .-i\'
I Sludlol cdtêrI T.!l lUndbtlh
ll*':Y-l :-f:
Figvre2. Typicol soi I fest dqtq for M.l.T. compus.

26
L--------l
4o
Io
5o
l2ra 2()@o
II
IIL-- sild.ilûdù Ecild¡nr Llm-L
-- - -- - - --j
', ...t IFigure 3. Dimensions of excovotion,
used to compute a field value of cu", Figure 4 shows the location of these instrumentsin tir"
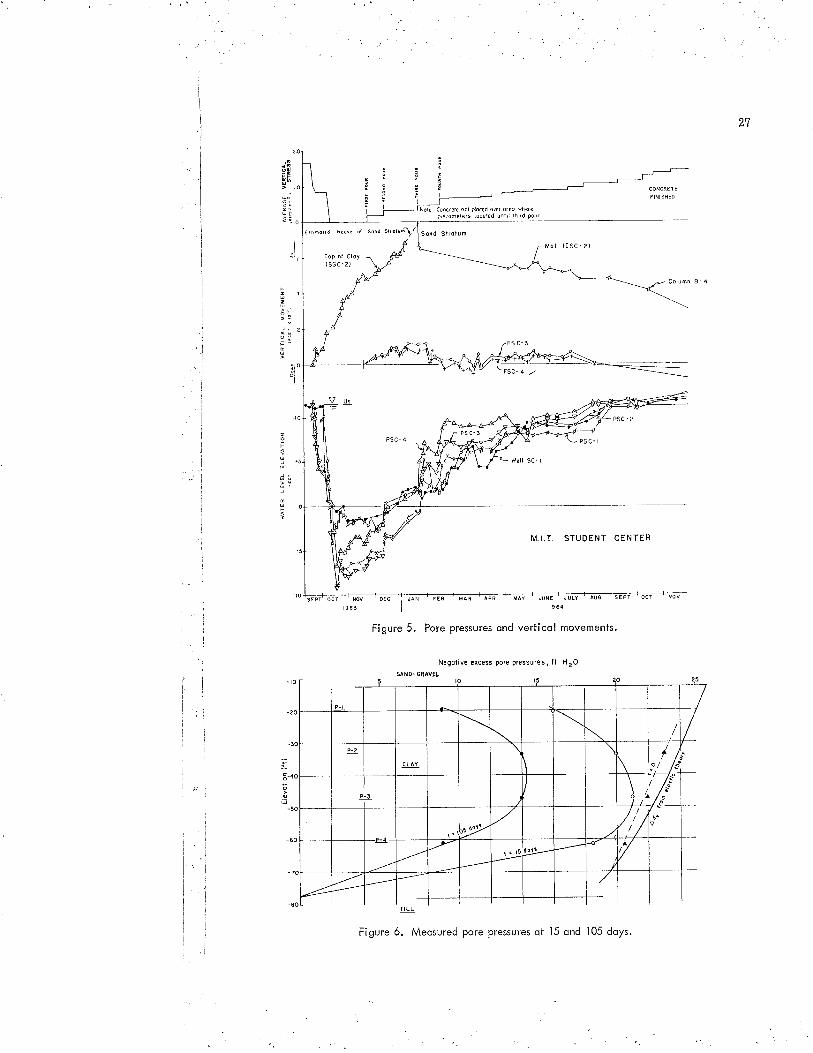
"t"y t'"yur. Figure 5 showdThe measurements of pore pressures a¡rd vertical
movements during foundation construction'Figure 6 shows a plot of the meazured negative excess p-ore pressures in the clay
tayer*1S and 105 ¿ayÀ a.fter excavation. The excavation and the dewatering were as-
zumed to have occurred on October ?, the middle of the actual excavation period'Also shown in Figure 6 are välues of the initial excess pore pressures (t = 0) o¡-
tained by extrapolating the measured pore pressures at the end of excavation back to
the middle of the excavation period. The values of initial excess pore pressure arequitã close to Aoy, the changL in vertical stress computed from elastic theory with
v= /2.tinowing the initial pore pressures at t = 0, and the equilrbrium pore pressures at
¡ = -, the äeazured valuesbf pore pressure at any intermediate time can be used to
compute a point value of Us, the percent consolidation. [The equilibrium pore pres-so""s we"e taken as those iezuIting from steady state upward seepage due to pumping'
The water table actualty varied somewhat during excavation (as shown by the well-pointdata in Fig. 5). The average head drop in the sand-gravel layer due to pumping was
-iS tt to""t = f ¡ days and -iO tt tor t = 105 days.l Using standard one-dimensional
,ãtoiiott" (l), tfre time factor, Ts, can then be obtained. The time factor is related tothe coefficient of consolidation by the following equation:
cvs - T"H'
The effect of errors in the assumed initialpore pressure distribution can be minimizedbycomputing cys using the following equation:
t66'
1s'mbl l!t!!!!lîf
o Ha!ñat.r
g H.oÉ rôd
Gl€iôllill
Figure 4. Locotion of piezometers.
T -Tcvs=ffu'where Ta, *d Tr, *" the time factors attimesto and t' respectively.' This procedure led to an^ average field valueof cys = 350 + 50 x 10-4 cm'fsec. The agree-ment
-between the theoretical isochrone computed
27
I .¡ncrala û0t ruccd of¡ oreo dnarer¡eloh€le15 ,ocoled ùnlri lhrd pour
5¡ñor.d Êeov. ol Soñd srrorÙrí\
fop of Cloy(ssc - 2)
io .ÊsEp Ði--õõi---- Nw
re63 | rsetI rs64
Figure 5. Pore pressures ond verticol movements.
Negotive excess pore pressures, lt. H20
Figure ó. Meosured pore pressures ot 15 ond 105 doys,

ooI
I
II,l
_lI
.i
Figure 7. Meqsured ond compufed pore Pressures ofter 105 doys'
usingthisvalueofcvsandthemeazuredporeplessuresatt=l0Sdaysisshov/ninFigure ?. tne agreeirãnt is quite good for the lower three piezometers' The top pi-
ãuã*"t"" is mucñ more sensilive to errors in the assumed steady-state pore p-ressures'
;hì;îi; probably why it does not show good agreement. Th_e apparent field val-1e of cvs
is about 6 times ttt" iuã""g"1aroratory"vatue. tire remainder of the paper will discuss
possible reasons for this discrepancy'
PoSSIBLECAUSESoFDISCREPANCYBETWEENLABANDFIELDVALUESpossible reasons for the large difference between the average lab value of cvs (60 x
ro-?iã"litte value ¡r"L-iigo""ãf"o* fieid data (350 x 10-a) include the following:
1. SamPle disturbance,2. LaboratorY test Procedures'3. Errors in field measurements, and
4. Use of one-dimensional consolidation theory'
Disturbedsoilsamplesgivelowervaluesofcu.Taylor(?)showeda4O-foldde-crease in cy after renäotdiñg a sample of Roston blue clay. Sample disturbance is un-
d;ñ"dtt råsponst¡ie for sõme of the scatter in cv va1ues shown in Figure 2'
A value of cy corrected for disturbance can be obtained by estimating the effect of
disturbance on r< and arr. The major change is the decrease in k resulting from the
lower void ratio at any'given consolidatioñ press-ure. A plot of e vs k cal be used to
estimate the magnitu¿'"ît tiri" effect. A corrected compression curve (!) .can be used
i" "¡t*i" a bettei value of ay. The new values of k and ây cân then be used to recom-
pute an undisturbed cy:
(cu)r, = (cy)¿ Hffiwhere subscript u refers to undisturbed conditions and subscript d refers to the dis-
turbed laboratorY samPle'Calculations usingtïis procedure indicated that the effect of sample disturbance on
thelabvaluesofcyis*itt'lntherangeofexperimenta.lerrorgiveninTablel.
lo5 dot '¡ochroñ. -4 ! -lo. cv3: 550 r lO €ñ, /s.c

I
I
I
t
1
ì.l
ìII
Ì
i
l.lI
l'.tÌ
ìI
ì
I
.lI
29
Laboratory Test Procedures
Lambe (5) discussed the differences in stress paths between la.boratory tests and
actual field conditions. In order to predict field behavior accurately, laboratory testsshould in general follow the field stre.ss path as closely as possible. However, thisprocedurJwil not, in general, provide áccurate cy data. For example, Lamb¡r. Q)
d"-scribed another M.I.T. building excavation (Center for Advanced Engineering Study)'
located across Massachusetts Àvenue from the Student Center (see Fig' 1), where an
oedometer test that duplicated the field vertical stress release gave a value of cvs =
B x 10-a cm'fsec. Thii value is a factor of 100 less than the value back-figured fromfield data.
Standard oedometer tests use a stress-increment ratio (Ào/õ) of one' It has been
shown that for smaller values of stress-increment ratio the Terzaghi consolidationtheory does not apply (2, ?). However, the actual value of Ao/A in the fieid is frequentlyless tïa¡ one, att-d it u*i"" with depth. A technique for correcting laboratory data totake this effect into account is not currently available. Hence, it is necessary to use astress-increment ratio of one in laboratory tests in order to obtain cu values that ap-pear reasonable.
Another factor that influences the laboratory value of cy is the curve-fitting methodused. The r/T fitting method generally gives a value of cu a.bout 50 percent higher thanthe log t method for-Boston blue clay (!). Values from the two methods were generallyaveraged to give the cy val.ues used in this paper'
Thé calculation of c,,. from oedometer tests is frequently difficuit, because swellingcurves tend to deviate iïuch more from the theoretical time curves than do compressioncurves. Perhaps an equally valid procedure would be to calculate c.1rs from measuredvalues of cys, iys, atrd ays. If all of the values are chosen at the same average voidratio, then'ii'caiile assurned that k is the same for both compression and swellingwith-out introducing a significant error. Then cys ca¡r be calculated as follows:
cvs = cvc (ffi)
Application of this procedure to the laboratory data on Boston'blue clay yields an aver-age value of cys = i00 + 5¡ x 10-a cm'f sec, almost two times higher than the averagevalue calculated from time-swelling curves.
Errors in Field Measurements
The field value of cvs relies on accurate piezometer data. The estimated accuracyof the measured pore piessu""s is t 0.25 ft. The time lag for the piezometers is lessthan 24 hr for 90 percent equalizationof pore pressure.
The assumed initial pore pressures may have been in error, although the distributionused is more likely to have underestimated the field cys than overestimated it'
Use of One-Dimensional Consolidation Theory
Most settlement problems are solved by use of the Terzaghi one-dimensiona.l theory.Significant errors in rate of settlement predictions can result from this assumption.Ripid advances, using numerica-L methods, are being made in the application of three,-dimensional consolidãtion theory to settlement problems. In the near future, the soilengineer may routinely use these three-dimensional analyses for settlement predictions.Solutions currentty avâilabl" can be used to estimate how much of the sixfold discrep-ancy between predicted and observed rates of pore pressure dissipation at the Student
Center can be attributed to three-dimensional effects.The importance of two- or three-dimensional drainage will.increase as (a) the ratio
of horizontal permeability to vertical permeability increases (t<¡1t<u¡, and (b) the ratioof vertical drãinage pathlo radius of loaded a¡ea increases (u/a).

30
The field permeability of Boston blue clay, measured by falling-head tests on pi-ezometers, is 2-3 x 10-'cm/sec, which is about 6 to 8 times greater than the verticalpermeability measured on laboratory samples. To some extent the meazured fieidpermeability probably reflects the existence of thin silt seams that act as drainagelayers.
Davis and Poulos (8) recommend using an average value of permeability to calculatea three -dimensional cn:
l- _Áâv -
The rezuIting equation for computing (cys), from measured oedometer values of (cvs)ris
| /l + ,r\ kav , ,(cvs/s=Th_r/Ç("u"t'
Assuming u =t/r, kf, = 9ky, and (cvs), = 60 x t0-a cm'f sec', this gives an estimated insitu (cys). = 130 x-t0-* cmz/sec.
In actuality, the Student Center excavation would not at first glance appear to havesignilicant three-dimensional effects. The vertical drainage path is 33 ft and the equiv-alént radius is 112 ft, giving avalue of.H/a = 0.29. However, curves givenby Gibsonet af (9) indicate that the rate of settlement, even with these dimensions, may be twiceas fast as predicted by one-dimensional theory. This calculation assumes that k¡ = ¡u.When the effect of anisotropic permea.bility is added, an I'equiva.lent" one-dimensionalcys of about 250 x 10-a cm'/sec is obtained. Considering the assumptions required toobtain this rezuIt, the rather close agreement with the field value must be consideredfortuitous. However, it does indicate that three-dimensional consolldation effects maybe able to account for the large discrepancy between laboratory and field values of cysat the Student Center.
The preceding analysis was made for one foundation, and is not intended to implythatthe rezuIts are generally applicable. However, the authors hope that numerous zuchanafyses, combined with advances in three-dimensional consolidation theory and ad-vances in field meâsurements of soil properties will lead to better techniques for makingsettlement predictions.
CONCLUSIONS
1. Field rates of excess pore pressure dissipation measured in Boston blue claygave a value of crrs for swelling of 350 x 10-" cm"/sec, using a one-dimensionalanalysis.
2. Although the discrepancy cannot be definitely attributed to any one cause, three-dimensional drainage seems the most likely reason. The difficulty of obtaining an ac-curate value of cys from laboratory time-swelling curves appears also to be an impor-tant factor.
ACKNO'WLEDGMENTS
The zuccess of the FERMIT program is the result of numerous individual contribu-tions. Inparticular, A' A. cass (10) andK. C' de Fries-VonArnim (11) studiedtheStudent Center project for their graduate theses. Other present and former membersof the M.I.T. sta-ff whohadprominentroles are Harry M. Horn (formerly AssistantProfessor of Civil Engineering), Charles C. Ladd, L. A. Wolfskill, U. Luscher (form-erly Assistant Professor of Civil Engineering), R. S. Ladd, W. R. Beckett, a¡rdN. F.Braathen. The M.I.T. Office of Physical Pla¡rt has provided continuous support and
encouragement for FERMIT. Philip A. Stoddard, Vice-President, and William R.Dickson, Assista¡rt Director of Physical Plant, have been especially helpful.
i-t-i-I
II
l'I
I

31
3.
4-
5.
6.
7.
L
9.
10.
11.
REFERENCES
1. Ladd, c. c., and Luscher, u. Engineering Properties of the soils underlyingthe M.I.T. Campus. M.I'T. Dept. of Civil Engineering Res' Rept' R65-58,Dec.1965.
2. Taylor, D. W. Research on consolidation of clays. M.I.T, Dept, of civil Engi-neering, Serial 82, Aug. 1942.
Lambe, i. W., andWhitma¡r, R. V. AnlntroductiontoSoilMecha¡rics, Ch. 27.
JohnìViley and Sons, Iac.' inpress.Schmertma¡n, J. H. The Undisturbed Consolidation Behavior of Clay. Trans.
ASCE, VoI. 120, p. 120X-1233, 1955.Lambe,
-T, William, Stress Path Method. Proc. ASCE, Jour. Soil Mech. and
Found. Div., Vol. 93, No. 5l\46, p. 309-331, Nov. 1967.Lambe, T. William. The Behavior of Foundations During Construction. Proc.
ASCE, Jour. SoiIMech. andFound. Div., Vol.94, No. SM1, p.93-130, Jal'1968.
Leonards, G. 4., and Girault, P. A Study of the One-DimensionaL ConsolidationTest. Proc. Fifth Internat. Conf . on Soil Mech, and Found. Eng., Vol. 1, p'213-218, Paris, 1961.
Davis, E. H., and Poulos, H. G. The Analysis of Settlement Under Three-Dimen-sional. Conditions. Symposium on Soft Ground Engineering, Brisbane, 1965.
Gibson, R. E., Schiffman, R. L., and Pu, s. L. Pla¡re strain andAxially-sym-metric Consolidation of a Clay Layer of Limited Thickness. Univ. of lll.inoisatChicago Circle, ,MATE RePt. 67-4.
Gass, A. A. Coniparison of Theoretical and Observed Performance of the M.I.T.Student Center Foundations. M.S. thesis in Dept. of Civil Engineering, M.I.T.,1964.
De Fries, K. S. The Prediction of Heaves and Pore Pressures Induced by Exca-vations in clay. civil Engineers thesis in Dept. of civil Engineering, M.I.T,,196?.
DíscussíonROBERT L. SCHIFFMAN, University of trlinois at Chicago Circle-The authors are tobecongratulatedonpointing@contributetothediscrepancybe-tween laboratory and field values of cy. They have noted that one of the reasons fordi.fferencesbetweenlaboratoryald field values of the coefficient of consolidation is thethree-dimensional consolidation effect, It is to this general point that this discussionis directed.
The coefficient of consolidation, cu, is defined (13) as
kî-_-7wm
where k is a coefficient of permeability, m is the compressibility, and 7w is the unitweight of water. For cy to be theoretically the same in both the field and the labora-tory, one of two conditions must be satisfied. First, if cy w€rê a fundamental soilproperty, its value would be independçnt of the measurement conditions. If cy is not aiunâamental soil property, then the same value can be expected theoretically only if the
k a¡rd m were of ttre lame magnitude in the la.boratory and in the field. That is, if the
boundary conditions in both the field and the laboratory were the same, one could expectk a¡rd m to theoretically have the same values. On the other hand, different boundaryconditions would provide different values for k and m.
In the conventional oedometer test, the value of the coefficient of permeability isrestricted to the vertical component ky. For a natural. soil, consolidated in a triaxial
(1)

32
device, or in the field, there are at least two va-lues of the coefficient of permeability:the vertical permeability, ky, and the horizontal permeability, k¡. Unless the soil isisotropic with respect to permeabì.lity there are, due to this effect alone, two possiblecoefficíents of consolidation:
for verticaL flow of water, a;rd
kv
" 7wffi
kh,. 7wm
(za)
(2b)
(5a)
(5b)
(5c)
(6a)
(6b)
for lateral flow of water.The compressibility, rn, is a factor that depends on the geometry of the loading and
the boundary conditions, independent of the permeability. To show this, consider theconsolidation of a clay layer of thickness h when the loading extends indefinitely on thesurface (9). The governing consolidation equation is
where k is the coefficient of permeability, u is the excess pore pressure, and e is thedilatation of the soil skeleton. The dilatation is defined as
e = êxx + eyy+ ezz
where e¡¡, €yyr artd evs are the normal strains of the soil skeleton.Assume thai the soil skeleton is elastic. Then the effective stress-strain relations
are
Ee** = o-$ç-u(o{y*oåz)
(3)k ð2u òe
- -ft¡¡ ò2" òt
(4)
E"yy
Eezz
ojt - vGÇ+ ois)
oi7-uGþç+ofy)
I
i
I
I
!
I
t-I
Iwhere Ç, oTv, and o'7,¿ are the normal effective stress components, and E and u areYoungts modúIus and Poisson's ratio, respectively, of the soil skeleton.
The oedometer provides axially symmetric compression with frictionless sides.Thus, o{^¡ =o'rr. The stress-strain relations are
and
Since the lateral strain err = 0, then
orr tzz
The dilatation, e, is equal to the vertical *rain, e77,Eqs. 6b and 7
Eerr = $-v)ofu-vozz
Eezz = oLz-2uoir
ut-u
in the oedometer. Thus from
(7)

33
(8)
From the effective stress principle
ÇZZ = O'72+u (e)
where 6,2v is the vertical total stress. Suþstituting the effective stress Eq. I into Eq.
I and then into Eq. 3 results in
(10a)
(10b)
where
The vertical strain is
Ezz =
a¡d the settlement, p, is
"'u =#Then
/¡\ (l-2ù11*,ùorup\t/ = - E(1 :r)
The degree of consoiidation, U, is defined as
u = pJt¡p(')
l"o, "\\n"' rt/
is
ozz
(12)
(1 3)
*,1, , (#, Ð]
¡,lI
II
,j.:I
lì
I'II
I.. i"..1
(15)
f, ln ,u,o
It
I
1
-{
I
I
(14)rn ,,o
- F)dz
(t-zv) (1+u) ,e = ---',:;l- ozz
^ òfu-òu*o òz' èt
kE(l - u)co = llT-tøl-ñlif the applied load intensity is time-independent. The coefficient co is the coefficÍentof c.onsolidation for the oedometer.
The solution to Eq. 10a ls of the form
u=uoF
where the initial excess porê prêg$rrê, ue,
(11a)
llo =
(l-2v)(t+v)E(1 - y)
(1lb)
which becomes
u(t) =1- (1 6)
.L.l
I
I
-lI
-l
l
,l
34
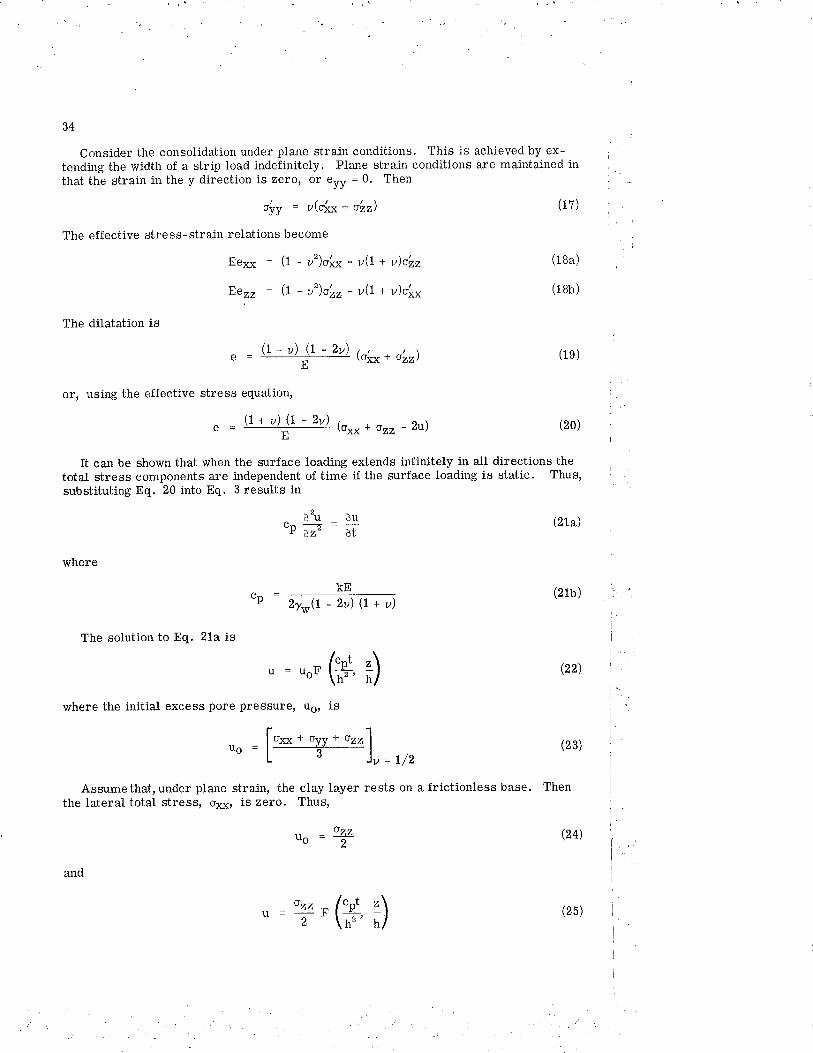
Consider the consolidation under plane strain conditions. Thls is achieved by ex-tending the width of a strip load indefinitely. Plane strain conditions are maintained inthat the strain in the y direction is zero, or ett = 0. Then
siy = v(dv+ oLz)
The effective stress-strain relations become
Ee¡ç, = í-u1dÆ-uí+ùoLz
Eezz = (l - v')oLz - y$ + v)Ç
The dilatation is
(1+ u) í _ zv) Gfu¡+ o*y)t=
E
or, using the effective stress equation,
^ _ (1+y)(1 -2v) t
" = ff \oor+orr-2u)
The solution to Eq. 21a is
" = """ (#,
where the initial excess pore pressur€, üs, is
(1e )
(17)
(18a)
(18b)
(22)
(20)
It can be shown that when the zurface toading extends infinitely in all directions thetotal stress components are independent of time i.f the zurface loading is static. Thus,substituting Eq. 20 into Eq. 3 results in
(21a)
where
cp=2yw$ - zù (t + v)
(2lb)
du duUs---P òz' òt
KE
Assumethat,under plane slrain, the clay layer rests on a frictionless base. Thenthe lateral total stress, sxlr, is zero. Thus,
üo=
Ð
ry,(H,;)
(2 3)
(24)ozz2
fo*** oyy*orrlL--------5-- ), = t/z
and
(25)

The consolidation settlement of the surface is
p(t) _ p(o) _ 2(1 _ zyr (1+ y) {^ lry
_ ,]*
and the degree of consolidation, Û, is defined as
ú(t) = #ïE- -h
u(t) = r-+J Faz.,o
35
(2 6)
(33)
(34)
Thus,
where
Consider the consolidation of a layer under an axialiy symmetric loading. The ef -fective stress-strain relations are given by Eqs, 6a and 6b. The diiatation is then
Ee = (1 - 2v) Gzz + 2o¡p - 3u) (2e)
In this case, the load of indefinite extent is achieved by expanding the radius of acircular load to infinity. Thus Fq. 3 takes the form
à2u òuC--=-' àz' òt
KEcr = gn¡¡ G-lTÐ
(27)
(28)
(30a)
(3ob)
(31)
(32)
,i,-l
I
i
I
I
;ì
l
I
l
The solution is'
u = uo' (#, i)For a smooth-based layer the lateral stress, orr, is zero. Then the initial excess
pore pressure, uo, is
""=ryThus the consolidation settlement of the surface is
p(t) _ p(o) = a? {,\ry_ "]u"
The degree of consolidation, Ú, is then
ú(t) = t -f, /h ra,
Since Eqs. !6, 28, and 34 are identical in form, the relationships between the de-grees of cõnsoiidation for the three cases consÍdered follow from the relationship
36
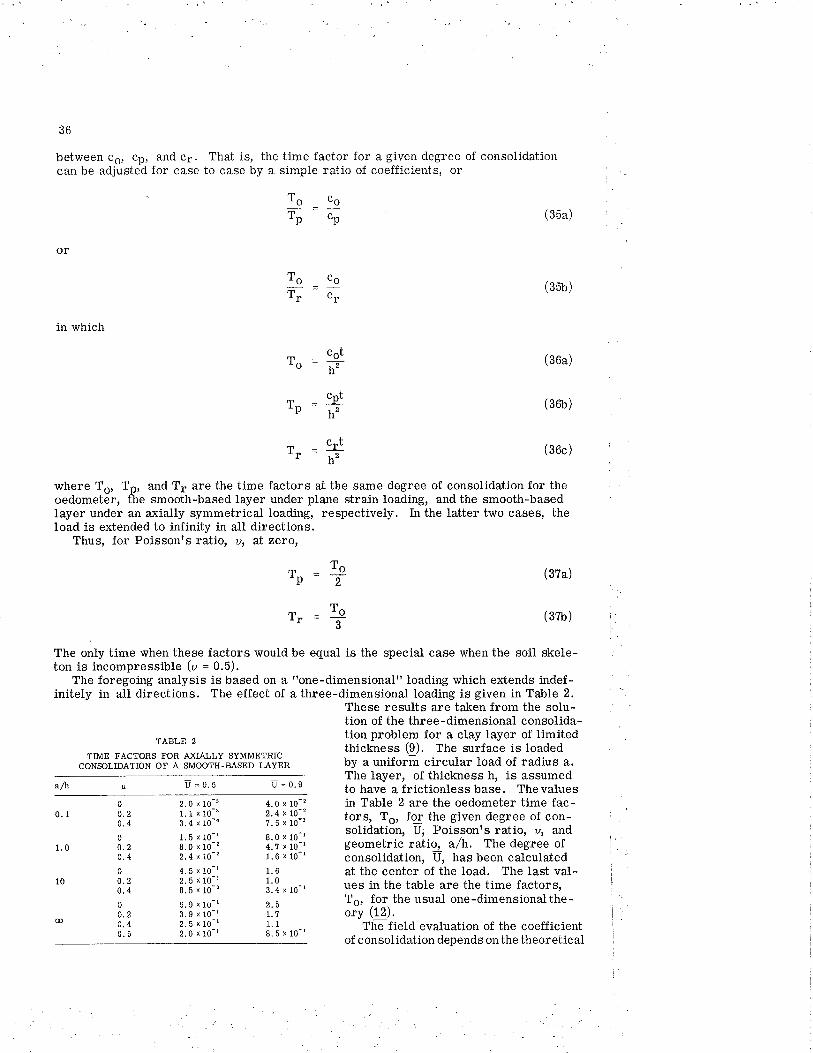
between ce¡ cpr and c¡. That is, the time factor for a given degree of consolidationcan be adjusted for case to case by a simple ratio of coefficients, or
in which
To co
5="t
To co
Tr cr
- cot-ïã-
( 3ba)
(35b)
(36a)
(36b)
(36c)
(37a)
(37b)
To
Tp =uh2
where Ts, Tp, and T¡ are the time factors at the same degree of consolidation for theoedometer, fhe smooth-based layer under plane strain loadiag, and the smooth-basedlayer under an axially symmetrical loading, respectively. In the latter two cases, theload is extended to infinity in all directions.
Thus, for Poissonrs tatio, r.t, àt zeto,
c-tõ_rt" - ht
Tp
Tr
=To2
=To3
The only time when these factors would be equal is the special case when the soil skele-ton is incompressible (v = 0.5).
The foregoing analysis is based on a "one-dimensionalil loading which extends indef -initely in all directions. The effect of a three-dimensional loading is given in Table 2.
¡ t=0.5 Ú=0.e
These rezuIts are taken from the solu-tion of the three-dimensional consolida-tion problem for a clay layer of limitedthickness (9). The surface is loadedby a uniform circular load of radius a.The layer, of thickness h, is assumedto have a frictionless base. Thevaluesin Table 2 a¡e the oedometer time fac-tors, Ts, for the given degree of con-solidation, U; Poissonts ratio, u, andgeometric ralio, a/h. The degree ofconsolidation, U, has been calculatedat the center of the load. The last val-ues in the table are the time factors,To, for the uzual one-dimensionalthe-ory (1:l).
The field evaluation of the coefficientof consolidation depends onthe theoretical
TÀBLE 2
TIME FACTORS FOR ÆíÀLLY SYMMETRICCONSOLTDATION OF A SMOOTH-BASED LAYER
alt00,20.4
00.20.4
0.0.20.4
00.20.40.5
2.0 x 10⁻³¹. I x 1o-'3. 4 x 10-{
1. 5 x l0-r8.0 x 10-z2.4 xl0-2
4.5 x 10-r2. 5 x 1o-t8. 5 x 1o-'s.9 x 1o-'3. I x 10-¡2. 5 x 10-r2.0 x 10-r
4. 0 x l0-22.4 x 1O-2?.5 x 1O'3
8.0 x 10-t4. ? x 10-11. 6 x lo-t1.61.03.4 x 10-r
2.51.?1.18,5x10-r

37
value of the time factor for a particular degree of consolidation. This value is a func-tion of the geometric ratio, a/h. The time factor, To, for 50 percent consolidation andpoissonts iatio of 0.4 can vary by a factor of approximately 250 for a geometric ratiochange of 100 (fa¡te Z). For 90 percent consol.idation the factor is approximately 45 fora geõmetric ratio change of 100. Thus, as elçected, the higher the degree of consoli-ditÍon, thecloserthetimefactors. Aspointedoutbytheauthors,thethree-dimensionaleffectîill seriously influence the basis for evaluating the coefficient of consolidation.
This shows two of the many factors involved in the evaluation of the coefficient of
consolidation. The first of these concerns the definition of this coefficient. It is seen
that the coefficient of consolidation depends on the anisotropy of permeability and the
definition of compressibitity. This latter property depends on the nature of the surfaceloading and the bõundary conditions of the clay layer. This means that the coefficientof consolidation is not a fundamental soil property. As such, values meazured underdifferent conditions will be different.
The second factor is the three-dimensional effect. That is, the curve-fitting at aspecific degree of consolidation will have to be based on different time factors that de-pãnd on thJeffective stress-strain properties, the type of loading, the boundary condi-tions of the clay, and the load width to layer-thickness ratio.
Al1 in all, eíen with perfect sampling, perfect field measurements, and perf.gct test-ing, there is no reason lo expect thtt the coefficient of consolidation determined in the
field and in the taboratory will be the same, In fact, they should be different.
Reference
12, Terzaghi, K. Die Berechnung der Durchlassigkeitsziffer des Tones aus demverlauf der Hydrodynamischen sþannungser -scheinungen. Akademie desWissenschaJten in ùein, Sitzungsberichte, Mathematish-naturwissenscha.ftlicheKlasse, Part IIq 132, No. 3/4, p. 125-138, 1923.