
Kristen Diedrich March 12, 2012. Outline Perception of electric vehicles Types of electric vehicles...
20
Environmental Impact of Electric Vehicles Kristen Diedrich March 12, 2012
-
Upload
francis-summers -
Category
Documents
-
view
223 -
download
0
Transcript of Kristen Diedrich March 12, 2012. Outline Perception of electric vehicles Types of electric vehicles...

Environmental Impact of Electric Vehicles
Kristen DiedrichMarch 12, 2012

OutlinePerception of electric vehiclesTypes of electric vehiclesComparison of environmental impactCost ComparisonPossible future improvements

How environmentally friendly are electric cars?

Articles about Electric Cars“Why Electric Vehicles Will Reduce Greenhouse Gas
Emissions”-Renewable Energy World
“Electric Cars Hold Greater Promise for Reducing Emissions and Lowering US Oil Imports, Study Finds”
-Science Daily“Do Electric Cars Really Produce Fewer Emissions?”
-The Guardian“Electric Vehicles Losing Their ‘Zero Emissions’ Claim in
U.S.”-Inside Climate News
“Electric Car Use May Increase Carbon Emissions”-Energy Boom

Zero Emissions?Nissan Leaf Commercial:http://www.youtube.com/watch?v=BhSqI77aLHU
Zero-Emissions Vehicle“Vehicles which produce no emissions from the on-
board source of power”-California Air Resources
Board
What is the problem with this definition?How do we calculate “actual” emissions?

Types of Electric VehiclesHybrid Electric Vehicle (HEV)
Plug-in Hybrid Electric Vehicle (PHEV)
Plug-in Electric Vehicle (PEV or EV)
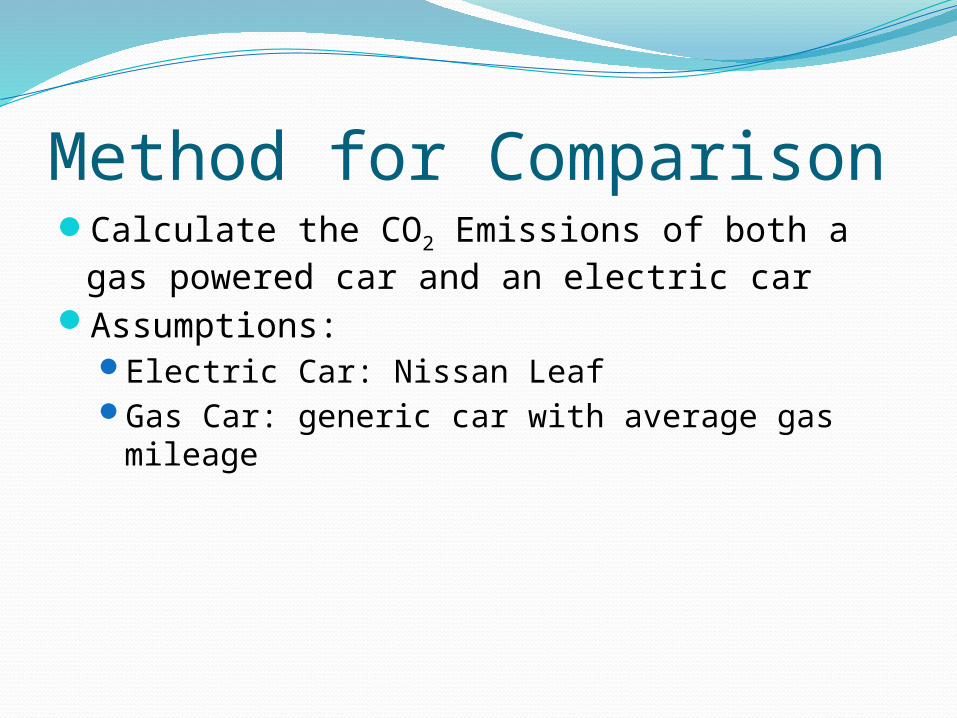
Method for ComparisonCalculate the CO2 Emissions of both a gas
powered car and an electric carAssumptions:
Electric Car: Nissan LeafGas Car: generic car with average gas mileage

Manufacturing-Related EmissionsGas Powered Vehicle:
12,000 lbs CO2 per carElectric Vehicle:
28,000 lbs CO2 per car
Main difference: internal combustion engine vs. lithium ion battery

Gas Powered Vehicle EmissionsAssume:
19.4 lbs CO2 per gallon of gasoline
22.4 miles per gallon
19.4 𝑙𝑏𝑠1 𝑔𝑎𝑙𝑙𝑜𝑛 x 1 𝑔𝑎𝑙𝑙𝑜𝑛22.4 𝑚𝑖𝑙𝑒𝑠 = 0.866 lbs CO2 per mile

Electricity SourcesCoal 44.9%
Natural Gas 23.4%
Nuclear 20.3%
Hydroelectric
6.9%
Other 4.5%
Emissions:Coal: 2.17 lbs CO2 per kWh producedNatural Gas: 1.40 lbs CO2 per kWh producedAssume zero emissions for other sources
Average US CO2 emissions from electricity:(2.17)(0.449) + (1.4)(0.234) = 1.30 lbs CO2 per kWh produced

Electric Vehicle EmissionsAssume:
34 kWh per 100 miles80% Efficiency
(34 kWh)/0.80 = 42.5 kWh needed to travel 100 miles1.30 𝑙𝑏𝑠1 𝑘𝑊ℎ x 42.5 𝑘𝑊ℎ100 𝑚𝑖𝑙𝑒𝑠 = 0.553 lbs CO2 per mile
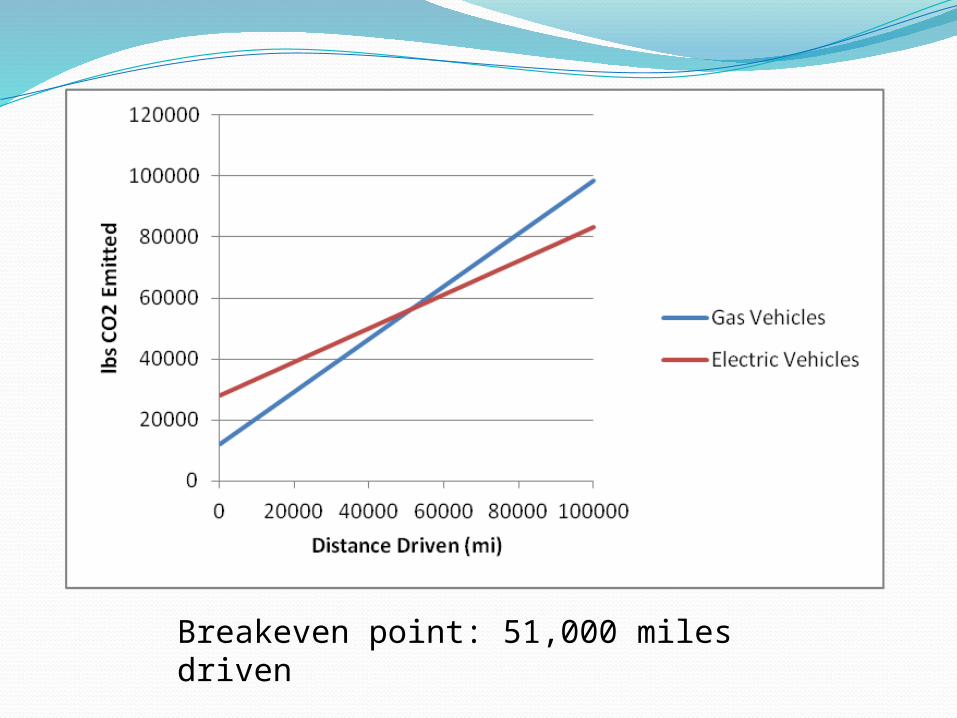
Breakeven point: 51,000 miles driven

What if…All of your electricity comes from coal?
2.17 lbs CO2 per kWh produced0.922 lbs CO2 per mile driven
Remember, gas powered cars produce 0.866 lbs CO2 per mile driven
In this situation, gas powered vehicles have a smaller carbon footprint than electric vehicles

What if…50% of your electricity is from renewable
resources?33% from coal, 17% from national gas0.954 lbs CO2 per kWh produced0.405 lbs CO2 per mile driven
Breakeven point with gas powered vehicles: 35,000 miles driven

What if…You live in Wisconsin?
63% from coal, 9% from natural gas1.49 lbs CO2 per kWh produced0.635 lbs CO2 per mile driven
Breakeven point with gas powered vehicles: 69,000 miles driven

Economic Analysis54% of people are willing to consider buying
an electric vehicleOnly 9% willing to pay more than $2,000
extra for an EVCurrent cost for a Nissan Leaf: $35,200Average cost of a new car: $29,000

Fuel Cost ComparisonAverage Gas Price: $3.80 per gallon
Average Electricity Price: $0.12 per kWh
$3.801 𝑔𝑎𝑙𝑙𝑜𝑛 x 1 𝑔𝑎𝑙𝑙𝑜𝑛22.4 𝑚𝑖𝑙𝑒𝑠 = $0.17 per mile
$0.121 𝑘𝑊ℎ x 42.5 𝑘𝑊ℎ100 𝑚𝑖𝑙𝑒𝑠 = $0.05 per mile

Breakeven Point: 52,000 miles driven
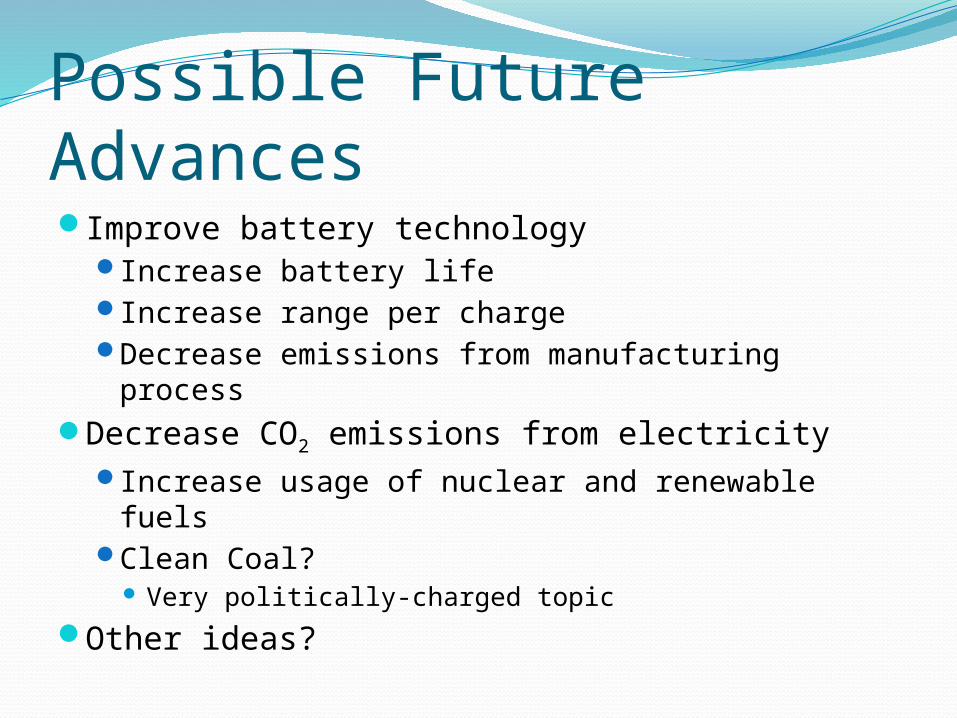
Possible Future AdvancesImprove battery technology
Increase battery lifeIncrease range per chargeDecrease emissions from manufacturing
processDecrease CO2 emissions from electricity
Increase usage of nuclear and renewable fuelsClean Coal?
Very politically-charged topic
Other ideas?

Questions?