
Comparison between Battery Electric Vehicles and Internal ... · Vehicles and Internal Combustion...
71
Comparison between Battery Electric Vehicles and Internal Combustion Engine Vehicles fueled by Electrofuels From an energy efficiency and cost perspective Master’s Thesis in Sustainable Energy Systems TOBIAS GUSTAFSSON & ANDERS JOHANSSON Department of Energy and Environment CHALMERS UNIVERSITY OF TECHNOLOGY Master’s Thesis FRT 2015:02, Gothenburg, Sweden 2015
Transcript of Comparison between Battery Electric Vehicles and Internal ... · Vehicles and Internal Combustion...

Comparison between Battery ElectricVehicles and Internal CombustionEngine Vehicles fueled by ElectrofuelsFrom an energy efficiency and cost perspective
Master’s Thesis in Sustainable Energy Systems
TOBIAS GUSTAFSSON & ANDERS JOHANSSON
Department of Energy and EnvironmentCHALMERS UNIVERSITY OF TECHNOLOGYMaster’s Thesis FRT 2015:02, Gothenburg, Sweden 2015


Master’s Thesis FRT 2015:02
Comparison between Battery Electric Vehiclesand Internal Combustion Engine Vehicles fueled
by Electrofuels
From an energy efficiency and cost perspective
TOBIAS GUSTAFSSON & ANDERS JOHANSSON
Department of Energy and EnvironmentDivision of Physical Resource Theory
Chalmers University of TechnologyGothenburg, Sweden 2015

Comparison between Battery Electric Vehicles and Internal Combustion EngineVehicles fueled by ElectrofuelsFrom an energy efficiency and cost perspectiveTOBIAS GUSTAFSSON & ANDERS JOHANSSON
© TOBIAS GUSTAFSSON & ANDERS JOHANSSON, 2015.
Supervisor: Fredrik Ekström, Volvo Car CorporationExaminer: Maria Grahn, Department of Energy and Environment
Master’s Thesis FRT 2015:02Department of Energy and EnvironmentDivision of Physical Resource TheoryChalmers University of TechnologySE-412 96 GothenburgTelephone +46 31 772 1000
Cover: Schematic pathway for renewable electricity to electrofuels or BatteryElectric VehiclesGothenburg, Sweden 2015
iv

Comparison between Battery Electric Vehicles and Internal Combustion EngineVehicles fueled by ElectrofuelsFrom an energy efficiency and cost perspectiveTOBIAS GUSTAFSSON & ANDERS JOHANSSONDepartment of Energy and EnvironmentChalmers University of Technology
AbstractIncreasing the share of renewable energy used in the transport sector is seen as animportant step to globally reduce greenhouse gas emissions. Battery electric ve-hicles have for a long time been seen as a solution if the electricity is producedby renewable sources, but still suffers from high battery costs and short range is-sues. As a way to overcome these issues and at the same time keep current carinfrastructure, renewable electricity can be used to create synthetic fuels, denotedelectrofuels, that are usable in already existing internal combustion engines. Thisstudy have investigated which of the two alternatives that would be preferable indifferent scenarios where both car size and driving pattern is compared. Individualcar models have been created and used in different driving cycles to find the specificenergy use. Investment and production costs related to electrofuel manufacturinghave been estimated to find total cost and energy use. The results show that theBEV is more energy efficient in all investigated scenarios while, however, using elec-trofuels can in most driving conditions be a more economic solution. A large scaleimplementation of electrofuels indicate a tremendous increase in electricity demand,where for example 30-93% (depending on fuel type, car size and driving cycle) ofthe Swedish power production would be needed to be able to produce electrofuelsfor the entire Swedish passenger car fleet.
Keywords: electrofuels, BEV, e-methanol, e-diesel, e-petrol, driving cycles.
v


AcknowledgementsWe would like to give a special thanks to our supervisor at Volvo Car Corporation,Fredrik Ekström, who has helped us with everything from ideas, modelling, dataand getting in touch with the right people at the company. We also want to thankour group 97624 for help throughout the project and for the weekly fika meetings.We would also like to thank people at Volvo who in different ways have helped uswith information, data and advice: Hans Pehrson, Sören Eriksson, Lisa Jacobssonand Rickard Arvidsson. Our opponent Chantut Rungruengsaowapak should have aspecial tanks for contributing to the final layout of the report.
We would like to give our supervisor and examiner Maria Grahn a big thank formodeling advice, guidance and aid with the report as well as being a well neededmood booster in times of problems.
Tobias Gustafsson & Anders Johansson, Gothenburg, June, 2015
vii


Contents
1 Introduction 11.1 Aim of the project . . . . . . . . . . . . . . . . . . . . . . . . . . . . 21.2 Restrictions . . . . . . . . . . . . . . . . . . . . . . . . . . . . . . . . 21.3 Research questions . . . . . . . . . . . . . . . . . . . . . . . . . . . . 31.4 Report layout . . . . . . . . . . . . . . . . . . . . . . . . . . . . . . . 3
2 Background 52.1 Electrofuels . . . . . . . . . . . . . . . . . . . . . . . . . . . . . . . . 5
2.1.1 Production overview . . . . . . . . . . . . . . . . . . . . . . . 62.1.2 Methanol . . . . . . . . . . . . . . . . . . . . . . . . . . . . . 72.1.3 e-petrol and e-diesel . . . . . . . . . . . . . . . . . . . . . . . 9
2.2 Battery Electric Vehicles . . . . . . . . . . . . . . . . . . . . . . . . . 92.3 Driving cycles . . . . . . . . . . . . . . . . . . . . . . . . . . . . . . . 102.4 Volvo vehicles . . . . . . . . . . . . . . . . . . . . . . . . . . . . . . . 12
3 Methods 133.1 VC-model tank-to-wheel . . . . . . . . . . . . . . . . . . . . . . . . . 13
3.1.1 Internal combustion driven cars . . . . . . . . . . . . . . . . . 133.1.2 Battery electric vehicle model . . . . . . . . . . . . . . . . . . 163.1.3 Efficiency calculations . . . . . . . . . . . . . . . . . . . . . . 173.1.4 VC-model fuel adaptions . . . . . . . . . . . . . . . . . . . . . 18
3.2 Economic and energy use model GTT . . . . . . . . . . . . . . . . . . 193.2.1 Car cost . . . . . . . . . . . . . . . . . . . . . . . . . . . . . . 193.2.2 Grid-to-wheel efficiency . . . . . . . . . . . . . . . . . . . . . . 203.2.3 Fuel cost model . . . . . . . . . . . . . . . . . . . . . . . . . . 213.2.4 Grid-to-wheel electricity consumption . . . . . . . . . . . . . . 21
4 Results 234.1 Tank-to-wheel . . . . . . . . . . . . . . . . . . . . . . . . . . . . . . . 23
4.1.1 Energy use . . . . . . . . . . . . . . . . . . . . . . . . . . . . . 234.1.2 Efficiency . . . . . . . . . . . . . . . . . . . . . . . . . . . . . 244.1.3 Fuel consumption . . . . . . . . . . . . . . . . . . . . . . . . . 264.1.4 Range . . . . . . . . . . . . . . . . . . . . . . . . . . . . . . . 27
4.2 Grid-to-wheel . . . . . . . . . . . . . . . . . . . . . . . . . . . . . . . 274.2.1 Car cost . . . . . . . . . . . . . . . . . . . . . . . . . . . . . . 284.2.2 Electricity consumption . . . . . . . . . . . . . . . . . . . . . 30
ix

Contents
4.3 Resources and cost perspectives . . . . . . . . . . . . . . . . . . . . . 314.3.1 How much electricity is required to provide Sweden with elec-
trofuels? . . . . . . . . . . . . . . . . . . . . . . . . . . . . . . 324.3.2 How many BEV’s could one e-methanol factory represent? . . 324.3.3 What is the water and carbon dioxide demand for e-methanol? 33
4.4 Sensitivity analysis . . . . . . . . . . . . . . . . . . . . . . . . . . . . 344.4.1 Electricity price . . . . . . . . . . . . . . . . . . . . . . . . . . 344.4.2 Battery price . . . . . . . . . . . . . . . . . . . . . . . . . . . 354.4.3 Electrolyzer efficiency . . . . . . . . . . . . . . . . . . . . . . . 354.4.4 Capacity factor . . . . . . . . . . . . . . . . . . . . . . . . . . 36
5 Discussion 37
6 Conclusion 41
List of Figures 41
List of Tables 44
References 49
A Appendix 1 I
B Appendix 2 VII
x
1Introduction
The ambitions of the Swedish Government are zero net emissions of greenhousegases (GHG) for Sweden in 2050 [1]. The vehicle fleet for road based transportshould be independent of fossil fuels by 2030 [2], which in the Swedish governmentalinvestigation (FFF-utredningen) was defined as that road based transport shouldreduce their emissions of GHG by 80% [3]. Increased integration of renewable energysources is seen as the important step to reach these lower targets on GHG emissionsin the future.
Passenger and freight transports contributes to 19% of the energy use and 23%of energy related CO2 emissions globally [4]. With the global growth of populationand economy there are many projections on a great increase of energy use and CO2emissions from the transport sector in the future [5]. This is a global challenge andthe EU states that all transport related GHG emissions must be reduced by 60% in2050 compared to 1990 [6]. In directive 2009/28/EC the European Parliament andcouncil demand all member states to have a minimum of 10% renewable energy inthe transport sector by 2020 [7].
The transport sector and its actors are highly dependent on a reliable infrastruc-ture to be able to fuel the vehicles whenever the demand arise. But as the majorityof the renewable energy production is intermittent and hence, unreliable, integratingthe two systems requires a way to balance supply and demand i.e. a way to storethe energy at times of overproduction to later be used at times when the demandis higher. One way to solve this is to charge Battery Electric Vehicles (BEV) tolet each vehicle operate as a storage unit [8]. This would supply BEV’s with cheapelectricity that would be used in electrical motors with high efficiency and woulddecrease the dependency of fossil fuels in the transportation sector. However, BEV’sstruggle with short driving range problems as well as a lacking infrastructure andexpensive batteries and have not yet proven to be the easy solution as many hashoped for [9].
The main propulsion system in vehicles has since the beginning of the 20thcentury been Internal Combustion Engines (ICE), and being the main powertraintechnology of transportation all over the world it has an extensive infrastructurebuild up around it. However, with the main fuel source originating from fossilresources, large quantities of emissions combined with a low fuel conversion factorof approximately 20% have forced various measures to reduce the contribution toboth global warming and local pollution.
Several options to fossil fuels already exists today where biomass-based alter-natives are available for both gasoline and diesel. However, the major sources ofavailable and usable biomass compete with food production and have problems to
1
1. Introduction
supply the vast amounts needed to replace fossil fuels. To be able to combine currentinfrastructure with an environmentally friendly energy source, increasing attentionis now turned to carbon-based synthetic fuels, known as electrofuels.
Industrial processes to convert electric energy to gaseous and liquid fuels havebeen known since the 1920s from the Fischer-Tropsch process. Other attemptsto produce synthetic fuels occurred during World War II, both with coal and withbiomass as feedstock. Since then, several attempts to largely implement for examplemethanol on the market have been made throughout the years, for example duringthe oil crisis in the 70’s, but have ultimately failed due to the low prices of fossilfuels. With an expected increase in fossil fuel prices, as well as the implementationof a carbon tax, electrofuels may still become a viable solution as a transportationfuel.
When carbon emissions and fuel economy is measured in cars, an industry stan-dard driving cycle is used to simulate a normal driving pattern. This cycle however,does very seldom resemble the actual driving pattern driven by a normal personin an every day situation. Additionally, the different advantages and disadvantagesof BEV’s and ICE cars are not captured and thus these standard cycles may be apoor method of comparison. Where BEV’s, with their regeneration abilities whilebraking and limited battery size are having an advantage in city traffic, fuels withhigher energy density are better utilized during long distance trips with a high poweroutput.
Therefore three different cycles with data collected from urban, rural and motor-way driving of a large set of European cars will be examined. This is combined withdifferent car sizes, which driven in a more realistic way will be used to determine thecompatibility of electrofuels in the transport sector. These conventional cars will becompared to BEV’s to find key factors for implementing renewable energy into thetransport sector.
1.1 Aim of the projectThis study should compare and evaluate two ways of implementing renewable electricenergy in the transport sector. It will investigate what impact BEV’s and electrofuelswill have on the amount of electricity needed to run cars of different sizes in differentenvironments. The total energy consumption from grid-to-wheel will be analysedand used to discuss the cost and environmental impact of each case. The results willalso be compared to conventional petrol and diesel propulsion to further determineadvantages and disadvantages of the different alternatives.
1.2 RestrictionsThis study should only include modern cars propelled by conventional fuels, electro-fuels and/or batteries. The environmental analysis and comparison will cover GHGCO2 equivalents emissions and will not be a full Life Cycle Assessment (LCA). Noattempts to predict the social cost will be made in the report. Only renewableproduction of electricity and renewable elements needed to form electrofuels are
2

1. Introduction
considered. A reference case with the Swedish market will be used as a frame forthe results.
1.3 Research questions• How does the actual total energy use from grid-to-wheel differ for different
types of vehicle propulsion systems?
1. By using more real life driving patterns provided by Volvo Car Corpo-ration instead of the European standard cycle the study will pin pointwhich propulsion alternative that real life driving benefits from.
• What impact does the different propulsion systems have when focusing onenvironmental, economic and energy efficiency perspectives?
1. By modelling vehicle characteristics for different car sizes and propulsionsystems one can determine how much energy each car consume at specificpoints and overall in the drive cycles. Focus lies on evaluate how to bestuse electricity in future passenger cars.
• What benefits/downsides come with using electrofuels in the ICE?
1. How much can engine efficiency be improved by increased octane numberin the electrofuels (e.g. methanol and synthetic petrol)?
2. What downsides are there (life time of seals, reducing specific energycontent etc...)?
3. Can increased engine efficiency outweigh the extra production energyneeded to increase the octane number of synthetic fuels?
• Under what circumstances (car size and driving pattern) can electrofuels bea more attractive fuel option for cars compared to electrified cars, measuredfrom CO2-emission, energy and cost per km?
1.4 Report layoutFollowing report layout will be used to guide the reader. Chapter 2 gives a back-ground to the topic and the different subjects crucial for the study. ThereafterChapter 3 explains the methodology used, both in terms of calculations and modelsbut also assumptions made to be able to achieve results. Results and discussion canbe found in Chapter 4 and 5 and is followed by the conclusions in Chapter 6. Someextra information about the engine models as well as results from the sensitivityanalysis can be found in the Appendices A and B.
3

1. Introduction
4

2Background
Following sections will describe the different types of electrofuels, investigated inthis report, and the corresponding production methods. The alternative, usingelectricity to propel a BEV and how that works will thereafter be explained. Thesections will also present the different driving cycles that are commonly used tocompare different cars regarding performance and emissions as well as to give abackground to uncertainties and implications of using them as they are used today.The final section will present the different cars that will be used for comparison.
2.1 ElectrofuelsEver since the industrial revolution fossil fuels have been used as the worlds mainenergy source as they have proven to being a relatively cheap fuel with a highenergy density. They have especially been important in the transport sector wherethe amount of fuel that is possible to carry is limited. For heavy-duty, aviationand commercial ocean applications there are today few alternatives while light-dutyvehicles, however, have the possibility to be electrified. Even so, as more than 90%of the worlds vehicle fleet is dependent on liquid hydrocarbon fuels, these will remaina major part of the fuel infrastructure in the foreseeable future[10].
Fossil fuels are the result of organic matter being put under high pressures andtemperatures millions of years ago [11]. All fossil fuels are made up by hydrocarbonchains of different length and composition [12], from the simplest molecule methaneto petrol, which can consist of up to 250 different hydrocarbons species [13]. Whena hydrocarbon fuel is fully oxidized the exothermic reaction converts the carbon inthe fuel to carbon dioxide CO2 and the hydrogen to water H2O. The result is a largeheat release that can be used to produce work while the products are emitted asexhaust gases [14]. As CO2 is also a Greenhouse Gas (GHG) the large use of fossilfuels over the years has lead to a global temperature increase, with negative impacton the environment[15].
In the beginning of the twentieth century the invention of the Sabatier reactormade it possible to reverse the combustion reaction by re-energizing H2O and CO2to form CH4, and the Fischer-Tropsch reactor a few years later made it possibleto produce hydrocarbons of any size and composition. The combination of a largeenergy input required in the process together with the low prices of regular fuelshowever, lead to a limited use. Due to worries of climate change the process have inthe recent years once again received increased attention. Electrofuels is the commonname given to hydrocarbon fuels produced from carbon dioxide and water using
5
2. Background
electricity as the main source, which actually is a reversed process to the combustionreaction.
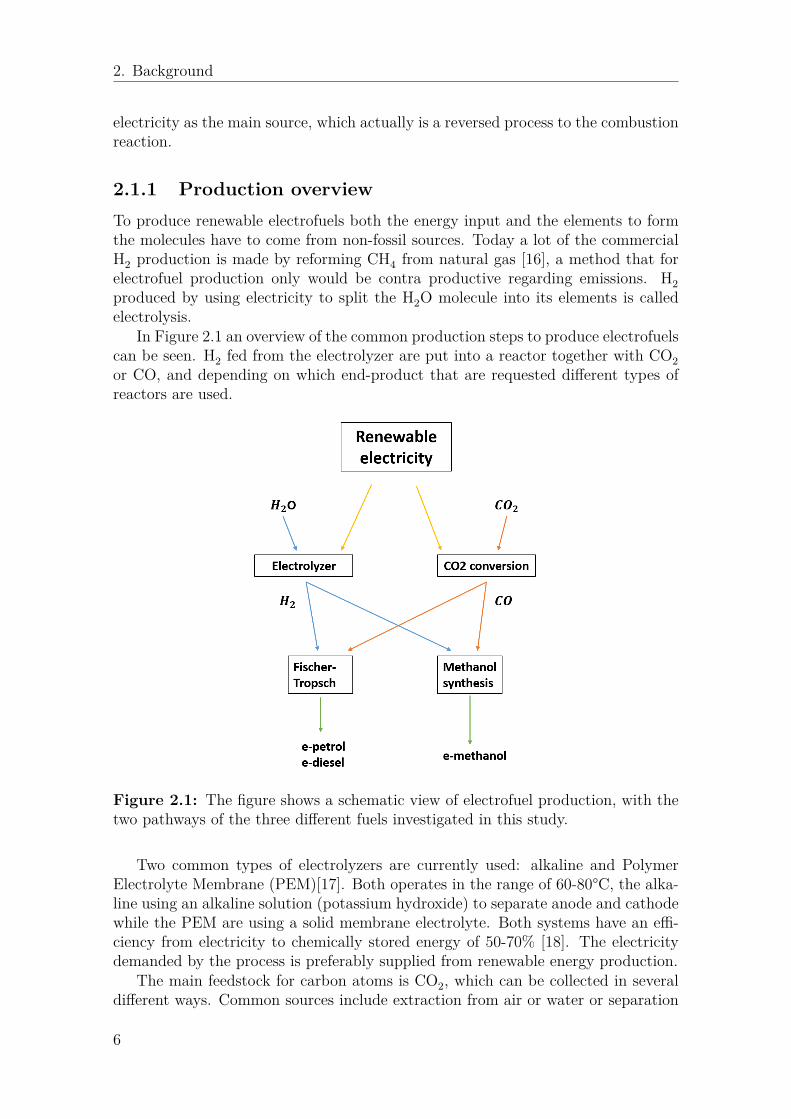
2.1.1 Production overviewTo produce renewable electrofuels both the energy input and the elements to formthe molecules have to come from non-fossil sources. Today a lot of the commercialH2 production is made by reforming CH4 from natural gas [16], a method that forelectrofuel production only would be contra productive regarding emissions. H2produced by using electricity to split the H2O molecule into its elements is calledelectrolysis.
In Figure 2.1 an overview of the common production steps to produce electrofuelscan be seen. H2 fed from the electrolyzer are put into a reactor together with CO2or CO, and depending on which end-product that are requested different types ofreactors are used.
Figure 2.1: The figure shows a schematic view of electrofuel production, with thetwo pathways of the three different fuels investigated in this study.
Two common types of electrolyzers are currently used: alkaline and PolymerElectrolyte Membrane (PEM)[17]. Both operates in the range of 60-80°C, the alka-line using an alkaline solution (potassium hydroxide) to separate anode and cathodewhile the PEM are using a solid membrane electrolyte. Both systems have an effi-ciency from electricity to chemically stored energy of 50-70% [18]. The electricitydemanded by the process is preferably supplied from renewable energy production.
The main feedstock for carbon atoms is CO2, which can be collected in severaldifferent ways. Common sources include extraction from air or water or separation
6

2. Background
of flue gases from industrial processes, power production or biofuel production. Tomaximize the process efficiency and minimize the cost the CO2 source should beas pure as possible. As the CO2 concentration in air and water is very low and nocommercial technologies are currently available, this technique will not be includedin the study.
Carbon Capture and Storage (CCS) is a collective name for techniques that canbe used to avoid CO2 emissions from power production and industrial processes.Instead of storing the CO2 it could be used as a feedstock for electrofuels, suchprocesses are expected to be commercial within some years. In biogas productiona syngas is created through gasification of biomass and then upgraded to have thesufficient level of CH4. Left in flue gas is mainly CO and H2 which instead of beingemitted to the atmosphere, could instead be supplied to an electrofuel process. Thiswould ensure that almost all products from the gasification process is used.
As mentioned earlier the H2 and CO2 or CO are supplied to a process wherethey are converted to hydrocarbons. The Fischer-Tropsch process is commonly usedwhen more advanced hydrocarbons are requested. It is possible to create a large setof different hydrocarbons by polymerization reactions, where the requested productis achieved by either extraction or further upgrading [19].
As a large variety of electrofuels can be created and this study will mainly fo-cus on three different types: methanol, synthetic petrol and synthetic diesel, whichhereafter will be denoted e-methanol, e-petrol and e-diesel. E-petrol and e-diesel,which can be blended with conventional fuels in all concentrations and thus utilizetoday’s fuel infrastructure, are attractive options and can easily be implemented.E-methanol is the simplest liquid hydrocarbon and is therefore evaluated under theassumption of having the lowest production cost. As a neat fuel for combustion en-gines, it is currently used in some racing sports and is also possible to blend in petrolwhere European fuel standard allow 3% methanol in conventional petrol. Higherblends and even pure e-methanol are possible to implement if minor changes to ve-hicles and infrastructure are made. The following sections will give a backgroundto each fuel and their applications.
2.1.2 MethanolContaining only one carbon atom, methanol (CH3OH) is simplest of the alcoholmolecules, belonging in the group of oxygenated hydrocarbons. It has been knownsince the 17th century and was produced by distilling wood material, why it is alsoknown as wood alcohol [20]. The French chemist Paul Sabatier was in 1905 thefirst to suggested a synthetic pathway to methanol production, which with furtherdevelopment made it possible to produce the liquid in the large quantities neededfor the chemical industry. Today methanol can be produced in various ways wherethe raw material H2 combined with CO are fed into a process, most commonlya methanol synthesis process or a Fischer-Tropsch process. The carbon source caninclude gasification of wood, agricultural by-products and municipal waste, however,the current main source is from fossil natural gas, mainly consisting of CH4.
The use of methanol, as well as ethanol, as a transportation fuel is as old asthe ICE itself but have due to low oil prices and being heavy opposed by the oil
7

2. Background
companies never been a true competitor to fossil fuels[20]. Methanol have been seenwith increased attention during times of short supply, as World War II or the oilcrisis in the 70s, but have not managed to remain an alternative to fossils afterwards.As an attempt do decrease emissions the state of California have in the last decadesbeen trying to promote the use of methanol cars, with a peak in 1997 with 20 000units used. Nowadays the methanol cars have mostly been replaced by ethanol, fuelcells and BEV’s as the main environmentally friendly car.
Methanol have several properties which makes it suitable to use in an ICE. Puremethanol has an Research Octane Number of 108.7[21], considerably higher thanpetrol, and can therefore be used under higher compression ratios which result inhigher theoretical thermal efficiency. It also has a high flame speed and allows afaster and cleaner combustion, which result in very low emissions from air pollutantsas NOx, particulates and hydrocarbons. It can also be used as a drop-in fuel inpetrol to increase efficiency as well as decrease both global and local emissions andthe share of fossil fuel used when produced in a sustainable way. Another possiblearea where methanol can be used in the future is as an on board source of hydrogento fuel cell vehicles which then allows for a higher energy density of the fuel thanstoring pure H2 would offer [20].
To be able to use pure methanol in an ICE a few modifications have to madeto the engine. These changes includes adjusting or switching pipes and plasticmaterials as methanol can corrode metals like aluminium and zinc (however, notsteel and cast iron) and react with plastics. Cold-start problems that might arisefrom the low volatility compared to petrol can be solved by adding small quantitiesof more-volatile components such as butane and pentane to ensure ignition [20]. Themain downside is however, the Lower Heating Value (LHV), about half of the petroland diesel properties, which can be seen in Table 3.3. To ensure the same drivingrange as its competitors a larger fuel tank has to be added.
Theoretically, methanol ca be used in both Spark Ignition (SI) and CompressionIgnition (CI) engines. However, due to methanol being substantially immisciblewith diesel due to the different structures of the molecules[20], methanol is oftenused in an SI engine as this allows the engine to run on methanol, petrol or a mixof them. Adding large amount of methanol to diesel also forces use of additives tocompensate for the low cetane number of methanol.
Methanol has been seen as a possible replacement to fossil fuels for a long timeand attempts are continuously made to set up large scale production to be ableto meet the demand at a competitive cost. As the shipping industry are facinglarge restrictions regarding emissions and where no other options currently exists,methanol propulsion is already in use in a Stena Lines ship running in Kattegatt andthe Baltic sea which will be implemented in 24 more ships if proven to be a satisfyingsolution [22]. Even though the majority of the methanol production originates fromnatural gas, production from sustainable sources is emerging around the world. OnIceland, Carbon Recycling International have been producing e-methanol since 2006completely based on sustainable sources with a current production capacity of 4000tons of methanol per year [23]. The electricity used to split the water is producedfrom a mix of hydro, geothermal, wind and solar while the CO2 is captured as a wastestream from a geothermal power plant. As part of the Icelandic governmental policy
8

2. Background
to use the large and cheap amounts of electricity available for domestic production,the produced e-methanol is then sold to other countries as a high density energysource and chemical feedstock. Hence, a commercial and sustainable productionmethod of e-methanol is available today.
To summarize, methanol is a mature and well-known alternative fuel that how-ever, never been able to compete with the prices of fossil fuels. With increasinglegislation on fossil emissions and pollutants, methanol is more and more seen as afuture complement or replacement to fossil fuels.
2.1.3 e-petrol and e-dieselPetrol has since the beginning of the 20th century been the main fuel used in carsall over the world. Ever since the invention of the Fischer-Tropsch synthesis thepossibility to produce gasoline and diesel in a synthetic way have been available,but due to low oil prices it has very seldom been profitable. However, during timesof low supply, which took place in Germany during World War II or in South Africaduring the boycott years of the Apartheid era [20], the method has been used byreforming syngas to liquid fuels.
Recently, Audi launched the opening of a pilot factory located in Dresden wheree-diesel is produced [24]. Using ambient air as CO2 source and sustainable energyas energy input the test plant will be able to produce approximately 130 litres ofsynthetic diesel per day, stated to have a high cetane number and being able toblend in any ratio with fossil diesel. The factory use a reversible electrolyzer withthe efficiency estimated to 90% and a power to liquid stated efficiency of 70%.With plans to soon launch a full-scale factory, this proves the increasing interest forelectrofuels in the automotive industry as a way to cope with increasing emissionlegislation’s. Both e-diesel and e-gasoline will therefore be a part of this study.[25]
2.2 Battery Electric VehiclesBattery electric cars are propelled by an electric motor which uses electric energystored on board in batteries. In some cases the car is equipped with a so calledrange extender to charge the batteries on road. The range extender can be a smallICE or some other machine that converts another energy form to electric energywhile driving.
The electric engine does not resemble the characteristics of the conventional ICE,which efficiency is dependent on load and engine speed in a much greater extent thenthe electric motor. Overall the electric motor has very high efficiency on all loadsand engine speeds compared to the ICE i.e much greater efficiency span. One moreadvantage for the electric motor is the instant torque delivery right after the firststart of engine revolution. This means that an electric motor can utilize only onegear instead of a complete gearbox and that increases efficiency and lowers thecomplexity of the drivetrain. [26]
Electric cars have the advantage of utilizing the electric motors as brakes andgenerate electricity to charge the batteries instead of dissolving that energy to heatthrough the friction brakes. This is called regenerative braking and only possible to
9

2. Background
do within certain brake powers before the conventional friction brakes have to takeover the deceleration process. The driving style of people using BEV’s thereforehave a great impact of the car’s total energy demand and possible range. This isalso true for ICE driven cars but will make a substantially larger impact on BEV’sdue to the regenerative braking.
The drawback for BEV’s is the significantly lower energy density in batteriescompared to petrol and diesel. To reach the same energy density carried by aconventional petrol or diesel tank a very large battery pack is required. The batterypack is both large in volume and mass compared to the conventional petrol or dieseltank carrying the equal amount of energy.
2.3 Driving cyclesTo be able to independently compare performance, emission certifications and fuellabeling of car models from different manufacturers driving cycles have for a longtime been used [27] with the idea to standardize how a car is driven. The car investi-gated is put into rolling road dynamometer where the driver follows the chosen cyclein a controlled way where often clutch engage and gear shift as well as acceleration,speed and deceleration are strictly prescribed [28].
Finding a cycle that can represent both driving patterns in urban areas and onhighway, long and short distance travels as well as capturing variations in differentcountries have proven to be a difficult task [26]. This has lead to a vast numberof different cycles used over the years, all with certain pros and cons. Since 1990the New European Driving Cycle (NEDC) has been used as the standard cyclein Europe. It is divided into two parts, one with low speed and one with highspeed with several start and stops, as can be seen in Figure 2.2. However, NEDChas been criticized for only covering a small area of engine operation range andtherefore allowing car manufacturers to optimize the emission performance and fuelconsumption which does not resemble the real-life emissions [29].
As a way to better represent European driving patterns the ARTEMIS drivingcycles were launched in 2004 [30]. By collecting detailed data (e.g. speed andacceleration) from 77 private cars in France, UK, Greece and Germany driving, intotal, 88 000 km, three sets of real-world driving cycles were created: urban, ruralroad and motorway. These can be seen in Figure 2.3.
The urban cycle represent driving in a city and are therefore mainly consistingof low velocities and start-stop driving. In the rural cycle velocities are increasedand the number of start-stops are decreased while the motorway cycle only containone stop where the rest of the cycle consist of constant high velocities. The differentimplications this have on cars and fuel consumption will be further discussed insection 3.1. Due to the nature of the data collected, the cycles vary in length.
As this study aim to investigate the real-life implications of using electrofuelsor BEV’s in passenger cars the three ARTEMIS cycles were chosen to representcommon driving patterns where the different advantages and disadvantages of thefuels can be investigated.
10

2. Background
Figure 2.2: The NEDC-cycle is as a standardized driving cycle which is usedto determine emission certification and fuel sampling of passenger cars in Europe.However, the cycle is often accused of not representing a normal driving pattern.
Figure 2.3: The figure shows the velocity profile of three driving cycles used in thestudy: urban, rural and motorway. The city cycle is dominated by low velocitiesand many start-stops, while high constant speed is significant for motorway.
11

2. Background
2.4 Volvo vehiclesThe study compares three different car sizes with official data provided by Volvo CarCorporation. They are defined as size small, medium and large with model detailsspecified in Table 2.1. These specifications are considered base case for petrol anddiesel driven cars in the study. Three sizes are used to accentuate the variation andthe impact of car size with the chosen driving pattern. All ICE’s have four cylinders,2 litre engine displacement and are turbocharged.
Table 2.1: The table shows specifications used for modelling of the three Volvocars.
Properties Small Medium LargeModel name V40 S80 XC90Mass [kg] 1572 1726 2137CxAa [m2] 0.63 0.68 0.92Tire circumference [m] 1.93 1.99 2.31Tank volume [l] 60 70 71
The chosen car models are displayed in Figure 2.4, all models are or were recentlyavailable with the chosen engine, gearbox and wheel setup in both the petrol anddiesel application [31]. The sizes represent common car sizes in Sweden and thesmallest have the national average weight. It is also noticeable that large cars aremore frequently sold in both Sweden and all over the European market than therest of the world [32] which means that the cars weight do not represent averagecars from a global perspective but are a good estimate for the Swedish market.
Figure 2.4: The figure shows the three Volvo cars chosen in the study, V40, S80and XC90 from left to right.
aCx is the drag coefficient while A is the car frontal area. Together they determine the airresistance of the vehicle.
12

3Methods
This study is focused on comparing and evaluating electrofuels on the passenger carmarket and investigate under what circumstances electrofuels could be the favorablechoice of fuel. To create leveled circumstances for cars of three sizes and four differentpropulsion technologies, a simplified car model, here after denoted VC-model1 inMATLAB was developed. This model is the first part of the comparison and providesthe study with fuel consumption and energy demand figures. The second partconsist of a model concerning the economical and environmental effects for eachchosen combination of size, driving pattern and propulsion system. Together thetwo models will provide the study with Grid-To-Wheel (GTW) information for eachcase.
3.1 VC-model tank-to-wheelThe first part of the comparison estimates the tank-to-wheel (TTW) energy demandof each chosen car size and drive cycle in the MATLAB calculation VC-model. Themodels are all able to follow the different driving cycles and hence be able to usevelocity and acceleration at any given point to calculate energy use and emissionsfrom the car.
3.1.1 Internal combustion driven carsTo model the ICE cars dynamic models of each Volvo car were created which therespective fuel dependent engine models were fitted to. One conventional petrolengine and one conventional diesel engine were provided by Volvo Car Corporation.The diesel engine were adjusted to resemble a methanol fueled engine. A detaileddescription can be found later in this section.
The petrol engine model took its start by determining the energy needed topropel the car for the different acceleration and velocity demands given by thedriving cycles. The least amount of energy needed is found by calculating theforces that affects the car: aerodynamic resistance, acceleration, roll resistance andgradient resistance. The minimum effect that have to be delivered at a specificmoment is found by adding the forces together and multiplying with the velocitiesfrom the driving cycle. The formulas can be seen in Equation 3.1 through 3.5.
Faero(t) = 0.5 ∗m ∗ ρair ∗ Cx ∗ A ∗ v(t)2 (3.1)1VC=Vehicle Characteristics
13

3. Methods
Facc(t) = m ∗ a(t) (3.2)
Froll(t) = m ∗ g ∗ cr ∗ cos(α(t)) (3.3)
Fgrade(t) = m ∗ g ∗ sin(α(t)) (3.4)
Ptot(t) = (Faero + Facc + Froll + Fgrade) ∗ v(t) (3.5)
The total mass that has to be transported is denoted m, the current velocityand acceleration are denoted v and a respectively. In Equation 3.1 the air densityρair, drag coefficient Cx and frontal area A all effect the aerodynamic resistance.The rolling friction coefficient cr is dependent of the surface and tyre deformationwhich are not completely elastic. For all investigated driving cycles the data hasbeen collected on a flat road and the road gradient α is therefore set to zero. Hence,Equation 3.4 can be neglected. An example of the different share of forces can beseen in Appendix A where the forces of a large car driving in the motorway cyclehave been calculated and plotted.
Unfortunately, not all fuel that is put into the car is converted into useful energy.The biggest loss takes place in the combustion process where a large portion of thefuel is turned into waste heat instead of mechanical work. The transmission systemas well as choice of gear also affects the amount of power that have to be suppliedby the engine to the transmission. The transmission efficiency, where losses occursfrom mechanical conversion in axis movement and gear connections, is here assumedto be 95%, see Figure 3.1.
Figure 3.1: A schematic view of the ICE model. All variations are using eightgears with the transmission efficiency set to 0.95. The engine efficiency is dependenton both fuel and load and is determined from the brake specific fuel consumptionmap.
The power developed by the engine is a combination of torque and RotationsPer Second (RPS). The engine RPS is determined from the RPS of the wheels,which are connected through the transmission system. By using different gears thisrelation can be changed and allows the engine to work within a more narrow spanof RPM and torque than otherwise could be achieved. This makes it possible tokeep the engine within a specific working range where it can be adjusted to be more
14

3. Methods
efficient.The gear ratios used in the VC-model are based on the car data explained inChapter 2.4. A suitable gear is chosen for each measurement point by determiningvelocity spans combined with the acceleration needed. During which conditions acertain gear is chosen can be seen in Table 3.1 and 3.2
Table 3.1: Gear choice for low acceleration levels
Gear Car speed [km/h] Car acceleration [m/s2]1st 0<15 -2nd 15<25 -3rd 25<35 -4th 35<45 -5th 45<60 <0.56th 60<70 <0.57th 70<85 <0.58th >85 <0.5
Table 3.2: Gear choice for high acceleration levels
Gear Car speed [km/h] Car acceleration [m/s2]3rd 25<40 >0.54th 40<70 >0.55th 70<85 >0.56th 85<100 >0.47th >100 >0.3
By determining the engine speed needed at a certain car velocity, the resultingtorque demand can be calculated. With the help of a Brake Specific Fuel Consump-tion (BSFC) map, a matrix where the specific fuel consumption have been measuredfor a large set of combinations of engine RPM and engine torque loads, the specificfuel consumption can be found for all possible car velocities in the drive cycle. Anexample of a BSFC map can be seen in Figure 3.2, where the diesel map used inthis study is shown.
For petrol and diesel, BSFC maps for the chosen engines were used. However,one did not exist for the methanol engine and was created under following assump-tions. As explained in section 2.1.2 methanol is most commonly used in a SI engine,however, the higher resistance to auto-ignition allows methanol SI engine to usealmost diesel-like compression ratios. Therefore a diesel BSFC map is used to findthe fuel consumption while compensations are made for pump losses that arise fromusing a SI engine. The lower LHV of methanol is also compensated by multiplyingthe diesel fuel flow with the LHV ratio to get the true methanol fuel flow.
Apart from fuel consumption at different speeds several functions is added tosimulate a more realistic driving pattern and to include real car functions to theVC-model. An electric load of 1 [kW ] is used at all speeds to simulate the use ofauxiliary equipment such as radio and air condition powered by the alternator. Astart and stop function where the engine is turned off if the car stands still for more
15

3. Methods
Figure 3.2: The figure shows the brake specific fuel consumption map used for thediesel engine in the study. Each combination of RPM and torque will end up in anarea where the fuel consumption in [g/kWh] can be found.
than two seconds and started one second before the car runs again, is also used toreduce the fuel consumption. To further implement the functionality of normal carbehaviour, a clutch function is added to ensure torque limiting slip and free rollingat slow velocities during start and stop of the car.
3.1.2 Battery electric vehicle modelThe configuration of a BEV is slightly different compared to a conventional car: dueto the use of an electric motor the energy supply have to be exchanged from a fueltank to a battery while the transmission system and gear box can be simplified. Aschematic view of the BEV part of the VC-model can be seen in Figure 3.3.
Figure 3.3: A schematic view of the BEV part of the VC-model which unlike theICE car only uses one gear for all loads. The power converter losses are assumedconstant for all loads while the internal losses in the battery are dependent on thecurrent.
The BEV have a different type of powertrain compared to the conventional ICEvehicle, however, the two systems are assumed to have the same weight. The calcu-
16

3. Methods
lations to determine the least amount of force needed to propel the car are thereforethe same as for the ICE model except for the extra weight added by the batter-ies. The BEV transmission system only consist of one gear since an electric motorhas full torque capacity from first start of engine revolution. One gear reduces thetransmission losses which is constantly set to 0.98 throughout all conditions.
The electric motor used is a 350 [V ] interior permanent magnet synchronousmotor using alternating current. A power converter is used as a link between thebattery and the motor to both shift the power from AC to DC and regulate the poweroutput. Losses from the conversion are set to 0.15 [W ] when torque is applied, asshown in Formula 3.6. A similar map as the BSFC is used to calculate the efficiencyand current demand based on torque and rpm. The internal losses in the battery aredependent on the current and are calculated using Formula 3.7 where the resistanceis set to R = 0.088[Ω] per 12 [kWh] of installed battery capacity. As for the ICEmodel, the auxiliary loads are assumed to be 1 [kW ].
Plossconverter = 0.15 [W ] (3.6)
Plossinternal(t) = I(t)2 ∗R [W ] (3.7)
One of the main benefits of using an electric motor is that it also can be usedas a generator when run on negative load. When this is done the kinetic energyof the vehicle is transformed to electrical energy. This reduces the vehicle speedand the generator can therefore be used when braking is wanted. This method can,however, only be used to a certain braking power level to avoid overheating thebattery. In this case the regular brakes are used. From a rule of thumb, a maximumregeneration limit in [kW ] is set to 2.5 times the battery capacity in [kWh], whichmeans with a battery size of 24 [kWh], the maximum charge and discharge level is 60[kW ]. The amount of regenerated power is calculated as the brake power availableat the wheels multiplied with the Battery-To-Wheel (BTW) efficiency twice, as thepower has to travel from the wheel to the battery and back again to be utilized.
3.1.3 Efficiency calculationsAs the different test cycles all vary in length and duration energy and fuel consump-tion are based on a mean value calculated per driven kilometer. For the ICE theenergy input is determined from the fuel flow, the density and the LHV of the fuel.The properties of the synthetic e-petrol and e-diesel are assumed to be the same asthe for the conventional products, these values can be seen in Table 3.3.
Table 3.3: The table shows the fuel properties used in the study. Most notable isthe low LHV of methanol which is less than half of petrol and diesel.
Fuel Density [kg/m3] LHV [MJ/kg] CO2 emissionsa [g CO2/lfuel]Petrol 735 44.4 2337Diesel 835 43.4 2684Methanol 791 19.9 1083
aTail pipe emissions.
17

3. Methods
From the table a major disadvantage of methanol compared to petrol and dieselcan be seen, the LHV is less than half of petrol and diesel which means that twicethe amount of fuel would have to be fed to the engine to achieve the same heatrelease. However, the higher resistance to self ignition allows for higher compressionratios and thereby a higher thermal efficiency which despite the low LHV still makesit a valid fuel option.
The TTW efficiency is found by comparing the energy needed at the wheels topropel the car to the engine energy input, which comes from either a battery or fueltank. This shows how efficient the energy put into the car is used by the car, itis an important way to express how to best utilise the produced electricity in thetransport sector.
3.1.4 VC-model fuel adaptionsIn the customers eyes, fuel and car prices are usually the most important factorsof choice. Other important measurements for customers are range capacity andrefueling options. To compensate for the LHV value of methanol the fuel tankson the base models are enlarged when converted to methanol propulsion. This isassumed to be a possible solution but will result in much more difficult packaging ofthe larger tank volume. The assumed changes of tank volume is presented in Table3.4.
Table 3.4: The table shows the methanol converted car’s new tank size.
Car size Tank volume [l]Small 90Medium 100Large 100
In the assumption of converting ICE to BEV of the base models battery sizes arechosen to represent equivalent available BEV on the market. The battery weightwhich is added to the base car models mass is assumed to be 7.5 [kg/kWh], sizes andadded mass are presented in Table 3.5. These battery packages are assumed to bepossible to fit in the cars and will result in packaging challenges. The other equip-ment required for BEV conversion is assumed to be cancelled out by the completedrivetrain change.
Table 3.5: The table shows the BEV conversion battery size and correspondingmass added to the base case car model.
Car size Battery size [kWh] Battery mass [kg]Small 24 180Medium 60 450Large 85 637.5
With the new fuel tank and batteries sizes it is possible to calculate availablerange for each car model and fuel type in all driving cycles, this is dependent on either
18
3. Methods
fuel or electricity consumption. The range is found as the possible driving lengthfor corresponding fuel or electric consumption with the carried energy amount.
3.2 Economic and energy use model GTT
The Grid-To-Tank (GTT) model investigates both economic aspects and energyconsumption. The economic evaluation considers investment cost and running costsof the car from a production point of view. The running cost is based on the fuel priceand is estimated to cover the investment and running cost of the fuel manufacturingplant. Based on the car energy use given from the VC-model the energy inputneeded to the system is calculated. Finally, the cost and environmental impact perunit can be found. The study uses a base case to find all efficiencies and prices beforeanalyzing how the results would be affected from making different assumptions onthe most uncertain parameters in a sensitivity analysis.
3.2.1 Car costThe investment cost of buying a car is dependent on a large variety of options,spanning from brand and comfort level to performance and style. When modelingthe different car sizes and propulsion system, a standardized car was chosen wherethe different powertrain packages were fitted. The petrol driven car is the cheapestalternative from a manufacturing point of view and is set as the level zero. To this,the extra costs associated with the alternatives is added. This is done to get a goodcomparison of where the other options differs from today’s conventional technologiesin price independently on customer choices.
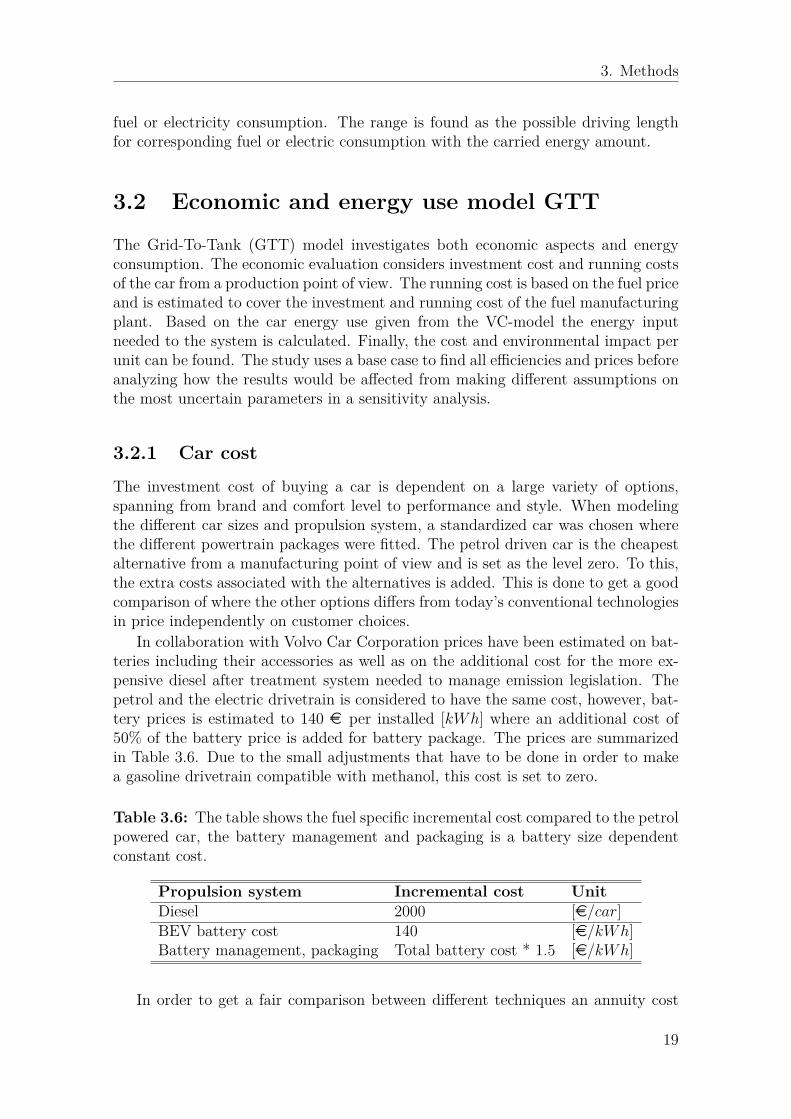
In collaboration with Volvo Car Corporation prices have been estimated on bat-teries including their accessories as well as on the additional cost for the more ex-pensive diesel after treatment system needed to manage emission legislation. Thepetrol and the electric drivetrain is considered to have the same cost, however, bat-tery prices is estimated to 140 e per installed [kWh] where an additional cost of50% of the battery price is added for battery package. The prices are summarizedin Table 3.6. Due to the small adjustments that have to be done in order to makea gasoline drivetrain compatible with methanol, this cost is set to zero.
Table 3.6: The table shows the fuel specific incremental cost compared to the petrolpowered car, the battery management and packaging is a battery size dependentconstant cost.
Propulsion system Incremental cost UnitDiesel 2000 [e/car]BEV battery cost 140 [e/kWh]Battery management, packaging Total battery cost * 1.5 [e/kWh]
In order to get a fair comparison between different techniques an annuity cost
19

3. Methods
model, shown in Equation 3.8,
A = I ∗ r
1 − (1 + r)−n(3.8)
is used to spread out the first large cost penalty over the cars economic life time. Theeconomic life time n of a car is estimated to ten years and the average driving lengthis estimated to 12000 [km/year] according to data from SCB [33]. The interest rater is set to 5% and the investment cost displayed in Table 3.6 is denoted I in theequation. The annuity cost denoted A divided by estimated driving length overthe cars life time form the extra cost for each non petrol propulsion system perkilometer. This is represented as the fixed car cost in the study. The resulting costsfor the different car sizes and propulsion systems can be seen in Appendix A.
3.2.2 Grid-to-wheel efficiency
In order to compare using the plug at home to charge a BEV with fueling electrofuelsat a tank station, the efficiency of producing electrofuels and their correspondingmanufacturing efficiency becomes vital. To find the overall efficiency from grid towheel the path is divided into four main steps: production, distribution, fueling andTTW.
E-methanol, e-diesel and e-petrol both have the same first step in the production,the electrolyzer. In the base case it is assumed that the electrolyzer have an efficiencyof 70% as explained in section 2.1.1. The next step is processing H2 and CO2 intoa liquid fuel. This is done by either Fischer-Tropsch or methanol synthesis with anefficiency assumed to be 60% and 79% respectively [34]. These steps result in a totalproduction efficiency of 42% and 55% for e-diesel and e-methanol. As the BEV havethe advantage of using electricity from the grid as fuel, the production efficiency isassumed to 100% in this study.
The next main step is distribution of fuel. As conventional petrol and dieselalready have an existing infrastructure for transport and storage, e-diesel, e-petroland e-methanol have the advantage of by small means being fitted to the currentsystem. It is assumed that the losses associated with transport and storage forchosen electrofuels is 0.5%. The electricity used for charging the BEV have to bedistributed over the electric power system from the origin to the charging point,which is assumed to be at home, and therefore assumed to have 10% distributionlosses.
The third main step is fueling the car and in the liquid fuel case there are almostno losses from pump to tank and the assumption is zero losses for this step. In theBEV case charging a battery is associated with some transfer losses from plug tobattery, resulting in emitted heat from the device. The losses is assumed to be 10%for charging the BEV.
The last main step is TTW, explained in section 3.1, which is used as input forthe GTT model to calculate the GTW efficiency for each case.
20

3. Methods
3.2.3 Fuel cost modelThis study focuses on the production cost without any profit added to the end priceto perform the comparison in an objective way. Due to great uncertainties andbusiness secrets, the cost of producing the different e-fuels is based on estimationsof investment costs of electrolyzers as well other reactors or processes needed forproduction. The investment cost for electrolyzers is estimated to 600 [e/kW ] wherethe stack needs replacement every 7th year at one third of the original investmentcost [35]. The Fischer-Tropsch synthesis and the CO2 to CO process combined withstorage and other accessories are estimated to 200 [e/kW ], based on already existingfacilities that converts gas to liquids [36]. The electrolyzer and Fischer-Tropsch withaccessories represent the total investment cost of the factory.
To find the fuel price an annuity cost for the factory is calculated with Equation3.8 where the estimated life time n is set to 25 years. The fuel cost can then becalculated with equation 3.9 in the unit [e/GJ ] with electricity prices estimated to25 [e/MWh] for industry users and 75 [e/MWh] for domestic users. This equationtakes all production related costs in to account, and all variables it contains isexplained in Table 3.7.
Cfuel = Afuel ∗ f1
CF+OM +D + E ∗ f2
η(3.9)
Table 3.7: The table shows explanations of variables used in Equation 3.9.
Variable ExplanationAfuel Investment annuity costf1 Conversion factor from [kW ] to [GJ ]CF Capacity factor of the factoryOM Operations and maintenance cost 4% of the total investment costD Distribution cost, assumed zero in base caseE Energy input cost, electricity or oil for conventional productionf2 Conversion factor from [MWh] to [GJ ]η Energy conversion efficiency
As a result of the output from the VC-model TTW in [l/km] the price in [e/GJ ]requires to be converted in to [e/l], Table 3.3 contains the fuel information usedin the conversion. The sum of the fixed costs explained in Section 3.2.1 and thevariable fuel costs represents the propulsion system’s total car cost per kilometer.
3.2.4 Grid-to-wheel electricity consumptionThe idea of electrofuels is to utilize electricity, preferable renewable, to producefuels. To find out how much electricity that is required to provide cars with electro-fuels, the study calculates the corresponding GTW electricity consumption for eachcase. With the help of the TTW energy use together with electrofuel productionefficiencies the study can derive the GTW electricity consumption. The results are,as stated, dependent on the car’s fuel or electricity consumption of each case and isthereafter compared with the BEV’s total electricity consumption.
21

3. Methods
22

4Results
This chapter presents the results completed by this study and the content is dividedinto three main parts. A sensitivity analysis in the end is conducted to understandand see the dependency of significant variables.
4.1 Tank-to-wheelThis section present results concerning TTW for all cases. Findings are conceived toget a greater understanding of the different car sizes and driving cycles dependencyon energy use. It also gives the foundation for the GTW analysis presented in section4.2, which gives the overall energy use and costs related to each combination of carand driving cycle.
4.1.1 Energy useTo determine the overall fuel energy input needed to provide a car with enoughenergy for propulsion the energy use within the car, i.e. BTW and TTW [Wh/km],first have to be determined. In Figure 4.1 the energy use for BEV’s and ICEV cars
Figure 4.1: The figure shows the energy use BTW/TTW of BEV and e-methanolfor all sizes and cycles, the energy use is constantly higher for e-methanol than theBEV cars regardless of size and cycle.
23

4. Results
Figure 4.2: The figure shows the energy use BTW/TTW of BEV, e-diesel ande-petrol for all sizes and cycles, the energy use is constantly higher for these twoelectrofuels than the BEV cars regardless of size and cycle.
run on e-methanol can be seen for the three different driving cycles. The energy usehas the dimension [Wh/km] and is a mean value of the the total amount of energydrawn from the tank or battery over the driving cycle, divided by the cycle length.This gives a good estimation of how energy intense a certain driving pattern is.
Two general trends can be seen in the figure: the e-methanol car uses moreenergy than the BEV and the higher the vehicle weight the more energy is needed.As explained in section 2.3 the urban cycle is dominated by start-and-stop and lowvelocities This can especially be seen in the urban cycle where the BEV can benefitfrom the possibility of regenerating a lot of the brake power back to the battery.Therefore only a small difference between urban and rural cycle can be seen, unlikethe e-methanol ICE which benefits much more from higher and more constant speedswhere the conditions are more suitable for the ICE characteristic.
Since the air resistance is dependent on the velocity squared, the large cars havean extra disadvantage in the highway cycle, dominated by high velocities where boththe extra weight as well as the bigger frontal area contributes to a high energy use.All car types have the lowest energy use in the rural cycle where few accelerationsare needed and the mean power demand is low. When looking at the e-petrol ande-diesel they follow the same trend as the e-methanol, as can be seen in Figure 4.2.
As explained in the section 3.1.1 the methanol engine is a modified diesel enginewith added pump losses when the throttle is not fully open. At high loads, whichtypically is the case in the highway cycle, only insignificant pump losses occurs in themethanol engine and therefore it has almost the same energy use as the e-diesel. Inthe urban and rural cycle, on the other hand, throttling occurs and differences cantherefore be seen between the two fuels. The petrol engine generally work at lowercompression ratios leading to a lower fuel efficiency. Therefore the petrol engine hasthe highest energy use of the investigated alternatives, almost five times higher thanthe BEV in the city cycle.
4.1.2 EfficiencyTo further explain the big differences in energy use between ICEV’s and BEV’s theTTW efficiencies are shown in Figure 4.3. The e-methanol cars’ efficiencies are inall cycles increased with increased weight. As extra weight means a higher torquedemand, this makes the chosen engine work at a more optimal load. When looking
24

4. Results
at the BSFC map in section 3.2 this can be understood by the engine workingpoint moving into a new area with a lower fuel consumption as a result. However,even though a higher efficiency is achieved with increased weight, a heavier car stillconsumes more energy, as earlier explained.
Figure 4.3: The figure shows BTW and TTW efficiency for all sizes of BEV ande-methanol in all cycles.
Figure 4.4: The figure shows TTW efficiency for all sizes of e-diesel and e-petrolin all cycles.
The BEV’s shows a very high BTW efficiency spanning from maximum 89% tominimum of 71%. The high BTW efficiencies are possible due to very high engineefficiency through out the electric engine’s whole working area. The three BEV sizeshave similar efficiency in the urban cycle while the difference increase with rural andmotorway cycles due to the internal losses dependency on current and hence higherloads results in bigger losses. This also explains why the efficiency of the small BEVis higher than the others, unlike the trends of ICE vehicles. Converting electricenergy into mechanical energy is not an exothermic reaction like in the ICE. Theconverting of energy do dissolve heat but through friction and is much lower than inthe combustion process. The BEV’s also have a higher efficiency on the transmissionwith the possibility to utilize only one gear instead of several to fit the ICE’s morenarrow optimal working point.
25

4. Results
The small BEV’s efficiency is noticeably lower in the city cycle than the mediumsized but responds predictable in the other two cycles in line with the larger cars.This rather strange behaviour is connected to the regenerative braking which isdependent on available wheel power and mass. Larger mass results in both a higheraccelerating kinetic energy and thus carries more energy which is available duringbraking. A larger battery also increases mass but with the downside of more lossesinternally of the battery because of size dependent losses.
When looking at the other two ICE driven cars, e-petrol and e-diesel shown inFigure 4.4, they follow the same trend as e-methanol but with some exceptions.The e-diesel have a slightly higher efficiency on all cycles than the e-methanol andthey are close to the same in the motorway cycle. As explained in Chapter 3.1.1the e-methanol engine is in this study based on the conventional diesel engine. Thee-petrol driven car have a lower efficiency then e-methanol on all cycles and followthe trend explained above with one exception. The motorway cycle on the large cardeviates from this predicted trend due to tire choice with standard gearbox ratio,this combination moves the cycle used working point slightly outside the optimalrange.
4.1.3 Fuel consumptionTo understand and get a feeling of the energy use presented in section 4.1.1 thecorresponding fuel consumption is presented in Table 4.1. It shows large differencesin volume between e-diesel and e-methanol which is expected considering the fuelsdifferent LHV. The e-petrol have a higher LHV and lower density than e-diesel andstill consumes a larger volume of fuel per kilometer which again shows how muchmore fuel efficient the e-diesel engine is compared to e-petrol engine. It also showsthe importance of changing tank volume of e-methanol driven cars to compensatefor the higher fuel consumption.
Table 4.1: The table shows average fuel consumption for all ICE driven cars in alldriving cycles. Sizes denoted S, M and L are short for small, medium and large.
Size & Fuel Urban [l/100km] Rural [l/100km] Motorway [l/100km]S e-methanol 16.9 10.5 12.5M e-methanol 17.7 11.1 13.3L e-methanol 20.4 13.4 16.9S e-diesel 6.6 4.3 5.3M e-diesel 6.7 4.6 5.7L e-diesel 8.1 5.6 7.3S e-petrol 9.9 5.9 6.7M e-petrol 10.4 6.3 7.2L e-petrol 11.9 7.6 9.5
26

4. Results
4.1.4 Range
To highlight the difference between the amount of energy carried and the consump-tion of each case in the three driving cycles the possible driving range were calcu-lated. The driving range for e-methanol and BEV as well as e-petrol and e-dieselis shown in Figure 4.5. It is noticeable that the e-methanol can drive much longercompared to the BEV even with the considerably lower energy use of the BEV.Given the 50% tank size increase the methanol vehicles are able to drive 500-900km between fueling occasions, a reasonable range for most users.
Figure 4.5: The figure shows available driving range for all sizes of BEV, e-methanol, e-diesel and e-petrol in each cycle. With the increased e-methanol tanksize, all ICE vehicles have considerably longer range than the BEV’s.
When looking at the e-diesel, e-petrol in Figure 4.5 and comparing them to thedriving range of BEV’s the gap between them is even larger. These findings stressesthe fact of batteries low energy density and that very high BTW efficiencies are notenough to by fair means compare BEV’s to ICEV’s driving range. The reason forthe rather similar driving range between the medium and large sizes of BEV’s, aswell as that the driving range are shortest for the small BEV, is that in this analysisit is assumed that the battery package increases with the size of BEV and is thusmuch larger in the largest car which increases the driving range
4.2 Grid-to-wheel
When all car parameters have been determined the fuel demand and the costs con-nected to each car type can be investigated. The costs connected to the productionof the e-fuels in the base case can be seen in Table 4.2.
As the factories producing the different e-fuels are assumed have the same invest-ment costs, Operations and Maintenance (O&M) cost, and capacity factors. Dueto the different reactor efficiencies, the electricity demand varies for producing e-methanol compared to e-diesel and e-petrol. Therefore, electricity demand and thusthe total cost of electricity is higher for the two latter. This ends up with an e-fuel production cost approximately two times higher than the price for conventionalpetrol.
27

4. Results
Table 4.2: The table shows production costs connected to the different electrofuelswhere regular petrol is added for comparison, all prices without tax or profit added.As can be seen the price per GJ for the electrofuels is approximately double theprice of conventional petrol.
Cost centre e-methanol e-diesel/e-petrol Conv. petrolTotal investment [e/GJ ] 6.34 6.34 -O&M [e/GJ ] 3.55 3.55 -Electricity [e/GJ ] 12.56 16.53 -Total fuel cost [e/GJ ] 22.45 26.42 10.04Total fuel cost [e/l] 0.35 0.96/0.86 0.33
4.2.1 Car costTo determine the total cost per kilometer for the car during its life time, investmentcosts are added to the running costs, as explained in section 3.2.1. The result fore-methanol and BEV can be seen in Figure 4.6.
Figure 4.6: The figure shows the differences in GTW cost with incremental costincluded per kilometer for BEV’s and e-methanol in the base case.
The e-methanol cars have only a running cost, as the car itself do not have tobe adjusted. Therefore the cost is only a function of the fuel consumption and allthree car sizes is within a narrow span. The BEV on the other hand have largeinvestment costs from the battery but small running costs as they all have a highefficiency combined with low "fuel" price. This also means that the BEV’s are almostindependent on driving cycle with the exception of the large car on the motorway.With the large batteries that is needed for the medium and large car, the share ofthe investment cost outweigh the low running costs and the price of using a BEVend up being approximately three times the cost of an e-methanol car in the samesize. The small car with a much smaller battery, however, is able to compete with
28
4. Results
the e-methanol cars. Once again these prices are based solely on production costand not what the consumers pay in the end.
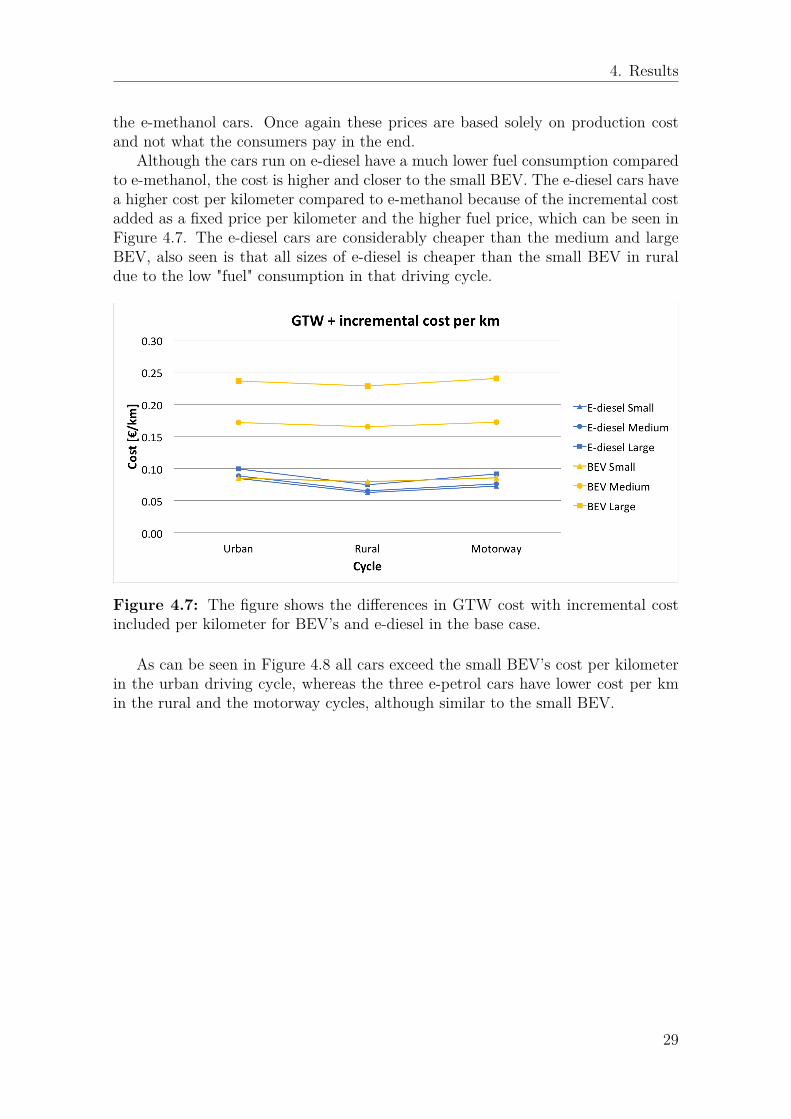
Although the cars run on e-diesel have a much lower fuel consumption comparedto e-methanol, the cost is higher and closer to the small BEV. The e-diesel cars havea higher cost per kilometer compared to e-methanol because of the incremental costadded as a fixed price per kilometer and the higher fuel price, which can be seen inFigure 4.7. The e-diesel cars are considerably cheaper than the medium and largeBEV, also seen is that all sizes of e-diesel is cheaper than the small BEV in ruraldue to the low "fuel" consumption in that driving cycle.
Figure 4.7: The figure shows the differences in GTW cost with incremental costincluded per kilometer for BEV’s and e-diesel in the base case.
As can be seen in Figure 4.8 all cars exceed the small BEV’s cost per kilometerin the urban driving cycle, whereas the three e-petrol cars have lower cost per kmin the rural and the motorway cycles, although similar to the small BEV.
29

4. Results
Figure 4.8: The figure shows the differences in GTW cost with incremental costincluded per kilometer for BEV’s and e-petrol in the base case.
4.2.2 Electricity consumptionCombining production efficiency (GTT) with the cars TTW efficiency the study cal-culated the amount of electric power input needed to propel each car per kilometer.These findings result in big differences between BEV and ICE powered cars, theresult of BEV and e-methanol required electric consumption per kilometer is shownin Figure 4.9.
Figure 4.9: The figure shows the electricity demand GTW per kilometer to propelBEV and e-methanol cars in each driving cycle.
30

4. Results
To produce and drive on e-methanol requires up to four times the electricityfrom GTW compared to driving BEV. The biggest loss occurs inside the engine dueto the low efficiency of ICE. Production of e-methanol is considerable less efficientcompared to using the electricity to charge batteries at home. In the e-diesel casethe engine itself have a better TTW efficiency but as the production of e-diesel isless efficient than e-methanol the total energy input needed is larger. Electricityconsumption GTW for e-diesel and e-petrol is shown in Figure 4.10.
Figure 4.10: The figure shows the electricity demand GTW per kilometer to propele-diesel and e-petrol cars in each driving cycle.
The electricity required to drive the small e-petrol car is more than seven timesthe amount of driving the small BEV in the urban cycle. It can also be seen that e-diesel is a bit more electricity intense than e-methanol overall due to lower productionefficiencies mentioned earlier. In the urban cycle e-diesel consumes less electricitythan e-petrol, the much lower TTW efficiency of e-petrol creates this big differencebetween them.
4.3 Resources and cost perspectives
This section investigates the resource and cost perspective for large scale imple-mentation of electrofuels in Sweden. By scaling up the electrofuel demand to all ofSweden’s passenger cars it is possible to interpret probability of future electrofuelproduction.
31

4. Results
4.3.1 How much electricity is required to provide Swedenwith electrofuels?
To give the results some perspective and to fully grasp the GTW electricity con-sumption of electrofuels a comparison is made with Sweden’s annual electricity pro-duction. Assuming the annual electricity production to 150 [TWh/year], estimatingthe average driving length to 12000 [km/year] and the fact that Sweden have about4.5 million cars registered [33]. If all these cars were to be driven by electrofuels theresulting electricity demand would be as presented in Table 4.3. The following num-bers are based on the small car in the rural cycle to show the minimum electricityrequired to provide all cars in Sweden with electrofuels.
Table 4.3: The table shows how much electricity each fuel would require to provideall of Sweden’s cars on average per year, calculated with the electricity consump-tion of a small car in rural cycle. Sweden’s annual production of 150 [TWh/year]represent 100% in the right hand side column.
Fuel Electricity demand [TWh/year] Share of productionBEV 10.3 7%e-methanol 45.2 30%e-diesel 55.7 37%e-petrol 69.1 46%
When looking at the extreme case of a large e-petrol car driven in urban en-vironment the demand rise to 93% of the annual Swedish electricity production.Regardless of cycle, size and type of electrofuel, a large scale implementation ofelectrofuels as a base fuel would not be possible in Sweden’s current electric powersystem. Except from a major change in the electricity production, securing a largeenough CO2 feedstock would also be required, which is presented in section 4.3.3.
4.3.2 How many BEV’s could one e-methanol factory rep-resent?
To give this study more perspective on the financial part of electrofuels and BEV’s,a comparison between building one e-methanol factory and how many BEV’s thatthe factory represents is conducted. All e-methanol car sizes and driving cycles aretested and as in the electricity investigation above it is assumed that the cars aredriven 12000 [km/year].
One e-methanol factory of the size 110 [MW ], which with the base case assump-tions made in this study corresponds to a fuel production of 482 [GWh/year]. Thisfactory size would have an investment cost of 278 million e. The battery pack inthe small BEV with the base case assumption have a cost of 5040 e per car, whichmeans that one factory investment cost would represent 55254 small BEV batterypacks in cost. All the 482 [GWh/year] of e-methanol produced in the factory wouldfor example be enough to fuel 87211 small cars, 1.6 times more e-methanol drivencars than small BEV’s for the same investment cost. When looking at the large
32

4. Results
cars it is 4.5 times more e-methanol driven cars than BEV’s, which is a consider-ably higher higher amount of vehicles replaced with this investment cost. If theinvestment cost instead would pay for medium BEV battery packs it covers 22102cars and in the large car case it would cover 15601 large BEV’s. The number ofe-methanol cars in their respective size and cycle that the fuel produced per year inthe factory could cover is presented in Table 4.4.
Table 4.4: This table shows the number of e-methanol cars that the 110 [MW ]factory could fuel per year for each size and driving cycle, with average drivinglength of 12000 [km/year]. The right column shows the number of BEV cars ofeach size that could instead be bought for the factory investment cost.
Car size Urban Rural Motorway BEV per factorySmall 54273 87211 73313 55254Medium 51788 82658 68963 22102Large 45125 68715 54203 15601
4.3.3 What is the water and carbon dioxide demand for e-methanol?
The water and CO2 demand for producing e-methanol is estimated and compared togive the calculated production values some perception of reality. This investigationis divided into two parts, first estimating demand of the 110 [MW ] factory describedin section 4.3.2 and second scaled to the entire Sweden’s electrofuel demand.
By looking at the overall chemical balance for producing e-methanol in Equation4.1, it is possible to estimate the demand of water and CO2 per liter of e-methanolwith knowledge of molar mass and other properties of the compounds included.
4 H2O + 2 CO2 −−−− 2 CH3OH + 3 O2 (4.1)
From this balance and with above described knowledge the investigation approx-imates water demand to 2 [l] and the CO2 demand to 3.6 [kg] per liter of e-methanolproduced. In Table 4.5 results of the investigation is presented for the 110 [MW ]factory and in Table 4.6 the upscale to Sweden’s minimum and maximum electrofueldemand is presented. The average water flow in Göta älv is 570 [m3/s] [37] and in2013 Sweden emitted 55.8 [Mton] [38] of CO2.
The results of the investigation pin points that water supply should not be aproblem for either the factory or the scale up in Sweden. From Table 4.6 it canalso be seen that if all cars in Sweden were in the category large the demand forCO2 would be higher than Sweden’s total CO2 emissions. This is of course anenormous amount of CO2 and sets the electrofuel production in perspectives. Itshould, however, be noted that Sweden also have large amounts of non-fossil CO2emission indicating that the electrofuel production, in this maximum assumption,still would be theoretically possible from a CO2 perspective. It should also be notedthat this exercise is a theoretical calculation to elaborate around perspectives butin reality it is not likely that 100% electrofuels would be demanded for the car fleet.
33

4. Results
Table 4.5: The table shows water and CO2 demand for the 110 [MW ] e-methanolfactory, it is compared with the annual water flow in Göta älv and Sweden’s totalCO2 emissions from 2013.
Factory Amount Unite-methanol produced 0.1 [Mm3/year]Water demand 0.2 [Mm3/year]Part of Göta älv 12 [ppm]CO2 demand 0.4 [Mton/year]Part of Sweden’s CO2 emissions 0.7 [%]
Table 4.6: The table shows the water and CO2 demand for e-methanol if all carsin Sweden where run on electrofuels, it is compared with the annual water flow inGöta älv and Sweden’s total CO2 emissions from 2013. Min represents small carsdriven in rural cycle and max represents large cars driven in urban cycle.
Sweden Amount Unite-methanol demand min 10 [Mm3/year]Water demand min 21 [Mm3/year]Part of Göta älv min 0.1 [%]CO2 demand min 37 [Mton/year]Part of Sweden’s CO2 emissions 67 [%]e-methanol demand max 20 [Mm3/year]Water demand max 40 [Mm3/year]Part of Göta älv max 0.2 [%]CO2 demand max 72 [Mton/year]Part of Sweden’s CO2 emissions 129 [%]
4.4 Sensitivity analysisTo get a deeper understanding of dependency on the assumptions made in this studythis section will present the results of the sensitivity analysis. Figures made toillustrate how the results are affected from changing parameter values are presentedin Appendix A & B and only explained in following sections. Each section presentsonly one parameter change from the base case to decrease complexity of the analysis.
4.4.1 Electricity priceThe main cost for producing electrofuels except of the factory investment is therunning cost of electricity, which means that naturally the production price of thefuel is highly dependent on this expense. To see the actual dependency of electricityprice two different cases were chosen, the first one lower the private price to 25[e/MWh]. This is the assumed price of industry use and gives an indication of thedependency of BEV’s electricity demand. The change of price resulted in a slightlylower cost per kilometer for the BEV’s but not down to the e-methanol level in ruraland motorway. The e-petrol cars are only lower in the rural cycle for all cases except
34

4. Results
for the large which is marginally higher than the small BEV. The e-diesel cars havehigher cost than the small BEV in both urban and motorway while the small andmedium stays marginally lower in rural. The medium and large sized BEV are stillin a higher range of cost than the cars driven by electrofuels. Results are presentedin Figures A.3 to A.5.
The second electricity price change is in the other direction, a higher price forthe industry is set to 75 [e/MWh], which is the price estimated for private use.As described before this makes a large impact on electrofuels due to the greateramount of electricity required to produce electrofuels compared to charge and driveBEV’s. The price increase results in e-methanol for all cycles and sizes to raiseabove or stay just the same as the small BEV cost per kilometer. The e-methanolstill stays below the medium and large BEV for all cycles, which indicates the highincremental cost for BEV’s. The e-diesel trend shows that all cases but the largein urban and motorway have a lower cost than medium BEV but higher than thesmall BEV. The e-petrol’s high fuel consumption in urban result in a higher costthan medium BEV for all sizes. In the other cycles the cost is lower than mediumBEV and higher than small BEV except for the large car in the motorway cycle.Results are presented in Figures A.6 to A.8.
4.4.2 Battery priceThe incremental cost of the BEV’s are based on the battery cost which is a roughestimation that currently is rather uncertain. Therefore the study investigates twobattery cost levels, one which is double the original estimated cost and one which ishalf of the estimated cost.
The lower battery cost makes the small BEV somewhat competitive with thee-methanol but the medium and large BEV’s still have a higher cost for all cycles.In the e-diesel case the small BEV have a lower cost overall and the medium andlarge BEV are still at a higher level. For the e-petrol case the urban cycle costs arehigher than the small BEV and lower or close to the medium BEV. In both ruraland motorway the small and medium e-petrol stays in the competitive range aroundthe small BEV. The large e-petrol car have a higher cost but still remains lowerthan the medium BEV. Results are presented in Figures A.9 to A.11.
With the higher battery cost all cases with electrofuels have a lower cost thanthe small BEV. The medium and large BEV have costs at a factor three or higherthan electrofuels in all cases. This indicates once again the dependency of batterycost as the most important one for BEV’s. Results are presented in Figures A.12 toA.14.
4.4.3 Electrolyzer efficiencyThe Audi e-diesel factory claims to have reversible electrolyzers with the efficiency90% which is mentioned in section 2.1.3. Therefore the study will investigate theaffect of changing the electrolyzer efficiency from 70% to 90%.
This will affect the total electricity consumption and the production efficiency forall electrofuels, which also changes the fuel price. Regarding the cost per kilometer
35

4. Results
all electrofuel cases drops down under or stays very close to the small BEV cost withthis change. The fuel price per liter decreases by 10-14 %, the e-methanol changesthe least because of the higher production efficiency in methanol synthesis. Resultsare presented in Figures B.1 to B.3. The electricity consumption for all electrofuelsdecreases by approximately 14-16%, with the e-methanol again in the lower endof the range because of above stated. The lower electricity consumption are stillhard to implement in the power system if scaled up to all Swedish cars fueled byelectrofuels. Results are presented in Figures B.4 to B.5.
4.4.4 Capacity factorWith increasing intermittent electricity production the possibilities of over produc-tion occurs from time to time. If instead of exporting the electricity or in worstcase disconnect it from the grid, producing electrofuels could be a good way to storethe electricity. If assumed that electrofuels only is produced when over productionoccurs and assuming this is only 10% of the year, the study investigates the changeof capacity factor from the conservative base case of 50% to the estimated 10%.With the estimated over production it is assumed that the electricity price do notchange from the usual price level. There could occur some special cases when theprice level decreases but it is not concerned in this analysis. A change from the basecase 50% to the more normal wanted production level of 90% is also investigated.
When assuming a capacity factor of 10% the price per liter changes by almosta factor three for all electrofuels, all the e-methanol cars except for the large car inurban have a higher price than the small BEV and lower than the medium BEV.The large cars cost per kilometer in urban is higher than the medium BEV but stilllower than the large BEV.
As the e-methanol car cost per kilometer increases so does also the cost for e-diesel and e-petrol. In the rural cycle all sizes for both e-diesel and e-petrol have alower cost than medium BEV, the two smaller e-diesel cars cost levels is similar to themedium BEV for the other cycles. The e-petrol driven cars high fuel consumptionin urban makes the cost higher than the medium BEV and the large e-petrol carare the only case that exceeds the large BEV cost. The other two cycles and sizesfollow the e-diesel trend, which overall makes the e-diesel a more promising fuel thane-petrol. Results are presented in Figures B.6 to B.8.
If the capacity factor is set to 90%, the cost for all electrofuel driven cars dropsbelow or stays the same as the small BEV in all cases. This capacity factor couldbe possible to reach in the future when the production of electrofuels might be amature process. Results are presented in Figures B.9 to B.11.
36

5Discussion
When this study started the main question that was to be solved were how to findthe best way of integrating renewable electricity into the transport sector. Thisturned out to be a very complex matter where the answers is highly dependent onwhat point of view that are important. As can be seen in the results, the GTWenergy use highly differs between electrofuels and BEV’s, so if the target is to reducethe energy use, BEV’s would seem to be the clear solution. However, without largeincentives, the users will most likely buy the cheapest option where only the smallBEV can compete with the electrofuel alternatives.
One of the biggest drawbacks of BEV’s is the short range that can be drivenbetween charges. This also showed in the results where the range of the BEV’s areconstantly lower than the electrofuel alternatives. It can, however, be discussed ifa range between 100-200 km would be enough for the normal city driver withouthaving to feel the so called range anxiety. Then the small BEV would be affordablecompared to electrofuels and with the lower battery price investigated in the sensi-tivity analysis it would even be cheaper. So in city or urban traffic the small BEVcould therefore be a good choice for both the user and especially the energy system.
As the battery price is another disadvantage of the BEV, the cost per [kWh] ofbattery is key to making the BEV an option for the future. In this study the pricewas set low compared to today’s prices, which however, are expected to decreaseover the years. As shown in the sensitivity analysis, lower battery prices would makethe BEV option a bit more attractive from a cost perspective, but without batterieswith increased energy density it is hard to compete with larger cars. One interestingfinding is that the range increase is not linear with battery size of the BEV due to theextra energy consumption that follows with heavier cars. This concludes that therecould be a limit where the larger battery does not have any affect on driving range,which could be defined as the largest suitable battery size. Of course improvementscan still be made within the battery market itself especially on increasing the energydensity and reduction of production costs.
In earlier studies, a standard car is often chosen where only a weight change isapplied to see how car size affects the results. This study has instead focused oncomparing and evaluating already existing car alternatives, on which modificationshas been done to fit the different fuel alternatives. This has increased the complexityof the cars and been done on the expense of seeing exact implications of each variablechange. However, in real life parameters like wheel diameter and frontal area areadjusted to fit different car sizes and will therefore in fact have an affect on theresults. Another alternative to developing own car models could have been to usealready developed models at Volvo Car Corporation, which probably would have
37

5. Discussion
given more exact results than what this model produced. This would however, evenmore reduced the possibility to make personal adjustments and understanding ofvariable changes.
From the TTW results, the ICE efficiency is increased with increased weightdue to using a more optimal RPM and torque demand in the chosen engines. Thismight look a bit different when using engines optimized to each specific car size andis also something that could improve the accuracy of the results. Using the sameengine type in cars of different size is however, a common way to reduce productionand development costs for car manufacturers and optimal engines are therefore notalways used in reality. As can be seen in Figure 4.3 and 4.4 the differences thatwould arise from choosing a more optimized engine for each size are not expectedto make any major changes to the results.
Finding valid production data proved to be a difficult task as it is often consideredbusiness secrets and information from factory and equipment suppliers are thereforehard to verify. The fuel production part of the study is therefore largely based onassumptions from earlier work and could probably be improved if more correct datawere available.
As a result of assumptions made and car sizes available, two things have to bementioned that might somewhat have affected the result. The weight of the chosensmall car can be argued to be outside the range of what is normally considered asmall car and therefore have a high energy consumption compared to other cars inthat segment. One quick calcuation with a weight reduction of 30% only results in15% lower fuel consumption for ICE and with the chosen engine the TTW efficiencyeven decreases some. This could imply that engine optimazation is a good way toreduce energy use for ICEV’s. We have noticed that driving pattern is more depend-able than size of passenger cars regarding the energy use or the fuel consumption.Regarding the e-methanol, the tank size is of crucial importance to be able to makeup for the LHV of the fuel. With the tank in the same size as petrol and diesel carshave today e-methanol would still have a range exceeding the BEV, but obviouslythe incentives to choose a small e-methanol car over the other fuel options, as wellas over a small BEV, would be a lot lower.
In this study the results of using electrofuels in passenger cars have been evalu-ated on the assumption that the only incentive is low price or low energy use. Thepossibility to produce electrofuels from renewable energy however, contains severaladvantages that which have been outside the scope of this study but still may largelyaffect the scale of electrofuel use in the future. When looking at the storage option,converting electricity into a fuel to later use it in an ICE instead of putting it directlyinto a battery will of course lead to increased losses. The electric power transmissionis however, limited by distance where losses and expenses gets bigger and bigger withgreater distance. This causes problems as a lot of the renewable energy productionpotential lies in distant areas with transmission problems as a result. This goesfor solar panels in the great deserts, possible hydro production in remote mountainparts and thermal heat on remote islands. Transporting liquids in either pipelinesor boats have lower losses connected to it, hence using the remote electricity pro-duction to produce electrofuels that can be transported to habitat areas without biglosses could be an alternative. This idea is already in place on Iceland where the
38

5. Discussion
cheap electricity, based on thermal heat, is converted to a transportable liquid, andoffers an interesting possibility for the future.
Electrofuels also offers a great variety of usage, e-methanol have the possibilityof being used both as a drop-in fuel as well as on its own. Therefore it exists a greatpotential of replacing parts of fossil use both today and in the future, and may easethe transition from a fossil based transport sector to sustainable alternatives. Apartfrom producing methanol, the possibility to produce fuel via the Fischer-Tropschreactor also offers the option of designing and improving the fuel. They can beproduced without toxins, carcinogens and sulphur which means a fuel better forengines, humans and the environment. They can also be designed to produce jetfuels for aviation as well as to have improved octane number compared to regularfuels which could increase the efficiency even more of the engines and reduce theamount of energy losses. The use of electrofuels as drop in also offers possibilities tointegrate the renewable energy into the current fossil fuel infrastructure. From theinvestigation of investing in one e-methanol factory it was found that one factoryis equivalent to 55,254 packs of 24 [kWh] batteries, an unlikely increase of vehiclescompared to the 2100 BEV’s[33] currently used in Sweden. If the investment insteadpayed for the e-methanol factory it could fuel 1.7 million small cars in rural with 5%drop-in of e-methanol, which lower the CO2 share from all these cars by 5%. Thisimplies that if the target is to decrease emissions at the lowest possible cost, usingelectrofuels as drop in is probably a better solution since incentives for customersand infrastructure investments have to be made to increase the share of BEV’s.The factory could supply up to 68,715 large cars with pure e-methanol and bythat replace 4.5 times more fossil fueled cars than investing in battery packs forlarge BEV’s. Additionally choosing electrofuels would take away the uncertaintyof whether customers in the end will buy BEV’s or not and hence increasing theprobability that the money invested will have an effect.
Compared to first generation biofuels such as ethanol or biodiesel, the electro-fuel production does not compete with food production or other arable land whichis already scarce. Electrofuels are instead in need of water, CO2 and renewableelectricity, in the e-methanol factory investigation the findings on water use stressesthe fact of water not to be a problem in Sweden. Even when scaled up to providee-methanol to fuel for all cars in Sweden the water demand is only 0.2% of Götaälv’s water flow. When looking at the CO2 demand to fuel 1.7 million cars withdrop-in from one 110 [MW ] factory it needs quite a small part of Sweden’s CO2emissions but the scale up to fuel all cars with only e-methanol the demand risesto above Sweden’s emission levels, which makes the assumption hard to implementwithout importing CO2 or CO to Sweden. The most difficult problem is, however,to deliver the amount of renewable electricity needed to provide all of Sweden withe-methanol, increasing the electricity production by 30% or more is hard enough fortoday’s electric power system already running near the limit of production.
Even with the complexity and low energy efficiency of producing electrofuels thecost per kilometer is still lower than for BEV’s, especially the two larger cars whichare much more expensive than the smaller one. In our study we have chosen a bitconservative capacity factor on the production, with the more optimistic capacityfactor of 90%, which may have been a better choice, the cost for electrofuels decreases
39

5. Discussion
even more below the BEV’s cost levels and is presented in the sensitivity analysis.This emphasis’s the possibility of implementing electrofuels to the passenger carmarket, and most certainly as a drop-in fuel option.
A possibility that has not been investigated in this study is a combination ofBEV and electrofuels in a hybrid car. A hybrid car has an ICE in combination witha battery and electric motor which allows for electric drive during shorter distances,normally up to 50 kilometers and the possibility of regenerative braking to chargethe battery. If longer distance or more power is needed, the ICE is used alone orin combination with the electric motor. The downside compared to a normal ICEVis the extra cost and weight for the battery pack. Using electrofuels in hybrid carscould also be a good way to phase out fossil fuels from the passenger car market.Further studies on implementing electrofuels could be done with hybrid cars includedto find other possible conclusions.
In this study no consideration has been made regarding the outdoor temperature.Doing so would likely be a disadvantage for the BEV since heating up the cabinhave to use battery capacity rather than using waste heat, as done in ICEV’s.Additionally, batteries are temperature dependent wherefore determining the impactof outdoor temperature could be an interesting target for further studies.
As mentioned in the introduction, the car industry is under less pressure of afuel transition than the shipping and aviation sector. In these sectors there arecurrently few options to fossil fuels due to prices, energy density matters and emis-sion legislation’s, which by a large probability will be forced to other alternatives.As the demand for alternatives increases, development and production costs can beexpected to decreased and make electrofuels an even more valid solution. But thatis only if the electric power system converts to only non fossil fuels, which also isthe main problem and requirement for BEV’s to truly be environmentally friendly.
When evaluating the research questions some conclusions can be drawn whileothers remains unanswered. For each driving cycle and car size, the BEV’s havea lower specific energy consumption, however, at a higher cost. The small BEVis able to compete with the cost of electrofuels with the assumptions made in thebase case, and could be an equally good option when a long driving range is notimportant. Answering what is the best way to use renewable electricity the obviousanswer is in BEV’s when looking at the total energy demand per driven kilome-ter. This solution is, however, dependent on customers buying more expensive carsand is therefore connected to bigger uncertainties whether the proposed decrease inglobal emissions from the transport sector is connected to a higher cost for bothcustomers and governments. Using the different electrofuels all comes with specificupsides and downsides but the main benefit of using synthetic fuels compared totheir respectively commercial alternatives is that electrofuels are free of toxins andpollutants. Due to uncertainties regarding the electrofuel production no connectionbetween octane number and production energy use and cost was found. The choiceof propulsion system is highly dependent on who is asking the question and whatthe target is, it is clear that choosing between low energy consumption or low costis more important than to base the choice on how the car is driven.
40

6Conclusion
The following conclusions can be drawn from the analyses made in this study.
• To minimize the amount of energy use, BEV’s is the preferred choice regardlessof cycle and size compared to electrofuels.
• Electrofuels outperforms BEV’s when it comes to range and even though muchmore energy inefficient, e-methanol can be a more cost-efficient option in allinvestigated driving cycles.
• The choice of driving cycle is more decisive than car size for electrofuels re-garding energy use and cost. BEV’s incremental cost are dominated by batterysize and therefore almost independent on driving cycle. Even though a lessexpensive "fuel" cost BEV’s will be more expensive than electrofuels.
• A large scale implementation of electrofuels would put an unrealistic demandon the electric power system. In Sweden water supply would not be an issue,however, CO2 feedstock could be an issue. A realistic alternative to reduce thefossil fuel use in the near future could be to implement electrofuels as drop-infuel.
• Using electrofuels as drop in offers the easiest solution for governments tointegrate renewable electricity into the transport sector as it is not dependenton customers buying BEV’s or car manufacturers adapting vehicles to newfuels.
41

6. Conclusion
42

List of Figures
2.1 Scheme of electrofuel production . . . . . . . . . . . . . . . . . . . . . 62.2 NEDC-cycle . . . . . . . . . . . . . . . . . . . . . . . . . . . . . . . . 112.3 ARTEMIS velocity profile . . . . . . . . . . . . . . . . . . . . . . . . 112.4 Volvo cars in the study . . . . . . . . . . . . . . . . . . . . . . . . . . 12
3.1 Scheme of ICE model . . . . . . . . . . . . . . . . . . . . . . . . . . . 143.2 A diesel brake specific fuel consumption map . . . . . . . . . . . . . . 163.3 Scheme of BEV model . . . . . . . . . . . . . . . . . . . . . . . . . . 16
4.1 Energy use TTW/BTW e-methanol & BEV . . . . . . . . . . . . . . 234.2 Energy use TTW/BTW e-diesel, e-petrol & BEV . . . . . . . . . . . 244.3 BTW/TTW efficiency for BEV & e-methanol . . . . . . . . . . . . . 254.4 TTW efficiency for e-diesel & e-petrol . . . . . . . . . . . . . . . . . . 254.5 Range for BEV, e-methanol, e-diesel & e-petrol . . . . . . . . . . . . 274.6 BEV & e-methanol cost . . . . . . . . . . . . . . . . . . . . . . . . . 284.7 BEV & e-diesel cost . . . . . . . . . . . . . . . . . . . . . . . . . . . 294.8 BEV & e-petrol cost . . . . . . . . . . . . . . . . . . . . . . . . . . . 304.9 BEV & e-methanol electricity consumption . . . . . . . . . . . . . . . 304.10 e-diesel & e-petrol electricity consumption . . . . . . . . . . . . . . . 31
A.1 Share of forces for a large car in highway cycle . . . . . . . . . . . . . IA.2 Torque demand difference . . . . . . . . . . . . . . . . . . . . . . . . IIA.3 BEV & e-methanol cost, private electricity 25 e/MWh . . . . . . . . IIA.4 BEV & e-diesel cost, private electricity 25 e/MWh . . . . . . . . . . IIA.5 BEV & e-petrol cost, private electricity 25 e/MWh . . . . . . . . . . IIIA.6 BEV & e-methanol cost, industry electricity 75 e/MWh . . . . . . . IIIA.7 BEV & e-diesel cost, industry electricity 75 e/MWh . . . . . . . . . IIIA.8 BEV & e-petrol cost, industry electricity 75 e/MWh . . . . . . . . . IVA.9 BEV & e-methanol cost, battery price 70 e/kWh . . . . . . . . . . . IVA.10 BEV & e-diesel cost, battery price 70 e/kWh . . . . . . . . . . . . . IVA.11 BEV & e-petrol cost, battery price 70 e/kWh . . . . . . . . . . . . . VA.12 BEV & e-methanol cost, battery price 280 e/kWh . . . . . . . . . . VA.13 BEV & e-diesel cost, battery price 280 e/kWh . . . . . . . . . . . . VA.14 BEV & e-petrol cost, battery price 280 e/kWh . . . . . . . . . . . . VI
B.1 BEV & e-methanol cost, electrolyzer 90 % efficiency . . . . . . . . . . VIIB.2 BEV & e-diesel cost, electrolyzer 90% efficiency . . . . . . . . . . . . VII
43

List of Figures
B.3 BEV & e-petrol cost, electrolyzer 90% efficiency . . . . . . . . . . . . VIIIB.4 BEV & e-methanol electric consumption, electrolyzer 90% efficiency . VIIIB.5 e-diesel & e-petrol electric consumption, electrolyzer 90% efficiency . IXB.6 BEV & e-methanol cost, capacity factor 10% . . . . . . . . . . . . . . IXB.7 BEV & e-diesel cost, capacity factor 10% . . . . . . . . . . . . . . . . XB.8 BEV & e-petrol cost, capacity factor 10% . . . . . . . . . . . . . . . . XB.9 BEV & e-methanol cost, capacity factor 90% . . . . . . . . . . . . . . XB.10 BEV & e-diesel cost, capacity factor 90% . . . . . . . . . . . . . . . . XIB.11 BEV & e-petrol cost, capacity factor 90% . . . . . . . . . . . . . . . . XI
44
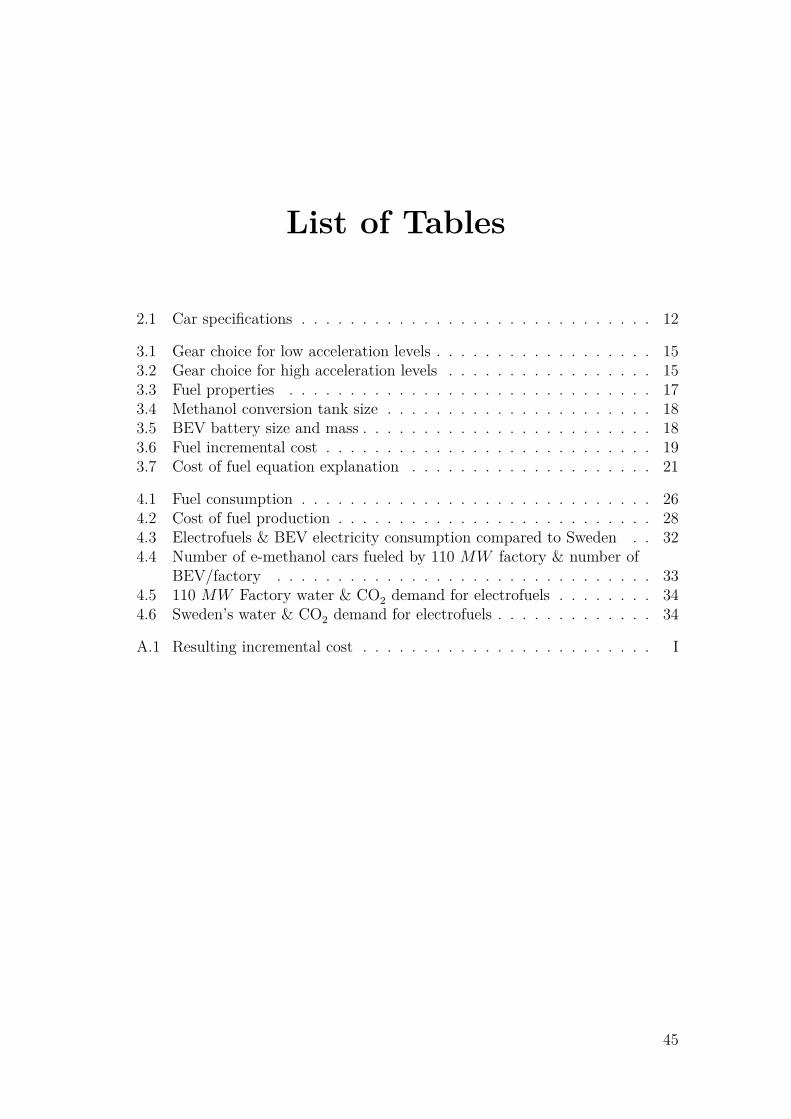
List of Tables
2.1 Car specifications . . . . . . . . . . . . . . . . . . . . . . . . . . . . . 12
3.1 Gear choice for low acceleration levels . . . . . . . . . . . . . . . . . . 153.2 Gear choice for high acceleration levels . . . . . . . . . . . . . . . . . 153.3 Fuel properties . . . . . . . . . . . . . . . . . . . . . . . . . . . . . . 173.4 Methanol conversion tank size . . . . . . . . . . . . . . . . . . . . . . 183.5 BEV battery size and mass . . . . . . . . . . . . . . . . . . . . . . . . 183.6 Fuel incremental cost . . . . . . . . . . . . . . . . . . . . . . . . . . . 193.7 Cost of fuel equation explanation . . . . . . . . . . . . . . . . . . . . 21
4.1 Fuel consumption . . . . . . . . . . . . . . . . . . . . . . . . . . . . . 264.2 Cost of fuel production . . . . . . . . . . . . . . . . . . . . . . . . . . 284.3 Electrofuels & BEV electricity consumption compared to Sweden . . 324.4 Number of e-methanol cars fueled by 110 MW factory & number of
BEV/factory . . . . . . . . . . . . . . . . . . . . . . . . . . . . . . . 334.5 110 MW Factory water & CO2 demand for electrofuels . . . . . . . . 344.6 Sweden’s water & CO2 demand for electrofuels . . . . . . . . . . . . . 34
A.1 Resulting incremental cost . . . . . . . . . . . . . . . . . . . . . . . . I
45

List of Tables
46

References
[1] Naturvårdsverket. Underlag till en färdplan för ett Sverige utan klimatutsläpp2050, rapport 6537. Tech. rep. In Swedish. Naturvårdsverket, 2012.
[2] Government offices of Sweden. Regeringens proposition 2008/2009:163: Ensammanhållen Klimat och Energipolitik – Energi. Tech. rep. In Swedish. Miljö-och energidepartementet, 2009.
[3] Johansson T.B. Fossilfrihet på väg. Betänkande av Utredningen om fossilfrifordonstrafik. Tech. rep. In Swedish. Statens Offentliga Utredningar, 2013.
[4] International Energy Agency. Transport, Energy and CO2. Tech. rep. Direc-torate of Sustainable Policy and Technology, 2009.
[5] Andreas Schäfer, Knovel (e-book collection), and Knovel (Firm). Transporta-tion in a climate-constrained world. Cambridge, Mass: MIT Press, 2009.
[6] European Commission.WHITE PAPER Roadmap to a Single European Trans-port Area - Towards a competitive and resource efficient transport system.Tech. rep. European Commission, 2011.
[7] European Parliament and Council of the European Union.Directive 2009/28/ECof the European Parliament and of the council of 23 April 2009 on the pro-motion of the use of energy from renewable sources and amending and subse-quently repealing Directives 2001/77/EC and 2003/30/EC. Tech. rep. Euro-pean Parliament and Council of the European Union, 2009.
[8] Christopher Saunders et al. “Electric vehicles and intermittent electricity pro-duction”. In: (2013), pp. 101–115.
[9] K.T. Chau. “21 - Pure electric vehicles”. In: Alternative Fuels and AdvancedVehicle Technologies for Improved Environmental Performance. Ed. by RichardFolkson. Woodhead Publishing, 2014, pp. 655 –684.
[10] “Re-energizing CO2 to fuels with the sun: Issues of efficiency, scale, and eco-nomics”. In: Journal of CO2 Utilization 1.0 (2013), pp. 28 –36.
[11] Ibrahim Dincer and Calin Zamfirescu. Sustainable Energy Systems and Appli-cations. SpringerScience+Business Media, LLC, 2011.
[12] Herman Daly. “Fossil Fuels”. In: World Bank Economist Science (1989).[13] Willard W. Pulkrabek. Engineering Fundamentals of the Internal Combustion
Engine. Second Edition. 2414. Pearson Prentice-Hall, 2004.[14] John B. Heywood. Internal Combustion Engine Fundamentals. McGraw-Hill,
1988.
47
References
[15] Stocker et al. Climate Change 2013: The Physical Science Basis. Contributionof Working Group I to the Fifth Assessment Report of the IntergovernmentalPanel on Climate Change. Cambridge University Press, Cambridge, UnitedKingdom and New York, NY, USA, 2013.
[16] J. Han M. Mintz and A. Burnham. “Alternative and renewable gaseous fuelsto improve vehicle environmental performance”. In: ().
[17] Paul W. Parfomak. “Congressional Research Service”. In: Energy Storage forPower Grids and Electric Transportation: A Technology Assessment. 2012.
[18] Gunnar Benjaminsson, Johan Benjaminsson, and Robert Boogh Rudberg.Power-to-Gas – A technical review. Tech. rep. SGC, 2013.
[19] Hanif A. Choudhury, Sankar Chakma, and Vijayanand S. Moholkar. “Chapter14 - Biomass Gasification Integrated Fischer-Tropsch Synthesis: Perspectives,Opportunities and Challenges”. In: Recent Advances in Thermo-Chemical Con-version of Biomass. Ed. by Ashok PandeyThallada BhaskarMichael Stöcker-Rajeev K. Sukumaran. Boston: Elsevier, 2015, pp. 383 –435.
[20] George A. Olah, Alain Goeppert, and G. K. Surya Prakash. Beyond Oil andGas: The Methanol Economy. WILEY-VCH Verlag, 2009.
[21] Richard L. Bechtold. 1997.[22] Göteborgs Hamn. Stena Line sjösätter världens första metanolfartyg. 2015.
url: http://www.goteborgshamn.se/Nyhetsrummet/Nyhetsartiklar/Stena - Line - sjosatter - varldens - forsta - metanolfartyg/ (visited on05/07/2015).
[23] Carbon Recycling International. Products: Methanol. 2015. url: http://www.carbonrecycling.is/index.php?option=com_content&view=article&id=64&Itemid=32&lang=en (visited on 05/07/2015).
[24] Audi Mediaservice. New Audi e-fuels project: e-diesel from air, water and greenelectricity. 2014. url: https://www.audi-mediaservices.com/publish/ms/content/en/public/pressemitteilungen/2014/11/14/new_audi_e-fuels_project.html (visited on 05/12/2015).
[25] sunfire GmbH. Sunfire now produces synthetic fuel from air, water and greenelectrical energy. 2015. url: http://www.sunfire.de/wp-content/uploads/sunfire - INTERNATIONAL - PM - 2015 - alternative - fuel . pdf (visited on05/12/2015).
[26] John Lowry, James Larminie, and ebrary (e-book collection). Electric vehicletechnology explained. Wiley, 2012.
[27] Lars-Henrik Kullingsjö and Sten Karlsson. “The possibility for energy regener-ation by electrification in Swedish car driving”. In: 27th World Electric VehicleSymposium and Exhibition, EVS 2014; Barcelona; Spain; 17 November 2013through 20 November 2013.
[28] B. J. Shim et al. “Work and speed based engine operation condition analysisfor new European driving cycle (NEDC)”. English. In: Journal of MechanicalScience and Technology 28.2 (Feb. 2014), pp. 755–761.
48
References
[29] “Analysis of vehicle emission measurements on the newWLTC, the NEDC andthe CADC”. In: Transportation Research Part D: Transport and Environment32.0 (2014), pp. 70 –85.
[30] “The ARTEMIS European driving cycles for measuring car pollutant emis-sions”. In: Science of The Total Environment 334–335.0 (2004). Highway andUrban Pollution, pp. 73 –84.
[31] Volvo Car Corporation. Volvo car specifications. 2015. url: http://www.volvocars.com/se.
[32] Peter Mock. European Vehicle Market Statistics, 2014. Tech. rep. The inter-national council on clean transportation, 2014.
[33] Statistiska Centralbyrån. “Fordon 2014”. In: Trafikanalys (2015).[34] E4tech. Review of Technologies for Gasification of Biomass and Wastes. Tech.
rep. National Non-Food Crops Centre.[35] M. Grahn et al. “System perspectives on renewable power”. In: ed. by B.
Sandén. Chalmers University of Technology, 2014. Chap. Utilising excess power:The case of electrofuels for transport.
[36] Boerrigter H. Economy of Biomass-to-Liquids (BTL) plants; An engineeringassessment. Tech. rep. ECN Biomass, Coal and Environmental Research, 2006.
[37] SMHI. Sveriges vattendrag. 2010. url: http://www.smhi.se/polopoly_fs/1.10713!webbSveriges\%20vattendrag\%2016.pdf (visited on 05/27/2015).
[38] Naturvårdsverket. Nationella utsläpp och upptag av växthusgaser. 2013. url:http://www.naturvardsverket.se/Sa- mar- miljon/Statistik- A- O/Vaxthusgaser--nationella-utslapp/ (visited on 05/27/2015).
49

References
50

AAppendix 1
Time [s]
0 100 200 300 400 500 600 700 800
Forc
e [kN
]
0
0.5
1
1.5
2
2.5
3
3.5Cumulative Force, large car in motorway cycle
F roll
F aero
F acc
Figure A.1: Share of forces for a large car in highway cycle. As can be seen, thebiggest share is made up of air resistance due to the high velocities.
Table A.1: The table shows the incremental costs for the different vehicle sizesand propulsion sytems [e/km]
Car size e-petrol e-methanol e-diesel BEVSmall 0 0 0.022 0.065Medium 0 0 0.022 0.147Large 0 0 0.022 0.203
I

A. Appendix 1
Figure A.2: The figure shows the percentage difference between the torque neededfor a diesel and methanol engine. Since pump losses only occurs until full throttleis used, the difference are bigger the lower load that is applied.
Figure A.3: The figure shows cost per kilometer for BEV and e-methanol cars ifprivate electricity price would be 25 [e/MWh].
Figure A.4: The figure shows cost per kilometer for BEV and e-diesel cars if privateelectricity price would be 25 [e/MWh].
II

A. Appendix 1
Figure A.5: The figure shows cost per kilometer for BEV and e-petrol cars ifprivate electricity price would be 25 [e/MWh].
Figure A.6: The figure shows cost per kilometer for BEV and e-methanol cars ifindustry electricity price would be 75 [e/MWh].
Figure A.7: The figure shows cost per kilometer for BEV and e-diesel cars ifindustry electricity price would be 75 [e/MWh].
III

A. Appendix 1
Figure A.8: The figure shows cost per kilometer for BEV and e-petrol cars ifindustry electricity price would be 75 [e/MWh].
Figure A.9: The figure shows cost per kilometer for BEV and e-methanol cars ifbattery cost would be 70 [e/kWh].
Figure A.10: The figure shows cost per kilometer for BEV and e-diesel cars ifbattery cost would be 70 [e/kWh].
IV

A. Appendix 1
Figure A.11: The figure shows cost per kilometer for BEV and e-petrol cars ifbattery cost would be 70 [e/kWh].
Figure A.12: The figure shows cost per kilometer for BEV and e-methanol cars ifbattery cost would be 280 [e/kWh].
Figure A.13: The figure shows cost per kilometer for BEV and e-diesel cars ifbattery cost would be 280 [e/kWh].
V

A. Appendix 1
Figure A.14: The figure shows cost per kilometer for BEV and e-petrol cars ifbattery cost would be 280 [e/kWh].
VI

BAppendix 2
Figure B.1: The figure shows cost per kilometer for BEV and e-methanol cars ifthe electrolyzer had 90% efficiency.
Figure B.2: The figure shows cost per kilometer for BEV and e-diesel cars if theelectrolyzer had 90% efficiency.
VII

B. Appendix 2
Figure B.3: The figure shows cost per kilometer for BEV and e-petrol cars if theelectrolyzer had 90% efficiency.
Figure B.4: The figure shows the electricity demand GTW per kilometer to propelBEV and e-methanol driven cars in each cycle if the electrolyzer had 90% efficiency.
VIII

B. Appendix 2
Figure B.5: The figure shows the electricity demand GTW per kilometer to propele-diesel and e-petrol driven cars in each cycle if the electrolyzer had 90% efficiency.
Figure B.6: The figure shows cost per kilometer for BEV and e-methanol cars ifthe capacity factor of the e-methanol factory would be 10%.
IX

B. Appendix 2
Figure B.7: The figure shows cost per kilometer for BEV and e-diesel cars if thecapacity factor of the e-diesel factory would be 10%.
Figure B.8: The figure shows cost per kilometer for BEV and e-petrol cars if thecapacity factor of the e-petrol factory would be 10%.
Figure B.9: The figure shows cost per kilometer for BEV and e-methanol cars ifthe capacity factor of the e-methanol factory would be 90%.
X

B. Appendix 2
Figure B.10: The figure shows cost per kilometer for BEV and e-diesel cars if thecapacity factor of the e-diesel factory would be 90%.
Figure B.11: The figure shows cost per kilometer for BEV and e-petrol cars if thecapacity factor of the e-petrol factory would be 90%.
XI


![Automated Autonomous Vehicles: Prospects and …thinking Transportation 2020-2030” [4]. The report claimed that vehicles equipped with gasoline fueled internal combustion engine](https://static.fdocuments.in/doc/165x107/5f206a0c09f2a96278431928/automated-autonomous-vehicles-prospects-and-thinking-transportation-2020-2030a.jpg)