KPANDAI DISTRICT ASSEMBLY
476
1 KPANDAI DISTRICT ASSEMBLY DIGITAL ADDRESS: NA 0057-1814 DISTRICT MEDIUM-TERM DEVELOPMENT PLAN UNDER THE MEDIUM-TERM NATIONAL DEVELOPMENT POLICY FRAMEWORK 2018-2021 PREPARED BY: DISTRICT PLANNING AND COORDINADING UNIT FEBRUARY 2018
Transcript of KPANDAI DISTRICT ASSEMBLY
1
KPANDAI DISTRICT ASSEMBLY
DIGITAL ADDRESS: NA 0057-1814
DISTRICT MEDIUM-TERM DEVELOPMENT PLAN UNDER
THE MEDIUM-TERM NATIONAL DEVELOPMENT POLICY FRAMEWORK 2018-2021
PREPARED BY: DISTRICT PLANNING AND COORDINADING UNIT
FEBRUARY 2018
2
Table of Contents ACKNOWLEDGEMENTS ........................................................................................................................... 7
LIST OF ACRONYMS/ABREVATIONS ........................................................................................................ 8
EXECUTIVE SUMMARY .......................................................................................................................... 12
Background ....................................................................................................................................... 12
Plan Preparation Process .................................................................................................................. 13
CHAPTER ONE ....................................................................................................................................... 15
1.1 PERFORMANVE REVIEW, PROFILE AND CURRENT SITUATION OF KPDA ........................................ 15
1.1.2 INTRODUCTION .................................................................................................................... 15
1.2 VISION: .................................................................................................................................... 15
1.3 MISSION: ................................................................................................................................. 15
1.4 CORE VALUE: ........................................................................................................................... 15
1.5 FUNCTIONS ............................................................................................................................. 15
1.6 Performance Review of District Medium Term Development Plan (DMTDP) ........................ 18
ICT ................................................................................................................................................. 21
Health ............................................................................................................................................ 21
Poverty Reduction ......................................................................................................................... 22
Governance ................................................................................................................................... 22
Monitoring and Evaluation ........................................................................................................... 22
Table 1.1. Status Report on the Implementation of the Activities of 2010-2017 DMTDP ........... 23
Table 1.2 PERFORMANCE OF THE DISTRICT FROM 2014 TO 2017 ............................................... 36
Table 1.3: Performance of the MMDA during 2017 .................................................................. 109
Table 1.4: Performance of the MMDA ........................................................................................ 110
Table 1.5: Performance of the MMDA during 2017 .................................................................. 121
AREA COUNCIL MAP ....................................................................................................................... 126
Table 1.6: Population by age, sex and type of locality ................................................................ 130
Figure 1.1: Population pyramid by age and sex .............................................................................. 133
Table 2.7: Reported district distribution of total fertility rate general fertility rate and
crude birth rate ........................................................................................................................... 134
Table 1.8: Female population 12 years and older by age, children ever born, children surviving
and sex of child ........................................................................................................................... 136
Table 1.9: Birthplace of migrants by duration of stay at current residence ............................... 137
Figure 1.2: Bar chart showing economic activity status ................................................................. 140
Table 1.10: Population 15 years and older by activity status and sex ........................................ 141
Table 1.11: Employed population 15 years and older by sex, age and activity status ............... 143
Table 1.12: Employed population 15 years and older by occupation and sex ........................... 145
3
Table 1.13: Employed population 15 years and older by Industry and Sex ................................ 146
Figure 1.3: Bar chart showing employment status by sex .............................................................. 148
Table 1.14: Employed population 15 years and older by employment status and sex .............. 149
Table 1.15: Employed population 15 years and older by employment sector and sex .............. 150
Figure 1.4: Bar chart showing the type of farming activity by locality ........................................... 151
Table 1.16: Agricultural activity of household members by locality ........................................... 152
Table 1.17: Distribution of livestock and keepers ....................................................................... 152
Table 1.18: Stock of houses and households by type of locality ................................................ 155
Figure 1.5: Pie chart showing main source of power or energy ..................................................... 156
Table 1.19: Main source of lighting of dwelling unit by type of locality ..................................... 157
Figure 1.6: Bar chart showing source of water ............................................................................... 158
Table 1.20: Main source of water for drinking and other domestic purposes ........................... 158
Figure 1.7: Main source of water for other domestic use of household ........................................ 160
Table 1.21: Main source of cooking fuel, and cooking space used by households by type of
Locality ........................................................................................................................................ 161
Figure 1.8: Bar chart showing toilet facilities.................................................................................. 163
Figure 1.9: Pie chart showing disability type .................................................................................. 168
Table 1.22: Disability status of population by locality and sex ................................................... 169
Table 1.23: Persons 15 years and older with disability by economic activity status and sex .... 171
Figure 1.10: The New Local Government Structure ....................................................................... 178
Table 1.24: NGOs in District ........................................................................................................ 181
Table 1.25: Total Number of Schools by Category ...................................................................... 182
Table 1.26: Circuits and their Schools ......................................................................................... 182
Table 1.28: Pupil Teacher Ratio .................................................................................................. 183
Table 1.29: Enrolment/completion/transition rate ................................................................... 184
Table 1.30: Schools without Standard Structures ....................................................................... 185
Table 1.32: Top Ten disease that from 2015-2017 .................................................................... 189
Table 1.33: Distribution of Health Personnel by Facility ............................................................. 189
Table 1.34: Population 12 years and older by sex, mobile phone ownership and internet Facility
usage ........................................................................................................................................... 192
Table 1.35: Household ownership of desktop/laptop computers and fixed telephone by sex of
head ............................................................................................................................................ 194
Table 1.36: Population Distribution by Gender .......................................................................... 195
Table 1.37: Composition of the general Assembly ..................................................................... 196
Table 1.38: Heads of Departments ............................................................................................. 196
Table 1.39: Indicators Education by Gender ............................................................................... 196
4
Table 1.40: Population 15 years and older by activity status and sex ........................................ 197
Table1.41: Employed population 15 years and older by occupation and sex ............................ 198
Table1.42. Harmonisation of Community needs and Aspirations with identified Development
Problems/Issues from review of performance and profiling from 2010-2013. GSGDA1 Thematic
Area: Human Resource Development, Productivity and Employment....................................... 202
Table 1.43: Kumdi Area Council .................................................................................................. 205
Table 1.44: Kpandai Town Council .............................................................................................. 206
Table 1.45: Nkanchina/Balai Area Council .................................................................................. 206
Table 1.46: Lonto Area Council ................................................................................................... 207
Table 1.47: Kabonwule Area Council .......................................................................................... 208
2.0 DEVELOPMENT ISSUES .................................................................................................................. 214
2.1 INTRODUCTION ..................................................................................................................... 214
2.2 ADOPTION OF DEVELOPMENT ISSUES FROM THE NATIONAL MEDIUM TERM DEVELOPMENT
POLICY ............................................................................................................................................. 214
2.3 ANALYSIS OF THE POTENTIALS, OPPORTUNITIES, CONSTRAINTS AND CHALLENGES OF THE
DISTRICT (POCC ANALYSIS) ............................................................................................................. 241
Table 2.2: Analysis of the Potentials, Opportunities, Constraints and Challenges ..................... 241
CHAPTER THREE .................................................................................................................................. 265
3.0 DEVELOPMENT PROJECTIONS, ADOPTED GOALS, SUB-GOALS, OBJECTIVES AND STRATEGIES ... 265
3.1 District Goal ............................................................................................................................... 265
3.2 District Sector Specific Goals ..................................................................................................... 265
3.2.1 Adopted Goal under Economic Development ................................................................... 265
3.2.2 Adopted Goal under Social Development.......................................................................... 265
3.2.3 Adopted Goal under Environment, Infrastructure and Human Settlements Development
.................................................................................................................................................... 265
3.2.4 Adopted Goal under Governance, Corruption and Public Accountability ......................... 265
3.3 Development Projections ......................................................................................................... 265
3.4 ECONOMIC DEVELOPMENT .................................................................................................... 269
3.4.1 DISTRICT DEVELOPMENT POLICY MATRIX LINKED WITH THE SDGs ................................. 269
CHAPTER FOUR ................................................................................................................................... 321
4.0 DEVELOPMENT PROGRAMMES .................................................................................................... 321
4.1 Introduction .............................................................................................................................. 321
4.2 Composite Programme of Action .............................................................................................. 321
Programme of Action (PoA) ................................................................................................................ 322
CHAPTER FIVE ..................................................................................................................................... 326
5.0 Annual Action Plans of the Kpandai District Assembly ................................................................. 326
5
5.1 Introduction .............................................................................................................................. 326
5.2 The District Assembly ................................................................................................................ 326
5.3 Decentralized Departments and Agencies ................................................................................ 327
5.4 Financing Agencies and Non-Governmental Organizations (NGOs) ......................................... 327
5.5 Regional Coordinating Council .................................................................................................. 327
5.6 Mobilization of Funds ............................................................................................................... 327
CHAPTER SIX ........................................................................................................................................ 447
6.0: Implementation, Monitoring and Evaluation .............................................................................. 447
6.1.1 Stakeholders Analysis ............................................................................................................ 447
6.1.2 Data Collection and Collation ................................................................................................ 449
6.1.3 Data Analysis and Use ............................................................................................................ 450
6.1.4 Reporting & Dissemination of M&E Reports ......................................................................... 450
6.2 Monitoring Indicators ............................................................................................................... 450
6.3 MONITORIG AND EVALUATION CALENDER .............................................................................. 464
6.4 QUARTERLY AND ANNUAL PROGRESS REPORTING FORMAT ................................................... 468
6.5 DESSEMINATION AND COMMUNICATION STRATEGY .............................................................. 468
6.5.1 Awareness Creation on Roles of Stakeholders .................................................................. 469
6.5.2 Promotion of Dialogue and Generation of Feedback ........................................................ 469
6.5.3 Conclusion .......................................................................................................................... 469
6.6 PROJECT EVALUATION .............................................................................................................. 471
6.6.1 EVALUATION GUIDE ........................................................................................................... 472
6.7: PARTICIPATORY MONITORING AND EVALUATION ARRANGEMENT ....................................... 473
6.8: ENVIRONMENTAL SUSTAINABILITY ......................................................................................... 474
6.8.1 Purpose of the SEA ...................................................................................................... 474
6.8.2 Scope of the SEA ......................................................................................................... 474
6.8.3 Methodology ............................................................................................................... 475
6.8.4 Institutional and Regulatory Requirements ................................................................ 475

6
7
ACKNOWLEDGEMENTS The preparation of this plan would not have been possible without the commitment and dedication
of certain individuals, organizations and other stakeholders. On behalf of the Kpandai District
Assembly and on my own behalf as the District Chief Executive, I would like to sincerely thank all
those who made invaluable contributions to the plan preparation process.
First, Kpandai District Assembly thanks the entire DPCU under the Chairmanship of the District Co-
coordinating Director; Mr. Samuel Owusu Boateng for facilitating the plan preparation process,
provision of funds and other logistics. The immense and diverse contributions of the DPCU members
are deeply appreciated.
Secondly, I appreciate the enthusiasm with which the core plan preparation team led by the District
Planning Officer, Mr. Alidu A. Abukari and late Budget Officer (Mr.Issah Sadat ) for their time,
effort and commitment to the completion of the plan. Without the technical support provided by
Mr. Francis Oyum (Governance Advisor GC/RING) it would have been difficult to accomplish this
arduous task. The Kpandai Disitrict Assembly is thus grateful for their assistance. The Assembly
cannot forget the tremendous and selfless efforts of M/S Jonathan Naami (PM) David, Aidam and
Sulemana Adams (GES) Osman Chimsi and Iddrisu Ismail (GHS) M/S Alhassan D. Alhassan and Issisfu
J. Josephp (DSWCD), M/S Dennis Mensah and Salifu Ibn (Works Dept) M/S Duut Maaliyu and Shei
Joseph (EHU) M/S Mahama Nayi Yakubu, Adam Nurudeen, Mohammed Baba Rahaman (DPCU)
towards putting together this document.
Thirdly, all Town and Area Council members, staff of sector departments, development partners
including USAID and Global Communities/RING, Traditional Authorities, Assembly men and women,
and others who provided data and participated in the public hearings as well as other individuals
whose names are not mentioned may the Good Lord bless you abundantly. It is my fervent hope and
prayer that the zeal, vigour and enthusiasm expressed by stakeholders during the preparation of the
Plan will be readily exhibited during its implementation.
……………………………………………………………………….
HONOURABLE ATTAH KOFI EMMANUEL TATABLATA
8
LIST OF ACRONYMS/ABREVATIONS A/TC Area/Town Council
ACD Agro-Chemical Dealers
AEAs Agric Extension Agencies
AEAs Agriculture extension officers
ANC Antenatal Care
ART Anti-Retroviral Therapy
BECE Basic Education Certificate Examination
BEmONC Basic Emergency Obstetric and Newborn Care
BHs Bore Holes
CLTs Community Led Total Sanitation
KDH Kpandai District Hospital
CBMF Community-Based Milling & Fortification
CHAG Christian Health Association of Ghana
CHOs Community Health Officers
CHPS Community Health Planning Systems
CMAM Community Management of Acute Malnutrition
CSOs Civil Society Organisations
D.H.M.T District Health Management Team
DA District Assembly
DACF District Assembly Common Fund
DCD District Co-ordinating Director
DCE District Chief Executive
DGPD Development of Global Partnership for Development
DMTDP District Medium Term Development Plan
9
DPCU District Planning Coordinating Unit
DWD District Works Department
DWST District Water and Sanitation Team
ECDC Early Childhood Development centres
KPDA Kpandai District District Assembly
FAITH Feasibility and Acceptability of Introducing standard days’ method for Improved
Health
FBOs Farmer Base Organisations
FPE Family Planning Education
GES Ghana Education Service
GHS Ghana Health Service
GIPC Ghana Investment Promotion Centre
GPI Gender Parity Index
GSGDA Ghana Shared Growth and Development Agenda
GSS Ghana Statistical Service
HDWs Hand Dug Wells
HEP Hydro- Electric Power
HIV/AIDS Human Immune Virus/ Acquire Immune Deficiency Syndrome
ICT Information and Communication Technology
IGF Internally Generated Fund
IRS Indoor Residual Spraying
JHS Junior High School
KG Kindergarten
KVIPs Kumasi Ventilated Improved Pits
LBW Low Birth Weight
LEAP Livelihood Empowerment Alternative Programme
LI Legislative Instrument
MDGs Millennium Development Goals
M&E Monitoring and Evaluation
10
MLRD Ministry of Local Government and Rural Development
MMDAs Metropolitan Municipal and District Assemblies
MOFA Ministry of Food and Agriculture
MTDP Medium Term Development Plan
NADMO National Disaster Management Organization
NGOs Non- Governmental Organisations
NHIS National Health Insurance Scheme
NMCCSP Nutrition and Malaria Control for Child Survival Project
NPF National Policy Framework
NR Northern Region
NTD National Teachers’ Day
OPD Out- Patient Department
PHC Population and Housing Census
PLWDs People Living With Disabilities
PLWHIV People living With Human Immune Virus
PMTCT Prevention of Mother to Child Transmission
PNC Postnatal Care
PNDC Provisional National Defense Council
RING Resilience In Northern Region
RMNCH Reproductive Health, Maternal, Newborn, Child Health
SAM Severe Acute Malnutrition
SDM Standard Days Method
SHS Senior High School
SMEs Small and Medium Enterprises
SMS Small and Medium Scale
TA Traditional Authorities
TBA Traditional Birth Attendance
TC Traditional Council
11
UC Unit committee
UWR Upper West Region
UNICEF United Nations Children Fund
UNFPA United Nations Population Fund
VIPs Ventilated Improved Pits
WHO World Health Organization
12
EXECUTIVE SUMMARY
Background Ghana Government’s policy on decentralization as specified in the fourth Republican Constitution of
1992, the Local Governance Act 2016, (Act 936), National Development Planning Commission Act
1994 (Act 479), National Development Planning System Act 1994 (Act 480), prescribes that
responsibility for sub-national development planning is placed on MMDAs, and will function through
their respective Executive Committees and the District Planning Coordinating Units (DPCU).
In the light of the decentralized approach to governance and development planning, districts are the
basic planning units in Ghana. They form the administrative and political authority at local level and
therefore, to realise the ‘’Agenda for Jobs: Creating Prosperity and Equal Opportunity for All’’, the
MMDAs, drawing from the medium-term national development policy framework prepared by
NDPC, will ensure the preparation of plans and budgets of Districts for transmission to the
Government for final approval.
Prior to the preparation of 2018–2021 MTDP, the Kpandai District Assembly has prepared and
executed similar plans including the following:
2010-2013 DMTDP under GSGDA I
2014-2017 DMTDP under GSGDA II
Substantial progress has been made towards the execution of programmes and projects geared
towards solving the socio–economic needs of residents in the district over the years. Nevertheless,
not all the programmes and projects planned were executed during these periods. This gap has
resulted due to certain difficulties uncounted by the Assembly. Among them include
Inadequate/irregular flow of funds
Weak coordination in implementation of programmes/projects and utilizing the feedback therein
Weak capacity to mobilise internally generated funds for project implementation
Dwindling donor support to the district Implementation of programmes and projects outside the
plans.
Interference of the operation of the District Assembly
The current MTDP (2018 - 2021) has been prepared based on “An Agenda for Jobs: Creating
Prosperity and Equal Opportunity for All”. Considering the challenges and setbacks of the
immediate past, the current framework outlines the development policies and strategies that will
guide the management of the district between 2018 and 2021. The focus areas where resources will
be concentrated within this period include:
Creating opportunities for all Ghanaians;
Safeguarding the natural environment and ensuring a resilient built environment;
Maintaining a stable, united and safe country; and Building a prosperous nation.
13
Plan Preparation Process (i) Formation of the Plan Preparation Team:
Several processes have been undertaken towards the preparation of the MTDP. The plan
preparation process started with the formation of the Plan Preparation Team, under the
Chairmanship of the District Co-ordinating Director, with other members drawn from the Heads of
the Decentralised Department. The Plan Preparation Team was constituted to prepare the grounds
for the eventual preparation of the plan document. Other key stakeholders were included in the
plan preparation process.
(ii) Ensuring Community Ownership of Plan:
In order to ensure ownership of the plan, community members, Traditional Authorities and civil
society organisations and all other relevant stake holders were vigorously engaged. They were
involved throughout the planning process from the area council level to the various consultative fora
at the district level. In many instances they were given the opportunity to lead the discussions.
(iii) Data analysis and Public Hearing:
Following the data collection and analysis, a public hearing was organised for Traditional Rulers,
Assembly Members, Heads of Decentralised Departments as well as the General Public to present a
review of performance of the immediate past plan with a view to soliciting suggestions to bridge the
identified gaps and more importantly assessing critically their implications for future planning.
(c) Final Hearing and Approval
A second and final Public Hearing was convened for the entire public after the plan had been
completed. The essence of this second hearing was to enable the public deliberate on programmes
and projects that had been embodied in the plan document. This hearing was also to give the
opportunity to all manner of persons who have a stake in the development of the district to either
criticize the document, make modifications or comments before the final submission of the draft
document to the National Development Planning Commission (NDPC).
(d) Scope and Direction of Interventions of the DMTDP
The Kpandai District is the geographical focus of the plan. The DMTDP proposes programmes and
projects that need to be executed between 2018 and 2021. The main police framework that guided
the preparation of the DMTDP and will guide the flow of resources is ‘’Agenda for job: creating
prosperity and equal opportunity for All’’
The ‘’Agenda for job: creating Prosperity and equal opportunity for All’ have five areas that need
concerted efforts to ensure overall growth and development of the economic. These areas are
Economy Development
Social Development
Environment, Infrastructure And Human Settlements
Governance, Corruption and Public Accountability
14
Ghana and The International Community
Guided by this policy framework, it is envisaged that at the end of the plan period considerable
improvement would have been achieved in the following areas:
Creating opportunities for all Ghanaians;
Safeguarding the natural environment and ensuring a resilient built environment;
Maintaining a stable, united and safe country; and Building a prosperous nation.
15
CHAPTER ONE
1.1 PERFORMANVE REVIEW, PROFILE AND CURRENT SITUATION OF
KPDA
1.1.2 INTRODUCTION
This chapter focuses on the vision, mission, core values as well as the functions of the Kpandai
District Assembly. Also contain in this chapter, is the analysis of the performance of the 2014-2017
District Medium Term Development plan implementation under the Ghana Shared Growth and
Development Agenda II (GSGDA II).
The chapter also captures analysis of current sector development situation and the profile of the
district as well as summary of key development problems identified from the analysis of the current
development situation.
1.2 VISION:
A district that will be one of the best in the country where there is development in peace, unity and
indeed adequate provision of security for all.
1.3 MISSION:
The Kpandai District Assembly exists to improve the livelihood of the people through the provision of
socioeconomic infrastructure in an equitable and just manner.
1.4 CORE VALUE:
1. Client-orientation, Loyalty and Commitment
2. Transparency and accountability
3. Diligence, Discipline and Timeliness
4. Creativity and Innovativeness
5. Equity and Impartiality
6. Integrity
7. Anonymity and Permanence
1.5 FUNCTIONS
In accordance to section 245, of the 1992 Republican constitution and section 13 of the Local
Governance Act 2016, (Act 936) the Kpandai District is mandated to perform the following Functions
as prescribe.
(1) The Kpandai District Assembly shall
(a) Exercise political and administrative authority in the district;
16
(b) Promote local economic development; levying and collection of taxes, rates, duties and fees.
(c) Provide guidance, give direction to and supervise other administrative authorities in the district
as may be prescribed by law.
(2) A District Assembly shall exercise deliberative, legislative and executive functions.
(3) Without limiting subsections (1) and (2), a District Assembly shall
(a) Be responsible for the overall development of the district;
(b) Formulate and execute plans, programmes and strategies for the effective mobilisation of the
resources necessary for the overall development of the district;
(c) Promote and support productive activity and social development in the district and remove any
obstacles to initiative and development;
(d) sponsor the education of students from the district to fill particular manpower needs of the
district especially in the social sectors of education and health, making sure that the sponsorship is
fairly and equitably balanced between male and female students;
(e) Initiate programmes for the development of basic infrastructure and provide municipal works
and services in the district;
(f) Be responsible for the development, improvement and management of human settlements and
the environment in the district;
(g) In co-operation with the appropriate national and local security agencies, be responsible for the
maintenance of security and public safety in the district;
(h) Ensure ready access to courts in the district for the promotion of justice;
(i) Act to preserve and promote the cultural heritage within the district;
(j) Initiate, sponsor or carry out studies that may be necessary for the discharge of any of the duties
conferred by this Act or any other enactment; and
(4) A District Assembly shall take the steps and measures that are necessary and expedient to
(a) Execute approved development plans for the district;
(b) Guide, encourage and support sub-district local structures, public agencies and local communities
to perform their functions in the execution of approved development plans;
(c) Initiate and encourage joint participation with other persons or bodies to execute approved
development plans;
(d) Promote or encourage other persons or bodies to undertake projects under approved
development plans; and
(e) Monitor the execution of projects under approved development plans and assess and evaluate
their impact on the development of the district and national economy in accordance with
government policy.
17
(5) A District Assembly shall co-ordinate, integrate and harmonise the execution of programmes and
projects under approved development plans for the district and other development programmes
promoted or carried out by Ministries, Departments, public corporations and other statutory bodies
and non-governmental organisations in the district.
(6) A District Assembly in the discharge of its duties shall
(a) Be subject to the general guidance and direction of the President on matters of national policy;
and
(b) Act in co-operation with the appropriate public corporation, statutory body or non-governmental
organisation.
(7) Public corporations, statutory bodies and non-governmental organisations shall co-operate with
a District Assembly in the performance of their functions.
(8) In the event of a conflict between a District Assembly and an agency of the central Government,
public corporation, statutory body, non-governmental organisation or individual over the application
of subsection (5), (6) or (7), the matter shall be referred by either or both parties to the Regional Co-
ordinating Council for resolution.
Functions under other enactments
13. (1) A District Assembly shall be the authority to carry out and execute within its district the
provisions of
(a) The Auction Sales Act, 1989 (P.N.D.C.L. 230);
(b) The Liquor Licensing Act, 1970 (Act 331); and
(c) The Control and Prevention of Bushfires Act, 1990(P.N.D.C.L. 229).
(2) A District Assembly shall be the authority to carry out and execute the following provisions of the
Criminal Offences Act, 1960(Act 29) within its district:
(a) Section 296 in respect of throwing rubbish in the street; and
(b) Section 300 in respect of stray cattle.
(3) For the purpose of subsection (1), the District Assembly shall, within its district, have the powers,
rights, duties, capacities, liabilities and obligations of a person or authority mentioned in the
enactment.
(4) Subsection (3) does not include the powers of a court or the Commissioner of the Customs
Division of the Ghana Revenue Authority.
(5) For the purpose of the Liquor Licensing Act, 1970, (Act 331),the District Finance Officer or
another designated officer of the District Assembly shall be the Licensing Officer.
(6) For the purpose of section 296 of the Criminal Offences Act,1960 (Act 29), the reference to the
Engineer-in-Chief of Public Works includes the District Engineer of the District Assembly or an
Engineer appointed in writing by the District Assembly.
18
(7) For the purpose of section 300 of the Criminal Offences Act,1960 (Act 29), the District Finance
Officer or other designated officer of the District Assembly is deemed to be the Controller and
Accountant-General or the representative of the Controller and Accountant-General.
(8) Nothing contained in this section shall derogate from the statutory or other functions of the
police, whether exercisable under the enactments specified in this section or otherwise and any
person or authority performing a function under this subsection shall act in consultation with the
police.
1.6 Performance Review of District Medium Term Development Plan (DMTDP)
2014 – 2017
The main objective of KPDA is to develop programmes and projects that meet the goals and
aspirations of the people in the District. Such goals and aspirations must, as a matter of principle, be
in line with the National Policy Framework.
The policy guidelines for the country between 2014 and 2017 were based on Ghana Shared Growth
and Development Agenda (GSGDA). Therefore, the development plan which spanned from 2014 –
2017 was prepared and implemented on the basis of the GSGDA. Programmes and Projects which
were implemented had to undergo a review process to ascertain their levels of implementation
1.6.1 Review Process of MTDP
The level of implementation of the programmes and projects captured in the MTDP (2014-2017)
were considered under the following:
Fully implemented
Partially implemented
On-going and
Not implemented
The review process looked at:
The achievement rate of planned goals and objectives
Reasons for non-achievement of goals and objectives
Problems and constraints that militated against the project implementation process
The Lessons learnt out of the process and their implication for future planning
1.6.2 Thematic Areas of GSGDA I
Ensuring and sustaining macroeconomic stability
Enhanced competitiveness of Ghana’s private sector
Accelerated agricultural modernisation and natural resource management
Oil and gas development
Infrastructure and human settlement development
19
Human development, employment and productivity
Transparent and accountable governance
The development Policy Framework from which the DMTDP was developed was heavily influenced
by the Millennium Development Goals (MDGs) which are geared towards upgrading the livelihood
of poor people to reduce the level of poverty to insignificant level. The goals of MDGs are:
Eradicate Extreme Poverty.
Achieve Universal Primary Education.
Reduce Child Mortality.
Improve Maternal Health.
Promote Gender Equality and Empower Women.
Combat HIV/AIDS, Malaria and other diseases.
Ensure Environmental Sustainability.
Development of Gl obal Partnership for Development.
Guided by these policy frameworks, it was envisaged that at the end of the plan period considerable
improvement would have been achieved in the following areas:
Built Environment, Waste and Sanitation Management.
Increased Revenue Collection.
Job opportunities created for the unemployed / underemployed youth.
Local Economic Development and increased investment in small and medium enterprises.
Women and the vulnerable children under various forms of abuse/labour
1.6.3 Goals of the GSGDA I by Thematic Area
Ensuring and sustaining macroeconomic stability
Strengthen the revenue generation and mobilisation base of the District
Enhanced competitiveness of Ghana’s private sector
Increase production base of viable sectors of the district economy
Accelerated agricultural modernisation and natural resource management
Harness the economic resource potentials, facilitate the production of food crops and livestock as
well as improve management of natural resources of the district to ensure food security and reduce
the effects of climate
Infrastructure and human settlement development
20
To provide Basic Socio- Economic Infrastructure to reduce the incidence of water and sanitation
related diseases and accelerate the development of the local economy.
Human development, employment and productivity
Improve access and standard of health and education, ensure the protection of Children’s Rights
and reduce poverty, income inequalities to better the quality of life of people especially Women
and other vulnerable groups in the District
Transparent and accountable governance
Ensure effective Governance at the District and Sub-District Levels, ensure effective implementation
and monitoring of programmes and projects and improve upon the quality of life of the vulnerable
and excluded groups of the District
1.6.4 Objectives of the Focus Areas under the Thematic Areas
Ensuring and sustaining macroeconomic stability
Revenue Mobilization
Increase internally generated revenue of the District by at least 20% annually
Enhanced competitiveness of Ghana’s private sector
Local Enterprises
Promote and strengthen 150 micro, small and medium scale enterprises annually.
Enhance micro, small and medium scale women enterprise holdings by 50% annually
Accelerated agricultural modernization and natural resource management
Agriculture
To increase production of cereals, legumes and root crops by 20% annually.
Increase farmers’ access to good quality seeds and planting materials by at least 70% by 2017
To increase the establishment of women-owned Agro-processing interventions from 10 to 30 by
2017
To ensure Value Addition to some Agro-products by 2017
To increase production of horticultural crops by at least 20% annually between 2014- 2017
To ensure that 80% of horticultural farmers have access to available markets for their produce
outside the district by 2017
To increase production and utilisation of soya beans to 15,000 metric tonnes by 2017.
To reduce Post Harvest losses of Agricultural commodities by 10% per annum
21
To increase the production of livestock by 40% by 2017
Natural Resource Management
Prepare communities against the effects of global climatic changes.
Organise 2 public educations for 36 communities annually to reduce incidence of Bush Burning in the
District.
Monitor foreign herdsmen activities on the environment quarterly
Infrastructure and human settlement development
Water and Sanitation
To ensure that 70% of the population have access to potable water by 2017
To improve sanitation coverage from 12% to 25% by the year 2017
Feeder Roads
To improve upon 100 km of feeder roads in the District for easy transportation of goods, services
and people
Energy
To extend the National Grid to 25 rural communities in the district by 2017.
To provide solar power to 100 households in rural communities by 2017
ICT
To establish a district internet facility.
Human development, employment and productivity
Education
To increase total enrolment of basic schools by 20% by the year 2017
To reduce Pupil Teacher Ratio at Basic Schools from 1:53 to 1:40 by 2017
Health
To provide at least of 2No residential accommodation for medical Doctors communities by 2017.
To upgrade Kpandai Poly clinic to a District hospital by 2017
To reduce reported cases of top ten diseases by at least 50% by 2017
To increases the acceptance rate of family Planning by 45% by the year 2017.
Provide 7 CHPS Compounds by the end of 2017

22
Poverty Reduction
To reduce the migration of young women to southern part of the country by at least 65% by 2017.
To economically integrate all Kayayi [head porters] returnees into viable ventures of livelihoods
Transparent and accountable governance
Governance
Construct and furnish 2no office Accommodation by 2017
Construct and furnish 2no residential accommodation for workers by 2017.
Renovate 4no Area councils by 2017
Organise 2 workshops annually to sensitise sub-District structures, Traditional Authorities and other
key community leaders on Transparent and accountable Local Governance, DA Programmes, Rights
and Responsibility of Citizens, and the constitution
Organise at least 4 meetings of all sub-committees of the Assembly annually.
Organise at least 3 meetings of the general assembly annually
Monitoring and Evaluation
To effectively monitor and evaluate district programmes and projects.
Vulnerability and Excluded
To protect all children in the district against child labour and other forms of discrimination by 2017
To ensure that People Living with Disabilities [PLWDs] and the excluded are brought into the main
stream of socio-economic activities with at least 50% of them engaged in economic activity
23
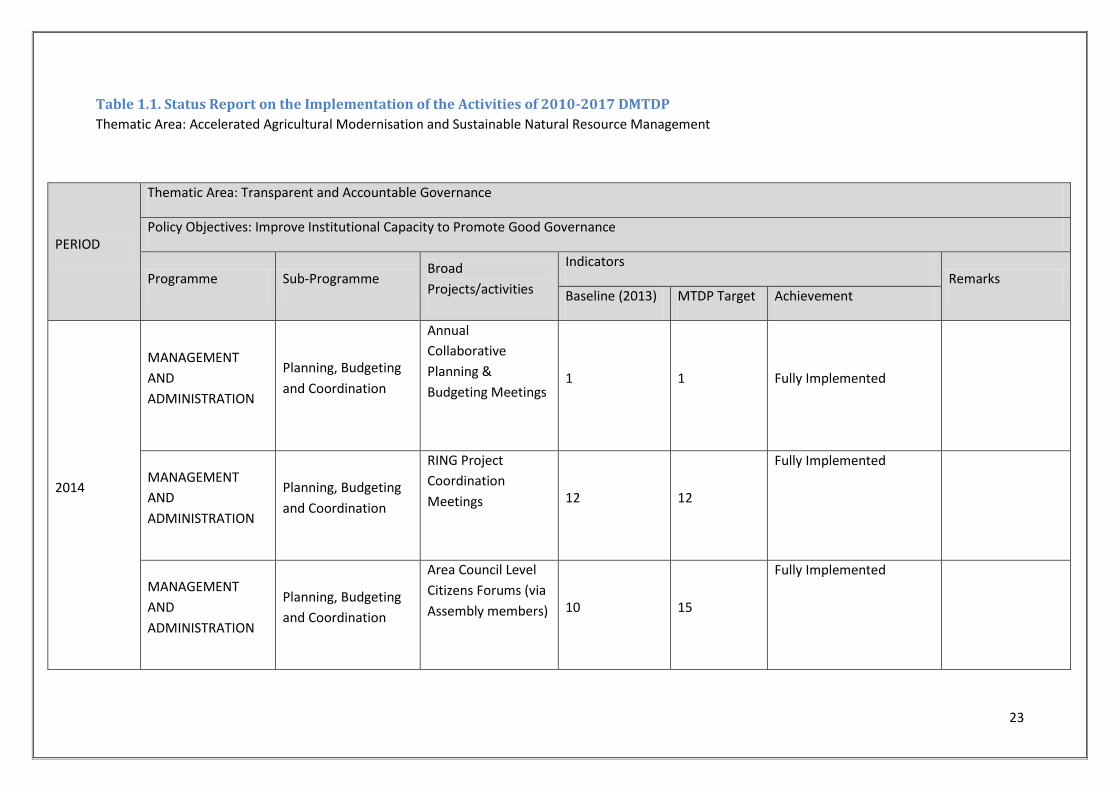
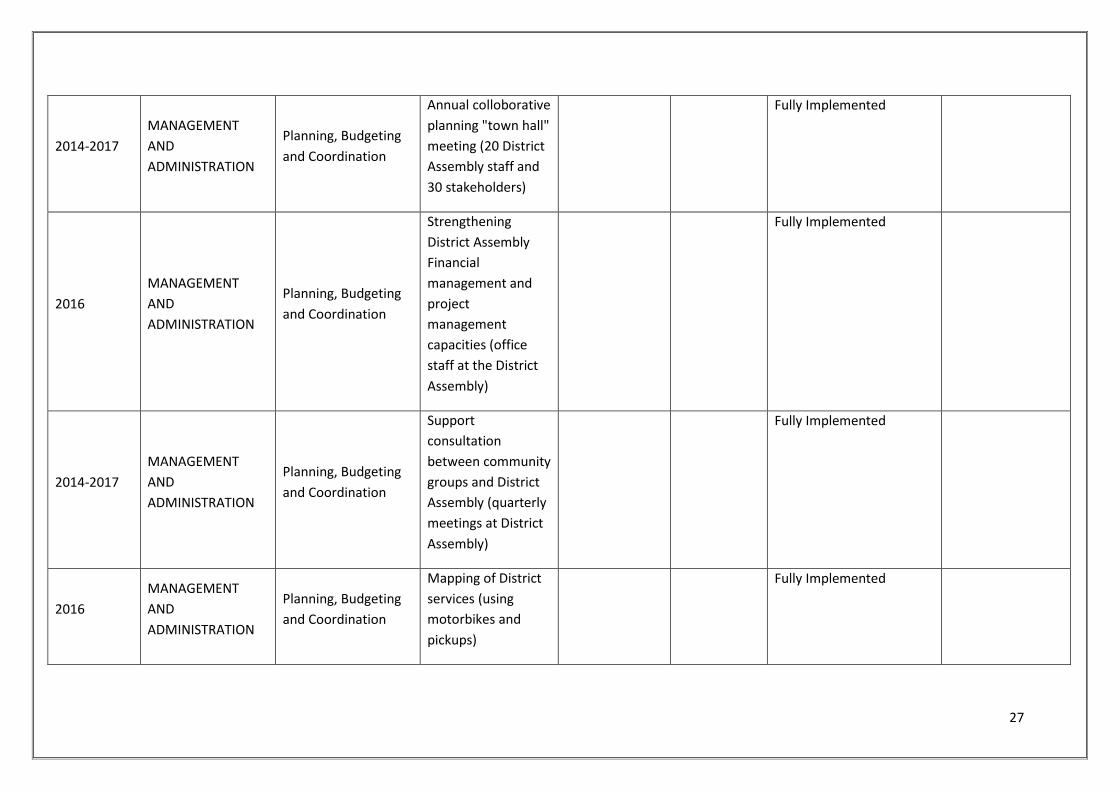
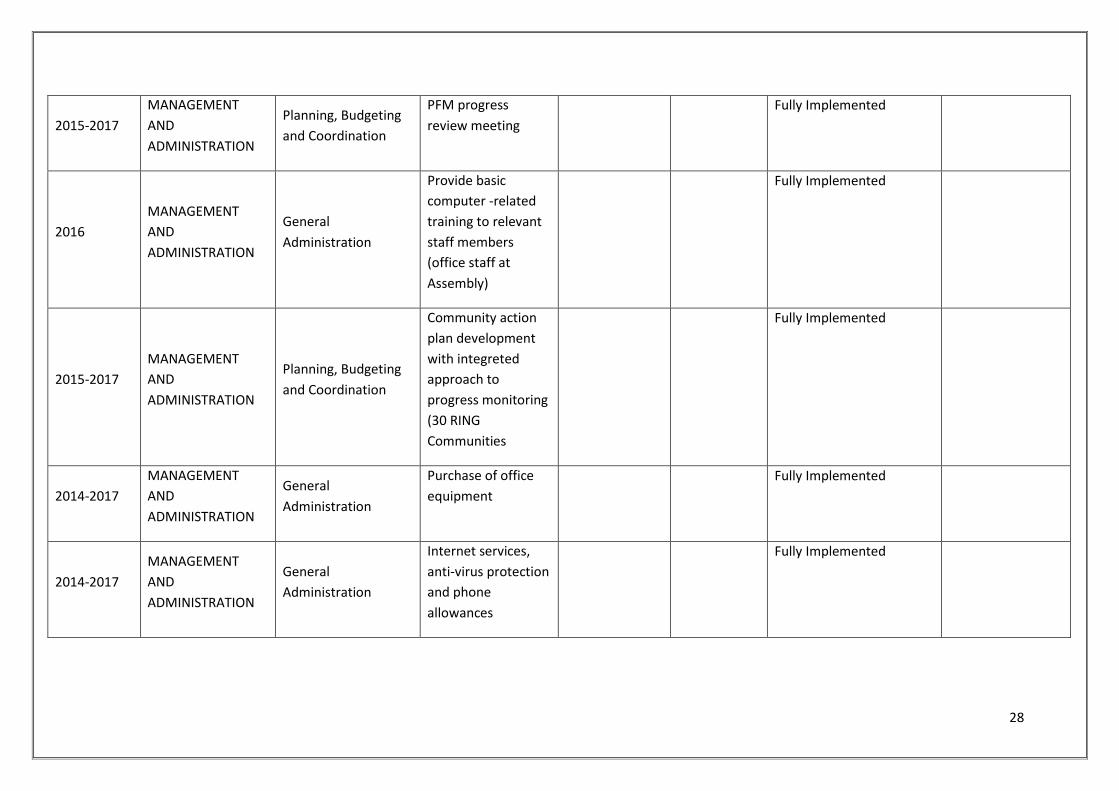
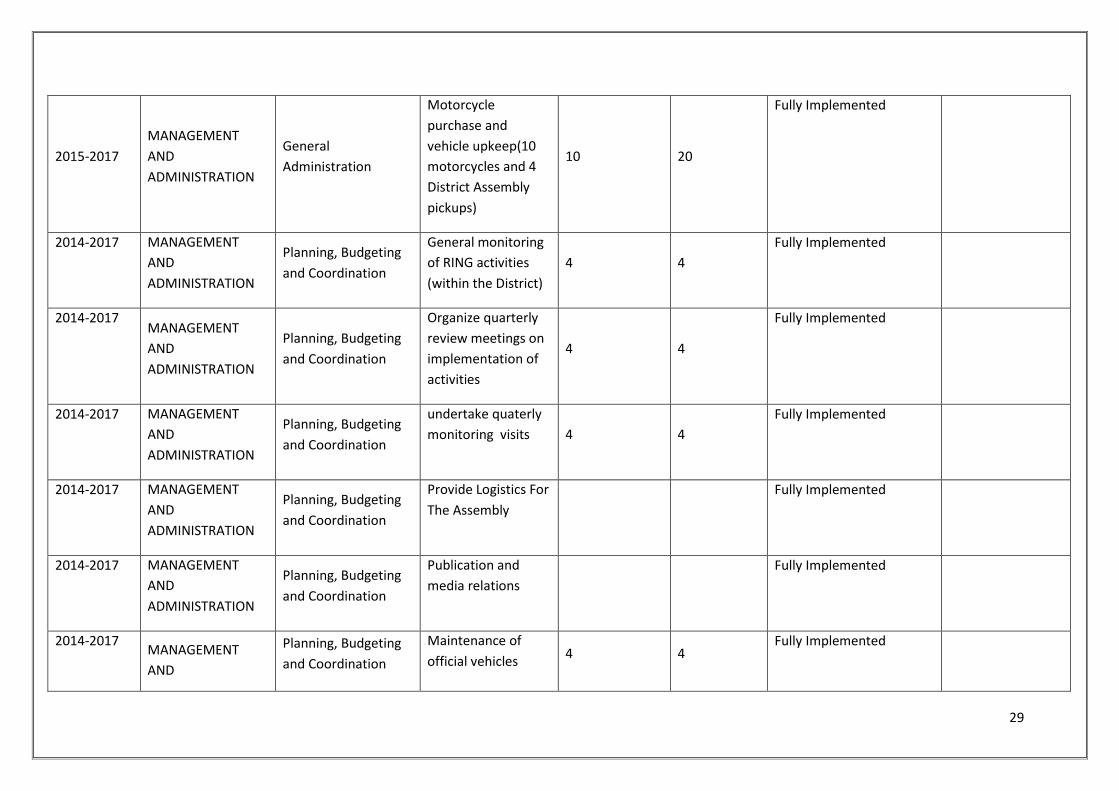
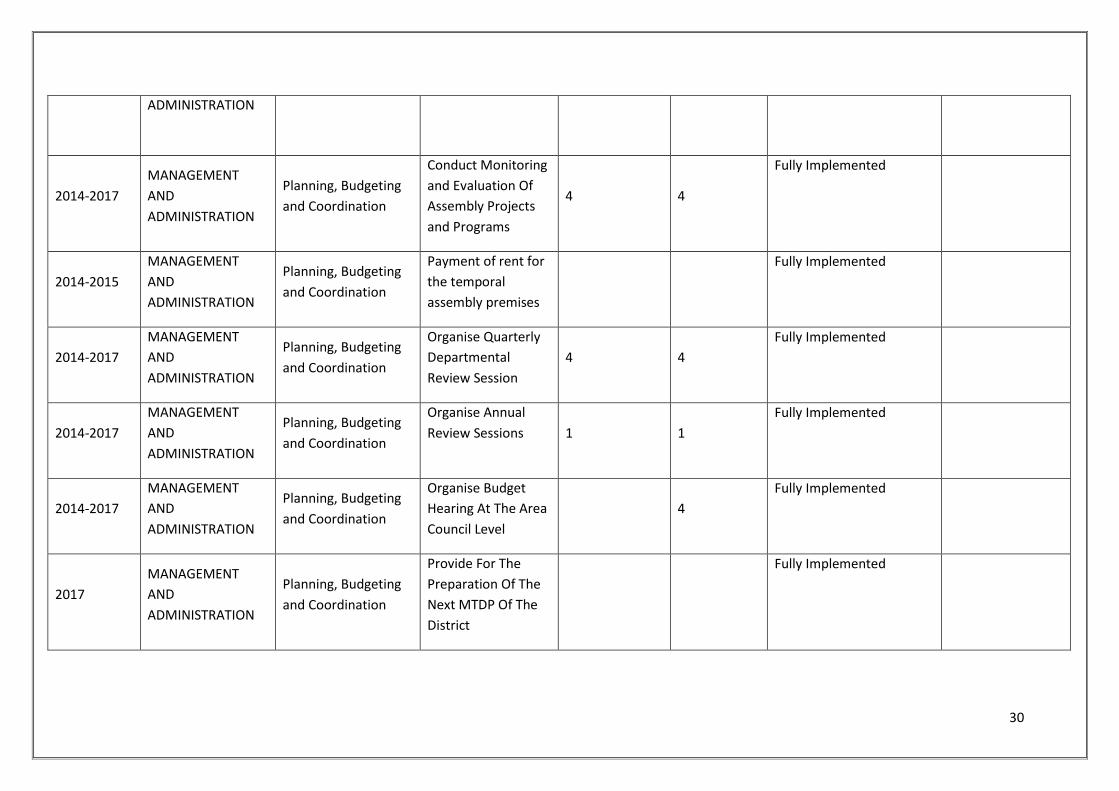
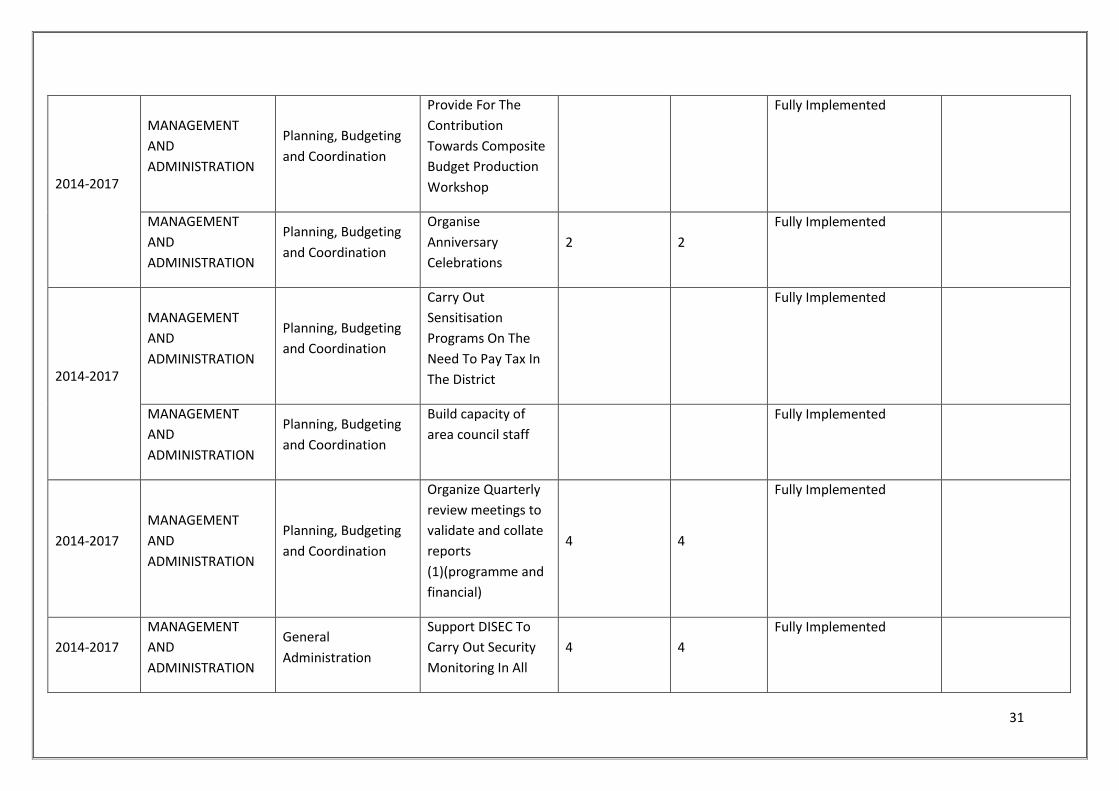
Table 1.1. Status Report on the Implementation of the Activities of 2010-2017 DMTDP
Thematic Area: Accelerated Agricultural Modernisation and Sustainable Natural Resource Management
PERIOD
Thematic Area: Transparent and Accountable Governance
Policy Objectives: Improve Institutional Capacity to Promote Good Governance
Programme Sub-Programme Broad
Projects/activities
Indicators Remarks
Baseline (2013) MTDP Target Achievement
2014
MANAGEMENT
AND
ADMINISTRATION
Planning, Budgeting
and Coordination
Annual
Collaborative
Planning &
Budgeting Meetings
1 1 Fully Implemented
MANAGEMENT
AND
ADMINISTRATION
Planning, Budgeting
and Coordination
RING Project
Coordination
Meetings
12 12
Fully Implemented
MANAGEMENT
AND
ADMINISTRATION
Planning, Budgeting
and Coordination
Area Council Level
Citizens Forums (via
Assembly members)
10 15
Fully Implemented
24
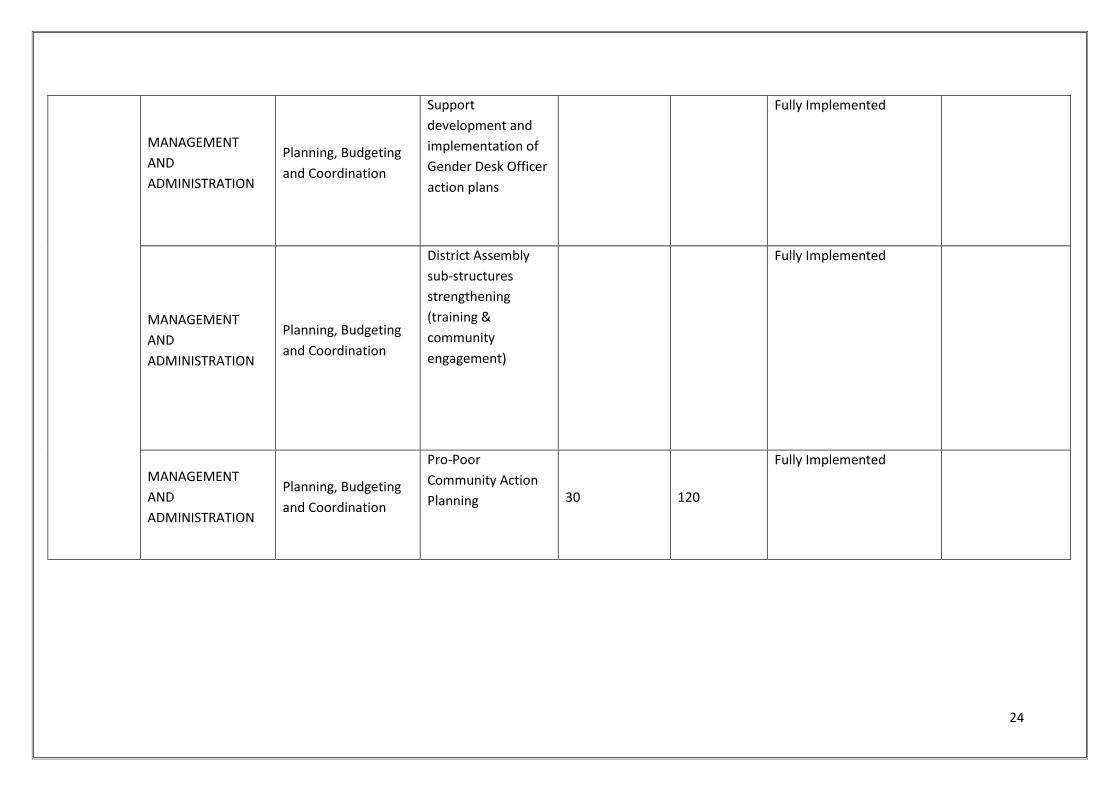
MANAGEMENT
AND
ADMINISTRATION
Planning, Budgeting
and Coordination
Support
development and
implementation of
Gender Desk Officer
action plans
Fully Implemented
MANAGEMENT
AND
ADMINISTRATION
Planning, Budgeting
and Coordination
District Assembly
sub-structures
strengthening
(training &
community
engagement)
Fully Implemented
MANAGEMENT
AND
ADMINISTRATION
Planning, Budgeting
and Coordination
Pro-Poor
Community Action
Planning
30 120
Fully Implemented
25
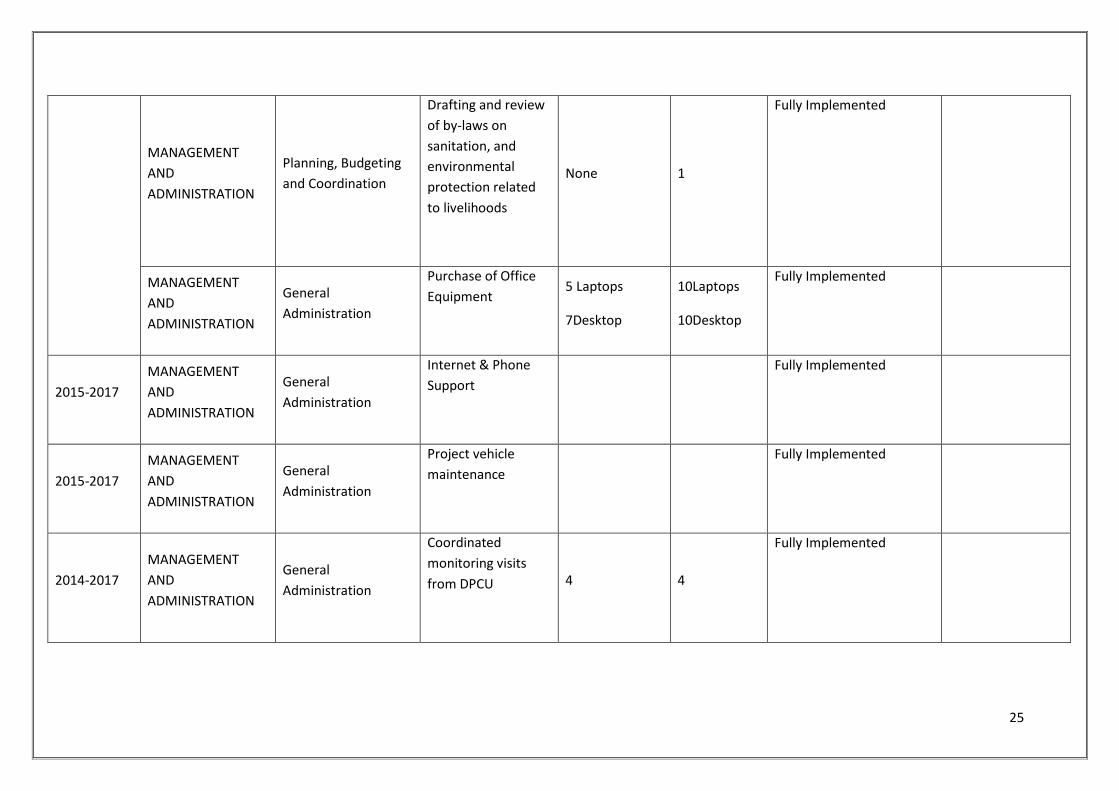
MANAGEMENT
AND
ADMINISTRATION
Planning, Budgeting
and Coordination
Drafting and review
of by-laws on
sanitation, and
environmental
protection related
to livelihoods
None 1
Fully Implemented
MANAGEMENT
AND
ADMINISTRATION
General
Administration
Purchase of Office
Equipment
5 Laptops
7Desktop
10Laptops
10Desktop
Fully Implemented
2015-2017
MANAGEMENT
AND
ADMINISTRATION
General
Administration
Internet & Phone
Support
Fully Implemented
2015-2017
MANAGEMENT
AND
ADMINISTRATION
General
Administration
Project vehicle
maintenance
Fully Implemented
2014-2017
MANAGEMENT
AND
ADMINISTRATION
General
Administration
Coordinated
monitoring visits
from DPCU
4 4
Fully Implemented
26
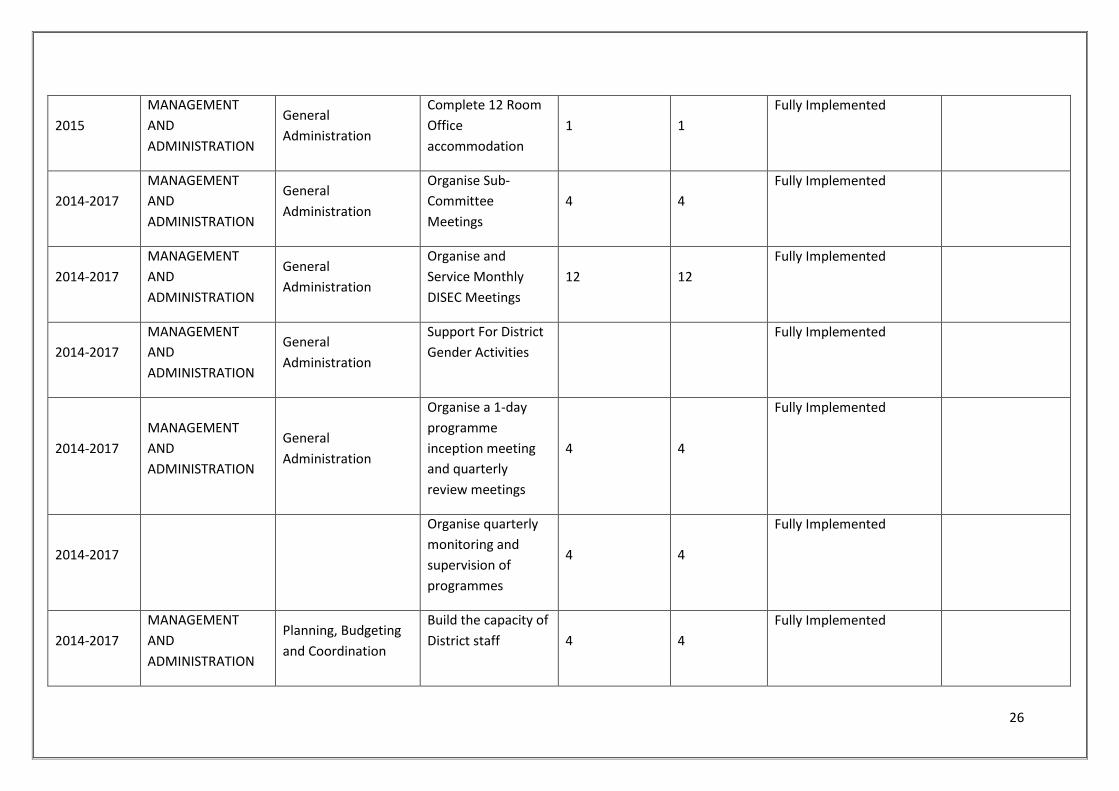
2015
MANAGEMENT
AND
ADMINISTRATION
General
Administration
Complete 12 Room
Office
accommodation
1 1
Fully Implemented
2014-2017
MANAGEMENT
AND
ADMINISTRATION
General
Administration
Organise Sub-
Committee
Meetings
4 4
Fully Implemented
2014-2017
MANAGEMENT
AND
ADMINISTRATION
General
Administration
Organise and
Service Monthly
DISEC Meetings
12 12
Fully Implemented
2014-2017
MANAGEMENT
AND
ADMINISTRATION
General
Administration
Support For District
Gender Activities
Fully Implemented
2014-2017
MANAGEMENT
AND
ADMINISTRATION
General
Administration
Organise a 1-day
programme
inception meeting
and quarterly
review meetings
4 4
Fully Implemented
2014-2017
Organise quarterly
monitoring and
supervision of
programmes
4 4
Fully Implemented
2014-2017
MANAGEMENT
AND
ADMINISTRATION
Planning, Budgeting
and Coordination
Build the capacity of
District staff 4 4
Fully Implemented
27
2014-2017
MANAGEMENT
AND
ADMINISTRATION
Planning, Budgeting
and Coordination
Annual colloborative
planning "town hall"
meeting (20 District
Assembly staff and
30 stakeholders)
Fully Implemented
2016
MANAGEMENT
AND
ADMINISTRATION
Planning, Budgeting
and Coordination
Strengthening
District Assembly
Financial
management and
project
management
capacities (office
staff at the District
Assembly)
Fully Implemented
2014-2017
MANAGEMENT
AND
ADMINISTRATION
Planning, Budgeting
and Coordination
Support
consultation
between community
groups and District
Assembly (quarterly
meetings at District
Assembly)
Fully Implemented
2016
MANAGEMENT
AND
ADMINISTRATION
Planning, Budgeting
and Coordination
Mapping of District
services (using
motorbikes and
pickups)
Fully Implemented
28
2015-2017
MANAGEMENT
AND
ADMINISTRATION
Planning, Budgeting
and Coordination
PFM progress
review meeting
Fully Implemented
2016
MANAGEMENT
AND
ADMINISTRATION
General
Administration
Provide basic
computer -related
training to relevant
staff members
(office staff at
Assembly)
Fully Implemented
2015-2017
MANAGEMENT
AND
ADMINISTRATION
Planning, Budgeting
and Coordination
Community action
plan development
with integreted
approach to
progress monitoring
(30 RING
Communities
Fully Implemented
2014-2017
MANAGEMENT
AND
ADMINISTRATION
General
Administration
Purchase of office
equipment
Fully Implemented
2014-2017
MANAGEMENT
AND
ADMINISTRATION
General
Administration
Internet services,
anti-virus protection
and phone
allowances
Fully Implemented
29
2015-2017
MANAGEMENT
AND
ADMINISTRATION
General
Administration
Motorcycle
purchase and
vehicle upkeep(10
motorcycles and 4
District Assembly
pickups)
10 20
Fully Implemented
2014-2017 MANAGEMENT
AND
ADMINISTRATION
Planning, Budgeting
and Coordination
General monitoring
of RING activities
(within the District)
4 4
Fully Implemented
2014-2017 MANAGEMENT
AND
ADMINISTRATION
Planning, Budgeting
and Coordination
Organize quarterly
review meetings on
implementation of
activities
4 4
Fully Implemented
2014-2017 MANAGEMENT
AND
ADMINISTRATION
Planning, Budgeting
and Coordination
undertake quaterly
monitoring visits 4 4
Fully Implemented
2014-2017 MANAGEMENT
AND
ADMINISTRATION
Planning, Budgeting
and Coordination
Provide Logistics For
The Assembly
Fully Implemented
2014-2017 MANAGEMENT
AND
ADMINISTRATION
Planning, Budgeting
and Coordination
Publication and
media relations
Fully Implemented
2014-2017 MANAGEMENT
AND
Planning, Budgeting
and Coordination
Maintenance of
official vehicles 4 4
Fully Implemented
30
ADMINISTRATION
2014-2017
MANAGEMENT
AND
ADMINISTRATION
Planning, Budgeting
and Coordination
Conduct Monitoring
and Evaluation Of
Assembly Projects
and Programs
4 4
Fully Implemented
2014-2015
MANAGEMENT
AND
ADMINISTRATION
Planning, Budgeting
and Coordination
Payment of rent for
the temporal
assembly premises
Fully Implemented
2014-2017
MANAGEMENT
AND
ADMINISTRATION
Planning, Budgeting
and Coordination
Organise Quarterly
Departmental
Review Session
4 4
Fully Implemented
2014-2017
MANAGEMENT
AND
ADMINISTRATION
Planning, Budgeting
and Coordination
Organise Annual
Review Sessions 1 1
Fully Implemented
2014-2017
MANAGEMENT
AND
ADMINISTRATION
Planning, Budgeting
and Coordination
Organise Budget
Hearing At The Area
Council Level
4
Fully Implemented
2017
MANAGEMENT
AND
ADMINISTRATION
Planning, Budgeting
and Coordination
Provide For The
Preparation Of The
Next MTDP Of The
District
Fully Implemented
31
2014-2017
MANAGEMENT
AND
ADMINISTRATION
Planning, Budgeting
and Coordination
Provide For The
Contribution
Towards Composite
Budget Production
Workshop
Fully Implemented
MANAGEMENT
AND
ADMINISTRATION
Planning, Budgeting
and Coordination
Organise
Anniversary
Celebrations
2 2
Fully Implemented
2014-2017
MANAGEMENT
AND
ADMINISTRATION
Planning, Budgeting
and Coordination
Carry Out
Sensitisation
Programs On The
Need To Pay Tax In
The District
Fully Implemented
MANAGEMENT
AND
ADMINISTRATION
Planning, Budgeting
and Coordination
Build capacity of
area council staff
Fully Implemented
2014-2017
MANAGEMENT
AND
ADMINISTRATION
Planning, Budgeting
and Coordination
Organize Quarterly
review meetings to
validate and collate
reports
(1)(programme and
financial)
4 4
Fully Implemented
2014-2017
MANAGEMENT
AND
ADMINISTRATION
General
Administration
Support DISEC To
Carry Out Security
Monitoring In All
4 4
Fully Implemented
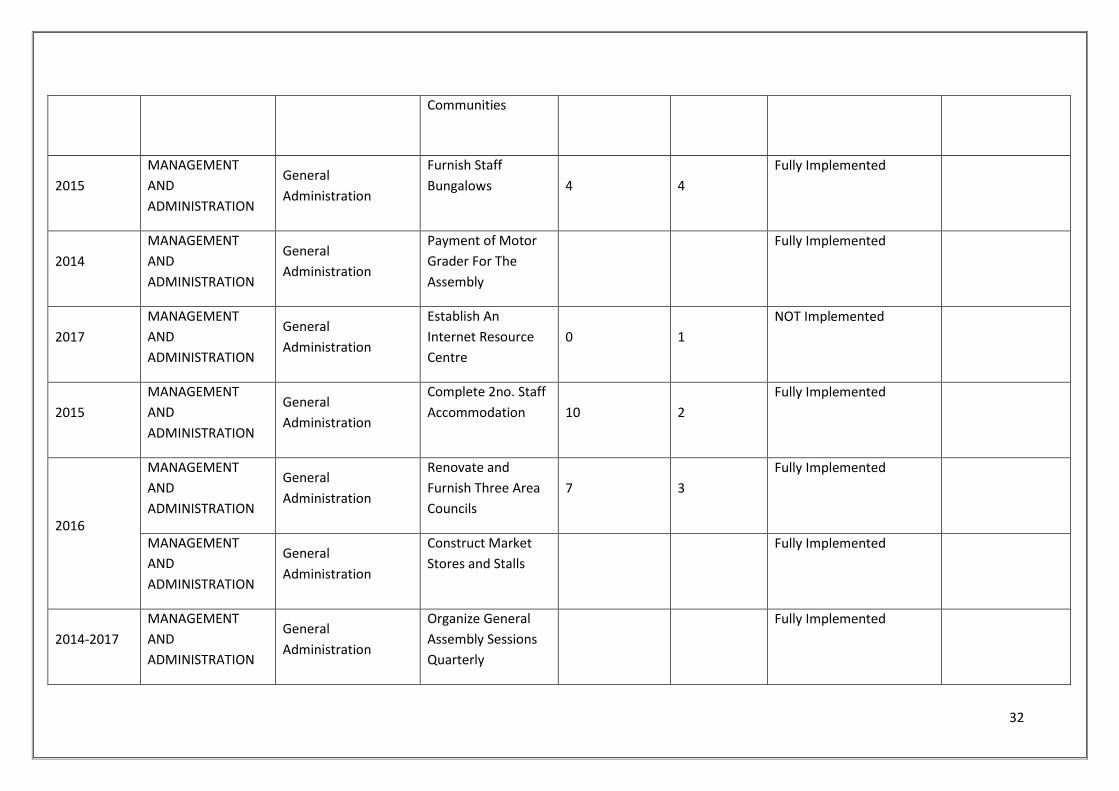
32
Communities
2015
MANAGEMENT
AND
ADMINISTRATION
General
Administration
Furnish Staff
Bungalows 4 4
Fully Implemented
2014
MANAGEMENT
AND
ADMINISTRATION
General
Administration
Payment of Motor
Grader For The
Assembly
Fully Implemented
2017
MANAGEMENT
AND
ADMINISTRATION
General
Administration
Establish An
Internet Resource
Centre
0 1
NOT Implemented
2015
MANAGEMENT
AND
ADMINISTRATION
General
Administration
Complete 2no. Staff
Accommodation 10 2
Fully Implemented
2016
MANAGEMENT
AND
ADMINISTRATION
General
Administration
Renovate and
Furnish Three Area
Councils
7 3
Fully Implemented
MANAGEMENT
AND
ADMINISTRATION
General
Administration
Construct Market
Stores and Stalls
Fully Implemented
2014-2017
MANAGEMENT
AND
ADMINISTRATION
General
Administration
Organize General
Assembly Sessions
Quarterly
Fully Implemented
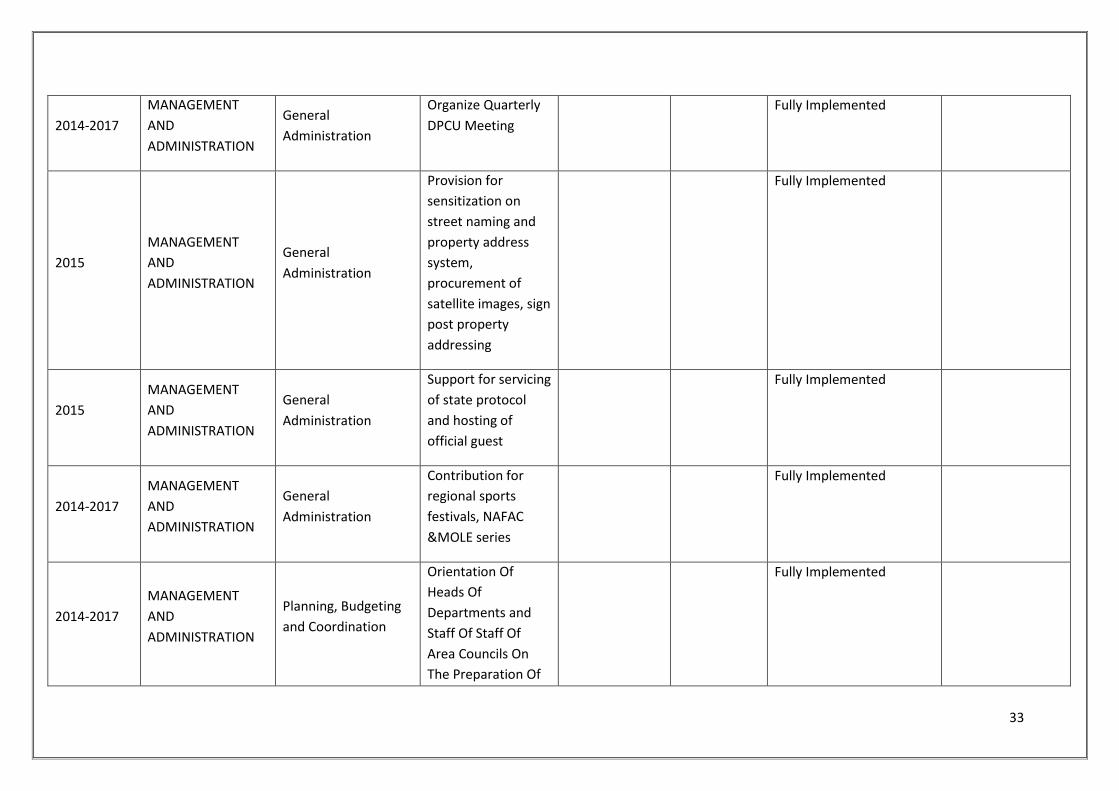
33
2014-2017
MANAGEMENT
AND
ADMINISTRATION
General
Administration
Organize Quarterly
DPCU Meeting
Fully Implemented
2015
MANAGEMENT
AND
ADMINISTRATION
General
Administration
Provision for
sensitization on
street naming and
property address
system,
procurement of
satellite images, sign
post property
addressing
Fully Implemented
2015
MANAGEMENT
AND
ADMINISTRATION
General
Administration
Support for servicing
of state protocol
and hosting of
official guest
Fully Implemented
2014-2017
MANAGEMENT
AND
ADMINISTRATION
General
Administration
Contribution for
regional sports
festivals, NAFAC
&MOLE series
Fully Implemented
2014-2017
MANAGEMENT
AND
ADMINISTRATION
Planning, Budgeting
and Coordination
Orientation Of
Heads Of
Departments and
Staff Of Staff Of
Area Councils On
The Preparation Of
Fully Implemented
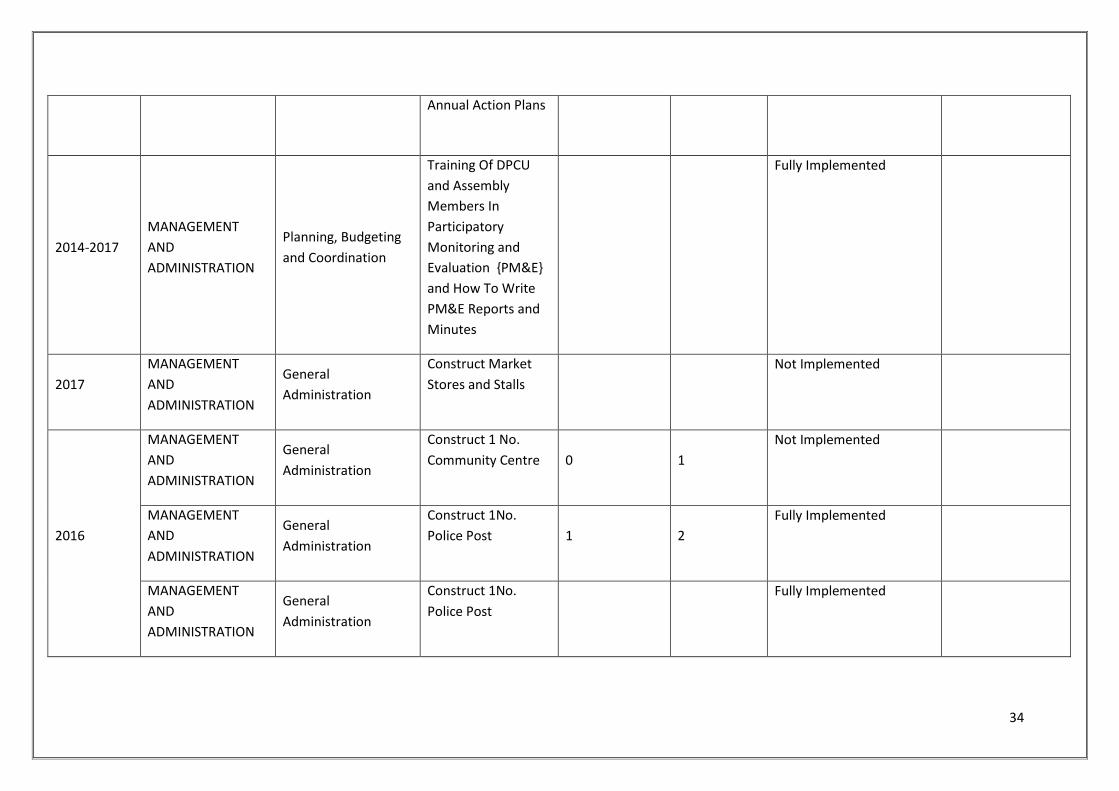
34
Annual Action Plans
2014-2017
MANAGEMENT
AND
ADMINISTRATION
Planning, Budgeting
and Coordination
Training Of DPCU
and Assembly
Members In
Participatory
Monitoring and
Evaluation {PM&E}
and How To Write
PM&E Reports and
Minutes
Fully Implemented
2017
MANAGEMENT
AND
ADMINISTRATION
General
Administration
Construct Market
Stores and Stalls
Not Implemented
2016
MANAGEMENT
AND
ADMINISTRATION
General
Administration
Construct 1 No.
Community Centre 0 1
Not Implemented
MANAGEMENT
AND
ADMINISTRATION
General
Administration
Construct 1No.
Police Post 1 2
Fully Implemented
MANAGEMENT
AND
ADMINISTRATION
General
Administration
Construct 1No.
Police Post
Fully Implemented
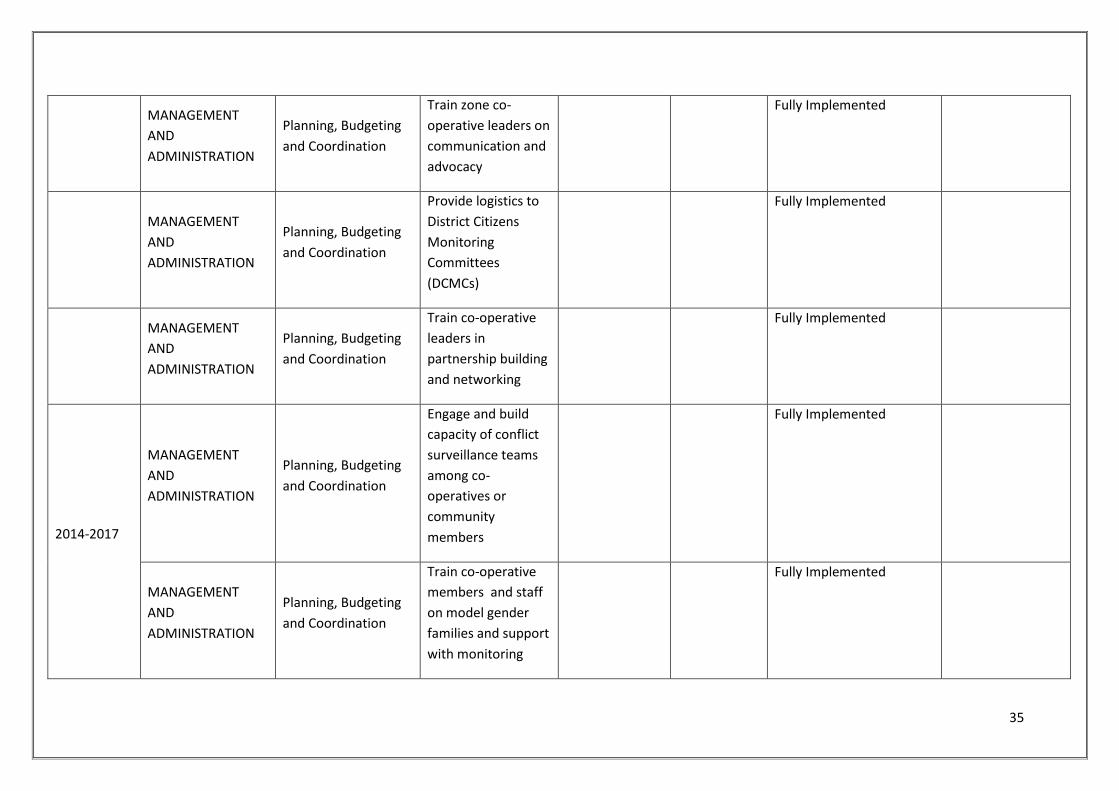
35
MANAGEMENT
AND
ADMINISTRATION
Planning, Budgeting
and Coordination
Train zone co-
operative leaders on
communication and
advocacy
Fully Implemented
MANAGEMENT
AND
ADMINISTRATION
Planning, Budgeting
and Coordination
Provide logistics to
District Citizens
Monitoring
Committees
(DCMCs)
Fully Implemented
MANAGEMENT
AND
ADMINISTRATION
Planning, Budgeting
and Coordination
Train co-operative
leaders in
partnership building
and networking
Fully Implemented
2014-2017
MANAGEMENT
AND
ADMINISTRATION
Planning, Budgeting
and Coordination
Engage and build
capacity of conflict
surveillance teams
among co-
operatives or
community
members
Fully Implemented
MANAGEMENT
AND
ADMINISTRATION
Planning, Budgeting
and Coordination
Train co-operative
members and staff
on model gender
families and support
with monitoring
Fully Implemented
36
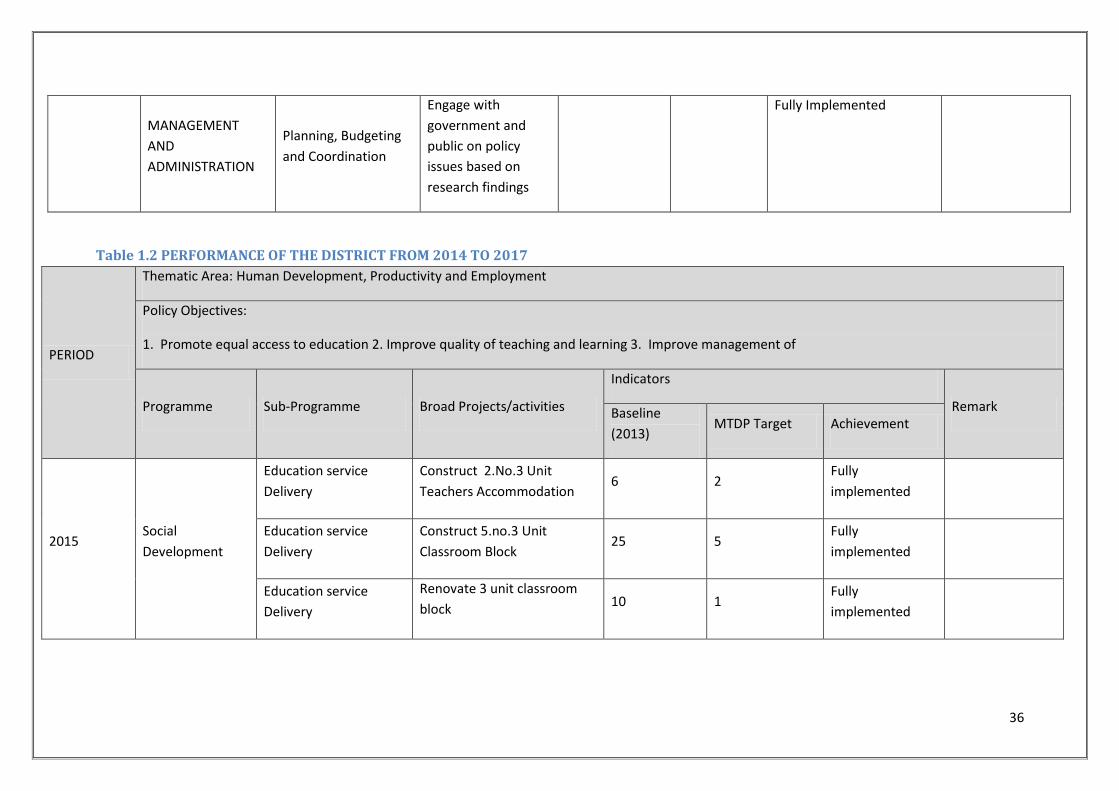
MANAGEMENT
AND
ADMINISTRATION
Planning, Budgeting
and Coordination
Engage with
government and
public on policy
issues based on
research findings
Fully Implemented
Table 1.2 PERFORMANCE OF THE DISTRICT FROM 2014 TO 2017
PERIOD
Thematic Area: Human Development, Productivity and Employment
Policy Objectives:
1. Promote equal access to education 2. Improve quality of teaching and learning 3. Improve management of
Programme Sub-Programme Broad Projects/activities
Indicators
Remark Baseline
(2013) MTDP Target Achievement
2015 Social
Development
Education service
Delivery
Construct 2.No.3 Unit
Teachers Accommodation 6 2
Fully
implemented
Education service
Delivery
Construct 5.no.3 Unit
Classroom Block 25 5
Fully
implemented
Education service
Delivery
Renovate 3 unit classroom
block 10 1
Fully
implemented
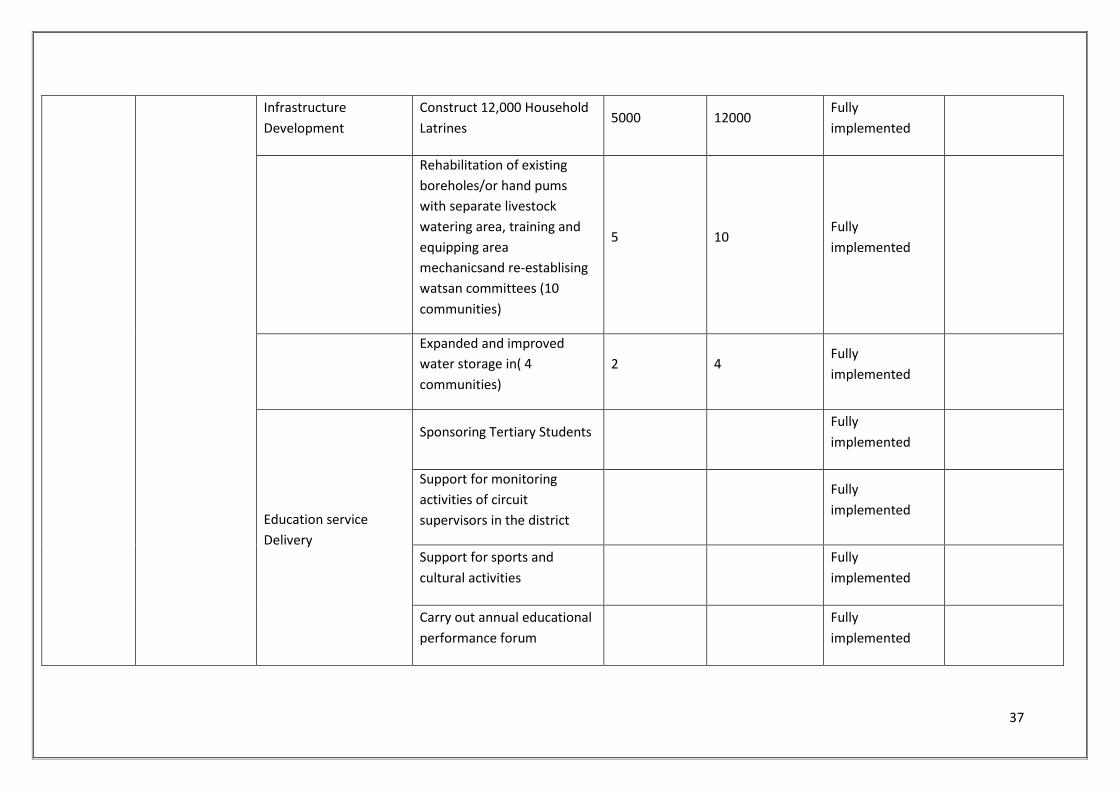
37
Infrastructure
Development
Construct 12,000 Household
Latrines 5000 12000
Fully
implemented
Rehabilitation of existing
boreholes/or hand pums
with separate livestock
watering area, training and
equipping area
mechanicsand re-establising
watsan committees (10
communities)
5 10 Fully
implemented
Expanded and improved
water storage in( 4
communities)
2 4 Fully
implemented
Education service
Delivery
Sponsoring Tertiary Students Fully
implemented
Support for monitoring
activities of circuit
supervisors in the district
Fully
implemented
Support for sports and
cultural activities
Fully
implemented
Carry out annual educational
performance forum
Fully
implemented
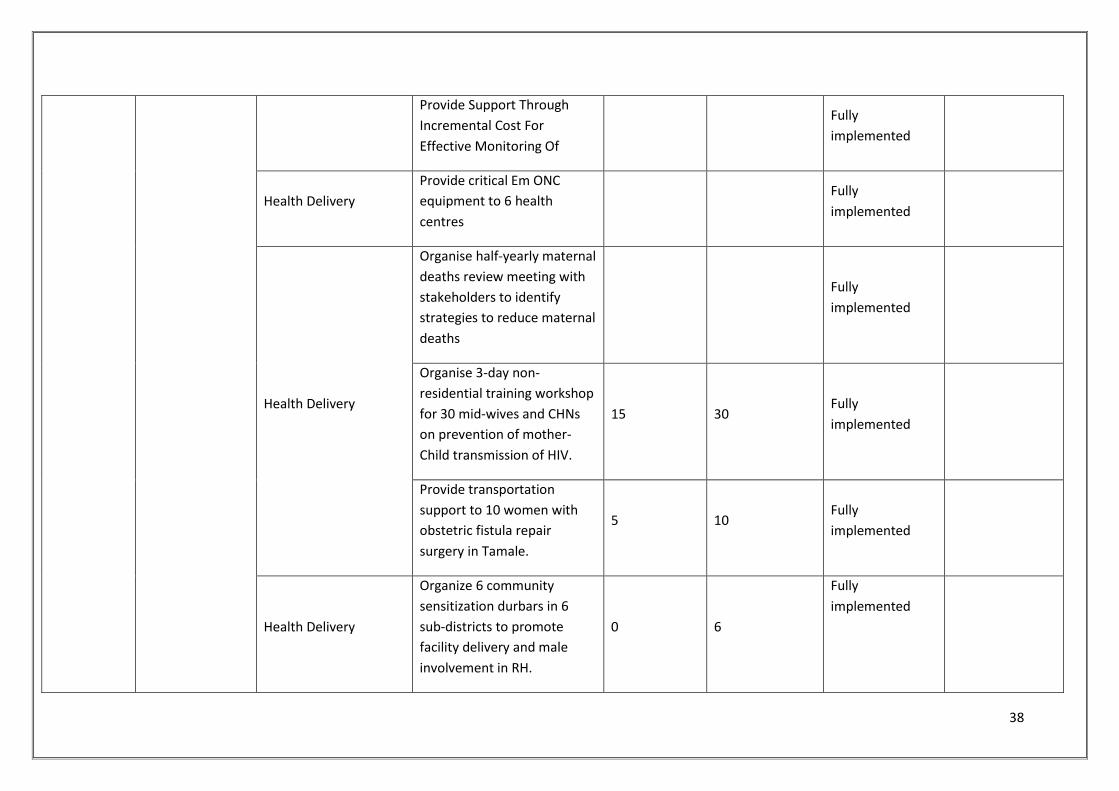
38
Provide Support Through
Incremental Cost For
Effective Monitoring Of
Fully
implemented
Health Delivery
Provide critical Em ONC
equipment to 6 health
centres
Fully
implemented
Health Delivery
Organise half-yearly maternal
deaths review meeting with
stakeholders to identify
strategies to reduce maternal
deaths
Fully
implemented
Organise 3-day non-
residential training workshop
for 30 mid-wives and CHNs
on prevention of mother-
Child transmission of HIV.
15 30 Fully
implemented
Provide transportation
support to 10 women with
obstetric fistula repair
surgery in Tamale.
5 10 Fully
implemented
Health Delivery
Organize 6 community
sensitization durbars in 6
sub-districts to promote
facility delivery and male
involvement in RH.
0 6
Fully
implemented
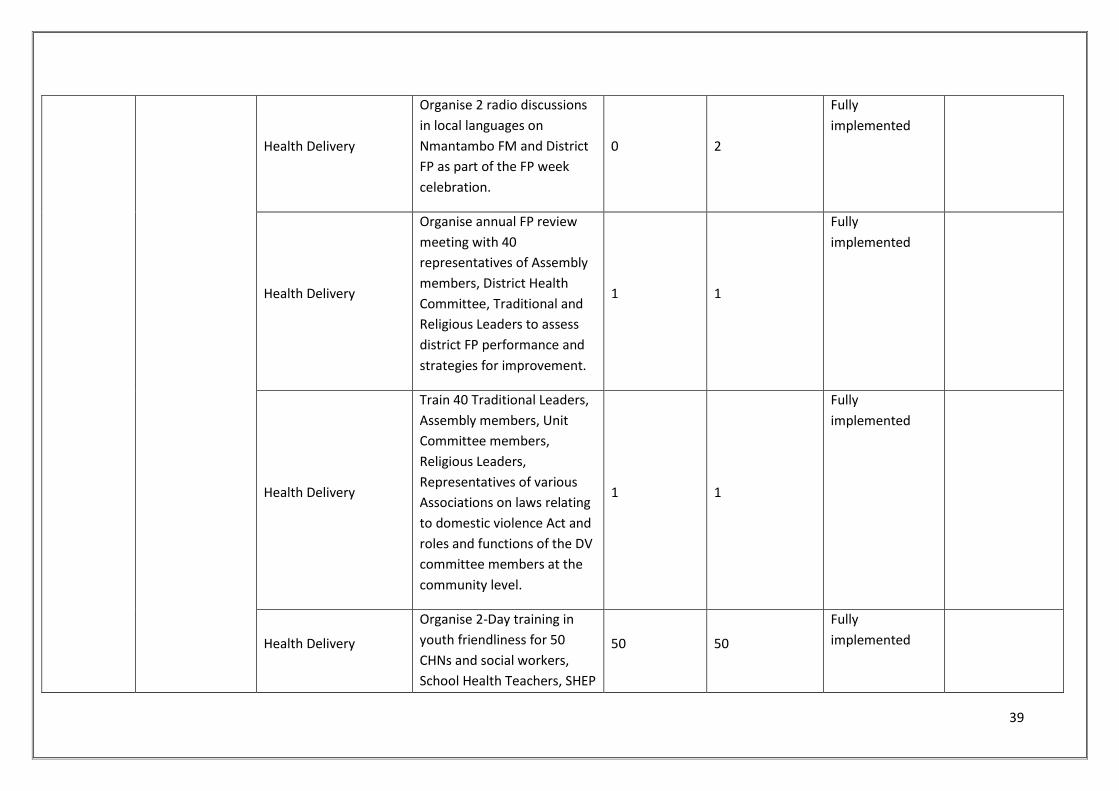
39
Health Delivery
Organise 2 radio discussions
in local languages on
Nmantambo FM and District
FP as part of the FP week
celebration.
0 2
Fully
implemented
Health Delivery
Organise annual FP review
meeting with 40
representatives of Assembly
members, District Health
Committee, Traditional and
Religious Leaders to assess
district FP performance and
strategies for improvement.
1 1
Fully
implemented
Health Delivery
Train 40 Traditional Leaders,
Assembly members, Unit
Committee members,
Religious Leaders,
Representatives of various
Associations on laws relating
to domestic violence Act and
roles and functions of the DV
committee members at the
community level.
1 1
Fully
implemented
Health Delivery
Organise 2-Day training in
youth friendliness for 50
CHNs and social workers,
School Health Teachers, SHEP
50 50
Fully
implemented
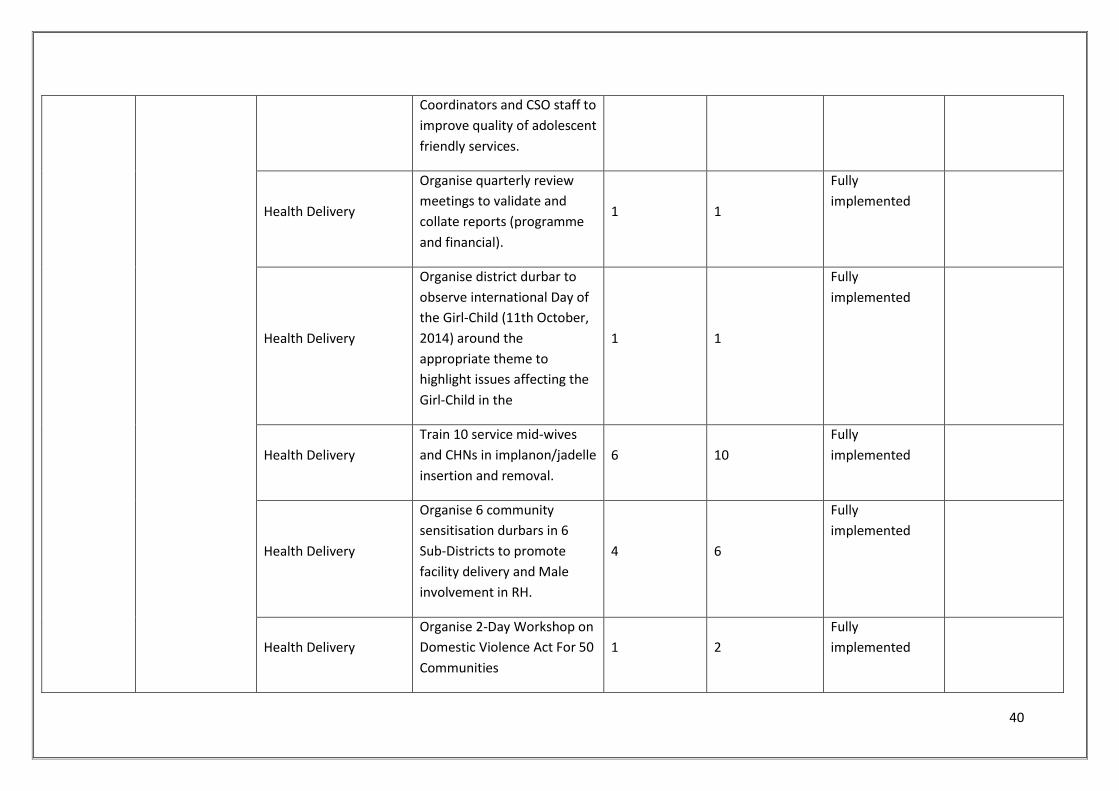
40
Coordinators and CSO staff to
improve quality of adolescent
friendly services.
Health Delivery
Organise quarterly review
meetings to validate and
collate reports (programme
and financial).
1 1
Fully
implemented
Health Delivery
Organise district durbar to
observe international Day of
the Girl-Child (11th October,
2014) around the
appropriate theme to
highlight issues affecting the
Girl-Child in the
1 1
Fully
implemented
Health Delivery
Train 10 service mid-wives
and CHNs in implanon/jadelle
insertion and removal.
6 10
Fully
implemented
Health Delivery
Organise 6 community
sensitisation durbars in 6
Sub-Districts to promote
facility delivery and Male
involvement in RH.
4 6
Fully
implemented
Health Delivery
Organise 2-Day Workshop on
Domestic Violence Act For 50
Communities
1 2
Fully
implemented
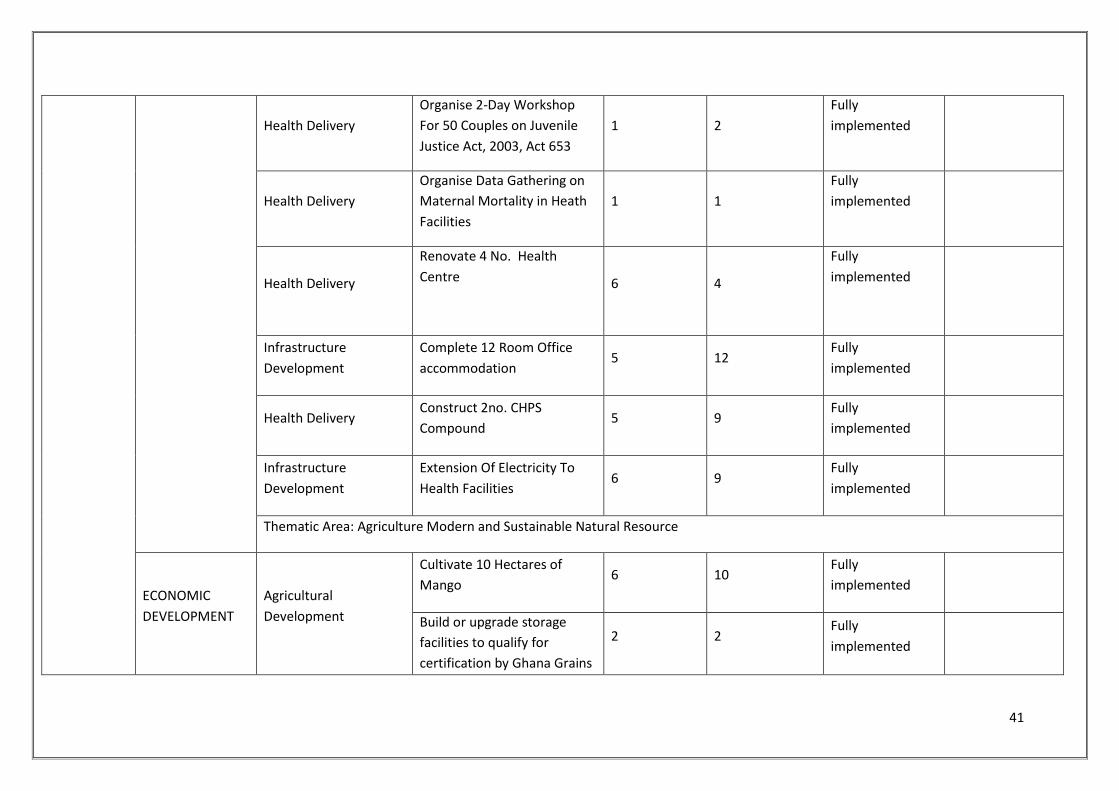
41
Health Delivery
Organise 2-Day Workshop
For 50 Couples on Juvenile
Justice Act, 2003, Act 653
1 2
Fully
implemented
Health Delivery
Organise Data Gathering on
Maternal Mortality in Heath
Facilities
1 1
Fully
implemented
Health Delivery
Renovate 4 No. Health
Centre
6 4
Fully
implemented
Infrastructure
Development
Complete 12 Room Office
accommodation 5 12
Fully
implemented
Health Delivery Construct 2no. CHPS
Compound 5 9
Fully
implemented
Infrastructure
Development
Extension Of Electricity To
Health Facilities 6 9
Fully
implemented
Thematic Area: Agriculture Modern and Sustainable Natural Resource
ECONOMIC
DEVELOPMENT
Agricultural
Development
Cultivate 10 Hectares of
Mango 6 10
Fully
implemented
Build or upgrade storage
facilities to qualify for
certification by Ghana Grains
2 2 Fully
implemented
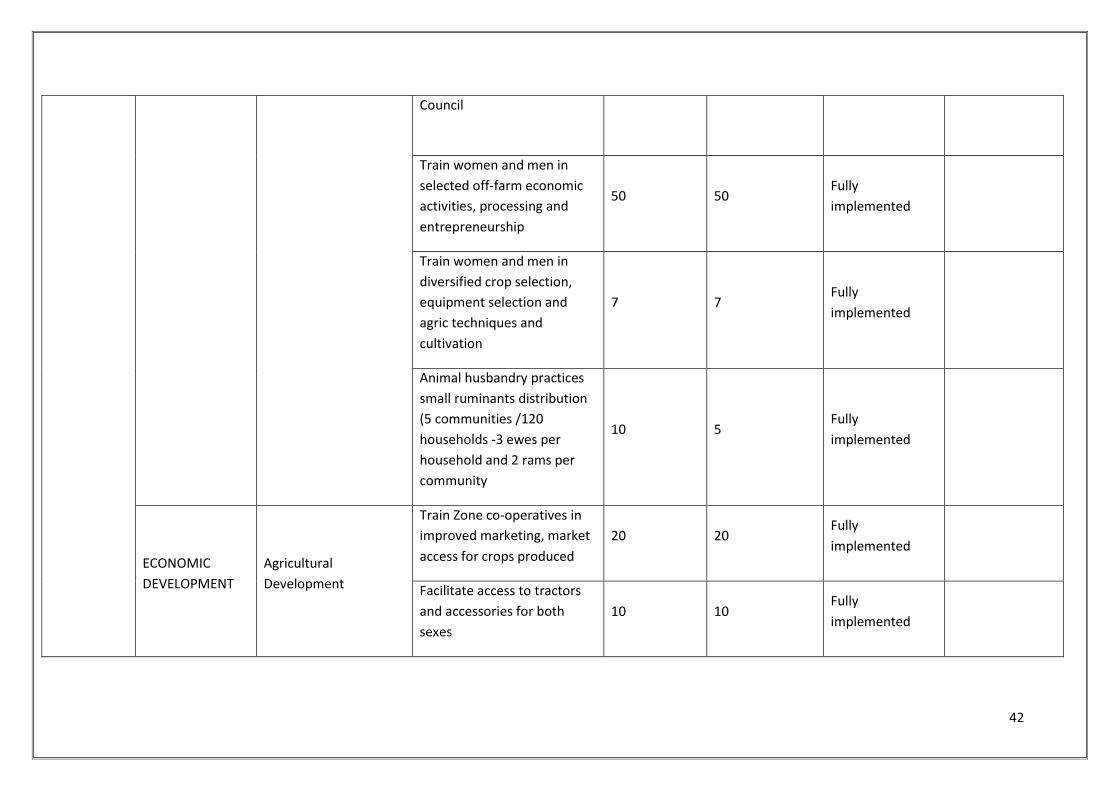
42
Council
Train women and men in
selected off-farm economic
activities, processing and
entrepreneurship
50 50 Fully
implemented
Train women and men in
diversified crop selection,
equipment selection and
agric techniques and
cultivation
7 7 Fully
implemented
Animal husbandry practices
small ruminants distribution
(5 communities /120
households -3 ewes per
household and 2 rams per
community
10 5 Fully
implemented
ECONOMIC
DEVELOPMENT
Agricultural
Development
Train Zone co-operatives in
improved marketing, market
access for crops produced
20 20 Fully
implemented
Facilitate access to tractors
and accessories for both
sexes
10 10 Fully
implemented
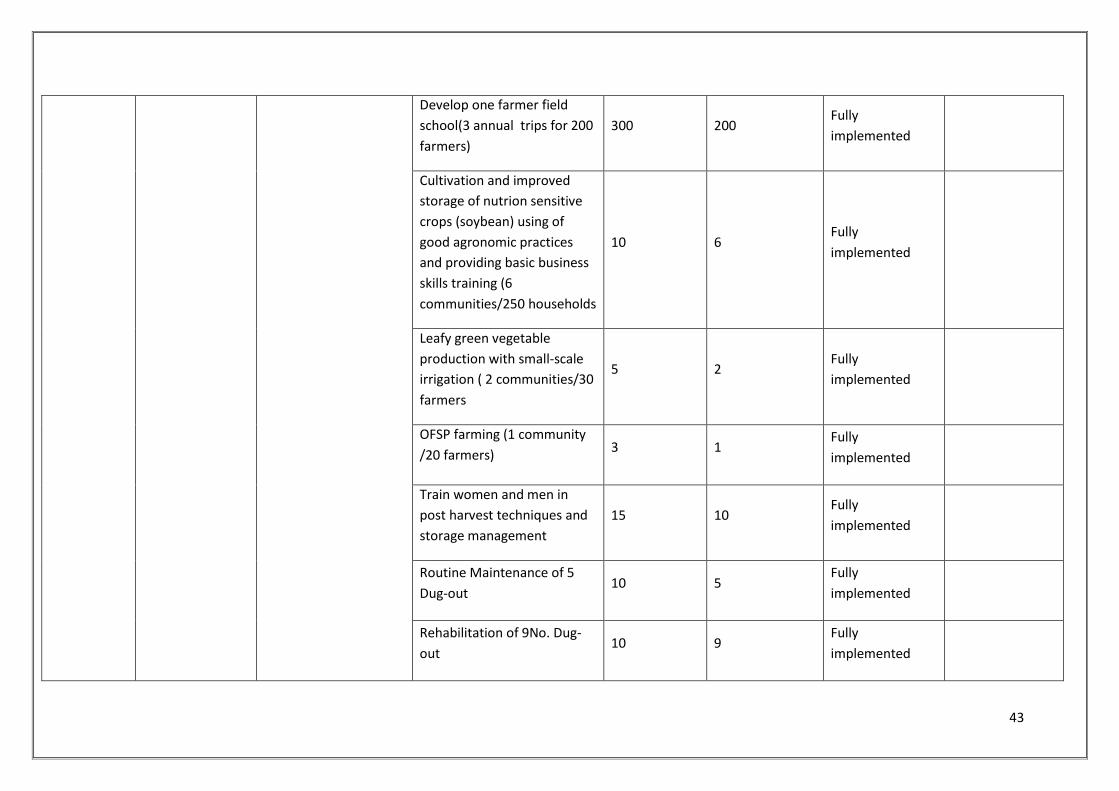
43
Develop one farmer field
school(3 annual trips for 200
farmers)
300 200 Fully
implemented
Cultivation and improved
storage of nutrion sensitive
crops (soybean) using of
good agronomic practices
and providing basic business
skills training (6
communities/250 households
10 6 Fully
implemented
Leafy green vegetable
production with small-scale
irrigation ( 2 communities/30
farmers
5 2 Fully
implemented
OFSP farming (1 community
/20 farmers) 3 1
Fully
implemented
Train women and men in
post harvest techniques and
storage management
15 10 Fully
implemented
Routine Maintenance of 5
Dug-out 10 5
Fully
implemented
Rehabilitation of 9No. Dug-
out 10 9
Fully
implemented
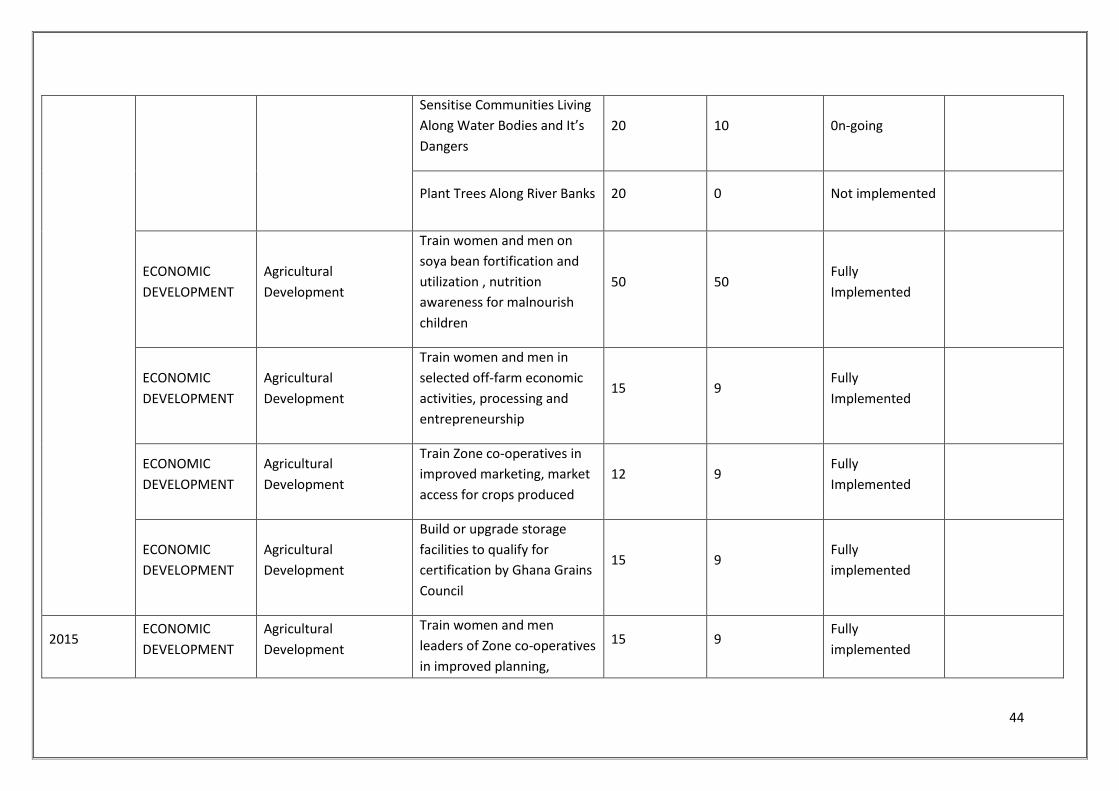
44
Sensitise Communities Living
Along Water Bodies and It’s
Dangers
20 10 0n-going
Plant Trees Along River Banks 20 0 Not implemented
ECONOMIC
DEVELOPMENT
Agricultural
Development
Train women and men on
soya bean fortification and
utilization , nutrition
awareness for malnourish
children
50 50 Fully
Implemented
ECONOMIC
DEVELOPMENT
Agricultural
Development
Train women and men in
selected off-farm economic
activities, processing and
entrepreneurship
15 9 Fully
Implemented
ECONOMIC
DEVELOPMENT
Agricultural
Development
Train Zone co-operatives in
improved marketing, market
access for crops produced
12 9 Fully
Implemented
ECONOMIC
DEVELOPMENT
Agricultural
Development
Build or upgrade storage
facilities to qualify for
certification by Ghana Grains
Council
15 9 Fully
implemented
2015 ECONOMIC
DEVELOPMENT
Agricultural
Development
Train women and men
leaders of Zone co-operatives
in improved planning,
15 9 Fully
implemented
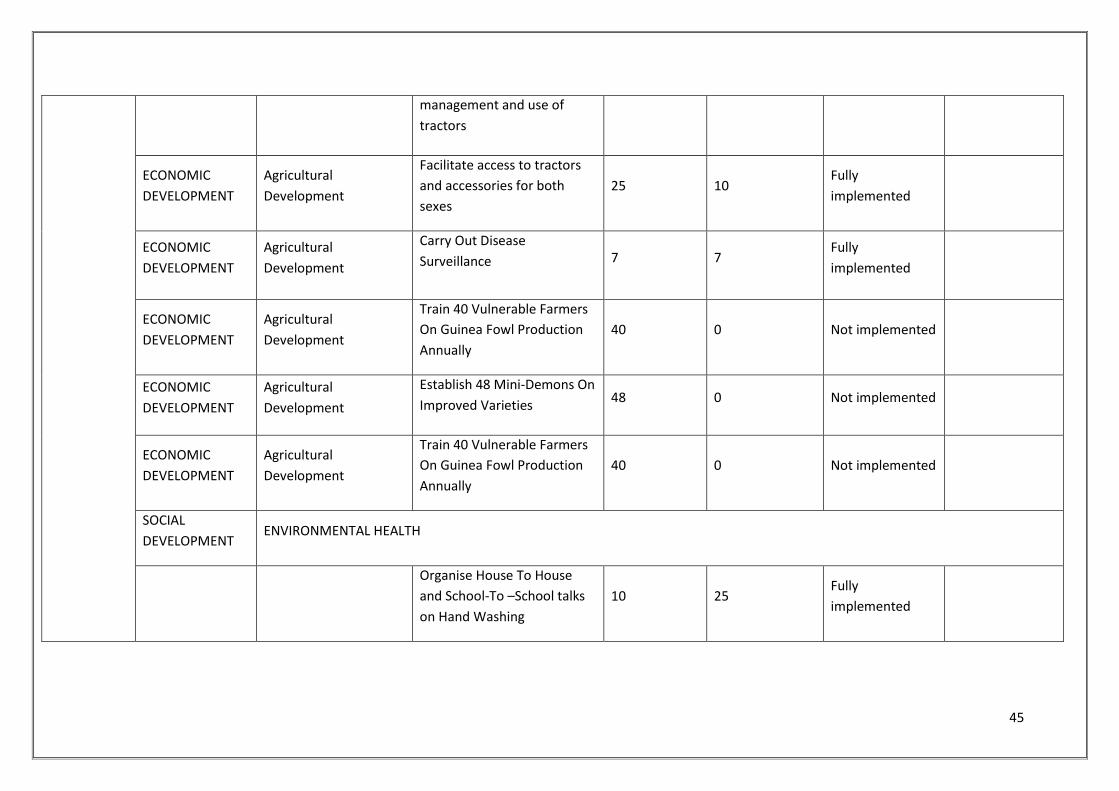
45
management and use of
tractors
ECONOMIC
DEVELOPMENT
Agricultural
Development
Facilitate access to tractors
and accessories for both
sexes
25 10 Fully
implemented
ECONOMIC
DEVELOPMENT
Agricultural
Development
Carry Out Disease
Surveillance 7 7 Fully
implemented
ECONOMIC
DEVELOPMENT
Agricultural
Development
Train 40 Vulnerable Farmers
On Guinea Fowl Production
Annually
40 0 Not implemented
ECONOMIC
DEVELOPMENT
Agricultural
Development
Establish 48 Mini-Demons On
Improved Varieties 48 0 Not implemented
ECONOMIC
DEVELOPMENT
Agricultural
Development
Train 40 Vulnerable Farmers
On Guinea Fowl Production
Annually
40 0 Not implemented
SOCIAL
DEVELOPMENT ENVIRONMENTAL HEALTH
Organise House To House
and School-To –School talks
on Hand Washing
10 25 Fully
implemented
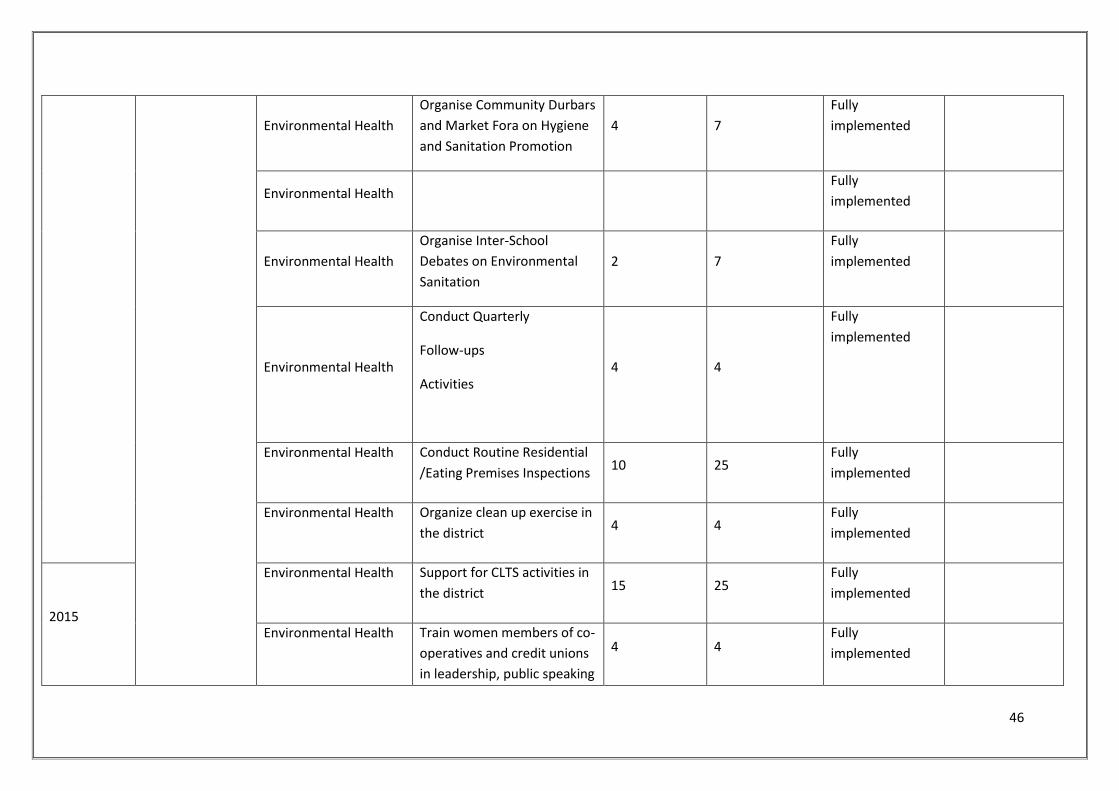
46
Environmental Health
Organise Community Durbars
and Market Fora on Hygiene
and Sanitation Promotion
4 7
Fully
implemented
Environmental Health Fully
implemented
Environmental Health
Organise Inter-School
Debates on Environmental
Sanitation
2 7
Fully
implemented
Environmental Health
Conduct Quarterly
Follow-ups
Activities
4 4
Fully
implemented
Environmental Health Conduct Routine Residential
/Eating Premises Inspections 10 25
Fully
implemented
Environmental Health Organize clean up exercise in
the district 4 4
Fully
implemented
2015
Environmental Health Support for CLTS activities in
the district 15 25
Fully
implemented
Environmental Health Train women members of co-
operatives and credit unions
in leadership, public speaking
4 4 Fully
implemented
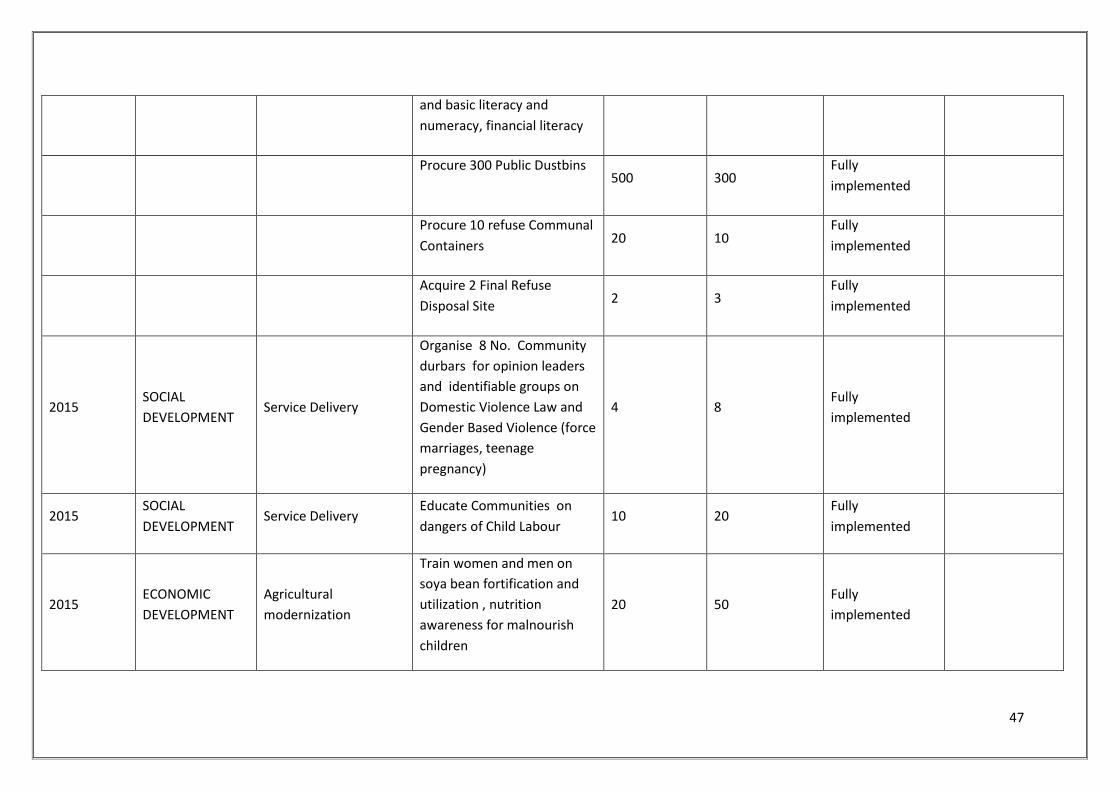
47
and basic literacy and
numeracy, financial literacy
Procure 300 Public Dustbins
500 300 Fully
implemented
Procure 10 refuse Communal
Containers 20 10
Fully
implemented
Acquire 2 Final Refuse
Disposal Site 2 3
Fully
implemented
2015 SOCIAL
DEVELOPMENT Service Delivery
Organise 8 No. Community
durbars for opinion leaders
and identifiable groups on
Domestic Violence Law and
Gender Based Violence (force
marriages, teenage
pregnancy)
4 8 Fully
implemented
2015 SOCIAL
DEVELOPMENT Service Delivery
Educate Communities on
dangers of Child Labour 10 20
Fully
implemented
2015 ECONOMIC
DEVELOPMENT
Agricultural
modernization
Train women and men on
soya bean fortification and
utilization , nutrition
awareness for malnourish
children
20 50 Fully
implemented
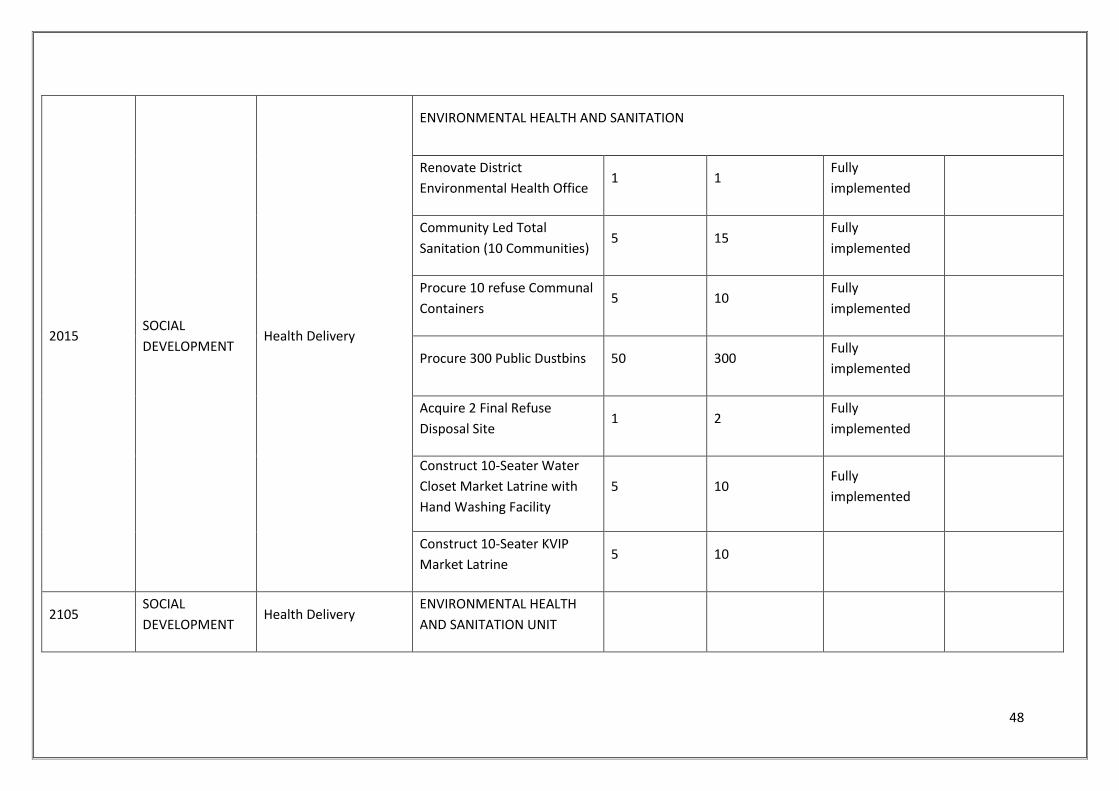
48
2015 SOCIAL
DEVELOPMENT Health Delivery
ENVIRONMENTAL HEALTH AND SANITATION
Renovate District
Environmental Health Office 1 1
Fully
implemented
Community Led Total
Sanitation (10 Communities) 5 15
Fully
implemented
Procure 10 refuse Communal
Containers 5 10
Fully
implemented
Procure 300 Public Dustbins 50 300 Fully
implemented
Acquire 2 Final Refuse
Disposal Site 1 2
Fully
implemented
Construct 10-Seater Water
Closet Market Latrine with
Hand Washing Facility
5 10 Fully
implemented
Construct 10-Seater KVIP
Market Latrine 5 10
2105 SOCIAL
DEVELOPMENT Health Delivery
ENVIRONMENTAL HEALTH
AND SANITATION UNIT
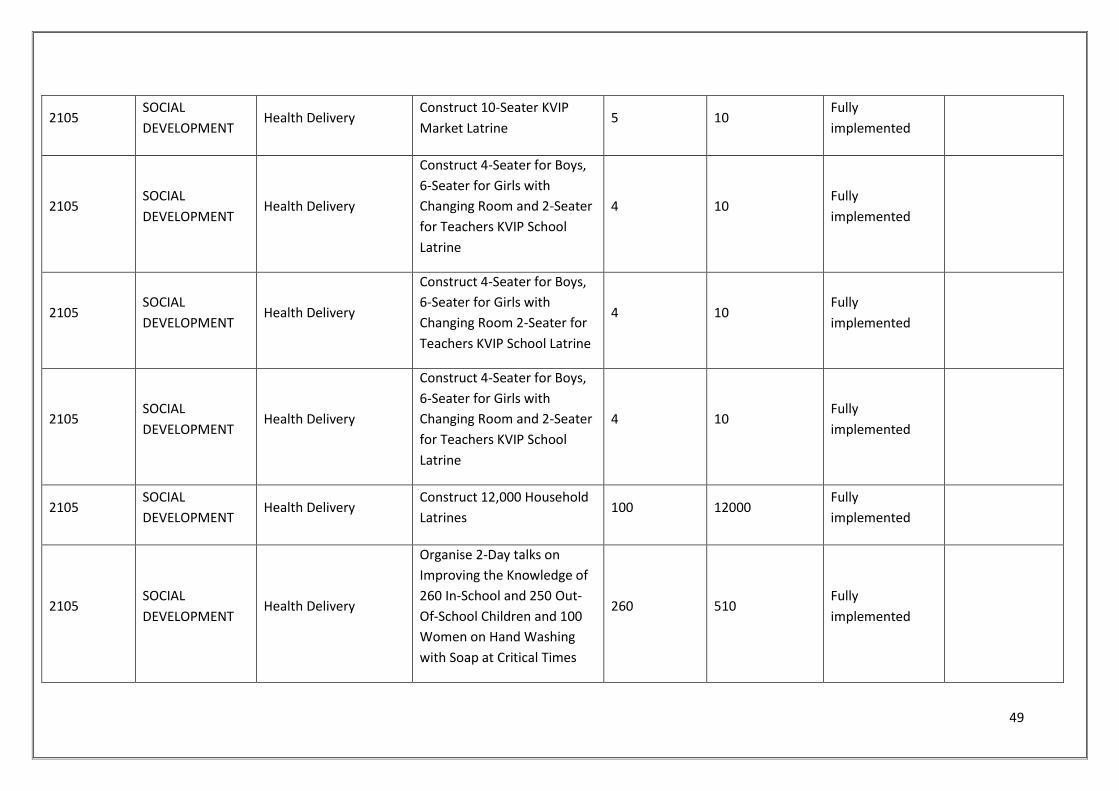
49
2105 SOCIAL
DEVELOPMENT Health Delivery
Construct 10-Seater KVIP
Market Latrine 5 10
Fully
implemented
2105 SOCIAL
DEVELOPMENT Health Delivery
Construct 4-Seater for Boys,
6-Seater for Girls with
Changing Room and 2-Seater
for Teachers KVIP School
Latrine
4 10 Fully
implemented
2105 SOCIAL
DEVELOPMENT Health Delivery
Construct 4-Seater for Boys,
6-Seater for Girls with
Changing Room 2-Seater for
Teachers KVIP School Latrine
4 10 Fully
implemented
2105 SOCIAL
DEVELOPMENT Health Delivery
Construct 4-Seater for Boys,
6-Seater for Girls with
Changing Room and 2-Seater
for Teachers KVIP School
Latrine
4 10 Fully
implemented
2105 SOCIAL
DEVELOPMENT Health Delivery
Construct 12,000 Household
Latrines 100 12000
Fully
implemented
2105 SOCIAL
DEVELOPMENT Health Delivery
Organise 2-Day talks on
Improving the Knowledge of
260 In-School and 250 Out-
Of-School Children and 100
Women on Hand Washing
with Soap at Critical Times
260 510 Fully
implemented
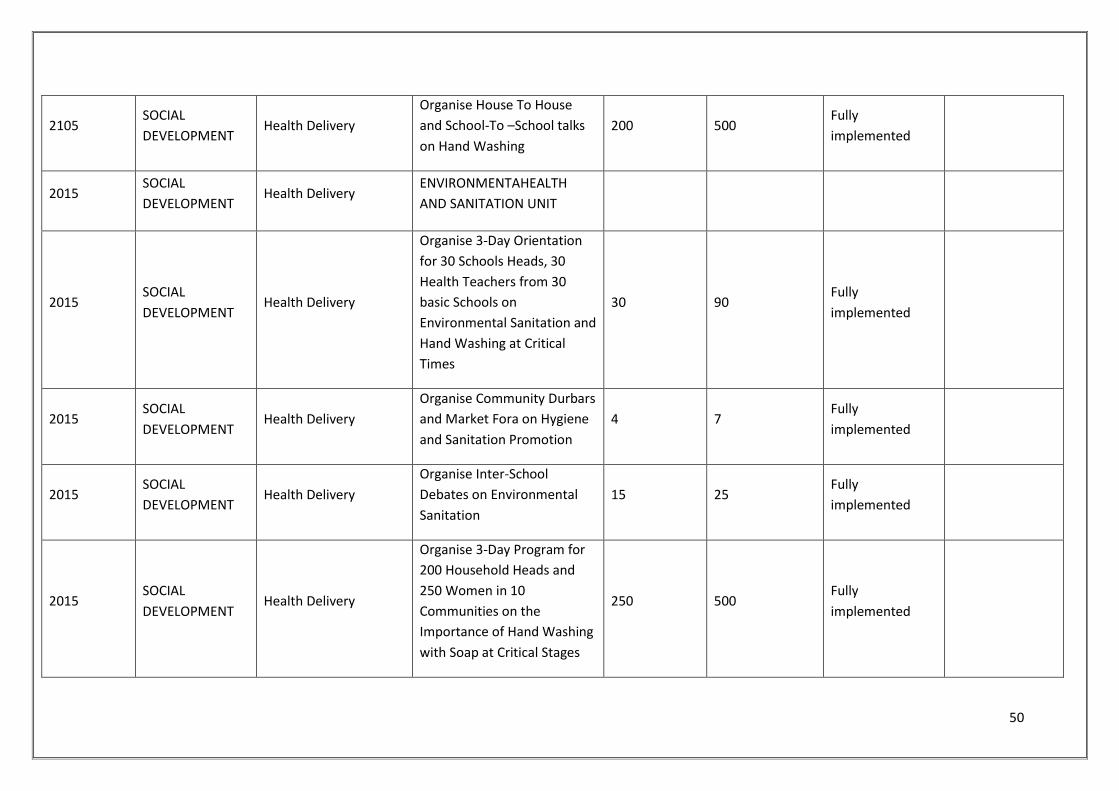
50
2105 SOCIAL
DEVELOPMENT Health Delivery
Organise House To House
and School-To –School talks
on Hand Washing
200 500 Fully
implemented
2015 SOCIAL
DEVELOPMENT Health Delivery
ENVIRONMENTAHEALTH
AND SANITATION UNIT
2015 SOCIAL
DEVELOPMENT Health Delivery
Organise 3-Day Orientation
for 30 Schools Heads, 30
Health Teachers from 30
basic Schools on
Environmental Sanitation and
Hand Washing at Critical
Times
30 90 Fully
implemented
2015 SOCIAL
DEVELOPMENT Health Delivery
Organise Community Durbars
and Market Fora on Hygiene
and Sanitation Promotion
4 7 Fully
implemented
2015 SOCIAL
DEVELOPMENT Health Delivery
Organise Inter-School
Debates on Environmental
Sanitation
15 25 Fully
implemented
2015 SOCIAL
DEVELOPMENT Health Delivery
Organise 3-Day Program for
200 Household Heads and
250 Women in 10
Communities on the
Importance of Hand Washing
with Soap at Critical Stages
250 500 Fully
implemented
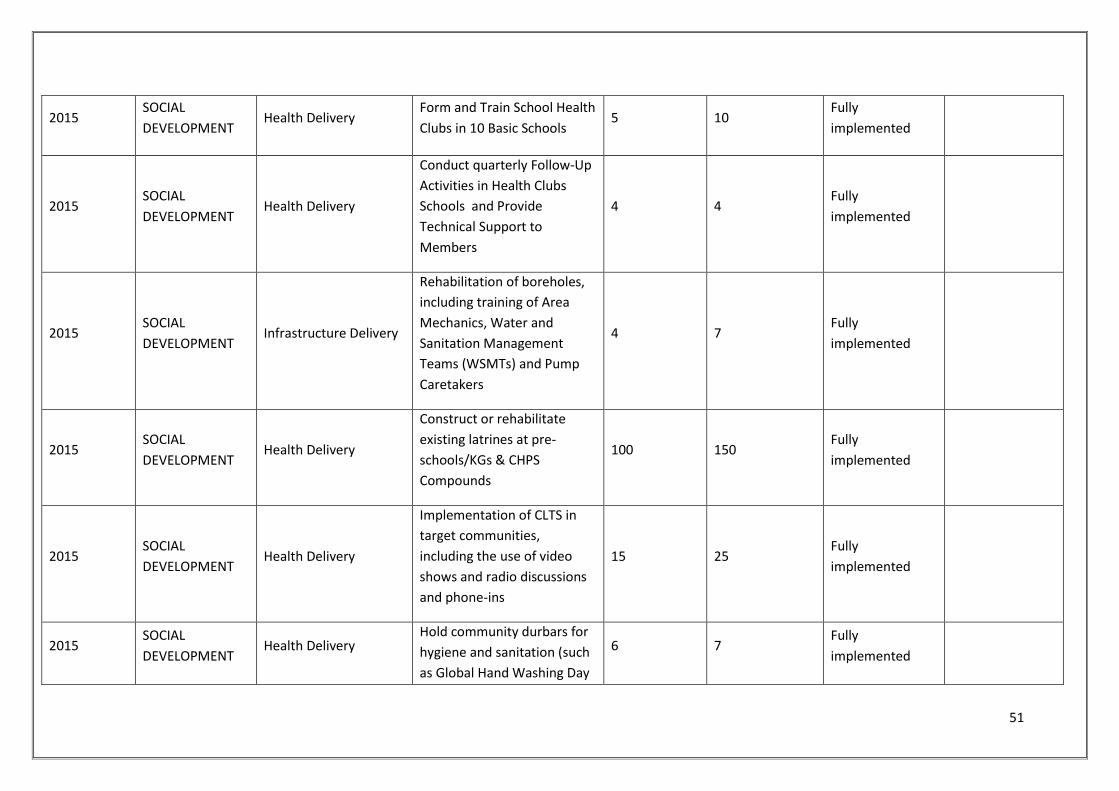
51
2015 SOCIAL
DEVELOPMENT Health Delivery
Form and Train School Health
Clubs in 10 Basic Schools 5 10
Fully
implemented
2015 SOCIAL
DEVELOPMENT Health Delivery
Conduct quarterly Follow-Up
Activities in Health Clubs
Schools and Provide
Technical Support to
Members
4 4 Fully
implemented
2015 SOCIAL
DEVELOPMENT Infrastructure Delivery
Rehabilitation of boreholes,
including training of Area
Mechanics, Water and
Sanitation Management
Teams (WSMTs) and Pump
Caretakers
4 7 Fully
implemented
2015 SOCIAL
DEVELOPMENT Health Delivery
Construct or rehabilitate
existing latrines at pre-
schools/KGs & CHPS
Compounds
100 150 Fully
implemented
2015 SOCIAL
DEVELOPMENT Health Delivery
Implementation of CLTS in
target communities,
including the use of video
shows and radio discussions
and phone-ins
15 25 Fully
implemented
2015 SOCIAL
DEVELOPMENT Health Delivery
Hold community durbars for
hygiene and sanitation (such
as Global Hand Washing Day
6 7 Fully
implemented
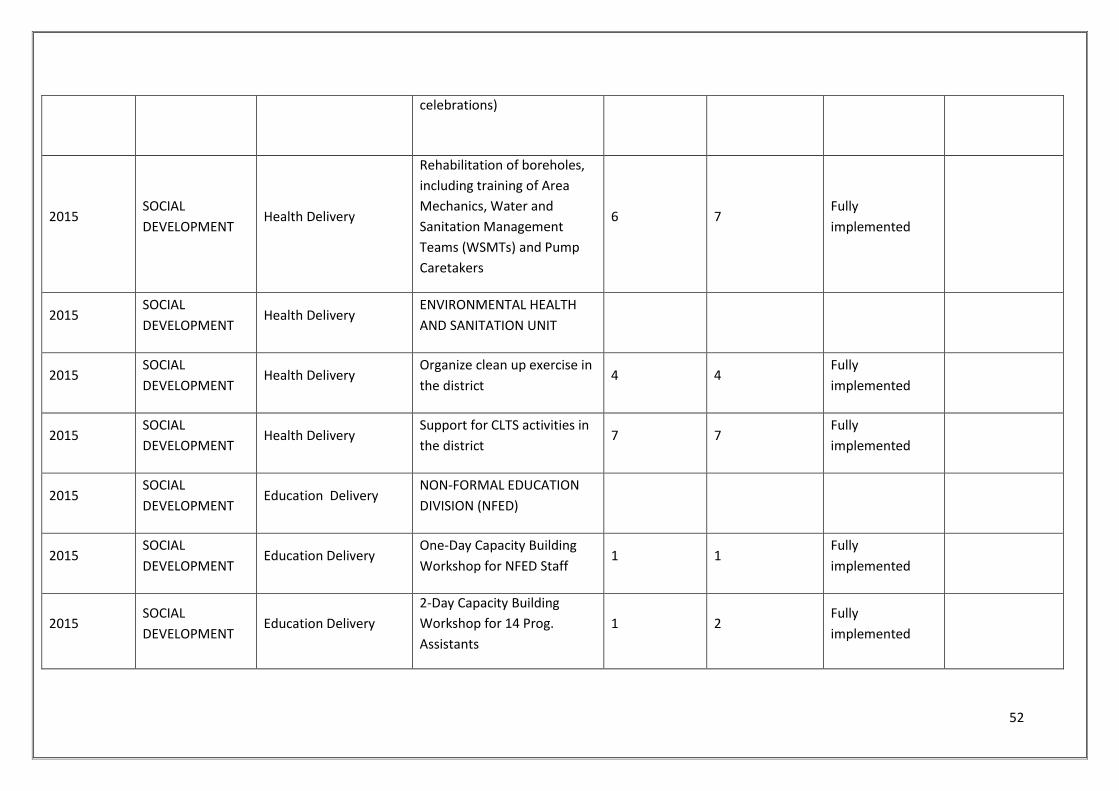
52
celebrations)
2015 SOCIAL
DEVELOPMENT Health Delivery
Rehabilitation of boreholes,
including training of Area
Mechanics, Water and
Sanitation Management
Teams (WSMTs) and Pump
Caretakers
6 7 Fully
implemented
2015 SOCIAL
DEVELOPMENT Health Delivery
ENVIRONMENTAL HEALTH
AND SANITATION UNIT
2015 SOCIAL
DEVELOPMENT Health Delivery
Organize clean up exercise in
the district 4 4
Fully
implemented
2015 SOCIAL
DEVELOPMENT Health Delivery
Support for CLTS activities in
the district 7 7
Fully
implemented
2015 SOCIAL
DEVELOPMENT Education Delivery
NON-FORMAL EDUCATION
DIVISION (NFED)
2015 SOCIAL
DEVELOPMENT Education Delivery
One-Day Capacity Building
Workshop for NFED Staff 1 1
Fully
implemented
2015 SOCIAL
DEVELOPMENT Education Delivery
2-Day Capacity Building
Workshop for 14 Prog.
Assistants
1 2 Fully
implemented
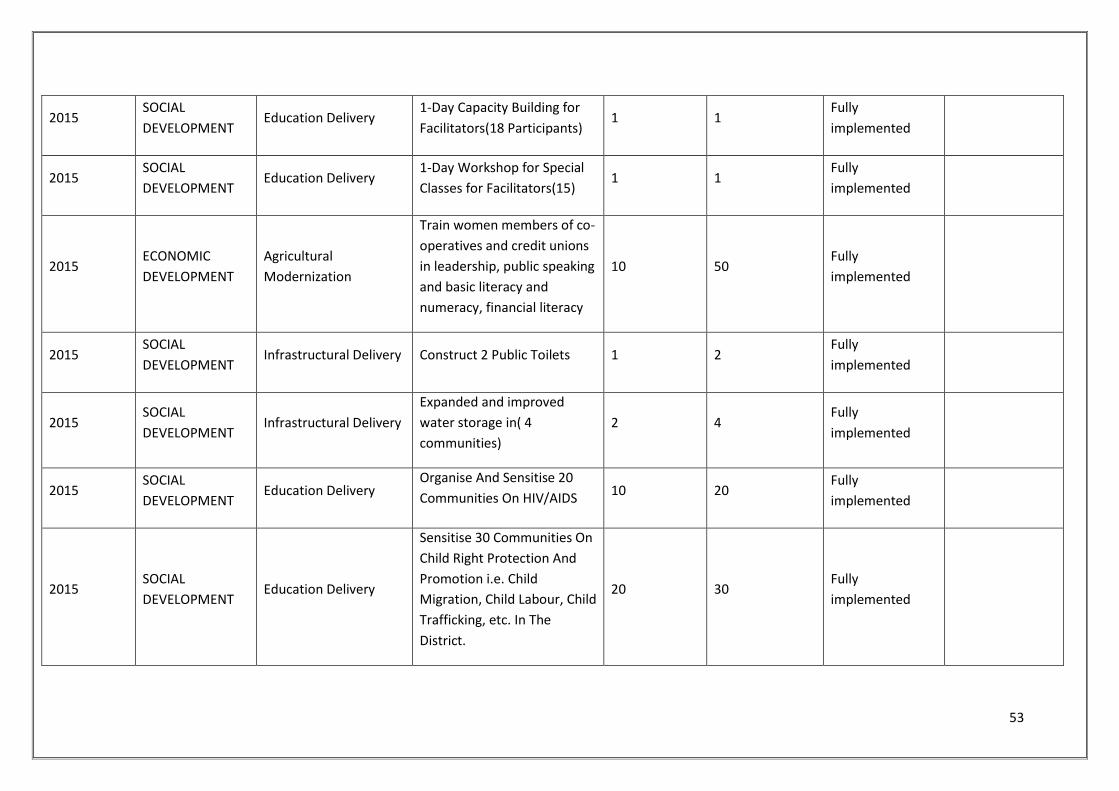
53
2015 SOCIAL
DEVELOPMENT Education Delivery
1-Day Capacity Building for
Facilitators(18 Participants) 1 1
Fully
implemented
2015 SOCIAL
DEVELOPMENT Education Delivery
1-Day Workshop for Special
Classes for Facilitators(15) 1 1
Fully
implemented
2015 ECONOMIC
DEVELOPMENT
Agricultural
Modernization
Train women members of co-
operatives and credit unions
in leadership, public speaking
and basic literacy and
numeracy, financial literacy
10 50 Fully
implemented
2015 SOCIAL
DEVELOPMENT Infrastructural Delivery Construct 2 Public Toilets 1 2
Fully
implemented
2015 SOCIAL
DEVELOPMENT Infrastructural Delivery
Expanded and improved
water storage in( 4
communities)
2 4 Fully
implemented
2015 SOCIAL
DEVELOPMENT Education Delivery
Organise And Sensitise 20
Communities On HIV/AIDS 10 20
Fully
implemented
2015 SOCIAL
DEVELOPMENT Education Delivery
Sensitise 30 Communities On
Child Right Protection And
Promotion i.e. Child
Migration, Child Labour, Child
Trafficking, etc. In The
District.
20 30 Fully
implemented
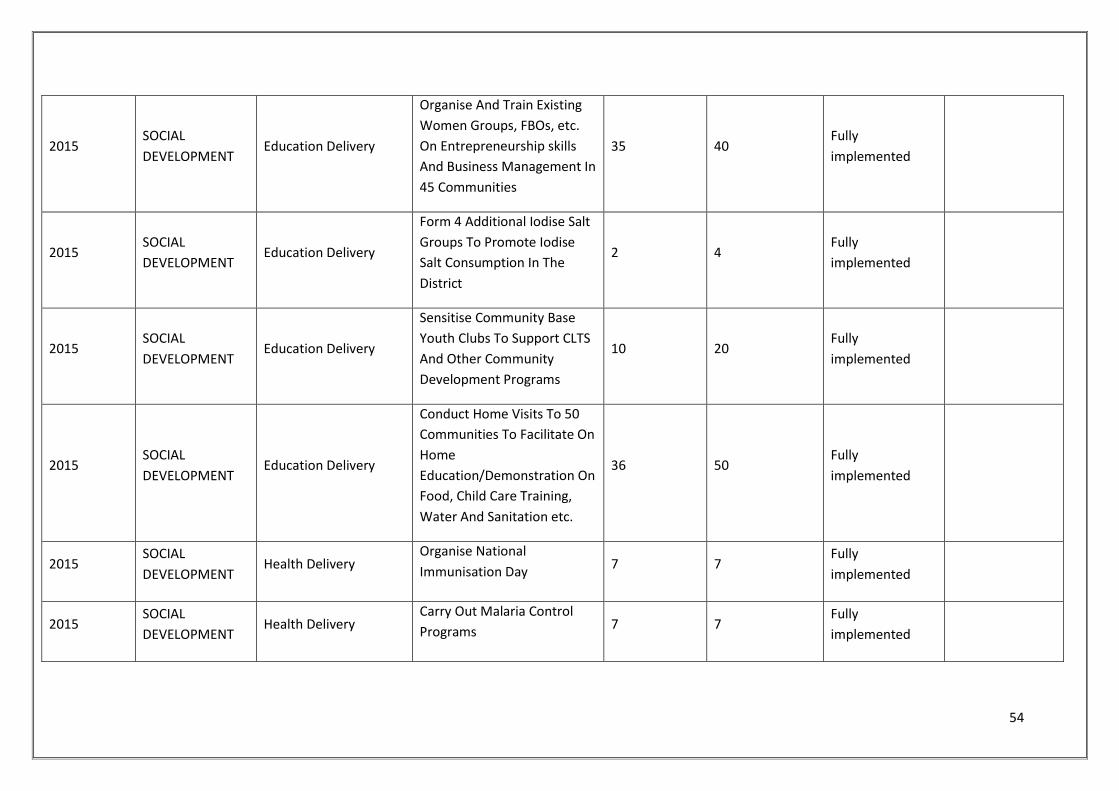
54
2015 SOCIAL
DEVELOPMENT Education Delivery
Organise And Train Existing
Women Groups, FBOs, etc.
On Entrepreneurship skills
And Business Management In
45 Communities
35 40 Fully
implemented
2015 SOCIAL
DEVELOPMENT Education Delivery
Form 4 Additional Iodise Salt
Groups To Promote Iodise
Salt Consumption In The
District
2 4 Fully
implemented
2015 SOCIAL
DEVELOPMENT Education Delivery
Sensitise Community Base
Youth Clubs To Support CLTS
And Other Community
Development Programs
10 20 Fully
implemented
2015 SOCIAL
DEVELOPMENT Education Delivery
Conduct Home Visits To 50
Communities To Facilitate On
Home
Education/Demonstration On
Food, Child Care Training,
Water And Sanitation etc.
36 50 Fully
implemented
2015 SOCIAL
DEVELOPMENT Health Delivery
Organise National
Immunisation Day 7 7
Fully
implemented
2015 SOCIAL
DEVELOPMENT Health Delivery
Carry Out Malaria Control
Programs 7 7
Fully
implemented
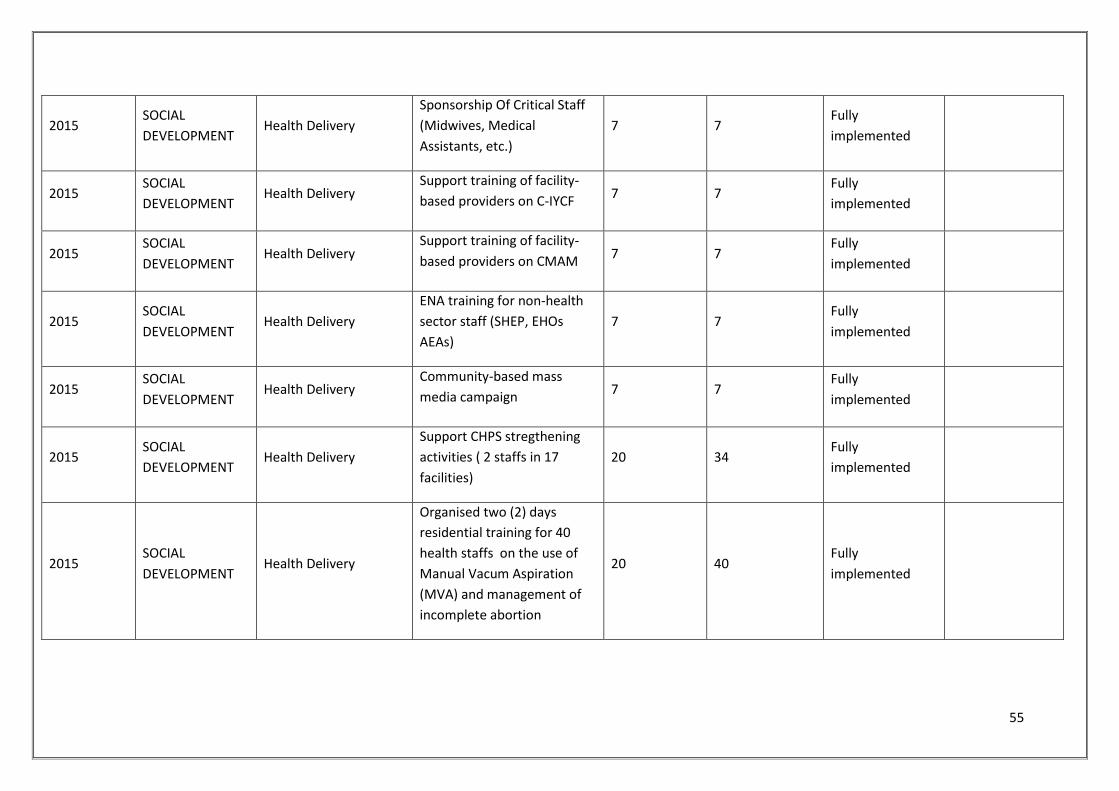
55
2015 SOCIAL
DEVELOPMENT Health Delivery
Sponsorship Of Critical Staff
(Midwives, Medical
Assistants, etc.)
7 7 Fully
implemented
2015 SOCIAL
DEVELOPMENT Health Delivery
Support training of facility-
based providers on C-IYCF 7 7
Fully
implemented
2015 SOCIAL
DEVELOPMENT Health Delivery
Support training of facility-
based providers on CMAM 7 7
Fully
implemented
2015 SOCIAL
DEVELOPMENT Health Delivery
ENA training for non-health
sector staff (SHEP, EHOs
AEAs)
7 7 Fully
implemented
2015 SOCIAL
DEVELOPMENT Health Delivery
Community-based mass
media campaign 7 7
Fully
implemented
2015 SOCIAL
DEVELOPMENT Health Delivery
Support CHPS stregthening
activities ( 2 staffs in 17
facilities)
20 34 Fully
implemented
2015 SOCIAL
DEVELOPMENT Health Delivery
Organised two (2) days
residential training for 40
health staffs on the use of
Manual Vacum Aspiration
(MVA) and management of
incomplete abortion
20 40 Fully
implemented
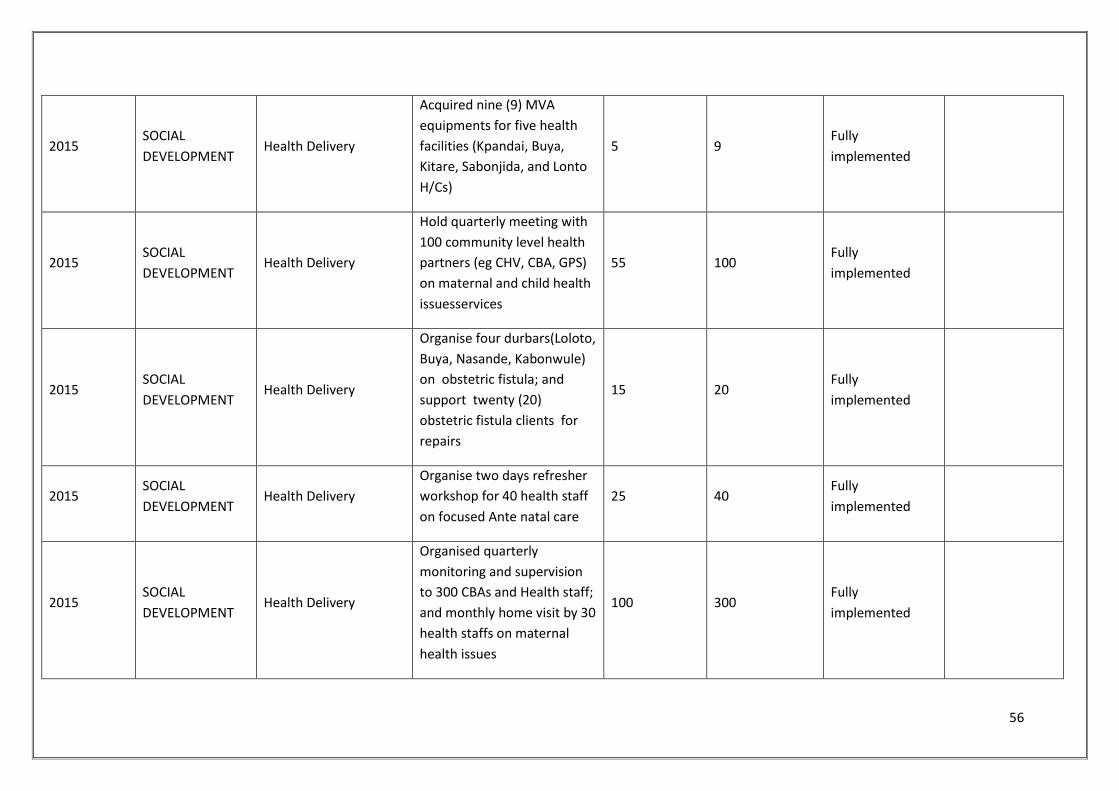
56
2015 SOCIAL
DEVELOPMENT Health Delivery
Acquired nine (9) MVA
equipments for five health
facilities (Kpandai, Buya,
Kitare, Sabonjida, and Lonto
H/Cs)
5 9 Fully
implemented
2015 SOCIAL
DEVELOPMENT Health Delivery
Hold quarterly meeting with
100 community level health
partners (eg CHV, CBA, GPS)
on maternal and child health
issuesservices
55 100 Fully
implemented
2015 SOCIAL
DEVELOPMENT Health Delivery
Organise four durbars(Loloto,
Buya, Nasande, Kabonwule)
on obstetric fistula; and
support twenty (20)
obstetric fistula clients for
repairs
15 20 Fully
implemented
2015 SOCIAL
DEVELOPMENT Health Delivery
Organise two days refresher
workshop for 40 health staff
on focused Ante natal care
25 40 Fully
implemented
2015 SOCIAL
DEVELOPMENT Health Delivery
Organised quarterly
monitoring and supervision
to 300 CBAs and Health staff;
and monthly home visit by 30
health staffs on maternal
health issues
100 300 Fully
implemented
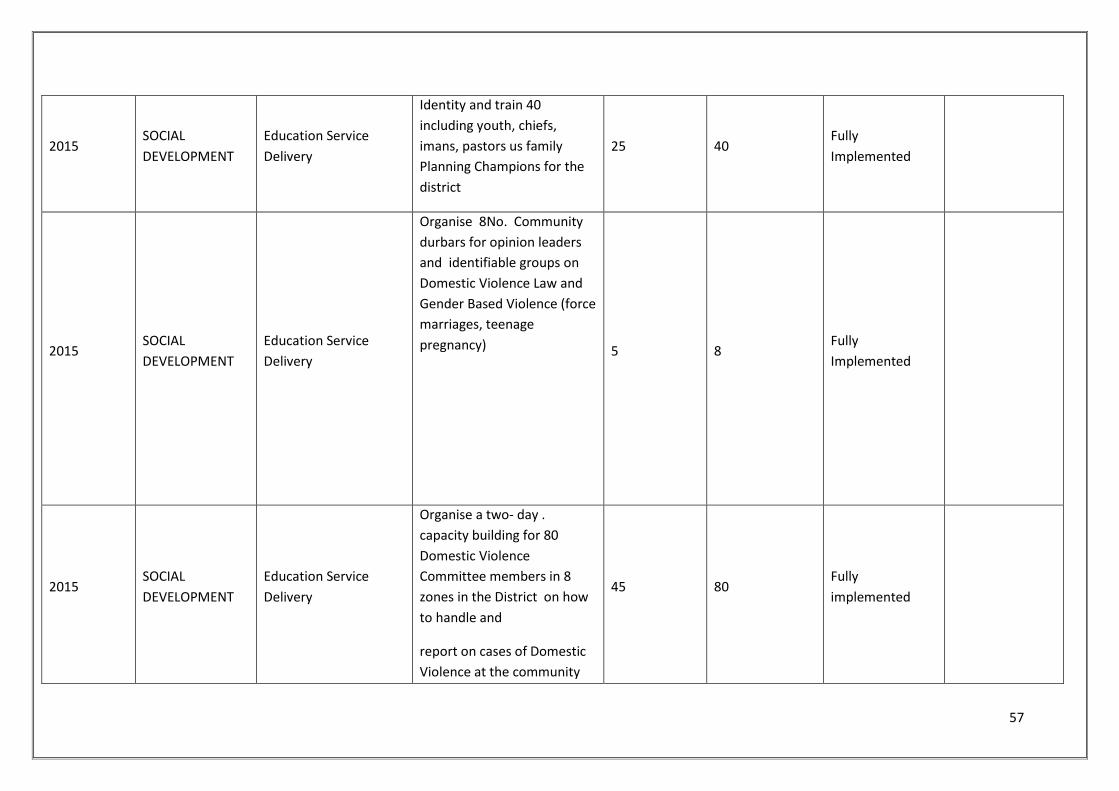
57
2015 SOCIAL
DEVELOPMENT
Education Service
Delivery
Identity and train 40
including youth, chiefs,
imans, pastors us family
Planning Champions for the
district
25 40 Fully
Implemented
2015 SOCIAL
DEVELOPMENT
Education Service
Delivery
Organise 8No. Community
durbars for opinion leaders
and identifiable groups on
Domestic Violence Law and
Gender Based Violence (force
marriages, teenage
pregnancy)
5 8 Fully
Implemented
2015 SOCIAL
DEVELOPMENT
Education Service
Delivery
Organise a two- day .
capacity building for 80
Domestic Violence
Committee members in 8
zones in the District on how
to handle and
report on cases of Domestic
Violence at the community
45 80 Fully
implemented
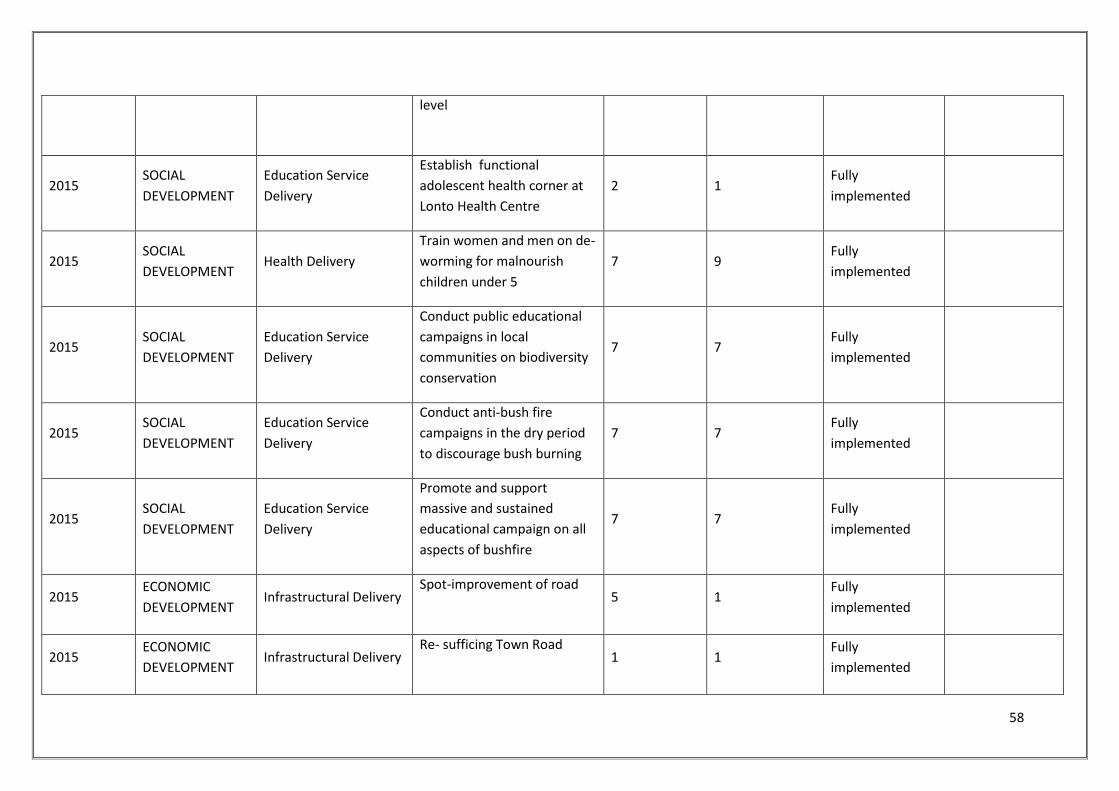
58
level
2015 SOCIAL
DEVELOPMENT
Education Service
Delivery
Establish functional
adolescent health corner at
Lonto Health Centre
2 1 Fully
implemented
2015 SOCIAL
DEVELOPMENT Health Delivery
Train women and men on de-
worming for malnourish
children under 5
7 9 Fully
implemented
2015 SOCIAL
DEVELOPMENT
Education Service
Delivery
Conduct public educational
campaigns in local
communities on biodiversity
conservation
7 7 Fully
implemented
2015 SOCIAL
DEVELOPMENT
Education Service
Delivery
Conduct anti-bush fire
campaigns in the dry period
to discourage bush burning
7 7 Fully
implemented
2015 SOCIAL
DEVELOPMENT
Education Service
Delivery
Promote and support
massive and sustained
educational campaign on all
aspects of bushfire
7 7 Fully
implemented
2015 ECONOMIC
DEVELOPMENT Infrastructural Delivery
Spot-improvement of road 5 1
Fully
implemented
2015 ECONOMIC
DEVELOPMENT Infrastructural Delivery
Re- sufficing Town Road 1 1
Fully
implemented
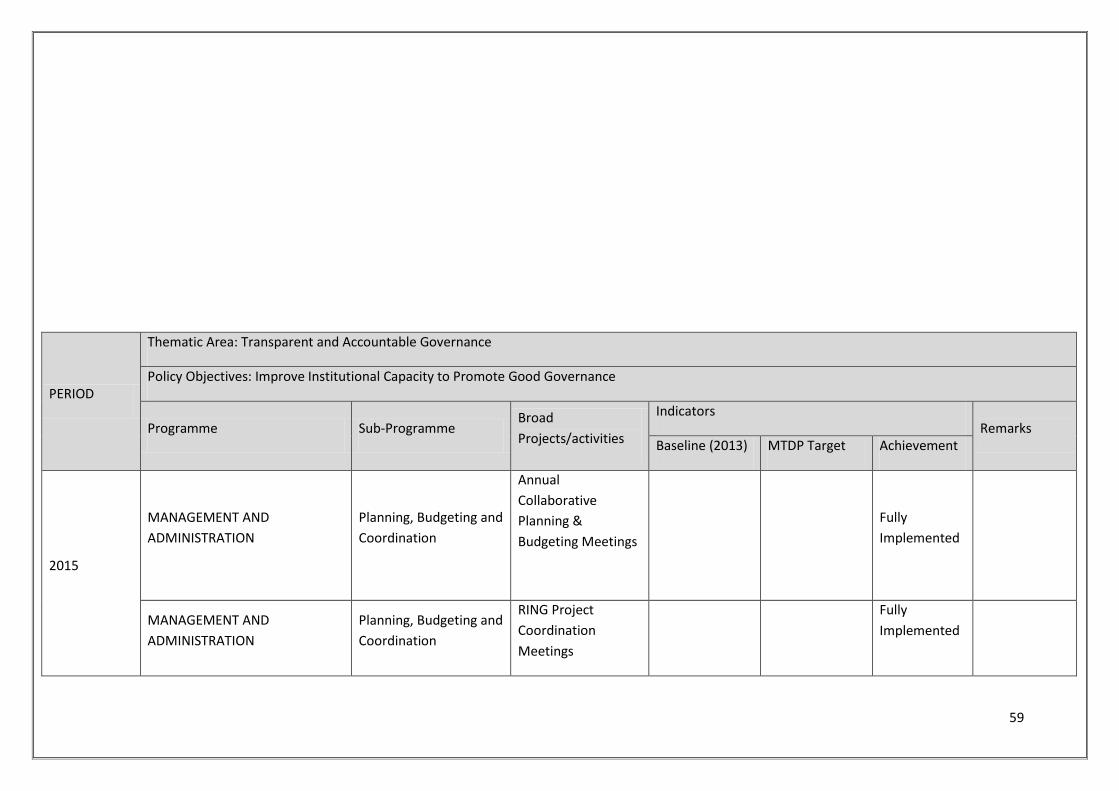
59
PERIOD
Thematic Area: Transparent and Accountable Governance
Policy Objectives: Improve Institutional Capacity to Promote Good Governance
Programme Sub-Programme Broad
Projects/activities
Indicators Remarks
Baseline (2013) MTDP Target Achievement
2015
MANAGEMENT AND
ADMINISTRATION
Planning, Budgeting and
Coordination
Annual
Collaborative
Planning &
Budgeting Meetings
Fully
Implemented
MANAGEMENT AND
ADMINISTRATION
Planning, Budgeting and
Coordination
RING Project
Coordination
Meetings
Fully
Implemented
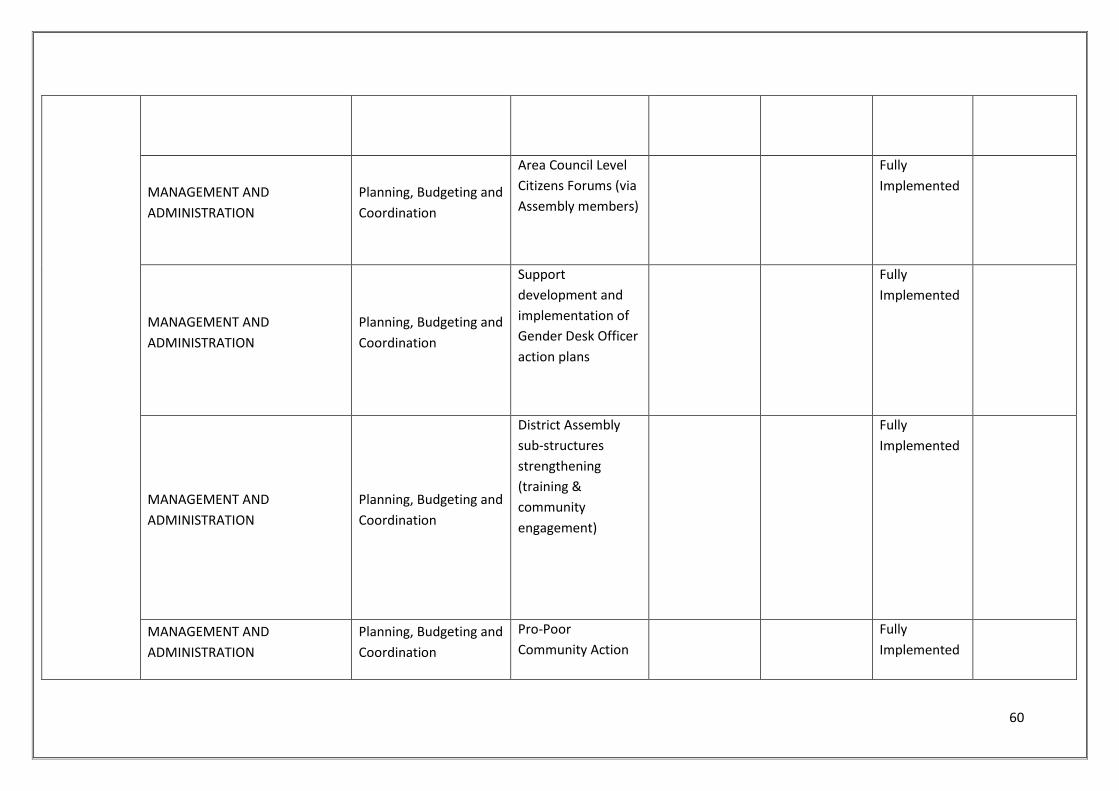
60
MANAGEMENT AND
ADMINISTRATION
Planning, Budgeting and
Coordination
Area Council Level
Citizens Forums (via
Assembly members)
Fully
Implemented
MANAGEMENT AND
ADMINISTRATION
Planning, Budgeting and
Coordination
Support
development and
implementation of
Gender Desk Officer
action plans
Fully
Implemented
MANAGEMENT AND
ADMINISTRATION
Planning, Budgeting and
Coordination
District Assembly
sub-structures
strengthening
(training &
community
engagement)
Fully
Implemented
MANAGEMENT AND
ADMINISTRATION
Planning, Budgeting and
Coordination
Pro-Poor
Community Action
Fully
Implemented
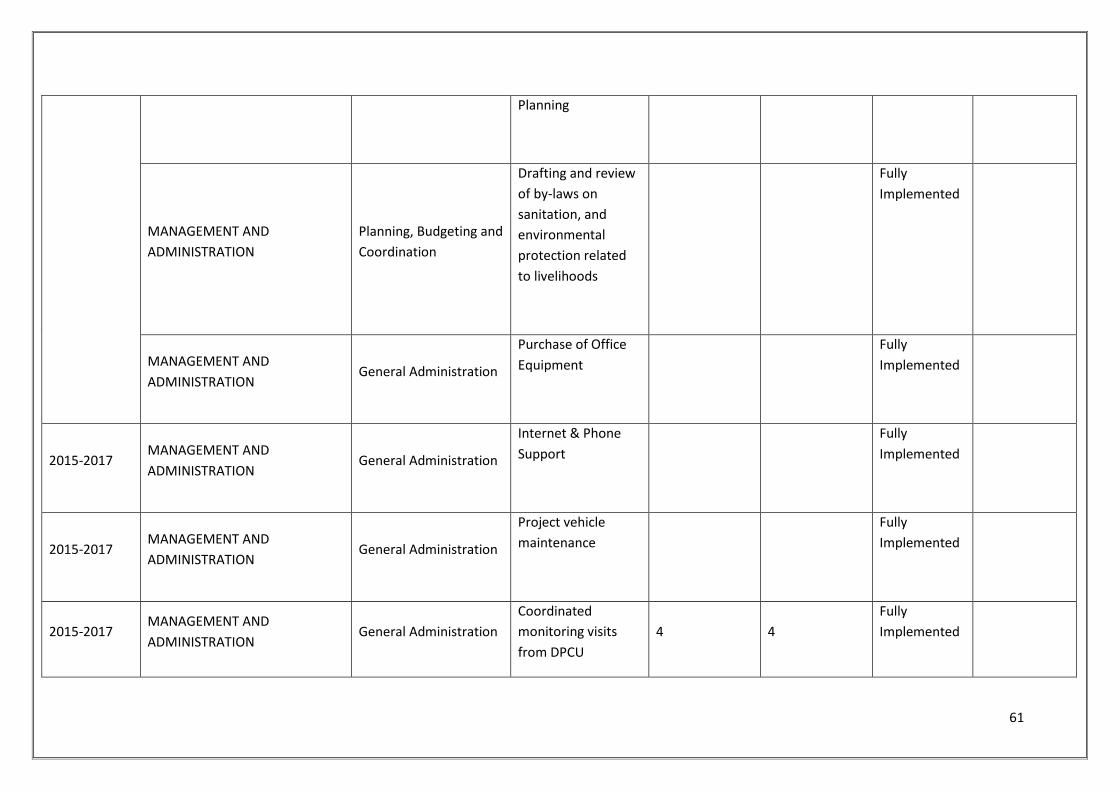
61
Planning
MANAGEMENT AND
ADMINISTRATION
Planning, Budgeting and
Coordination
Drafting and review
of by-laws on
sanitation, and
environmental
protection related
to livelihoods
Fully
Implemented
MANAGEMENT AND
ADMINISTRATION General Administration
Purchase of Office
Equipment
Fully
Implemented
2015-2017 MANAGEMENT AND
ADMINISTRATION General Administration
Internet & Phone
Support
Fully
Implemented
2015-2017 MANAGEMENT AND
ADMINISTRATION General Administration
Project vehicle
maintenance
Fully
Implemented
2015-2017 MANAGEMENT AND
ADMINISTRATION General Administration
Coordinated
monitoring visits
from DPCU
4 4
Fully
Implemented
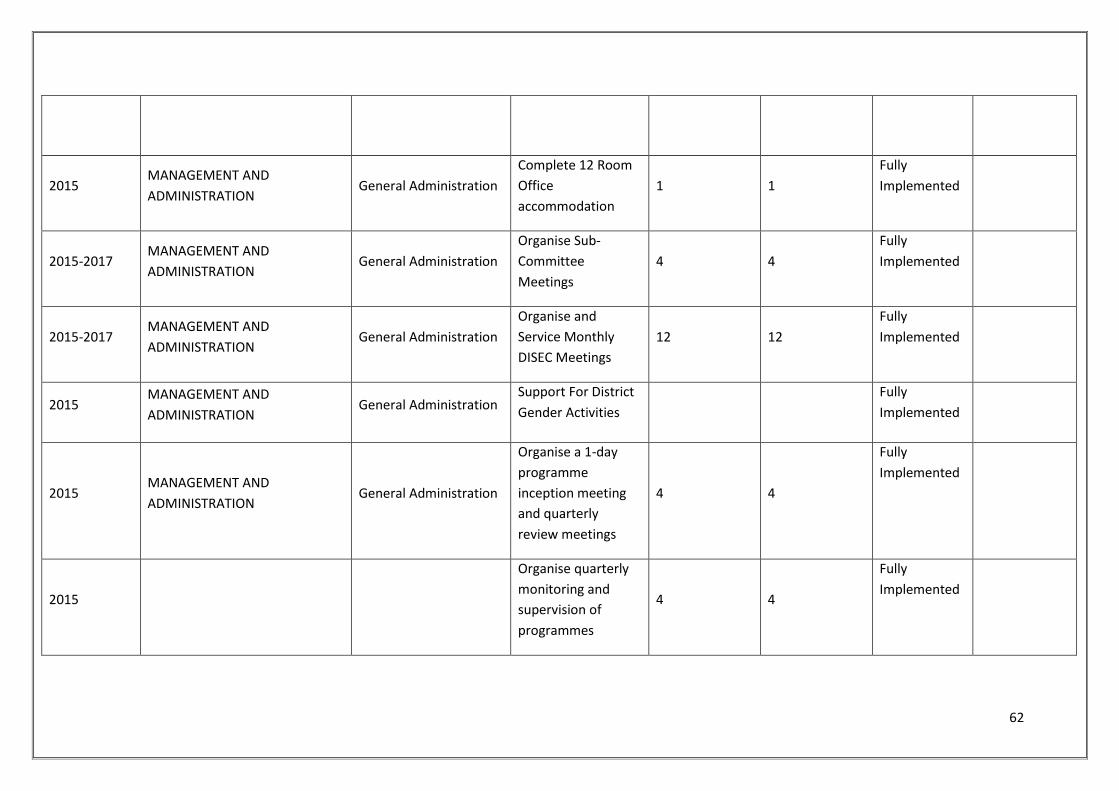
62
2015 MANAGEMENT AND
ADMINISTRATION General Administration
Complete 12 Room
Office
accommodation
1 1
Fully
Implemented
2015-2017 MANAGEMENT AND
ADMINISTRATION General Administration
Organise Sub-
Committee
Meetings
4 4
Fully
Implemented
2015-2017 MANAGEMENT AND
ADMINISTRATION General Administration
Organise and
Service Monthly
DISEC Meetings
12 12
Fully
Implemented
2015 MANAGEMENT AND
ADMINISTRATION General Administration
Support For District
Gender Activities
Fully
Implemented
2015 MANAGEMENT AND
ADMINISTRATION General Administration
Organise a 1-day
programme
inception meeting
and quarterly
review meetings
4 4
Fully
Implemented
2015
Organise quarterly
monitoring and
supervision of
programmes
4 4
Fully
Implemented
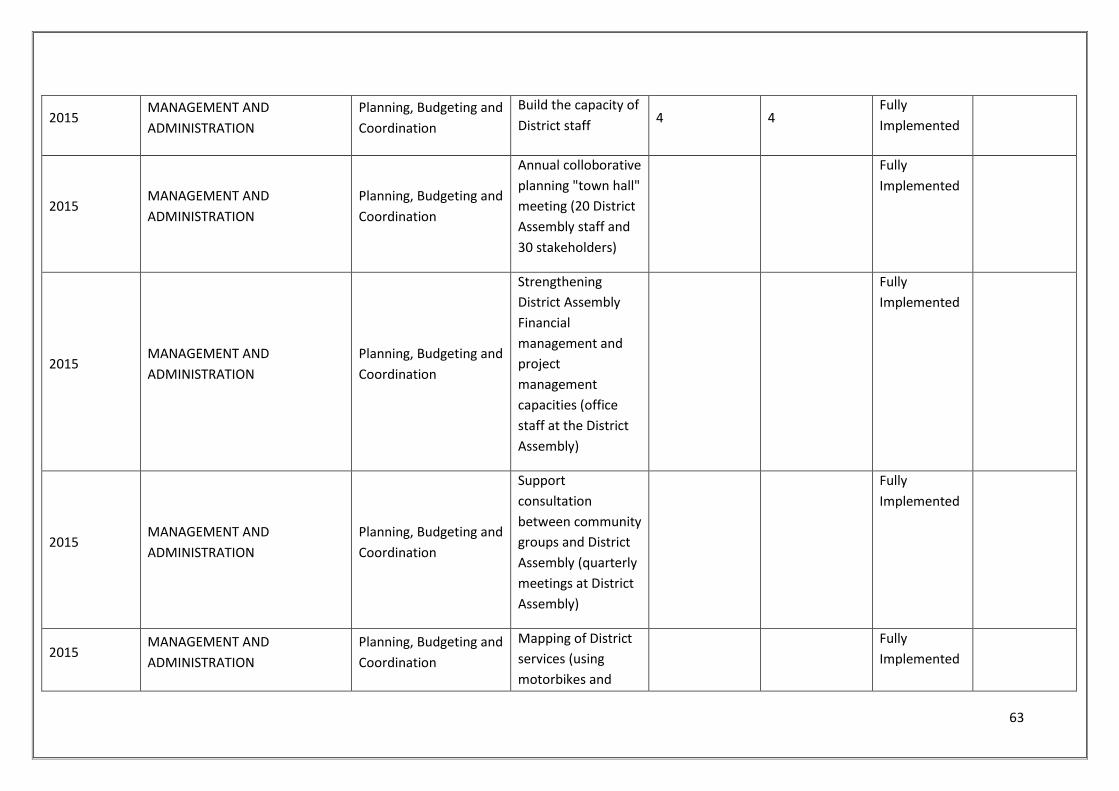
63
2015 MANAGEMENT AND
ADMINISTRATION
Planning, Budgeting and
Coordination
Build the capacity of
District staff 4 4
Fully
Implemented
2015 MANAGEMENT AND
ADMINISTRATION
Planning, Budgeting and
Coordination
Annual colloborative
planning "town hall"
meeting (20 District
Assembly staff and
30 stakeholders)
Fully
Implemented
2015 MANAGEMENT AND
ADMINISTRATION
Planning, Budgeting and
Coordination
Strengthening
District Assembly
Financial
management and
project
management
capacities (office
staff at the District
Assembly)
Fully
Implemented
2015 MANAGEMENT AND
ADMINISTRATION
Planning, Budgeting and
Coordination
Support
consultation
between community
groups and District
Assembly (quarterly
meetings at District
Assembly)
Fully
Implemented
2015 MANAGEMENT AND
ADMINISTRATION
Planning, Budgeting and
Coordination
Mapping of District
services (using
motorbikes and
Fully
Implemented
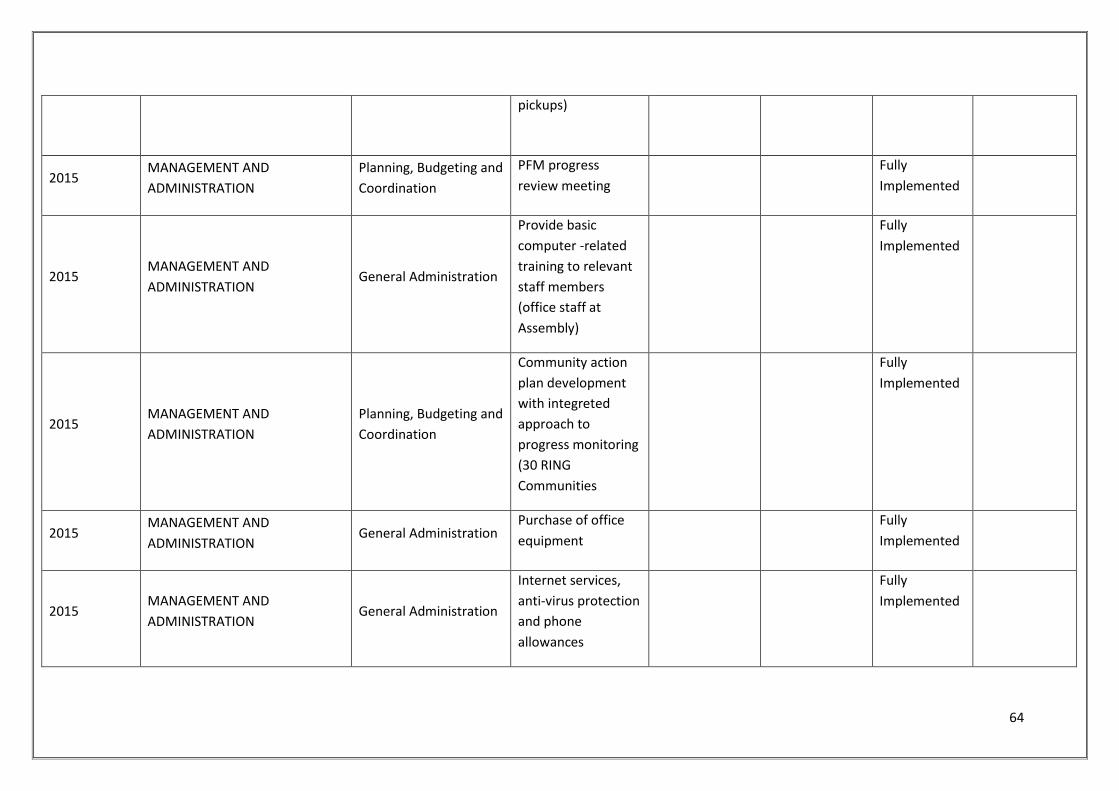
64
pickups)
2015 MANAGEMENT AND
ADMINISTRATION
Planning, Budgeting and
Coordination
PFM progress
review meeting
Fully
Implemented
2015 MANAGEMENT AND
ADMINISTRATION General Administration
Provide basic
computer -related
training to relevant
staff members
(office staff at
Assembly)
Fully
Implemented
2015 MANAGEMENT AND
ADMINISTRATION
Planning, Budgeting and
Coordination
Community action
plan development
with integreted
approach to
progress monitoring
(30 RING
Communities
Fully
Implemented
2015 MANAGEMENT AND
ADMINISTRATION General Administration
Purchase of office
equipment
Fully
Implemented
2015 MANAGEMENT AND
ADMINISTRATION General Administration
Internet services,
anti-virus protection
and phone
allowances
Fully
Implemented
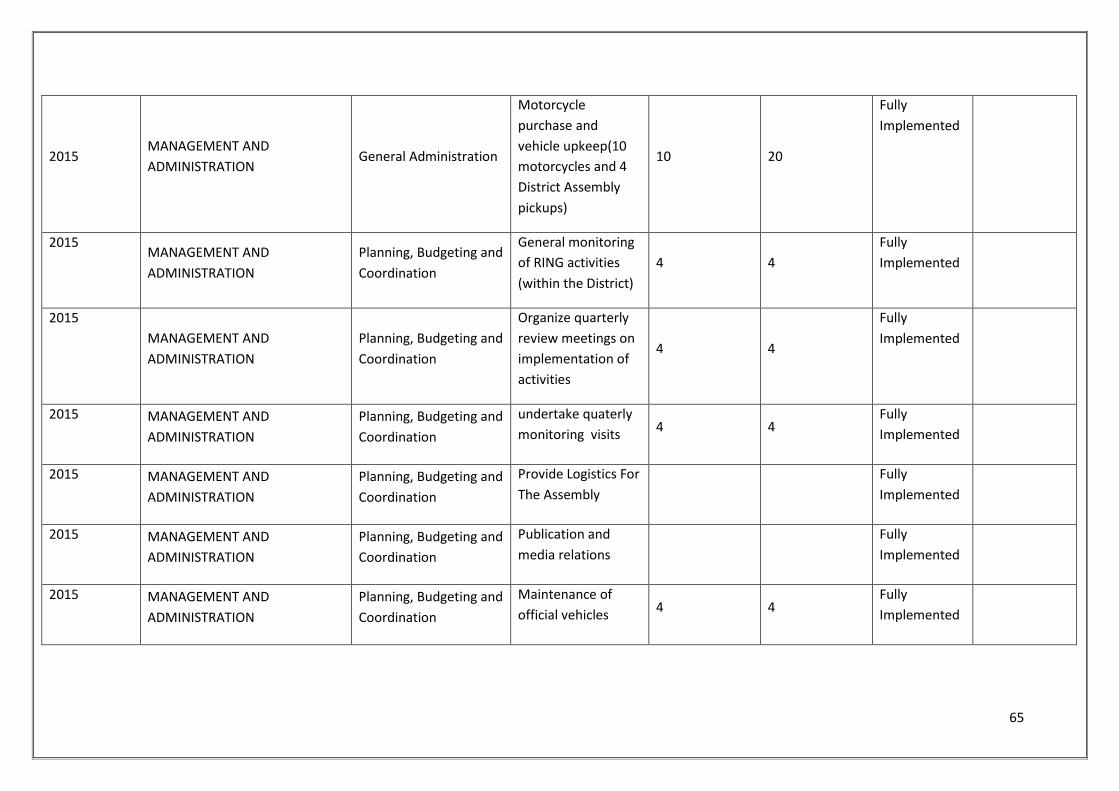
65
2015 MANAGEMENT AND
ADMINISTRATION General Administration
Motorcycle
purchase and
vehicle upkeep(10
motorcycles and 4
District Assembly
pickups)
10 20
Fully
Implemented
2015 MANAGEMENT AND
ADMINISTRATION
Planning, Budgeting and
Coordination
General monitoring
of RING activities
(within the District)
4 4
Fully
Implemented
2015
MANAGEMENT AND
ADMINISTRATION
Planning, Budgeting and
Coordination
Organize quarterly
review meetings on
implementation of
activities
4 4
Fully
Implemented
2015 MANAGEMENT AND
ADMINISTRATION
Planning, Budgeting and
Coordination
undertake quaterly
monitoring visits 4 4
Fully
Implemented
2015 MANAGEMENT AND
ADMINISTRATION
Planning, Budgeting and
Coordination
Provide Logistics For
The Assembly
Fully
Implemented
2015 MANAGEMENT AND
ADMINISTRATION
Planning, Budgeting and
Coordination
Publication and
media relations
Fully
Implemented
2015 MANAGEMENT AND
ADMINISTRATION
Planning, Budgeting and
Coordination
Maintenance of
official vehicles 4 4
Fully
Implemented
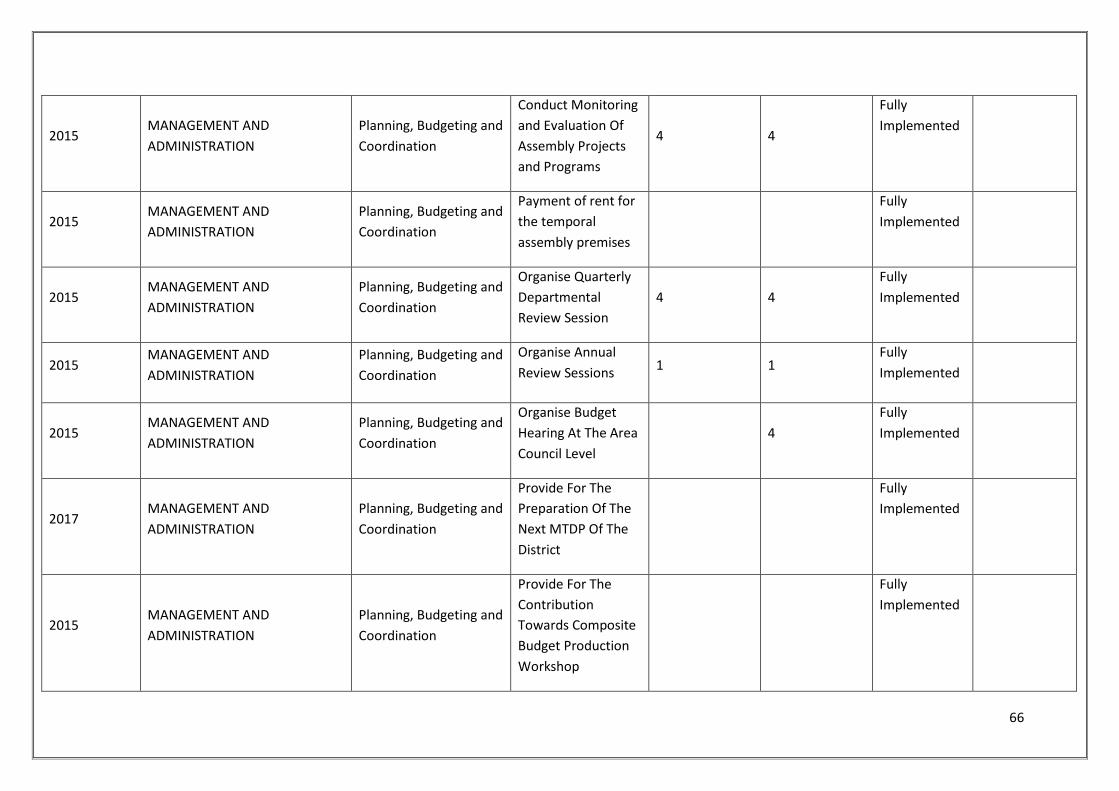
66
2015 MANAGEMENT AND
ADMINISTRATION
Planning, Budgeting and
Coordination
Conduct Monitoring
and Evaluation Of
Assembly Projects
and Programs
4 4
Fully
Implemented
2015 MANAGEMENT AND
ADMINISTRATION
Planning, Budgeting and
Coordination
Payment of rent for
the temporal
assembly premises
Fully
Implemented
2015 MANAGEMENT AND
ADMINISTRATION
Planning, Budgeting and
Coordination
Organise Quarterly
Departmental
Review Session
4 4
Fully
Implemented
2015 MANAGEMENT AND
ADMINISTRATION
Planning, Budgeting and
Coordination
Organise Annual
Review Sessions 1 1
Fully
Implemented
2015 MANAGEMENT AND
ADMINISTRATION
Planning, Budgeting and
Coordination
Organise Budget
Hearing At The Area
Council Level
4
Fully
Implemented
2017 MANAGEMENT AND
ADMINISTRATION
Planning, Budgeting and
Coordination
Provide For The
Preparation Of The
Next MTDP Of The
District
Fully
Implemented
2015 MANAGEMENT AND
ADMINISTRATION
Planning, Budgeting and
Coordination
Provide For The
Contribution
Towards Composite
Budget Production
Workshop
Fully
Implemented
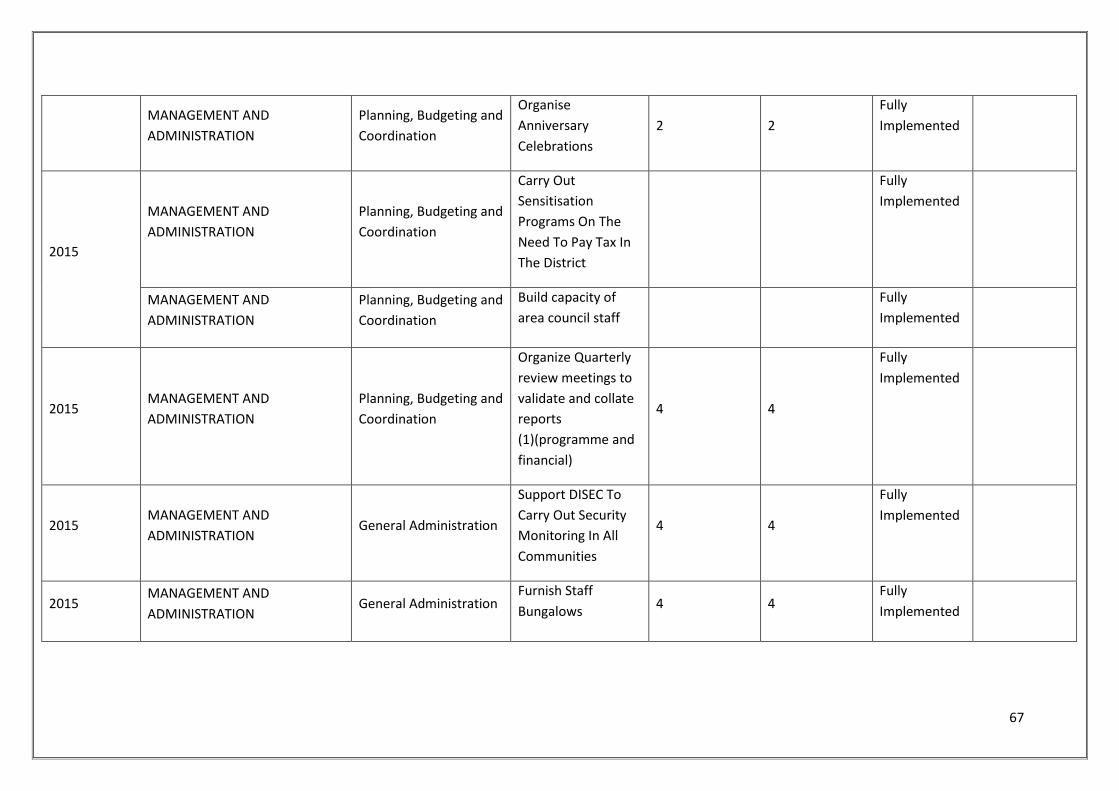
67
MANAGEMENT AND
ADMINISTRATION
Planning, Budgeting and
Coordination
Organise
Anniversary
Celebrations
2 2
Fully
Implemented
2015
MANAGEMENT AND
ADMINISTRATION
Planning, Budgeting and
Coordination
Carry Out
Sensitisation
Programs On The
Need To Pay Tax In
The District
Fully
Implemented
MANAGEMENT AND
ADMINISTRATION
Planning, Budgeting and
Coordination
Build capacity of
area council staff
Fully
Implemented
2015 MANAGEMENT AND
ADMINISTRATION
Planning, Budgeting and
Coordination
Organize Quarterly
review meetings to
validate and collate
reports
(1)(programme and
financial)
4 4
Fully
Implemented
2015 MANAGEMENT AND
ADMINISTRATION General Administration
Support DISEC To
Carry Out Security
Monitoring In All
Communities
4 4
Fully
Implemented
2015 MANAGEMENT AND
ADMINISTRATION General Administration
Furnish Staff
Bungalows 4 4
Fully
Implemented
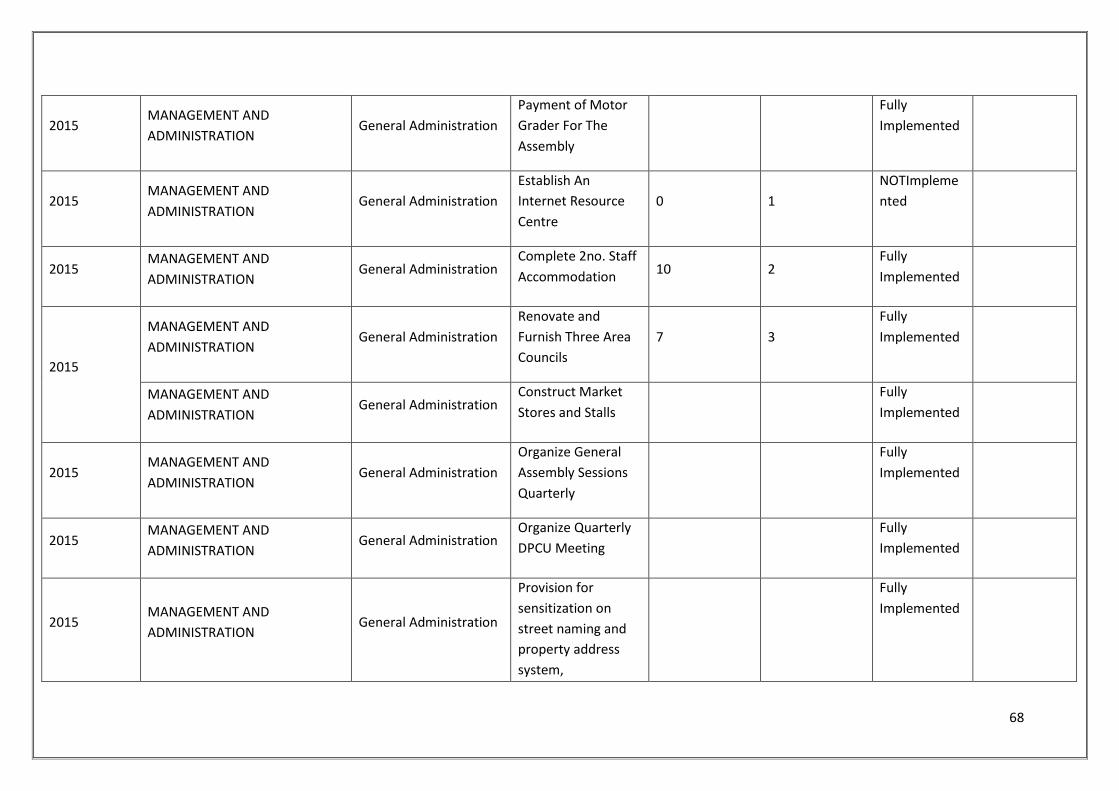
68
2015 MANAGEMENT AND
ADMINISTRATION General Administration
Payment of Motor
Grader For The
Assembly
Fully
Implemented
2015 MANAGEMENT AND
ADMINISTRATION General Administration
Establish An
Internet Resource
Centre
0 1
NOTImpleme
nted
2015 MANAGEMENT AND
ADMINISTRATION General Administration
Complete 2no. Staff
Accommodation 10 2
Fully
Implemented
2015
MANAGEMENT AND
ADMINISTRATION General Administration
Renovate and
Furnish Three Area
Councils
7 3
Fully
Implemented
MANAGEMENT AND
ADMINISTRATION General Administration
Construct Market
Stores and Stalls
Fully
Implemented
2015 MANAGEMENT AND
ADMINISTRATION General Administration
Organize General
Assembly Sessions
Quarterly
Fully
Implemented
2015 MANAGEMENT AND
ADMINISTRATION General Administration
Organize Quarterly
DPCU Meeting
Fully
Implemented
2015 MANAGEMENT AND
ADMINISTRATION General Administration
Provision for
sensitization on
street naming and
property address
system,
Fully
Implemented
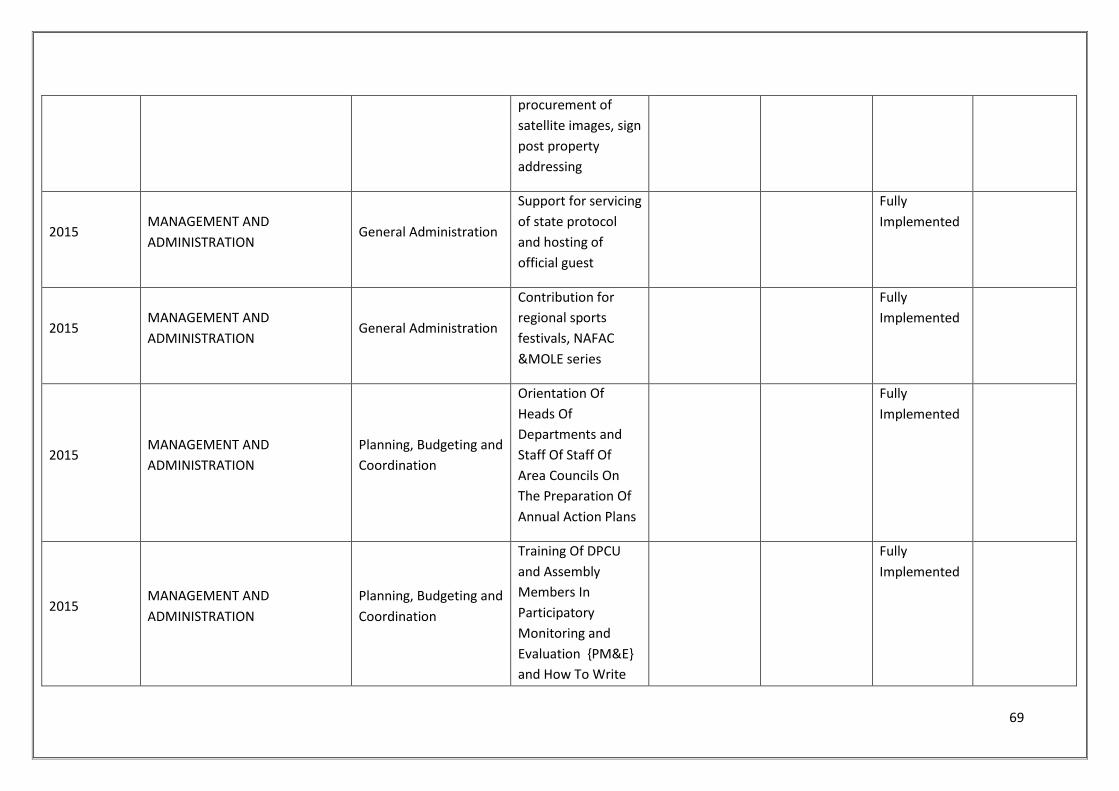
69
procurement of
satellite images, sign
post property
addressing
2015 MANAGEMENT AND
ADMINISTRATION General Administration
Support for servicing
of state protocol
and hosting of
official guest
Fully
Implemented
2015 MANAGEMENT AND
ADMINISTRATION General Administration
Contribution for
regional sports
festivals, NAFAC
&MOLE series
Fully
Implemented
2015 MANAGEMENT AND
ADMINISTRATION
Planning, Budgeting and
Coordination
Orientation Of
Heads Of
Departments and
Staff Of Staff Of
Area Councils On
The Preparation Of
Annual Action Plans
Fully
Implemented
2015 MANAGEMENT AND
ADMINISTRATION
Planning, Budgeting and
Coordination
Training Of DPCU
and Assembly
Members In
Participatory
Monitoring and
Evaluation {PM&E}
and How To Write
Fully
Implemented
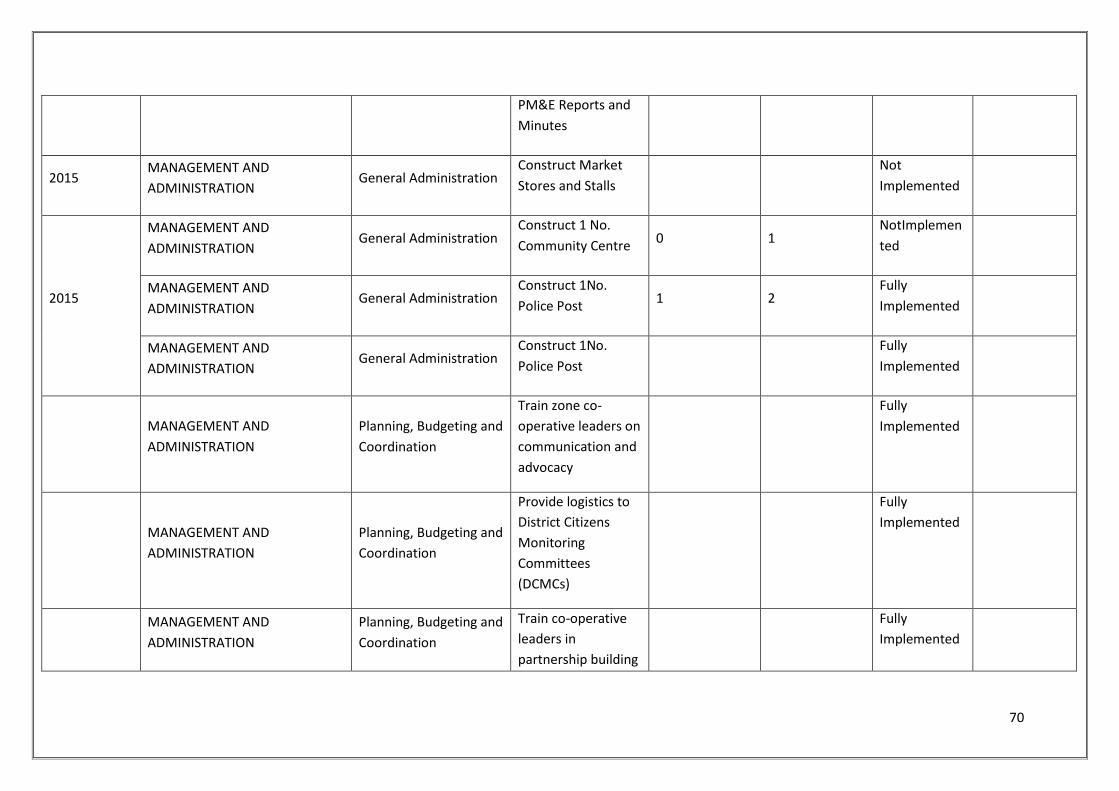
70
PM&E Reports and
Minutes
2015 MANAGEMENT AND
ADMINISTRATION General Administration
Construct Market
Stores and Stalls
Not
Implemented
2015
MANAGEMENT AND
ADMINISTRATION General Administration
Construct 1 No.
Community Centre 0 1
NotImplemen
ted
MANAGEMENT AND
ADMINISTRATION General Administration
Construct 1No.
Police Post 1 2
Fully
Implemented
MANAGEMENT AND
ADMINISTRATION General Administration
Construct 1No.
Police Post
Fully
Implemented
MANAGEMENT AND
ADMINISTRATION
Planning, Budgeting and
Coordination
Train zone co-
operative leaders on
communication and
advocacy
Fully
Implemented
MANAGEMENT AND
ADMINISTRATION
Planning, Budgeting and
Coordination
Provide logistics to
District Citizens
Monitoring
Committees
(DCMCs)
Fully
Implemented
MANAGEMENT AND
ADMINISTRATION
Planning, Budgeting and
Coordination
Train co-operative
leaders in
partnership building
Fully
Implemented
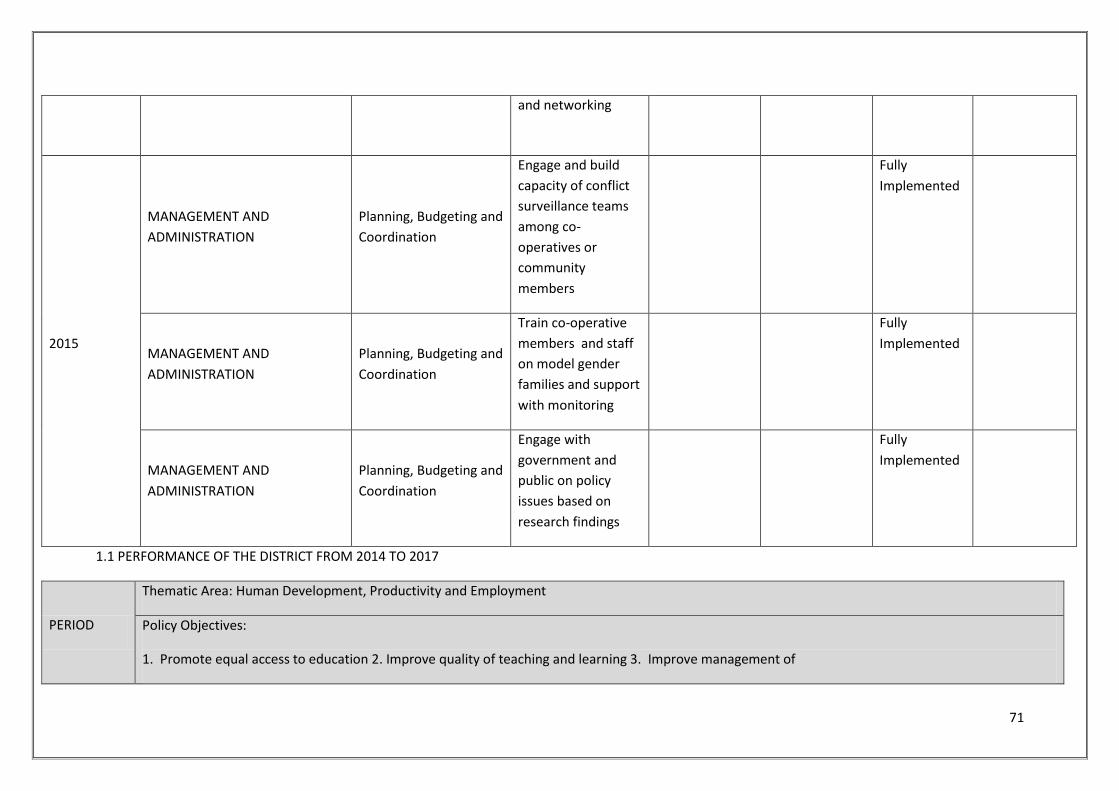
71
and networking
2015
MANAGEMENT AND
ADMINISTRATION
Planning, Budgeting and
Coordination
Engage and build
capacity of conflict
surveillance teams
among co-
operatives or
community
members
Fully
Implemented
MANAGEMENT AND
ADMINISTRATION
Planning, Budgeting and
Coordination
Train co-operative
members and staff
on model gender
families and support
with monitoring
Fully
Implemented
MANAGEMENT AND
ADMINISTRATION
Planning, Budgeting and
Coordination
Engage with
government and
public on policy
issues based on
research findings
Fully
Implemented
1.1 PERFORMANCE OF THE DISTRICT FROM 2014 TO 2017
PERIOD
Thematic Area: Human Development, Productivity and Employment
Policy Objectives:
1. Promote equal access to education 2. Improve quality of teaching and learning 3. Improve management of
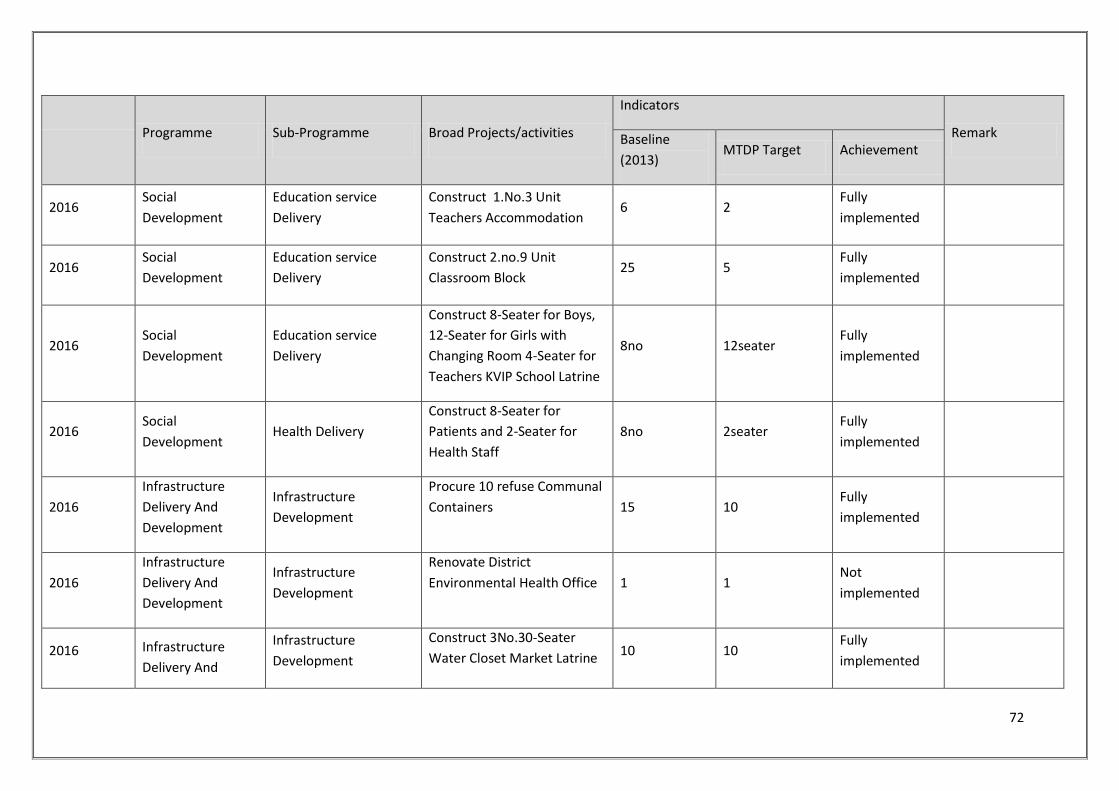
72
Programme Sub-Programme Broad Projects/activities
Indicators
Remark Baseline
(2013) MTDP Target Achievement
2016 Social
Development
Education service
Delivery
Construct 1.No.3 Unit
Teachers Accommodation 6 2
Fully
implemented
2016 Social
Development
Education service
Delivery
Construct 2.no.9 Unit
Classroom Block 25 5
Fully
implemented
2016 Social
Development
Education service
Delivery
Construct 8-Seater for Boys,
12-Seater for Girls with
Changing Room 4-Seater for
Teachers KVIP School Latrine
8no 12seater Fully
implemented
2016 Social
Development Health Delivery
Construct 8-Seater for
Patients and 2-Seater for
Health Staff
8no 2seater Fully
implemented
2016
Infrastructure
Delivery And
Development
Infrastructure
Development
Procure 10 refuse Communal
Containers 15 10 Fully
implemented
2016
Infrastructure
Delivery And
Development
Infrastructure
Development
Renovate District
Environmental Health Office 1 1 Not
implemented
2016 Infrastructure
Delivery And
Infrastructure
Development
Construct 3No.30-Seater
Water Closet Market Latrine 10 10
Fully
implemented
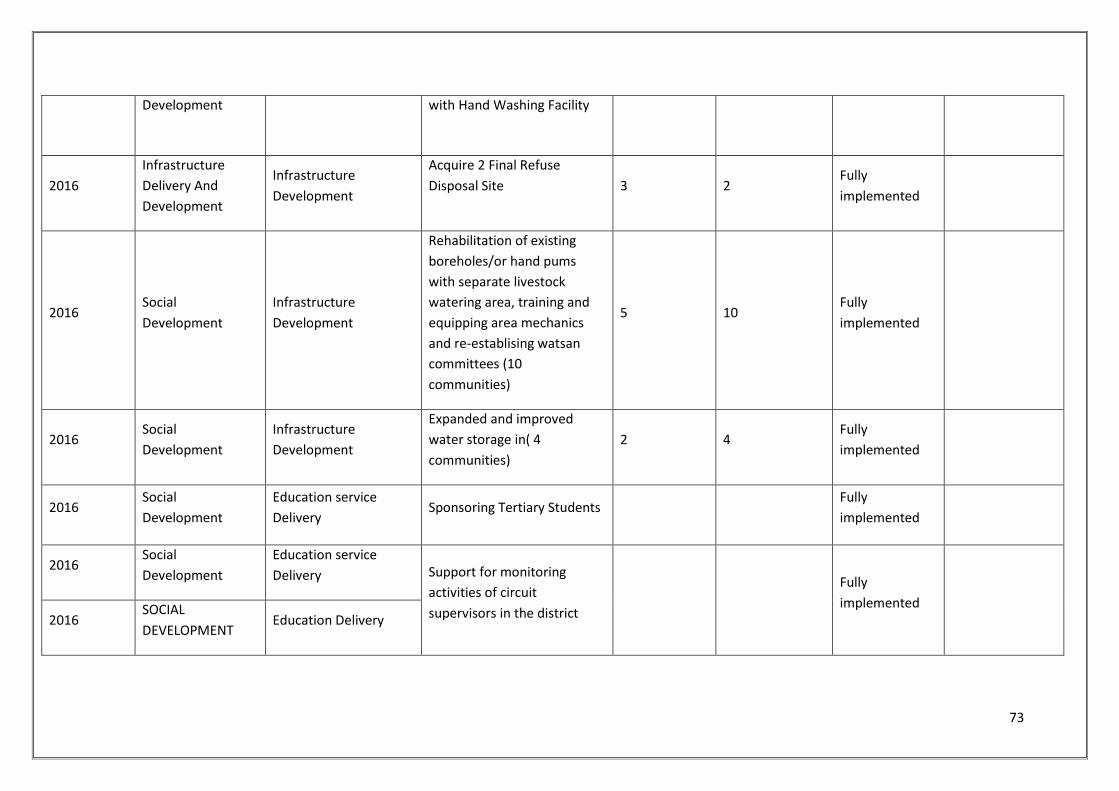
73
Development with Hand Washing Facility
2016
Infrastructure
Delivery And
Development
Infrastructure
Development
Acquire 2 Final Refuse
Disposal Site 3 2 Fully
implemented
2016 Social
Development
Infrastructure
Development
Rehabilitation of existing
boreholes/or hand pums
with separate livestock
watering area, training and
equipping area mechanics
and re-establising watsan
committees (10
communities)
5 10 Fully
implemented
2016 Social
Development
Infrastructure
Development
Expanded and improved
water storage in( 4
communities)
2 4 Fully
implemented
2016 Social
Development
Education service
Delivery Sponsoring Tertiary Students
Fully
implemented
2016 Social
Development
Education service
Delivery Support for monitoring
activities of circuit
supervisors in the district
Fully
implemented
2016 SOCIAL
DEVELOPMENT Education Delivery
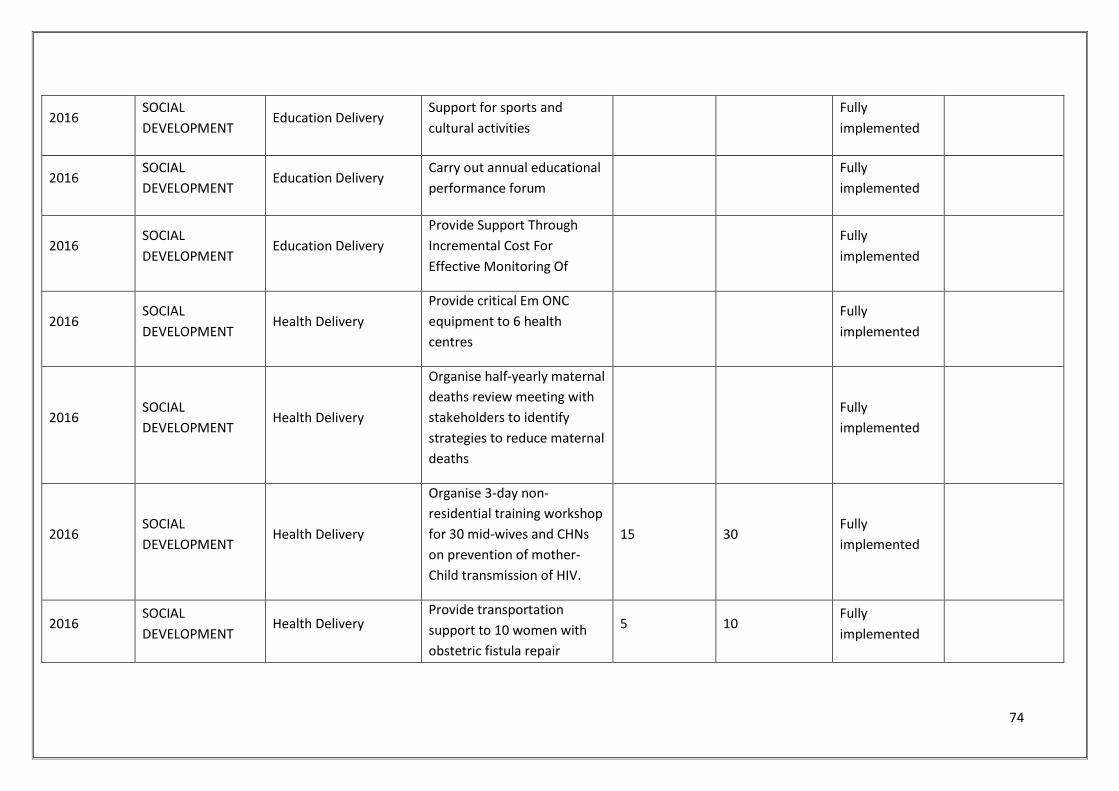
74
2016 SOCIAL
DEVELOPMENT Education Delivery
Support for sports and
cultural activities
Fully
implemented
2016 SOCIAL
DEVELOPMENT Education Delivery
Carry out annual educational
performance forum
Fully
implemented
2016 SOCIAL
DEVELOPMENT Education Delivery
Provide Support Through
Incremental Cost For
Effective Monitoring Of
Fully
implemented
2016 SOCIAL
DEVELOPMENT Health Delivery
Provide critical Em ONC
equipment to 6 health
centres
Fully
implemented
2016 SOCIAL
DEVELOPMENT Health Delivery
Organise half-yearly maternal
deaths review meeting with
stakeholders to identify
strategies to reduce maternal
deaths
Fully
implemented
2016 SOCIAL
DEVELOPMENT Health Delivery
Organise 3-day non-
residential training workshop
for 30 mid-wives and CHNs
on prevention of mother-
Child transmission of HIV.
15 30 Fully
implemented
2016 SOCIAL
DEVELOPMENT Health Delivery
Provide transportation
support to 10 women with
obstetric fistula repair
5 10 Fully
implemented
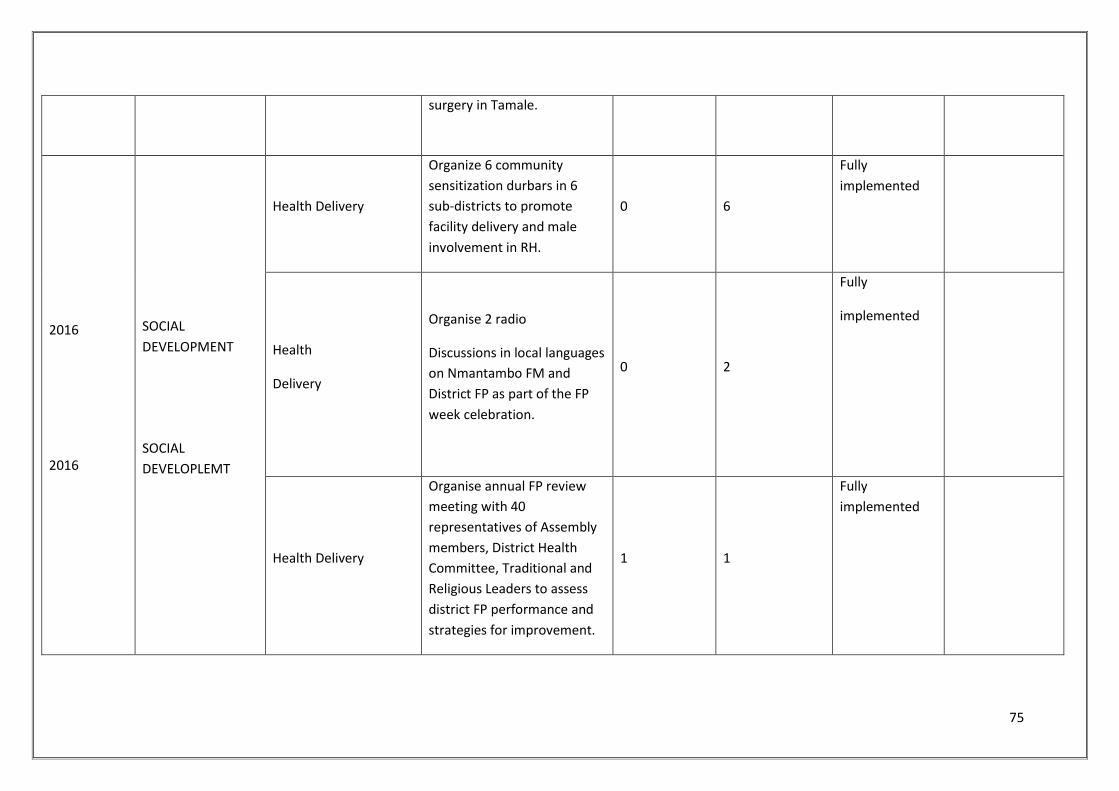
75
surgery in Tamale.
2016
2016
SOCIAL
DEVELOPMENT
SOCIAL
DEVELOPLEMT
Health Delivery
Organize 6 community
sensitization durbars in 6
sub-districts to promote
facility delivery and male
involvement in RH.
0 6
Fully
implemented
Health
Delivery
Organise 2 radio
Discussions in local languages
on Nmantambo FM and
District FP as part of the FP
week celebration.
0 2
Fully
implemented
Health Delivery
Organise annual FP review
meeting with 40
representatives of Assembly
members, District Health
Committee, Traditional and
Religious Leaders to assess
district FP performance and
strategies for improvement.
1 1
Fully
implemented
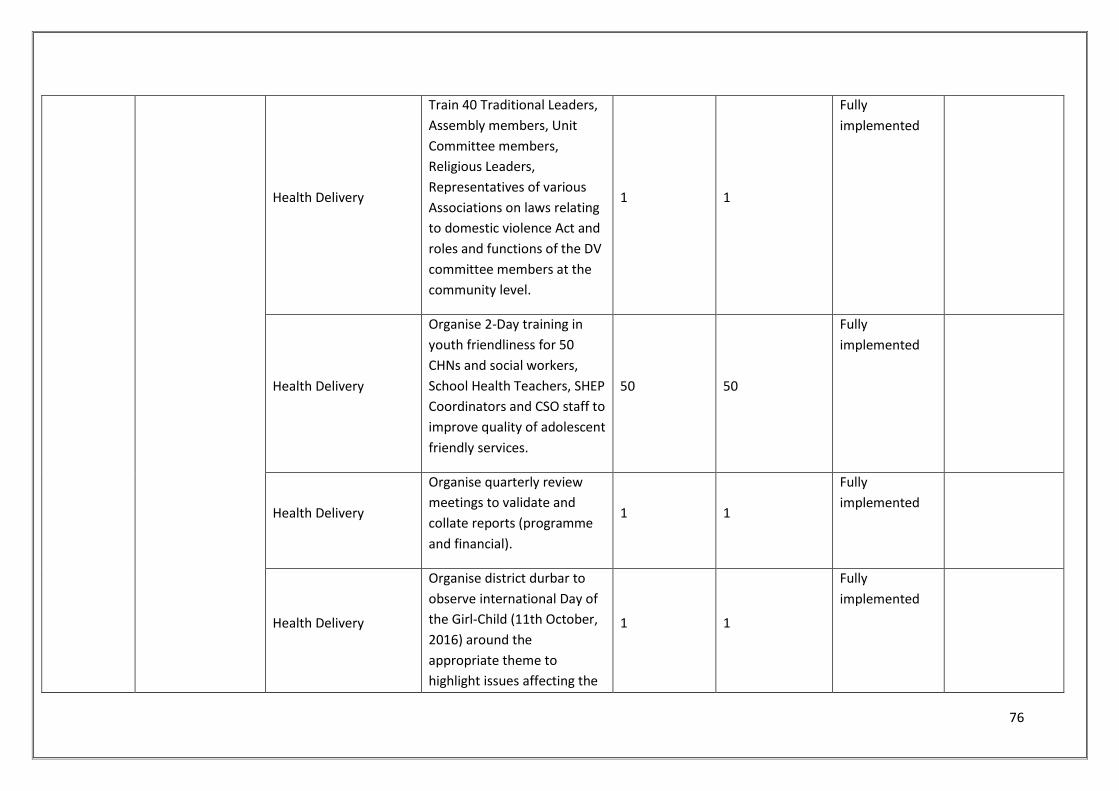
76
Health Delivery
Train 40 Traditional Leaders,
Assembly members, Unit
Committee members,
Religious Leaders,
Representatives of various
Associations on laws relating
to domestic violence Act and
roles and functions of the DV
committee members at the
community level.
1 1
Fully
implemented
Health Delivery
Organise 2-Day training in
youth friendliness for 50
CHNs and social workers,
School Health Teachers, SHEP
Coordinators and CSO staff to
improve quality of adolescent
friendly services.
50 50
Fully
implemented
Health Delivery
Organise quarterly review
meetings to validate and
collate reports (programme
and financial).
1 1
Fully
implemented
Health Delivery
Organise district durbar to
observe international Day of
the Girl-Child (11th October,
2016) around the
appropriate theme to
highlight issues affecting the
1 1
Fully
implemented
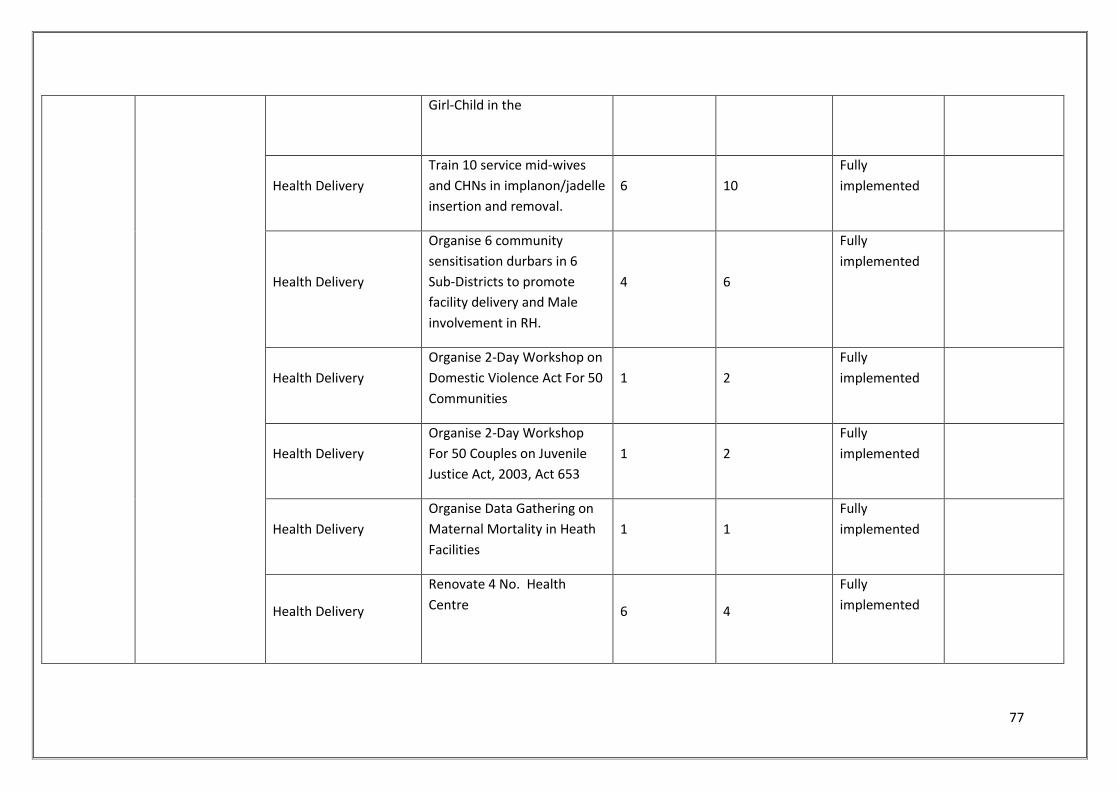
77
Girl-Child in the
Health Delivery
Train 10 service mid-wives
and CHNs in implanon/jadelle
insertion and removal.
6 10
Fully
implemented
Health Delivery
Organise 6 community
sensitisation durbars in 6
Sub-Districts to promote
facility delivery and Male
involvement in RH.
4 6
Fully
implemented
Health Delivery
Organise 2-Day Workshop on
Domestic Violence Act For 50
Communities
1 2
Fully
implemented
Health Delivery
Organise 2-Day Workshop
For 50 Couples on Juvenile
Justice Act, 2003, Act 653
1 2
Fully
implemented
Health Delivery
Organise Data Gathering on
Maternal Mortality in Heath
Facilities
1 1
Fully
implemented
Health Delivery
Renovate 4 No. Health
Centre
6 4
Fully
implemented
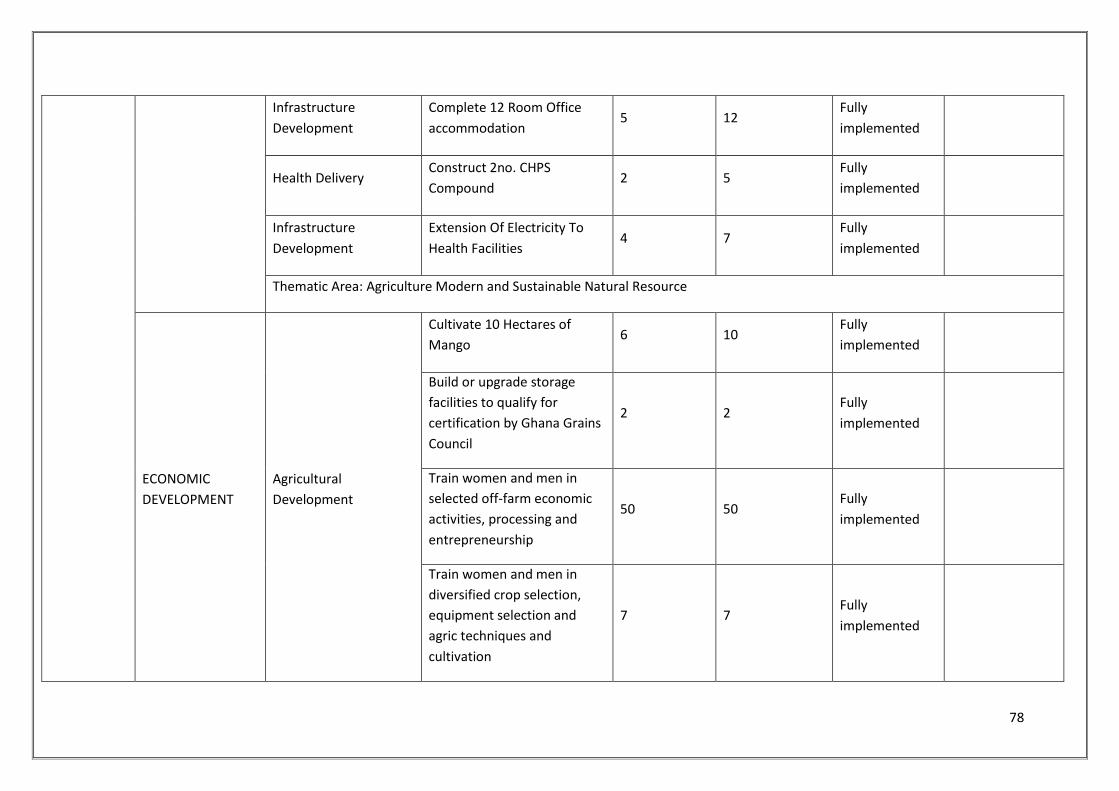
78
Infrastructure
Development
Complete 12 Room Office
accommodation 5 12
Fully
implemented
Health Delivery Construct 2no. CHPS
Compound 2 5
Fully
implemented
Infrastructure
Development
Extension Of Electricity To
Health Facilities 4 7
Fully
implemented
Thematic Area: Agriculture Modern and Sustainable Natural Resource
ECONOMIC
DEVELOPMENT
Agricultural
Development
Cultivate 10 Hectares of
Mango 6 10
Fully
implemented
Build or upgrade storage
facilities to qualify for
certification by Ghana Grains
Council
2 2 Fully
implemented
Train women and men in
selected off-farm economic
activities, processing and
entrepreneurship
50 50 Fully
implemented
Train women and men in
diversified crop selection,
equipment selection and
agric techniques and
cultivation
7 7 Fully
implemented
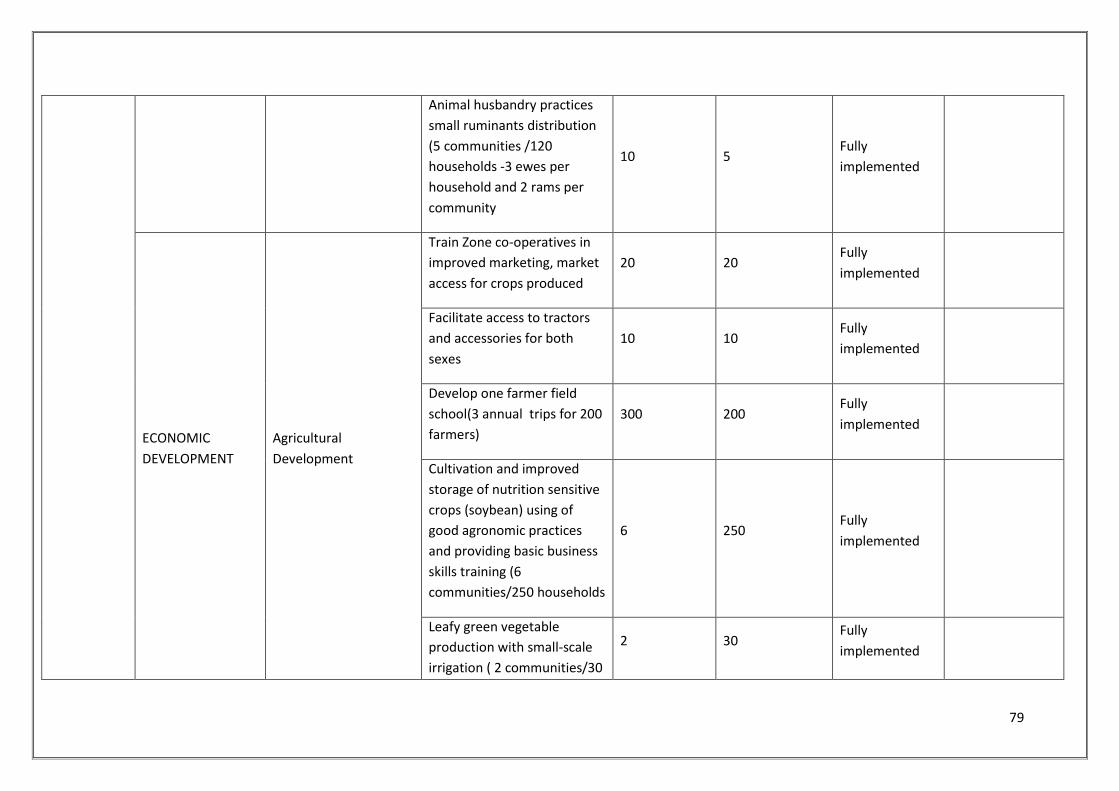
79
Animal husbandry practices
small ruminants distribution
(5 communities /120
households -3 ewes per
household and 2 rams per
community
10 5 Fully
implemented
ECONOMIC
DEVELOPMENT
Agricultural
Development
Train Zone co-operatives in
improved marketing, market
access for crops produced
20 20 Fully
implemented
Facilitate access to tractors
and accessories for both
sexes
10 10 Fully
implemented
Develop one farmer field
school(3 annual trips for 200
farmers)
300 200 Fully
implemented
Cultivation and improved
storage of nutrition sensitive
crops (soybean) using of
good agronomic practices
and providing basic business
skills training (6
communities/250 households
6 250 Fully
implemented
Leafy green vegetable
production with small-scale
irrigation ( 2 communities/30
2 30 Fully
implemented
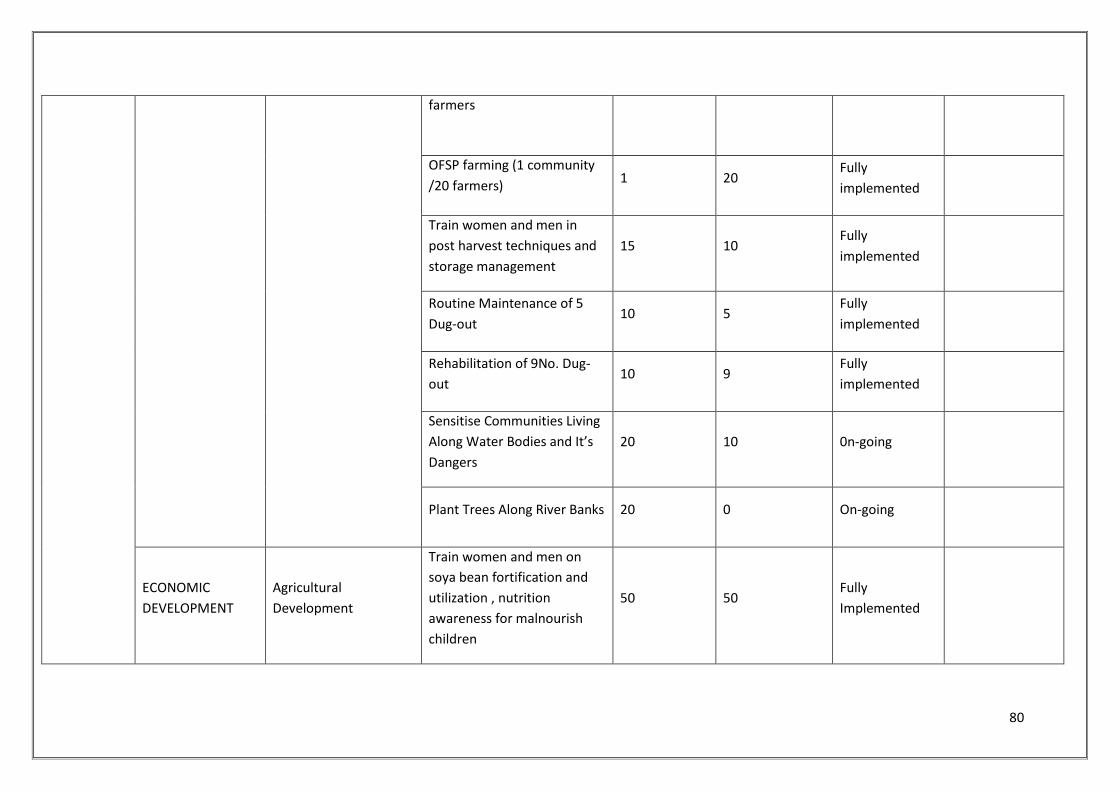
80
farmers
OFSP farming (1 community
/20 farmers) 1 20
Fully
implemented
Train women and men in
post harvest techniques and
storage management
15 10 Fully
implemented
Routine Maintenance of 5
Dug-out 10 5
Fully
implemented
Rehabilitation of 9No. Dug-
out 10 9
Fully
implemented
Sensitise Communities Living
Along Water Bodies and It’s
Dangers
20 10 0n-going
Plant Trees Along River Banks 20 0 On-going
ECONOMIC
DEVELOPMENT
Agricultural
Development
Train women and men on
soya bean fortification and
utilization , nutrition
awareness for malnourish
children
50 50 Fully
Implemented
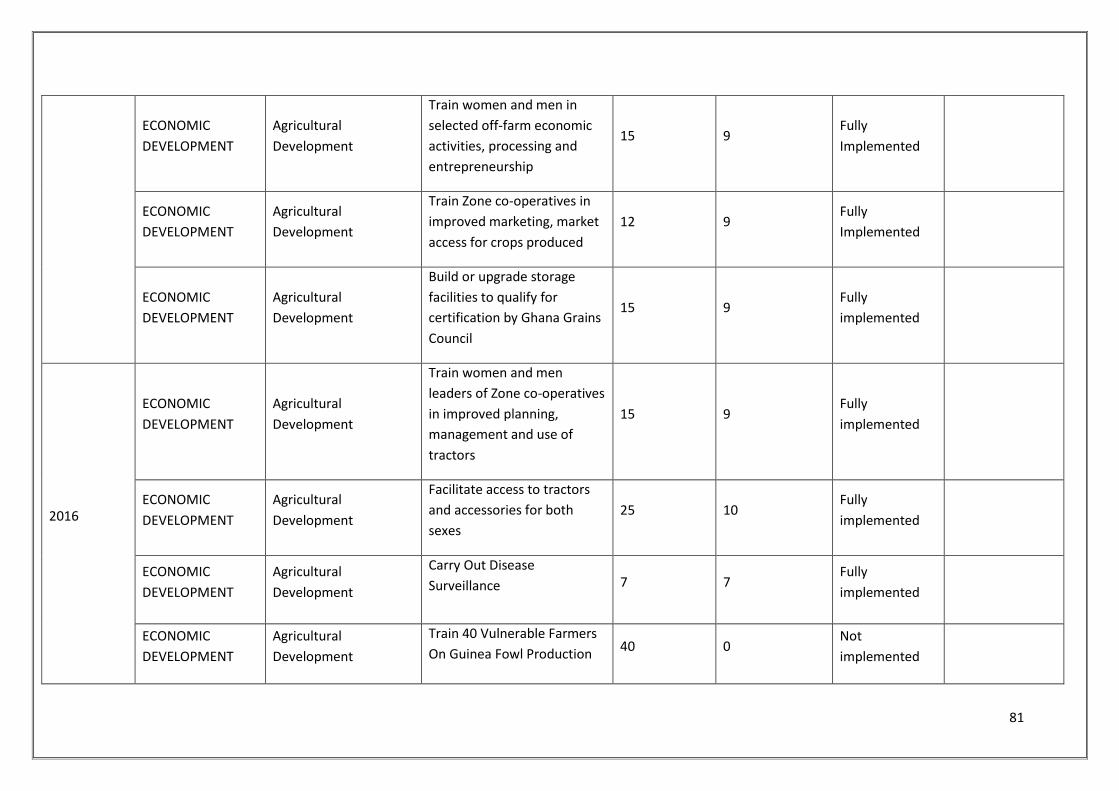
81
ECONOMIC
DEVELOPMENT
Agricultural
Development
Train women and men in
selected off-farm economic
activities, processing and
entrepreneurship
15 9 Fully
Implemented
ECONOMIC
DEVELOPMENT
Agricultural
Development
Train Zone co-operatives in
improved marketing, market
access for crops produced
12 9 Fully
Implemented
ECONOMIC
DEVELOPMENT
Agricultural
Development
Build or upgrade storage
facilities to qualify for
certification by Ghana Grains
Council
15 9 Fully
implemented
2016
ECONOMIC
DEVELOPMENT
Agricultural
Development
Train women and men
leaders of Zone co-operatives
in improved planning,
management and use of
tractors
15 9 Fully
implemented
ECONOMIC
DEVELOPMENT
Agricultural
Development
Facilitate access to tractors
and accessories for both
sexes
25 10 Fully
implemented
ECONOMIC
DEVELOPMENT
Agricultural
Development
Carry Out Disease
Surveillance 7 7 Fully
implemented
ECONOMIC
DEVELOPMENT
Agricultural
Development
Train 40 Vulnerable Farmers
On Guinea Fowl Production 40 0
Not
implemented
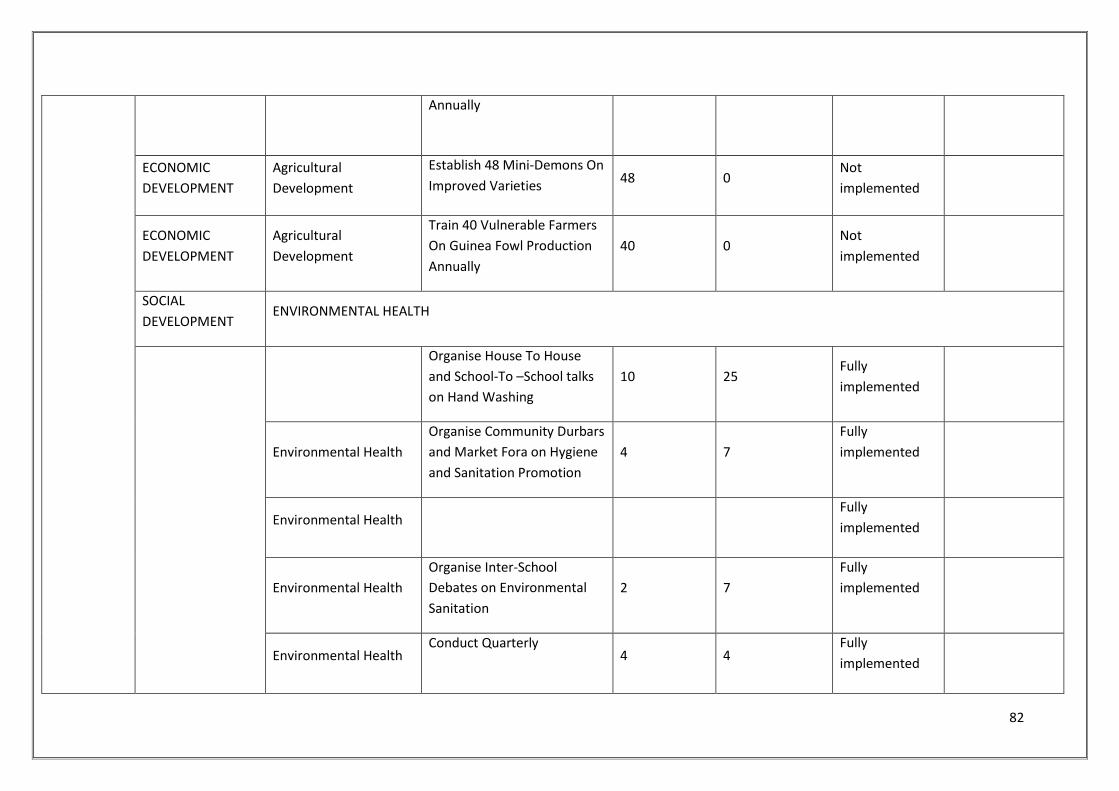
82
Annually
ECONOMIC
DEVELOPMENT
Agricultural
Development
Establish 48 Mini-Demons On
Improved Varieties 48 0
Not
implemented
ECONOMIC
DEVELOPMENT
Agricultural
Development
Train 40 Vulnerable Farmers
On Guinea Fowl Production
Annually
40 0 Not
implemented
SOCIAL
DEVELOPMENT ENVIRONMENTAL HEALTH
Organise House To House
and School-To –School talks
on Hand Washing
10 25 Fully
implemented
Environmental Health
Organise Community Durbars
and Market Fora on Hygiene
and Sanitation Promotion
4 7
Fully
implemented
Environmental Health Fully
implemented
Environmental Health
Organise Inter-School
Debates on Environmental
Sanitation
2 7
Fully
implemented
Environmental Health Conduct Quarterly
4 4 Fully
implemented
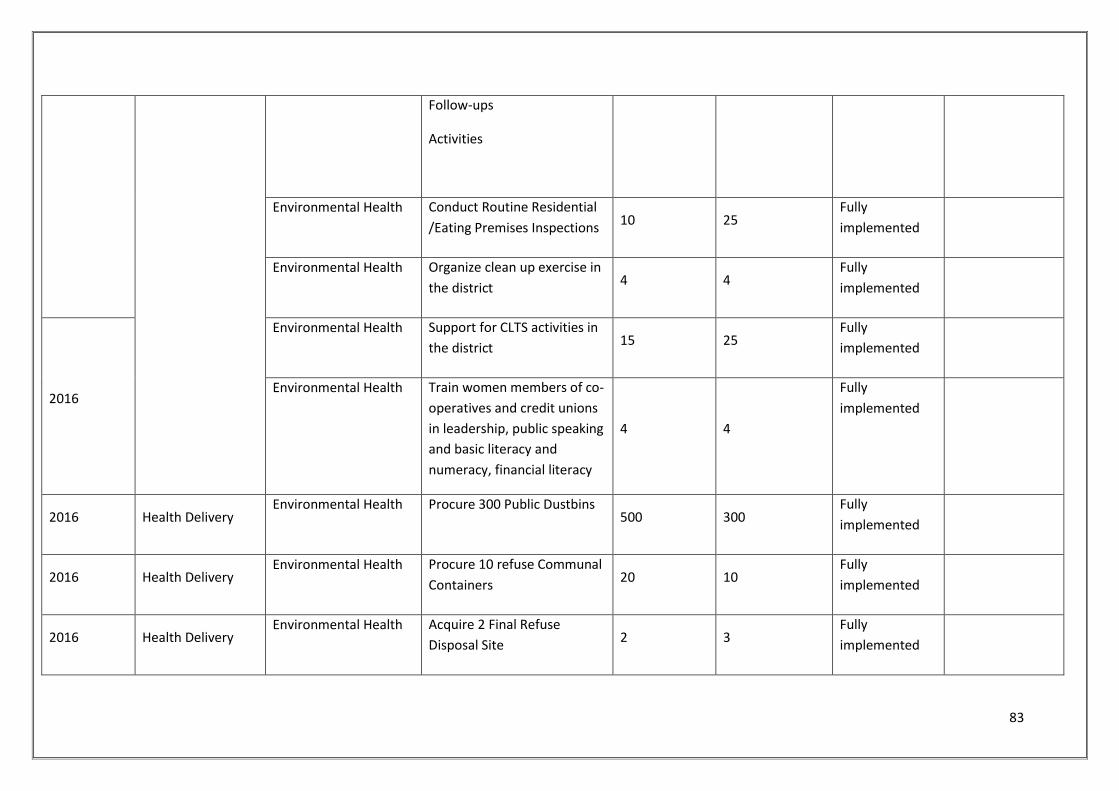
83
Follow-ups
Activities
Environmental Health Conduct Routine Residential
/Eating Premises Inspections 10 25
Fully
implemented
Environmental Health Organize clean up exercise in
the district 4 4
Fully
implemented
2016
Environmental Health Support for CLTS activities in
the district 15 25
Fully
implemented
Environmental Health Train women members of co-
operatives and credit unions
in leadership, public speaking
and basic literacy and
numeracy, financial literacy
4 4
Fully
implemented
2016 Health Delivery Environmental Health Procure 300 Public Dustbins
500 300 Fully
implemented
2016 Health Delivery Environmental Health Procure 10 refuse Communal
Containers 20 10
Fully
implemented
2016 Health Delivery Environmental Health Acquire 2 Final Refuse
Disposal Site 2 3
Fully
implemented
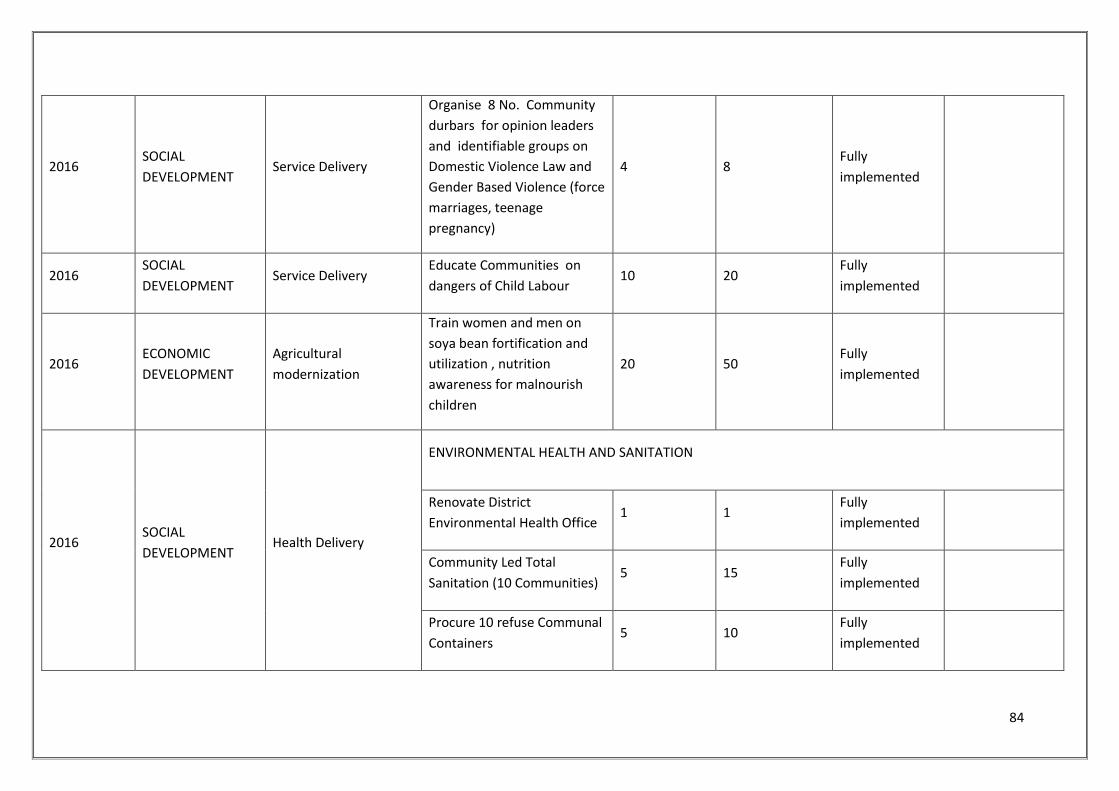
84
2016 SOCIAL
DEVELOPMENT Service Delivery
Organise 8 No. Community
durbars for opinion leaders
and identifiable groups on
Domestic Violence Law and
Gender Based Violence (force
marriages, teenage
pregnancy)
4 8 Fully
implemented
2016 SOCIAL
DEVELOPMENT Service Delivery
Educate Communities on
dangers of Child Labour 10 20
Fully
implemented
2016 ECONOMIC
DEVELOPMENT
Agricultural
modernization
Train women and men on
soya bean fortification and
utilization , nutrition
awareness for malnourish
children
20 50 Fully
implemented
2016 SOCIAL
DEVELOPMENT Health Delivery
ENVIRONMENTAL HEALTH AND SANITATION
Renovate District
Environmental Health Office 1 1
Fully
implemented
Community Led Total
Sanitation (10 Communities) 5 15
Fully
implemented
Procure 10 refuse Communal
Containers 5 10
Fully
implemented
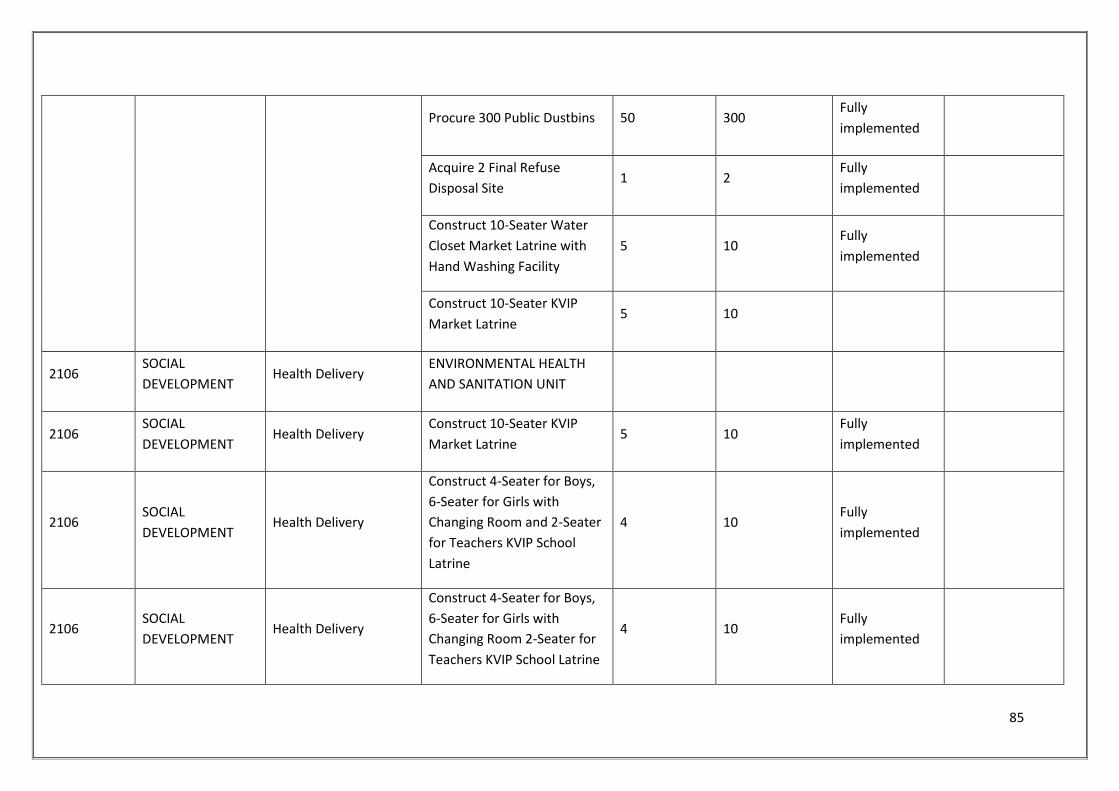
85
Procure 300 Public Dustbins 50 300 Fully
implemented
Acquire 2 Final Refuse
Disposal Site 1 2
Fully
implemented
Construct 10-Seater Water
Closet Market Latrine with
Hand Washing Facility
5 10 Fully
implemented
Construct 10-Seater KVIP
Market Latrine 5 10
2106 SOCIAL
DEVELOPMENT Health Delivery
ENVIRONMENTAL HEALTH
AND SANITATION UNIT
2106 SOCIAL
DEVELOPMENT Health Delivery
Construct 10-Seater KVIP
Market Latrine 5 10
Fully
implemented
2106 SOCIAL
DEVELOPMENT Health Delivery
Construct 4-Seater for Boys,
6-Seater for Girls with
Changing Room and 2-Seater
for Teachers KVIP School
Latrine
4 10 Fully
implemented
2106 SOCIAL
DEVELOPMENT Health Delivery
Construct 4-Seater for Boys,
6-Seater for Girls with
Changing Room 2-Seater for
Teachers KVIP School Latrine
4 10 Fully
implemented
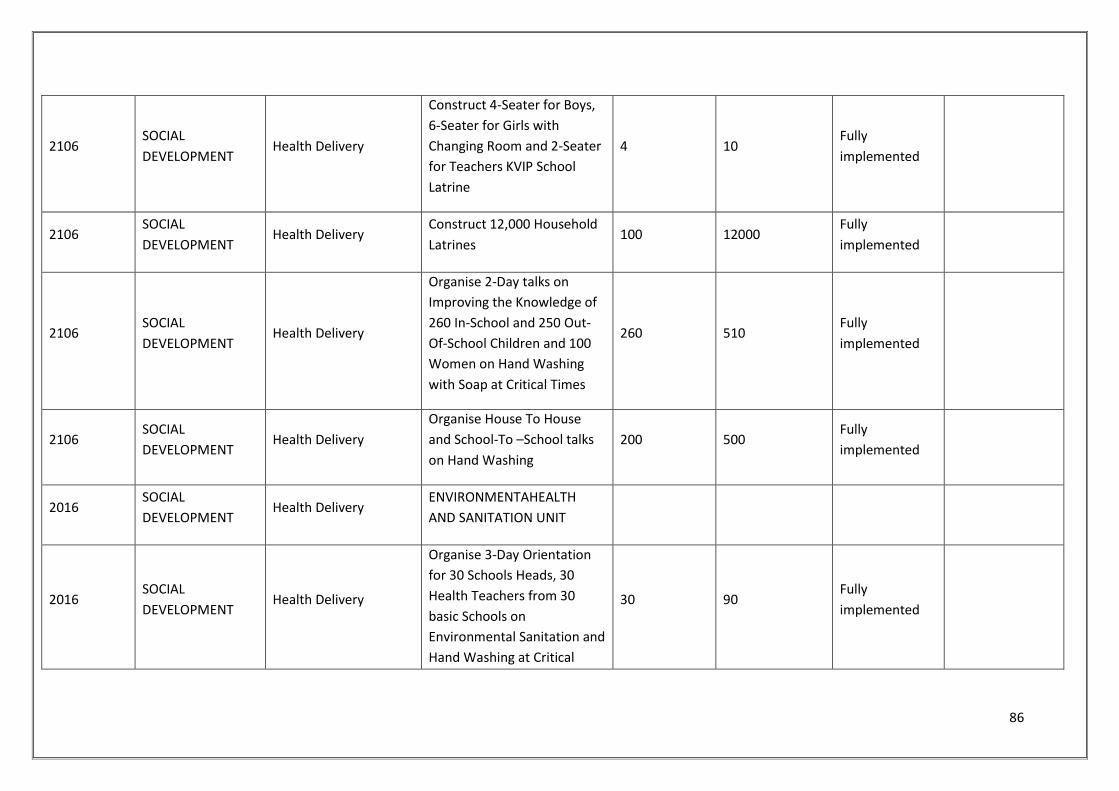
86
2106 SOCIAL
DEVELOPMENT Health Delivery
Construct 4-Seater for Boys,
6-Seater for Girls with
Changing Room and 2-Seater
for Teachers KVIP School
Latrine
4 10 Fully
implemented
2106 SOCIAL
DEVELOPMENT Health Delivery
Construct 12,000 Household
Latrines 100 12000
Fully
implemented
2106 SOCIAL
DEVELOPMENT Health Delivery
Organise 2-Day talks on
Improving the Knowledge of
260 In-School and 250 Out-
Of-School Children and 100
Women on Hand Washing
with Soap at Critical Times
260 510 Fully
implemented
2106 SOCIAL
DEVELOPMENT Health Delivery
Organise House To House
and School-To –School talks
on Hand Washing
200 500 Fully
implemented
2016 SOCIAL
DEVELOPMENT Health Delivery
ENVIRONMENTAHEALTH
AND SANITATION UNIT
2016 SOCIAL
DEVELOPMENT Health Delivery
Organise 3-Day Orientation
for 30 Schools Heads, 30
Health Teachers from 30
basic Schools on
Environmental Sanitation and
Hand Washing at Critical
30 90 Fully
implemented
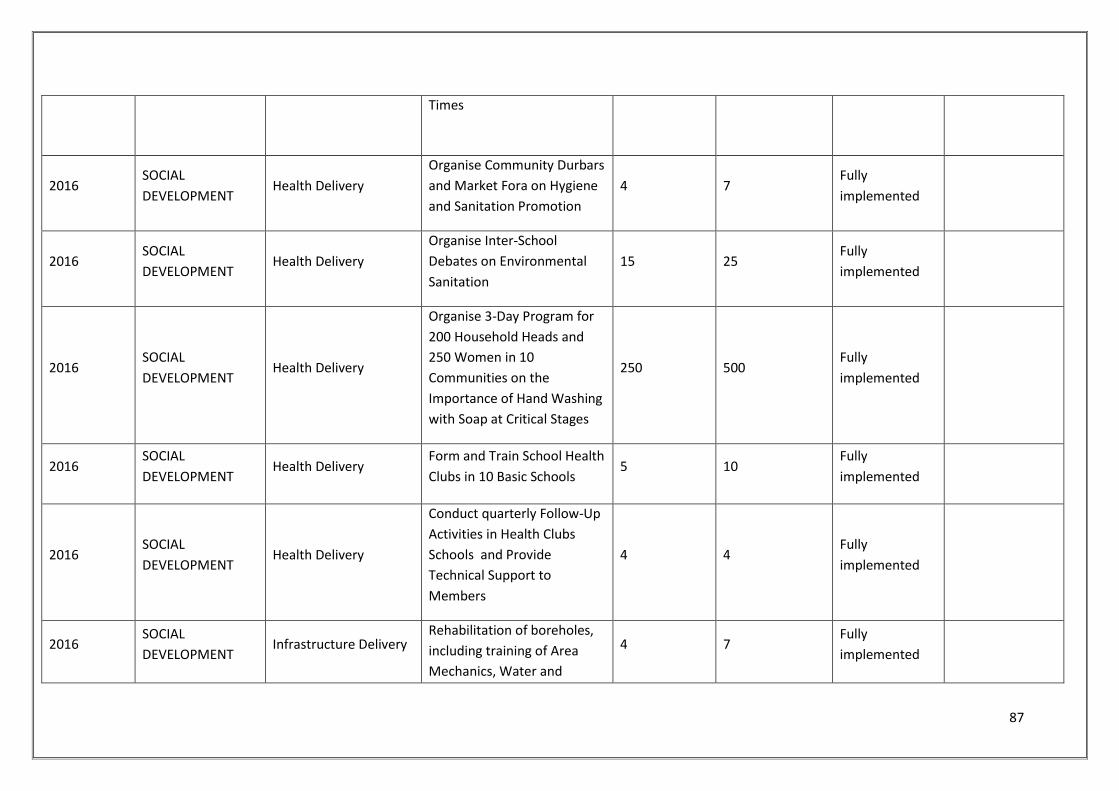
87
Times
2016 SOCIAL
DEVELOPMENT Health Delivery
Organise Community Durbars
and Market Fora on Hygiene
and Sanitation Promotion
4 7 Fully
implemented
2016 SOCIAL
DEVELOPMENT Health Delivery
Organise Inter-School
Debates on Environmental
Sanitation
15 25 Fully
implemented
2016 SOCIAL
DEVELOPMENT Health Delivery
Organise 3-Day Program for
200 Household Heads and
250 Women in 10
Communities on the
Importance of Hand Washing
with Soap at Critical Stages
250 500 Fully
implemented
2016 SOCIAL
DEVELOPMENT Health Delivery
Form and Train School Health
Clubs in 10 Basic Schools 5 10
Fully
implemented
2016 SOCIAL
DEVELOPMENT Health Delivery
Conduct quarterly Follow-Up
Activities in Health Clubs
Schools and Provide
Technical Support to
Members
4 4 Fully
implemented
2016 SOCIAL
DEVELOPMENT Infrastructure Delivery
Rehabilitation of boreholes,
including training of Area
Mechanics, Water and
4 7 Fully
implemented
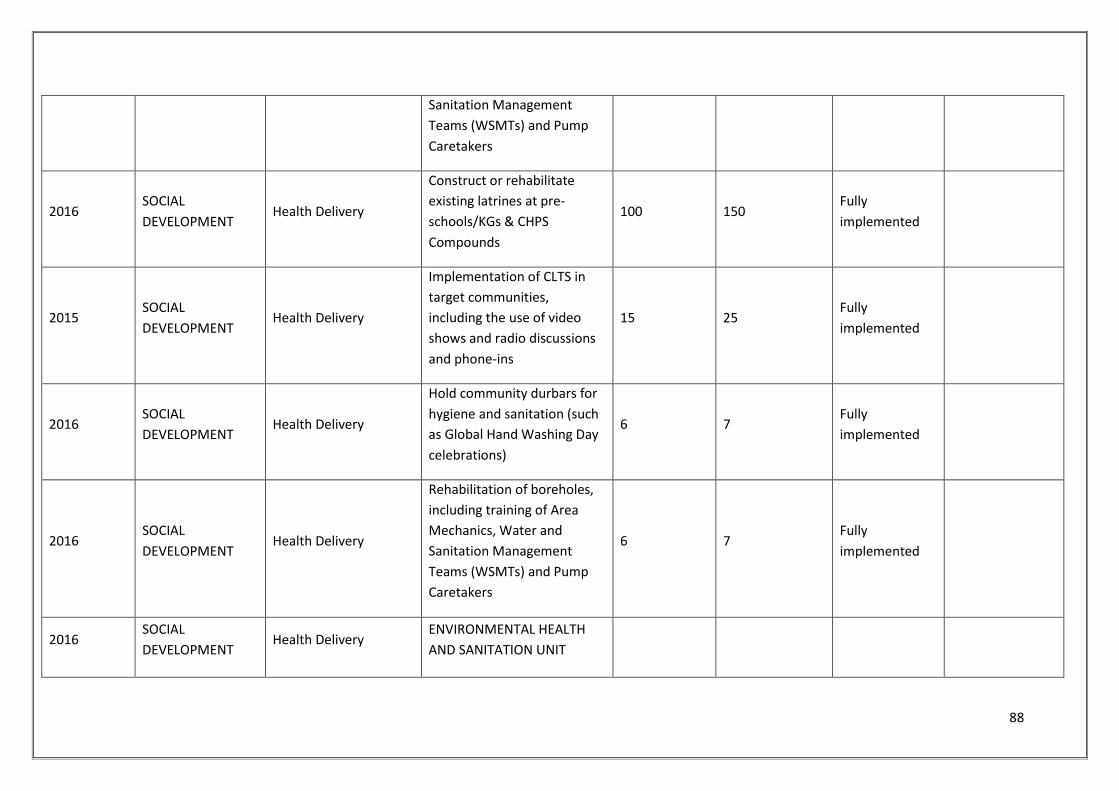
88
Sanitation Management
Teams (WSMTs) and Pump
Caretakers
2016 SOCIAL
DEVELOPMENT Health Delivery
Construct or rehabilitate
existing latrines at pre-
schools/KGs & CHPS
Compounds
100 150 Fully
implemented
2015 SOCIAL
DEVELOPMENT Health Delivery
Implementation of CLTS in
target communities,
including the use of video
shows and radio discussions
and phone-ins
15 25 Fully
implemented
2016 SOCIAL
DEVELOPMENT Health Delivery
Hold community durbars for
hygiene and sanitation (such
as Global Hand Washing Day
celebrations)
6 7 Fully
implemented
2016 SOCIAL
DEVELOPMENT Health Delivery
Rehabilitation of boreholes,
including training of Area
Mechanics, Water and
Sanitation Management
Teams (WSMTs) and Pump
Caretakers
6 7 Fully
implemented
2016 SOCIAL
DEVELOPMENT Health Delivery
ENVIRONMENTAL HEALTH
AND SANITATION UNIT
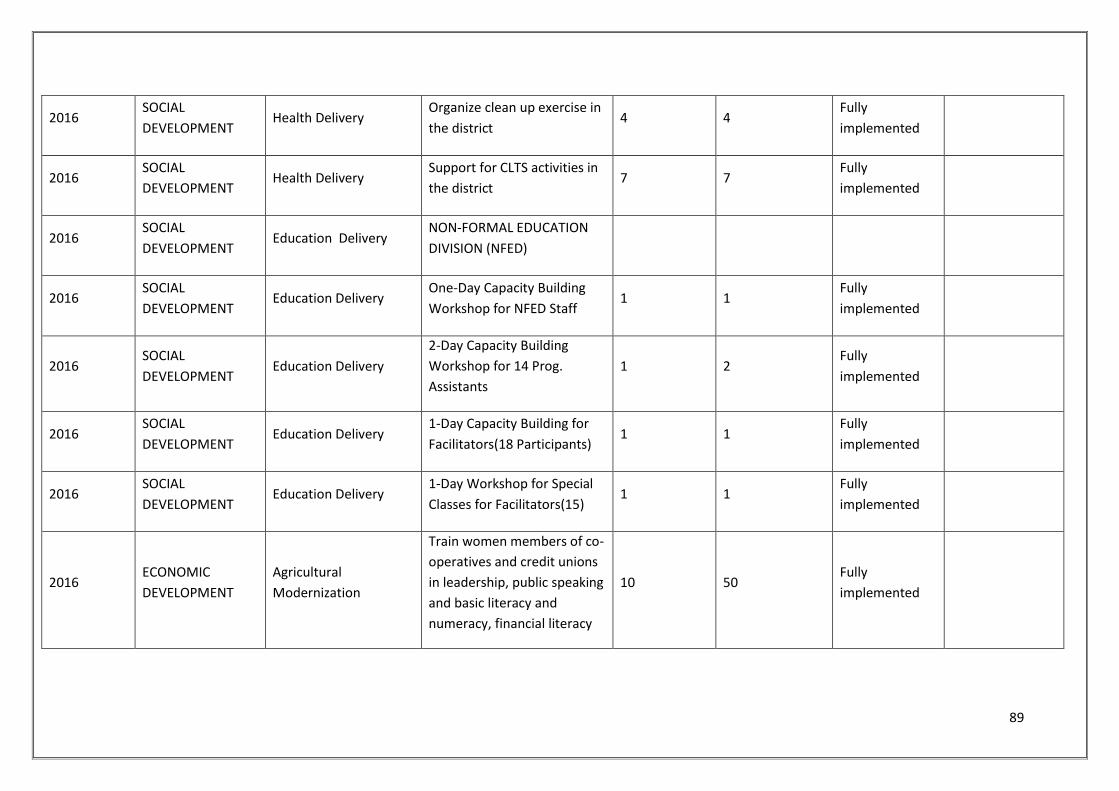
89
2016 SOCIAL
DEVELOPMENT Health Delivery
Organize clean up exercise in
the district 4 4
Fully
implemented
2016 SOCIAL
DEVELOPMENT Health Delivery
Support for CLTS activities in
the district 7 7
Fully
implemented
2016 SOCIAL
DEVELOPMENT Education Delivery
NON-FORMAL EDUCATION
DIVISION (NFED)
2016 SOCIAL
DEVELOPMENT Education Delivery
One-Day Capacity Building
Workshop for NFED Staff 1 1
Fully
implemented
2016 SOCIAL
DEVELOPMENT Education Delivery
2-Day Capacity Building
Workshop for 14 Prog.
Assistants
1 2 Fully
implemented
2016 SOCIAL
DEVELOPMENT Education Delivery
1-Day Capacity Building for
Facilitators(18 Participants) 1 1
Fully
implemented
2016 SOCIAL
DEVELOPMENT Education Delivery
1-Day Workshop for Special
Classes for Facilitators(15) 1 1
Fully
implemented
2016 ECONOMIC
DEVELOPMENT
Agricultural
Modernization
Train women members of co-
operatives and credit unions
in leadership, public speaking
and basic literacy and
numeracy, financial literacy
10 50 Fully
implemented
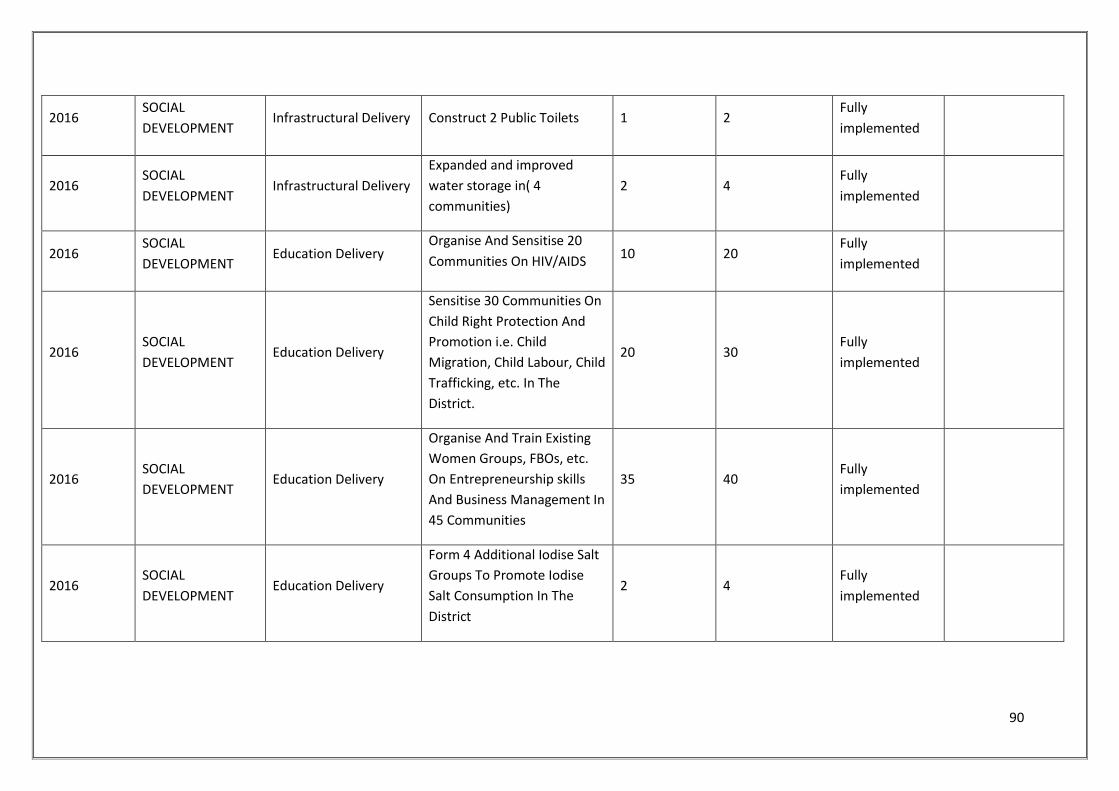
90
2016 SOCIAL
DEVELOPMENT Infrastructural Delivery Construct 2 Public Toilets 1 2
Fully
implemented
2016 SOCIAL
DEVELOPMENT Infrastructural Delivery
Expanded and improved
water storage in( 4
communities)
2 4 Fully
implemented
2016 SOCIAL
DEVELOPMENT Education Delivery
Organise And Sensitise 20
Communities On HIV/AIDS 10 20
Fully
implemented
2016 SOCIAL
DEVELOPMENT Education Delivery
Sensitise 30 Communities On
Child Right Protection And
Promotion i.e. Child
Migration, Child Labour, Child
Trafficking, etc. In The
District.
20 30 Fully
implemented
2016 SOCIAL
DEVELOPMENT Education Delivery
Organise And Train Existing
Women Groups, FBOs, etc.
On Entrepreneurship skills
And Business Management In
45 Communities
35 40 Fully
implemented
2016 SOCIAL
DEVELOPMENT Education Delivery
Form 4 Additional Iodise Salt
Groups To Promote Iodise
Salt Consumption In The
District
2 4 Fully
implemented
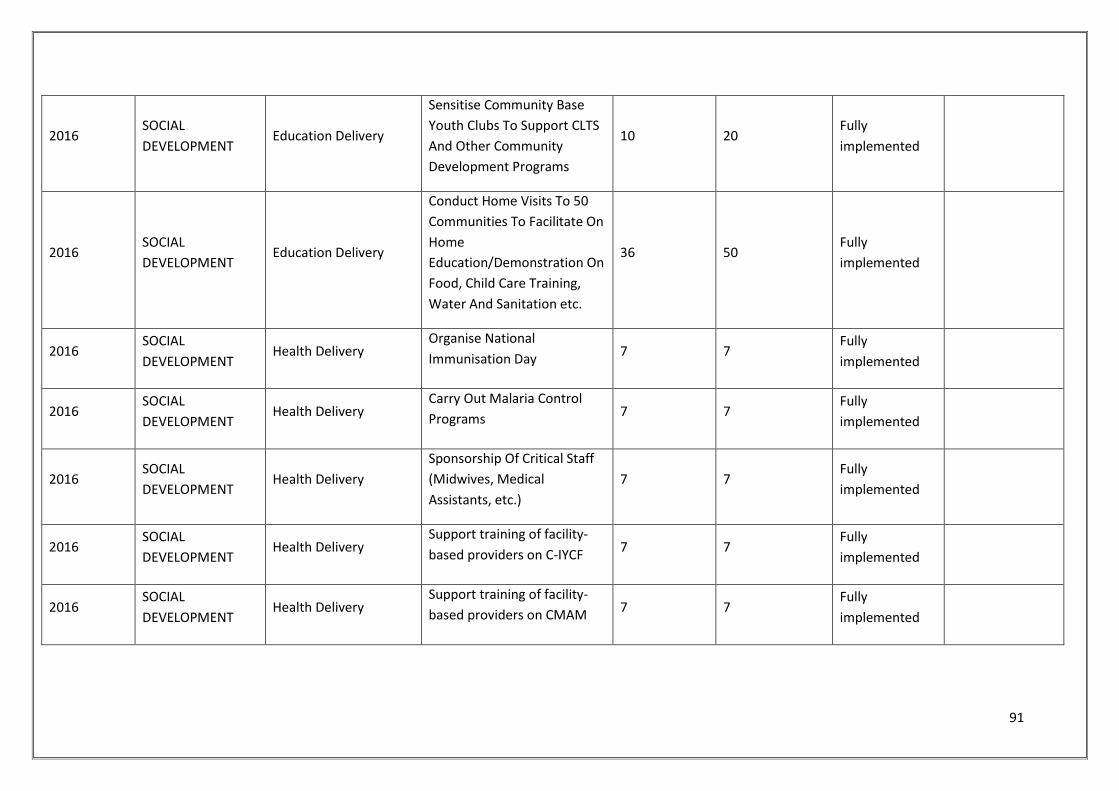
91
2016 SOCIAL
DEVELOPMENT Education Delivery
Sensitise Community Base
Youth Clubs To Support CLTS
And Other Community
Development Programs
10 20 Fully
implemented
2016 SOCIAL
DEVELOPMENT Education Delivery
Conduct Home Visits To 50
Communities To Facilitate On
Home
Education/Demonstration On
Food, Child Care Training,
Water And Sanitation etc.
36 50 Fully
implemented
2016 SOCIAL
DEVELOPMENT Health Delivery
Organise National
Immunisation Day 7 7
Fully
implemented
2016 SOCIAL
DEVELOPMENT Health Delivery
Carry Out Malaria Control
Programs 7 7
Fully
implemented
2016 SOCIAL
DEVELOPMENT Health Delivery
Sponsorship Of Critical Staff
(Midwives, Medical
Assistants, etc.)
7 7 Fully
implemented
2016 SOCIAL
DEVELOPMENT Health Delivery
Support training of facility-
based providers on C-IYCF 7 7
Fully
implemented
2016 SOCIAL
DEVELOPMENT Health Delivery
Support training of facility-
based providers on CMAM 7 7
Fully
implemented
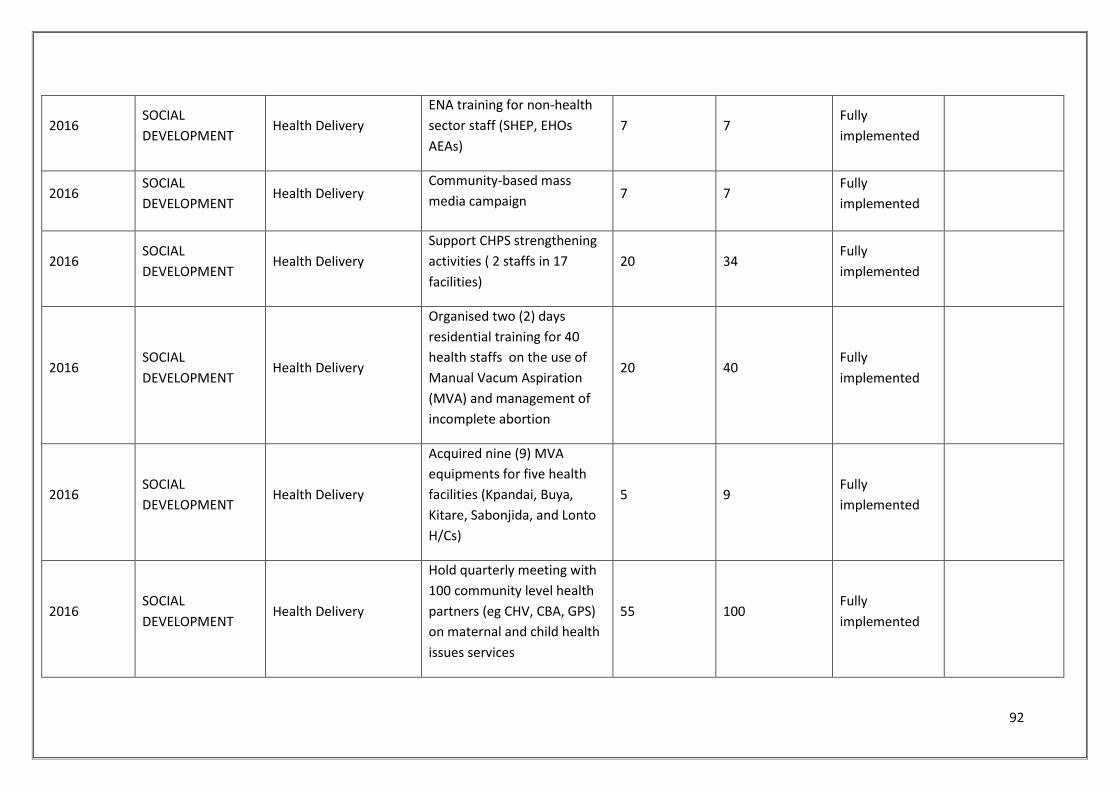
92
2016 SOCIAL
DEVELOPMENT Health Delivery
ENA training for non-health
sector staff (SHEP, EHOs
AEAs)
7 7 Fully
implemented
2016 SOCIAL
DEVELOPMENT Health Delivery
Community-based mass
media campaign 7 7
Fully
implemented
2016 SOCIAL
DEVELOPMENT Health Delivery
Support CHPS strengthening
activities ( 2 staffs in 17
facilities)
20 34 Fully
implemented
2016 SOCIAL
DEVELOPMENT Health Delivery
Organised two (2) days
residential training for 40
health staffs on the use of
Manual Vacum Aspiration
(MVA) and management of
incomplete abortion
20 40 Fully
implemented
2016 SOCIAL
DEVELOPMENT Health Delivery
Acquired nine (9) MVA
equipments for five health
facilities (Kpandai, Buya,
Kitare, Sabonjida, and Lonto
H/Cs)
5 9 Fully
implemented
2016 SOCIAL
DEVELOPMENT Health Delivery
Hold quarterly meeting with
100 community level health
partners (eg CHV, CBA, GPS)
on maternal and child health
issues services
55 100 Fully
implemented
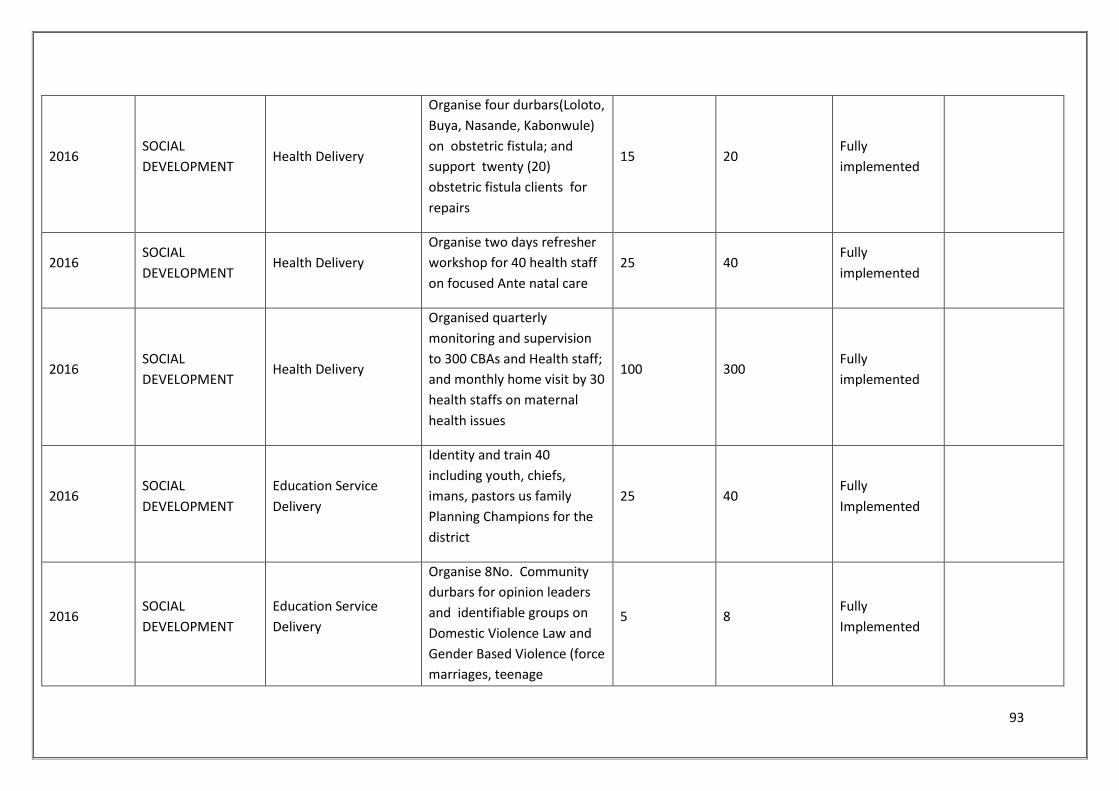
93
2016 SOCIAL
DEVELOPMENT Health Delivery
Organise four durbars(Loloto,
Buya, Nasande, Kabonwule)
on obstetric fistula; and
support twenty (20)
obstetric fistula clients for
repairs
15 20 Fully
implemented
2016 SOCIAL
DEVELOPMENT Health Delivery
Organise two days refresher
workshop for 40 health staff
on focused Ante natal care
25 40 Fully
implemented
2016 SOCIAL
DEVELOPMENT Health Delivery
Organised quarterly
monitoring and supervision
to 300 CBAs and Health staff;
and monthly home visit by 30
health staffs on maternal
health issues
100 300 Fully
implemented
2016 SOCIAL
DEVELOPMENT
Education Service
Delivery
Identity and train 40
including youth, chiefs,
imans, pastors us family
Planning Champions for the
district
25 40 Fully
Implemented
2016 SOCIAL
DEVELOPMENT
Education Service
Delivery
Organise 8No. Community
durbars for opinion leaders
and identifiable groups on
Domestic Violence Law and
Gender Based Violence (force
marriages, teenage
5 8 Fully
Implemented
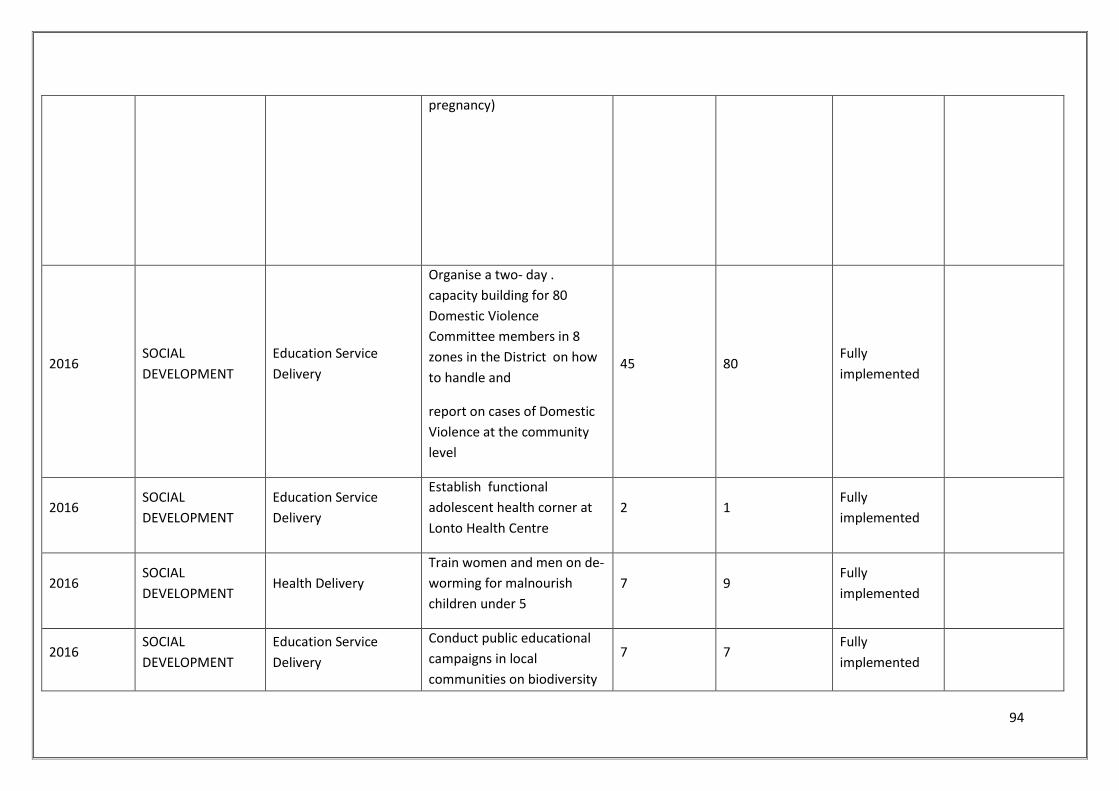
94
pregnancy)
2016 SOCIAL
DEVELOPMENT
Education Service
Delivery
Organise a two- day .
capacity building for 80
Domestic Violence
Committee members in 8
zones in the District on how
to handle and
report on cases of Domestic
Violence at the community
level
45 80 Fully
implemented
2016 SOCIAL
DEVELOPMENT
Education Service
Delivery
Establish functional
adolescent health corner at
Lonto Health Centre
2 1 Fully
implemented
2016 SOCIAL
DEVELOPMENT Health Delivery
Train women and men on de-
worming for malnourish
children under 5
7 9 Fully
implemented
2016 SOCIAL
DEVELOPMENT
Education Service
Delivery
Conduct public educational
campaigns in local
communities on biodiversity
7 7 Fully
implemented
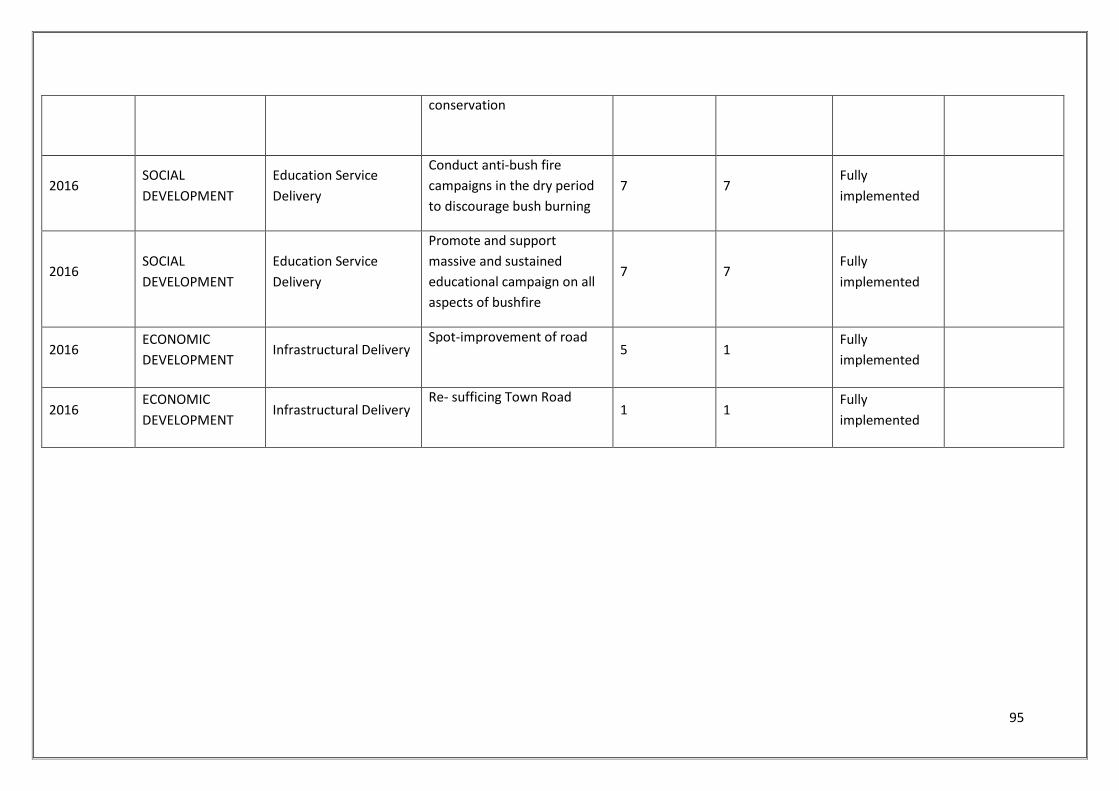
95
conservation
2016 SOCIAL
DEVELOPMENT
Education Service
Delivery
Conduct anti-bush fire
campaigns in the dry period
to discourage bush burning
7 7 Fully
implemented
2016 SOCIAL
DEVELOPMENT
Education Service
Delivery
Promote and support
massive and sustained
educational campaign on all
aspects of bushfire
7 7 Fully
implemented
2016 ECONOMIC
DEVELOPMENT Infrastructural Delivery
Spot-improvement of road 5 1
Fully
implemented
2016 ECONOMIC
DEVELOPMENT Infrastructural Delivery
Re- sufficing Town Road 1 1
Fully
implemented
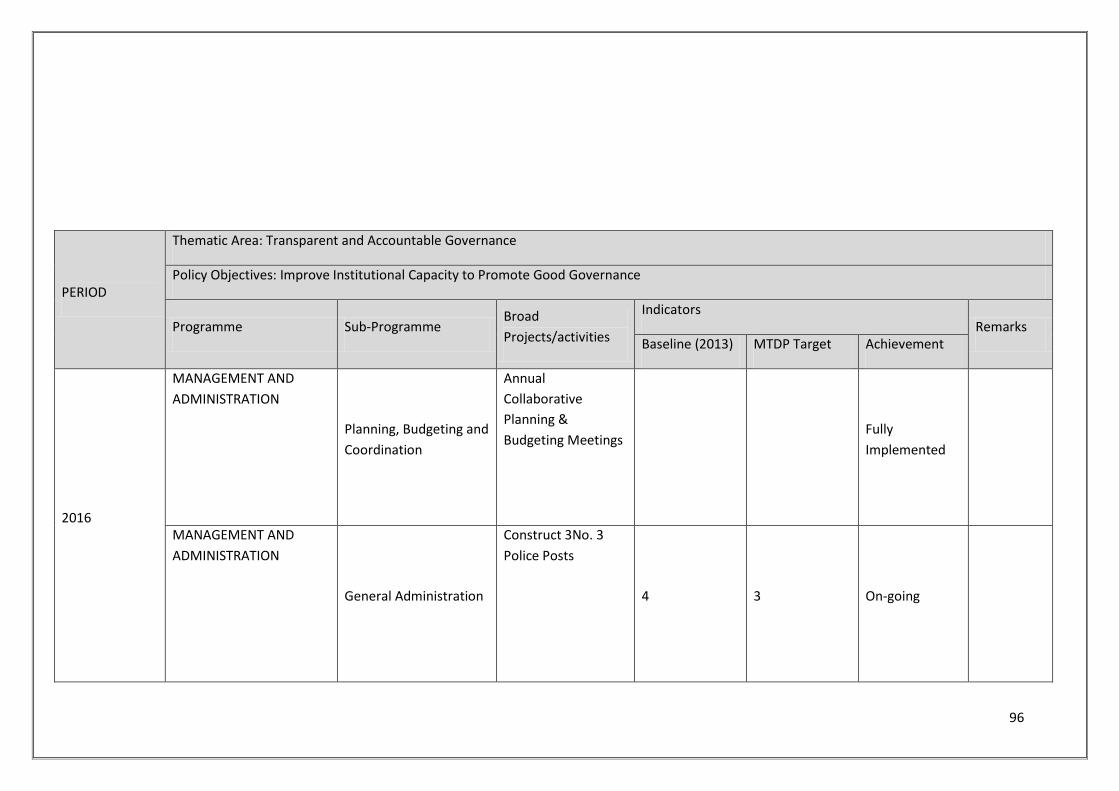
96
PERIOD
Thematic Area: Transparent and Accountable Governance
Policy Objectives: Improve Institutional Capacity to Promote Good Governance
Programme Sub-Programme Broad
Projects/activities
Indicators Remarks
Baseline (2013) MTDP Target Achievement
2016
MANAGEMENT AND
ADMINISTRATION
Planning, Budgeting and
Coordination
Annual
Collaborative
Planning &
Budgeting Meetings
Fully
Implemented
MANAGEMENT AND
ADMINISTRATION
General Administration
Construct 3No. 3
Police Posts
4 3 On-going
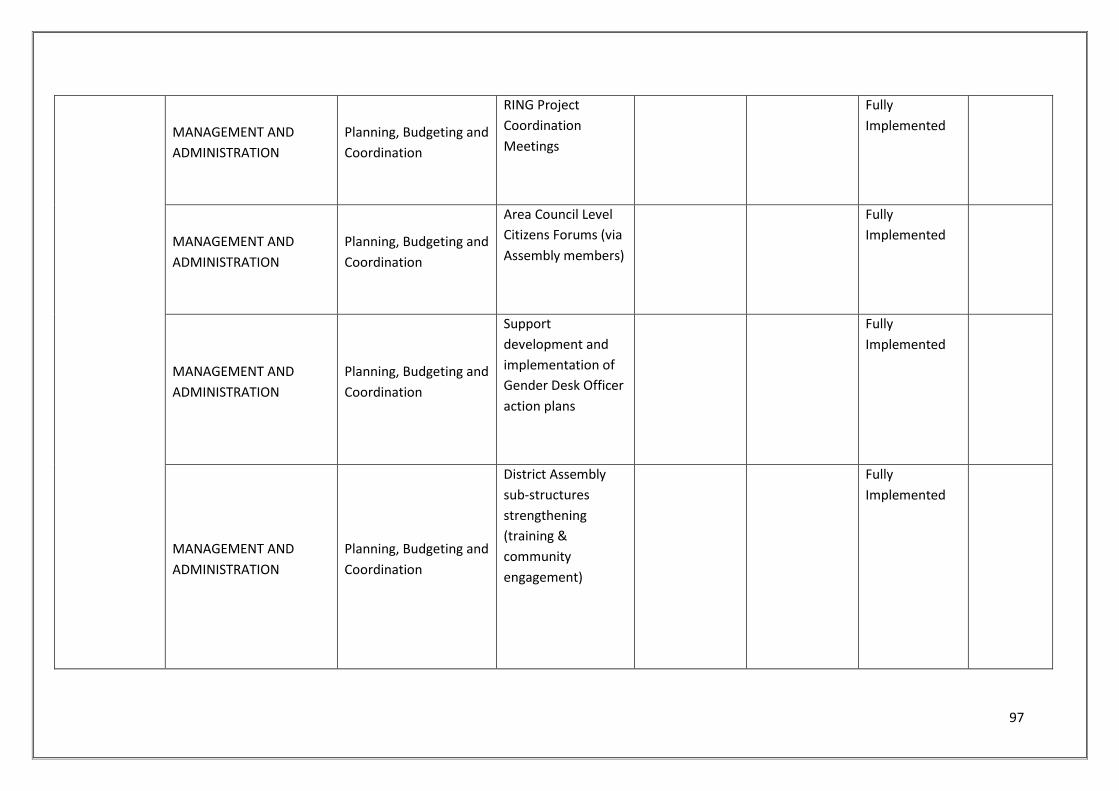
97
MANAGEMENT AND
ADMINISTRATION
Planning, Budgeting and
Coordination
RING Project
Coordination
Meetings
Fully
Implemented
MANAGEMENT AND
ADMINISTRATION
Planning, Budgeting and
Coordination
Area Council Level
Citizens Forums (via
Assembly members)
Fully
Implemented
MANAGEMENT AND
ADMINISTRATION
Planning, Budgeting and
Coordination
Support
development and
implementation of
Gender Desk Officer
action plans
Fully
Implemented
MANAGEMENT AND
ADMINISTRATION
Planning, Budgeting and
Coordination
District Assembly
sub-structures
strengthening
(training &
community
engagement)
Fully
Implemented
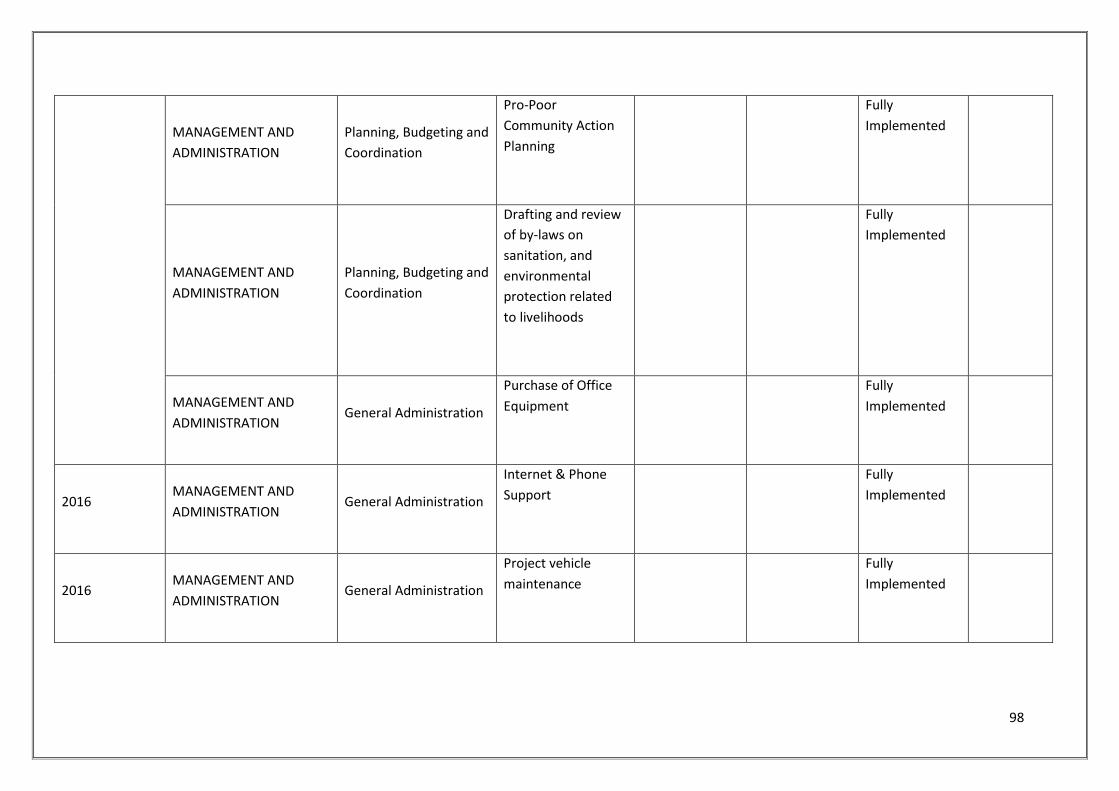
98
MANAGEMENT AND
ADMINISTRATION
Planning, Budgeting and
Coordination
Pro-Poor
Community Action
Planning
Fully
Implemented
MANAGEMENT AND
ADMINISTRATION
Planning, Budgeting and
Coordination
Drafting and review
of by-laws on
sanitation, and
environmental
protection related
to livelihoods
Fully
Implemented
MANAGEMENT AND
ADMINISTRATION General Administration
Purchase of Office
Equipment
Fully
Implemented
2016 MANAGEMENT AND
ADMINISTRATION General Administration
Internet & Phone
Support
Fully
Implemented
2016 MANAGEMENT AND
ADMINISTRATION General Administration
Project vehicle
maintenance
Fully
Implemented
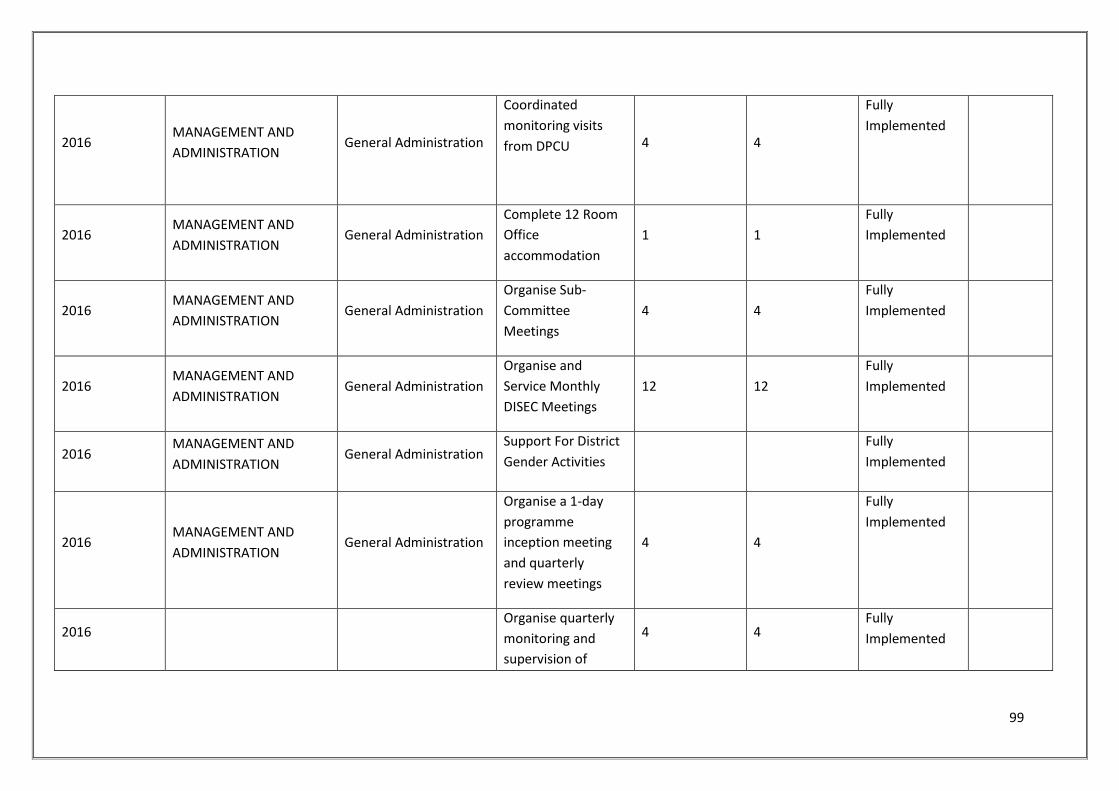
99
2016 MANAGEMENT AND
ADMINISTRATION General Administration
Coordinated
monitoring visits
from DPCU
4 4
Fully
Implemented
2016 MANAGEMENT AND
ADMINISTRATION General Administration
Complete 12 Room
Office
accommodation
1 1
Fully
Implemented
2016 MANAGEMENT AND
ADMINISTRATION General Administration
Organise Sub-
Committee
Meetings
4 4
Fully
Implemented
2016 MANAGEMENT AND
ADMINISTRATION General Administration
Organise and
Service Monthly
DISEC Meetings
12 12
Fully
Implemented
2016 MANAGEMENT AND
ADMINISTRATION General Administration
Support For District
Gender Activities
Fully
Implemented
2016 MANAGEMENT AND
ADMINISTRATION General Administration
Organise a 1-day
programme
inception meeting
and quarterly
review meetings
4 4
Fully
Implemented
2016 Organise quarterly
monitoring and
supervision of
4 4 Fully
Implemented
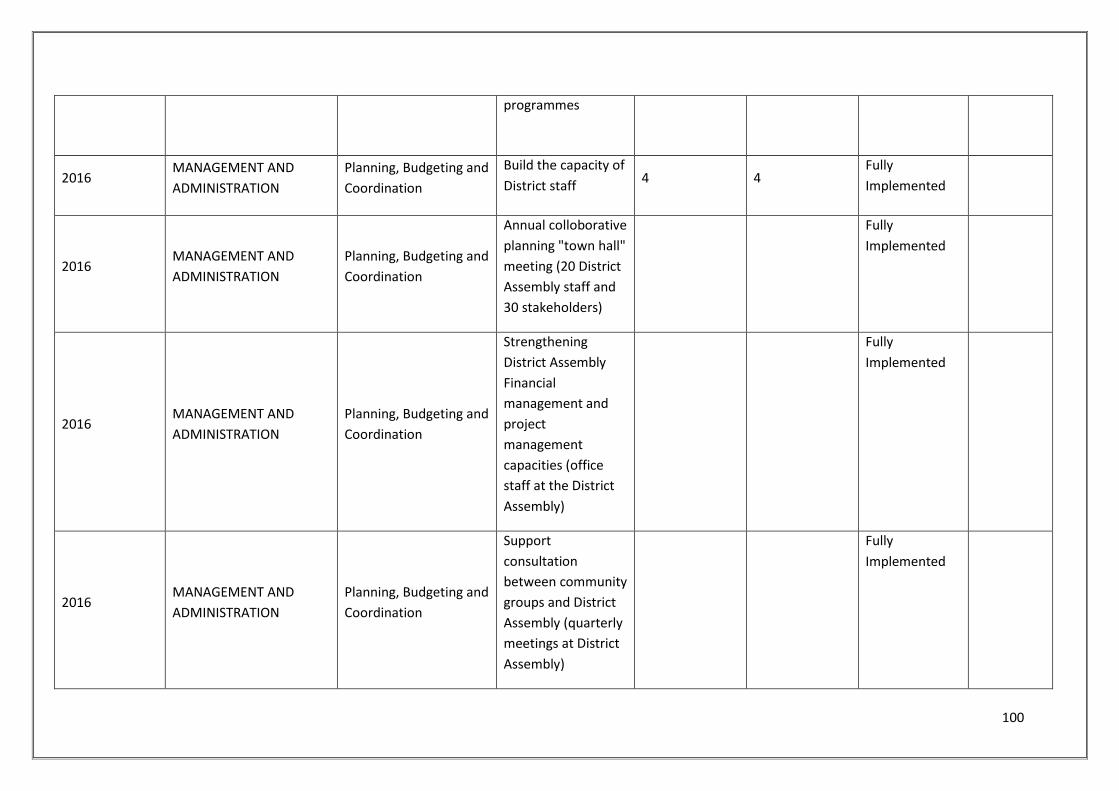
100
programmes
2016 MANAGEMENT AND
ADMINISTRATION
Planning, Budgeting and
Coordination
Build the capacity of
District staff 4 4
Fully
Implemented
2016 MANAGEMENT AND
ADMINISTRATION
Planning, Budgeting and
Coordination
Annual colloborative
planning "town hall"
meeting (20 District
Assembly staff and
30 stakeholders)
Fully
Implemented
2016 MANAGEMENT AND
ADMINISTRATION
Planning, Budgeting and
Coordination
Strengthening
District Assembly
Financial
management and
project
management
capacities (office
staff at the District
Assembly)
Fully
Implemented
2016 MANAGEMENT AND
ADMINISTRATION
Planning, Budgeting and
Coordination
Support
consultation
between community
groups and District
Assembly (quarterly
meetings at District
Assembly)
Fully
Implemented
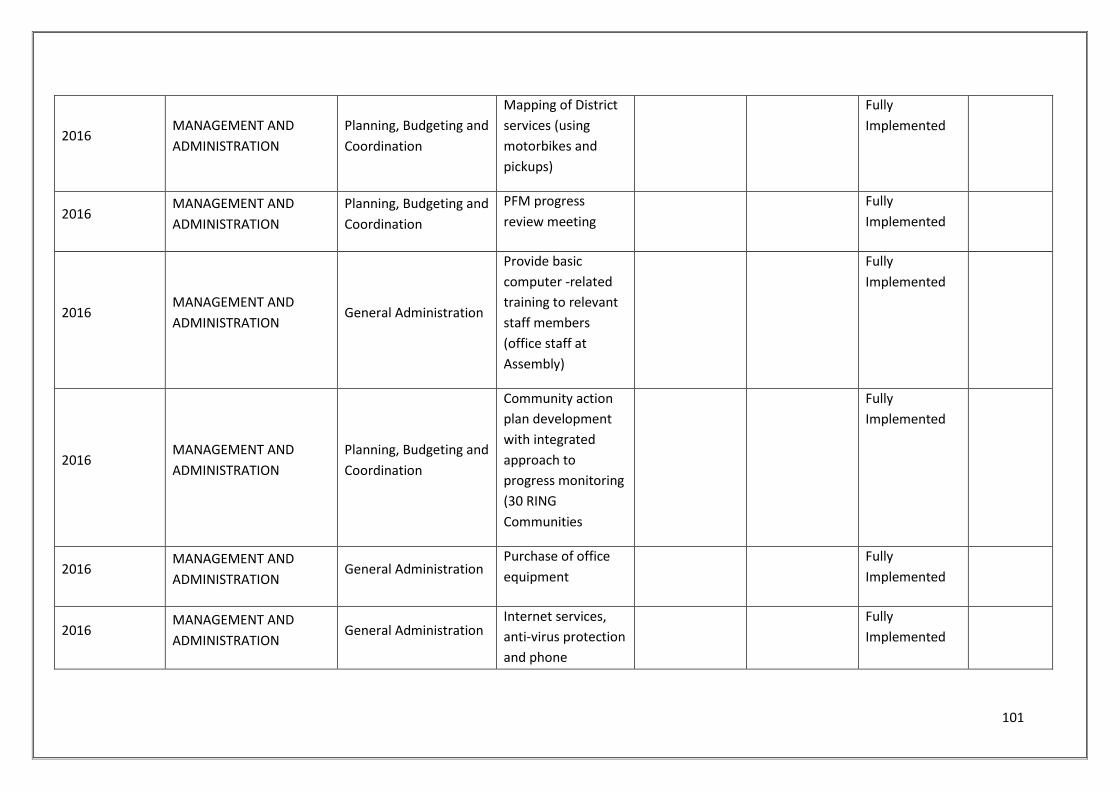
101
2016 MANAGEMENT AND
ADMINISTRATION
Planning, Budgeting and
Coordination
Mapping of District
services (using
motorbikes and
pickups)
Fully
Implemented
2016 MANAGEMENT AND
ADMINISTRATION
Planning, Budgeting and
Coordination
PFM progress
review meeting
Fully
Implemented
2016 MANAGEMENT AND
ADMINISTRATION General Administration
Provide basic
computer -related
training to relevant
staff members
(office staff at
Assembly)
Fully
Implemented
2016 MANAGEMENT AND
ADMINISTRATION
Planning, Budgeting and
Coordination
Community action
plan development
with integrated
approach to
progress monitoring
(30 RING
Communities
Fully
Implemented
2016 MANAGEMENT AND
ADMINISTRATION General Administration
Purchase of office
equipment
Fully
Implemented
2016 MANAGEMENT AND
ADMINISTRATION General Administration
Internet services,
anti-virus protection
and phone
Fully
Implemented
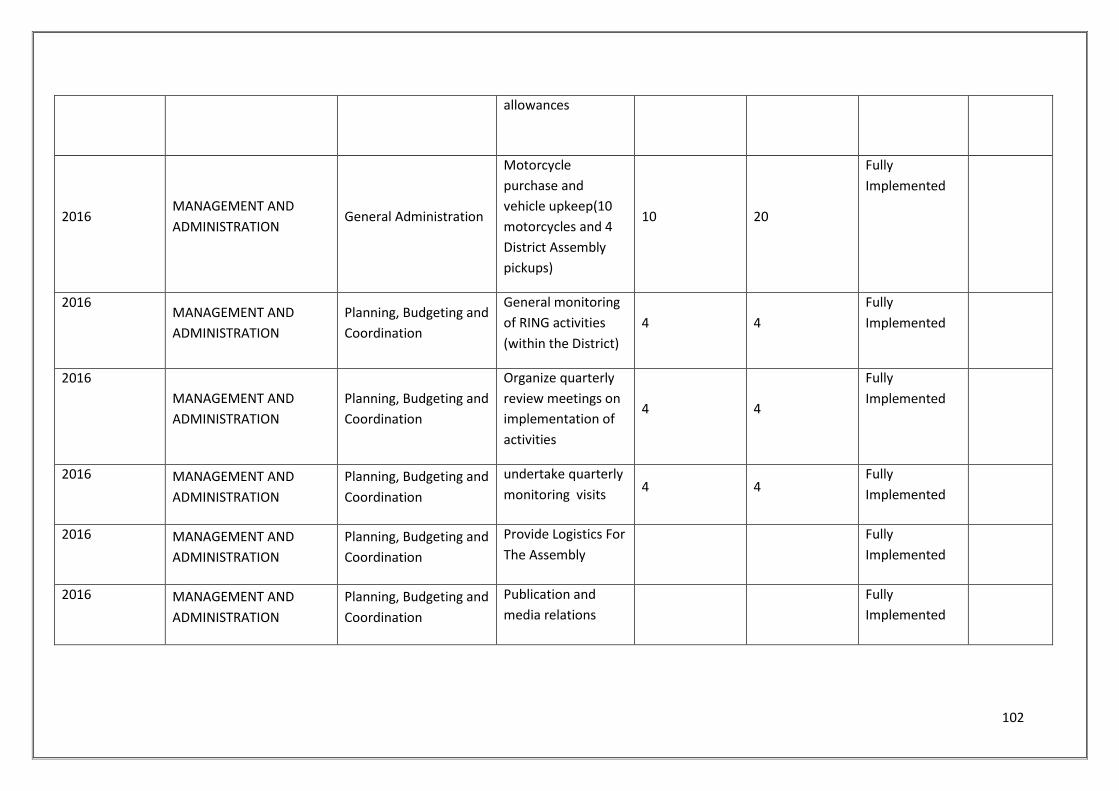
102
allowances
2016 MANAGEMENT AND
ADMINISTRATION General Administration
Motorcycle
purchase and
vehicle upkeep(10
motorcycles and 4
District Assembly
pickups)
10 20
Fully
Implemented
2016 MANAGEMENT AND
ADMINISTRATION
Planning, Budgeting and
Coordination
General monitoring
of RING activities
(within the District)
4 4
Fully
Implemented
2016
MANAGEMENT AND
ADMINISTRATION
Planning, Budgeting and
Coordination
Organize quarterly
review meetings on
implementation of
activities
4 4
Fully
Implemented
2016 MANAGEMENT AND
ADMINISTRATION
Planning, Budgeting and
Coordination
undertake quarterly
monitoring visits 4 4
Fully
Implemented
2016 MANAGEMENT AND
ADMINISTRATION
Planning, Budgeting and
Coordination
Provide Logistics For
The Assembly
Fully
Implemented
2016 MANAGEMENT AND
ADMINISTRATION
Planning, Budgeting and
Coordination
Publication and
media relations
Fully
Implemented
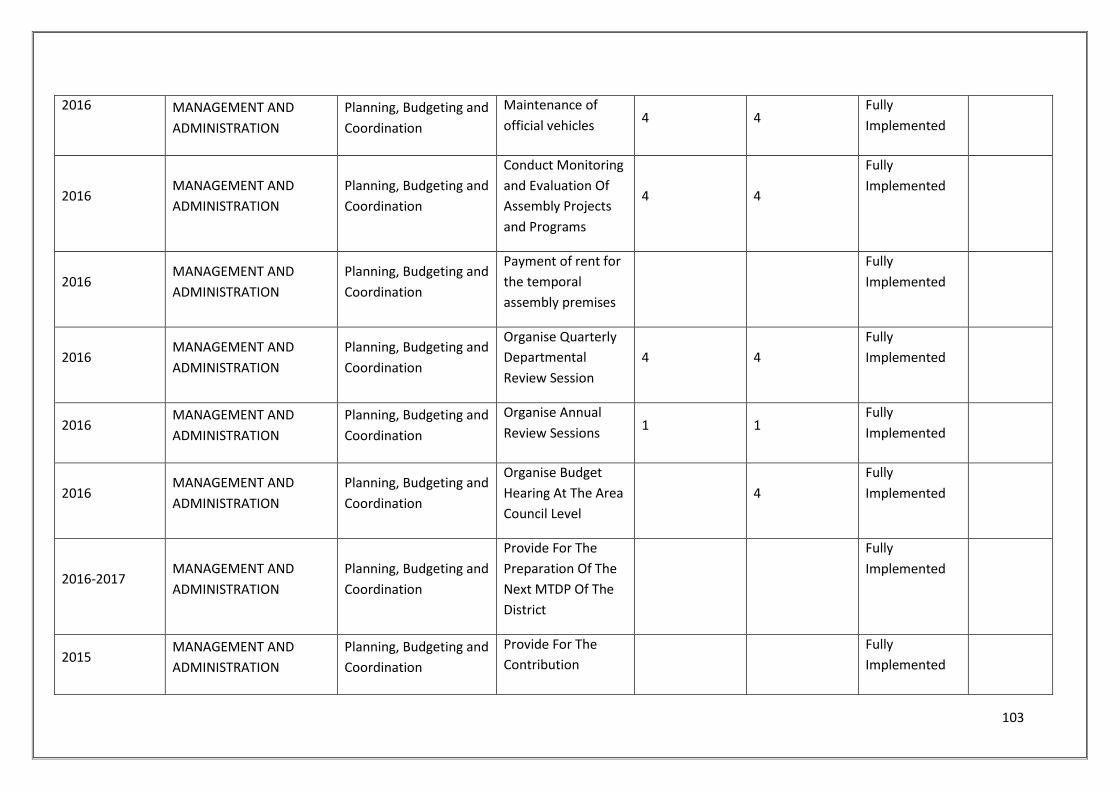
103
2016 MANAGEMENT AND
ADMINISTRATION
Planning, Budgeting and
Coordination
Maintenance of
official vehicles 4 4
Fully
Implemented
2016 MANAGEMENT AND
ADMINISTRATION
Planning, Budgeting and
Coordination
Conduct Monitoring
and Evaluation Of
Assembly Projects
and Programs
4 4
Fully
Implemented
2016 MANAGEMENT AND
ADMINISTRATION
Planning, Budgeting and
Coordination
Payment of rent for
the temporal
assembly premises
Fully
Implemented
2016 MANAGEMENT AND
ADMINISTRATION
Planning, Budgeting and
Coordination
Organise Quarterly
Departmental
Review Session
4 4
Fully
Implemented
2016 MANAGEMENT AND
ADMINISTRATION
Planning, Budgeting and
Coordination
Organise Annual
Review Sessions 1 1
Fully
Implemented
2016 MANAGEMENT AND
ADMINISTRATION
Planning, Budgeting and
Coordination
Organise Budget
Hearing At The Area
Council Level
4
Fully
Implemented
2016-2017 MANAGEMENT AND
ADMINISTRATION
Planning, Budgeting and
Coordination
Provide For The
Preparation Of The
Next MTDP Of The
District
Fully
Implemented
2015 MANAGEMENT AND
ADMINISTRATION
Planning, Budgeting and
Coordination
Provide For The
Contribution
Fully
Implemented
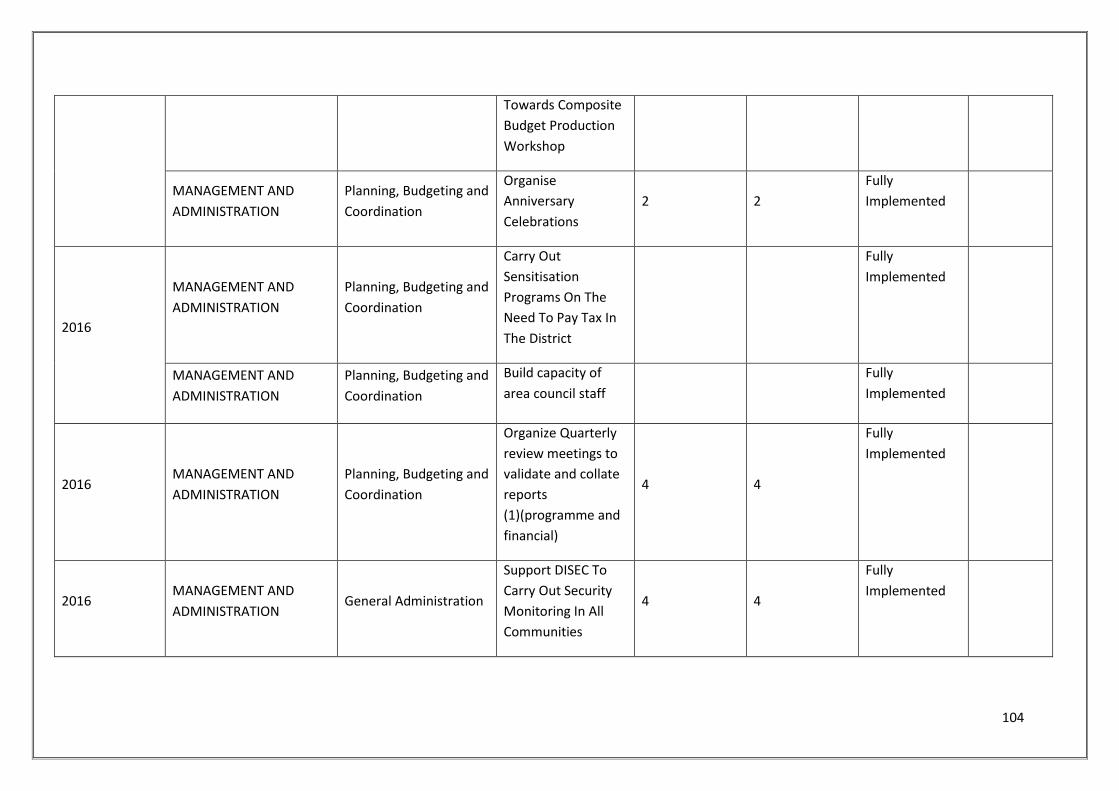
104
Towards Composite
Budget Production
Workshop
MANAGEMENT AND
ADMINISTRATION
Planning, Budgeting and
Coordination
Organise
Anniversary
Celebrations
2 2
Fully
Implemented
2016
MANAGEMENT AND
ADMINISTRATION
Planning, Budgeting and
Coordination
Carry Out
Sensitisation
Programs On The
Need To Pay Tax In
The District
Fully
Implemented
MANAGEMENT AND
ADMINISTRATION
Planning, Budgeting and
Coordination
Build capacity of
area council staff
Fully
Implemented
2016 MANAGEMENT AND
ADMINISTRATION
Planning, Budgeting and
Coordination
Organize Quarterly
review meetings to
validate and collate
reports
(1)(programme and
financial)
4 4
Fully
Implemented
2016 MANAGEMENT AND
ADMINISTRATION General Administration
Support DISEC To
Carry Out Security
Monitoring In All
Communities
4 4
Fully
Implemented
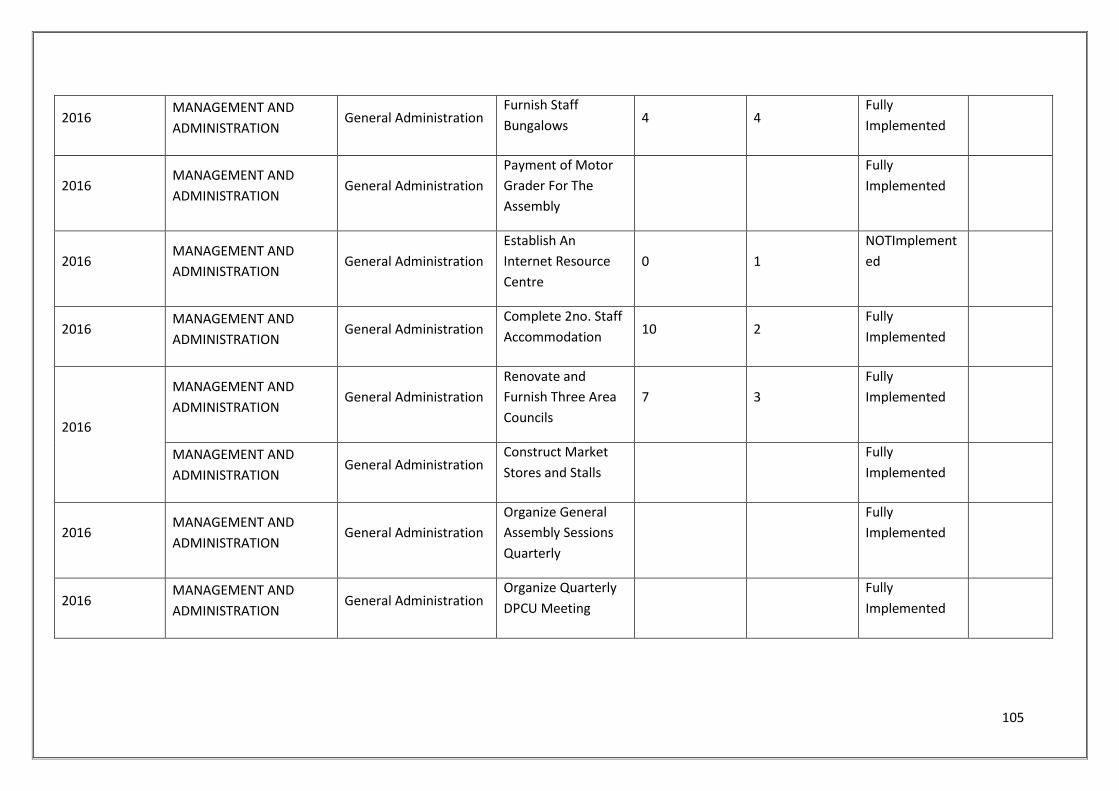
105
2016 MANAGEMENT AND
ADMINISTRATION General Administration
Furnish Staff
Bungalows 4 4
Fully
Implemented
2016 MANAGEMENT AND
ADMINISTRATION General Administration
Payment of Motor
Grader For The
Assembly
Fully
Implemented
2016 MANAGEMENT AND
ADMINISTRATION General Administration
Establish An
Internet Resource
Centre
0 1
NOTImplement
ed
2016 MANAGEMENT AND
ADMINISTRATION General Administration
Complete 2no. Staff
Accommodation 10 2
Fully
Implemented
2016
MANAGEMENT AND
ADMINISTRATION General Administration
Renovate and
Furnish Three Area
Councils
7 3
Fully
Implemented
MANAGEMENT AND
ADMINISTRATION General Administration
Construct Market
Stores and Stalls
Fully
Implemented
2016 MANAGEMENT AND
ADMINISTRATION General Administration
Organize General
Assembly Sessions
Quarterly
Fully
Implemented
2016 MANAGEMENT AND
ADMINISTRATION General Administration
Organize Quarterly
DPCU Meeting
Fully
Implemented
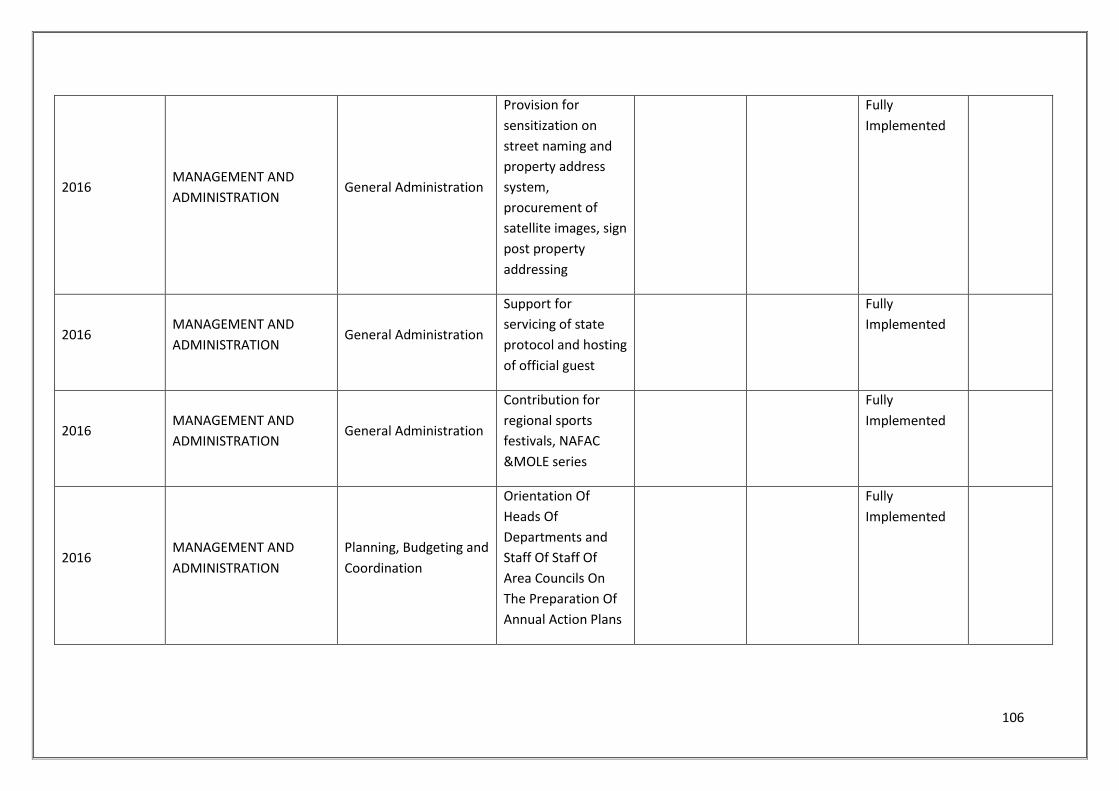
106
2016 MANAGEMENT AND
ADMINISTRATION General Administration
Provision for
sensitization on
street naming and
property address
system,
procurement of
satellite images, sign
post property
addressing
Fully
Implemented
2016 MANAGEMENT AND
ADMINISTRATION General Administration
Support for
servicing of state
protocol and hosting
of official guest
Fully
Implemented
2016 MANAGEMENT AND
ADMINISTRATION General Administration
Contribution for
regional sports
festivals, NAFAC
&MOLE series
Fully
Implemented
2016 MANAGEMENT AND
ADMINISTRATION
Planning, Budgeting and
Coordination
Orientation Of
Heads Of
Departments and
Staff Of Staff Of
Area Councils On
The Preparation Of
Annual Action Plans
Fully
Implemented
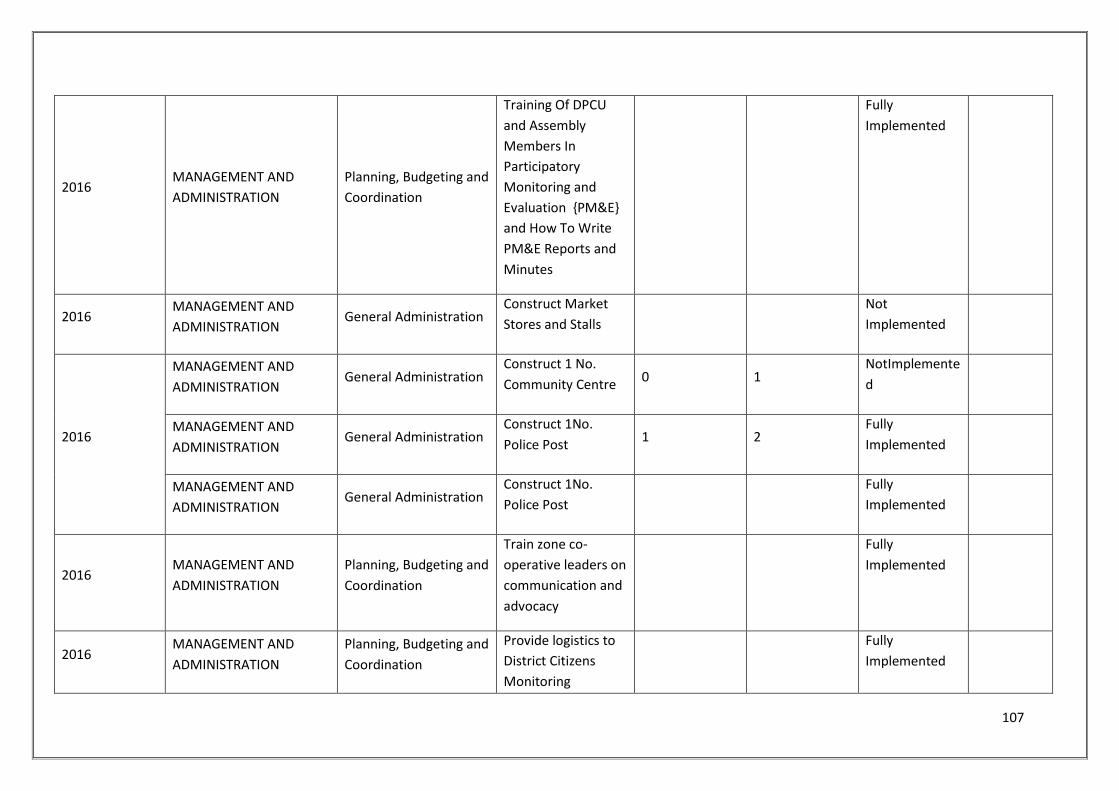
107
2016 MANAGEMENT AND
ADMINISTRATION
Planning, Budgeting and
Coordination
Training Of DPCU
and Assembly
Members In
Participatory
Monitoring and
Evaluation {PM&E}
and How To Write
PM&E Reports and
Minutes
Fully
Implemented
2016 MANAGEMENT AND
ADMINISTRATION General Administration
Construct Market
Stores and Stalls
Not
Implemented
2016
MANAGEMENT AND
ADMINISTRATION General Administration
Construct 1 No.
Community Centre 0 1
NotImplemente
d
MANAGEMENT AND
ADMINISTRATION General Administration
Construct 1No.
Police Post 1 2
Fully
Implemented
MANAGEMENT AND
ADMINISTRATION General Administration
Construct 1No.
Police Post
Fully
Implemented
2016 MANAGEMENT AND
ADMINISTRATION
Planning, Budgeting and
Coordination
Train zone co-
operative leaders on
communication and
advocacy
Fully
Implemented
2016 MANAGEMENT AND
ADMINISTRATION
Planning, Budgeting and
Coordination
Provide logistics to
District Citizens
Monitoring
Fully
Implemented
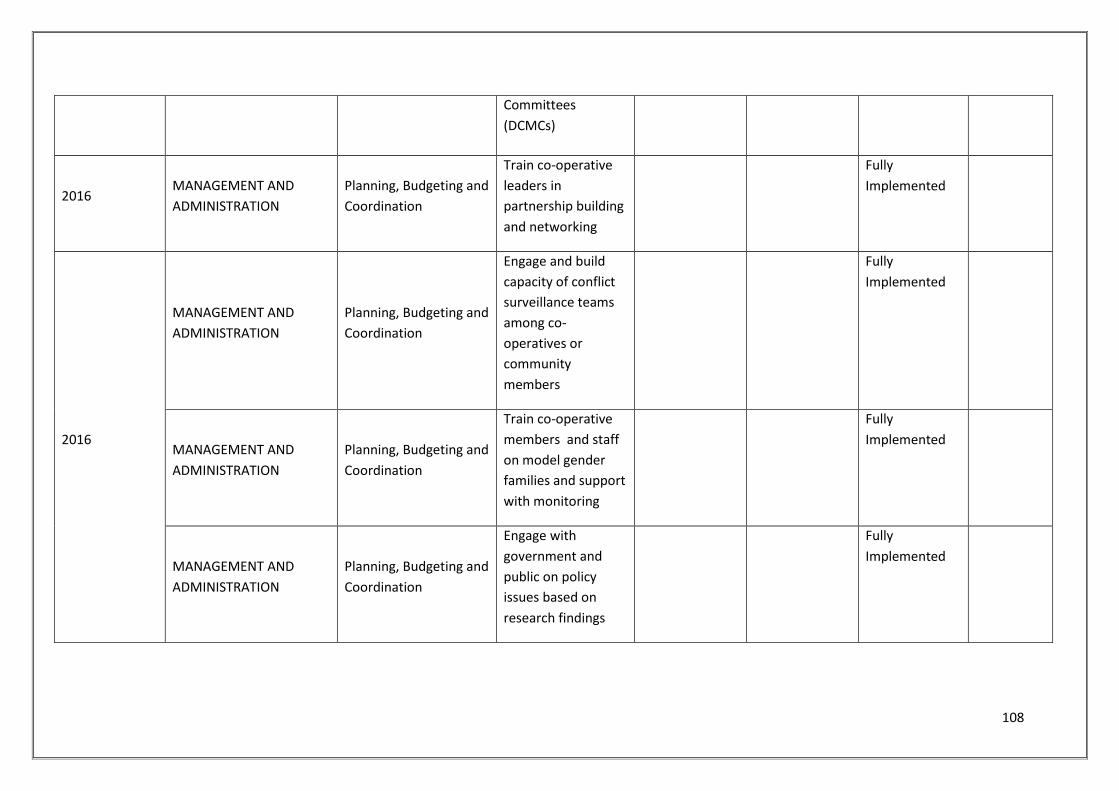
108
Committees
(DCMCs)
2016 MANAGEMENT AND
ADMINISTRATION
Planning, Budgeting and
Coordination
Train co-operative
leaders in
partnership building
and networking
Fully
Implemented
2016
MANAGEMENT AND
ADMINISTRATION
Planning, Budgeting and
Coordination
Engage and build
capacity of conflict
surveillance teams
among co-
operatives or
community
members
Fully
Implemented
MANAGEMENT AND
ADMINISTRATION
Planning, Budgeting and
Coordination
Train co-operative
members and staff
on model gender
families and support
with monitoring
Fully
Implemented
MANAGEMENT AND
ADMINISTRATION
Planning, Budgeting and
Coordination
Engage with
government and
public on policy
issues based on
research findings
Fully
Implemented
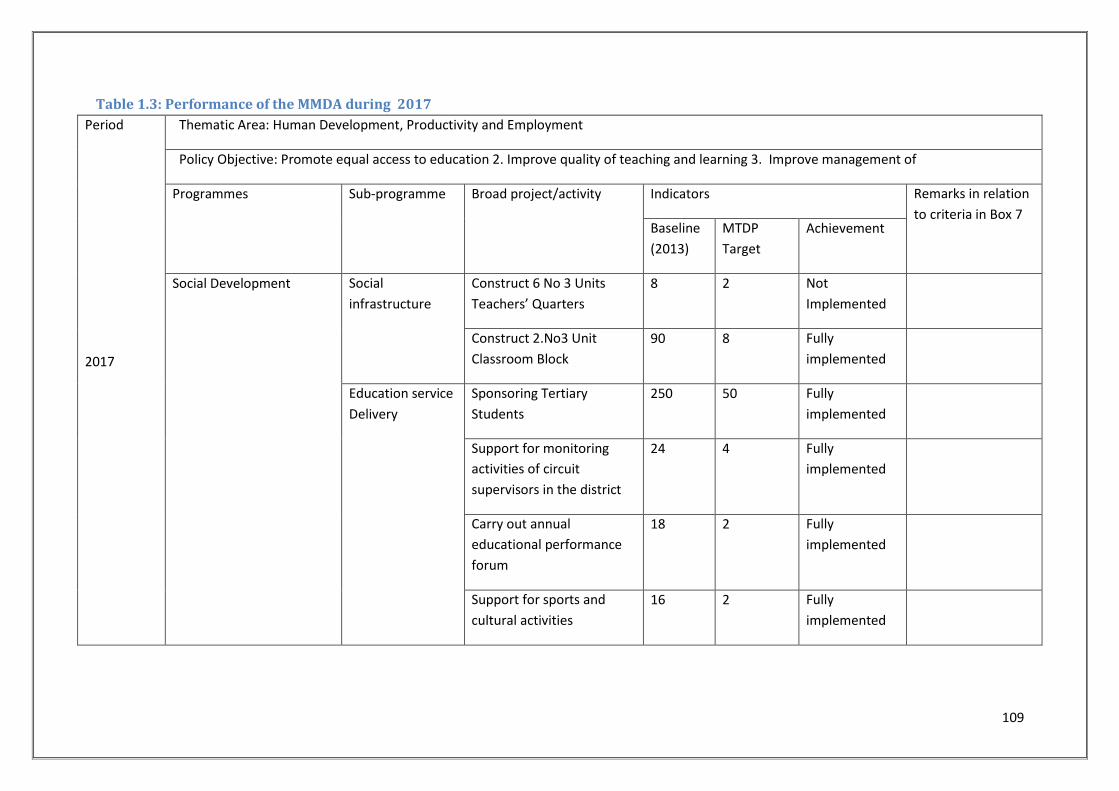
109
Table 1.3: Performance of the MMDA during 2017
Period
2017
Thematic Area: Human Development, Productivity and Employment
Policy Objective: Promote equal access to education 2. Improve quality of teaching and learning 3. Improve management of
Programmes Sub-programme Broad project/activity Indicators Remarks in relation
to criteria in Box 7 Baseline
(2013)
MTDP
Target
Achievement
Social Development Social
infrastructure
Construct 6 No 3 Units
Teachers’ Quarters
8 2 Not
Implemented
Construct 2.No3 Unit
Classroom Block
90 8 Fully
implemented
Education service
Delivery
Sponsoring Tertiary
Students
250 50 Fully
implemented
Support for monitoring
activities of circuit
supervisors in the district
24 4 Fully
implemented
Carry out annual
educational performance
forum
18 2 Fully
implemented
Support for sports and
cultural activities
16 2 Fully
implemented
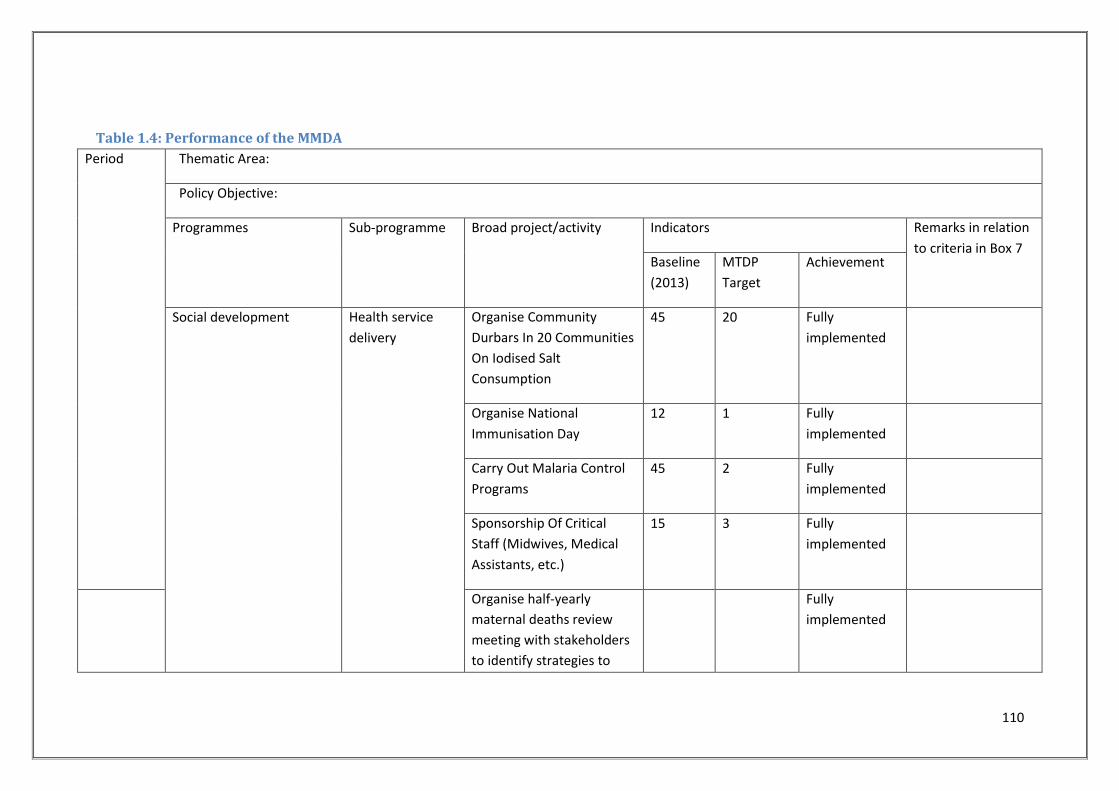
110
Table 1.4: Performance of the MMDA
Period
Thematic Area:
Policy Objective:
Programmes Sub-programme Broad project/activity Indicators Remarks in relation
to criteria in Box 7 Baseline
(2013)
MTDP
Target
Achievement
Social development Health service
delivery
Organise Community
Durbars In 20 Communities
On Iodised Salt
Consumption
45 20 Fully
implemented
Organise National
Immunisation Day
12 1 Fully
implemented
Carry Out Malaria Control
Programs
45 2 Fully
implemented
Sponsorship Of Critical
Staff (Midwives, Medical
Assistants, etc.)
15 3 Fully
implemented
Organise half-yearly
maternal deaths review
meeting with stakeholders
to identify strategies to
Fully
implemented
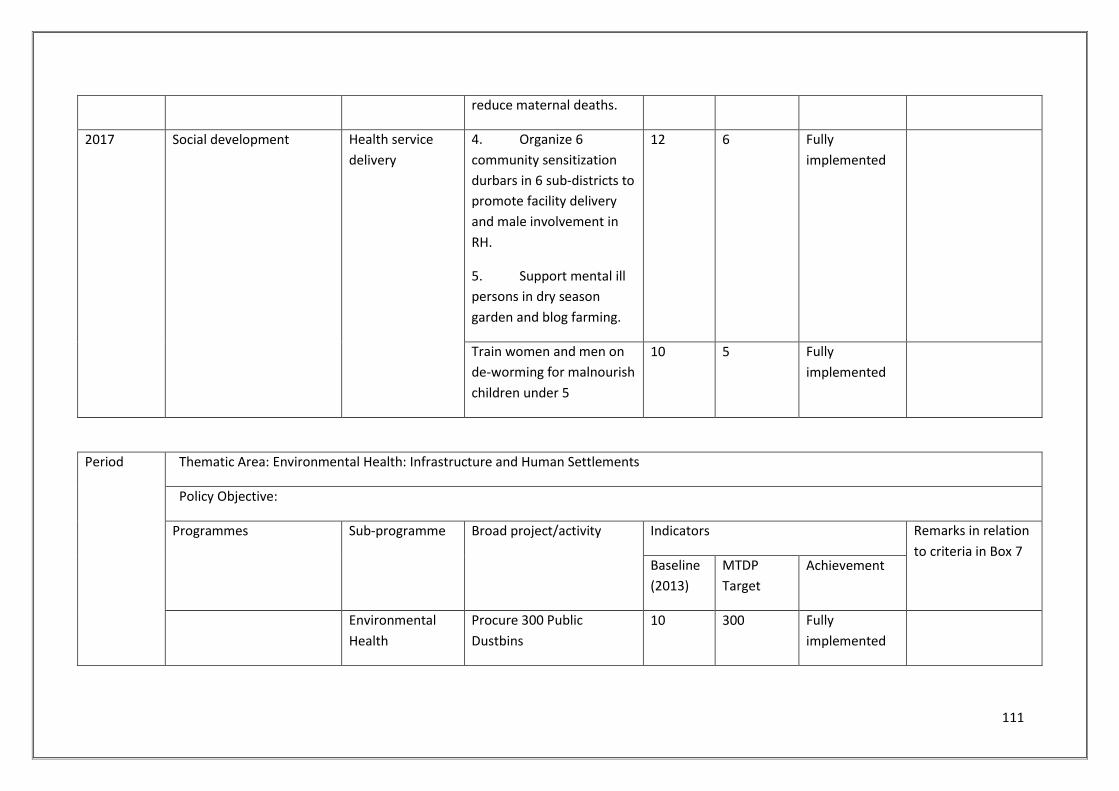
111
reduce maternal deaths.
2017 Social development Health service
delivery
4. Organize 6
community sensitization
durbars in 6 sub-districts to
promote facility delivery
and male involvement in
RH.
5. Support mental ill
persons in dry season
garden and blog farming.
12 6 Fully
implemented
Train women and men on
de-worming for malnourish
children under 5
10 5 Fully
implemented
Period
Thematic Area: Environmental Health: Infrastructure and Human Settlements
Policy Objective:
Programmes Sub-programme Broad project/activity Indicators Remarks in relation
to criteria in Box 7 Baseline
(2013)
MTDP
Target
Achievement
Environmental
Health
Procure 300 Public
Dustbins
10 300 Fully
implemented
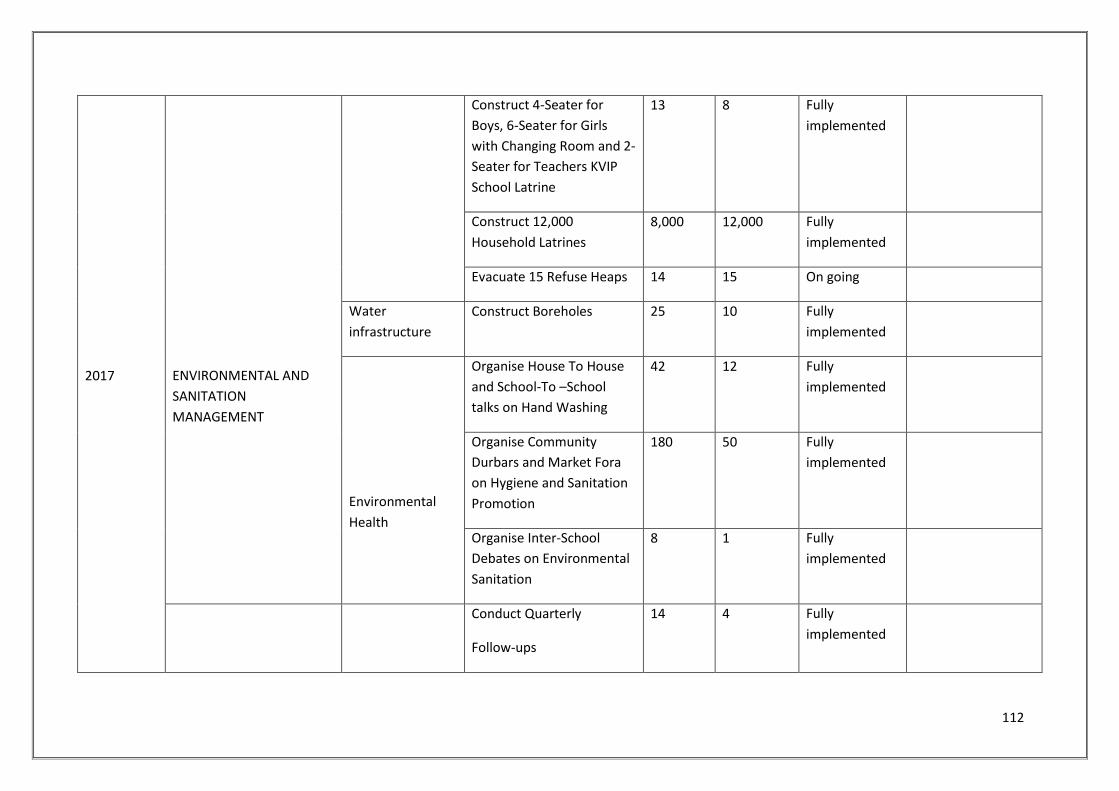
112
2017
ENVIRONMENTAL AND
SANITATION
MANAGEMENT
Construct 4-Seater for
Boys, 6-Seater for Girls
with Changing Room and 2-
Seater for Teachers KVIP
School Latrine
13 8 Fully
implemented
Construct 12,000
Household Latrines
8,000 12,000 Fully
implemented
Evacuate 15 Refuse Heaps 14 15 On going
Water
infrastructure
Construct Boreholes 25 10 Fully
implemented
Environmental
Health
Organise House To House
and School-To –School
talks on Hand Washing
42 12 Fully
implemented
Organise Community
Durbars and Market Fora
on Hygiene and Sanitation
Promotion
180 50 Fully
implemented
Organise Inter-School
Debates on Environmental
Sanitation
8 1 Fully
implemented
Conduct Quarterly
Follow-ups
14 4 Fully
implemented
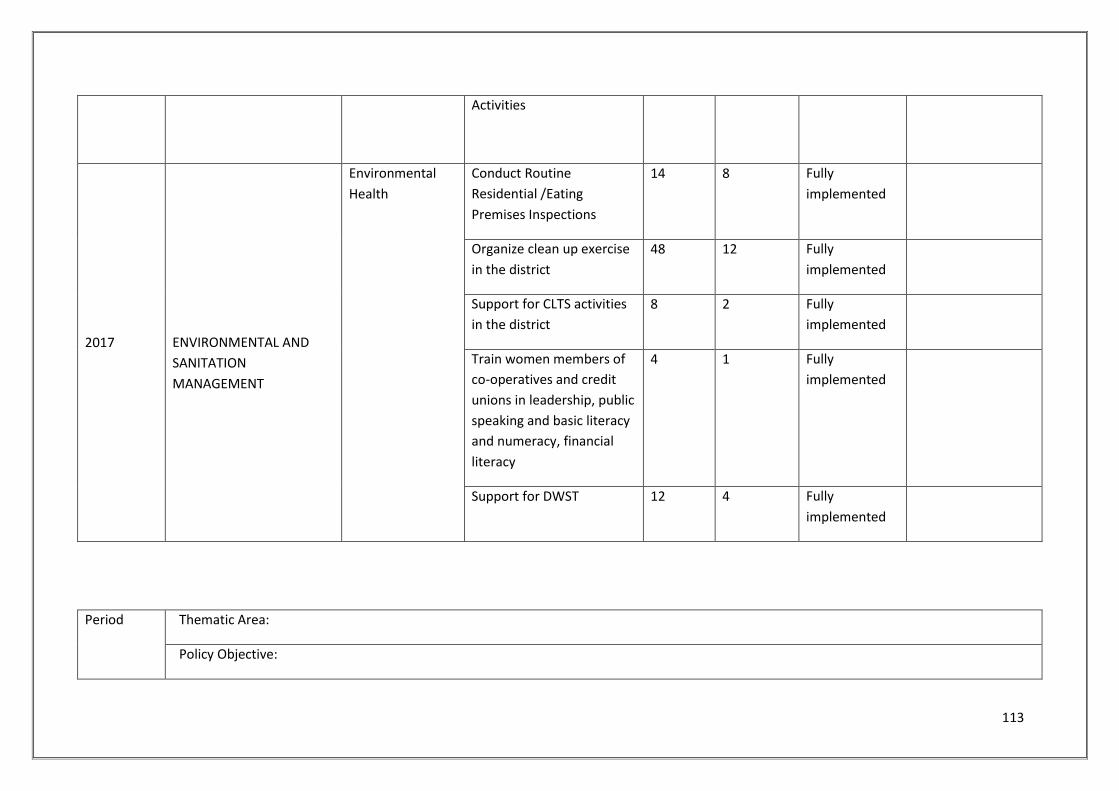
113
Activities
2017
ENVIRONMENTAL AND
SANITATION
MANAGEMENT
Environmental
Health
Conduct Routine
Residential /Eating
Premises Inspections
14 8 Fully
implemented
Organize clean up exercise
in the district
48 12 Fully
implemented
Support for CLTS activities
in the district
8 2 Fully
implemented
Train women members of
co-operatives and credit
unions in leadership, public
speaking and basic literacy
and numeracy, financial
literacy
4 1 Fully
implemented
Support for DWST 12 4 Fully
implemented
Period
Thematic Area:
Policy Objective:
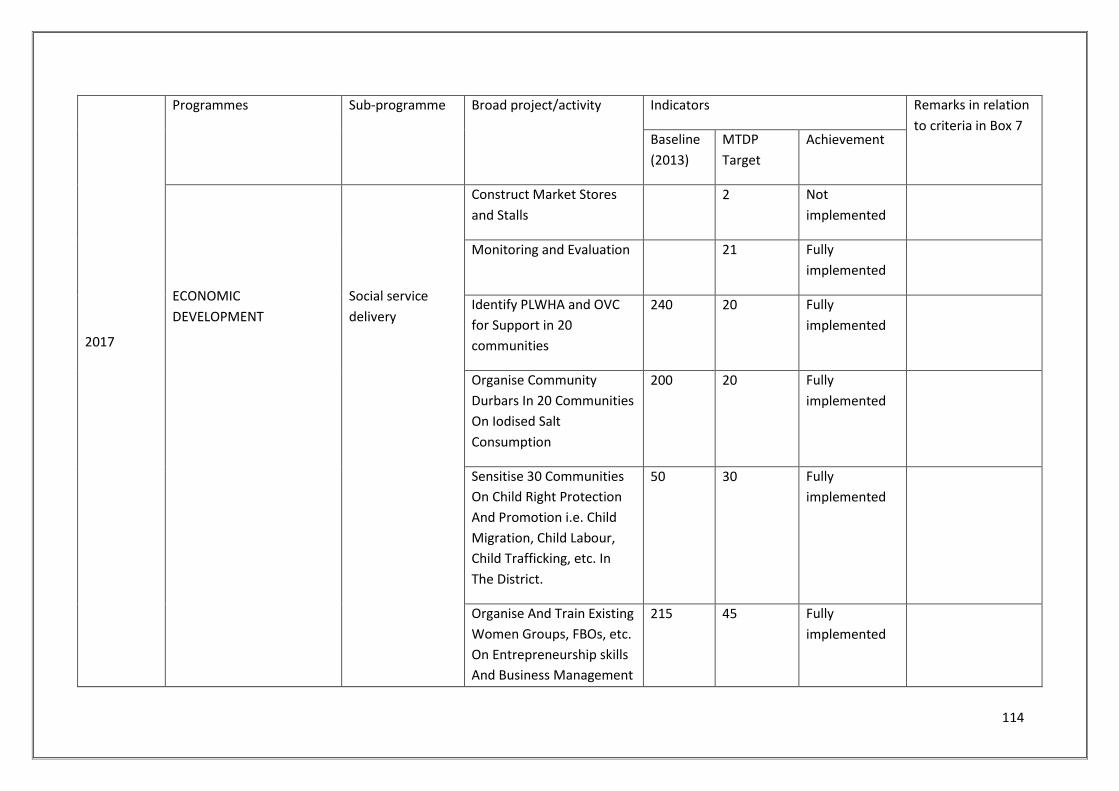
114
2017
Programmes Sub-programme Broad project/activity Indicators Remarks in relation
to criteria in Box 7 Baseline
(2013)
MTDP
Target
Achievement
ECONOMIC
DEVELOPMENT
Social service
delivery
Construct Market Stores
and Stalls
2 Not
implemented
Monitoring and Evaluation 21 Fully
implemented
Identify PLWHA and OVC
for Support in 20
communities
240 20 Fully
implemented
Organise Community
Durbars In 20 Communities
On Iodised Salt
Consumption
200 20 Fully
implemented
Sensitise 30 Communities
On Child Right Protection
And Promotion i.e. Child
Migration, Child Labour,
Child Trafficking, etc. In
The District.
50 30 Fully
implemented
Organise And Train Existing
Women Groups, FBOs, etc.
On Entrepreneurship skills
And Business Management
215 45 Fully
implemented
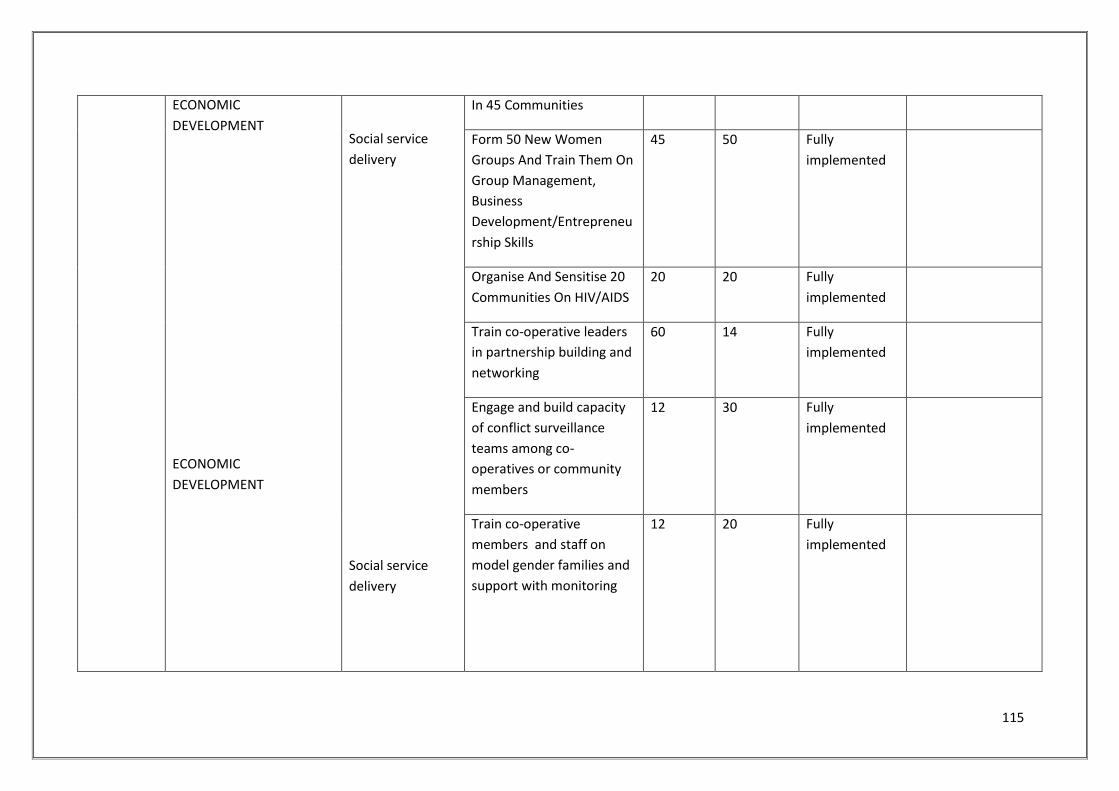
115
ECONOMIC
DEVELOPMENT
ECONOMIC
DEVELOPMENT
Social service
delivery
Social service
delivery
In 45 Communities
Form 50 New Women
Groups And Train Them On
Group Management,
Business
Development/Entrepreneu
rship Skills
45 50 Fully
implemented
Organise And Sensitise 20
Communities On HIV/AIDS
20 20 Fully
implemented
Train co-operative leaders
in partnership building and
networking
60 14 Fully
implemented
Engage and build capacity
of conflict surveillance
teams among co-
operatives or community
members
12 30 Fully
implemented
Train co-operative
members and staff on
model gender families and
support with monitoring
12 20 Fully
implemented

116
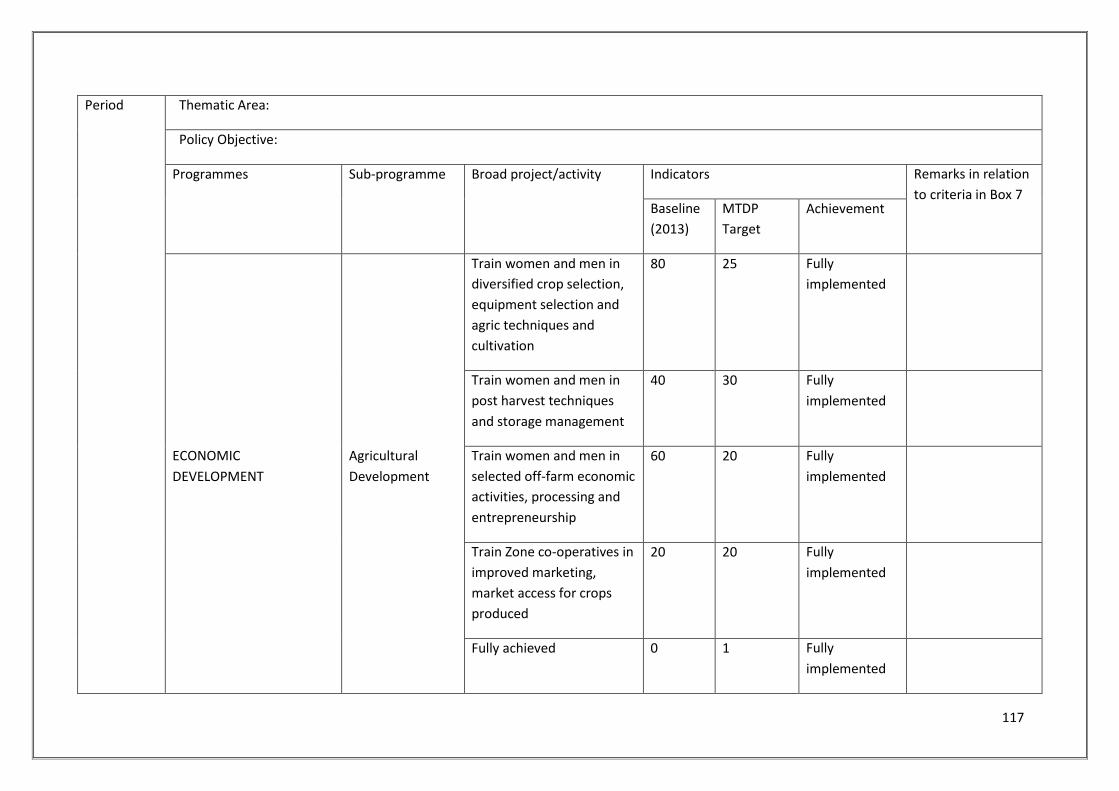
117
Period
Thematic Area:
Policy Objective:
Programmes Sub-programme Broad project/activity Indicators Remarks in relation
to criteria in Box 7 Baseline
(2013)
MTDP
Target
Achievement
ECONOMIC
DEVELOPMENT
Agricultural
Development
Train women and men in
diversified crop selection,
equipment selection and
agric techniques and
cultivation
80 25 Fully
implemented
Train women and men in
post harvest techniques
and storage management
40 30 Fully
implemented
Train women and men in
selected off-farm economic
activities, processing and
entrepreneurship
60 20 Fully
implemented
Train Zone co-operatives in
improved marketing,
market access for crops
produced
20 20 Fully
implemented
Fully achieved 0 1 Fully
implemented
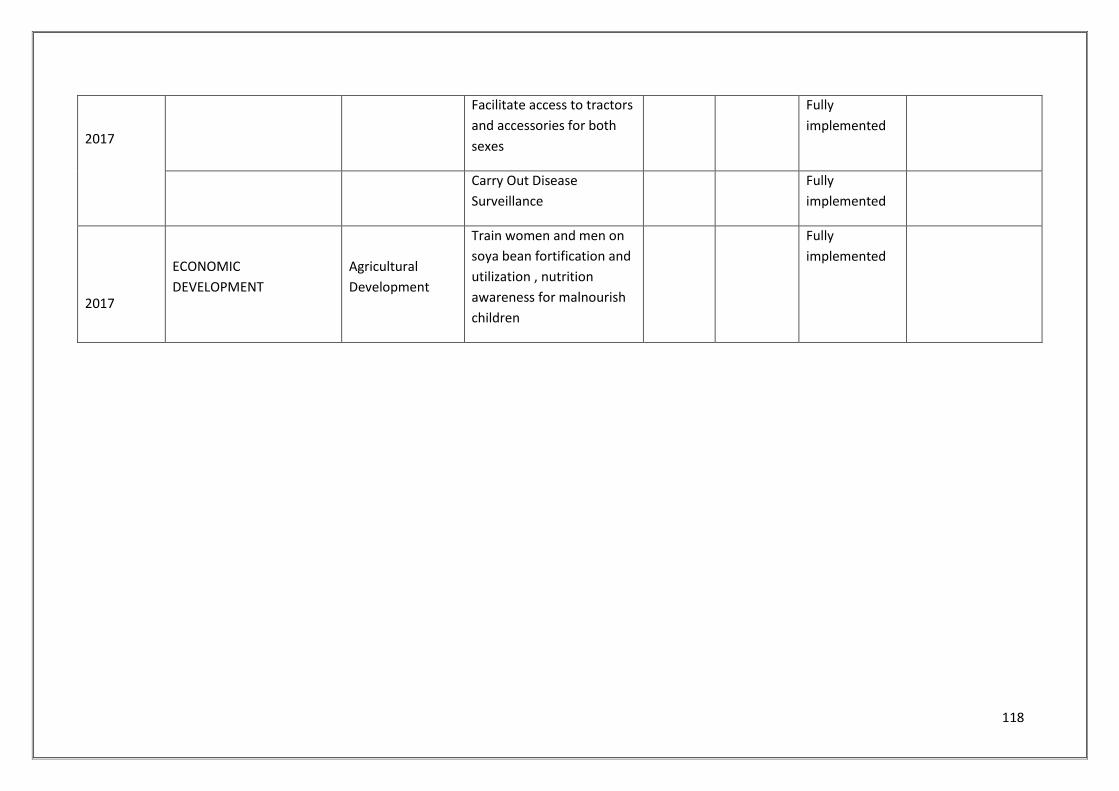
118
2017
Facilitate access to tractors
and accessories for both
sexes
Fully
implemented
Carry Out Disease
Surveillance
Fully
implemented
2017
ECONOMIC
DEVELOPMENT
Agricultural
Development
Train women and men on
soya bean fortification and
utilization , nutrition
awareness for malnourish
children
Fully
implemented
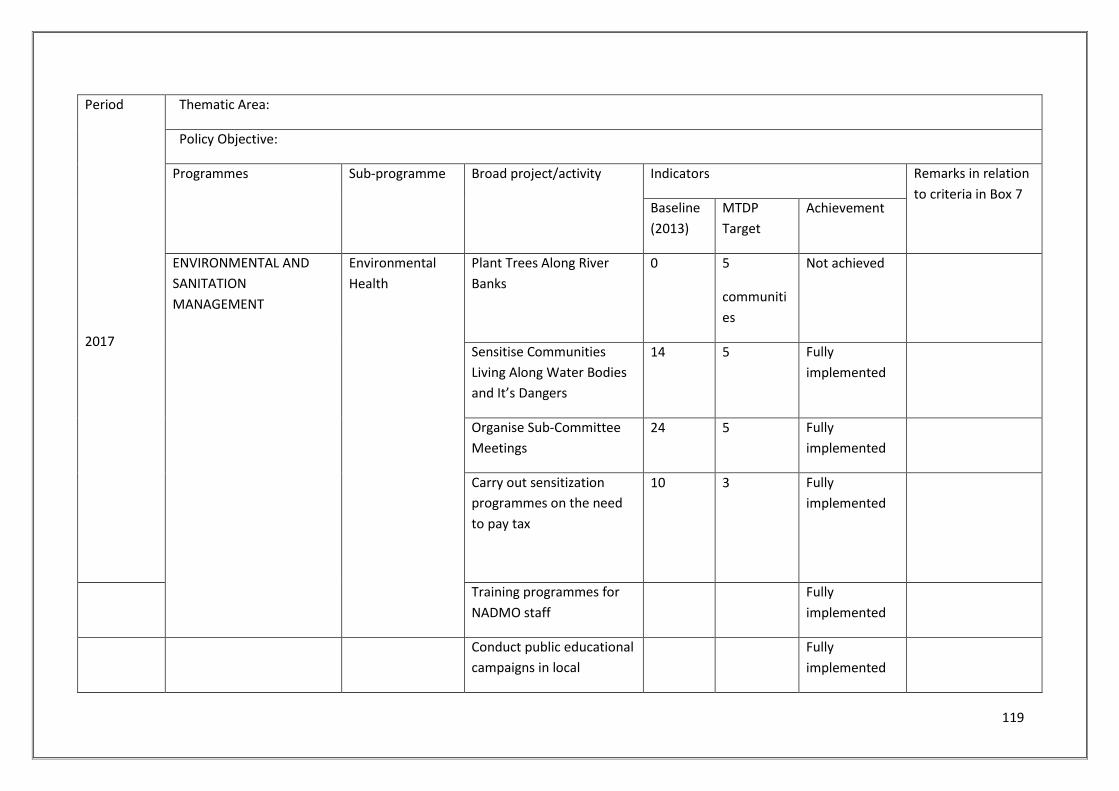
119
Period
2017
Thematic Area:
Policy Objective:
Programmes Sub-programme Broad project/activity Indicators Remarks in relation
to criteria in Box 7 Baseline
(2013)
MTDP
Target
Achievement
ENVIRONMENTAL AND
SANITATION
MANAGEMENT
Environmental
Health
Plant Trees Along River
Banks
0 5
communiti
es
Not achieved
Sensitise Communities
Living Along Water Bodies
and It’s Dangers
14 5 Fully
implemented
Organise Sub-Committee
Meetings
24 5 Fully
implemented
Carry out sensitization
programmes on the need
to pay tax
10 3 Fully
implemented
Training programmes for
NADMO staff
Fully
implemented
Conduct public educational
campaigns in local
Fully
implemented
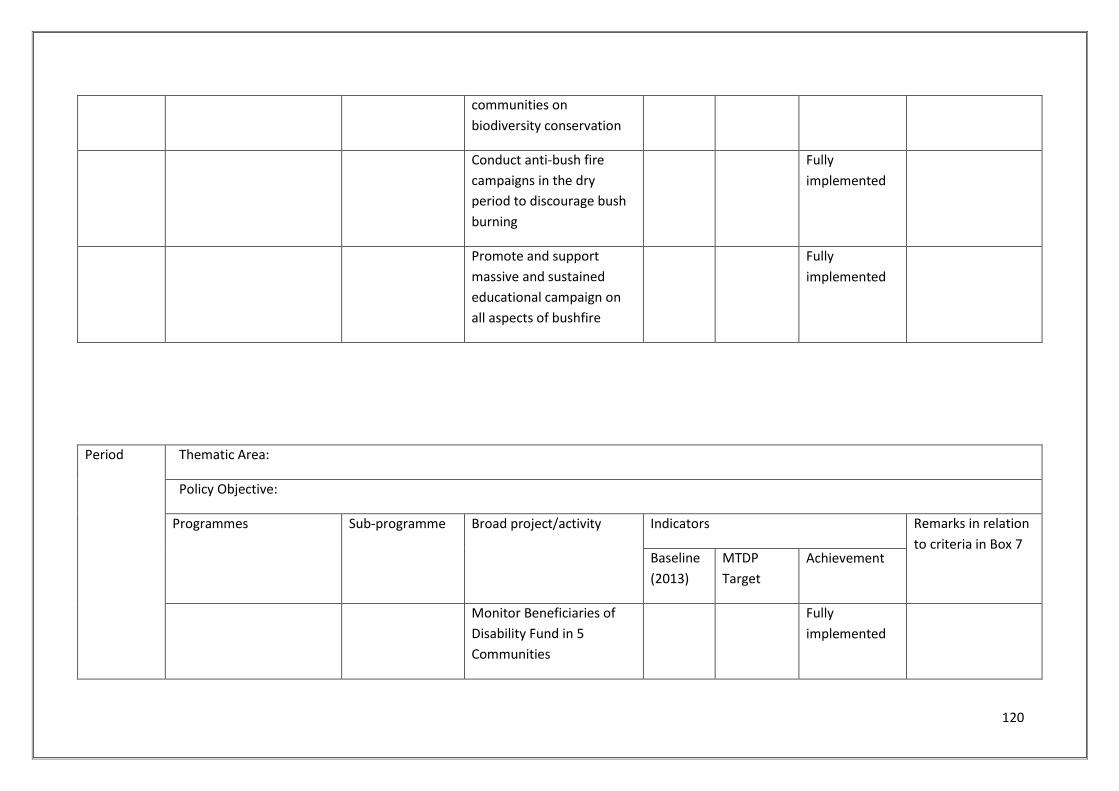
120
Period
Thematic Area:
Policy Objective:
Programmes Sub-programme Broad project/activity Indicators Remarks in relation
to criteria in Box 7 Baseline
(2013)
MTDP
Target
Achievement
Monitor Beneficiaries of
Disability Fund in 5
Communities
Fully
implemented
communities on
biodiversity conservation
Conduct anti-bush fire
campaigns in the dry
period to discourage bush
burning
Fully
implemented
Promote and support
massive and sustained
educational campaign on
all aspects of bushfire
Fully
implemented
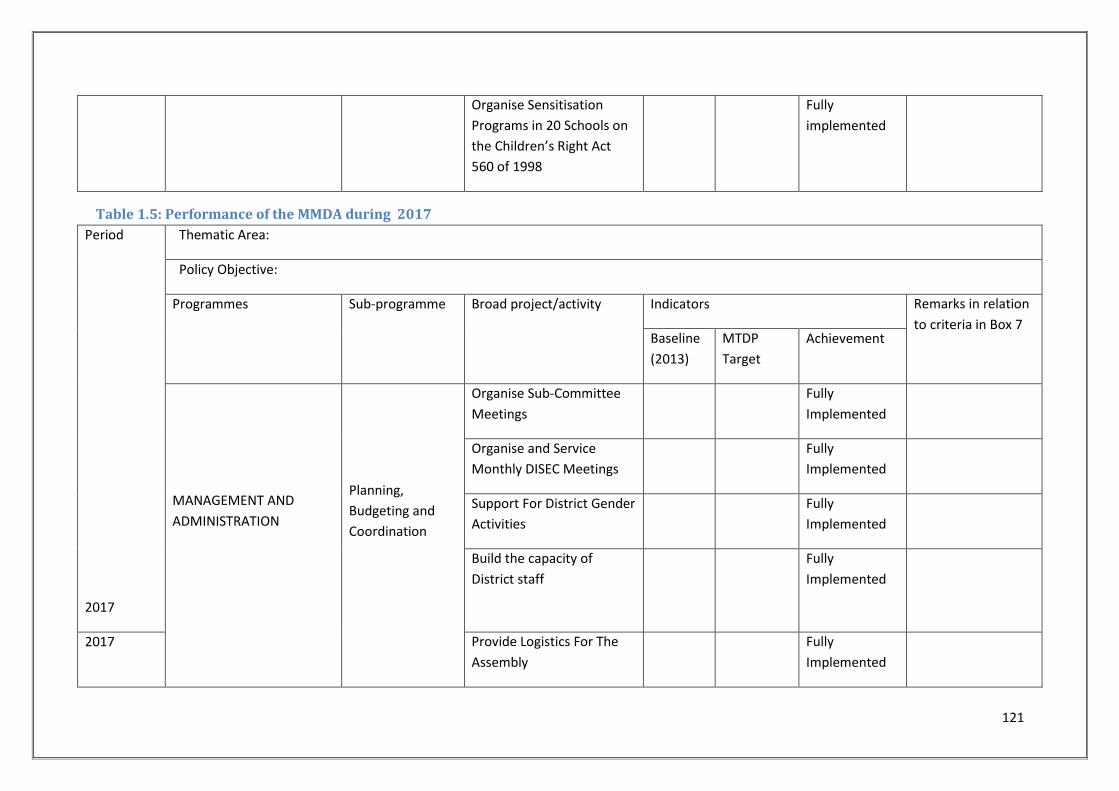
121
Organise Sensitisation
Programs in 20 Schools on
the Children’s Right Act
560 of 1998
Fully
implemented
Table 1.5: Performance of the MMDA during 2017
Period
2017
Thematic Area:
Policy Objective:
Programmes Sub-programme Broad project/activity Indicators Remarks in relation
to criteria in Box 7 Baseline
(2013)
MTDP
Target
Achievement
MANAGEMENT AND
ADMINISTRATION
Planning,
Budgeting and
Coordination
Organise Sub-Committee
Meetings
Fully
Implemented
Organise and Service
Monthly DISEC Meetings
Fully
Implemented
Support For District Gender
Activities
Fully
Implemented
Build the capacity of
District staff
Fully
Implemented
2017 Provide Logistics For The
Assembly
Fully
Implemented
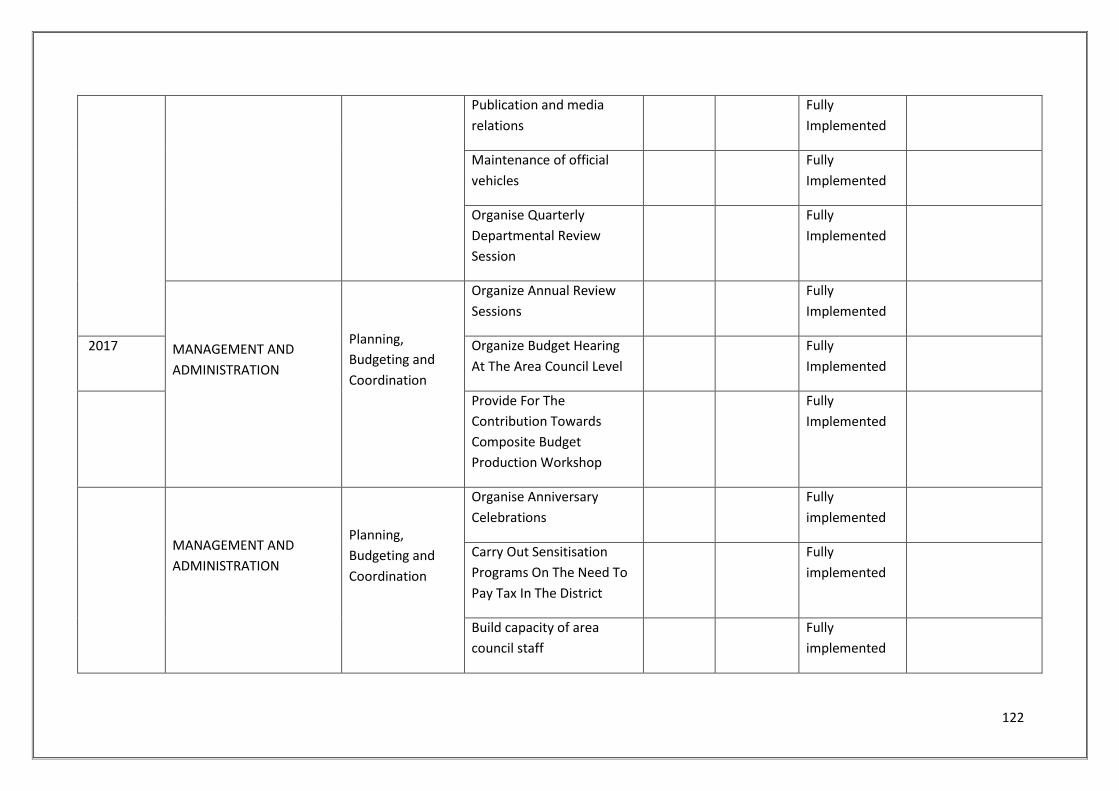
122
Publication and media
relations
Fully
Implemented
Maintenance of official
vehicles
Fully
Implemented
Organise Quarterly
Departmental Review
Session
Fully
Implemented
MANAGEMENT AND
ADMINISTRATION
Planning,
Budgeting and
Coordination
Organize Annual Review
Sessions
Fully
Implemented
2017 Organize Budget Hearing
At The Area Council Level
Fully
Implemented
Provide For The
Contribution Towards
Composite Budget
Production Workshop
Fully
Implemented
MANAGEMENT AND
ADMINISTRATION
Planning,
Budgeting and
Coordination
Organise Anniversary
Celebrations
Fully
implemented
Carry Out Sensitisation
Programs On The Need To
Pay Tax In The District
Fully
implemented
Build capacity of area
council staff
Fully
implemented

123
2017
Support DISEC To Carry Out
Security Monitoring In All
Communities
Fully
implemented
Organize General Assembly
Sessions Quarterly
Fully
implemented
Support for servicing of
state protocol and hosting
of official guest
Fully
implemented
Contribution for regional
sports festivals, NAFAC
&MOLE series
Fully
implemented
Train zone co-operative
leaders on communication
and advocacy
Fully
implemented
Engage with government
and public on policy issues
based on research findings
Fully
implemented
Organise Sensitisation
Meeting In Area Councils
To Explain Community
Development Programs
And Projects
Fully
implemented
MANAGEMENT AND
Planning,
Budgeting and
Sensitise Communities On
The Development Policies
Fully 23
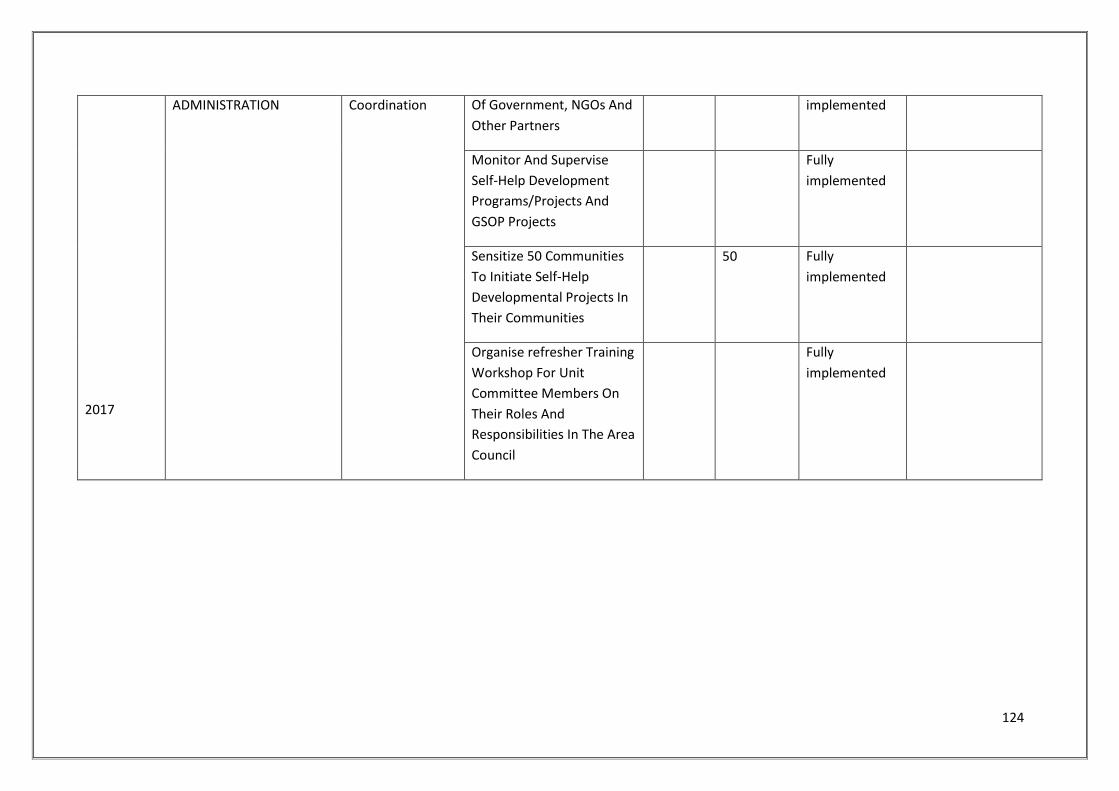
124
2017
ADMINISTRATION Coordination Of Government, NGOs And
Other Partners
implemented
Monitor And Supervise
Self-Help Development
Programs/Projects And
GSOP Projects
Fully
implemented
Sensitize 50 Communities
To Initiate Self-Help
Developmental Projects In
Their Communities
50 Fully
implemented
Organise refresher Training
Workshop For Unit
Committee Members On
Their Roles And
Responsibilities In The Area
Council
Fully
implemented
125
From table 1, it could be seen that substantial progress has been made in the implementation of
programmes and projects contained in the plan during the period under review. It was observed
that:
92.86% of the activities were fully implemented
2.38% were on-going at the time of the review
4.76% were not implemented at all
Thus, 100. % of the activities were either fully implemented, partially or on-going at the time of the
review.
1.7 Profile of the District
1.7.1 Introduction
Legislative Instrument 1885 having the district capital located at Kpandai carved Kpandai District out
of the East Gonja District in February 2008. According to the 2010 PHC, the district has a population
of 108,816 made of 54,997 Males (50.5%) and 53,819 females (49.5%). The population above 15
years stands at 57,160 with a mean age of 21 and sex ratio of 102. 1.2.3 Geophysical Characteristics.
1.7.2 Location and size
The District can be located at the South-Eastern corner of the Northern Region of Ghana and lies
between latitudes 8º N and 9.29º N and longitudes 0.29 º E and 1.26ºW. It is bordered to the North
by Nanumba South District, East Gonja to the West, Krachi West District to the South-West, Nkwanta
North District to the East.
The District has a total land area of 1,132.9Km Square. The District is strategically located – the
central point between the Northern part and Southern part of the Eastern corridor of Ghana. The
District can therefore take advantage of its strategic location to be a gateway to both the Southern
and Northern Ghana.
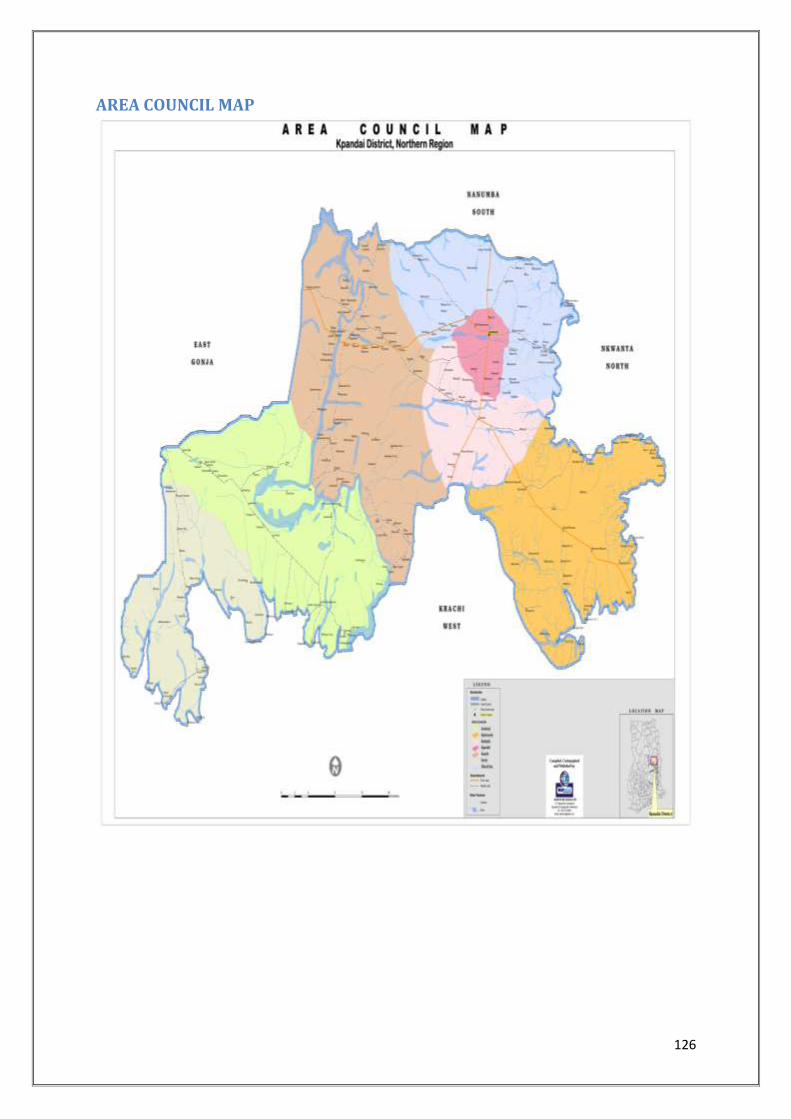
126
AREA COUNCIL MAP
127
1.7.3 Relief and Drainage
The lands are gently undulating with few depressions. There are few high hills to the eastern
corridor of the district but mountains are completely absent. The soils are generally sandy loamy
except in the lowlands and swampy areas where alluvial deposits are found.
The district is endowed with three big rivers- River Oti, River Daka, White Volta and its tributaries
that transverse the district at vantage points and floods these areas at the peak of the rainy season.
There are also low lying and swampy areas which also become waterlogged during the rainy season.
Other water bodies found in the District include numerous intermittent streams located in most
parts of the District. These water bodies constitute important resources for the people as most of
them depend on them for household use, fishing and transportation.
The topography of the District is not a hindrance for road development and yet most of the
communities in the District are accessible only by foot paths .Generally, the area is well drained
except that few portions located close to the major rivers and streams become waterlogged and
pose problems for human and vehicle movement in the rainy seasons. The water bodies also create
large expanse of river banks that offer an advantage for rice cultivation.
1.7.4 Climate
The District lies in the Tropical Continental Climatic Zone with the mid-day sun always overhead. As
result, temperatures are fairly high ranging between 29oC and 40oC. Maximum temperature is
usually recorded in April, towards the end of the dry season. Minimum temperatures are also
recorded around December-January, during the Harmattan period. Just like any part of West Africa,
the district comes under the influence of the wet South-West Monsoon and the dry North-East
Trades winds which are associated with the rainy season and the dry harmattan conditions
respectively.
The rainfall pattern in Kpandai District is characterized by irregularity and variability in terms of
timing of onset, duration and total amount of rainfall, which has been the key limiting factor
affecting crop production in the district. However, the district has one main rainy season which is
sufficient to support and sustain plant life. The total annual rainfall ranges between 1150mm to
1500mm.
This climatic pattern is good for food crop production and to some extent, forest development.
However, the concentration of the rains in three months period affect farming since most parts of
the year when rains are off is usually declared as “off farming” and the people spend most of this
period idling. Similarly, the pattern affects accessibility to certain communities as most roads
become flooded during the peak season rendering them impossible or unmotorable.
1.7.5 Vegetation
The District is located in the transitional zone between the Northern Savannah and the moist semi
deciduous forest. The natural vegetation in the district is the Guinea Savannah Woodland, which has
128
evolved from climatic conditions and modified substantially by human activities. There are few
grooves, which have been preserved over the years.
The tree cover consists of semi-deciduous trees such as oil palm trees; raffia palm; acacia; shea-nut
trees; dawadawa trees among others. In addition, tall grasses that characterize Guinea Savannah
areas are extensively spread throughout the district. A large number of both plant and animal
species inhabit the natural environment.
The tree cover is relatively dense, compared to the rest of the districts in Northern Region. However,
intensive harvesting of the trees for fuel wood and charcoal production, and bad attitude of the
Fulani herdsmen are fast reducing the tree cover.
1.7.6 Soils
The soils in the district are classified into three major groupings. These include alluvial soils classified
as Glysols, which is found around the Volta Lake, particularly in the drawn-down zone of the Volta
Lake, in the dry season. The soils along the Lake are medium textured and moderately well drained
in parts. The soil is potentially fertile for the commercial cultivation of yams and maize.
The bulk of the district is covered by ground water laterites, developed mainly from Voltaian
Sandstone materials, highly concretionally with frequent exposures of iron pan and boulders. There
are, however, deeper and slightly better soils in some locations, which could support shifting
cultivation patterns. Any development should include maintenance of vegetation cover to prevent
soil erosion.
The other major soil group is the relatively fertile Savannah Ochrosols. This soil group is moderately
well drained with good water retention. The soils types found in the District are good for the
cultivation of crops such as yam, maize, groundnut, cassava among others. Also the recent
discoveries of smooth sand (Sea-Sand) around Blajai may be an important revenue sources to the
District if access road is created to the site.
1.7.7 Environmental Situation
The quality of both the built and natural environment is vital for the sustainable growth and
development of the district. Developmental initiatives can only be meaningful and sustainable when
it is founded on a well managed and healthy built environment. To this end, the protection of
natural environment to prevent deforestation, land degradation and loss of ecosystem is
paramount. The District Natural and Built Environment are therefore examined in this section.
1.7.8 Natural Environment
The District’s natural environment is characterized by numerous problems emanating from the
rainfall pattern, nature of soils, use of energy resources, farming and household activities.
129
The pattern of rainfall experienced in the district to a large extent contributes to the environmental
degradation of the district. From December to March when the rains are off, the area becomes dry
and the vegetation is destroyed by bush fires leaving the land bare. This serves as an avenue for
extensive soil erosion when the rains set-in around April or May. This phenomenon has led to
extensive land degradation in most parts of the district.
A significant portion of the district abound in clay soils and this poses serious problems for human
and vehicle movement due to the floods that are normally associated with clay with the onset of
the rains.
About 90% of the population depends on wood and charcoal as the main source of energy for both
domestic and commercial purposes. The collection of wood and the production of charcoal lead to
environmental degradation in all the settlements in the district. The developmental constraints
associated with the use of charcoal and wood as the main sources of energy includes.
Deforestation
Soil erosion
Loss of soil fertility
Ecological imbalance
The practice of clearing and burning the vegetation for farming in the district also cause erosion and
deforestation in the district. Since about 90% of the population is farmers, these have adverse
impact on the food security in the District.
The main problems of the district environment and sanitation are caused by household activities.
About 80% of the population in the district disposes off both solid and liquid waste within the
vicinity of their houses and these are carried into the various water bodies by run-offs thereby
polluting them. The logical consequence of this is the wide spread incidence of sanitation related
diseases such as diarrhoea, bilharzias, dysentery and other water borne diseases etc.
1.7.9 Built Environment
The state of the built environment in the District leaves much to be desired. This is traceable to poor
spatial planning, poor waste management, lack of District bye- laws, poor building technology etc.
With the absence of effective development control machinery in the district, physical development
has been haphazard and uncoordinated leading to incompatible land uses especially in the urban
and semi urban settlements of Kpandai, Kumdi, Buya and Kitare etc. Worse still the general absence
of drains in the district has exposed most communities to severe erosion resulting in reel and gullies
and these exposed foundations of buildings. Similarly, large portions of the feeder roads in the
District are badly eroded increasing travelling time by more than half the normal travel time.
1.7.10 Demographic Characteristics
Population is a critical issue in every district development. The Population of a District is its greatest
resource. It is the instrument and objective of the district’s development, hence the protection and
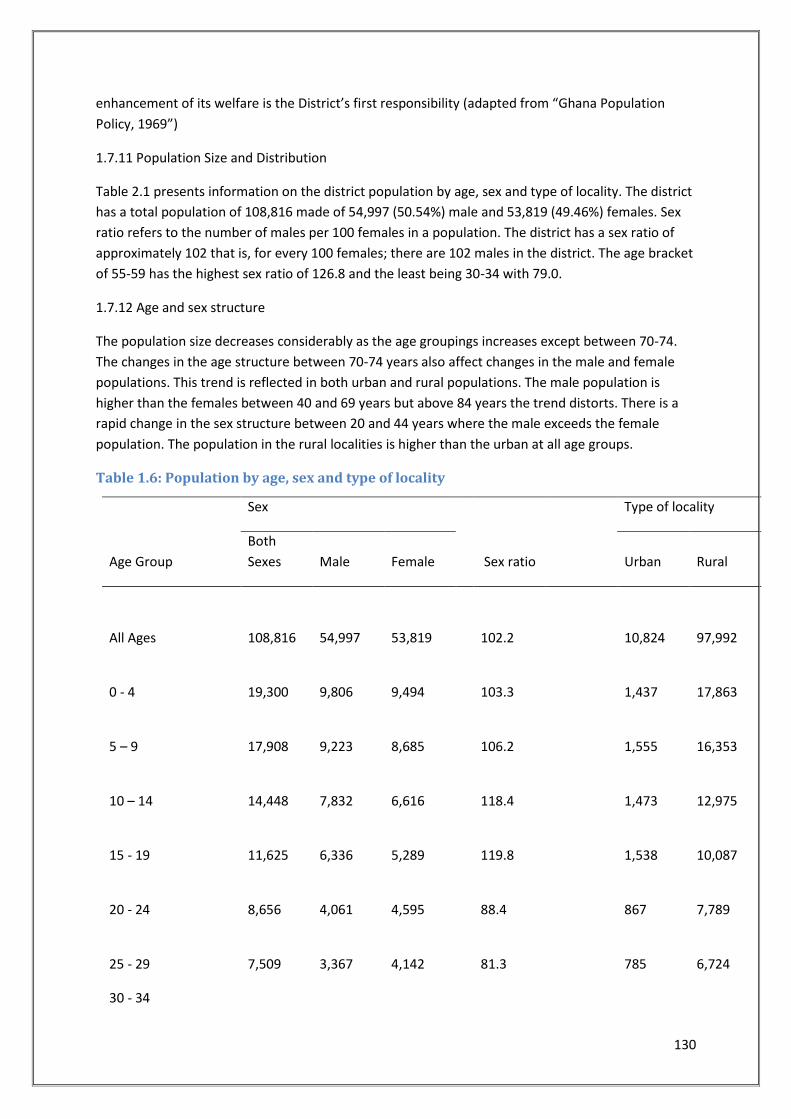
130
enhancement of its welfare is the District’s first responsibility (adapted from “Ghana Population
Policy, 1969”)
1.7.11 Population Size and Distribution
Table 2.1 presents information on the district population by age, sex and type of locality. The district
has a total population of 108,816 made of 54,997 (50.54%) male and 53,819 (49.46%) females. Sex
ratio refers to the number of males per 100 females in a population. The district has a sex ratio of
approximately 102 that is, for every 100 females; there are 102 males in the district. The age bracket
of 55-59 has the highest sex ratio of 126.8 and the least being 30-34 with 79.0.
1.7.12 Age and sex structure
The population size decreases considerably as the age groupings increases except between 70-74.
The changes in the age structure between 70-74 years also affect changes in the male and female
populations. This trend is reflected in both urban and rural populations. The male population is
higher than the females between 40 and 69 years but above 84 years the trend distorts. There is a
rapid change in the sex structure between 20 and 44 years where the male exceeds the female
population. The population in the rural localities is higher than the urban at all age groups.
Table 1.6: Population by age, sex and type of locality
Sex Type of locality
Age Group
Both
Sexes Male Female Sex ratio Urban Rural
All Ages
108,816
54,997
53,819
102.2
10,824
97,992
0 - 4
19,300
9,806
9,494
103.3
1,437
17,863
5 – 9
17,908
9,223
8,685
106.2
1,555
16,353
10 – 14
14,448
7,832
6,616
118.4
1,473
12,975
15 - 19
11,625
6,336
5,289
119.8
1,538
10,087
20 - 24
8,656
4,061
4,595
88.4
867
7,789
25 - 29
7,509
3,367
4,142
81.3
785
6,724
30 - 34
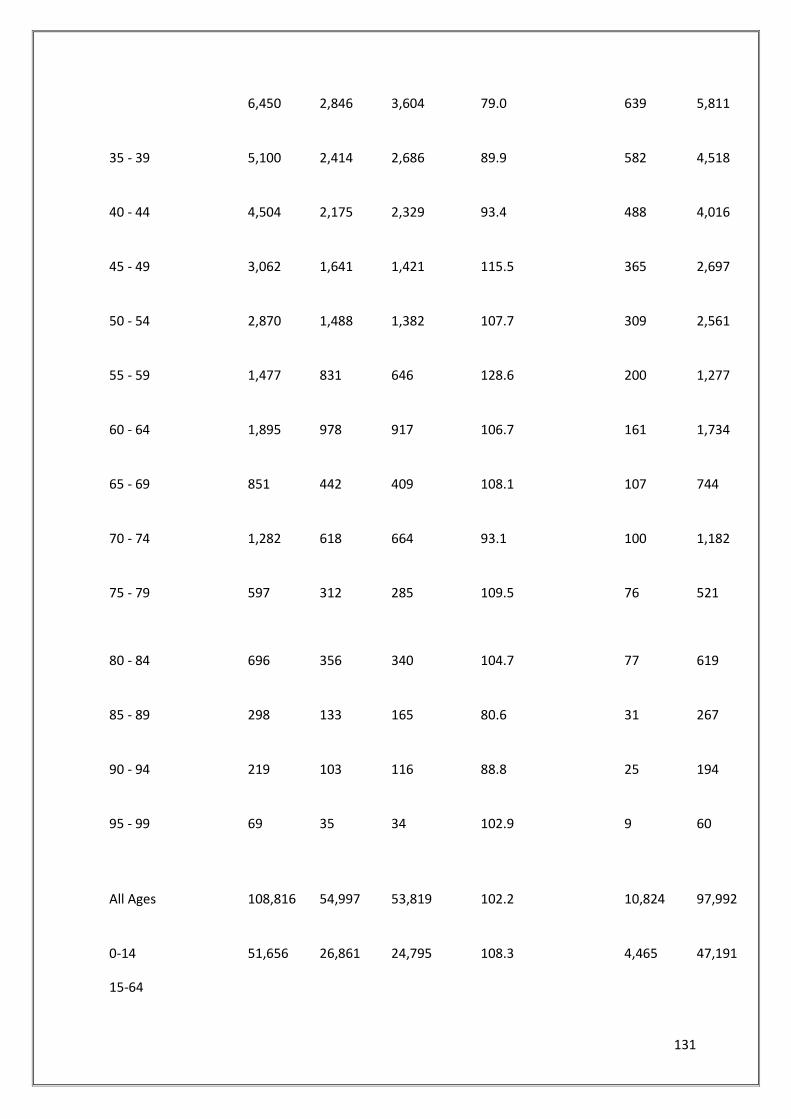
131
6,450 2,846 3,604 79.0 639 5,811
35 - 39
5,100
2,414
2,686
89.9
582
4,518
40 - 44
4,504
2,175
2,329
93.4
488
4,016
45 - 49
3,062
1,641
1,421
115.5
365
2,697
50 - 54
2,870
1,488
1,382
107.7
309
2,561
55 - 59
1,477
831
646
128.6
200
1,277
60 - 64
1,895
978
917
106.7
161
1,734
65 - 69
851
442
409
108.1
107
744
70 - 74
1,282
618
664
93.1
100
1,182
75 - 79
597
312
285
109.5
76
521
80 - 84
696
356
340
104.7
77
619
85 - 89
298
133
165
80.6
31
267
90 - 94
219
103
116
88.8
25
194
95 - 99
69
35
34
102.9
9
60
All Ages
108,816
54,997
53,819
102.2
10,824
97,992
0-14
51,656
26,861
24,795
108.3
4,465
47,191
15-64
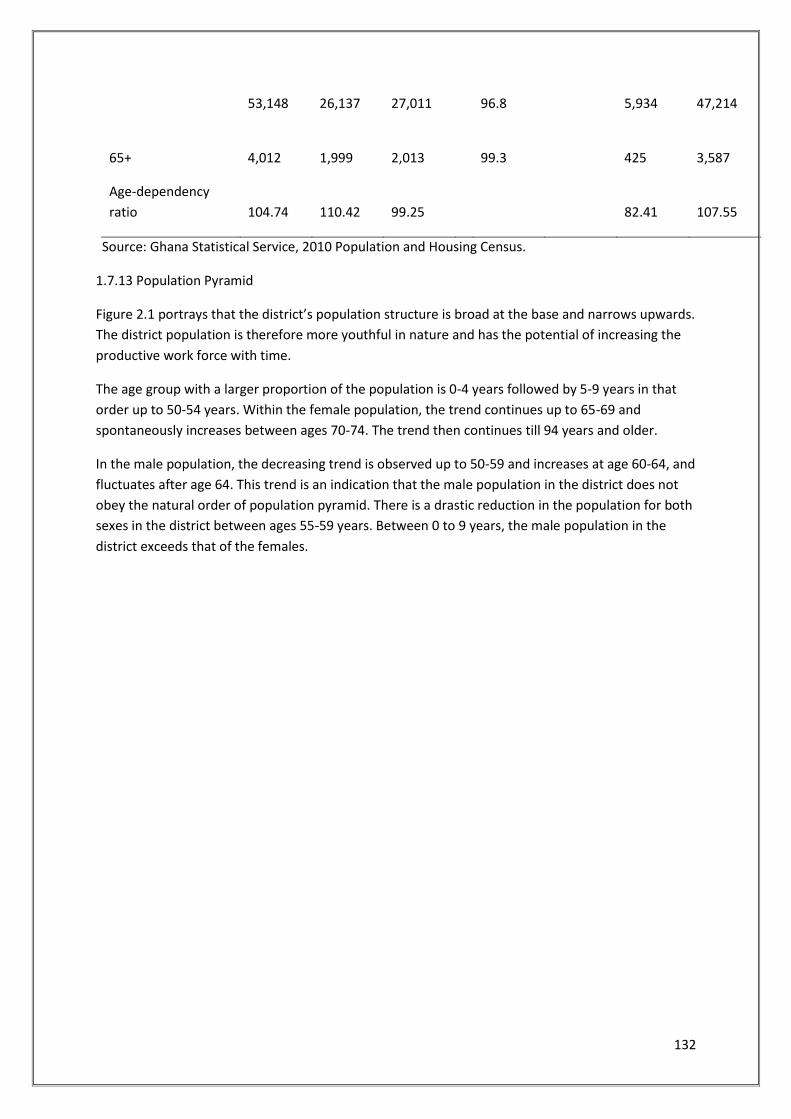
132
53,148 26,137 27,011 96.8 5,934 47,214
65+
4,012
1,999
2,013
99.3
425
3,587
Age-dependency
ratio
104.74
110.42
99.25
82.41
107.55
Source: Ghana Statistical Service, 2010 Population and Housing Census.
1.7.13 Population Pyramid
Figure 2.1 portrays that the district’s population structure is broad at the base and narrows upwards.
The district population is therefore more youthful in nature and has the potential of increasing the
productive work force with time.
The age group with a larger proportion of the population is 0-4 years followed by 5-9 years in that
order up to 50-54 years. Within the female population, the trend continues up to 65-69 and
spontaneously increases between ages 70-74. The trend then continues till 94 years and older.
In the male population, the decreasing trend is observed up to 50-59 and increases at age 60-64, and
fluctuates after age 64. This trend is an indication that the male population in the district does not
obey the natural order of population pyramid. There is a drastic reduction in the population for both
sexes in the district between ages 55-59 years. Between 0 to 9 years, the male population in the
district exceeds that of the females.
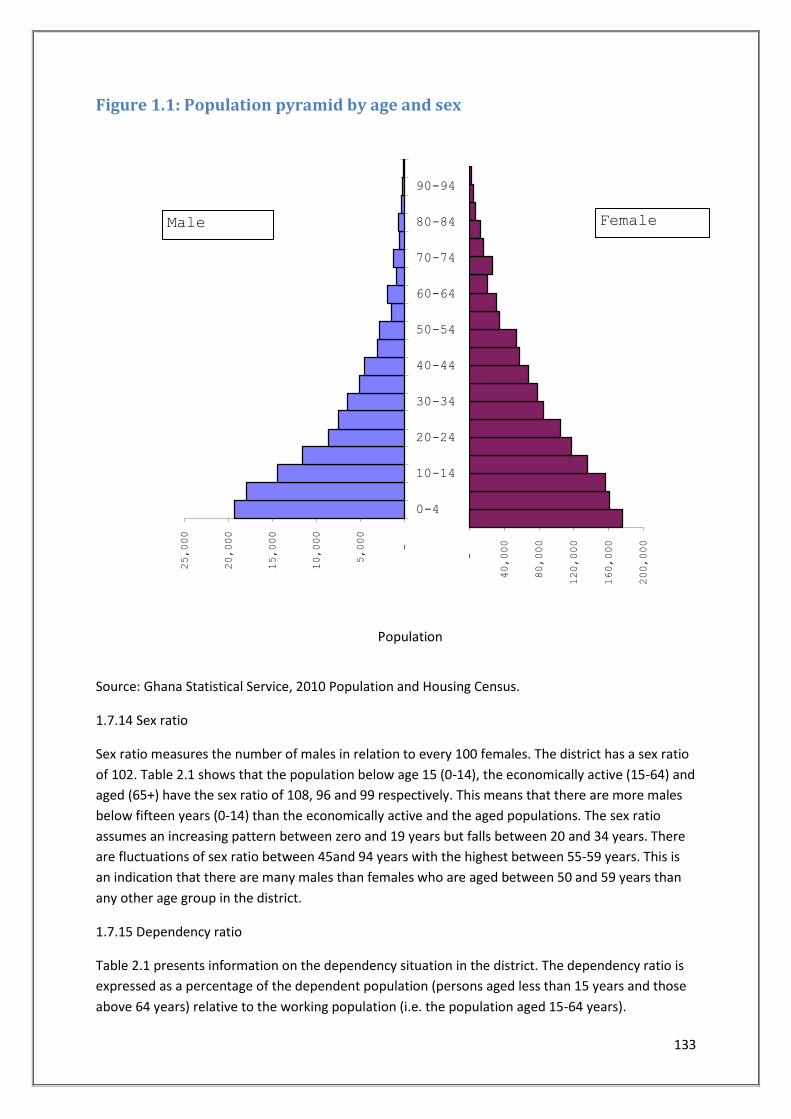
133
Figure 1.1: Population pyramid by age and sex
Population
Source: Ghana Statistical Service, 2010 Population and Housing Census.
1.7.14 Sex ratio
Sex ratio measures the number of males in relation to every 100 females. The district has a sex ratio
of 102. Table 2.1 shows that the population below age 15 (0-14), the economically active (15-64) and
aged (65+) have the sex ratio of 108, 96 and 99 respectively. This means that there are more males
below fifteen years (0-14) than the economically active and the aged populations. The sex ratio
assumes an increasing pattern between zero and 19 years but falls between 20 and 34 years. There
are fluctuations of sex ratio between 45and 94 years with the highest between 55-59 years. This is
an indication that there are many males than females who are aged between 50 and 59 years than
any other age group in the district.
1.7.15 Dependency ratio
Table 2.1 presents information on the dependency situation in the district. The dependency ratio is
expressed as a percentage of the dependent population (persons aged less than 15 years and those
above 64 years) relative to the working population (i.e. the population aged 15-64 years).
-
40,000
80,000
120,000
160,000
200,000
-
5,000
10,000
15,000
20,000
25,000
0-4
10-14
20-24
30-34
40-44
50-54
60-64
70-74
80-84
90-94
Male Female
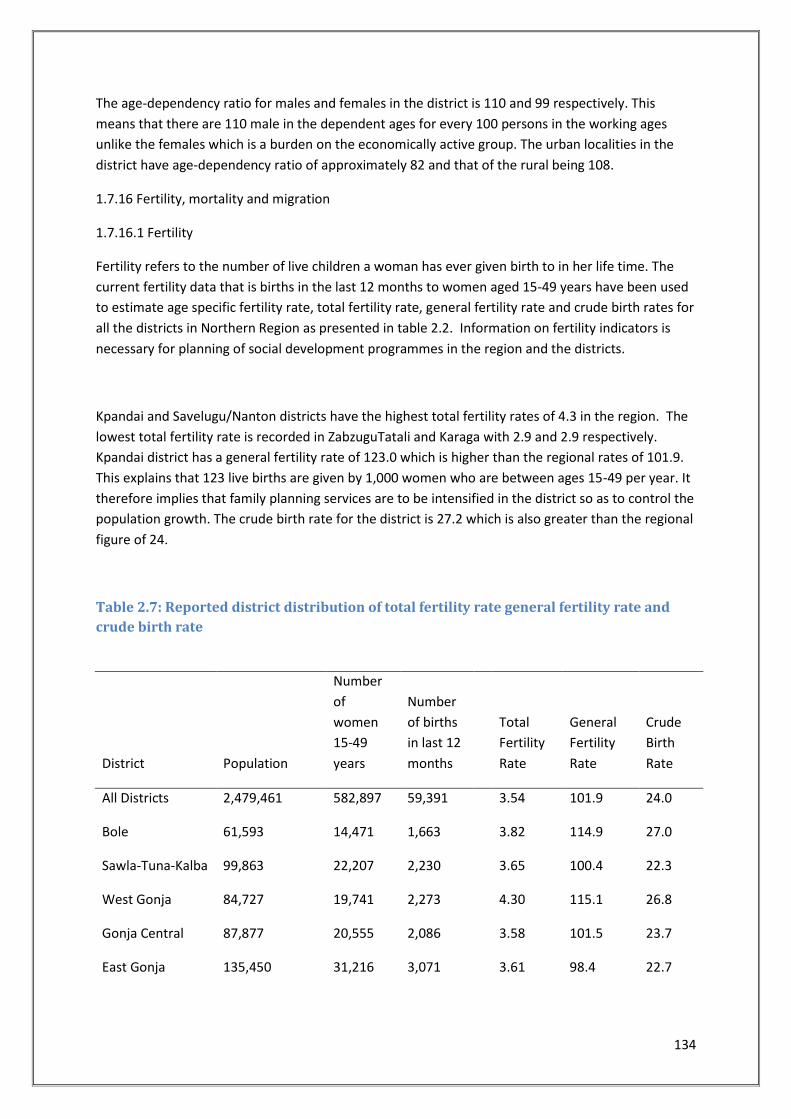
134
The age-dependency ratio for males and females in the district is 110 and 99 respectively. This
means that there are 110 male in the dependent ages for every 100 persons in the working ages
unlike the females which is a burden on the economically active group. The urban localities in the
district have age-dependency ratio of approximately 82 and that of the rural being 108.
1.7.16 Fertility, mortality and migration
1.7.16.1 Fertility
Fertility refers to the number of live children a woman has ever given birth to in her life time. The
current fertility data that is births in the last 12 months to women aged 15-49 years have been used
to estimate age specific fertility rate, total fertility rate, general fertility rate and crude birth rates for
all the districts in Northern Region as presented in table 2.2. Information on fertility indicators is
necessary for planning of social development programmes in the region and the districts.
Kpandai and Savelugu/Nanton districts have the highest total fertility rates of 4.3 in the region. The
lowest total fertility rate is recorded in ZabzuguTatali and Karaga with 2.9 and 2.9 respectively.
Kpandai district has a general fertility rate of 123.0 which is higher than the regional rates of 101.9.
This explains that 123 live births are given by 1,000 women who are between ages 15-49 per year. It
therefore implies that family planning services are to be intensified in the district so as to control the
population growth. The crude birth rate for the district is 27.2 which is also greater than the regional
figure of 24.
Table 2.7: Reported district distribution of total fertility rate general fertility rate and
crude birth rate
District Population
Number
of
women
15-49
years
Number
of births
in last 12
months
Total
Fertility
Rate
General
Fertility
Rate
Crude
Birth
Rate
All Districts 2,479,461 582,897 59,391 3.54 101.9 24.0
Bole 61,593 14,471 1,663
3.82 114.9 27.0
Sawla-Tuna-Kalba 99,863 22,207 2,230
3.65 100.4 22.3
West Gonja 84,727 19,741 2,273
4.30 115.1 26.8
Gonja Central 87,877 20,555 2,086
3.58 101.5 23.7
East Gonja 135,450 31,216 3,071
3.61 98.4 22.7
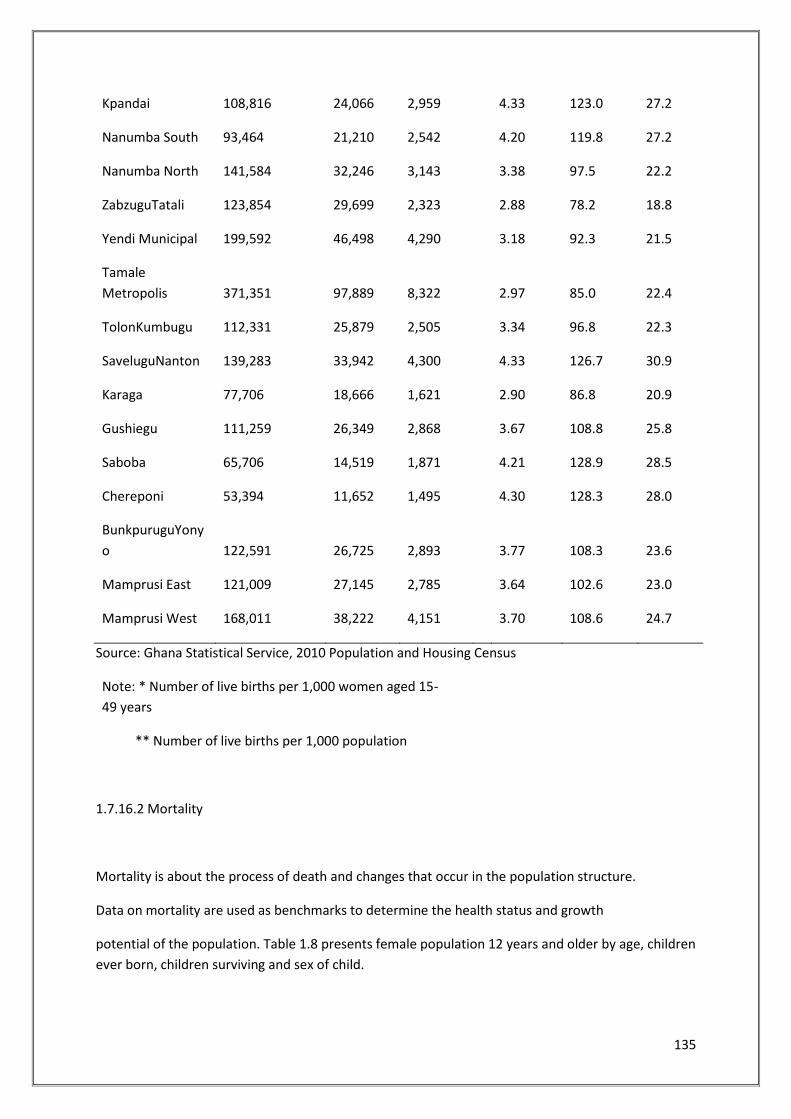
135
Kpandai 108,816 24,066 2,959
4.33 123.0 27.2
Nanumba South 93,464 21,210 2,542
4.20 119.8 27.2
Nanumba North 141,584 32,246 3,143
3.38 97.5 22.2
ZabzuguTatali 123,854 29,699 2,323
2.88 78.2 18.8
Yendi Municipal 199,592 46,498 4,290
3.18 92.3 21.5
Tamale
Metropolis 371,351 97,889 8,322
2.97 85.0 22.4
TolonKumbugu 112,331 25,879 2,505
3.34 96.8 22.3
SaveluguNanton 139,283 33,942 4,300
4.33 126.7 30.9
Karaga 77,706 18,666 1,621
2.90 86.8 20.9
Gushiegu 111,259 26,349 2,868
3.67 108.8 25.8
Saboba 65,706 14,519 1,871
4.21 128.9 28.5
Chereponi 53,394 11,652 1,495
4.30 128.3 28.0
BunkpuruguYony
o 122,591 26,725 2,893
3.77 108.3 23.6
Mamprusi East 121,009 27,145 2,785
3.64 102.6 23.0
Mamprusi West 168,011 38,222 4,151 3.70 108.6 24.7
Source: Ghana Statistical Service, 2010 Population and Housing Census
Note: * Number of live births per 1,000 women aged 15-
49 years
** Number of live births per 1,000 population
1.7.16.2 Mortality
Mortality is about the process of death and changes that occur in the population structure.
Data on mortality are used as benchmarks to determine the health status and growth
potential of the population. Table 1.8 presents female population 12 years and older by age, children
ever born, children surviving and sex of child.
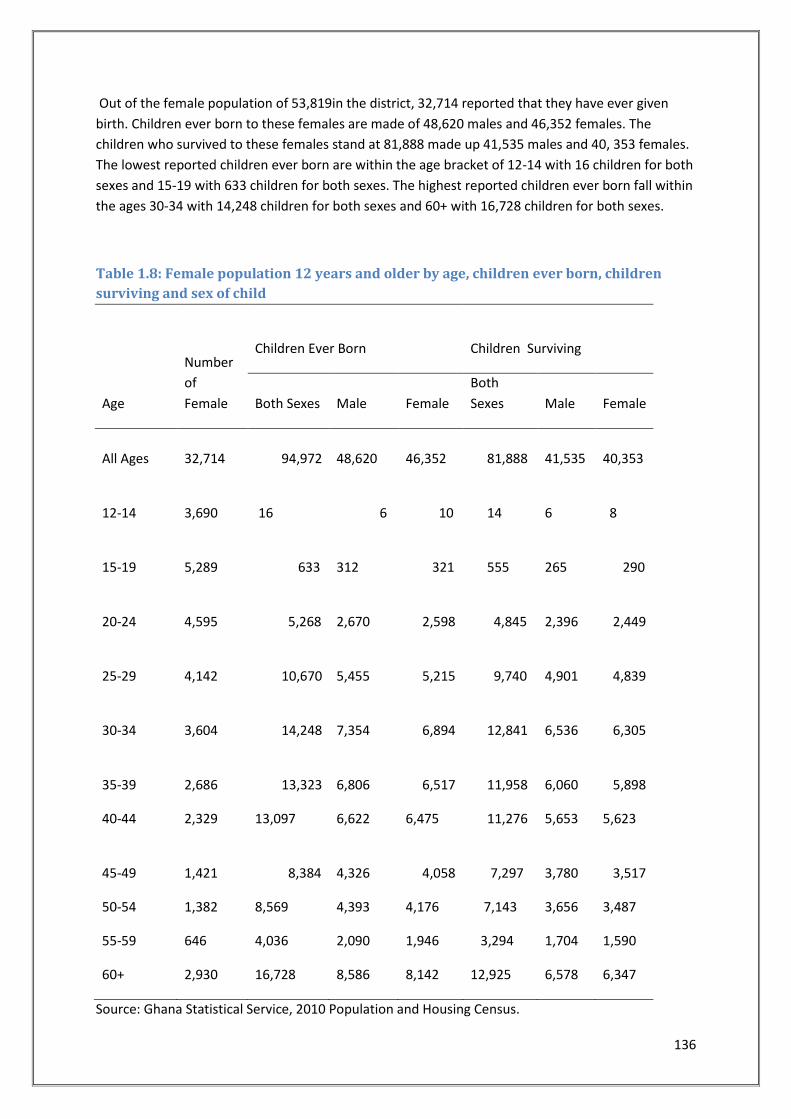
136
Out of the female population of 53,819in the district, 32,714 reported that they have ever given
birth. Children ever born to these females are made of 48,620 males and 46,352 females. The
children who survived to these females stand at 81,888 made up 41,535 males and 40, 353 females.
The lowest reported children ever born are within the age bracket of 12-14 with 16 children for both
sexes and 15-19 with 633 children for both sexes. The highest reported children ever born fall within
the ages 30-34 with 14,248 children for both sexes and 60+ with 16,728 children for both sexes.
Table 1.8: Female population 12 years and older by age, children ever born, children
surviving and sex of child
Age
Number
of
Female
Children Ever Born Children Surviving
Both Sexes Male Female
Both
Sexes Male Female
All Ages
32,714 94,972
48,620
46,352 81,888
41,535
40,353
12-14
3,690 16 6 10 14
6 8
15-19
5,289 633
312 321 555
265 290
20-24
4,595 5,268
2,670 2,598 4,845
2,396 2,449
25-29
4,142 10,670
5,455 5,215 9,740
4,901 4,839
30-34
3,604 14,248
7,354 6,894 12,841
6,536 6,305
35-39
2,686 13,323
6,806 6,517 11,958
6,060 5,898
40-44 2,329 13,097 6,622 6,475 11,276 5,653 5,623
45-49
1,421 8,384
4,326 4,058 7,297
3,780 3,517
50-54 1,382 8,569 4,393 4,176 7,143 3,656 3,487
55-59 646 4,036 2,090 1,946 3,294 1,704 1,590
60+ 2,930 16,728 8,586 8,142 12,925 6,578 6,347
Source: Ghana Statistical Service, 2010 Population and Housing Census.
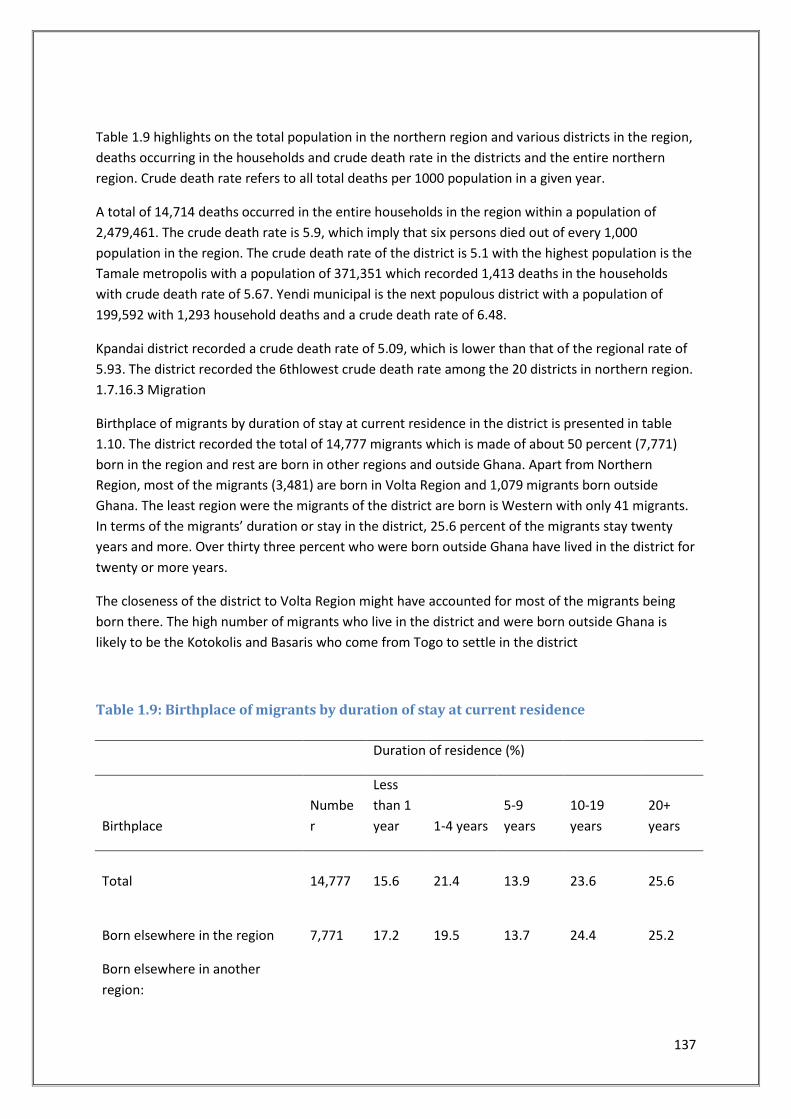
137
Table 1.9 highlights on the total population in the northern region and various districts in the region,
deaths occurring in the households and crude death rate in the districts and the entire northern
region. Crude death rate refers to all total deaths per 1000 population in a given year.
A total of 14,714 deaths occurred in the entire households in the region within a population of
2,479,461. The crude death rate is 5.9, which imply that six persons died out of every 1,000
population in the region. The crude death rate of the district is 5.1 with the highest population is the
Tamale metropolis with a population of 371,351 which recorded 1,413 deaths in the households
with crude death rate of 5.67. Yendi municipal is the next populous district with a population of
199,592 with 1,293 household deaths and a crude death rate of 6.48.
Kpandai district recorded a crude death rate of 5.09, which is lower than that of the regional rate of
5.93. The district recorded the 6thlowest crude death rate among the 20 districts in northern region.
1.7.16.3 Migration
Birthplace of migrants by duration of stay at current residence in the district is presented in table
1.10. The district recorded the total of 14,777 migrants which is made of about 50 percent (7,771)
born in the region and rest are born in other regions and outside Ghana. Apart from Northern
Region, most of the migrants (3,481) are born in Volta Region and 1,079 migrants born outside
Ghana. The least region were the migrants of the district are born is Western with only 41 migrants.
In terms of the migrants’ duration or stay in the district, 25.6 percent of the migrants stay twenty
years and more. Over thirty three percent who were born outside Ghana have lived in the district for
twenty or more years.
The closeness of the district to Volta Region might have accounted for most of the migrants being
born there. The high number of migrants who live in the district and were born outside Ghana is
likely to be the Kotokolis and Basaris who come from Togo to settle in the district
Table 1.9: Birthplace of migrants by duration of stay at current residence
Duration of residence (%)
Birthplace
Numbe
r
Less
than 1
year 1-4 years
5-9
years
10-19
years
20+
years
Total
14,777 15.6 21.4 13.9 23.6 25.6
Born elsewhere in the region
7,771 17.2 19.5 13.7 24.4 25.2
Born elsewhere in another
region:
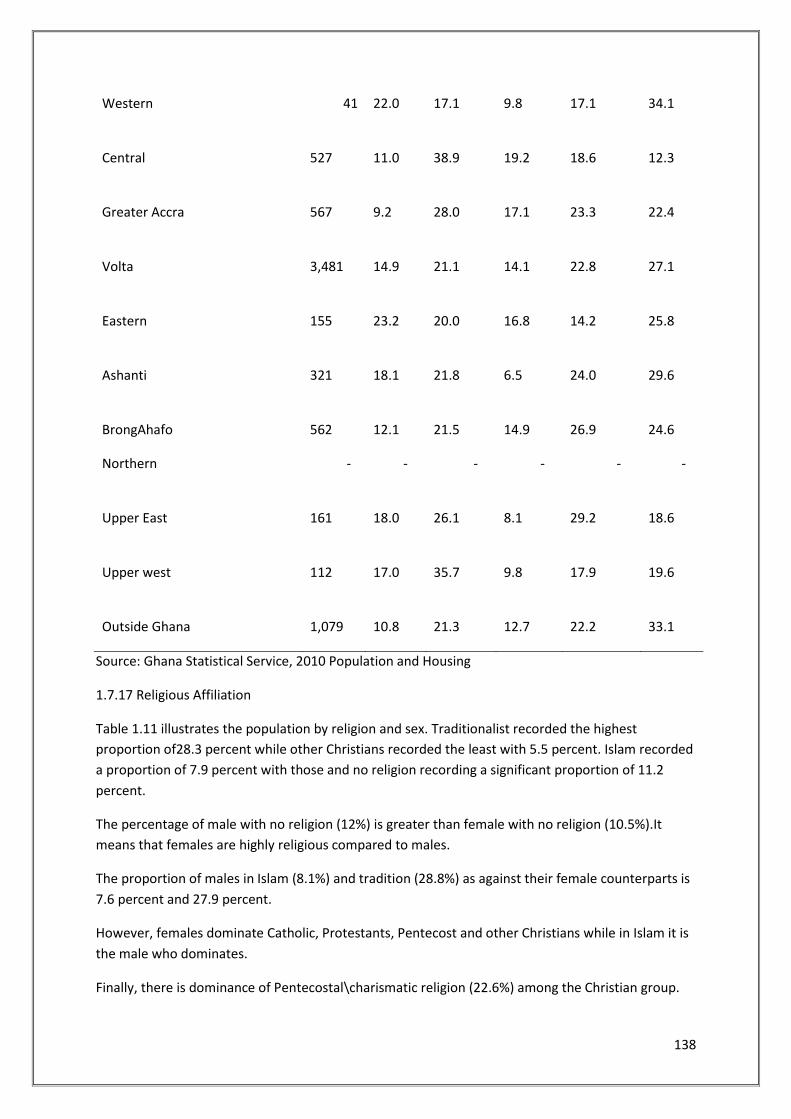
138
Western 41 22.0 17.1 9.8 17.1 34.1
Central
527 11.0 38.9 19.2 18.6 12.3
Greater Accra
567 9.2 28.0 17.1 23.3 22.4
Volta
3,481 14.9 21.1 14.1 22.8 27.1
Eastern
155 23.2 20.0 16.8 14.2 25.8
Ashanti
321 18.1 21.8 6.5 24.0 29.6
BrongAhafo
562 12.1 21.5 14.9 26.9 24.6
Northern - - - - - -
Upper East
161 18.0 26.1 8.1 29.2 18.6
Upper west
112 17.0 35.7 9.8 17.9 19.6
Outside Ghana
1,079 10.8 21.3 12.7 22.2 33.1
Source: Ghana Statistical Service, 2010 Population and Housing
1.7.17 Religious Affiliation
Table 1.11 illustrates the population by religion and sex. Traditionalist recorded the highest
proportion of28.3 percent while other Christians recorded the least with 5.5 percent. Islam recorded
a proportion of 7.9 percent with those and no religion recording a significant proportion of 11.2
percent.
The percentage of male with no religion (12%) is greater than female with no religion (10.5%).It
means that females are highly religious compared to males.
The proportion of males in Islam (8.1%) and tradition (28.8%) as against their female counterparts is
7.6 percent and 27.9 percent.
However, females dominate Catholic, Protestants, Pentecost and other Christians while in Islam it is
the male who dominates.
Finally, there is dominance of Pentecostal\charismatic religion (22.6%) among the Christian group.
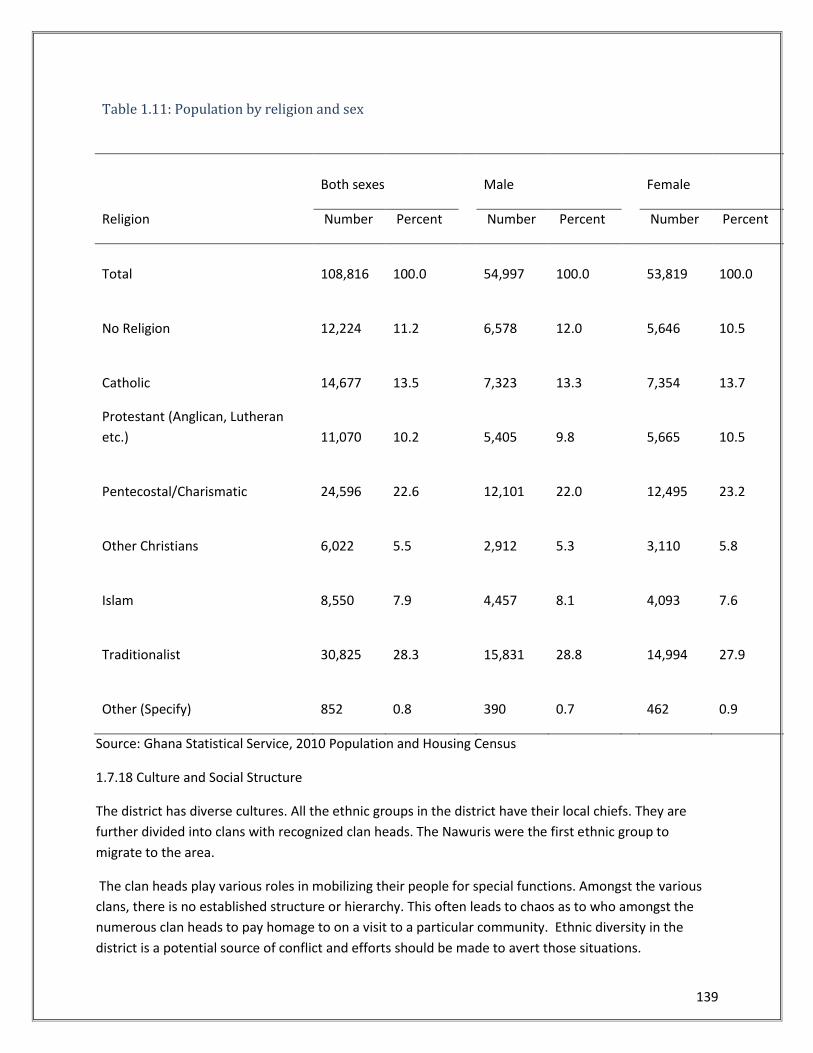
139
Table 1.11: Population by religion and sex
Religion
Both sexes
Male
Female
Number Percent Number Percent Number Percent
Total
108,816
100.0
54,997
100.0
53,819
100.0
No Religion
12,224
11.2
6,578
12.0
5,646
10.5
Catholic
14,677
13.5
7,323
13.3
7,354
13.7
Protestant (Anglican, Lutheran
etc.)
11,070
10.2
5,405
9.8
5,665
10.5
Pentecostal/Charismatic
24,596
22.6
12,101
22.0
12,495
23.2
Other Christians
6,022
5.5
2,912
5.3
3,110
5.8
Islam
8,550
7.9
4,457
8.1
4,093
7.6
Traditionalist
30,825
28.3
15,831
28.8
14,994
27.9
Other (Specify)
852
0.8
390
0.7
462
0.9
Source: Ghana Statistical Service, 2010 Population and Housing Census
1.7.18 Culture and Social Structure
The district has diverse cultures. All the ethnic groups in the district have their local chiefs. They are
further divided into clans with recognized clan heads. The Nawuris were the first ethnic group to
migrate to the area.
The clan heads play various roles in mobilizing their people for special functions. Amongst the various
clans, there is no established structure or hierarchy. This often leads to chaos as to who amongst the
numerous clan heads to pay homage to on a visit to a particular community. Ethnic diversity in the
district is a potential source of conflict and efforts should be made to avert those situations.
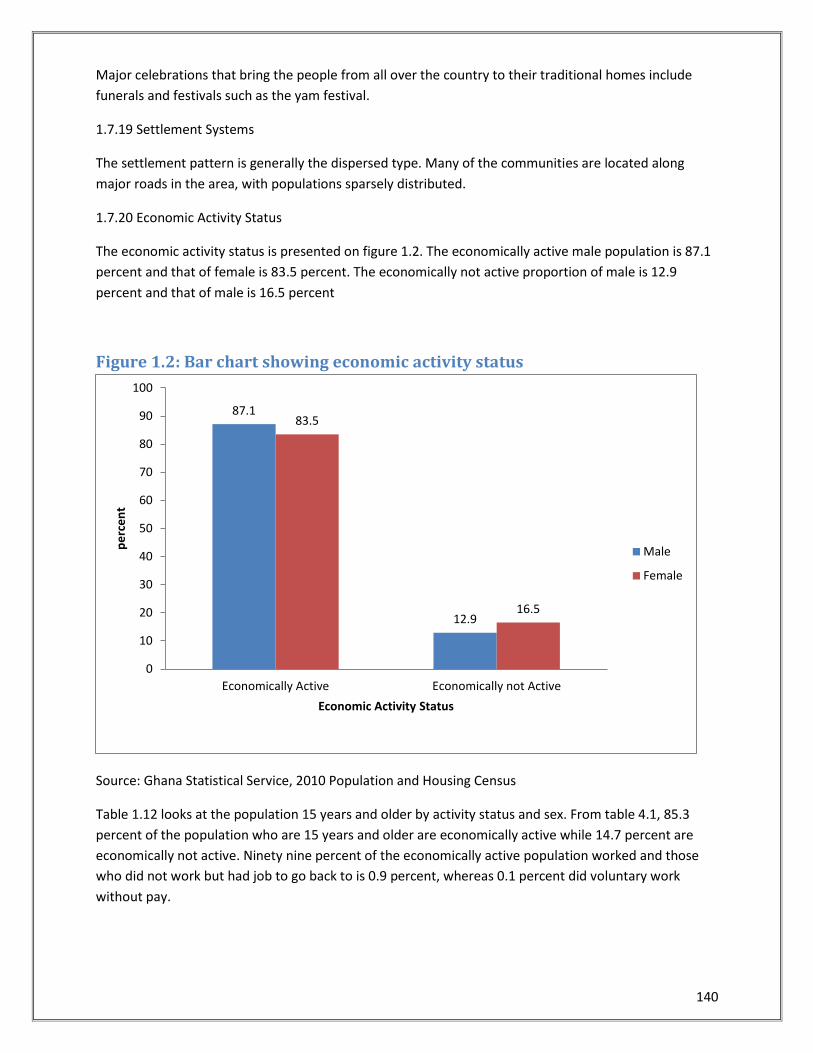
140
Major celebrations that bring the people from all over the country to their traditional homes include
funerals and festivals such as the yam festival.
1.7.19 Settlement Systems
The settlement pattern is generally the dispersed type. Many of the communities are located along
major roads in the area, with populations sparsely distributed.
1.7.20 Economic Activity Status
The economic activity status is presented on figure 1.2. The economically active male population is 87.1
percent and that of female is 83.5 percent. The economically not active proportion of male is 12.9
percent and that of male is 16.5 percent
Figure 1.2: Bar chart showing economic activity status
Source: Ghana Statistical Service, 2010 Population and Housing Census
Table 1.12 looks at the population 15 years and older by activity status and sex. From table 4.1, 85.3
percent of the population who are 15 years and older are economically active while 14.7 percent are
economically not active. Ninety nine percent of the economically active population worked and those
who did not work but had job to go back to is 0.9 percent, whereas 0.1 percent did voluntary work
without pay.
87.1
12.9
83.5
16.5
0
10
20
30
40
50
60
70
80
90
100
Economically Active Economically not Active
pe
rce
nt
Economic Activity Status
Male
Female
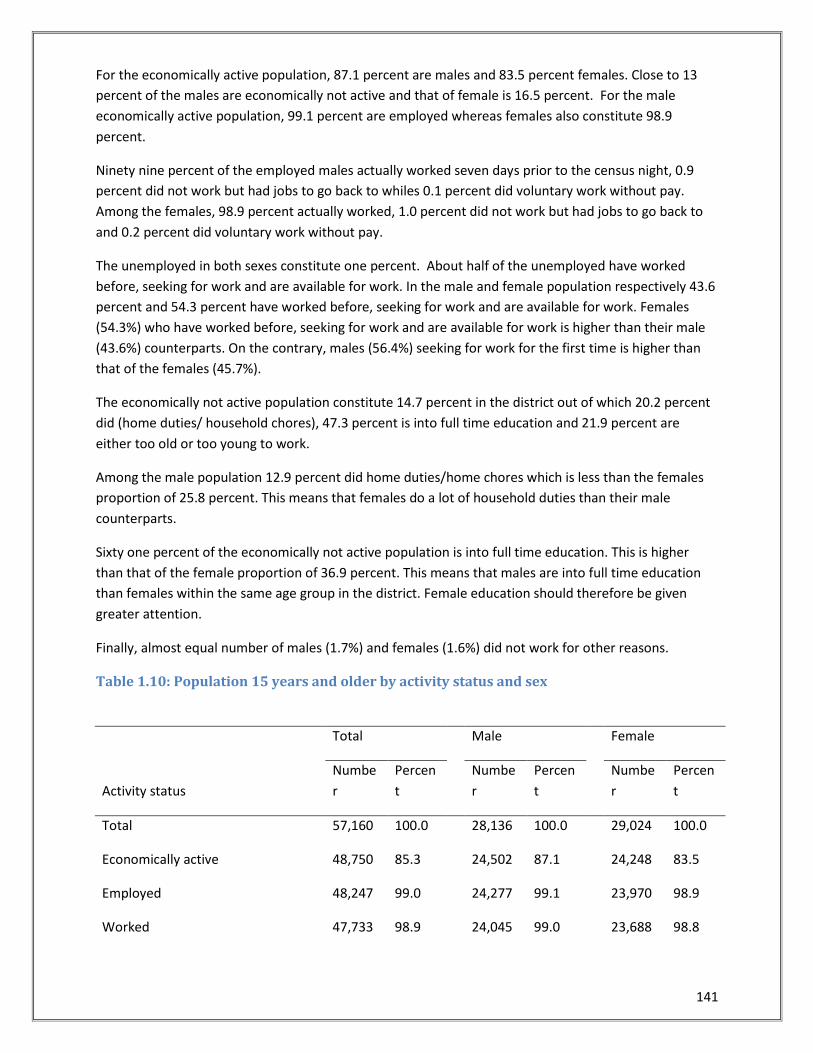
141
For the economically active population, 87.1 percent are males and 83.5 percent females. Close to 13
percent of the males are economically not active and that of female is 16.5 percent. For the male
economically active population, 99.1 percent are employed whereas females also constitute 98.9
percent.
Ninety nine percent of the employed males actually worked seven days prior to the census night, 0.9
percent did not work but had jobs to go back to whiles 0.1 percent did voluntary work without pay.
Among the females, 98.9 percent actually worked, 1.0 percent did not work but had jobs to go back to
and 0.2 percent did voluntary work without pay.
The unemployed in both sexes constitute one percent. About half of the unemployed have worked
before, seeking for work and are available for work. In the male and female population respectively 43.6
percent and 54.3 percent have worked before, seeking for work and are available for work. Females
(54.3%) who have worked before, seeking for work and are available for work is higher than their male
(43.6%) counterparts. On the contrary, males (56.4%) seeking for work for the first time is higher than
that of the females (45.7%).
The economically not active population constitute 14.7 percent in the district out of which 20.2 percent
did (home duties/ household chores), 47.3 percent is into full time education and 21.9 percent are
either too old or too young to work.
Among the male population 12.9 percent did home duties/home chores which is less than the females
proportion of 25.8 percent. This means that females do a lot of household duties than their male
counterparts.
Sixty one percent of the economically not active population is into full time education. This is higher
than that of the female proportion of 36.9 percent. This means that males are into full time education
than females within the same age group in the district. Female education should therefore be given
greater attention.
Finally, almost equal number of males (1.7%) and females (1.6%) did not work for other reasons.
Table 1.10: Population 15 years and older by activity status and sex
Activity status
Total Male Female
Numbe
r
Percen
t
Numbe
r
Percen
t
Numbe
r
Percen
t
Total 57,160 100.0
28,136 100.0
29,024 100.0
Economically active 48,750 85.3
24,502 87.1
24,248 83.5
Employed 48,247 99.0
24,277 99.1
23,970 98.9
Worked 47,733 98.9
24,045 99.0
23,688 98.8
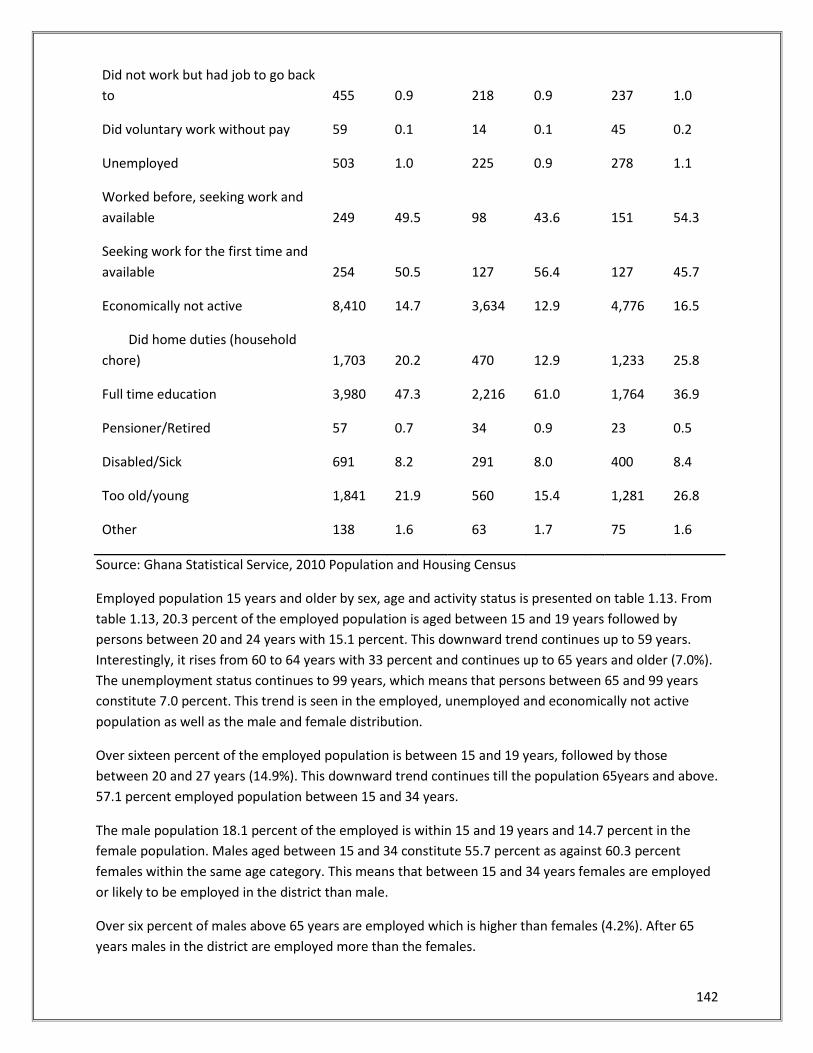
142
Did not work but had job to go back
to 455 0.9
218 0.9
237 1.0
Did voluntary work without pay 59 0.1
14 0.1
45 0.2
Unemployed 503 1.0
225 0.9
278 1.1
Worked before, seeking work and
available 249 49.5
98 43.6
151 54.3
Seeking work for the first time and
available 254 50.5
127 56.4
127 45.7
Economically not active 8,410 14.7
3,634 12.9
4,776 16.5
Did home duties (household
chore) 1,703 20.2
470 12.9
1,233 25.8
Full time education 3,980 47.3
2,216 61.0
1,764 36.9
Pensioner/Retired 57 0.7
34 0.9
23 0.5
Disabled/Sick 691 8.2
291 8.0
400 8.4
Too old/young 1,841 21.9
560 15.4
1,281 26.8
Other 138 1.6 63 1.7 75 1.6
Source: Ghana Statistical Service, 2010 Population and Housing Census
Employed population 15 years and older by sex, age and activity status is presented on table 1.13. From
table 1.13, 20.3 percent of the employed population is aged between 15 and 19 years followed by
persons between 20 and 24 years with 15.1 percent. This downward trend continues up to 59 years.
Interestingly, it rises from 60 to 64 years with 33 percent and continues up to 65 years and older (7.0%).
The unemployment status continues to 99 years, which means that persons between 65 and 99 years
constitute 7.0 percent. This trend is seen in the employed, unemployed and economically not active
population as well as the male and female distribution.
Over sixteen percent of the employed population is between 15 and 19 years, followed by those
between 20 and 27 years (14.9%). This downward trend continues till the population 65years and above.
57.1 percent employed population between 15 and 34 years.
The male population 18.1 percent of the employed is within 15 and 19 years and 14.7 percent in the
female population. Males aged between 15 and 34 constitute 55.7 percent as against 60.3 percent
females within the same age category. This means that between 15 and 34 years females are employed
or likely to be employed in the district than male.
Over six percent of males above 65 years are employed which is higher than females (4.2%). After 65
years males in the district are employed more than the females.
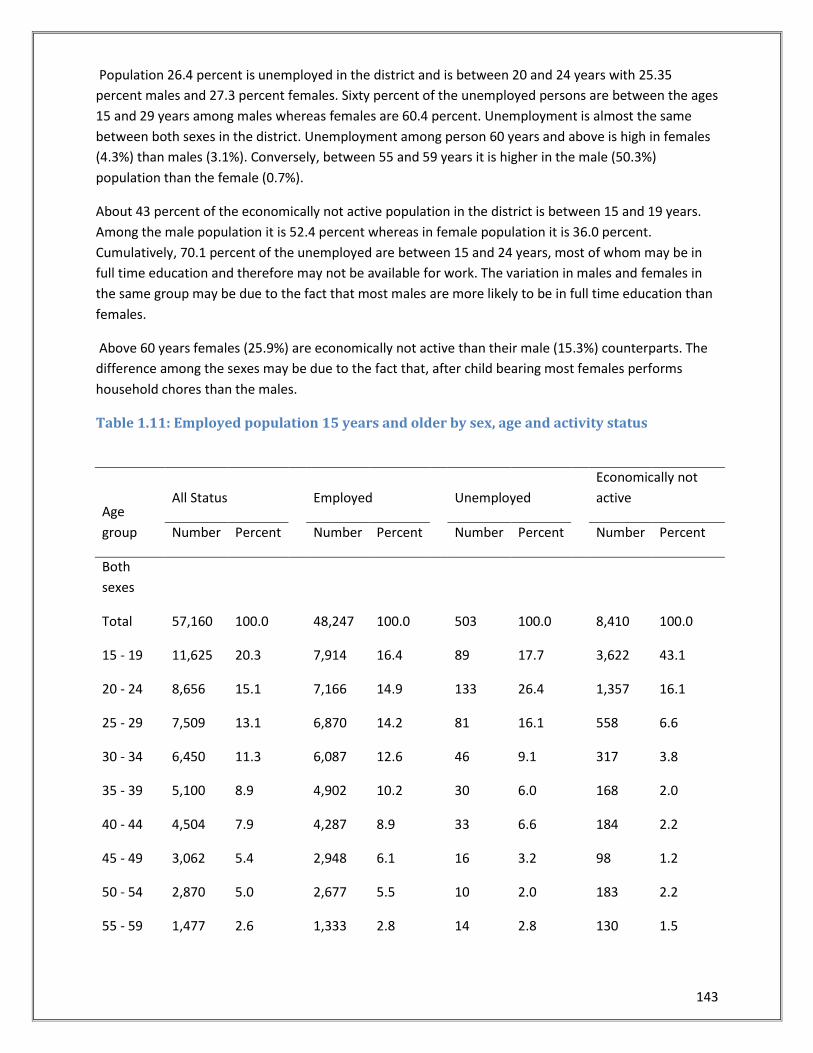
143
Population 26.4 percent is unemployed in the district and is between 20 and 24 years with 25.35
percent males and 27.3 percent females. Sixty percent of the unemployed persons are between the ages
15 and 29 years among males whereas females are 60.4 percent. Unemployment is almost the same
between both sexes in the district. Unemployment among person 60 years and above is high in females
(4.3%) than males (3.1%). Conversely, between 55 and 59 years it is higher in the male (50.3%)
population than the female (0.7%).
About 43 percent of the economically not active population in the district is between 15 and 19 years.
Among the male population it is 52.4 percent whereas in female population it is 36.0 percent.
Cumulatively, 70.1 percent of the unemployed are between 15 and 24 years, most of whom may be in
full time education and therefore may not be available for work. The variation in males and females in
the same group may be due to the fact that most males are more likely to be in full time education than
females.
Above 60 years females (25.9%) are economically not active than their male (15.3%) counterparts. The
difference among the sexes may be due to the fact that, after child bearing most females performs
household chores than the males.
Table 1.11: Employed population 15 years and older by sex, age and activity status
Age
group
All Status Employed Unemployed
Economically not
active
Number Percent Number Percent Number Percent Number Percent
Both
sexes
Total 57,160 100.0
48,247 100.0
503 100.0
8,410 100.0
15 - 19 11,625 20.3
7,914 16.4
89 17.7
3,622 43.1
20 - 24 8,656 15.1
7,166 14.9
133 26.4
1,357 16.1
25 - 29 7,509 13.1
6,870 14.2
81 16.1
558 6.6
30 - 34 6,450 11.3
6,087 12.6
46 9.1
317 3.8
35 - 39 5,100 8.9
4,902 10.2
30 6.0
168 2.0
40 - 44 4,504 7.9
4,287 8.9
33 6.6
184 2.2
45 - 49 3,062 5.4
2,948 6.1
16 3.2
98 1.2
50 - 54 2,870 5.0
2,677 5.5
10 2.0
183 2.2
55 - 59 1,477 2.6
1,333 2.8
14 2.8
130 1.5
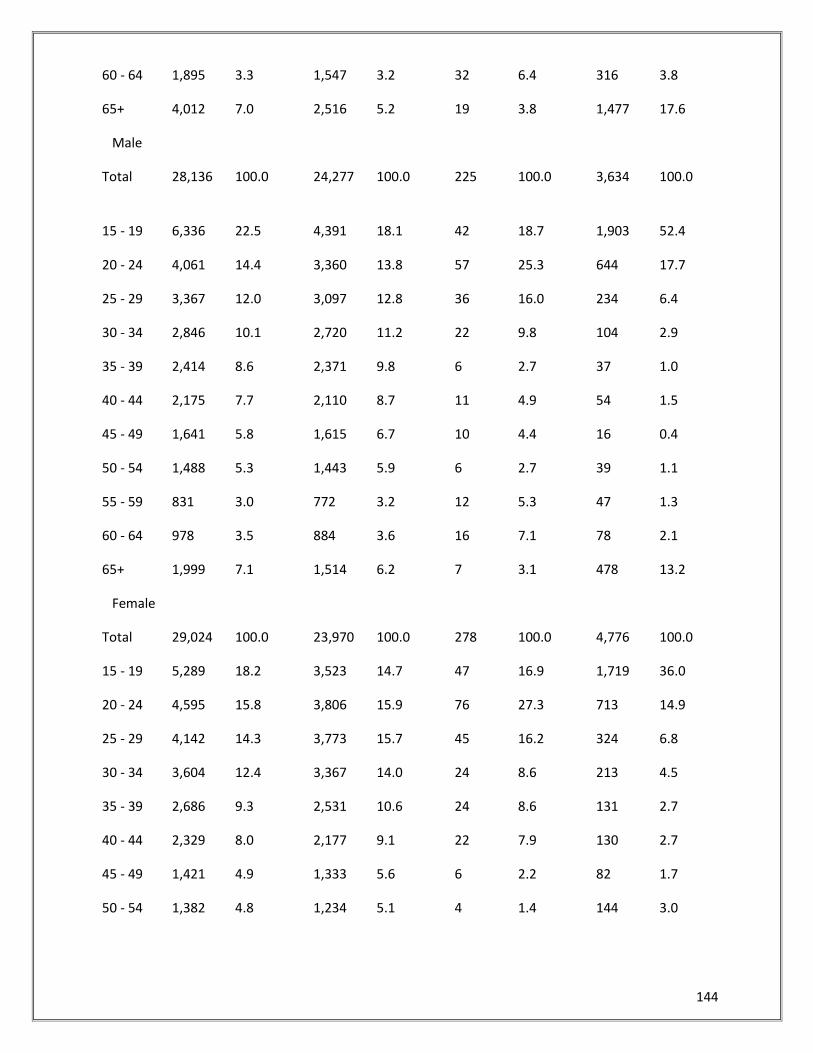
144
60 - 64 1,895 3.3
1,547 3.2
32 6.4
316 3.8
65+ 4,012 7.0
2,516 5.2
19 3.8
1,477 17.6
Male
Total 28,136 100.0
24,277 100.0
225 100.0
3,634 100.0
15 - 19
6,336 22.5
4,391 18.1
42 18.7
1,903 52.4
20 - 24 4,061 14.4
3,360 13.8
57 25.3
644 17.7
25 - 29 3,367 12.0
3,097 12.8
36 16.0
234 6.4
30 - 34 2,846 10.1
2,720 11.2
22 9.8
104 2.9
35 - 39 2,414 8.6
2,371 9.8
6 2.7
37 1.0
40 - 44 2,175 7.7
2,110 8.7
11 4.9
54 1.5
45 - 49 1,641 5.8
1,615 6.7
10 4.4
16 0.4
50 - 54 1,488 5.3
1,443 5.9
6 2.7
39 1.1
55 - 59 831 3.0
772 3.2
12 5.3
47 1.3
60 - 64 978 3.5
884 3.6
16 7.1
78 2.1
65+ 1,999 7.1
1,514 6.2
7 3.1
478 13.2
Female
Total 29,024 100.0
23,970 100.0
278 100.0
4,776 100.0
15 - 19 5,289 18.2
3,523 14.7
47 16.9
1,719 36.0
20 - 24 4,595 15.8
3,806 15.9
76 27.3
713 14.9
25 - 29 4,142 14.3
3,773 15.7
45 16.2
324 6.8
30 - 34 3,604 12.4
3,367 14.0
24 8.6
213 4.5
35 - 39 2,686 9.3
2,531 10.6
24 8.6
131 2.7
40 - 44 2,329 8.0
2,177 9.1
22 7.9
130 2.7
45 - 49 1,421 4.9
1,333 5.6
6 2.2
82 1.7
50 - 54 1,382 4.8
1,234 5.1
4 1.4
144 3.0
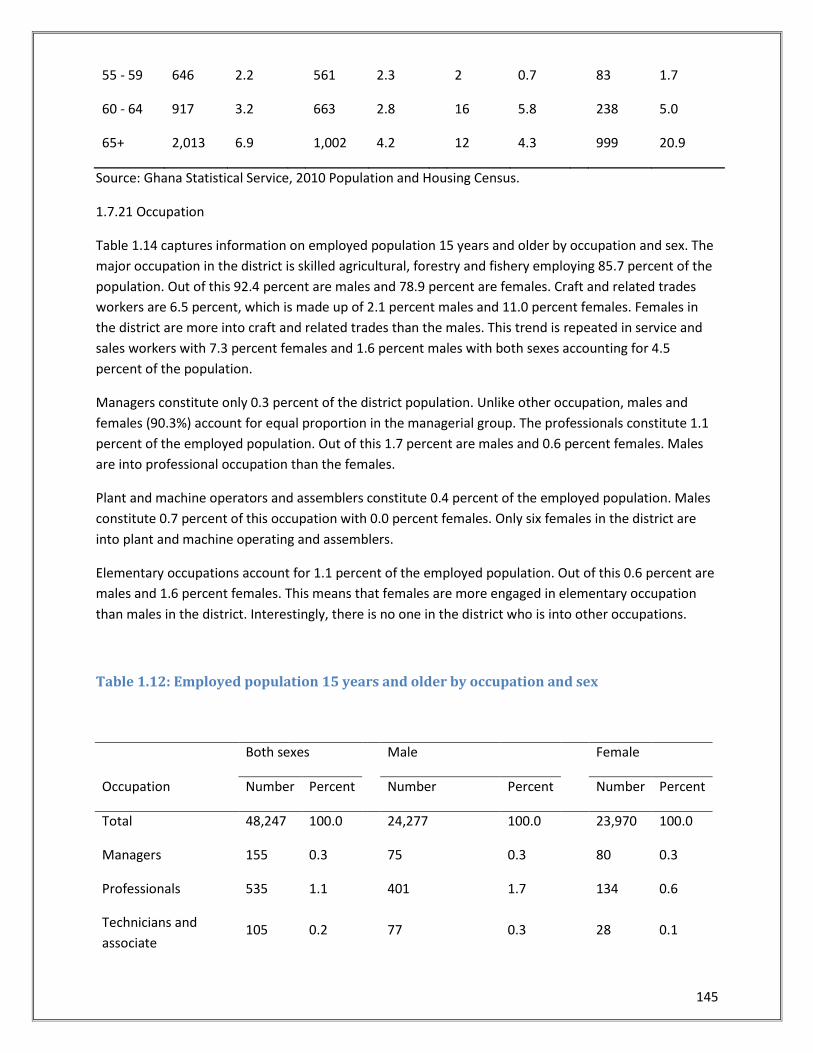
145
55 - 59 646 2.2
561 2.3
2 0.7
83 1.7
60 - 64 917 3.2
663 2.8
16 5.8
238 5.0
65+ 2,013 6.9 1,002 4.2 12 4.3 999 20.9
Source: Ghana Statistical Service, 2010 Population and Housing Census.
1.7.21 Occupation
Table 1.14 captures information on employed population 15 years and older by occupation and sex. The
major occupation in the district is skilled agricultural, forestry and fishery employing 85.7 percent of the
population. Out of this 92.4 percent are males and 78.9 percent are females. Craft and related trades
workers are 6.5 percent, which is made up of 2.1 percent males and 11.0 percent females. Females in
the district are more into craft and related trades than the males. This trend is repeated in service and
sales workers with 7.3 percent females and 1.6 percent males with both sexes accounting for 4.5
percent of the population.
Managers constitute only 0.3 percent of the district population. Unlike other occupation, males and
females (90.3%) account for equal proportion in the managerial group. The professionals constitute 1.1
percent of the employed population. Out of this 1.7 percent are males and 0.6 percent females. Males
are into professional occupation than the females.
Plant and machine operators and assemblers constitute 0.4 percent of the employed population. Males
constitute 0.7 percent of this occupation with 0.0 percent females. Only six females in the district are
into plant and machine operating and assemblers.
Elementary occupations account for 1.1 percent of the employed population. Out of this 0.6 percent are
males and 1.6 percent females. This means that females are more engaged in elementary occupation
than males in the district. Interestingly, there is no one in the district who is into other occupations.
Table 1.12: Employed population 15 years and older by occupation and sex
Occupation
Both sexes
Male
Female
Number Percent Number Percent Number Percent
Total 48,247 100.0
24,277 100.0
23,970 100.0
Managers 155 0.3
75 0.3
80 0.3
Professionals 535 1.1
401 1.7
134 0.6
Technicians and
associate 105 0.2
77 0.3
28 0.1
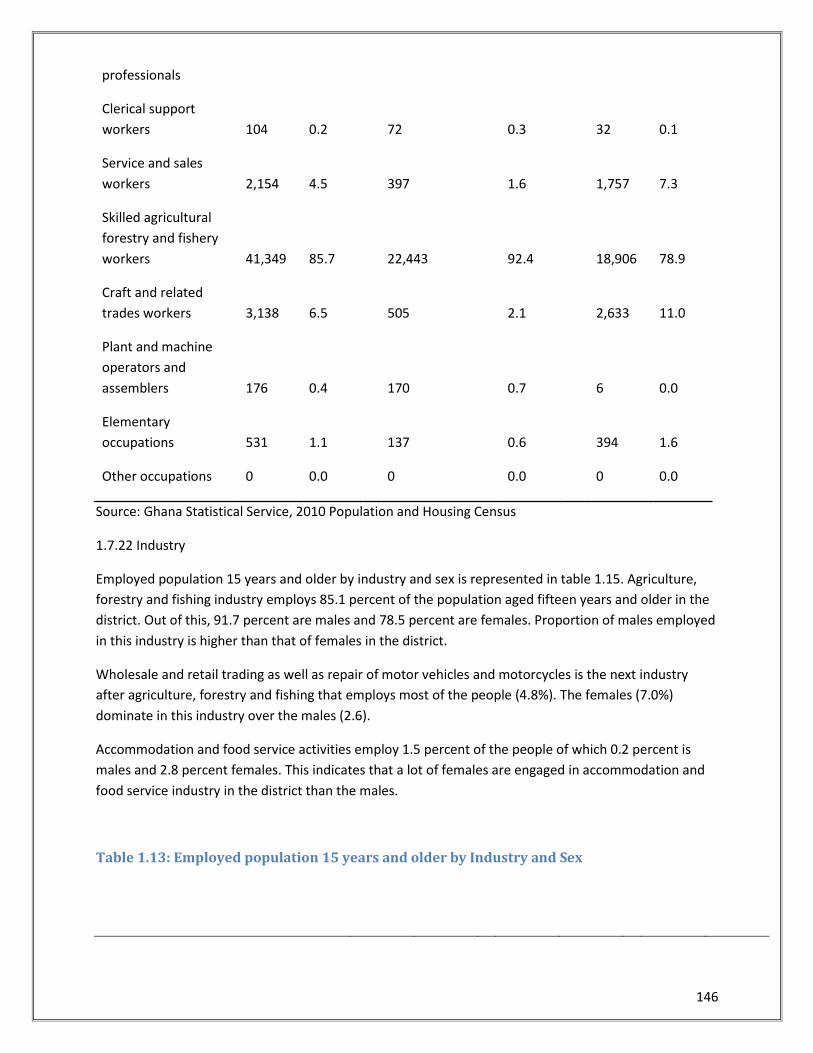
146
professionals
Clerical support
workers 104 0.2
72 0.3
32 0.1
Service and sales
workers 2,154 4.5
397 1.6
1,757 7.3
Skilled agricultural
forestry and fishery
workers 41,349 85.7
22,443 92.4
18,906 78.9
Craft and related
trades workers 3,138 6.5
505 2.1
2,633 11.0
Plant and machine
operators and
assemblers 176 0.4
170 0.7
6 0.0
Elementary
occupations 531 1.1
137 0.6
394 1.6
Other occupations 0 0.0 0 0.0 0 0.0
Source: Ghana Statistical Service, 2010 Population and Housing Census
1.7.22 Industry
Employed population 15 years and older by industry and sex is represented in table 1.15. Agriculture,
forestry and fishing industry employs 85.1 percent of the population aged fifteen years and older in the
district. Out of this, 91.7 percent are males and 78.5 percent are females. Proportion of males employed
in this industry is higher than that of females in the district.
Wholesale and retail trading as well as repair of motor vehicles and motorcycles is the next industry
after agriculture, forestry and fishing that employs most of the people (4.8%). The females (7.0%)
dominate in this industry over the males (2.6).
Accommodation and food service activities employ 1.5 percent of the people of which 0.2 percent is
males and 2.8 percent females. This indicates that a lot of females are engaged in accommodation and
food service industry in the district than the males.
Table 1.13: Employed population 15 years and older by Industry and Sex
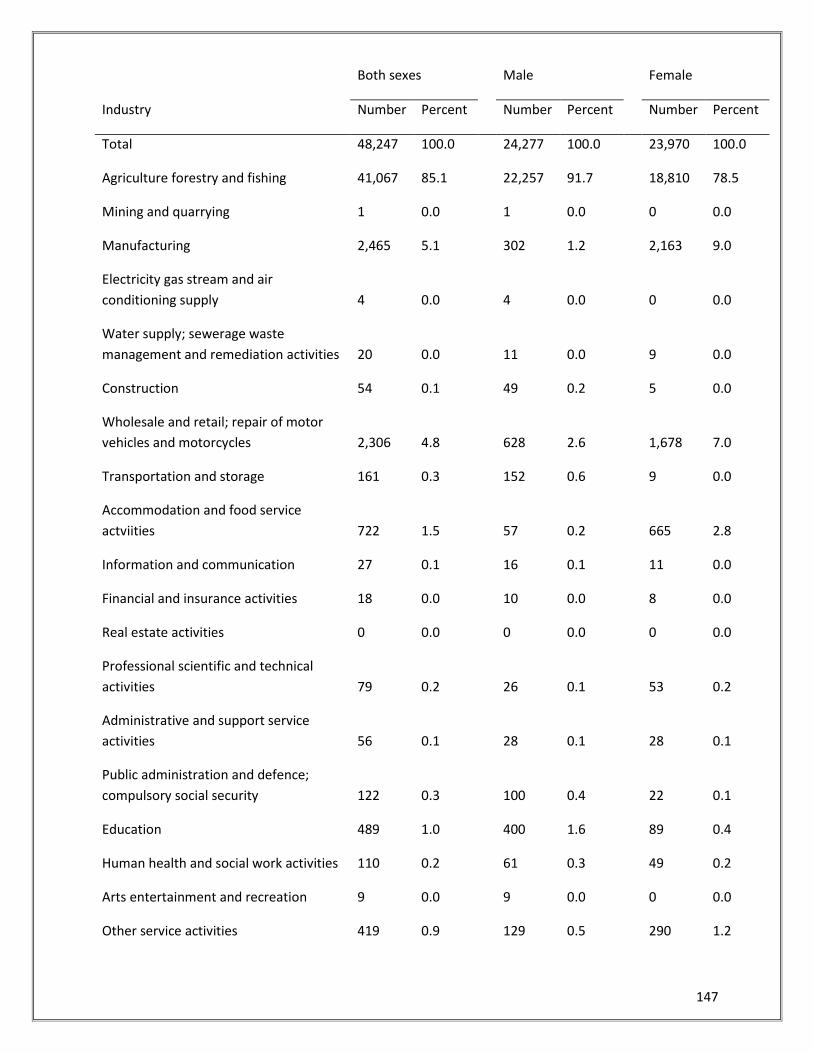
147
Industry
Both sexes
Male
Female
Number Percent Number Percent Number Percent
Total 48,247 100.0
24,277 100.0
23,970 100.0
Agriculture forestry and fishing 41,067 85.1
22,257 91.7
18,810 78.5
Mining and quarrying 1 0.0
1 0.0
0 0.0
Manufacturing 2,465 5.1
302 1.2
2,163 9.0
Electricity gas stream and air
conditioning supply 4 0.0
4 0.0
0 0.0
Water supply; sewerage waste
management and remediation activities 20 0.0
11 0.0
9 0.0
Construction 54 0.1
49 0.2
5 0.0
Wholesale and retail; repair of motor
vehicles and motorcycles 2,306 4.8
628 2.6
1,678 7.0
Transportation and storage 161 0.3
152 0.6
9 0.0
Accommodation and food service
actviities 722 1.5
57 0.2
665 2.8
Information and communication 27 0.1
16 0.1
11 0.0
Financial and insurance activities 18 0.0
10 0.0
8 0.0
Real estate activities 0 0.0
0 0.0
0 0.0
Professional scientific and technical
activities 79 0.2
26 0.1
53 0.2
Administrative and support service
activities 56 0.1
28 0.1
28 0.1
Public administration and defence;
compulsory social security 122 0.3
100 0.4
22 0.1
Education 489 1.0
400 1.6
89 0.4
Human health and social work activities 110 0.2
61 0.3
49 0.2
Arts entertainment and recreation 9 0.0
9 0.0
0 0.0
Other service activities 419 0.9
129 0.5
290 1.2
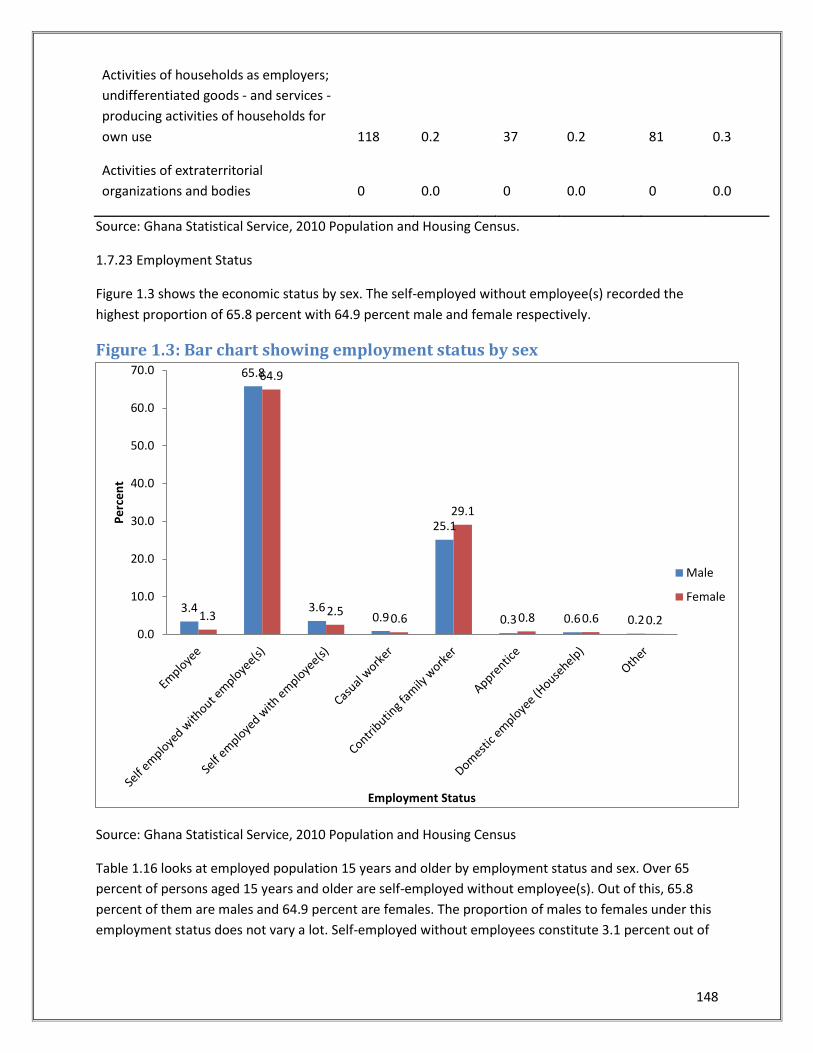
148
Activities of households as employers;
undifferentiated goods - and services -
producing activities of households for
own use 118 0.2
37 0.2
81 0.3
Activities of extraterritorial
organizations and bodies 0 0.0 0 0.0 0 0.0
Source: Ghana Statistical Service, 2010 Population and Housing Census.
1.7.23 Employment Status
Figure 1.3 shows the economic status by sex. The self-employed without employee(s) recorded the
highest proportion of 65.8 percent with 64.9 percent male and female respectively.
Figure 1.3: Bar chart showing employment status by sex
Source: Ghana Statistical Service, 2010 Population and Housing Census
Table 1.16 looks at employed population 15 years and older by employment status and sex. Over 65
percent of persons aged 15 years and older are self-employed without employee(s). Out of this, 65.8
percent of them are males and 64.9 percent are females. The proportion of males to females under this
employment status does not vary a lot. Self-employed without employees constitute 3.1 percent out of
3.4
65.8
3.6 0.9
25.1
0.3 0.6 0.2 1.3
64.9
2.5 0.6
29.1
0.8 0.6 0.2 0.0
10.0
20.0
30.0
40.0
50.0
60.0
70.0
Pe
rce
nt
Employment Status
Male
Female
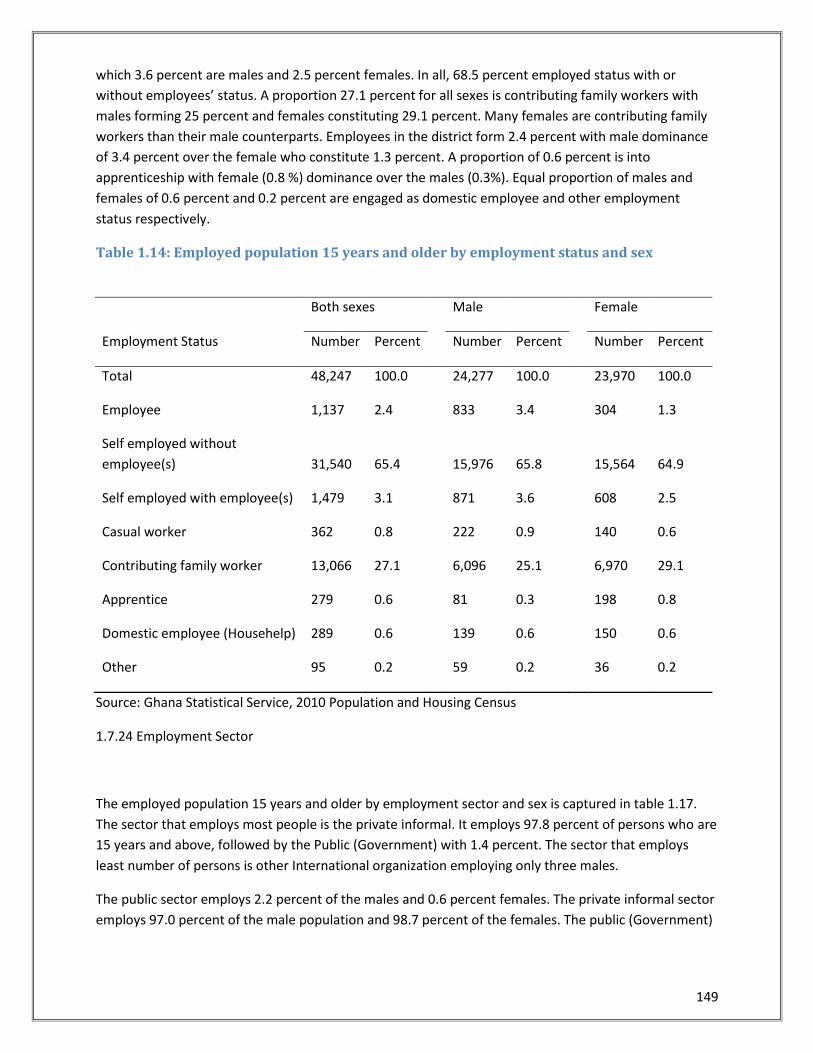
149
which 3.6 percent are males and 2.5 percent females. In all, 68.5 percent employed status with or
without employees’ status. A proportion 27.1 percent for all sexes is contributing family workers with
males forming 25 percent and females constituting 29.1 percent. Many females are contributing family
workers than their male counterparts. Employees in the district form 2.4 percent with male dominance
of 3.4 percent over the female who constitute 1.3 percent. A proportion of 0.6 percent is into
apprenticeship with female (0.8 %) dominance over the males (0.3%). Equal proportion of males and
females of 0.6 percent and 0.2 percent are engaged as domestic employee and other employment
status respectively.
Table 1.14: Employed population 15 years and older by employment status and sex
Employment Status
Both sexes
Male
Female
Number Percent Number Percent Number Percent
Total 48,247 100.0
24,277 100.0
23,970 100.0
Employee 1,137 2.4
833 3.4
304 1.3
Self employed without
employee(s) 31,540 65.4
15,976 65.8
15,564 64.9
Self employed with employee(s) 1,479 3.1
871 3.6
608 2.5
Casual worker 362 0.8
222 0.9
140 0.6
Contributing family worker 13,066 27.1
6,096 25.1
6,970 29.1
Apprentice 279 0.6
81 0.3
198 0.8
Domestic employee (Househelp) 289 0.6
139 0.6
150 0.6
Other 95 0.2 59 0.2 36 0.2
Source: Ghana Statistical Service, 2010 Population and Housing Census
1.7.24 Employment Sector
The employed population 15 years and older by employment sector and sex is captured in table 1.17.
The sector that employs most people is the private informal. It employs 97.8 percent of persons who are
15 years and above, followed by the Public (Government) with 1.4 percent. The sector that employs
least number of persons is other International organization employing only three males.
The public sector employs 2.2 percent of the males and 0.6 percent females. The private informal sector
employs 97.0 percent of the male population and 98.7 percent of the females. The public (Government)
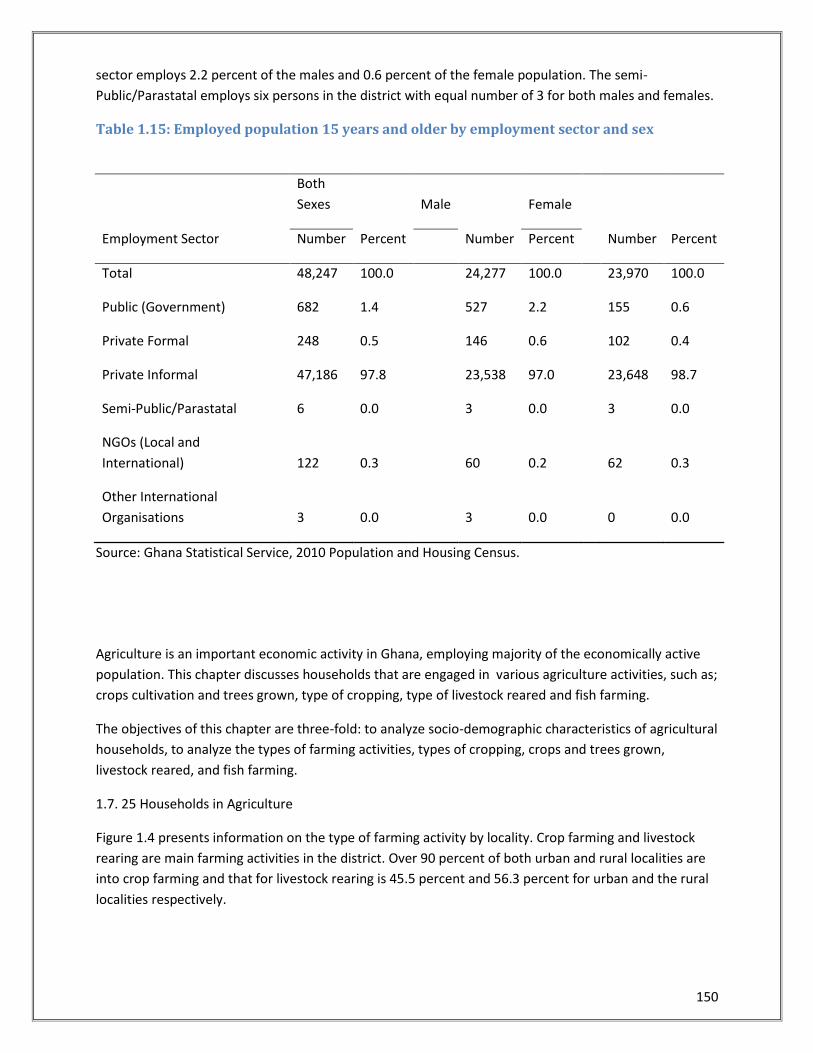
150
sector employs 2.2 percent of the males and 0.6 percent of the female population. The semi-
Public/Parastatal employs six persons in the district with equal number of 3 for both males and females.
Table 1.15: Employed population 15 years and older by employment sector and sex
Employment Sector
Both
Sexes
Male
Female
Number Percent Number Percent Number Percent
Total 48,247 100.0
24,277 100.0
23,970 100.0
Public (Government) 682 1.4
527 2.2
155 0.6
Private Formal 248 0.5
146 0.6
102 0.4
Private Informal 47,186 97.8
23,538 97.0
23,648 98.7
Semi-Public/Parastatal 6 0.0
3 0.0
3 0.0
NGOs (Local and
International) 122 0.3
60 0.2
62 0.3
Other International
Organisations 3 0.0 3 0.0 0 0.0
Source: Ghana Statistical Service, 2010 Population and Housing Census.
Agriculture is an important economic activity in Ghana, employing majority of the economically active
population. This chapter discusses households that are engaged in various agriculture activities, such as;
crops cultivation and trees grown, type of cropping, type of livestock reared and fish farming.
The objectives of this chapter are three-fold: to analyze socio-demographic characteristics of agricultural
households, to analyze the types of farming activities, types of cropping, crops and trees grown,
livestock reared, and fish farming.
1.7. 25 Households in Agriculture
Figure 1.4 presents information on the type of farming activity by locality. Crop farming and livestock
rearing are main farming activities in the district. Over 90 percent of both urban and rural localities are
into crop farming and that for livestock rearing is 45.5 percent and 56.3 percent for urban and the rural
localities respectively.
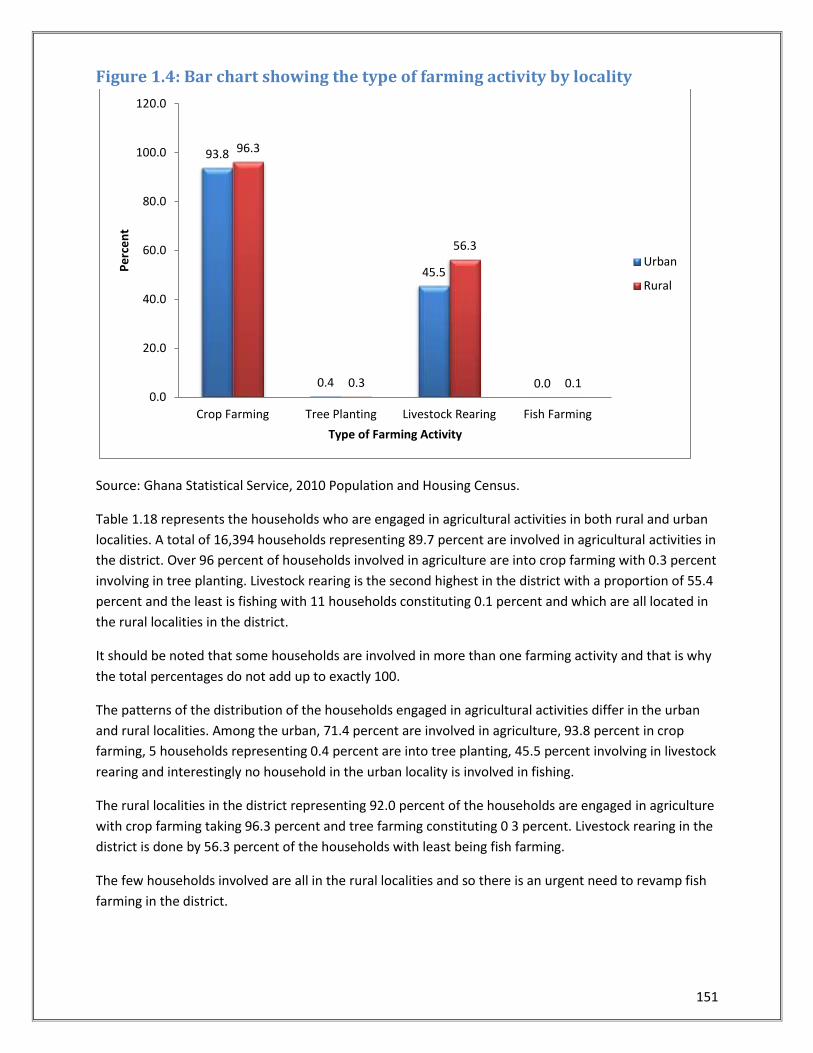
151
Figure 1.4: Bar chart showing the type of farming activity by locality
Source: Ghana Statistical Service, 2010 Population and Housing Census.
Table 1.18 represents the households who are engaged in agricultural activities in both rural and urban
localities. A total of 16,394 households representing 89.7 percent are involved in agricultural activities in
the district. Over 96 percent of households involved in agriculture are into crop farming with 0.3 percent
involving in tree planting. Livestock rearing is the second highest in the district with a proportion of 55.4
percent and the least is fishing with 11 households constituting 0.1 percent and which are all located in
the rural localities in the district.
It should be noted that some households are involved in more than one farming activity and that is why
the total percentages do not add up to exactly 100.
The patterns of the distribution of the households engaged in agricultural activities differ in the urban
and rural localities. Among the urban, 71.4 percent are involved in agriculture, 93.8 percent in crop
farming, 5 households representing 0.4 percent are into tree planting, 45.5 percent involving in livestock
rearing and interestingly no household in the urban locality is involved in fishing.
The rural localities in the district representing 92.0 percent of the households are engaged in agriculture
with crop farming taking 96.3 percent and tree farming constituting 0 3 percent. Livestock rearing in the
district is done by 56.3 percent of the households with least being fish farming.
The few households involved are all in the rural localities and so there is an urgent need to revamp fish
farming in the district.
93.8
0.4
45.5
0.0
96.3
0.3
56.3
0.1 0.0
20.0
40.0
60.0
80.0
100.0
120.0
Crop Farming Tree Planting Livestock Rearing Fish Farming
Pe
rce
nt
Type of Farming Activity
Urban
Rural
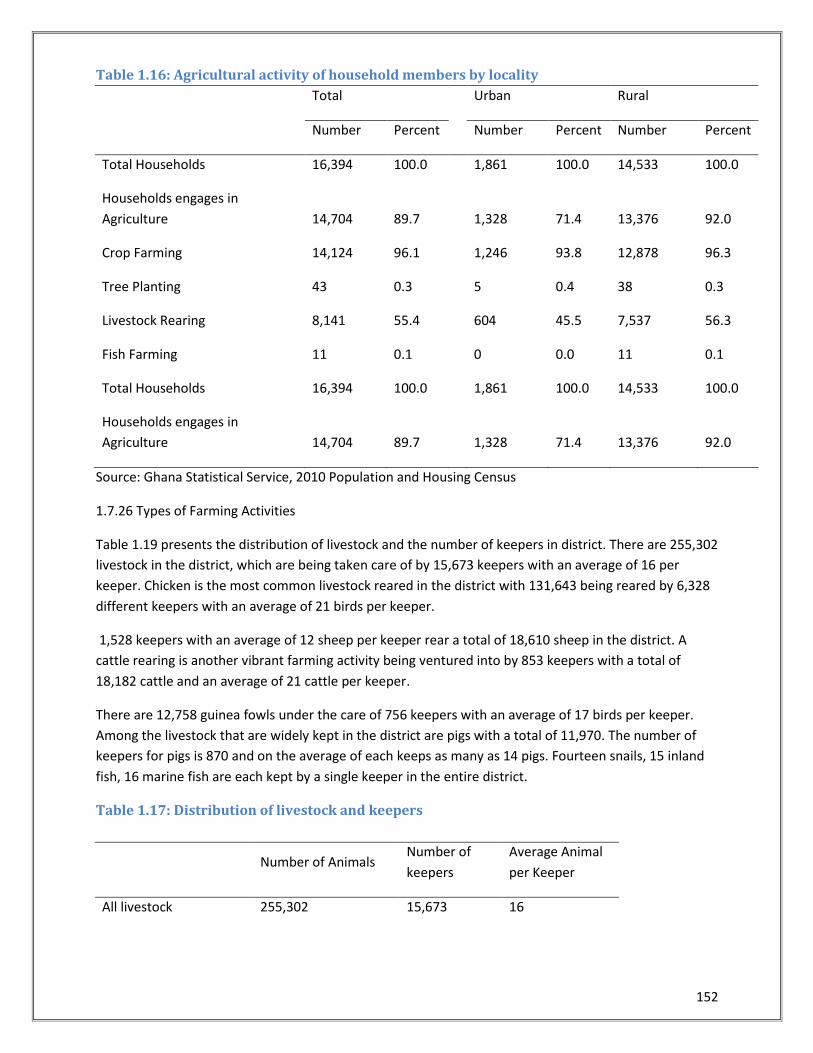
152
Table 1.16: Agricultural activity of household members by locality
Total Urban Rural
Number Percent Number Percent Number Percent
Total Households 16,394 100.0
1,861 100.0 14,533 100.0
Households engages in
Agriculture 14,704 89.7
1,328 71.4 13,376 92.0
Crop Farming 14,124 96.1
1,246 93.8 12,878 96.3
Tree Planting 43 0.3
5 0.4 38 0.3
Livestock Rearing 8,141 55.4
604 45.5 7,537 56.3
Fish Farming 11 0.1 0 0.0 11 0.1
Total Households 16,394 100.0
1,861 100.0 14,533 100.0
Households engages in
Agriculture 14,704 89.7
1,328 71.4 13,376 92.0
Source: Ghana Statistical Service, 2010 Population and Housing Census
1.7.26 Types of Farming Activities
Table 1.19 presents the distribution of livestock and the number of keepers in district. There are 255,302
livestock in the district, which are being taken care of by 15,673 keepers with an average of 16 per
keeper. Chicken is the most common livestock reared in the district with 131,643 being reared by 6,328
different keepers with an average of 21 birds per keeper.
1,528 keepers with an average of 12 sheep per keeper rear a total of 18,610 sheep in the district. A
cattle rearing is another vibrant farming activity being ventured into by 853 keepers with a total of
18,182 cattle and an average of 21 cattle per keeper.
There are 12,758 guinea fowls under the care of 756 keepers with an average of 17 birds per keeper.
Among the livestock that are widely kept in the district are pigs with a total of 11,970. The number of
keepers for pigs is 870 and on the average of each keeps as many as 14 pigs. Fourteen snails, 15 inland
fish, 16 marine fish are each kept by a single keeper in the entire district.
Table 1.17: Distribution of livestock and keepers
Number of Animals
Number of
keepers
Average Animal
per Keeper
All livestock 255,302 15,673 16
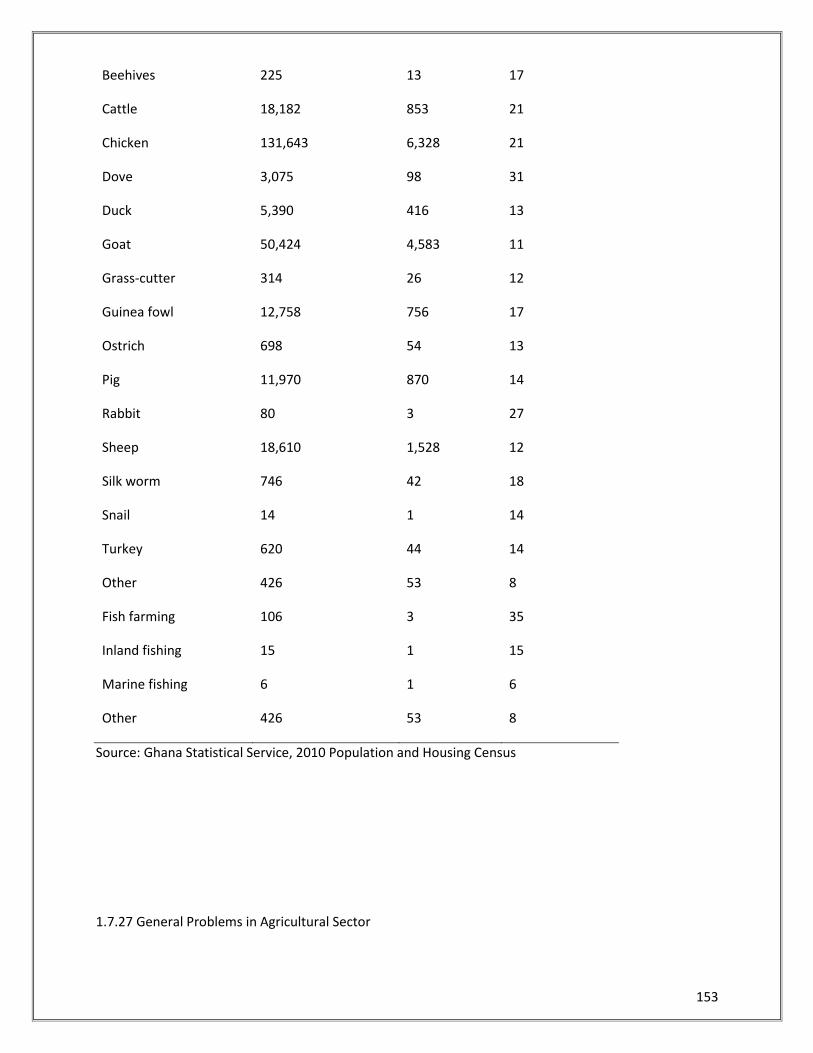
153
Beehives 225 13 17
Cattle 18,182 853 21
Chicken 131,643 6,328 21
Dove 3,075 98 31
Duck 5,390 416 13
Goat 50,424 4,583 11
Grass-cutter 314 26 12
Guinea fowl 12,758 756 17
Ostrich 698 54 13
Pig 11,970 870 14
Rabbit 80 3 27
Sheep 18,610 1,528 12
Silk worm 746 42 18
Snail 14 1 14
Turkey 620 44 14
Other 426 53 8
Fish farming 106 3 35
Inland fishing 15 1 15
Marine fishing 6 1 6
Other 426 53 8
Source: Ghana Statistical Service, 2010 Population and Housing Census
1.7.27 General Problems in Agricultural Sector
154
The major problems confronting agricultural development in the District include the following:
Crop farming
High farmer AEA ratio
Inadequate tractors for mechanization
Low use of quality and improved seeds
Misuse and abuse of agro-chemicals
Bad access roads linking farm settlements to market centres
Over reliance on rain fed agriculture
Lack of appropriate storage facilities
Low farm gate prices
Perennial bush burning
High cost of agricultural inputs
Inadequate micro credit facilities
1.7.28 Housing Stock
Table 1.20 indicates the stock of houses and households in the district, the spread of the population and
their distribution among the rural and urban localities.
The district has a total population of 108,816 out of which 10,824 reside in the urban localities and
96,992 reside in the rural localities.
The population living in households in the district is 107,598 leaving the remaining 1,218 as non-
household population. The household population in the urban localities are 10, 594 and non-household
population are 230. The rural households in the district are 97,004 and a non-household population is
988. This means that a total of 1,448 are non-household population, with majority of them found in
urban localities in the district.
There are 13,931 houses in the district with 1,523 of them found among the urban localities and 12,408
in rural. This means that majority of the houses (12,408) are located in the rural localities than the
urban. The number of individual households in the district is 16,394. Out of which, 1,861 are urbanized
and 14,533 rural.
The average household per house in the district is 1.2 for both urban and a rural locality, which is not
different from the regional figure of 1.2.This, suggests that there are fewer households per house in the
district than the national average of 1.6.
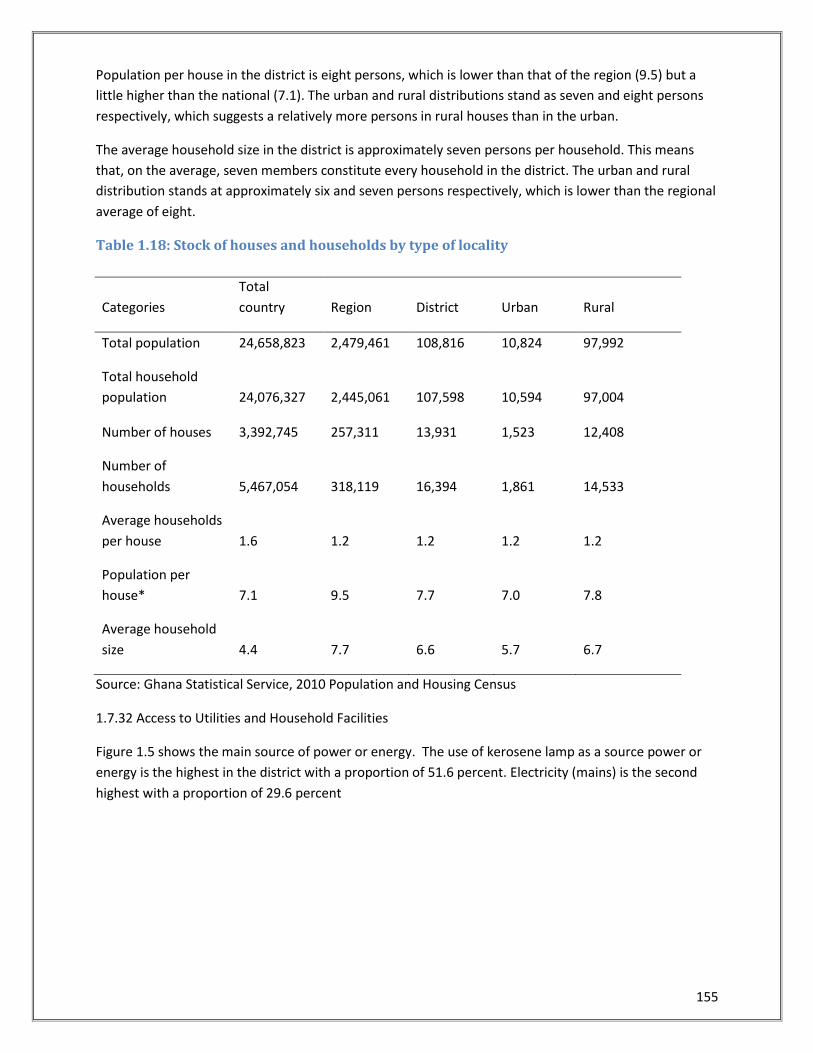
155
Population per house in the district is eight persons, which is lower than that of the region (9.5) but a
little higher than the national (7.1). The urban and rural distributions stand as seven and eight persons
respectively, which suggests a relatively more persons in rural houses than in the urban.
The average household size in the district is approximately seven persons per household. This means
that, on the average, seven members constitute every household in the district. The urban and rural
distribution stands at approximately six and seven persons respectively, which is lower than the regional
average of eight.
Table 1.18: Stock of houses and households by type of locality
Categories
Total
country Region District Urban Rural
Total population 24,658,823 2,479,461 108,816 10,824 97,992
Total household
population 24,076,327 2,445,061 107,598 10,594 97,004
Number of houses 3,392,745 257,311 13,931 1,523 12,408
Number of
households 5,467,054 318,119 16,394 1,861 14,533
Average households
per house
1.6
1.2
1.2
1.2
1.2
Population per
house*
7.1
9.5
7.7
7.0
7.8
Average household
size
4.4
7.7
6.6
5.7
6.7
Source: Ghana Statistical Service, 2010 Population and Housing Census
1.7.32 Access to Utilities and Household Facilities
Figure 1.5 shows the main source of power or energy. The use of kerosene lamp as a source power or
energy is the highest in the district with a proportion of 51.6 percent. Electricity (mains) is the second
highest with a proportion of 29.6 percent
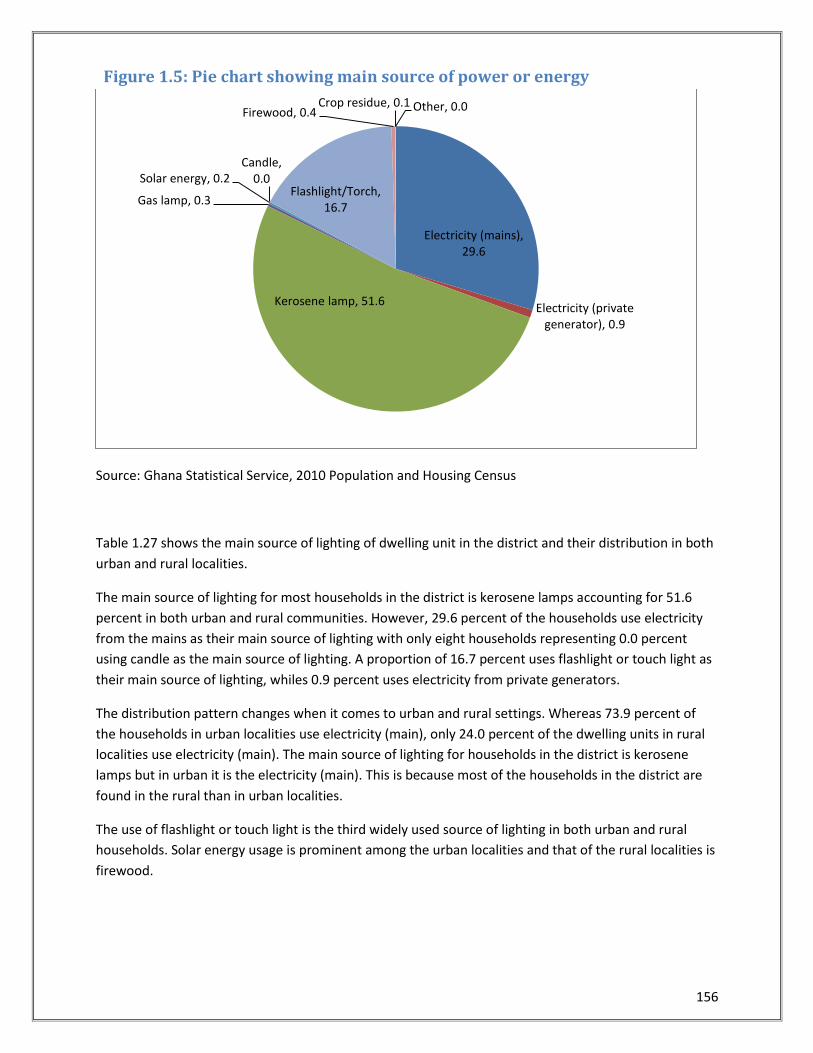
156
Figure 1.5: Pie chart showing main source of power or energy
Source: Ghana Statistical Service, 2010 Population and Housing Census
Table 1.27 shows the main source of lighting of dwelling unit in the district and their distribution in both
urban and rural localities.
The main source of lighting for most households in the district is kerosene lamps accounting for 51.6
percent in both urban and rural communities. However, 29.6 percent of the households use electricity
from the mains as their main source of lighting with only eight households representing 0.0 percent
using candle as the main source of lighting. A proportion of 16.7 percent uses flashlight or touch light as
their main source of lighting, whiles 0.9 percent uses electricity from private generators.
The distribution pattern changes when it comes to urban and rural settings. Whereas 73.9 percent of
the households in urban localities use electricity (main), only 24.0 percent of the dwelling units in rural
localities use electricity (main). The main source of lighting for households in the district is kerosene
lamps but in urban it is the electricity (main). This is because most of the households in the district are
found in the rural than in urban localities.
The use of flashlight or touch light is the third widely used source of lighting in both urban and rural
households. Solar energy usage is prominent among the urban localities and that of the rural localities is
firewood.
Electricity (mains), 29.6
Electricity (private generator), 0.9
Kerosene lamp, 51.6
Gas lamp, 0.3
Solar energy, 0.2 Candle,
0.0 Flashlight/Torch,
16.7
Firewood, 0.4 Crop residue, 0.1 Other, 0.0
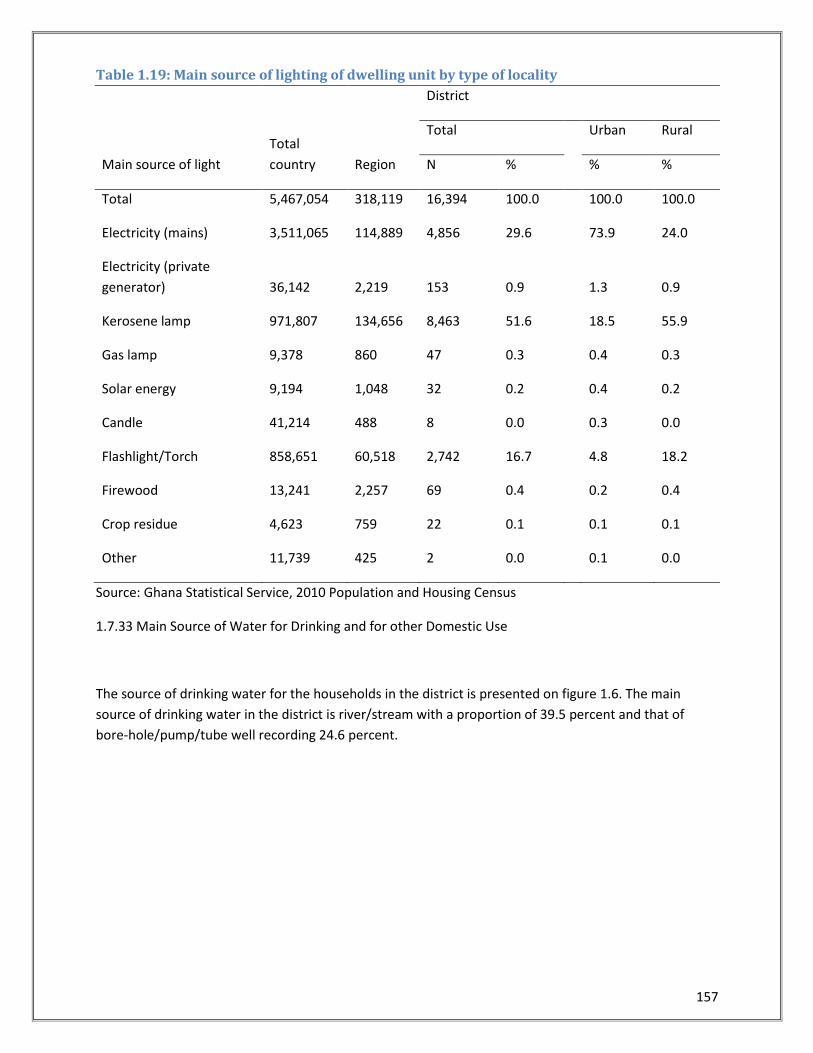
157
Table 1.19: Main source of lighting of dwelling unit by type of locality
Main source of light
Total
country Region
District
Total
Urban Rural
N % % %
Total 5,467,054 318,119 16,394 100.0
100.0 100.0
Electricity (mains) 3,511,065 114,889 4,856 29.6
73.9 24.0
Electricity (private
generator) 36,142 2,219 153 0.9
1.3 0.9
Kerosene lamp 971,807 134,656 8,463 51.6
18.5 55.9
Gas lamp 9,378 860 47 0.3
0.4 0.3
Solar energy 9,194 1,048 32 0.2
0.4 0.2
Candle 41,214 488 8 0.0
0.3 0.0
Flashlight/Torch 858,651 60,518 2,742 16.7
4.8 18.2
Firewood 13,241 2,257 69 0.4
0.2 0.4
Crop residue 4,623 759 22 0.1
0.1 0.1
Other 11,739 425 2 0.0 0.1 0.0
Source: Ghana Statistical Service, 2010 Population and Housing Census
1.7.33 Main Source of Water for Drinking and for other Domestic Use
The source of drinking water for the households in the district is presented on figure 1.6. The main
source of drinking water in the district is river/stream with a proportion of 39.5 percent and that of
bore-hole/pump/tube well recording 24.6 percent.
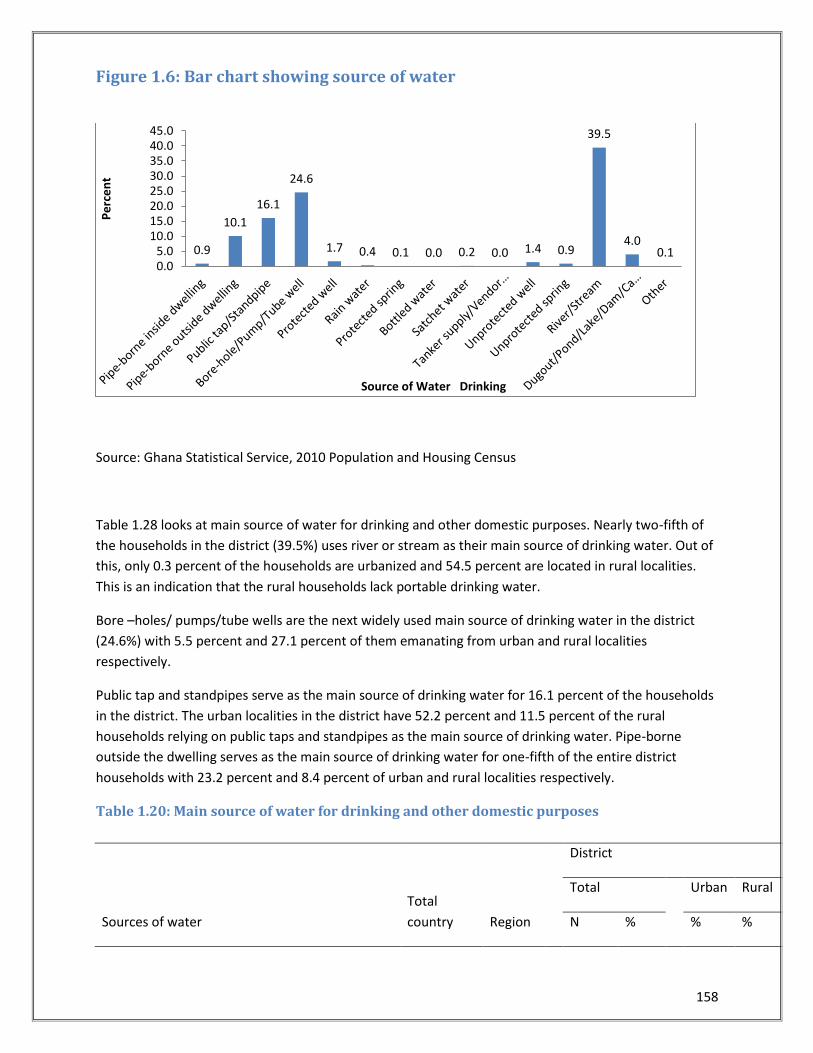
158
Figure 1.6: Bar chart showing source of water
Source: Ghana Statistical Service, 2010 Population and Housing Census
Table 1.28 looks at main source of water for drinking and other domestic purposes. Nearly two-fifth of
the households in the district (39.5%) uses river or stream as their main source of drinking water. Out of
this, only 0.3 percent of the households are urbanized and 54.5 percent are located in rural localities.
This is an indication that the rural households lack portable drinking water.
Bore –holes/ pumps/tube wells are the next widely used main source of drinking water in the district
(24.6%) with 5.5 percent and 27.1 percent of them emanating from urban and rural localities
respectively.
Public tap and standpipes serve as the main source of drinking water for 16.1 percent of the households
in the district. The urban localities in the district have 52.2 percent and 11.5 percent of the rural
households relying on public taps and standpipes as the main source of drinking water. Pipe-borne
outside the dwelling serves as the main source of drinking water for one-fifth of the entire district
households with 23.2 percent and 8.4 percent of urban and rural localities respectively.
Table 1.20: Main source of water for drinking and other domestic purposes
Sources of water
Total
country Region
District
Total
Urban Rural
N % % %
0.9
10.1
16.1
24.6
1.7 0.4 0.1 0.0 0.2 0.0 1.4 0.9
39.5
4.0 0.1
0.05.0
10.015.020.025.030.035.040.045.0
Pe
rce
nt
Source of Water Drinking
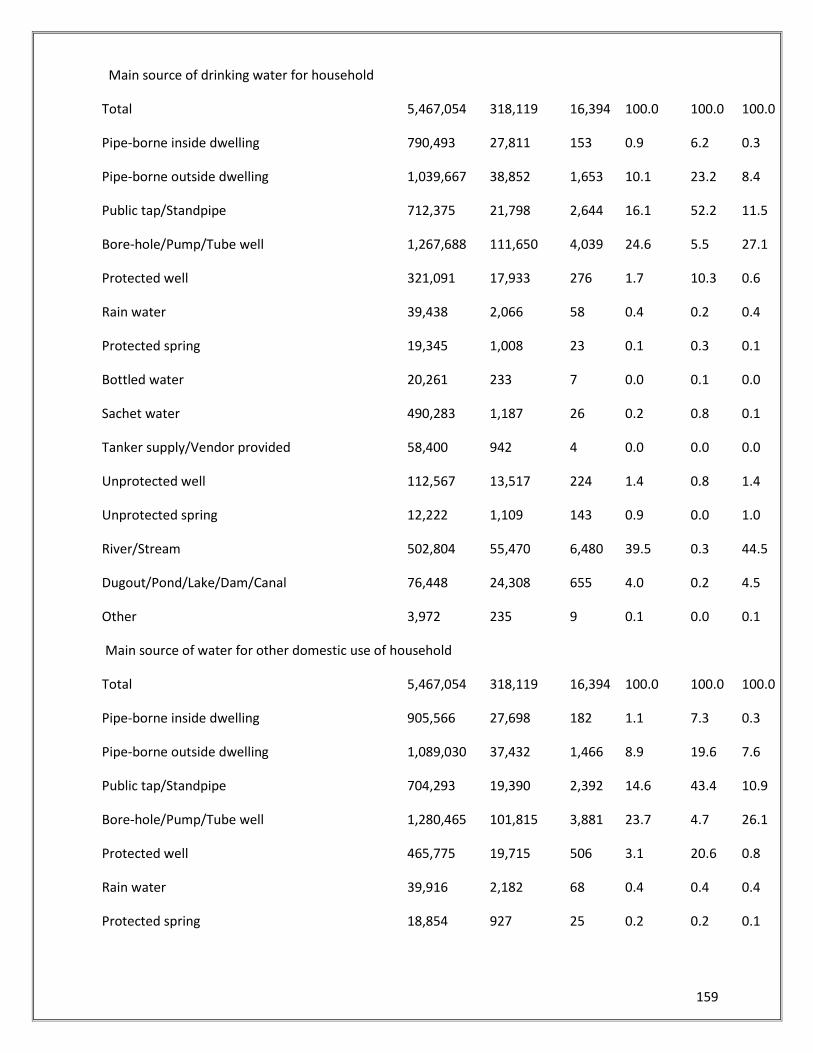
159
Main source of drinking water for household
Total 5,467,054 318,119
16,394 100.0
100.0 100.0
Pipe-borne inside dwelling 790,493 27,811
153 0.9
6.2 0.3
Pipe-borne outside dwelling 1,039,667 38,852
1,653 10.1
23.2 8.4
Public tap/Standpipe 712,375 21,798
2,644 16.1
52.2 11.5
Bore-hole/Pump/Tube well 1,267,688 111,650
4,039 24.6
5.5 27.1
Protected well 321,091 17,933
276 1.7
10.3 0.6
Rain water 39,438 2,066
58 0.4
0.2 0.4
Protected spring 19,345 1,008
23 0.1
0.3 0.1
Bottled water 20,261 233
7 0.0
0.1 0.0
Sachet water 490,283 1,187
26 0.2
0.8 0.1
Tanker supply/Vendor provided 58,400 942
4 0.0
0.0 0.0
Unprotected well 112,567 13,517
224 1.4
0.8 1.4
Unprotected spring 12,222 1,109
143 0.9
0.0 1.0
River/Stream 502,804 55,470
6,480 39.5
0.3 44.5
Dugout/Pond/Lake/Dam/Canal 76,448 24,308
655 4.0
0.2 4.5
Other 3,972 235
9 0.1
0.0 0.1
Main source of water for other domestic use of household
Total 5,467,054 318,119
16,394 100.0
100.0 100.0
Pipe-borne inside dwelling 905,566 27,698
182 1.1
7.3 0.3
Pipe-borne outside dwelling 1,089,030 37,432
1,466 8.9
19.6 7.6
Public tap/Standpipe 704,293 19,390
2,392 14.6
43.4 10.9
Bore-hole/Pump/Tube well 1,280,465 101,815
3,881 23.7
4.7 26.1
Protected well 465,775 19,715
506 3.1
20.6 0.8
Rain water 39,916 2,182
68 0.4
0.4 0.4
Protected spring 18,854 927
25 0.2
0.2 0.1
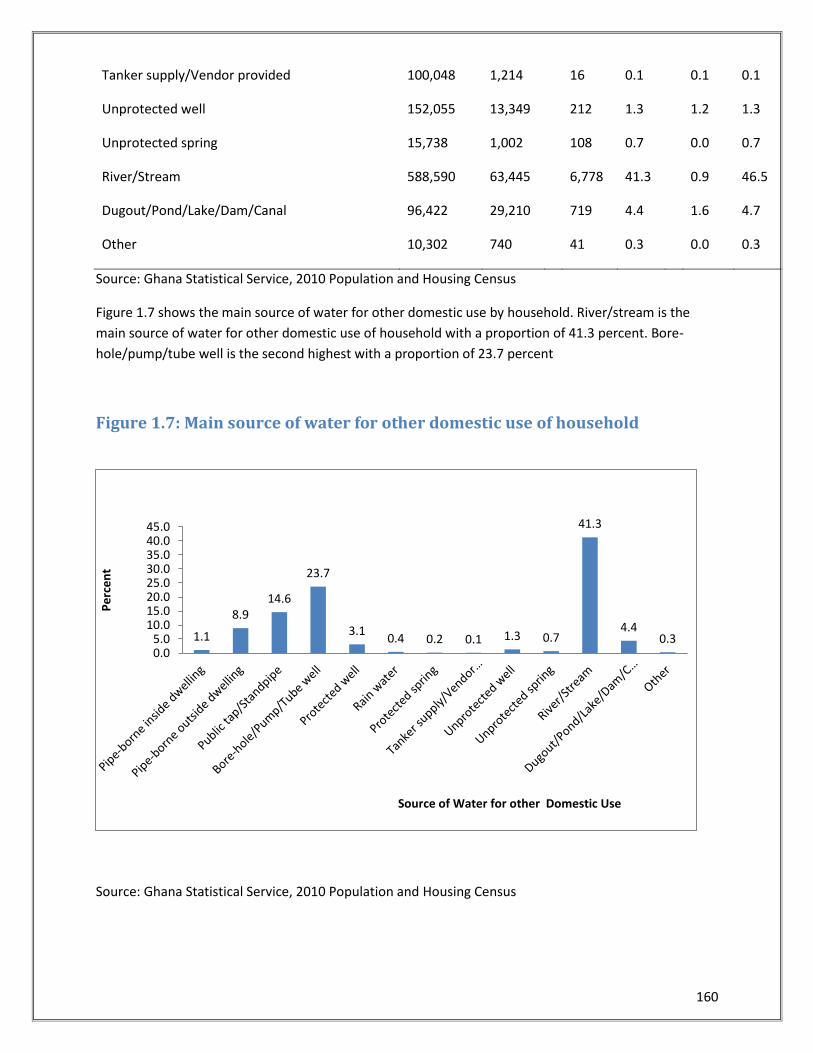
160
Tanker supply/Vendor provided 100,048 1,214
16 0.1
0.1 0.1
Unprotected well 152,055 13,349
212 1.3
1.2 1.3
Unprotected spring 15,738 1,002
108 0.7
0.0 0.7
River/Stream 588,590 63,445
6,778 41.3
0.9 46.5
Dugout/Pond/Lake/Dam/Canal 96,422 29,210
719 4.4
1.6 4.7
Other 10,302 740 41 0.3 0.0 0.3
Source: Ghana Statistical Service, 2010 Population and Housing Census
Figure 1.7 shows the main source of water for other domestic use by household. River/stream is the
main source of water for other domestic use of household with a proportion of 41.3 percent. Bore-
hole/pump/tube well is the second highest with a proportion of 23.7 percent
Figure 1.7: Main source of water for other domestic use of household
Source: Ghana Statistical Service, 2010 Population and Housing Census
1.1
8.9 14.6
23.7
3.1 0.4 0.2 0.1 1.3 0.7
41.3
4.4 0.3
0.05.0
10.015.020.025.030.035.040.045.0
Pe
rce
nt
Source of Water for other Domestic Use
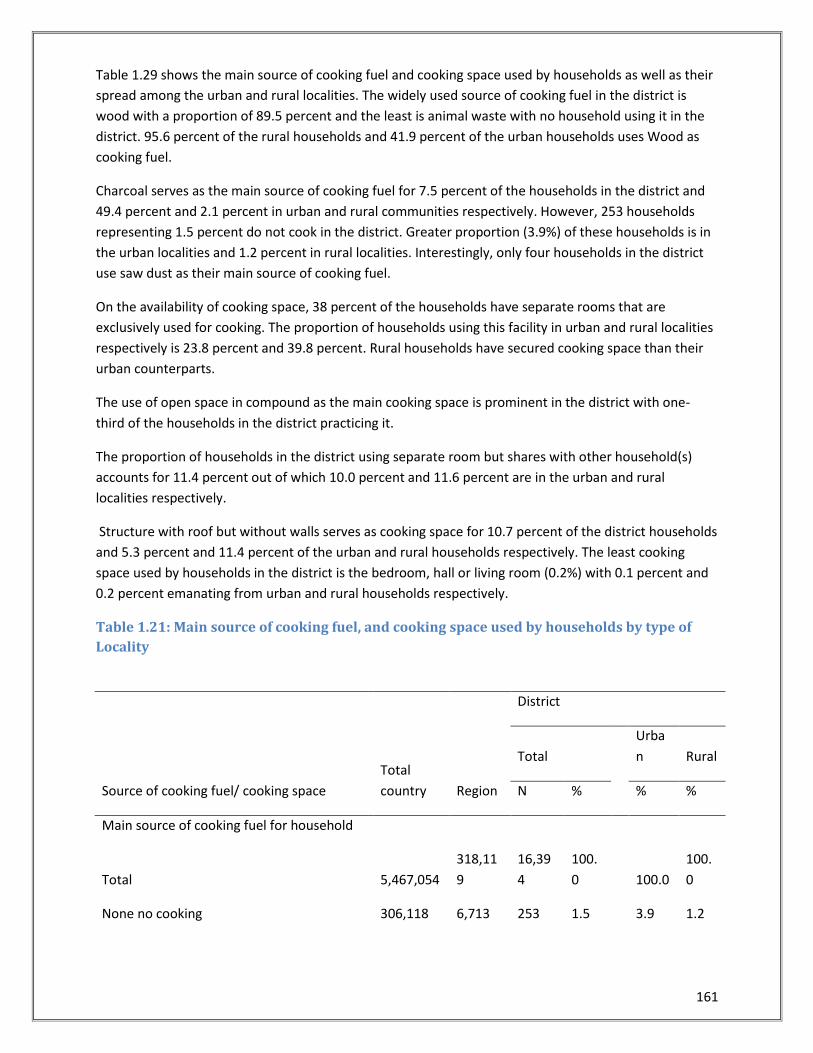
161
Table 1.29 shows the main source of cooking fuel and cooking space used by households as well as their
spread among the urban and rural localities. The widely used source of cooking fuel in the district is
wood with a proportion of 89.5 percent and the least is animal waste with no household using it in the
district. 95.6 percent of the rural households and 41.9 percent of the urban households uses Wood as
cooking fuel.
Charcoal serves as the main source of cooking fuel for 7.5 percent of the households in the district and
49.4 percent and 2.1 percent in urban and rural communities respectively. However, 253 households
representing 1.5 percent do not cook in the district. Greater proportion (3.9%) of these households is in
the urban localities and 1.2 percent in rural localities. Interestingly, only four households in the district
use saw dust as their main source of cooking fuel.
On the availability of cooking space, 38 percent of the households have separate rooms that are
exclusively used for cooking. The proportion of households using this facility in urban and rural localities
respectively is 23.8 percent and 39.8 percent. Rural households have secured cooking space than their
urban counterparts.
The use of open space in compound as the main cooking space is prominent in the district with one-
third of the households in the district practicing it.
The proportion of households in the district using separate room but shares with other household(s)
accounts for 11.4 percent out of which 10.0 percent and 11.6 percent are in the urban and rural
localities respectively.
Structure with roof but without walls serves as cooking space for 10.7 percent of the district households
and 5.3 percent and 11.4 percent of the urban and rural households respectively. The least cooking
space used by households in the district is the bedroom, hall or living room (0.2%) with 0.1 percent and
0.2 percent emanating from urban and rural households respectively.
Table 1.21: Main source of cooking fuel, and cooking space used by households by type of
Locality
Source of cooking fuel/ cooking space
Total
country Region
District
Total
Urba
n Rural
N % % %
Main source of cooking fuel for household
Total 5,467,054
318,11
9
16,39
4
100.
0
100.0
100.
0
None no cooking 306,118 6,713 253 1.5
3.9 1.2
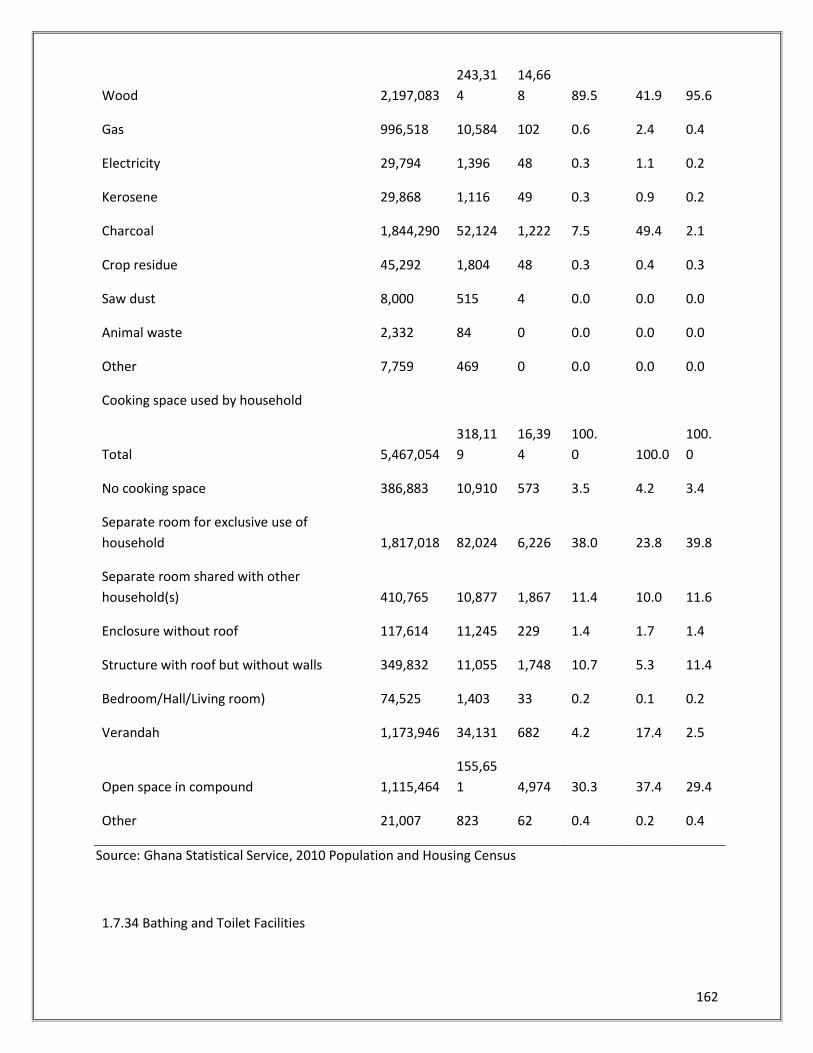
162
Wood 2,197,083
243,31
4
14,66
8 89.5
41.9 95.6
Gas 996,518 10,584 102 0.6
2.4 0.4
Electricity 29,794 1,396 48 0.3
1.1 0.2
Kerosene 29,868 1,116 49 0.3
0.9 0.2
Charcoal 1,844,290 52,124 1,222 7.5
49.4 2.1
Crop residue 45,292 1,804 48 0.3
0.4 0.3
Saw dust 8,000 515 4 0.0
0.0 0.0
Animal waste 2,332 84 0 0.0
0.0 0.0
Other 7,759 469 0 0.0
0.0 0.0
Cooking space used by household
Total 5,467,054
318,11
9
16,39
4
100.
0
100.0
100.
0
No cooking space 386,883 10,910 573 3.5
4.2 3.4
Separate room for exclusive use of
household 1,817,018 82,024 6,226 38.0
23.8 39.8
Separate room shared with other
household(s) 410,765 10,877 1,867 11.4
10.0 11.6
Enclosure without roof 117,614 11,245 229 1.4
1.7 1.4
Structure with roof but without walls 349,832 11,055 1,748 10.7
5.3 11.4
Bedroom/Hall/Living room) 74,525 1,403 33 0.2
0.1 0.2
Verandah 1,173,946 34,131 682 4.2
17.4 2.5
Open space in compound 1,115,464
155,65
1 4,974 30.3
37.4 29.4
Other 21,007 823 62 0.4 0.2 0.4
Source: Ghana Statistical Service, 2010 Population and Housing Census
1.7.34 Bathing and Toilet Facilities
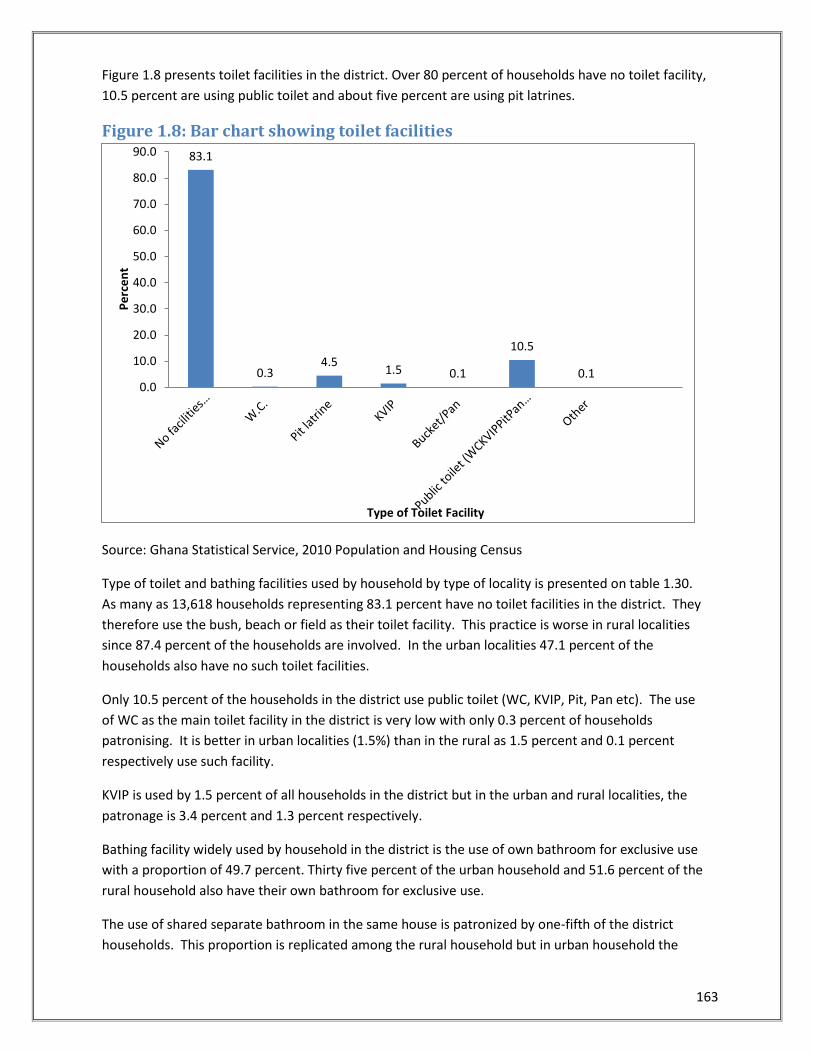
163
Figure 1.8 presents toilet facilities in the district. Over 80 percent of households have no toilet facility,
10.5 percent are using public toilet and about five percent are using pit latrines.
Figure 1.8: Bar chart showing toilet facilities
Source: Ghana Statistical Service, 2010 Population and Housing Census
Type of toilet and bathing facilities used by household by type of locality is presented on table 1.30.
As many as 13,618 households representing 83.1 percent have no toilet facilities in the district. They
therefore use the bush, beach or field as their toilet facility. This practice is worse in rural localities
since 87.4 percent of the households are involved. In the urban localities 47.1 percent of the
households also have no such toilet facilities.
Only 10.5 percent of the households in the district use public toilet (WC, KVIP, Pit, Pan etc). The use
of WC as the main toilet facility in the district is very low with only 0.3 percent of households
patronising. It is better in urban localities (1.5%) than in the rural as 1.5 percent and 0.1 percent
respectively use such facility.
KVIP is used by 1.5 percent of all households in the district but in the urban and rural localities, the
patronage is 3.4 percent and 1.3 percent respectively.
Bathing facility widely used by household in the district is the use of own bathroom for exclusive use
with a proportion of 49.7 percent. Thirty five percent of the urban household and 51.6 percent of the
rural household also have their own bathroom for exclusive use.
The use of shared separate bathroom in the same house is patronized by one-fifth of the district
households. This proportion is replicated among the rural household but in urban household the
83.1
0.3 4.5
1.5 0.1
10.5
0.1 0.0
10.0
20.0
30.0
40.0
50.0
60.0
70.0
80.0
90.0
Pe
rce
nt
Type of Toilet Facility
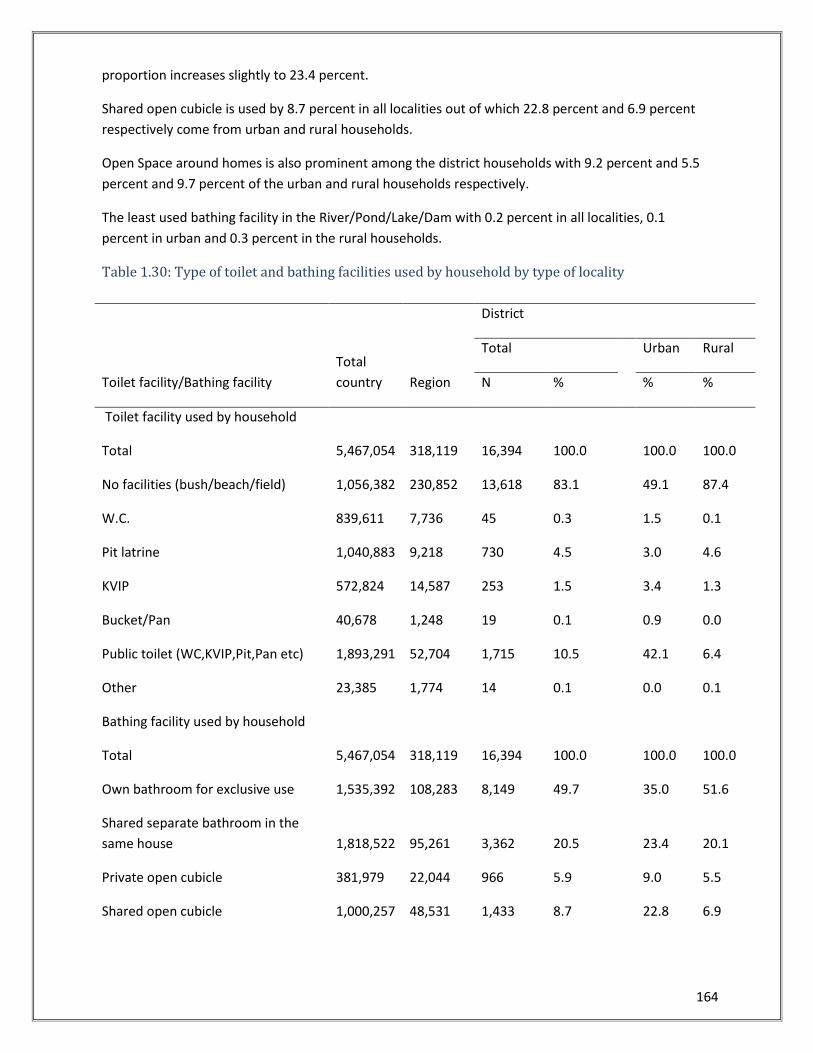
164
proportion increases slightly to 23.4 percent.
Shared open cubicle is used by 8.7 percent in all localities out of which 22.8 percent and 6.9 percent
respectively come from urban and rural households.
Open Space around homes is also prominent among the district households with 9.2 percent and 5.5
percent and 9.7 percent of the urban and rural households respectively.
The least used bathing facility in the River/Pond/Lake/Dam with 0.2 percent in all localities, 0.1
percent in urban and 0.3 percent in the rural households.
Table 1.30: Type of toilet and bathing facilities used by household by type of locality
Toilet facility/Bathing facility
Total
country Region
District
Total
Urban Rural
N % % %
Toilet facility used by household
Total 5,467,054 318,119 16,394 100.0
100.0 100.0
No facilities (bush/beach/field) 1,056,382 230,852 13,618 83.1
49.1 87.4
W.C. 839,611 7,736 45 0.3
1.5 0.1
Pit latrine 1,040,883 9,218 730 4.5
3.0 4.6
KVIP 572,824 14,587 253 1.5
3.4 1.3
Bucket/Pan 40,678 1,248 19 0.1
0.9 0.0
Public toilet (WC,KVIP,Pit,Pan etc) 1,893,291 52,704 1,715 10.5
42.1 6.4
Other 23,385 1,774 14 0.1
0.0 0.1
Bathing facility used by household
Total 5,467,054 318,119 16,394 100.0
100.0 100.0
Own bathroom for exclusive use 1,535,392 108,283 8,149 49.7
35.0 51.6
Shared separate bathroom in the
same house 1,818,522 95,261 3,362 20.5
23.4 20.1
Private open cubicle 381,979 22,044 966 5.9
9.0 5.5
Shared open cubicle 1,000,257 48,531 1,433 8.7
22.8 6.9
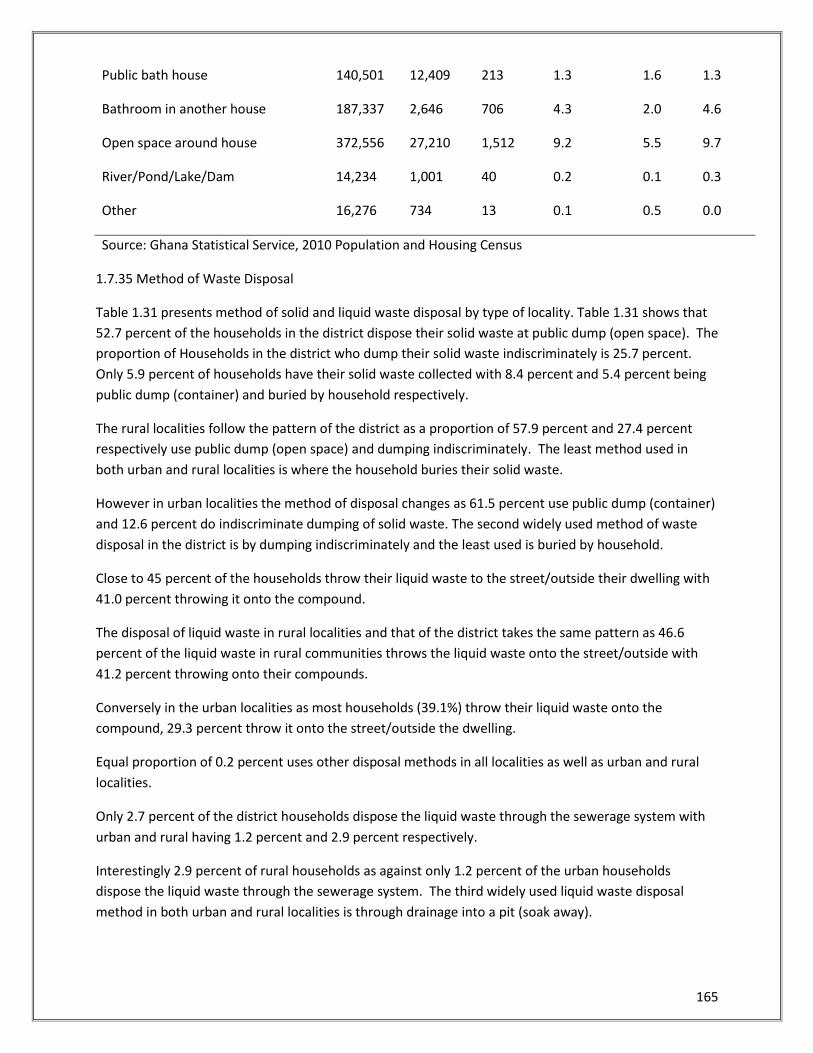
165
Public bath house 140,501 12,409 213 1.3
1.6 1.3
Bathroom in another house 187,337 2,646 706 4.3
2.0 4.6
Open space around house 372,556 27,210 1,512 9.2
5.5 9.7
River/Pond/Lake/Dam 14,234 1,001 40 0.2
0.1 0.3
Other 16,276 734 13 0.1 0.5 0.0
Source: Ghana Statistical Service, 2010 Population and Housing Census
1.7.35 Method of Waste Disposal
Table 1.31 presents method of solid and liquid waste disposal by type of locality. Table 1.31 shows that
52.7 percent of the households in the district dispose their solid waste at public dump (open space). The
proportion of Households in the district who dump their solid waste indiscriminately is 25.7 percent.
Only 5.9 percent of households have their solid waste collected with 8.4 percent and 5.4 percent being
public dump (container) and buried by household respectively.
The rural localities follow the pattern of the district as a proportion of 57.9 percent and 27.4 percent
respectively use public dump (open space) and dumping indiscriminately. The least method used in
both urban and rural localities is where the household buries their solid waste.
However in urban localities the method of disposal changes as 61.5 percent use public dump (container)
and 12.6 percent do indiscriminate dumping of solid waste. The second widely used method of waste
disposal in the district is by dumping indiscriminately and the least used is buried by household.
Close to 45 percent of the households throw their liquid waste to the street/outside their dwelling with
41.0 percent throwing it onto the compound.
The disposal of liquid waste in rural localities and that of the district takes the same pattern as 46.6
percent of the liquid waste in rural communities throws the liquid waste onto the street/outside with
41.2 percent throwing onto their compounds.
Conversely in the urban localities as most households (39.1%) throw their liquid waste onto the
compound, 29.3 percent throw it onto the street/outside the dwelling.
Equal proportion of 0.2 percent uses other disposal methods in all localities as well as urban and rural
localities.
Only 2.7 percent of the district households dispose the liquid waste through the sewerage system with
urban and rural having 1.2 percent and 2.9 percent respectively.
Interestingly 2.9 percent of rural households as against only 1.2 percent of the urban households
dispose the liquid waste through the sewerage system. The third widely used liquid waste disposal
method in both urban and rural localities is through drainage into a pit (soak away).
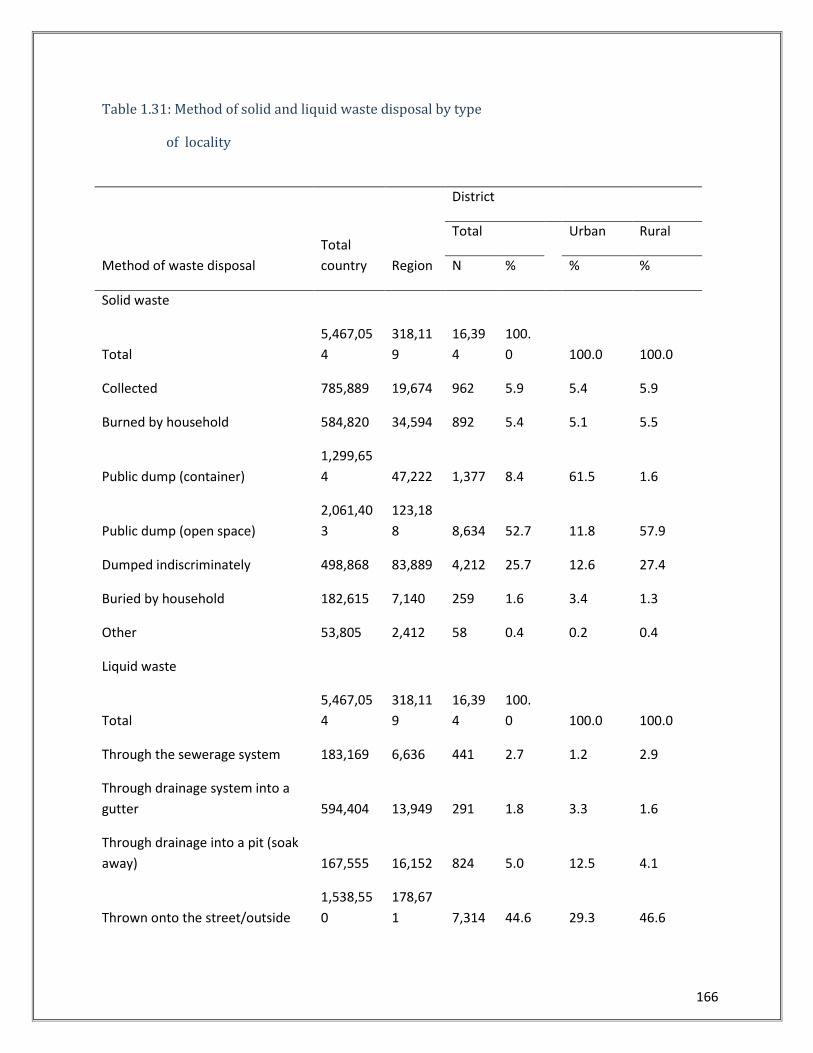
166
Table 1.31: Method of solid and liquid waste disposal by type
of locality
Method of waste disposal
Total
country Region
District
Total
Urban Rural
N % % %
Solid waste
Total
5,467,05
4
318,11
9
16,39
4
100.
0
100.0 100.0
Collected 785,889 19,674 962 5.9
5.4 5.9
Burned by household 584,820 34,594 892 5.4
5.1 5.5
Public dump (container)
1,299,65
4 47,222 1,377 8.4
61.5 1.6
Public dump (open space)
2,061,40
3
123,18
8 8,634 52.7
11.8 57.9
Dumped indiscriminately 498,868 83,889 4,212 25.7
12.6 27.4
Buried by household 182,615 7,140 259 1.6
3.4 1.3
Other 53,805 2,412 58 0.4
0.2 0.4
Liquid waste
Total
5,467,05
4
318,11
9
16,39
4
100.
0
100.0 100.0
Through the sewerage system 183,169 6,636 441 2.7
1.2 2.9
Through drainage system into a
gutter 594,404 13,949 291 1.8
3.3 1.6
Through drainage into a pit (soak
away) 167,555 16,152 824 5.0
12.5 4.1
Thrown onto the street/outside
1,538,55
0
178,67
1 7,314 44.6
29.3 46.6
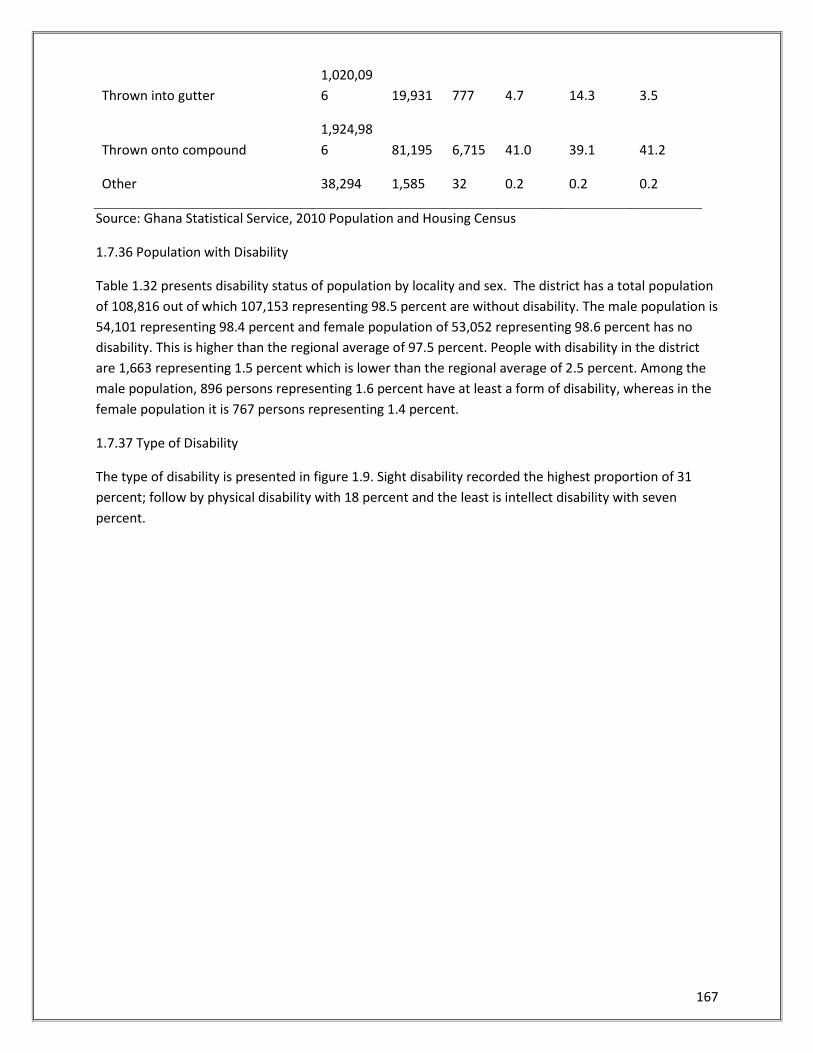
167
Thrown into gutter
1,020,09
6 19,931 777 4.7
14.3 3.5
Thrown onto compound
1,924,98
6 81,195 6,715 41.0
39.1 41.2
Other 38,294 1,585 32 0.2 0.2 0.2
Source: Ghana Statistical Service, 2010 Population and Housing Census
1.7.36 Population with Disability
Table 1.32 presents disability status of population by locality and sex. The district has a total population
of 108,816 out of which 107,153 representing 98.5 percent are without disability. The male population is
54,101 representing 98.4 percent and female population of 53,052 representing 98.6 percent has no
disability. This is higher than the regional average of 97.5 percent. People with disability in the district
are 1,663 representing 1.5 percent which is lower than the regional average of 2.5 percent. Among the
male population, 896 persons representing 1.6 percent have at least a form of disability, whereas in the
female population it is 767 persons representing 1.4 percent.
1.7.37 Type of Disability
The type of disability is presented in figure 1.9. Sight disability recorded the highest proportion of 31
percent; follow by physical disability with 18 percent and the least is intellect disability with seven
percent.
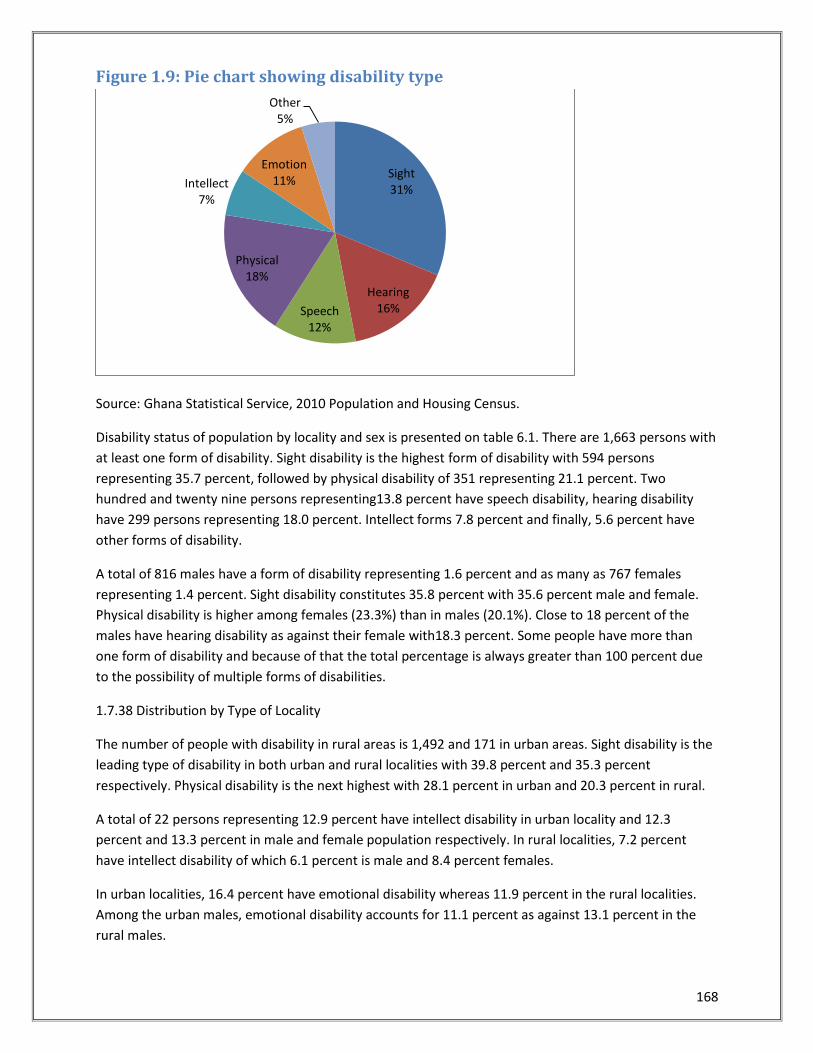
168
Figure 1.9: Pie chart showing disability type
Source: Ghana Statistical Service, 2010 Population and Housing Census.
Disability status of population by locality and sex is presented on table 6.1. There are 1,663 persons with
at least one form of disability. Sight disability is the highest form of disability with 594 persons
representing 35.7 percent, followed by physical disability of 351 representing 21.1 percent. Two
hundred and twenty nine persons representing13.8 percent have speech disability, hearing disability
have 299 persons representing 18.0 percent. Intellect forms 7.8 percent and finally, 5.6 percent have
other forms of disability.
A total of 816 males have a form of disability representing 1.6 percent and as many as 767 females
representing 1.4 percent. Sight disability constitutes 35.8 percent with 35.6 percent male and female.
Physical disability is higher among females (23.3%) than in males (20.1%). Close to 18 percent of the
males have hearing disability as against their female with18.3 percent. Some people have more than
one form of disability and because of that the total percentage is always greater than 100 percent due
to the possibility of multiple forms of disabilities.
1.7.38 Distribution by Type of Locality
The number of people with disability in rural areas is 1,492 and 171 in urban areas. Sight disability is the
leading type of disability in both urban and rural localities with 39.8 percent and 35.3 percent
respectively. Physical disability is the next highest with 28.1 percent in urban and 20.3 percent in rural.
A total of 22 persons representing 12.9 percent have intellect disability in urban locality and 12.3
percent and 13.3 percent in male and female population respectively. In rural localities, 7.2 percent
have intellect disability of which 6.1 percent is male and 8.4 percent females.
In urban localities, 16.4 percent have emotional disability whereas 11.9 percent in the rural localities.
Among the urban males, emotional disability accounts for 11.1 percent as against 13.1 percent in the
rural males.
Sight 31%
Hearing 16% Speech
12%
Physical 18%
Intellect 7%
Emotion 11%
Other 5%
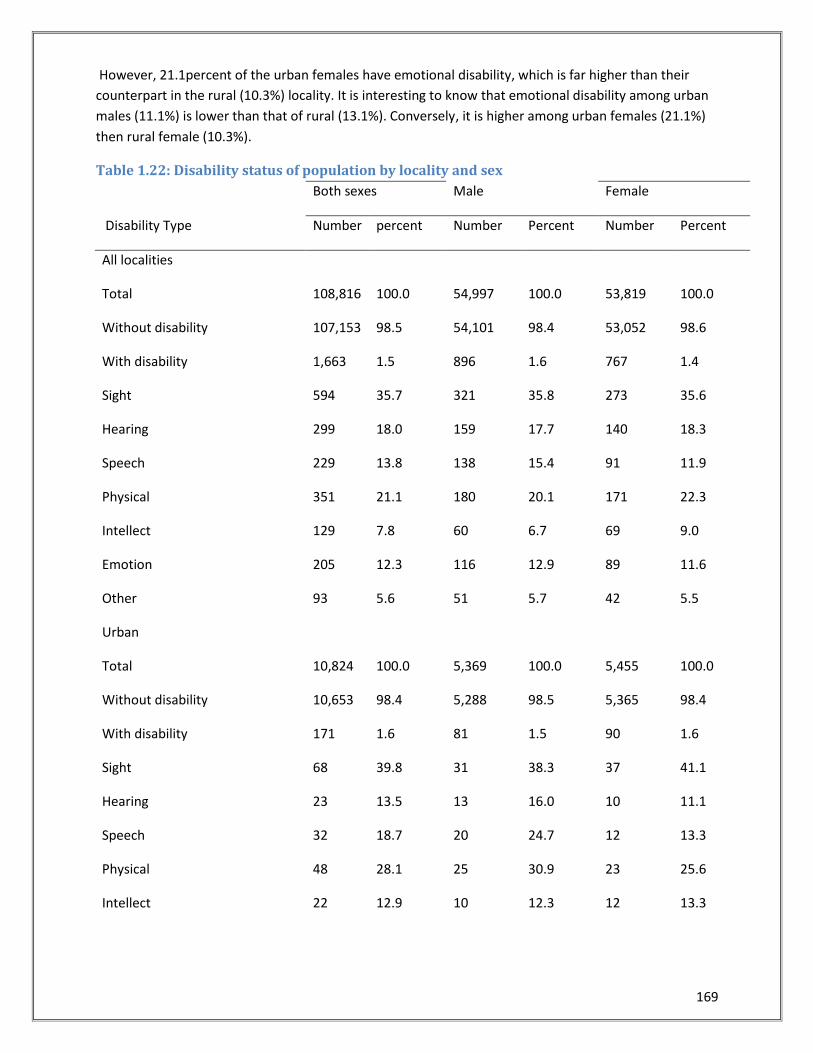
169
However, 21.1percent of the urban females have emotional disability, which is far higher than their
counterpart in the rural (10.3%) locality. It is interesting to know that emotional disability among urban
males (11.1%) is lower than that of rural (13.1%). Conversely, it is higher among urban females (21.1%)
then rural female (10.3%).
Table 1.22: Disability status of population by locality and sex
Disability Type
Both sexes Male Female
Number percent Number Percent Number Percent
All localities
Total 108,816 100.0 54,997 100.0 53,819 100.0
Without disability 107,153 98.5 54,101 98.4 53,052 98.6
With disability 1,663 1.5 896 1.6 767 1.4
Sight 594 35.7 321 35.8 273 35.6
Hearing 299 18.0 159 17.7 140 18.3
Speech 229 13.8 138 15.4 91 11.9
Physical 351 21.1 180 20.1 171 22.3
Intellect 129 7.8 60 6.7 69 9.0
Emotion 205 12.3 116 12.9 89 11.6
Other 93 5.6 51 5.7 42 5.5
Urban
Total 10,824 100.0 5,369 100.0 5,455 100.0
Without disability 10,653 98.4 5,288 98.5 5,365 98.4
With disability 171 1.6 81 1.5 90 1.6
Sight 68 39.8 31 38.3 37 41.1
Hearing 23 13.5 13 16.0 10 11.1
Speech 32 18.7 20 24.7 12 13.3
Physical 48 28.1 25 30.9 23 25.6
Intellect 22 12.9 10 12.3 12 13.3
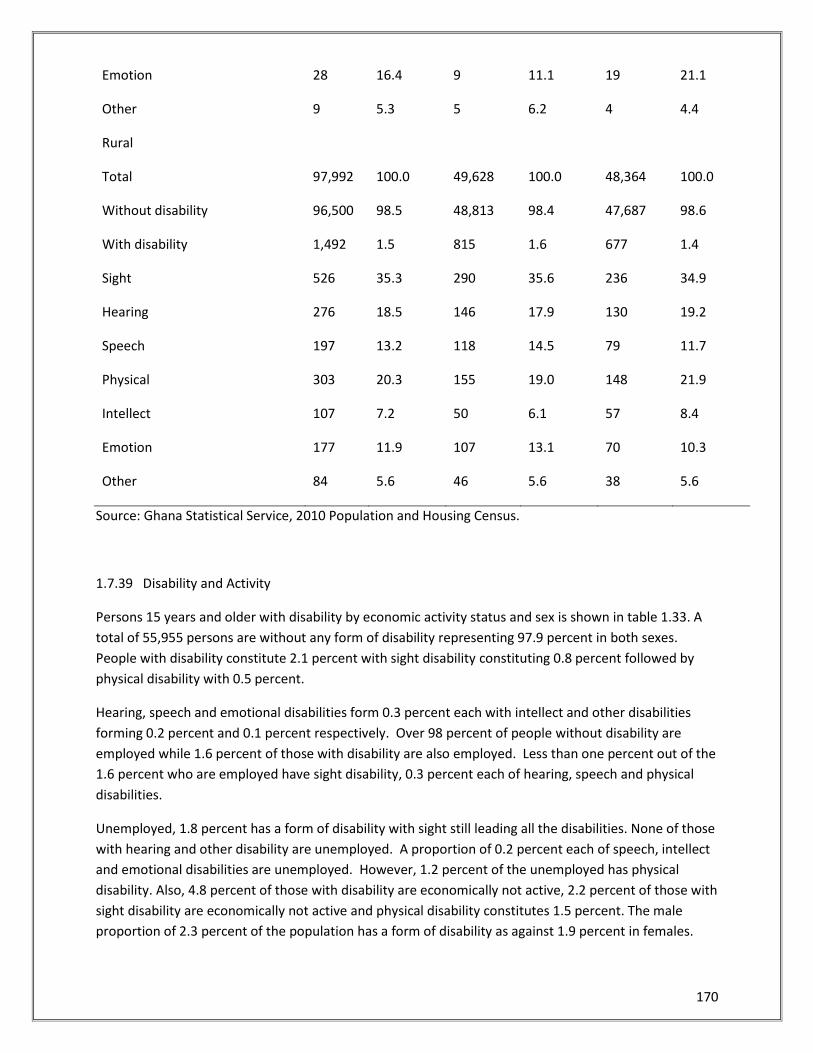
170
Emotion 28 16.4 9 11.1 19 21.1
Other 9 5.3 5 6.2 4 4.4
Rural
Total 97,992 100.0 49,628 100.0 48,364 100.0
Without disability 96,500 98.5 48,813 98.4 47,687 98.6
With disability 1,492 1.5 815 1.6 677 1.4
Sight 526 35.3 290 35.6 236 34.9
Hearing 276 18.5 146 17.9 130 19.2
Speech 197 13.2 118 14.5 79 11.7
Physical 303 20.3 155 19.0 148 21.9
Intellect 107 7.2 50 6.1 57 8.4
Emotion 177 11.9 107 13.1 70 10.3
Other 84 5.6 46 5.6 38 5.6
Source: Ghana Statistical Service, 2010 Population and Housing Census.
1.7.39 Disability and Activity
Persons 15 years and older with disability by economic activity status and sex is shown in table 1.33. A
total of 55,955 persons are without any form of disability representing 97.9 percent in both sexes.
People with disability constitute 2.1 percent with sight disability constituting 0.8 percent followed by
physical disability with 0.5 percent.
Hearing, speech and emotional disabilities form 0.3 percent each with intellect and other disabilities
forming 0.2 percent and 0.1 percent respectively. Over 98 percent of people without disability are
employed while 1.6 percent of those with disability are also employed. Less than one percent out of the
1.6 percent who are employed have sight disability, 0.3 percent each of hearing, speech and physical
disabilities.
Unemployed, 1.8 percent has a form of disability with sight still leading all the disabilities. None of those
with hearing and other disability are unemployed. A proportion of 0.2 percent each of speech, intellect
and emotional disabilities are unemployed. However, 1.2 percent of the unemployed has physical
disability. Also, 4.8 percent of those with disability are economically not active, 2.2 percent of those with
sight disability are economically not active and physical disability constitutes 1.5 percent. The male
proportion of 2.3 percent of the population has a form of disability as against 1.9 percent in females.
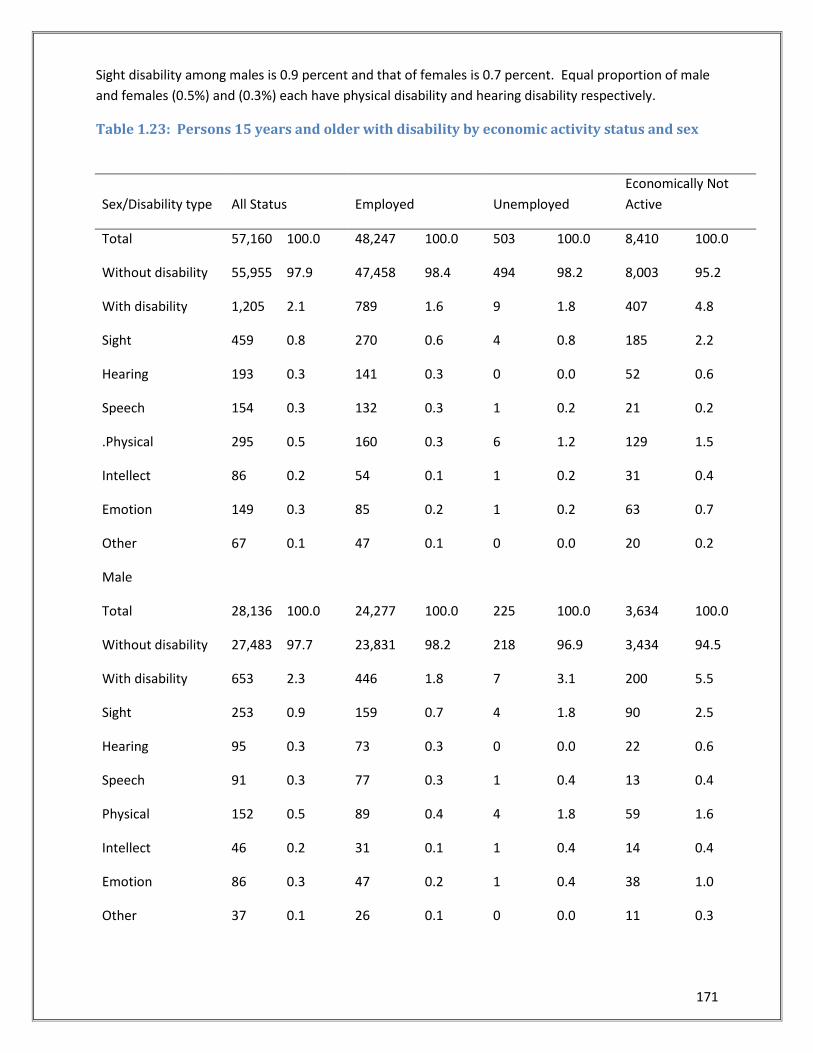
171
Sight disability among males is 0.9 percent and that of females is 0.7 percent. Equal proportion of male
and females (0.5%) and (0.3%) each have physical disability and hearing disability respectively.
Table 1.23: Persons 15 years and older with disability by economic activity status and sex
Sex/Disability type All Status Employed Unemployed
Economically Not
Active
Total 57,160 100.0 48,247 100.0 503 100.0 8,410 100.0
Without disability 55,955 97.9 47,458 98.4 494 98.2 8,003 95.2
With disability 1,205 2.1 789 1.6 9 1.8 407 4.8
Sight 459 0.8 270 0.6 4 0.8 185 2.2
Hearing 193 0.3 141 0.3 0 0.0 52 0.6
Speech 154 0.3 132 0.3 1 0.2 21 0.2
.Physical 295 0.5 160 0.3 6 1.2 129 1.5
Intellect 86 0.2 54 0.1 1 0.2 31 0.4
Emotion 149 0.3 85 0.2 1 0.2 63 0.7
Other 67 0.1 47 0.1 0 0.0 20 0.2
Male
Total 28,136 100.0 24,277 100.0 225 100.0 3,634 100.0
Without disability 27,483 97.7 23,831 98.2 218 96.9 3,434 94.5
With disability 653 2.3 446 1.8 7 3.1 200 5.5
Sight 253 0.9 159 0.7 4 1.8 90 2.5
Hearing 95 0.3 73 0.3 0 0.0 22 0.6
Speech 91 0.3 77 0.3 1 0.4 13 0.4
Physical 152 0.5 89 0.4 4 1.8 59 1.6
Intellect 46 0.2 31 0.1 1 0.4 14 0.4
Emotion 86 0.3 47 0.2 1 0.4 38 1.0
Other 37 0.1 26 0.1 0 0.0 11 0.3
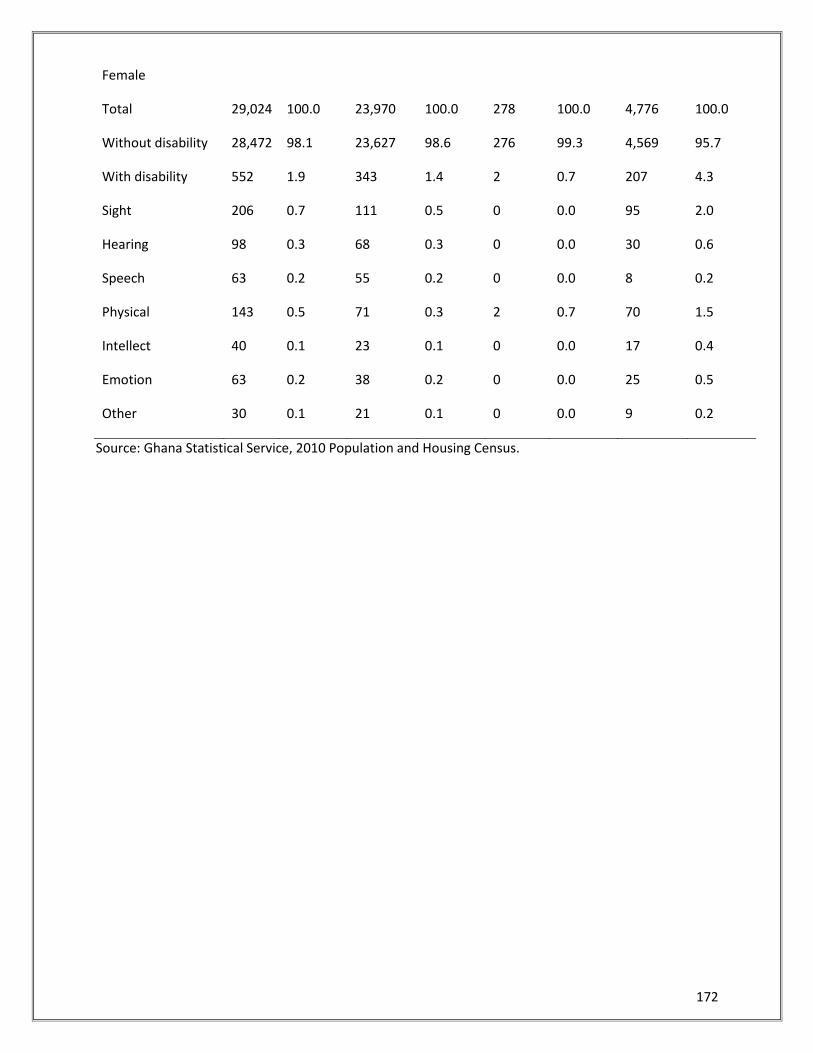
172
Female
Total 29,024 100.0 23,970 100.0 278 100.0 4,776 100.0
Without disability 28,472 98.1 23,627 98.6 276 99.3 4,569 95.7
With disability 552 1.9 343 1.4 2 0.7 207 4.3
Sight 206 0.7 111 0.5 0 0.0 95 2.0
Hearing 98 0.3 68 0.3 0 0.0 30 0.6
Speech 63 0.2 55 0.2 0 0.0 8 0.2
Physical 143 0.5 71 0.3 2 0.7 70 1.5
Intellect 40 0.1 23 0.1 0 0.0 17 0.4
Emotion 63 0.2 38 0.2 0 0.0 25 0.5
Other 30 0.1 21 0.1 0 0.0 9 0.2
Source: Ghana Statistical Service, 2010 Population and Housing Census.
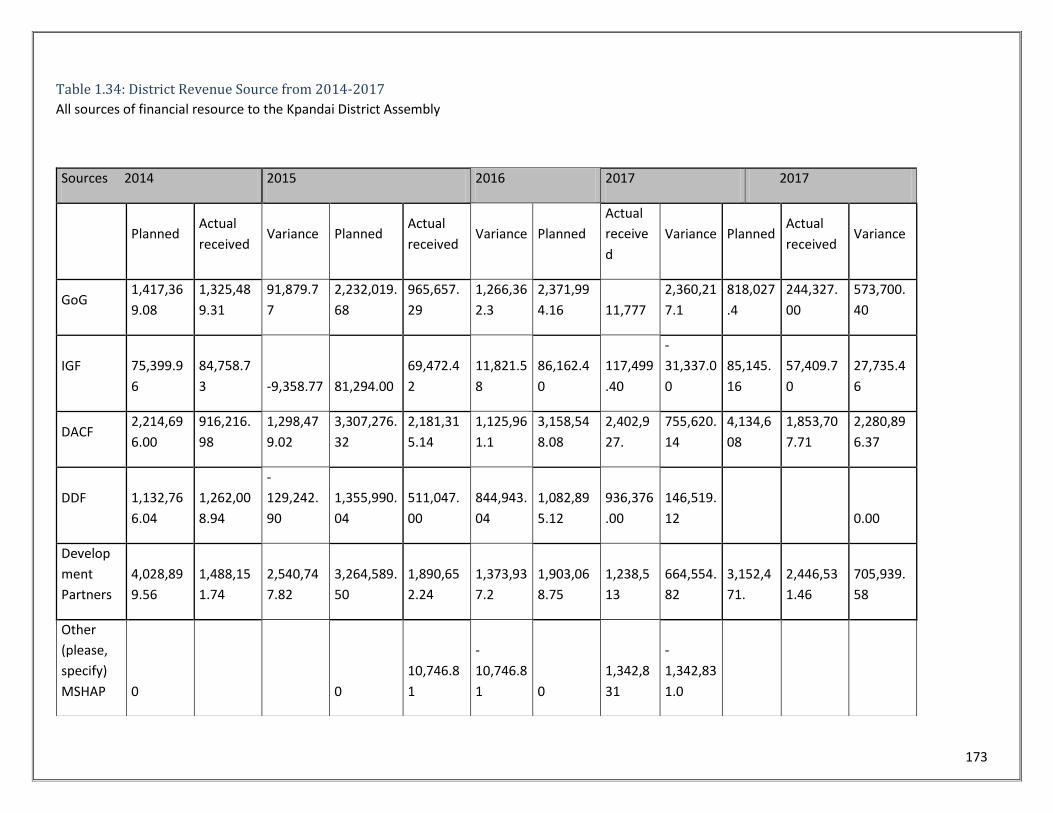
173
Table 1.34: District Revenue Source from 2014-2017
All sources of financial resource to the Kpandai District Assembly
Sources 2014 2015 2016 2017 2017
Planned
Actual
received Variance Planned
Actual
received Variance Planned
Actual
receive
d
Variance Planned Actual
received Variance
GoG 1,417,36
9.08
1,325,48
9.31
91,879.7
7
2,232,019.
68
965,657.
29
1,266,36
2.3
2,371,99
4.16 11,777
2,360,21
7.1
818,027
.4
244,327.
00
573,700.
40
IGF 75,399.9
6
84,758.7
3 -9,358.77 81,294.00
69,472.4
2
11,821.5
8
86,162.4
0
117,499
.40
-
31,337.0
0
85,145.
16
57,409.7
0
27,735.4
6
DACF 2,214,69
6.00
916,216.
98
1,298,47
9.02
3,307,276.
32
2,181,31
5.14
1,125,96
1.1
3,158,54
8.08
2,402,9
27.
755,620.
14
4,134,6
08
1,853,70
7.71
2,280,89
6.37
DDF 1,132,76
6.04
1,262,00
8.94
-
129,242.
90
1,355,990.
04
511,047.
00
844,943.
04
1,082,89
5.12
936,376
.00
146,519.
12 0.00
Develop
ment
Partners
4,028,89
9.56
1,488,15
1.74
2,540,74
7.82
3,264,589.
50
1,890,65
2.24
1,373,93
7.2
1,903,06
8.75
1,238,5
13
664,554.
82
3,152,4
71.
2,446,53
1.46
705,939.
58
Other
(please,
specify)
MSHAP 0 0
10,746.8
1
-
10,746.8
1 0
1,342,8
31
-
1,342,83
1.0
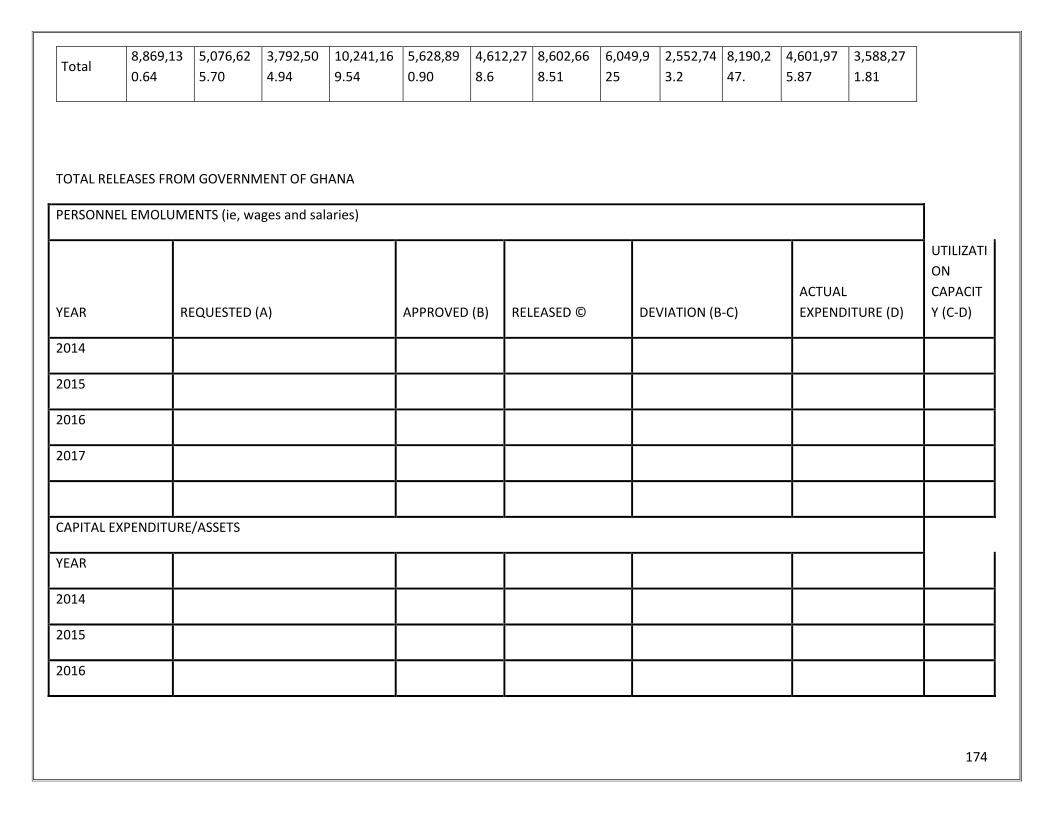
174
Total 8,869,13
0.64
5,076,62
5.70
3,792,50
4.94
10,241,16
9.54
5,628,89
0.90
4,612,27
8.6
8,602,66
8.51
6,049,9
25
2,552,74
3.2
8,190,2
47.
4,601,97
5.87
3,588,27
1.81
TOTAL RELEASES FROM GOVERNMENT OF GHANA
PERSONNEL EMOLUMENTS (ie, wages and salaries)
YEAR REQUESTED (A) APPROVED (B) RELEASED © DEVIATION (B-C)
ACTUAL
EXPENDITURE (D)
UTILIZATI
ON
CAPACIT
Y (C-D)
2014
2015
2016
2017
CAPITAL EXPENDITURE/ASSETS
YEAR
2014
2015
2016
175
2017
GOODS AND SERVICES
2014
2015
2016
2017
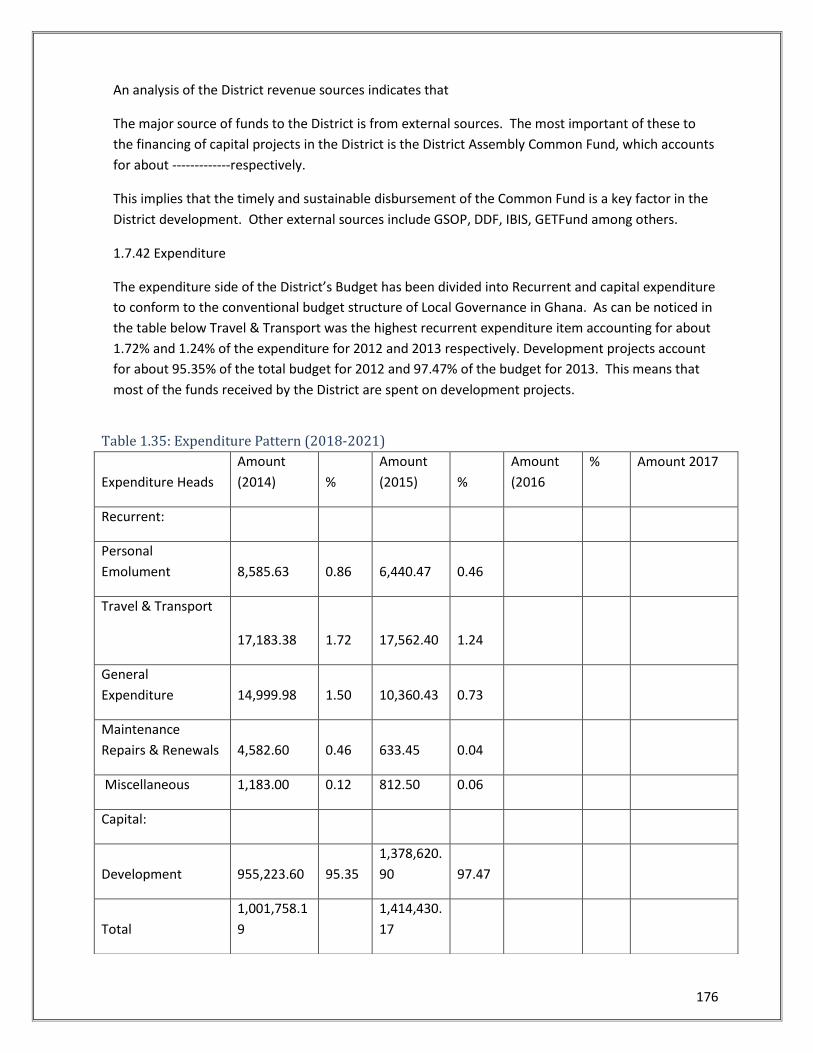
176
An analysis of the District revenue sources indicates that
The major source of funds to the District is from external sources. The most important of these to
the financing of capital projects in the District is the District Assembly Common Fund, which accounts
for about -------------respectively.
This implies that the timely and sustainable disbursement of the Common Fund is a key factor in the
District development. Other external sources include GSOP, DDF, IBIS, GETFund among others.
1.7.42 Expenditure
The expenditure side of the District’s Budget has been divided into Recurrent and capital expenditure
to conform to the conventional budget structure of Local Governance in Ghana. As can be noticed in
the table below Travel & Transport was the highest recurrent expenditure item accounting for about
1.72% and 1.24% of the expenditure for 2012 and 2013 respectively. Development projects account
for about 95.35% of the total budget for 2012 and 97.47% of the budget for 2013. This means that
most of the funds received by the District are spent on development projects.
Table 1.35: Expenditure Pattern (2018-2021)
Expenditure Heads
Amount
(2014) %
Amount
(2015) %
Amount
(2016
% Amount 2017
Recurrent:
Personal
Emolument 8,585.63 0.86 6,440.47 0.46
Travel & Transport
17,183.38 1.72 17,562.40 1.24
General
Expenditure 14,999.98 1.50 10,360.43 0.73
Maintenance
Repairs & Renewals 4,582.60 0.46 633.45 0.04
Miscellaneous 1,183.00 0.12 812.50 0.06
Capital:
Development 955,223.60 95.35
1,378,620.
90 97.47
Total
1,001,758.1
9
1,414,430.
17
177
1.7.43 Traditional System of Governance
This describes the established structures and processes, which promote and guide development in
the District. There are two main systems of governance in the District. These are the traditional
system with established chiefs and clan heads representing the communities. The District traditional
governance is led by the Nawuris and Nchumburus Wuras and they oversee all the communities in
the District. They however have appointed representatives in communities all over the District.
Directly below the representatives are the elders and family heads as well as settler’s heads. The next
in the hierarchy are opinion leaders who mostly represent various interest groups in the
communities. These people play various roles in the management of development projects and
fostering peaceful co-existence in the various communities.
1.7.44 Institutional Framework for Local Governance
The various legal frameworks which guide local development in Ghana includes: the Civil Service Law,
1993 (PNDC Law, 327), the National Development Planning System Law, 1994, (Act 480) and the Local
Governance Act, 2016 (Act 936). These enactments place emphasis on District Assembly in order to
reinforce the attainment of total decentralization and participatory development
According to the National Development (System) Law, 1994, (Act 480), all District Assemblies are to
submit District Development Plans to the Regional Coordinating Councils which will intend harmonize
the plans with the national development policies and priorities for consideration and approval by the
National Development Planning Commission.
There is therefore a vertical relationship between the National Development Planning Commission at
the National level, Regional Planning Coordinating Council at the Regional level and the District
Assembly at the District level. The figure below shows the New Local Government Structure.
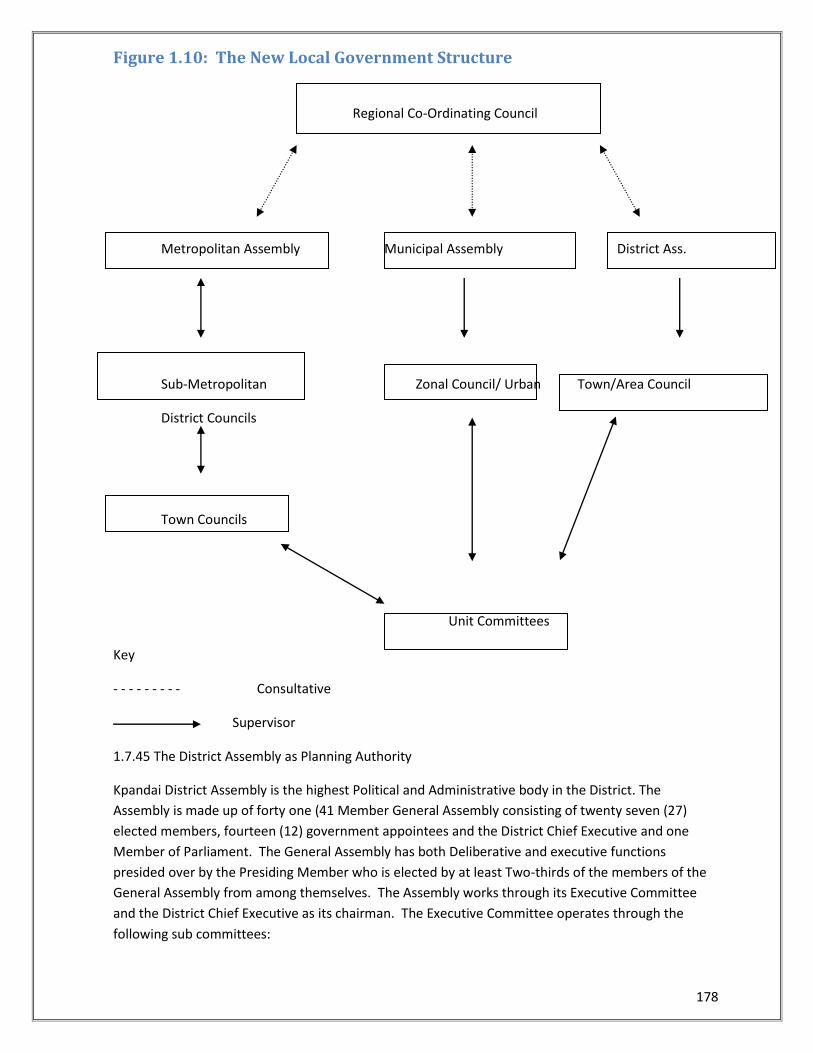
178
Figure 1.10: The New Local Government Structure
Regional Co-Ordinating Council
Metropolitan Assembly Municipal Assembly District Ass.
Sub-Metropolitan Zonal Council/ Urban Town/Area Council
District Councils
Town Councils
Unit Committees
Key
- - - - - - - - - Consultative
Supervisor
1.7.45 The District Assembly as Planning Authority
Kpandai District Assembly is the highest Political and Administrative body in the District. The
Assembly is made up of forty one (41 Member General Assembly consisting of twenty seven (27)
elected members, fourteen (12) government appointees and the District Chief Executive and one
Member of Parliament. The General Assembly has both Deliberative and executive functions
presided over by the Presiding Member who is elected by at least Two-thirds of the members of the
General Assembly from among themselves. The Assembly works through its Executive Committee
and the District Chief Executive as its chairman. The Executive Committee operates through the
following sub committees:
179
Development Planning Sub-committee
Works Sub-committee
Finance and Administration Sub-committee
Justice and Security Sub-committee
Social Services Sub-committee
Agriculture and Environment Sub-committee
Women and Children Sub-committee
These sub-committees have the responsibility of deliberating on specific issues related to their area
of operation and submitting their recommendations to the Executive Committee. The Executive
Committee intends presents them to the General Assembly for further deliberations and adoption.
The day to day administration of the District and operationalizing the decisions taken by the General
Assembly is undertaken by the Central Administration. These consist of the core staff of the District
Assembly and the Decentralized Departments under the leadership of the District Coordinating
Director.
With the enactment of the Local Governance Act 2016, Act 936, there ought to have been eleven
Departments (known as Decentralized Departments) established at the Assembly level but we have
only eight. The Departments are:
Central Administration
Education
Health
Finance
Works
Agriculture
Social Welfare and Community Development
NADMO
The other Public Institutions not decentralized and operating in the District are:
Ghana Police Service
Bureau of National Investigations
National Commission for Civic Education
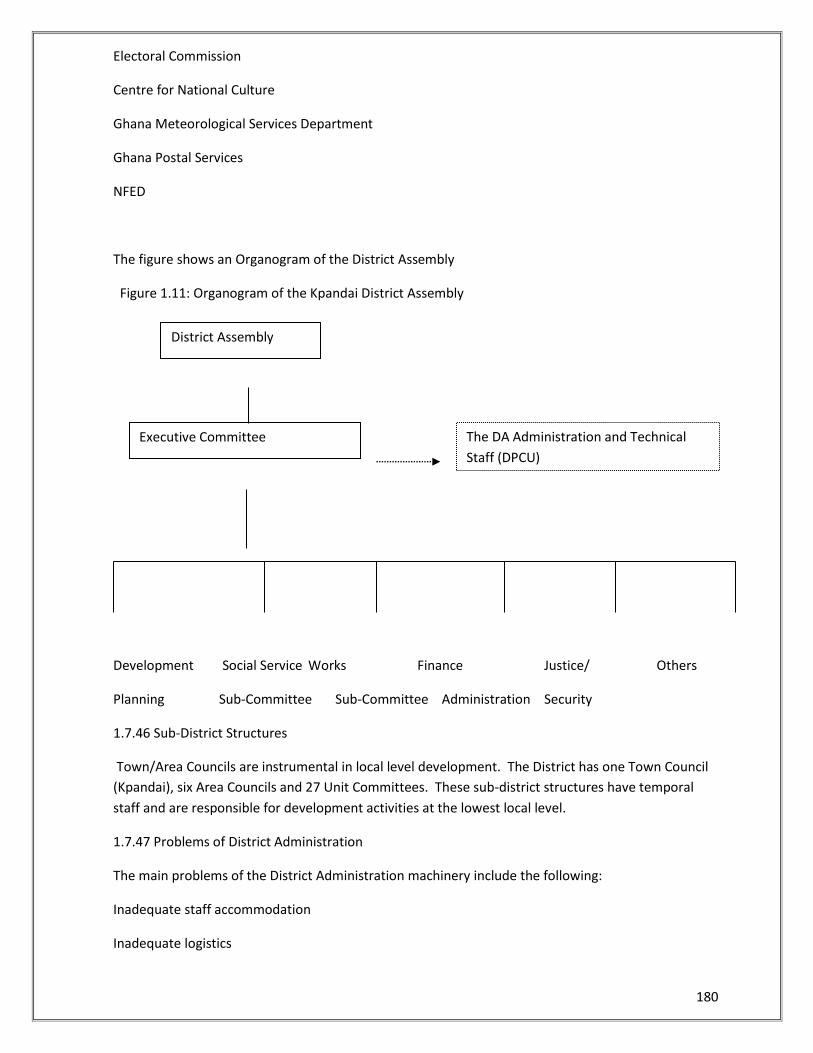
180
District Assembly
Executive Committee The DA Administration and Technical
Staff (DPCU)
Electoral Commission
Centre for National Culture
Ghana Meteorological Services Department
Ghana Postal Services
NFED
The figure shows an Organogram of the District Assembly
Figure 1.11: Organogram of the Kpandai District Assembly
Development Social Service Works Finance Justice/ Others
Planning Sub-Committee Sub-Committee Administration Security
1.7.46 Sub-District Structures
Town/Area Councils are instrumental in local level development. The District has one Town Council
(Kpandai), six Area Councils and 27 Unit Committees. These sub-district structures have temporal
staff and are responsible for development activities at the lowest local level.
1.7.47 Problems of District Administration
The main problems of the District Administration machinery include the following:
Inadequate staff accommodation
Inadequate logistics
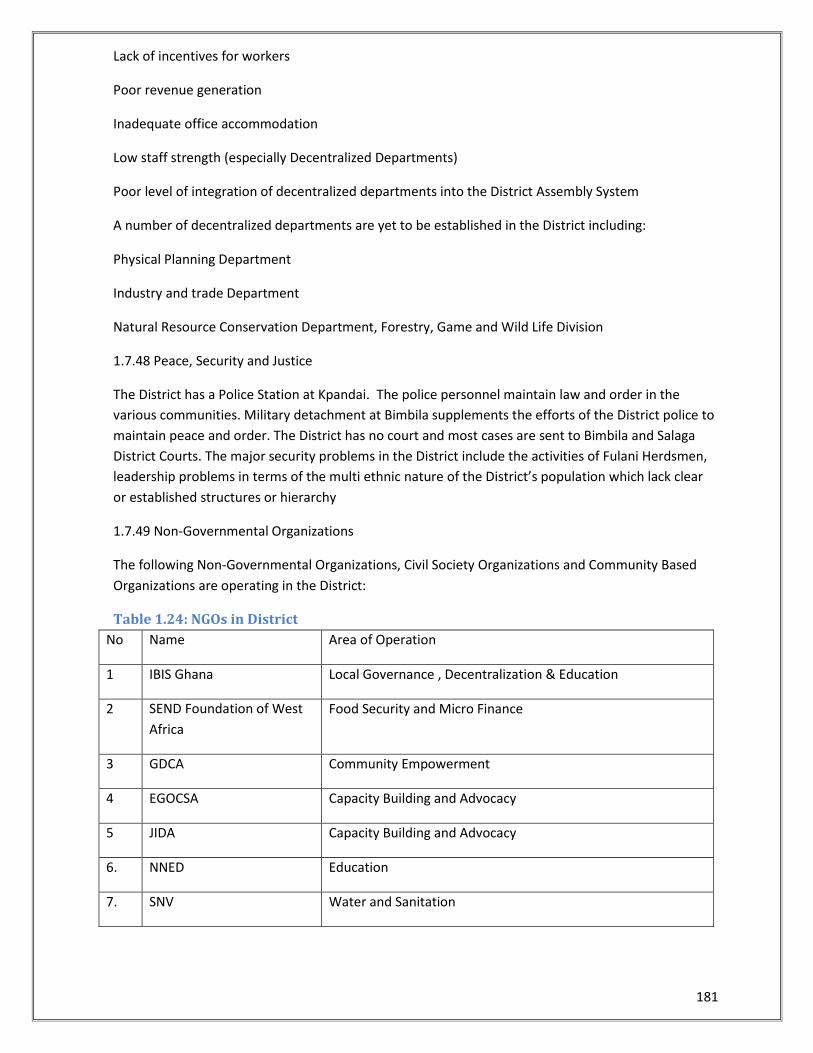
181
Lack of incentives for workers
Poor revenue generation
Inadequate office accommodation
Low staff strength (especially Decentralized Departments)
Poor level of integration of decentralized departments into the District Assembly System
A number of decentralized departments are yet to be established in the District including:
Physical Planning Department
Industry and trade Department
Natural Resource Conservation Department, Forestry, Game and Wild Life Division
1.7.48 Peace, Security and Justice
The District has a Police Station at Kpandai. The police personnel maintain law and order in the
various communities. Military detachment at Bimbila supplements the efforts of the District police to
maintain peace and order. The District has no court and most cases are sent to Bimbila and Salaga
District Courts. The major security problems in the District include the activities of Fulani Herdsmen,
leadership problems in terms of the multi ethnic nature of the District’s population which lack clear
or established structures or hierarchy
1.7.49 Non-Governmental Organizations
The following Non-Governmental Organizations, Civil Society Organizations and Community Based
Organizations are operating in the District:
Table 1.24: NGOs in District
No Name Area of Operation
1 IBIS Ghana Local Governance , Decentralization & Education
2 SEND Foundation of West
Africa
Food Security and Micro Finance
3 GDCA Community Empowerment
4 EGOCSA Capacity Building and Advocacy
5 JIDA Capacity Building and Advocacy
6. NNED Education
7. SNV Water and Sanitation
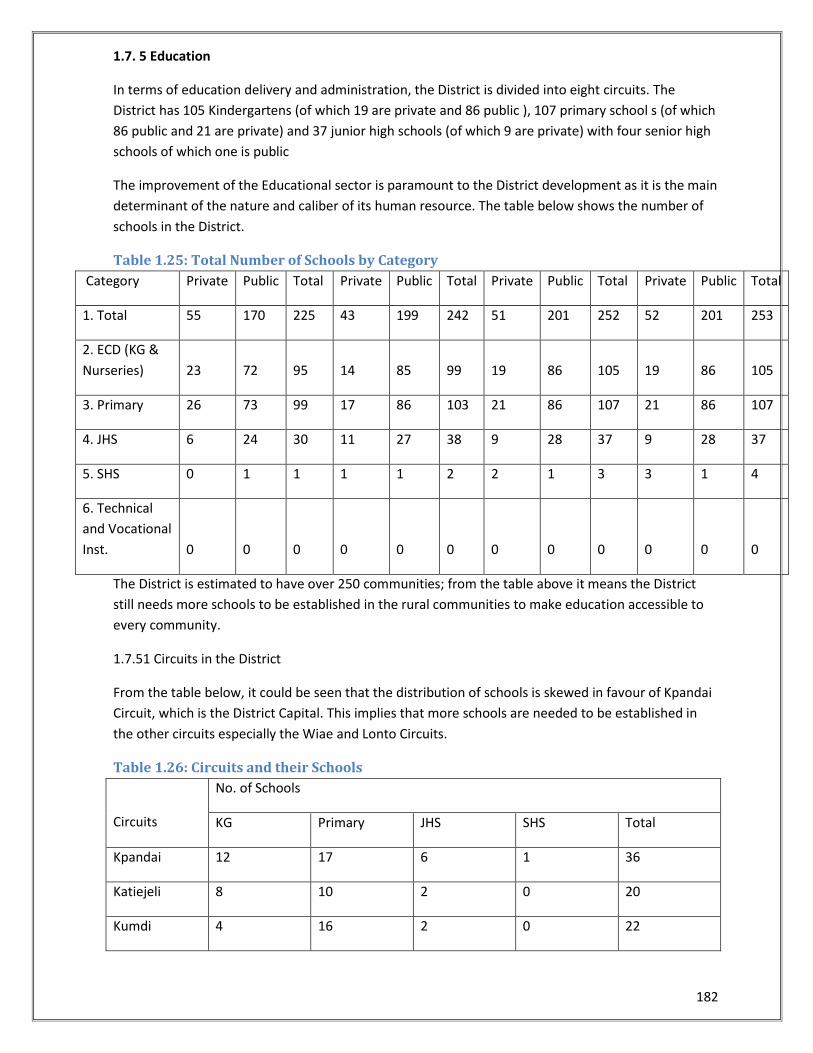
182
1.7. 5 Education
In terms of education delivery and administration, the District is divided into eight circuits. The
District has 105 Kindergartens (of which 19 are private and 86 public ), 107 primary school s (of which
86 public and 21 are private) and 37 junior high schools (of which 9 are private) with four senior high
schools of which one is public
The improvement of the Educational sector is paramount to the District development as it is the main
determinant of the nature and caliber of its human resource. The table below shows the number of
schools in the District.
Table 1.25: Total Number of Schools by Category
Category Private Public Total Private Public Total Private Public Total Private Public Total
1. Total 55 170 225 43 199 242 51 201 252 52 201 253
2. ECD (KG &
Nurseries) 23 72 95 14 85 99 19 86 105 19 86 105
3. Primary 26 73 99 17 86 103 21 86 107 21 86 107
4. JHS 6 24 30 11 27 38 9 28 37 9 28 37
5. SHS 0 1 1 1 1 2 2 1 3 3 1 4
6. Technical
and Vocational
Inst. 0 0 0 0 0 0 0 0 0 0 0 0
The District is estimated to have over 250 communities; from the table above it means the District
still needs more schools to be established in the rural communities to make education accessible to
every community.
1.7.51 Circuits in the District
From the table below, it could be seen that the distribution of schools is skewed in favour of Kpandai
Circuit, which is the District Capital. This implies that more schools are needed to be established in
the other circuits especially the Wiae and Lonto Circuits.
Table 1.26: Circuits and their Schools
Circuits
No. of Schools
KG Primary JHS SHS Total
Kpandai 12 17 6 1 36
Katiejeli 8 10 2 0 20
Kumdi 4 16 2 0 22
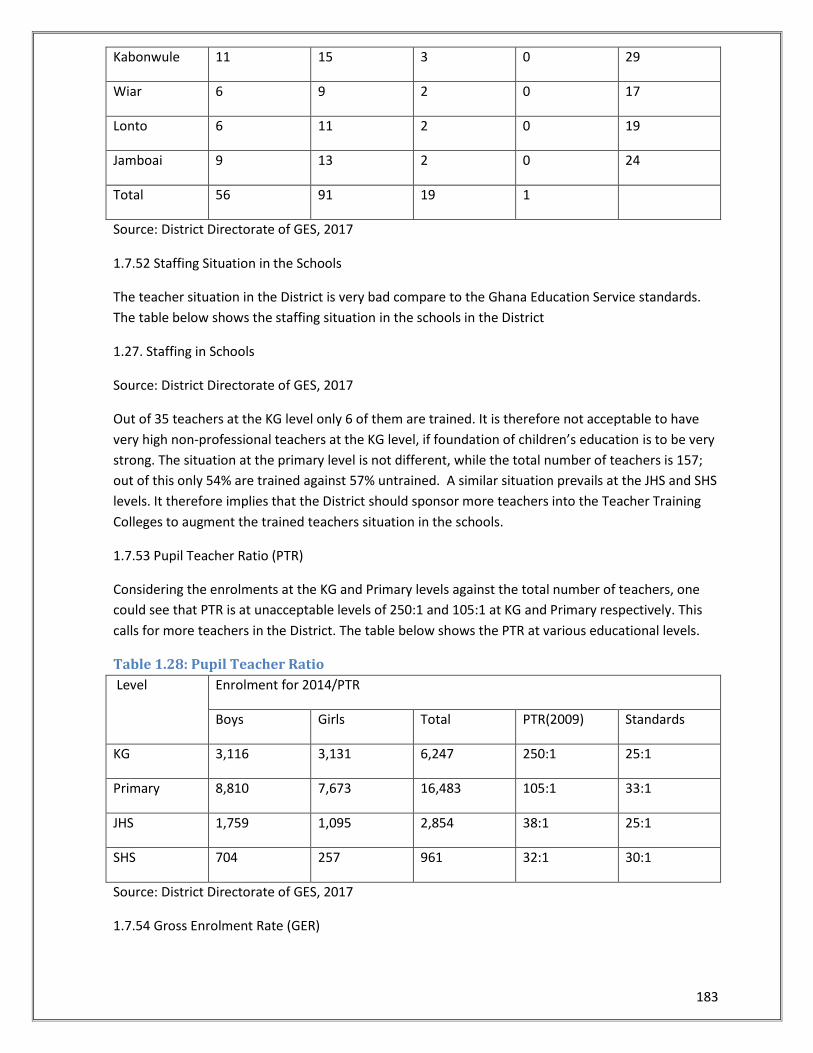
183
Kabonwule 11 15 3 0 29
Wiar 6 9 2 0 17
Lonto 6 11 2 0 19
Jamboai 9 13 2 0 24
Total 56 91 19 1
Source: District Directorate of GES, 2017
1.7.52 Staffing Situation in the Schools
The teacher situation in the District is very bad compare to the Ghana Education Service standards.
The table below shows the staffing situation in the schools in the District
1.27. Staffing in Schools
Source: District Directorate of GES, 2017
Out of 35 teachers at the KG level only 6 of them are trained. It is therefore not acceptable to have
very high non-professional teachers at the KG level, if foundation of children’s education is to be very
strong. The situation at the primary level is not different, while the total number of teachers is 157;
out of this only 54% are trained against 57% untrained. A similar situation prevails at the JHS and SHS
levels. It therefore implies that the District should sponsor more teachers into the Teacher Training
Colleges to augment the trained teachers situation in the schools.
1.7.53 Pupil Teacher Ratio (PTR)
Considering the enrolments at the KG and Primary levels against the total number of teachers, one
could see that PTR is at unacceptable levels of 250:1 and 105:1 at KG and Primary respectively. This
calls for more teachers in the District. The table below shows the PTR at various educational levels.
Table 1.28: Pupil Teacher Ratio
Level Enrolment for 2014/PTR
Boys Girls Total PTR(2009) Standards
KG 3,116 3,131 6,247 250:1 25:1
Primary 8,810 7,673 16,483 105:1 33:1
JHS 1,759 1,095 2,854 38:1 25:1
SHS 704 257 961 32:1 30:1
Source: District Directorate of GES, 2017
1.7.54 Gross Enrolment Rate (GER)
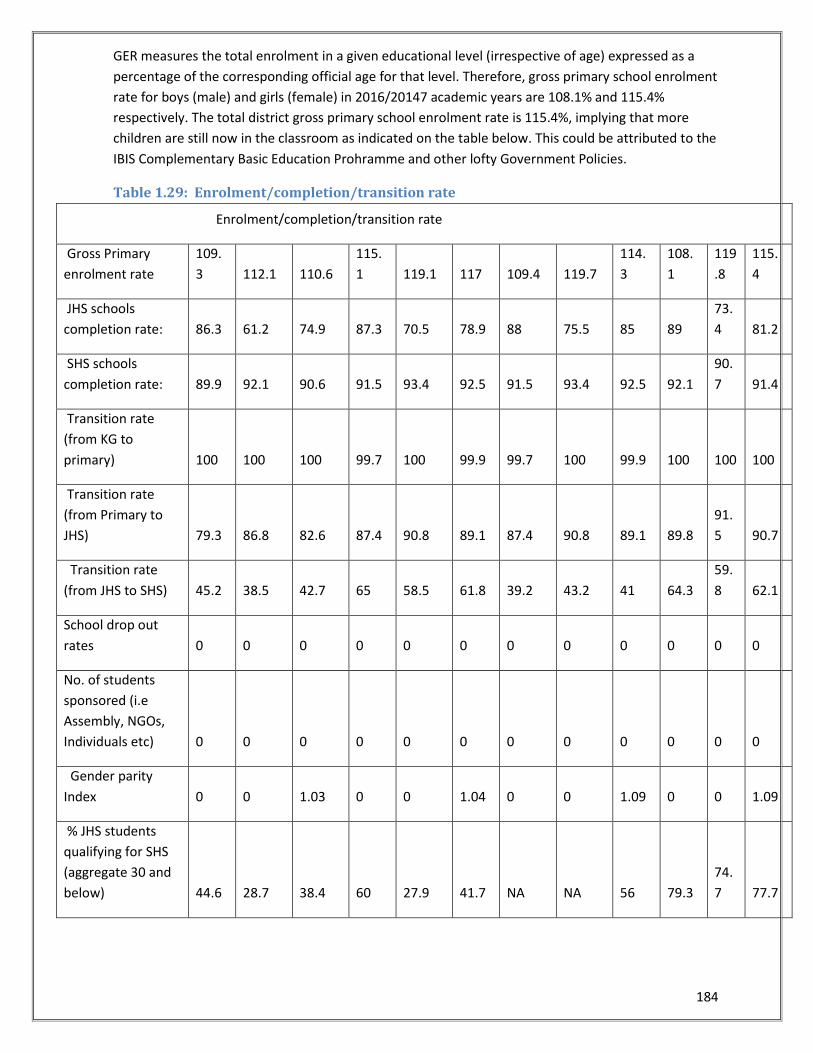
184
GER measures the total enrolment in a given educational level (irrespective of age) expressed as a
percentage of the corresponding official age for that level. Therefore, gross primary school enrolment
rate for boys (male) and girls (female) in 2016/20147 academic years are 108.1% and 115.4%
respectively. The total district gross primary school enrolment rate is 115.4%, implying that more
children are still now in the classroom as indicated on the table below. This could be attributed to the
IBIS Complementary Basic Education Prohramme and other lofty Government Policies.
Table 1.29: Enrolment/completion/transition rate
Enrolment/completion/transition rate
Gross Primary
enrolment rate
109.
3 112.1 110.6
115.
1 119.1 117 109.4 119.7
114.
3
108.
1
119
.8
115.
4
JHS schools
completion rate: 86.3 61.2 74.9 87.3 70.5 78.9 88 75.5 85 89
73.
4 81.2
SHS schools
completion rate: 89.9 92.1 90.6 91.5 93.4 92.5 91.5 93.4 92.5 92.1
90.
7 91.4
Transition rate
(from KG to
primary) 100 100 100 99.7 100 99.9 99.7 100 99.9 100 100 100
Transition rate
(from Primary to
JHS) 79.3 86.8 82.6 87.4 90.8 89.1 87.4 90.8 89.1 89.8
91.
5 90.7
Transition rate
(from JHS to SHS) 45.2 38.5 42.7 65 58.5 61.8 39.2 43.2 41 64.3
59.
8 62.1
School drop out
rates 0 0 0 0 0 0 0 0 0 0 0 0
No. of students
sponsored (i.e
Assembly, NGOs,
Individuals etc) 0 0 0 0 0 0 0 0 0 0 0 0
Gender parity
Index 0 0 1.03 0 0 1.04 0 0 1.09 0 0 1.09
% JHS students
qualifying for SHS
(aggregate 30 and
below) 44.6 28.7 38.4 60 27.9 41.7 NA NA 56 79.3
74.
7 77.7

185
% JHS students
admitted to SHS 0 0 0 0 0 0 0 0 0 0 0 0
Gross Primary School Enrolment Rate
This is the number of pupils who manage to complete JHS 3 in a given year over the number of pupils
who enter JHS 1 in that particular year expressed as a percentage. From the table above, the JHS
completion rates for both boys and girls are 89.7 and 73.4 respectively in 2016/2017 academic year.
The total JHS completion rate in the district is 81.2 for the same academic year. This implies that the
JHS completion rate in the district for JHS is generally high but that of girls is low. There is the need
therefore to encourage more girls to be retained in the schools and also encourage more girls to be
enrolled.
1.7.55 School Infrastructure
There are a number of on-going and completed school building projects in the district. DDF, GETFund,
NORPREP and GSOP fund these projects among others. With the increasing number of school
children of school going age, there is the need for more interventions. Supporting facilities like
furniture and equipment are still inadequate and in some cases completely lacking. The table below
shows schools without standard structures,
Table 1.30: Schools without Standard Structures
No. schools without standard
structures (Temporary Structures) 2014 2015 2016 2017
Total 0 44 44 0 74 74 0 73 73 0 62 62
ECD (KG & Nurseries) 0 38 38 0 48 48 0 47 47 0 43 43
Primary 0 6 6 0 26 26 0 26 26 0 18 18
JHS 0 0 0 0 0 0 0 0 0 0 1 1
SHS 0 0 0 0 0 0 0 0 0 0 0 0
Technical and Vocational Inst. 0 0 0 0 0 0 0 0 0 0 0 0
1.7.56 School Feeding Programme
Currently there are 20 schools benefitting from the School Feeding Programme in the District. Some
of them are:
Kitare Primary
Kojobone Primary
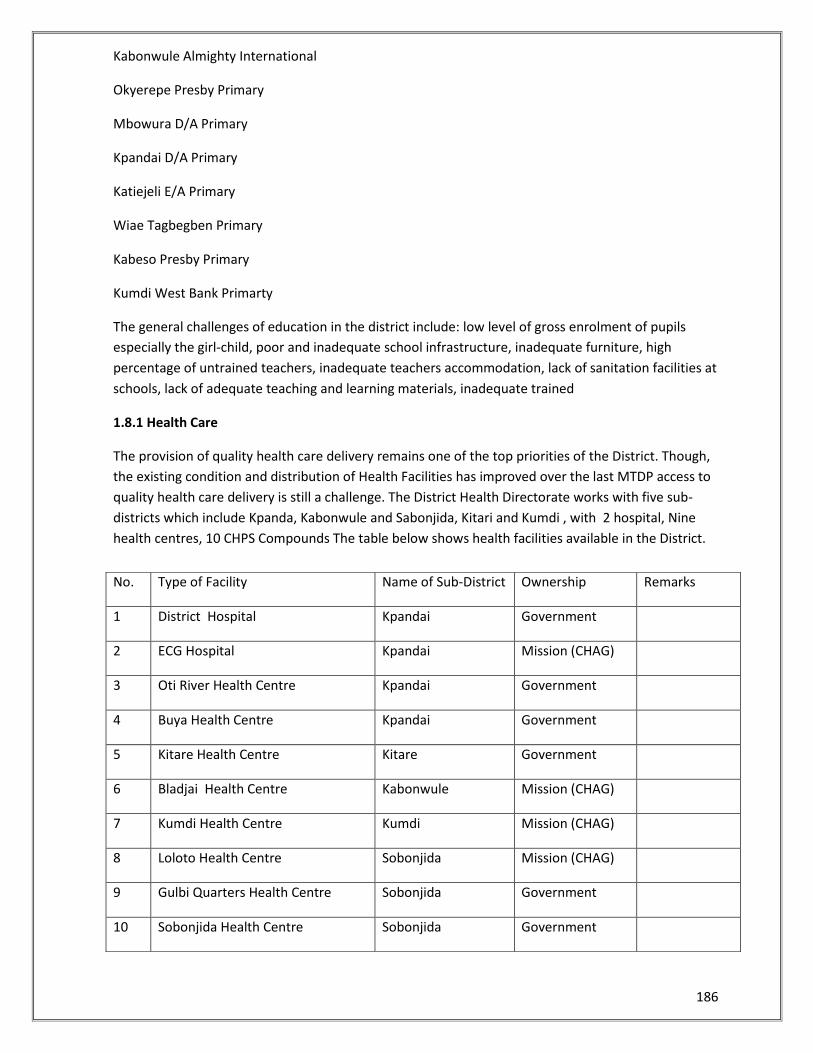
186
Kabonwule Almighty International
Okyerepe Presby Primary
Mbowura D/A Primary
Kpandai D/A Primary
Katiejeli E/A Primary
Wiae Tagbegben Primary
Kabeso Presby Primary
Kumdi West Bank Primarty
The general challenges of education in the district include: low level of gross enrolment of pupils
especially the girl-child, poor and inadequate school infrastructure, inadequate furniture, high
percentage of untrained teachers, inadequate teachers accommodation, lack of sanitation facilities at
schools, lack of adequate teaching and learning materials, inadequate trained
1.8.1 Health Care
The provision of quality health care delivery remains one of the top priorities of the District. Though,
the existing condition and distribution of Health Facilities has improved over the last MTDP access to
quality health care delivery is still a challenge. The District Health Directorate works with five sub-
districts which include Kpanda, Kabonwule and Sabonjida, Kitari and Kumdi , with 2 hospital, Nine
health centres, 10 CHPS Compounds The table below shows health facilities available in the District.
No. Type of Facility Name of Sub-District Ownership Remarks
1 District Hospital Kpandai Government
2 ECG Hospital Kpandai Mission (CHAG)
3 Oti River Health Centre Kpandai Government
4 Buya Health Centre Kpandai Government
5 Kitare Health Centre Kitare Government
6 Bladjai Health Centre Kabonwule Mission (CHAG)
7 Kumdi Health Centre Kumdi Mission (CHAG)
8 Loloto Health Centre Sobonjida Mission (CHAG)
9 Gulbi Quarters Health Centre Sobonjida Government
10 Sobonjida Health Centre Sobonjida Government
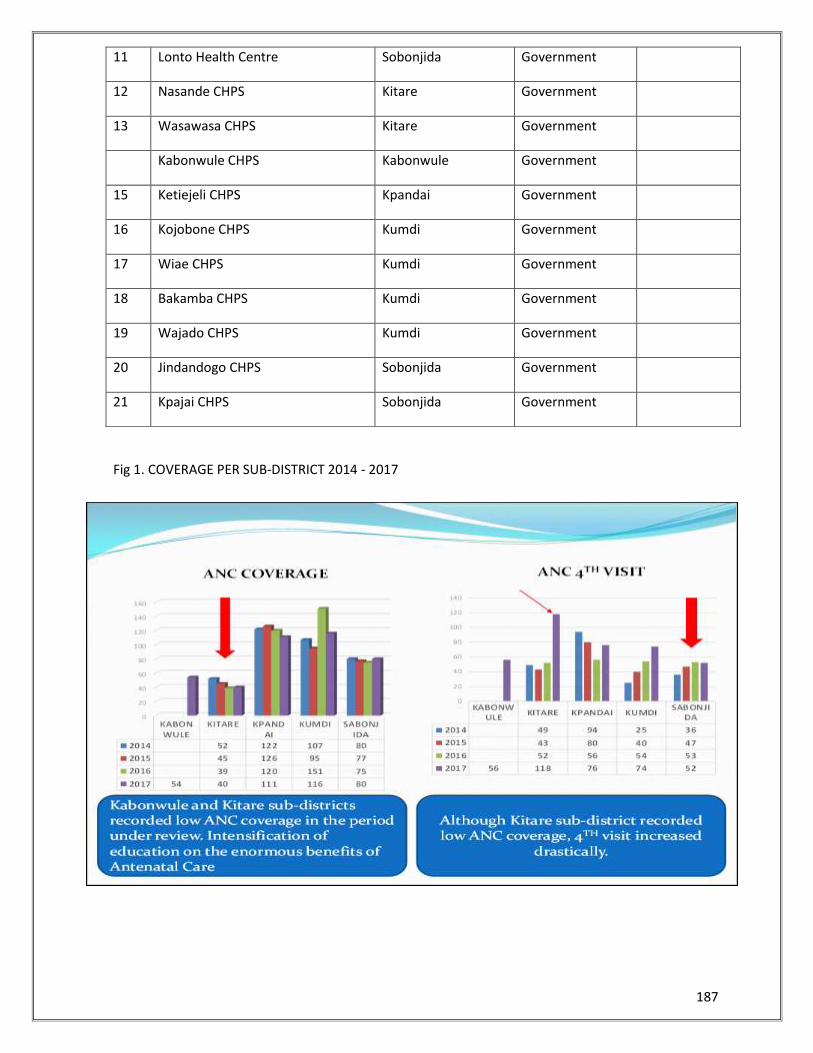
187
Fig 1. COVERAGE PER SUB-DISTRICT 2014 - 2017
11 Lonto Health Centre Sobonjida Government
12 Nasande CHPS Kitare Government
13 Wasawasa CHPS Kitare Government
Kabonwule CHPS Kabonwule Government
15 Ketiejeli CHPS Kpandai Government
16 Kojobone CHPS Kumdi Government
17 Wiae CHPS Kumdi Government
18 Bakamba CHPS Kumdi Government
19 Wajado CHPS Kumdi Government
20 Jindandogo CHPS Sobonjida Government
21 Kpajai CHPS Sobonjida Government

188
For the people in the District to
have access to modern health care,
its means that more health centres
and clinics are to be opened to
augment the twelve health
facilities currently serving the over
100,000 people in the District.
1.7.59 Health Personnel
It is not only the limited health
facilities that the District is
struggling with, but personnel to
man these facilities are virtually
not available. Of all the ten health
facilities in the District, there is no
medical doctor and currently there
are only four medical assistants in
four of the facilities.
The table below shows the health
personnel distribution by facility.
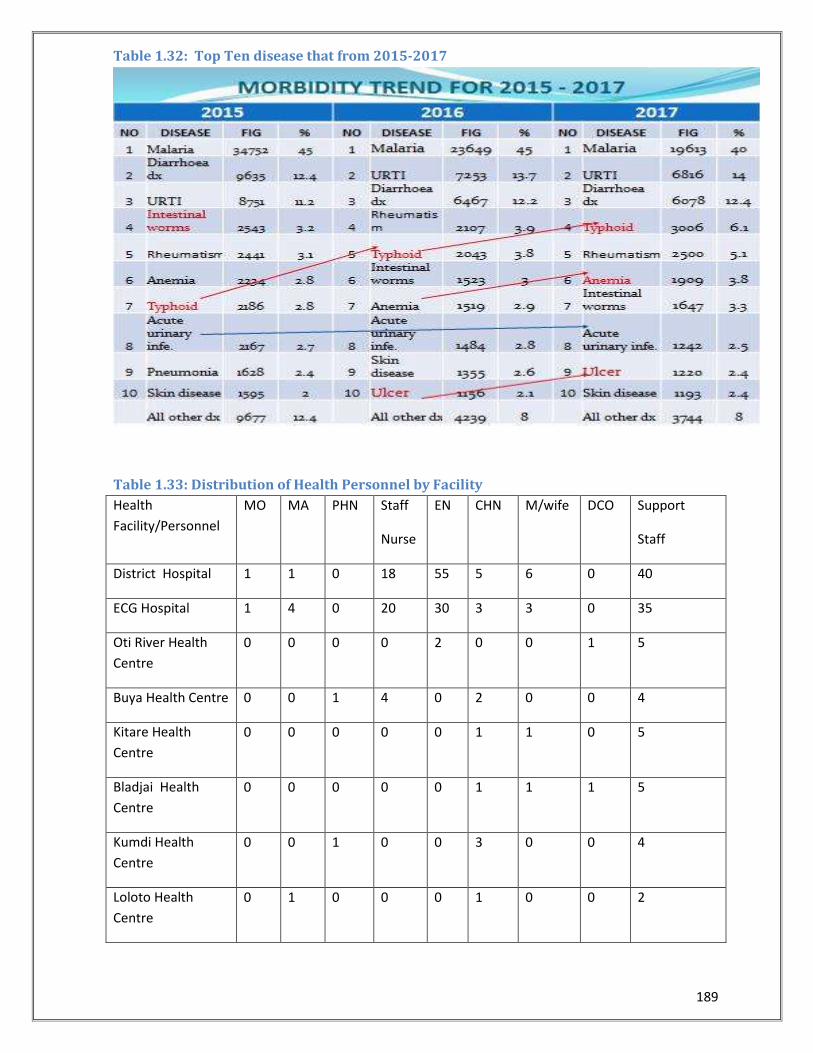
189
Table 1.32: Top Ten disease that from 2015-2017
Table 1.33: Distribution of Health Personnel by Facility
Health
Facility/Personnel
MO MA PHN Staff
Nurse
EN CHN M/wife DCO Support
Staff
District Hospital 1 1 0 18 55 5 6 0 40
ECG Hospital 1 4 0 20 30 3 3 0 35
Oti River Health
Centre
0 0 0 0 2 0 0 1 5
Buya Health Centre 0 0 1 4 0 2 0 0 4
Kitare Health
Centre
0 0 0 0 0 1 1 0 5
Bladjai Health
Centre
0 0 0 0 0 1 1 1 5
Kumdi Health
Centre
0 0 1 0 0 3 0 0 4
Loloto Health
Centre
0 1 0 0 0 1 0 0 2
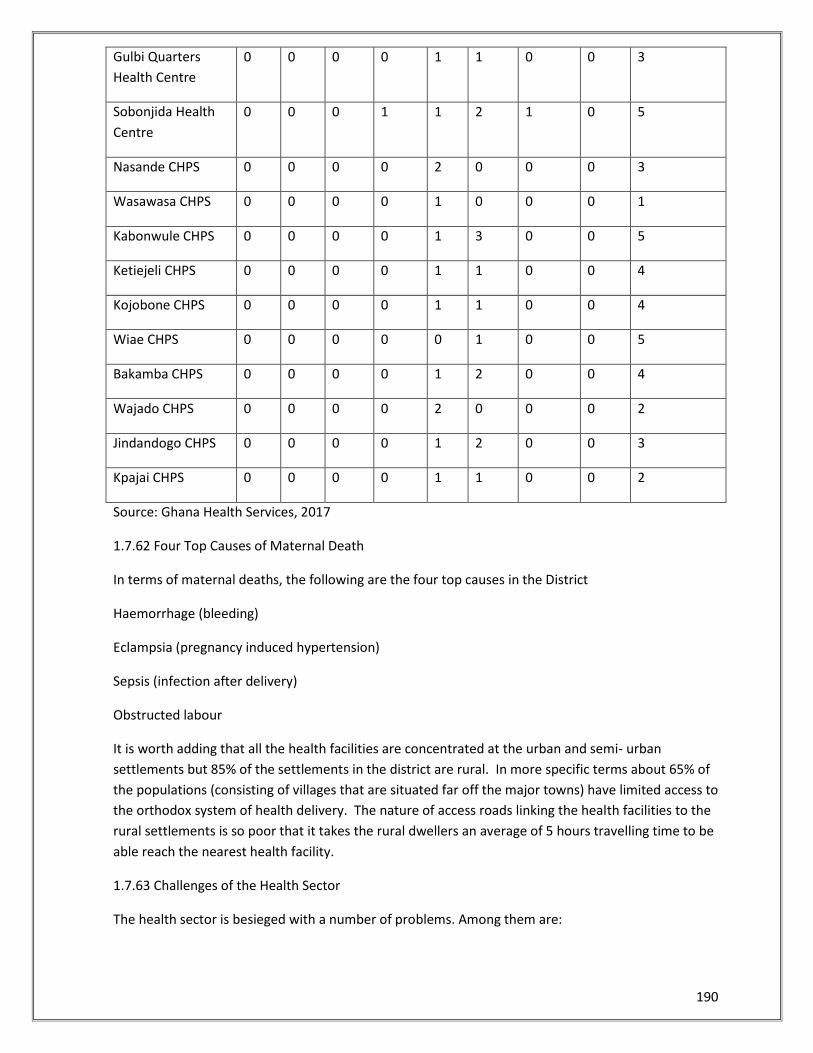
190
Gulbi Quarters
Health Centre
0 0 0 0 1 1 0 0 3
Sobonjida Health
Centre
0 0 0 1 1 2 1 0 5
Nasande CHPS 0 0 0 0 2 0 0 0 3
Wasawasa CHPS 0 0 0 0 1 0 0 0 1
Kabonwule CHPS 0 0 0 0 1 3 0 0 5
Ketiejeli CHPS 0 0 0 0 1 1 0 0 4
Kojobone CHPS 0 0 0 0 1 1 0 0 4
Wiae CHPS 0 0 0 0 0 1 0 0 5
Bakamba CHPS 0 0 0 0 1 2 0 0 4
Wajado CHPS 0 0 0 0 2 0 0 0 2
Jindandogo CHPS 0 0 0 0 1 2 0 0 3
Kpajai CHPS 0 0 0 0 1 1 0 0 2
Source: Ghana Health Services, 2017
1.7.62 Four Top Causes of Maternal Death
In terms of maternal deaths, the following are the four top causes in the District
Haemorrhage (bleeding)
Eclampsia (pregnancy induced hypertension)
Sepsis (infection after delivery)
Obstructed labour
It is worth adding that all the health facilities are concentrated at the urban and semi- urban
settlements but 85% of the settlements in the district are rural. In more specific terms about 65% of
the populations (consisting of villages that are situated far off the major towns) have limited access to
the orthodox system of health delivery. The nature of access roads linking the health facilities to the
rural settlements is so poor that it takes the rural dwellers an average of 5 hours travelling time to be
able reach the nearest health facility.
1.7.63 Challenges of the Health Sector
The health sector is besieged with a number of problems. Among them are:
191
Inadequate health personnel
Lack of a district hospital
Inadequate residential and office accommodation for health personnel
Inadequate logistics
Inadequate health facilities
Poor road network
Lack of ambulance services
1.7.64 Vulnerability Analysis
The analysis of the fundamental issues of vulnerability in relation to it causal factors as well as its
relation to some sections of the population such as women and children, persons with disabilities,
HIV positive persons, the extreme poor and the destitute will inform policy direction of the District
towards designing programmes that will address their concerns.
The district abounds with a number of factors that predispose its population to one risk or the other.
Most of these factors are natural while others are manmade. Analysis of the current situation of the
District revealed that drought or rain failure is one of the factors that predispose the people to the
risk of food insecurity. Crop failure is common during years of drought and the people who are
mostly peasant farmers suffer severe forms of hunger. Small scale rearing of cattle, goats, sheep and
poultry are kept as alternative social security against periods of drought and lean season. Other
phenomenon of significant threat to the people includes floods. Sometimes floods could raze the
whole village down. The building pattern and the roofing materials in most of the communities
including sections of the District capital predispose the communities to the risk of fire outbreaks and
floods.
The combined effects of these factors make the district very vulnerable to acute food shortages, fire
disaster, cholera and other diseases including malaria. Women, children, the aged, the physically
challenged etc are the worst affected. Women and Children are less resilient to the risk of acquiring
sicknesses. Women lack equal access to productive resources such as land as their male
counterparts. They are the least educated in the formal sector and the worst placed in terms of
opportunities for alternative sources of employment.
A further analysis of the social setups of the indigenous people reveals a sense of declining family ties
and this has negative implications on the traditional social security system especially for the aged, the
physically challenged, Orphans and persons infected with HIV/AIDS. There is a growing feeling of
individualism among the people and this gradually weakening the social security system.
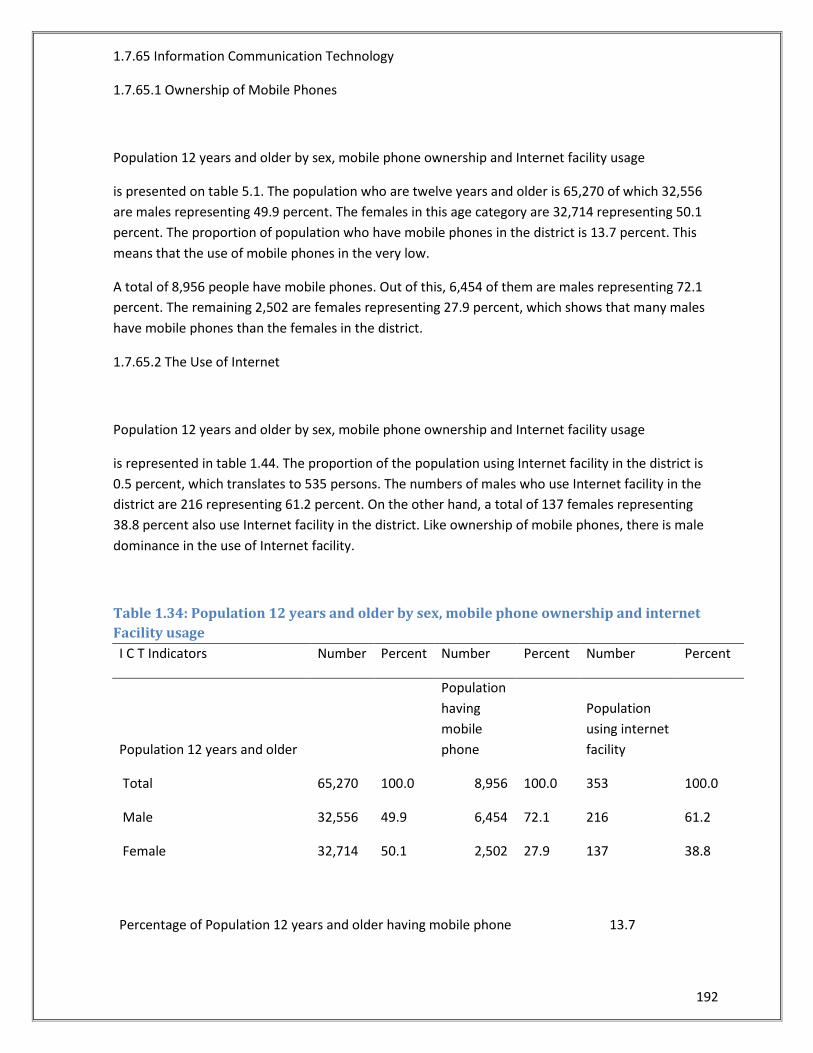
192
1.7.65 Information Communication Technology
1.7.65.1 Ownership of Mobile Phones
Population 12 years and older by sex, mobile phone ownership and Internet facility usage
is presented on table 5.1. The population who are twelve years and older is 65,270 of which 32,556
are males representing 49.9 percent. The females in this age category are 32,714 representing 50.1
percent. The proportion of population who have mobile phones in the district is 13.7 percent. This
means that the use of mobile phones in the very low.
A total of 8,956 people have mobile phones. Out of this, 6,454 of them are males representing 72.1
percent. The remaining 2,502 are females representing 27.9 percent, which shows that many males
have mobile phones than the females in the district.
1.7.65.2 The Use of Internet
Population 12 years and older by sex, mobile phone ownership and Internet facility usage
is represented in table 1.44. The proportion of the population using Internet facility in the district is
0.5 percent, which translates to 535 persons. The numbers of males who use Internet facility in the
district are 216 representing 61.2 percent. On the other hand, a total of 137 females representing
38.8 percent also use Internet facility in the district. Like ownership of mobile phones, there is male
dominance in the use of Internet facility.
Table 1.34: Population 12 years and older by sex, mobile phone ownership and internet
Facility usage
I C T Indicators Number Percent Number Percent Number Percent
Population 12 years and older
Population
having
mobile
phone
Population
using internet
facility
Total 65,270 100.0 8,956 100.0 353 100.0
Male 32,556 49.9 6,454 72.1 216 61.2
Female 32,714 50.1 2,502 27.9 137 38.8
Percentage of Population 12 years and older having mobile phone 13.7
193
Percentage of Population 12 years and older using internet facility 0.5
Source: Ghana Statistical Service, 2010 Population and Housing Census.
1.7.65.3 Household Ownership of Fixed Telephone Lines
Household ownership of fixed telephone by sex of head is presented on table 5.2. The proportion of
households who have fixed telephone lines is 0.2 percent. A total of 26 households in the district
have fixed telephone lines. Twenty-four of them representing 92.3 percent are male-headed
household. Females head the remaining 2 households representing 7.7 percent. Once again, males
head many households who have fixed telephone lines in the district.
1.7.65.4 Household Ownership of Desktop or Laptop Computer
Table 5.2 captures table 1.45 captures household ownership of desktop/laptop computers by sex of
head. There are 16,394 households in the district with only 97 having desktop/laptop computers. This
represents 0.6 percent of the total households. The male-headed households are 14,092 with only 84
having desktop or laptop computers, which represent 86.0 percent. On the other hand, females head
2,302 of the households representing 14.0 percent. Out of this, 13 of the households have
desktop/laptop computers representing 13.4 percent
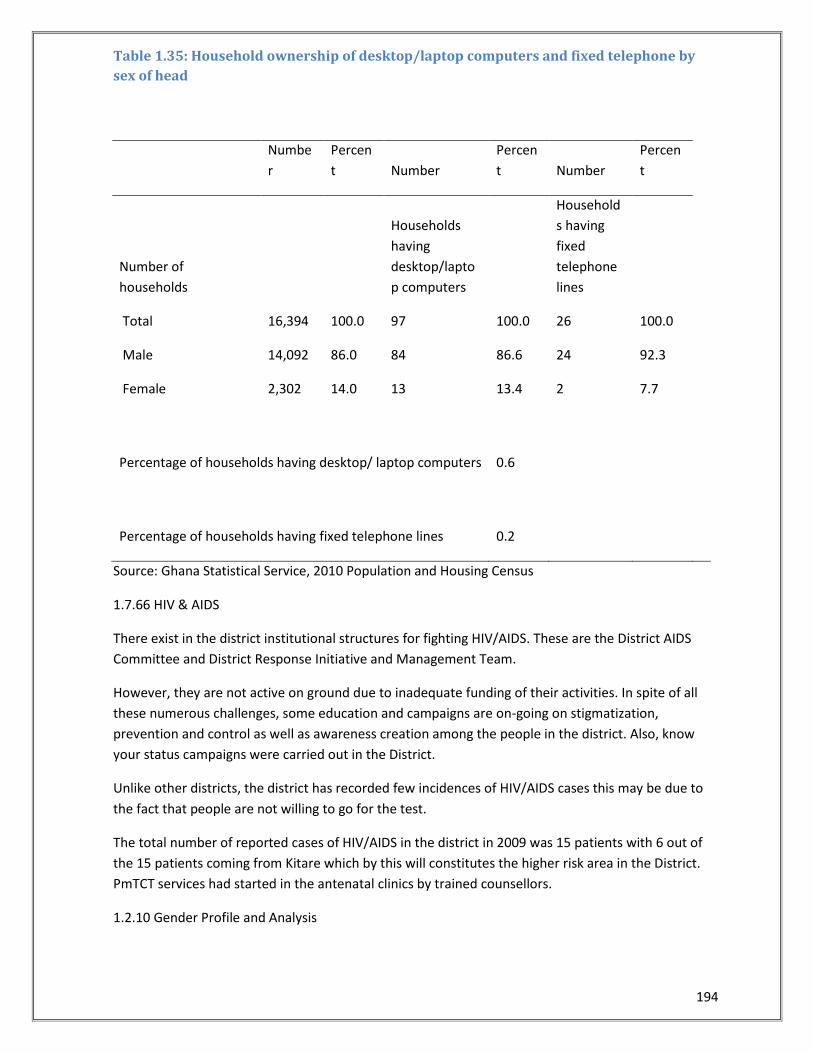
194
Table 1.35: Household ownership of desktop/laptop computers and fixed telephone by
sex of head
Numbe
r
Percen
t Number
Percen
t Number
Percen
t
Number of
households
Households
having
desktop/lapto
p computers
Household
s having
fixed
telephone
lines
Total 16,394 100.0 97 100.0 26 100.0
Male 14,092 86.0 84 86.6 24 92.3
Female 2,302 14.0 13 13.4 2 7.7
Percentage of households having desktop/ laptop computers 0.6
Percentage of households having fixed telephone lines 0.2
Source: Ghana Statistical Service, 2010 Population and Housing Census
1.7.66 HIV & AIDS
There exist in the district institutional structures for fighting HIV/AIDS. These are the District AIDS
Committee and District Response Initiative and Management Team.
However, they are not active on ground due to inadequate funding of their activities. In spite of all
these numerous challenges, some education and campaigns are on-going on stigmatization,
prevention and control as well as awareness creation among the people in the district. Also, know
your status campaigns were carried out in the District.
Unlike other districts, the district has recorded few incidences of HIV/AIDS cases this may be due to
the fact that people are not willing to go for the test.
The total number of reported cases of HIV/AIDS in the district in 2009 was 15 patients with 6 out of
the 15 patients coming from Kitare which by this will constitutes the higher risk area in the District.
PmTCT services had started in the antenatal clinics by trained counsellors.
1.2.10 Gender Profile and Analysis
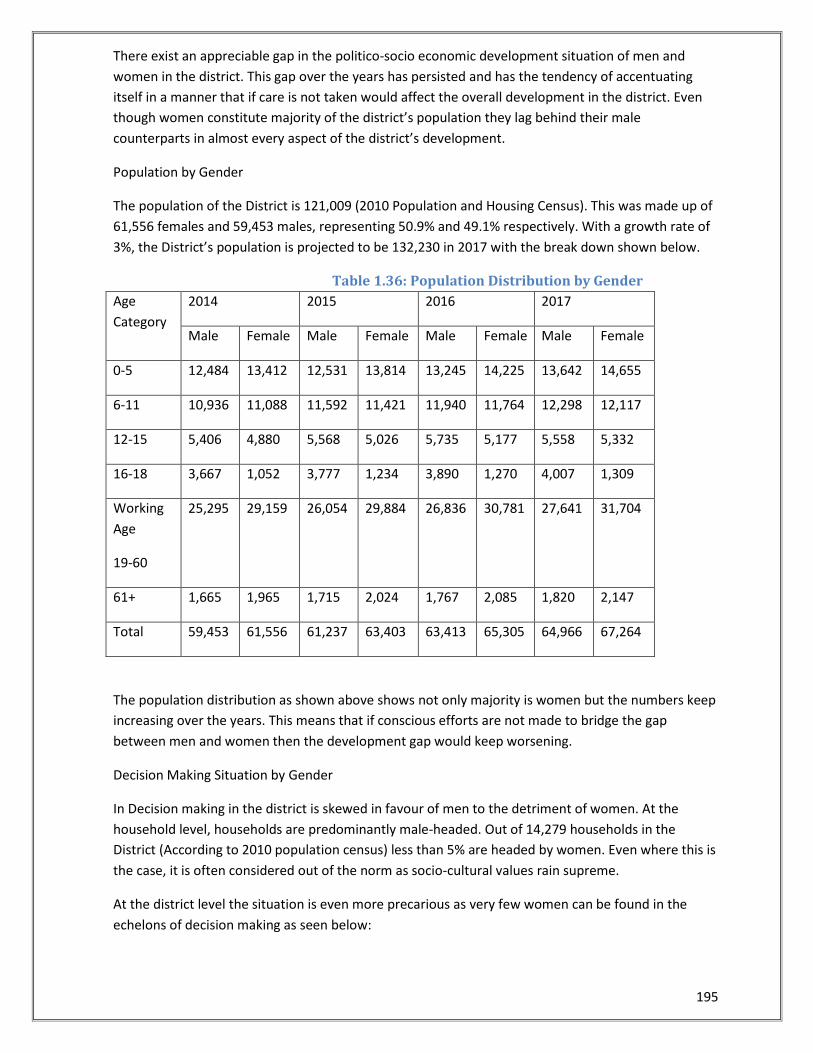
195
There exist an appreciable gap in the politico-socio economic development situation of men and
women in the district. This gap over the years has persisted and has the tendency of accentuating
itself in a manner that if care is not taken would affect the overall development in the district. Even
though women constitute majority of the district’s population they lag behind their male
counterparts in almost every aspect of the district’s development.
Population by Gender
The population of the District is 121,009 (2010 Population and Housing Census). This was made up of
61,556 females and 59,453 males, representing 50.9% and 49.1% respectively. With a growth rate of
3%, the District’s population is projected to be 132,230 in 2017 with the break down shown below.
Table 1.36: Population Distribution by Gender
Age
Category
2014 2015 2016 2017
Male Female Male Female Male Female Male Female
0-5 12,484 13,412 12,531 13,814 13,245 14,225 13,642 14,655
6-11 10,936 11,088 11,592 11,421 11,940 11,764 12,298 12,117
12-15 5,406 4,880 5,568 5,026 5,735 5,177 5,558 5,332
16-18 3,667 1,052 3,777 1,234 3,890 1,270 4,007 1,309
Working
Age
19-60
25,295 29,159 26,054 29,884 26,836 30,781 27,641 31,704
61+ 1,665 1,965 1,715 2,024 1,767 2,085 1,820 2,147
Total 59,453 61,556 61,237 63,403 63,413 65,305 64,966 67,264
The population distribution as shown above shows not only majority is women but the numbers keep
increasing over the years. This means that if conscious efforts are not made to bridge the gap
between men and women then the development gap would keep worsening.
Decision Making Situation by Gender
In Decision making in the district is skewed in favour of men to the detriment of women. At the
household level, households are predominantly male-headed. Out of 14,279 households in the
District (According to 2010 population census) less than 5% are headed by women. Even where this is
the case, it is often considered out of the norm as socio-cultural values rain supreme.
At the district level the situation is even more precarious as very few women can be found in the
echelons of decision making as seen below:
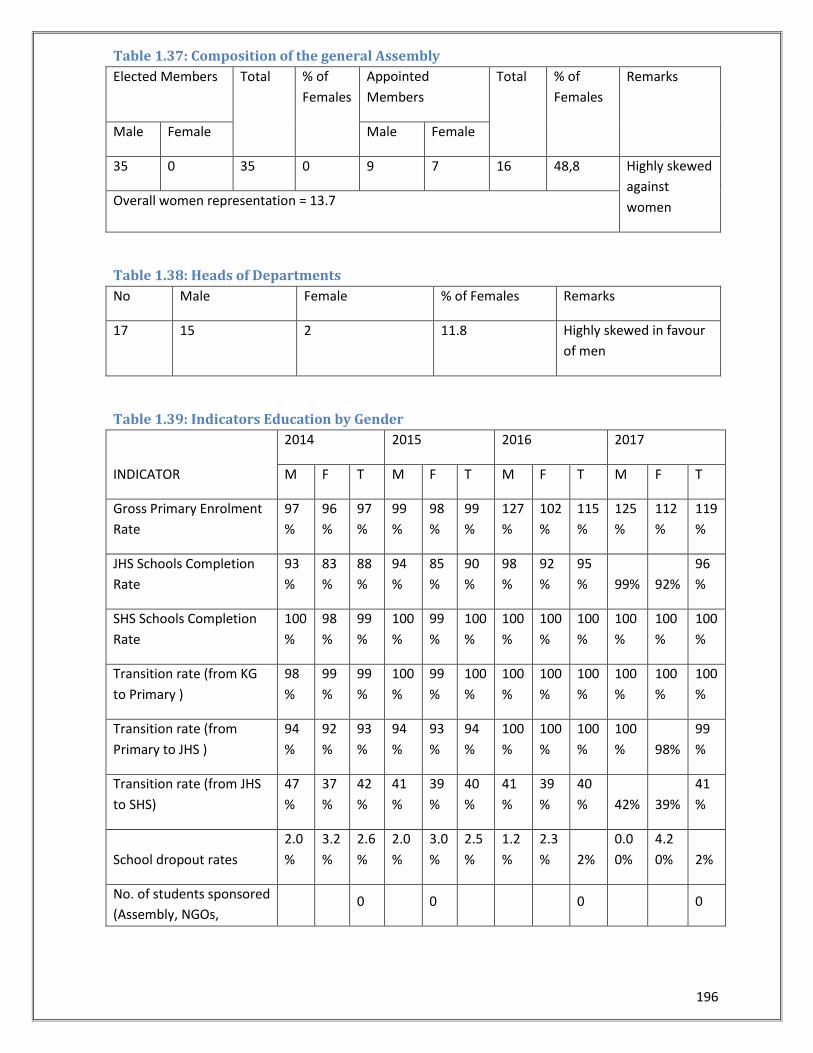
196
Table 1.37: Composition of the general Assembly
Elected Members Total % of
Females
Appointed
Members
Total % of
Females
Remarks
Male Female Male Female
35 0 35 0 9 7 16 48,8 Highly skewed
against
women Overall women representation = 13.7
Table 1.38: Heads of Departments
No Male Female % of Females Remarks
17 15 2 11.8 Highly skewed in favour
of men
Table 1.39: Indicators Education by Gender
INDICATOR
2014 2015 2016 2017
M F T M F T M F T M F T
Gross Primary Enrolment
Rate
97
%
96
%
97
%
99
%
98
%
99
%
127
%
102
%
115
%
125
%
112
%
119
%
JHS Schools Completion
Rate
93
%
83
%
88
%
94
%
85
%
90
%
98
%
92
%
95
% 99% 92%
96
%
SHS Schools Completion
Rate
100
%
98
%
99
%
100
%
99
%
100
%
100
%
100
%
100
%
100
%
100
%
100
%
Transition rate (from KG
to Primary )
98
%
99
%
99
%
100
%
99
%
100
%
100
%
100
%
100
%
100
%
100
%
100
%
Transition rate (from
Primary to JHS )
94
%
92
%
93
%
94
%
93
%
94
%
100
%
100
%
100
%
100
% 98%
99
%
Transition rate (from JHS
to SHS)
47
%
37
%
42
%
41
%
39
%
40
%
41
%
39
%
40
% 42% 39%
41
%
School dropout rates
2.0
%
3.2
%
2.6
%
2.0
%
3.0
%
2.5
%
1.2
%
2.3
% 2%
0.0
0%
4.2
0% 2%
No. of students sponsored
(Assembly, NGOs, 0 0 0 0
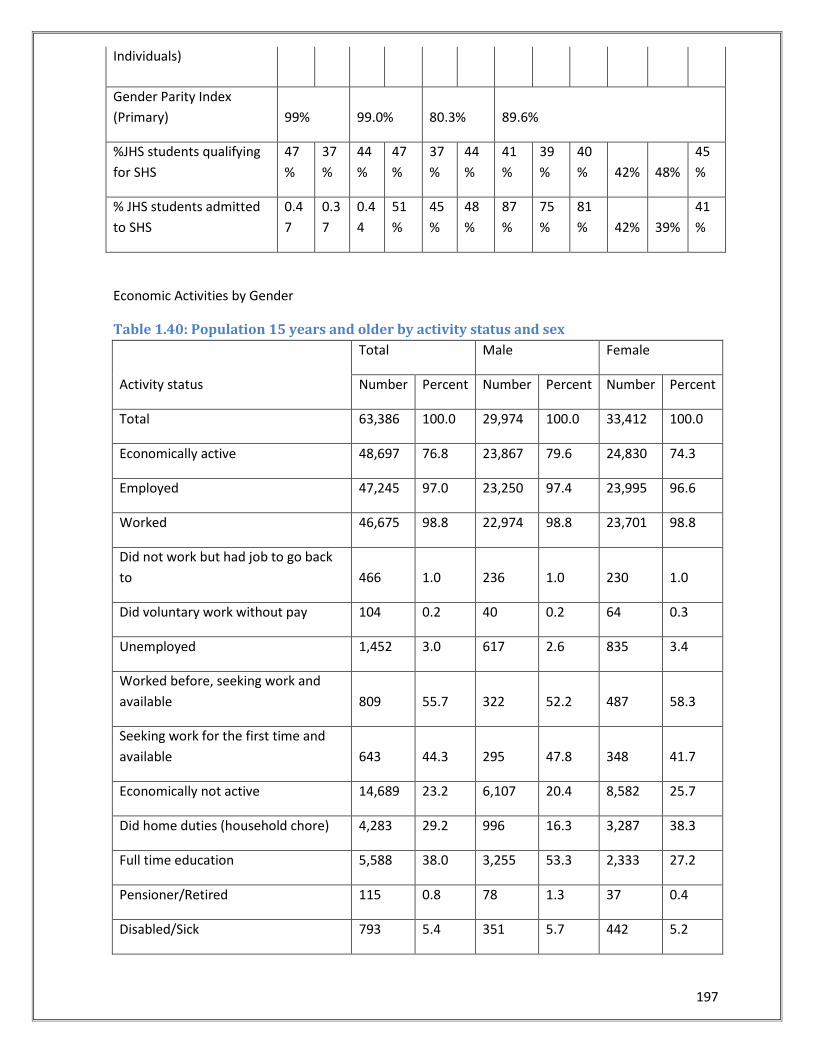
197
Individuals)
Gender Parity Index
(Primary) 99% 99.0% 80.3% 89.6%
%JHS students qualifying
for SHS
47
%
37
%
44
%
47
%
37
%
44
%
41
%
39
%
40
% 42% 48%
45
%
% JHS students admitted
to SHS
0.4
7
0.3
7
0.4
4
51
%
45
%
48
%
87
%
75
%
81
% 42% 39%
41
%
Economic Activities by Gender
Table 1.40: Population 15 years and older by activity status and sex
Activity status
Total Male Female
Number Percent Number Percent Number Percent
Total 63,386 100.0 29,974 100.0 33,412 100.0
Economically active 48,697 76.8 23,867 79.6 24,830 74.3
Employed 47,245 97.0 23,250 97.4 23,995 96.6
Worked 46,675 98.8 22,974 98.8 23,701 98.8
Did not work but had job to go back
to 466 1.0 236 1.0 230 1.0
Did voluntary work without pay 104 0.2 40 0.2 64 0.3
Unemployed 1,452 3.0 617 2.6 835 3.4
Worked before, seeking work and
available 809 55.7 322 52.2 487 58.3
Seeking work for the first time and
available 643 44.3 295 47.8 348 41.7
Economically not active 14,689 23.2 6,107 20.4 8,582 25.7
Did home duties (household chore) 4,283 29.2 996 16.3 3,287 38.3
Full time education 5,588 38.0 3,255 53.3 2,333 27.2
Pensioner/Retired 115 0.8 78 1.3 37 0.4
Disabled/Sick 793 5.4 351 5.7 442 5.2
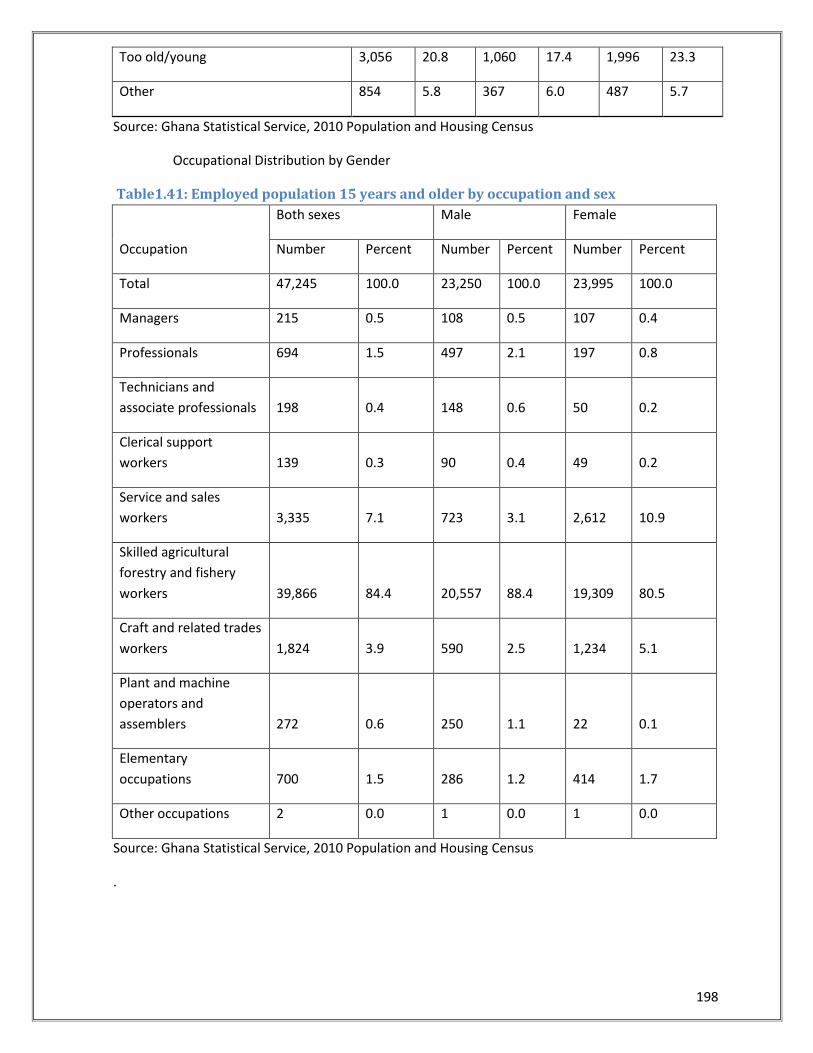
198
Too old/young 3,056 20.8 1,060 17.4 1,996 23.3
Other 854 5.8 367 6.0 487 5.7
Source: Ghana Statistical Service, 2010 Population and Housing Census
Occupational Distribution by Gender
Table1.41: Employed population 15 years and older by occupation and sex
Occupation
Both sexes Male Female
Number Percent Number Percent Number Percent
Total 47,245 100.0 23,250 100.0 23,995 100.0
Managers 215 0.5 108 0.5 107 0.4
Professionals 694 1.5 497 2.1 197 0.8
Technicians and
associate professionals 198 0.4 148 0.6 50 0.2
Clerical support
workers 139 0.3 90 0.4 49 0.2
Service and sales
workers 3,335 7.1 723 3.1 2,612 10.9
Skilled agricultural
forestry and fishery
workers 39,866 84.4 20,557 88.4 19,309 80.5
Craft and related trades
workers 1,824 3.9 590 2.5 1,234 5.1
Plant and machine
operators and
assemblers 272 0.6 250 1.1 22 0.1
Elementary
occupations 700 1.5 286 1.2 414 1.7
Other occupations 2 0.0 1 0.0 1 0.0
Source: Ghana Statistical Service, 2010 Population and Housing Census
.
199
In Kpandai District for instance, farmlands are owned by the traditional authorities/rulers and some
lands are family owned and are therefore inherited by family members.
Also, in terms of gender, men who control both the physical and natural resources whilst few women
have access to farmlands own majority of the farmlands. Children (both boys and girls) do not own
land at all.
1.7.5 Environment, Climate Change and Green Economy
The area experiences one seasonal rainfall. The period is characterised with heavy rainfall thereby
perennial floods especially area closer to both river oti and White Volta tributaries. The vegetative
cover is very thick which makes the District endowed with fertile soils enhancing its food basket
status.
1.7. 6 Climate Change and Vulnerability Analysis
The people in the district face a number of vulnerability factors. The depletion of the natural
vegetation cover has exposed the area to natural disasters such wind/rainstorms and flooding of
devastating proportions. Over the last three years alone, over 50 classroom blocks and several
households have been reported ripped off. Many families have lost their farms to flood due to the
erratic and increasing variability of rainfall pattern in recent times. This situation does not only
expose the people to a high possibility of food insecurity but also increases the overall poverty
situation in the district as majority of the people eke out a living from peasant agriculture that
depends on the generosity of nature.
HIV/AIDs cases in the district appear to be on the rise. Statistics from the district directorate of health
indicates that there have been increases of cases screened in the health centers from 12% in 2012 to
19% in 2017. Even though the district hospital is a referral center for many districts and there is a
possibility that some of the cases could be from other districts the case still remains that the disease
is real and its incidence appears to be rising in the district. The district should therefore intensify
efforts to increase awareness on the disease and encourage healthy sexual relations among the
populace to contain and reduce the menace in the district.
There are a number of people living with various kinds of disabilities in the district. According GSS
(2010), over 3,000 people in the district live with different kinds of disabilities. These people are
faced with various challenges such as inadequate access to education, poor access to economic
assets, inadequate voice in decision making at all levels poor access to public infrastructure and the
general societal neglect among others. The Assembly will continue to roll out progrommes such as
the LEAP, improving access to public infrastructure and others to ameliorate the plight of this
segment of the society.
200
1.7.7 Summary of Key Development Problems, Issues and Gaps Identified from Performance Review
Situational Analysis
The following gaps/development problems were ascertained from an analysis of the current situation
of the District and these will form the basis for development intervention over the medium term
period:
1.7.69.1 Enhancing Competitiveness In Ghana’s Private Sector
Poor road network
Weak institutional support to farmers
Low farmer managerial and entrepreneurial skills
Inadequate credit facilities for farmers/businessmen in the district
High cost of farm inputs
Low coverage of electricity
1.7.69.2 Human Development, Productivity And Employment.
Low coverage of health facilities in the district
Inadequate technical staff for health care delivery
Inadequate supply of essential drugs to the clinics
Inadequate medical doctors in the district
Absence of an ambulance for the health care delivery
Low coverage of potable water provision in the District
Low sanitation coverage in the District
Low level of gross enrolment of pupils, especially girls, in basic schools.
Inadequate trained teachers
Inadequate teaching& learning materials
Inadequate incentives and motivation for teachers
Absence of vocational & technical institute in the District
1.7.69.3 Transparent And Accountable Governance
Non functioning sub district structures
Low participation of women in local governance
201
Low internally generated revenue
Inadequate residential accommodation for District Staff
Persistent ethnic conflicts
Lack of adequate security points in the communities
Inadequate means of transport for decentralised departments
1.7.69.4 Accelerated Agricultural Modernisation and Sustainable Natural Resources Management
High Extension officer –Farmer Ratio
High post harvest losses
Over reliance on rain-fed agriculture
High farmer tractor ratio
Persistent bush burning in the District
1.7.69.5 Infrastructure and Human Settlement Development
Inadequate office accommodation for central administration and decentralised departments
Poor and inadequate school infrastructure
Poor road network
Inadequate residential accommodation for the critical staff
1.1.7 Challenges
Implementation of some programmes/ projects outside the plan.
Inadequate / irregular flow of funds
Weak monitoring of programmes/ projects as a result of low involvement of Planning and Budget
Units in project implementation.
Limited community participation in project implementation and monitoring.
Weak departmental linkages.
1.1.8 Lessons Learnt
Resourcing the Monitoring Team will enhance efficient implementation of projects and programmes.
Increase community participation will lead to successful project implementation, operation and
maintenance.

202
Downsizing programmes /projects in the plan will lead to high achievement level of planned
activities.
High stakeholders’ participation in project/programme identification/implementation and monitoring
and evaluation enhances achievement levels.
1.7.70 Harmonisation of Community Needs and Aspirations with Identified Key Development
Gaps/Problems/issues.
In order to ensure harmony, each community’s Needs and Aspirations should be scored against the
key gaps/problems or issues identified under the review of performances in a scale as follows:
DEFINITION SCORE
Strong Relationship 2
Weak Relationship 1
No Relationship 0
Table1.42. Harmonisation of Community needs and Aspirations with identified
Development Problems/Issues from review of performance and profiling from 2010-
2013. GSGDA1 Thematic Area: Human Resource Development, Productivity and
Employment
COMMUNITY NEEDS AND ASPIRATIONS IDENTIFIED KEY DEVELOPMENT
GAPS/PROBLEMS/ISSUES ( FROM
PERFORMA NCE AND PROFILE)
SCORE
Accommodation for Nurses Inadequate residential accommodation
for health staff
2
Improve health Infrastructure Low coverage of health facilities in the
District
2
Provision of Essential Services Absence of VCT/PmTCT services for
HIV/AIDS
2
Trained Teachers/ Nurses Inadequate Technical Staff for Health care
Delivery
2
Provision of Essential Services Inadequate Supply of Essential Drugs to
the Clinics
1
Provision of Essential Services Poor Road Network making Health care
Delivery difficult
2
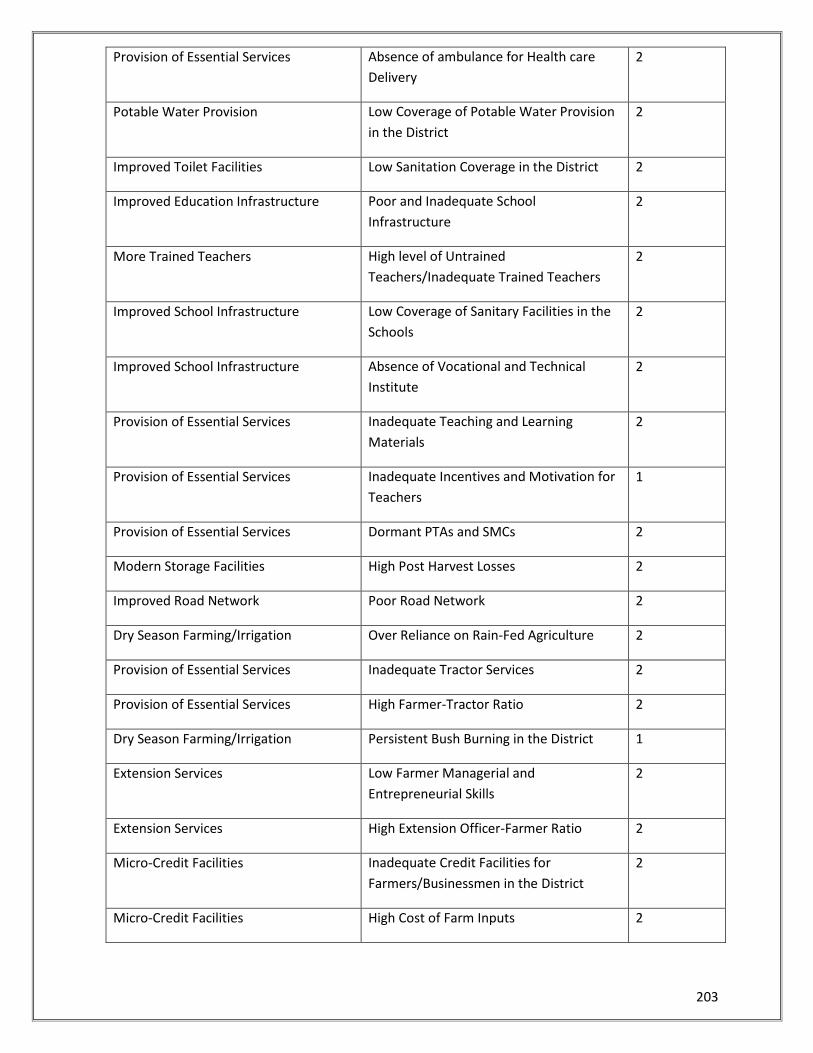
203
Provision of Essential Services Absence of ambulance for Health care
Delivery
2
Potable Water Provision Low Coverage of Potable Water Provision
in the District
2
Improved Toilet Facilities Low Sanitation Coverage in the District 2
Improved Education Infrastructure Poor and Inadequate School
Infrastructure
2
More Trained Teachers High level of Untrained
Teachers/Inadequate Trained Teachers
2
Improved School Infrastructure Low Coverage of Sanitary Facilities in the
Schools
2
Improved School Infrastructure Absence of Vocational and Technical
Institute
2
Provision of Essential Services Inadequate Teaching and Learning
Materials
2
Provision of Essential Services Inadequate Incentives and Motivation for
Teachers
1
Provision of Essential Services Dormant PTAs and SMCs 2
Modern Storage Facilities High Post Harvest Losses 2
Improved Road Network Poor Road Network 2
Dry Season Farming/Irrigation Over Reliance on Rain-Fed Agriculture 2
Provision of Essential Services Inadequate Tractor Services 2
Provision of Essential Services High Farmer-Tractor Ratio 2
Dry Season Farming/Irrigation Persistent Bush Burning in the District 1
Extension Services Low Farmer Managerial and
Entrepreneurial Skills
2
Extension Services High Extension Officer-Farmer Ratio 2
Micro-Credit Facilities Inadequate Credit Facilities for
Farmers/Businessmen in the District
2
Micro-Credit Facilities High Cost of Farm Inputs 2
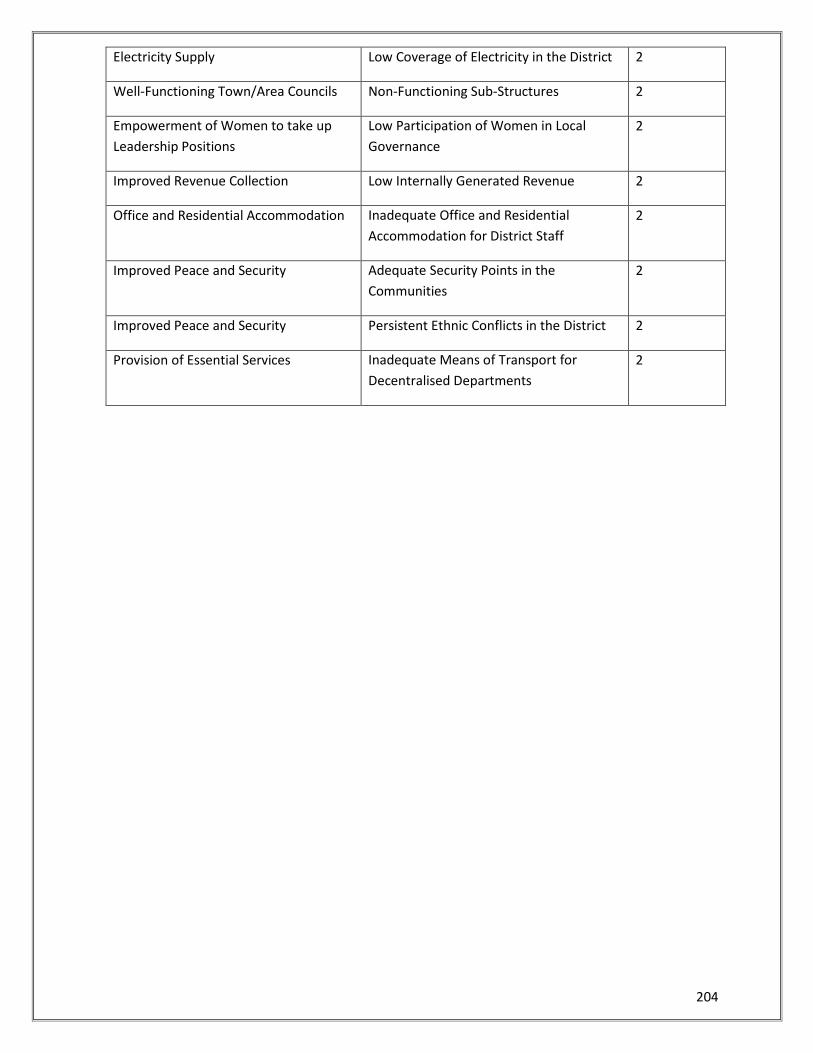
204
Electricity Supply Low Coverage of Electricity in the District 2
Well-Functioning Town/Area Councils Non-Functioning Sub-Structures 2
Empowerment of Women to take up
Leadership Positions
Low Participation of Women in Local
Governance
2
Improved Revenue Collection Low Internally Generated Revenue 2
Office and Residential Accommodation Inadequate Office and Residential
Accommodation for District Staff
2
Improved Peace and Security Adequate Security Points in the
Communities
2
Improved Peace and Security Persistent Ethnic Conflicts in the District 2
Provision of Essential Services Inadequate Means of Transport for
Decentralised Departments
2
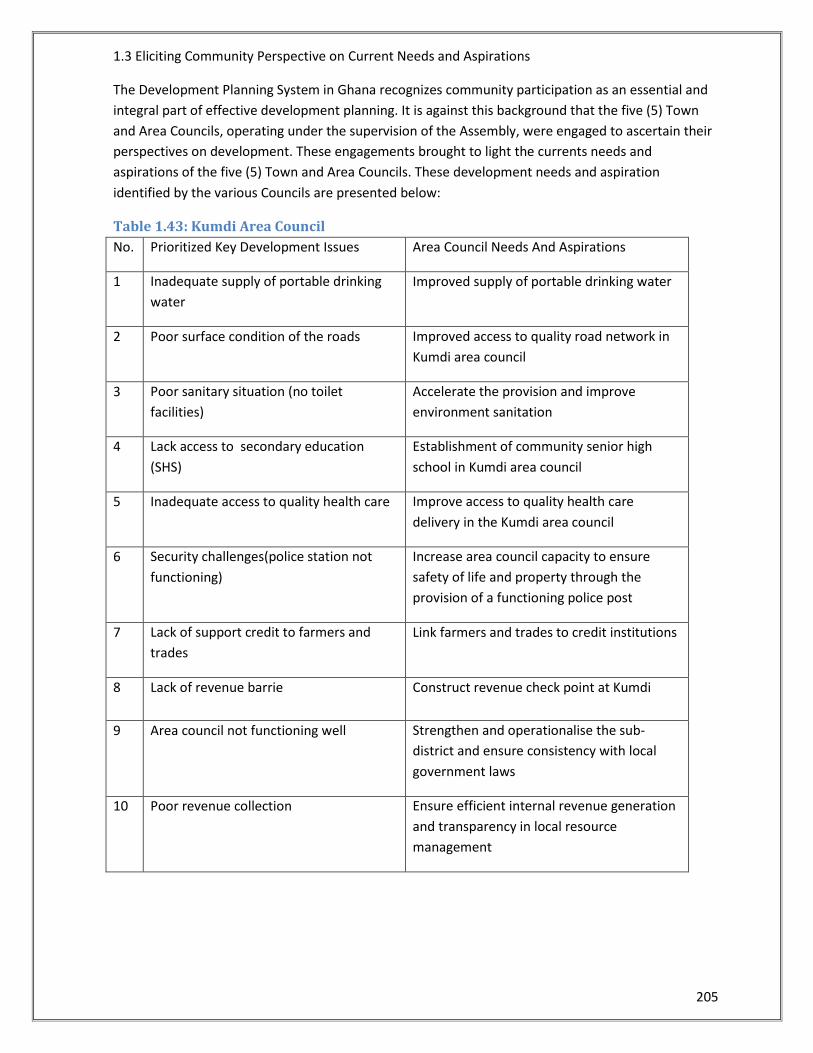
205
1.3 Eliciting Community Perspective on Current Needs and Aspirations
The Development Planning System in Ghana recognizes community participation as an essential and
integral part of effective development planning. It is against this background that the five (5) Town
and Area Councils, operating under the supervision of the Assembly, were engaged to ascertain their
perspectives on development. These engagements brought to light the currents needs and
aspirations of the five (5) Town and Area Councils. These development needs and aspiration
identified by the various Councils are presented below:
Table 1.43: Kumdi Area Council
No. Prioritized Key Development Issues Area Council Needs And Aspirations
1 Inadequate supply of portable drinking
water
Improved supply of portable drinking water
2 Poor surface condition of the roads Improved access to quality road network in
Kumdi area council
3 Poor sanitary situation (no toilet
facilities)
Accelerate the provision and improve
environment sanitation
4 Lack access to secondary education
(SHS)
Establishment of community senior high
school in Kumdi area council
5 Inadequate access to quality health care Improve access to quality health care
delivery in the Kumdi area council
6 Security challenges(police station not
functioning)
Increase area council capacity to ensure
safety of life and property through the
provision of a functioning police post
7 Lack of support credit to farmers and
trades
Link farmers and trades to credit institutions
8 Lack of revenue barrie Construct revenue check point at Kumdi
9 Area council not functioning well Strengthen and operationalise the sub-
district and ensure consistency with local
government laws
10 Poor revenue collection Ensure efficient internal revenue generation
and transparency in local resource
management
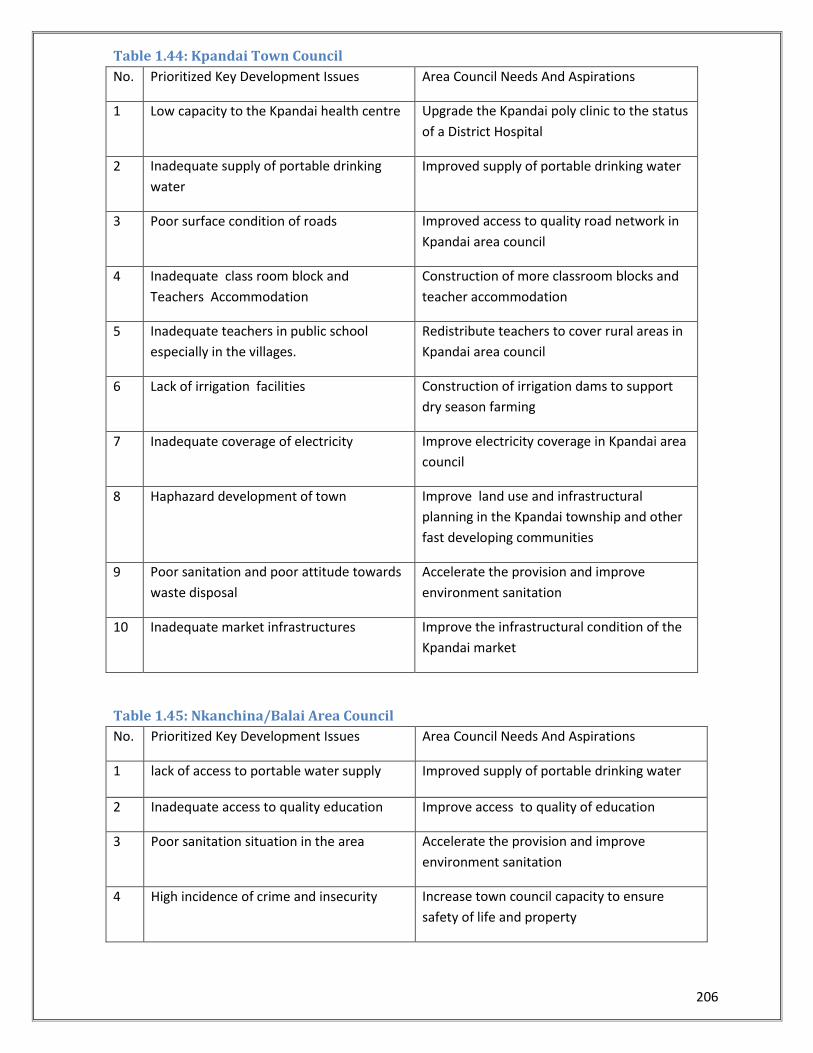
206
Table 1.44: Kpandai Town Council
No. Prioritized Key Development Issues Area Council Needs And Aspirations
1 Low capacity to the Kpandai health centre Upgrade the Kpandai poly clinic to the status
of a District Hospital
2 Inadequate supply of portable drinking
water
Improved supply of portable drinking water
3 Poor surface condition of roads Improved access to quality road network in
Kpandai area council
4 Inadequate class room block and
Teachers Accommodation
Construction of more classroom blocks and
teacher accommodation
5 Inadequate teachers in public school
especially in the villages.
Redistribute teachers to cover rural areas in
Kpandai area council
6 Lack of irrigation facilities Construction of irrigation dams to support
dry season farming
7 Inadequate coverage of electricity Improve electricity coverage in Kpandai area
council
8 Haphazard development of town Improve land use and infrastructural
planning in the Kpandai township and other
fast developing communities
9 Poor sanitation and poor attitude towards
waste disposal
Accelerate the provision and improve
environment sanitation
10 Inadequate market infrastructures Improve the infrastructural condition of the
Kpandai market
Table 1.45: Nkanchina/Balai Area Council
No. Prioritized Key Development Issues Area Council Needs And Aspirations
1 lack of access to portable water supply Improved supply of portable drinking water
2 Inadequate access to quality education Improve access to quality of education
3 Poor sanitation situation in the area Accelerate the provision and improve
environment sanitation
4 High incidence of crime and insecurity Increase town council capacity to ensure
safety of life and property
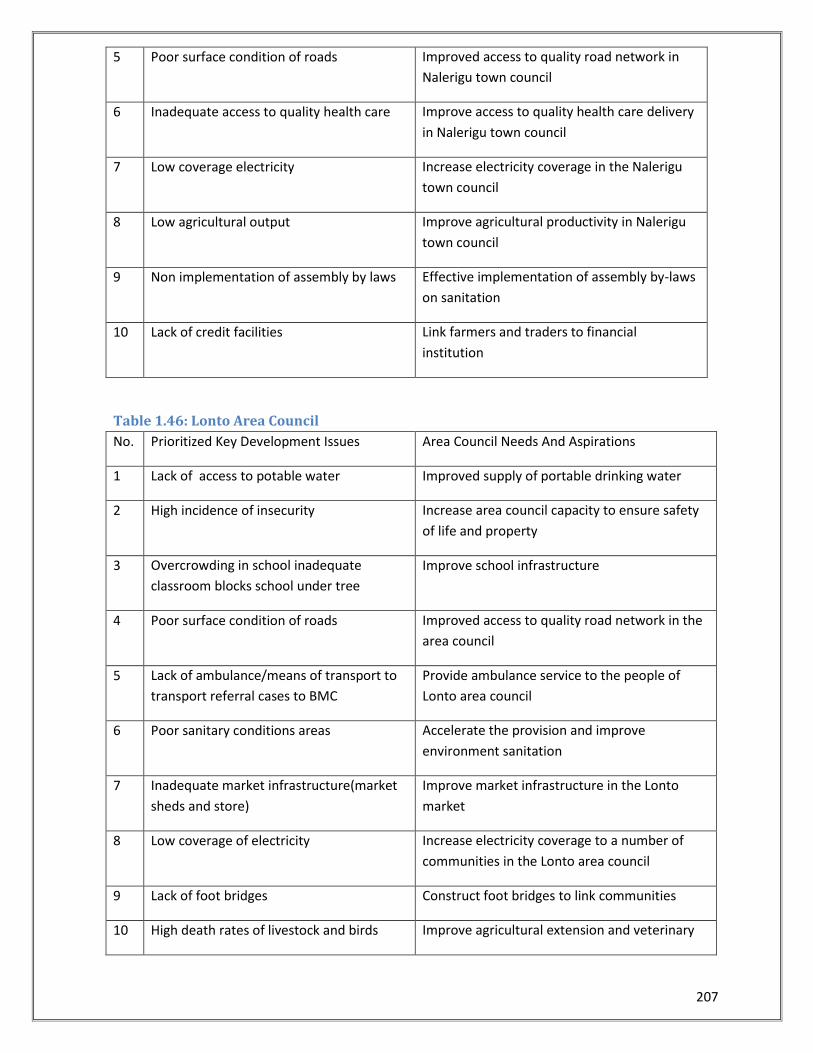
207
5 Poor surface condition of roads Improved access to quality road network in
Nalerigu town council
6 Inadequate access to quality health care Improve access to quality health care delivery
in Nalerigu town council
7 Low coverage electricity Increase electricity coverage in the Nalerigu
town council
8 Low agricultural output Improve agricultural productivity in Nalerigu
town council
9 Non implementation of assembly by laws Effective implementation of assembly by-laws
on sanitation
10 Lack of credit facilities Link farmers and traders to financial
institution
Table 1.46: Lonto Area Council
No. Prioritized Key Development Issues Area Council Needs And Aspirations
1 Lack of access to potable water Improved supply of portable drinking water
2 High incidence of insecurity Increase area council capacity to ensure safety
of life and property
3 Overcrowding in school inadequate
classroom blocks school under tree
Improve school infrastructure
4 Poor surface condition of roads Improved access to quality road network in the
area council
5 Lack of ambulance/means of transport to
transport referral cases to BMC
Provide ambulance service to the people of
Lonto area council
6 Poor sanitary conditions areas Accelerate the provision and improve
environment sanitation
7 Inadequate market infrastructure(market
sheds and store)
Improve market infrastructure in the Lonto
market
8 Low coverage of electricity Increase electricity coverage to a number of
communities in the Lonto area council
9 Lack of foot bridges Construct foot bridges to link communities
10 High death rates of livestock and birds Improve agricultural extension and veterinary
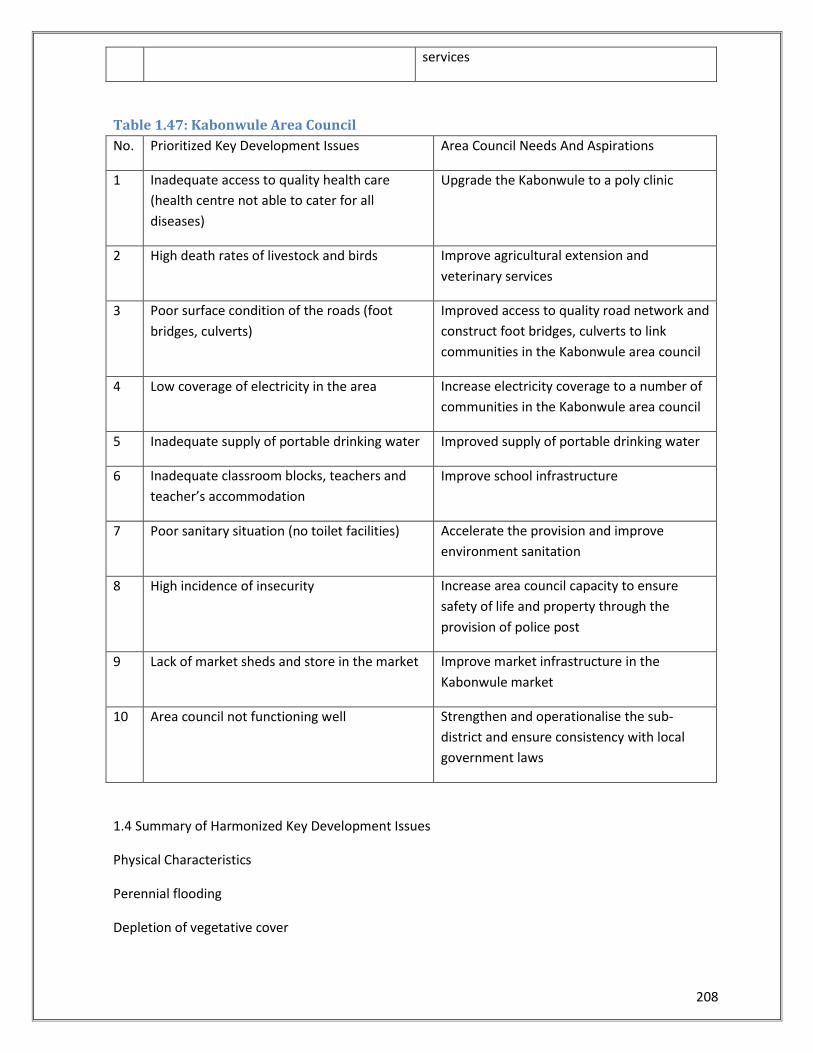
208
services
Table 1.47: Kabonwule Area Council
No. Prioritized Key Development Issues Area Council Needs And Aspirations
1 Inadequate access to quality health care
(health centre not able to cater for all
diseases)
Upgrade the Kabonwule to a poly clinic
2 High death rates of livestock and birds Improve agricultural extension and
veterinary services
3 Poor surface condition of the roads (foot
bridges, culverts)
Improved access to quality road network and
construct foot bridges, culverts to link
communities in the Kabonwule area council
4 Low coverage of electricity in the area Increase electricity coverage to a number of
communities in the Kabonwule area council
5 Inadequate supply of portable drinking water Improved supply of portable drinking water
6 Inadequate classroom blocks, teachers and
teacher’s accommodation
Improve school infrastructure
7 Poor sanitary situation (no toilet facilities) Accelerate the provision and improve
environment sanitation
8 High incidence of insecurity Increase area council capacity to ensure
safety of life and property through the
provision of police post
9 Lack of market sheds and store in the market Improve market infrastructure in the
Kabonwule market
10 Area council not functioning well Strengthen and operationalise the sub-
district and ensure consistency with local
government laws
1.4 Summary of Harmonized Key Development Issues
Physical Characteristics
Perennial flooding
Depletion of vegetative cover
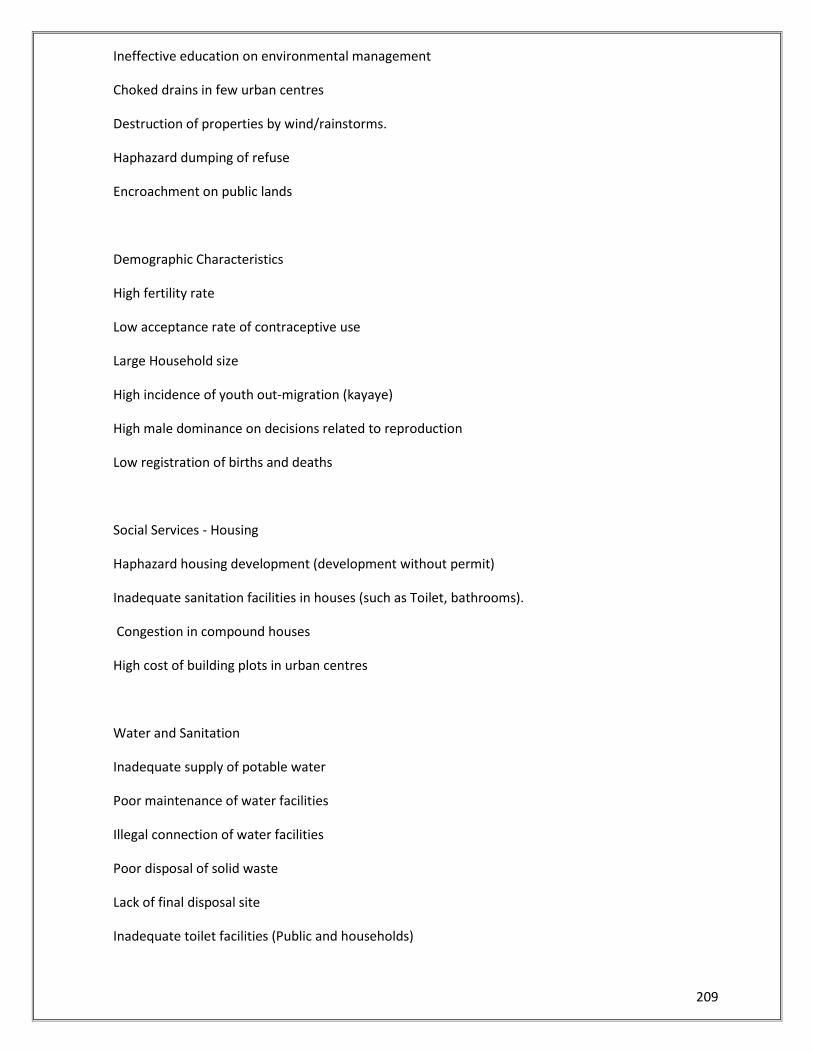
209
Ineffective education on environmental management
Choked drains in few urban centres
Destruction of properties by wind/rainstorms.
Haphazard dumping of refuse
Encroachment on public lands
Demographic Characteristics
High fertility rate
Low acceptance rate of contraceptive use
Large Household size
High incidence of youth out-migration (kayaye)
High male dominance on decisions related to reproduction
Low registration of births and deaths
Social Services - Housing
Haphazard housing development (development without permit)
Inadequate sanitation facilities in houses (such as Toilet, bathrooms).
Congestion in compound houses
High cost of building plots in urban centres
Water and Sanitation
Inadequate supply of potable water
Poor maintenance of water facilities
Illegal connection of water facilities
Poor disposal of solid waste
Lack of final disposal site
Inadequate toilet facilities (Public and households)
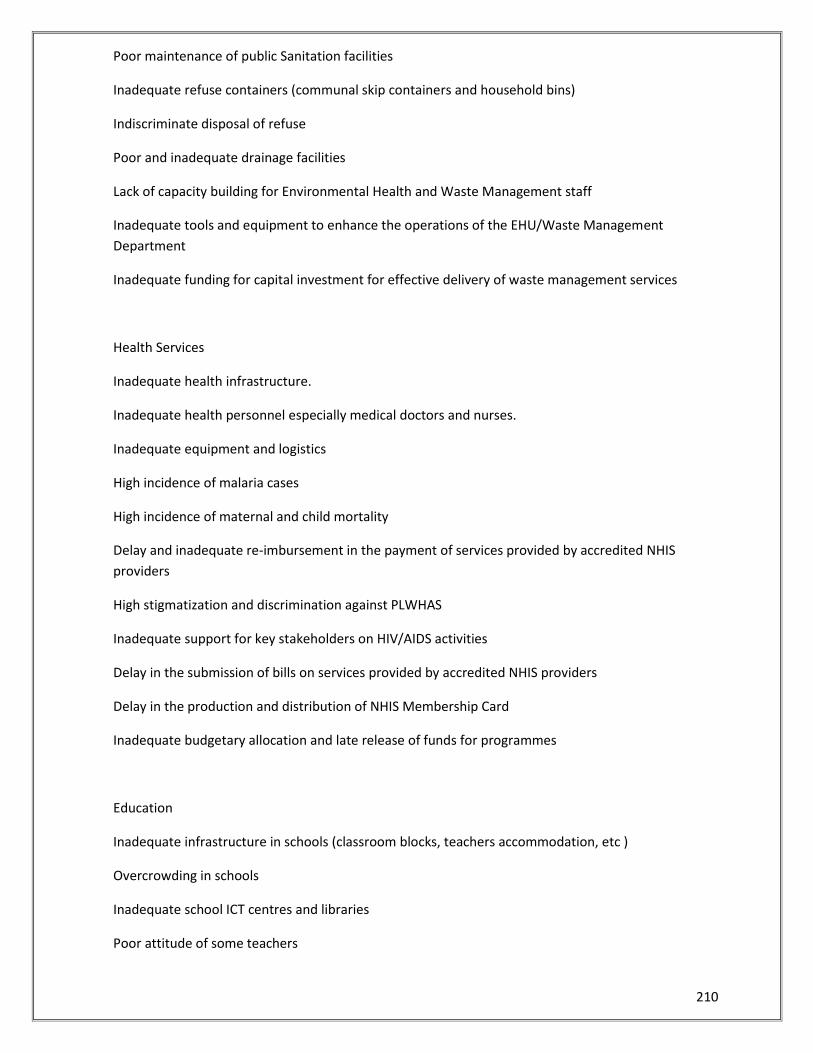
210
Poor maintenance of public Sanitation facilities
Inadequate refuse containers (communal skip containers and household bins)
Indiscriminate disposal of refuse
Poor and inadequate drainage facilities
Lack of capacity building for Environmental Health and Waste Management staff
Inadequate tools and equipment to enhance the operations of the EHU/Waste Management
Department
Inadequate funding for capital investment for effective delivery of waste management services
Health Services
Inadequate health infrastructure.
Inadequate health personnel especially medical doctors and nurses.
Inadequate equipment and logistics
High incidence of malaria cases
High incidence of maternal and child mortality
Delay and inadequate re-imbursement in the payment of services provided by accredited NHIS
providers
High stigmatization and discrimination against PLWHAS
Inadequate support for key stakeholders on HIV/AIDS activities
Delay in the submission of bills on services provided by accredited NHIS providers
Delay in the production and distribution of NHIS Membership Card
Inadequate budgetary allocation and late release of funds for programmes
Education
Inadequate infrastructure in schools (classroom blocks, teachers accommodation, etc )
Overcrowding in schools
Inadequate school ICT centres and libraries
Poor attitude of some teachers
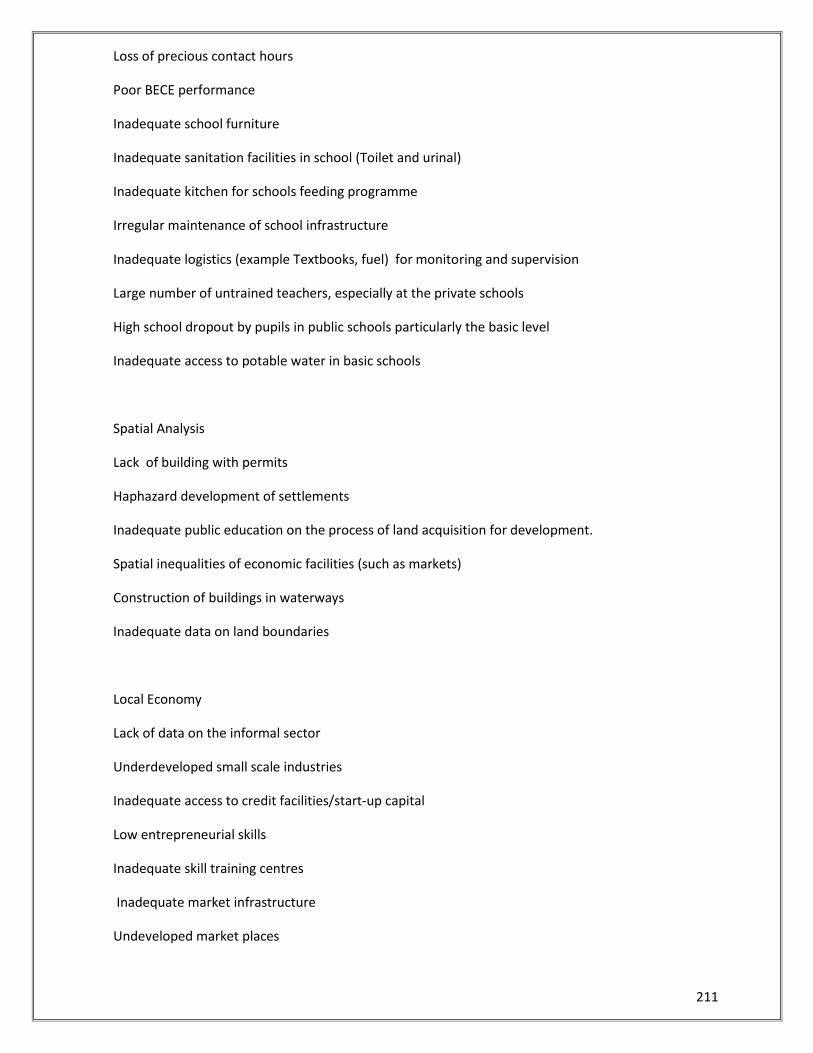
211
Loss of precious contact hours
Poor BECE performance
Inadequate school furniture
Inadequate sanitation facilities in school (Toilet and urinal)
Inadequate kitchen for schools feeding programme
Irregular maintenance of school infrastructure
Inadequate logistics (example Textbooks, fuel) for monitoring and supervision
Large number of untrained teachers, especially at the private schools
High school dropout by pupils in public schools particularly the basic level
Inadequate access to potable water in basic schools
Spatial Analysis
Lack of building with permits
Haphazard development of settlements
Inadequate public education on the process of land acquisition for development.
Spatial inequalities of economic facilities (such as markets)
Construction of buildings in waterways
Inadequate data on land boundaries
Local Economy
Lack of data on the informal sector
Underdeveloped small scale industries
Inadequate access to credit facilities/start-up capital
Low entrepreneurial skills
Inadequate skill training centres
Inadequate market infrastructure
Undeveloped market places
212
Haphazard organization of economic activities
Limited market for SSEs products
High competition of SSEs produce with foreign imported ones
High cost of production inputs
Low coordination between the private and the public sector
Economic Infrastructure
Encroachment on access roads by private developers
Deteriorated surface condition of road networks
Inadequate drains along developed roads
Frequent power outages
Illegal connection of electricity
Faulty meters and the high number of un-metered premises
Revenue and Expenditure
Inadequate and unreliable data on ratable items
Low mobilisation of internally generated funds by the Assembly
Delays in the release of DACF
Inadequate donor funds
Under declaration of revenue mobilised by revenue collectors
Unwillingness of the public to pay fees
Low motivation for revenue collectors
Poor management of Internally Generated Funds
Poor monitoring of revenue collectors
213
Governance
Dilapidated offices for Town & Area Councils
Malfunctioning Area Councils and Unit Committees
Inadequate logistics for Area and Town Councils
Lack of remuneration for Area Council staff
Low capacity of the Area Councils and Unit Committee members
Lack of incentive package for Unit Committee Members
Inadequate office space for technical staff in the central administration
Inadequate logistics
Lack of means of transport for key staff to carry out mandate
Lack of motivation of staff/low staff morale
Weak coordination and collaboration between departments of the Assembly
Limited participation of women in decision making process
Poor participation of community members in development issues
Poor commitment of community members towards implementation of development project
Lack of marketing of the assembly and its relevance.
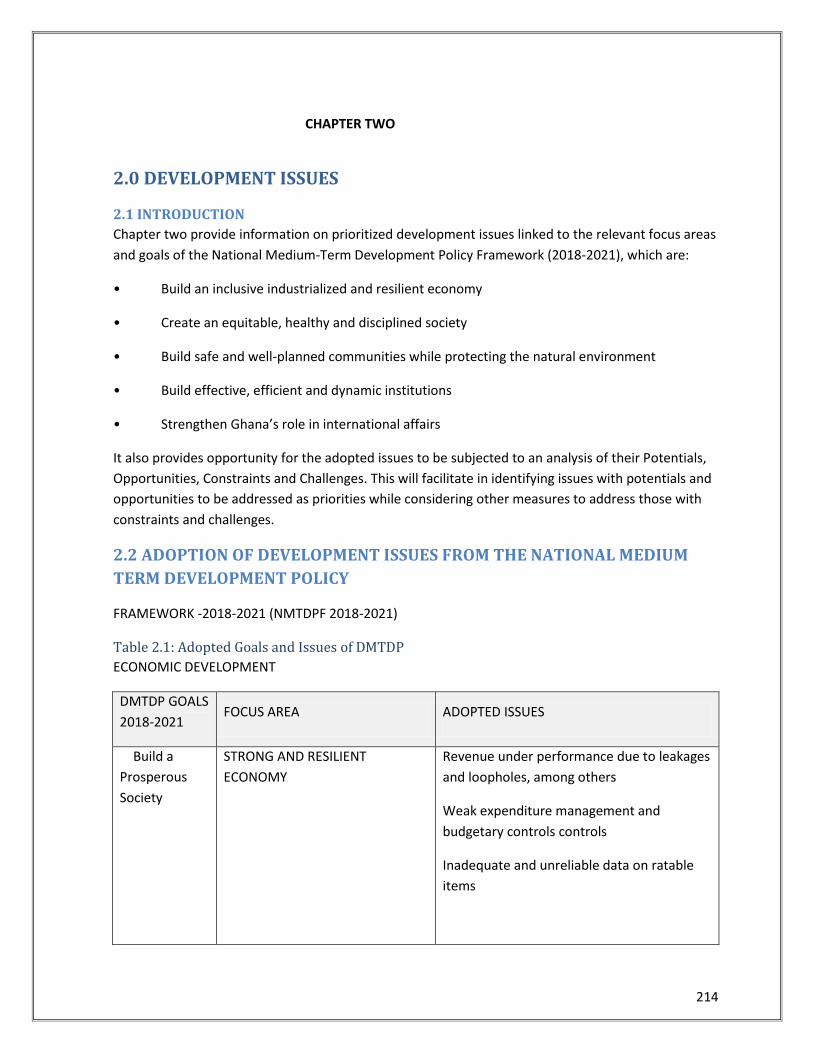
214
CHAPTER TWO
2.0 DEVELOPMENT ISSUES
2.1 INTRODUCTION
Chapter two provide information on prioritized development issues linked to the relevant focus areas
and goals of the National Medium-Term Development Policy Framework (2018-2021), which are:
• Build an inclusive industrialized and resilient economy
• Create an equitable, healthy and disciplined society
• Build safe and well-planned communities while protecting the natural environment
• Build effective, efficient and dynamic institutions
• Strengthen Ghana’s role in international affairs
It also provides opportunity for the adopted issues to be subjected to an analysis of their Potentials,
Opportunities, Constraints and Challenges. This will facilitate in identifying issues with potentials and
opportunities to be addressed as priorities while considering other measures to address those with
constraints and challenges.
2.2 ADOPTION OF DEVELOPMENT ISSUES FROM THE NATIONAL MEDIUM
TERM DEVELOPMENT POLICY
FRAMEWORK -2018-2021 (NMTDPF 2018-2021)
Table 2.1: Adopted Goals and Issues of DMTDP
ECONOMIC DEVELOPMENT
DMTDP GOALS
2018-2021 FOCUS AREA ADOPTED ISSUES
Build a
Prosperous
Society
STRONG AND RESILIENT
ECONOMY
Revenue under performance due to leakages
and loopholes, among others
Weak expenditure management and
budgetary controls controls
Inadequate and unreliable data on ratable
items
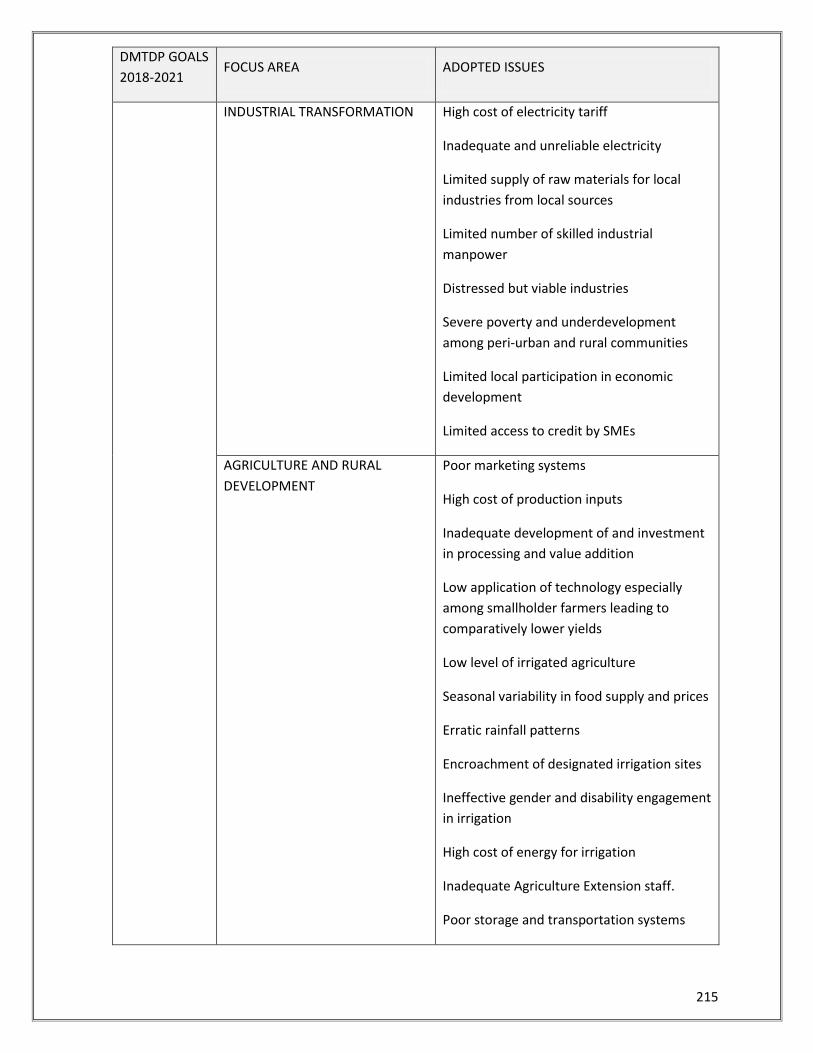
215
DMTDP GOALS
2018-2021 FOCUS AREA ADOPTED ISSUES
INDUSTRIAL TRANSFORMATION High cost of electricity tariff
Inadequate and unreliable electricity
Limited supply of raw materials for local
industries from local sources
Limited number of skilled industrial
manpower
Distressed but viable industries
Severe poverty and underdevelopment
among peri-urban and rural communities
Limited local participation in economic
development
Limited access to credit by SMEs
AGRICULTURE AND RURAL
DEVELOPMENT
Poor marketing systems
High cost of production inputs
Inadequate development of and investment
in processing and value addition
Low application of technology especially
among smallholder farmers leading to
comparatively lower yields
Low level of irrigated agriculture
Seasonal variability in food supply and prices
Erratic rainfall patterns
Encroachment of designated irrigation sites
Ineffective gender and disability engagement
in irrigation
High cost of energy for irrigation
Inadequate Agriculture Extension staff.
Poor storage and transportation systems
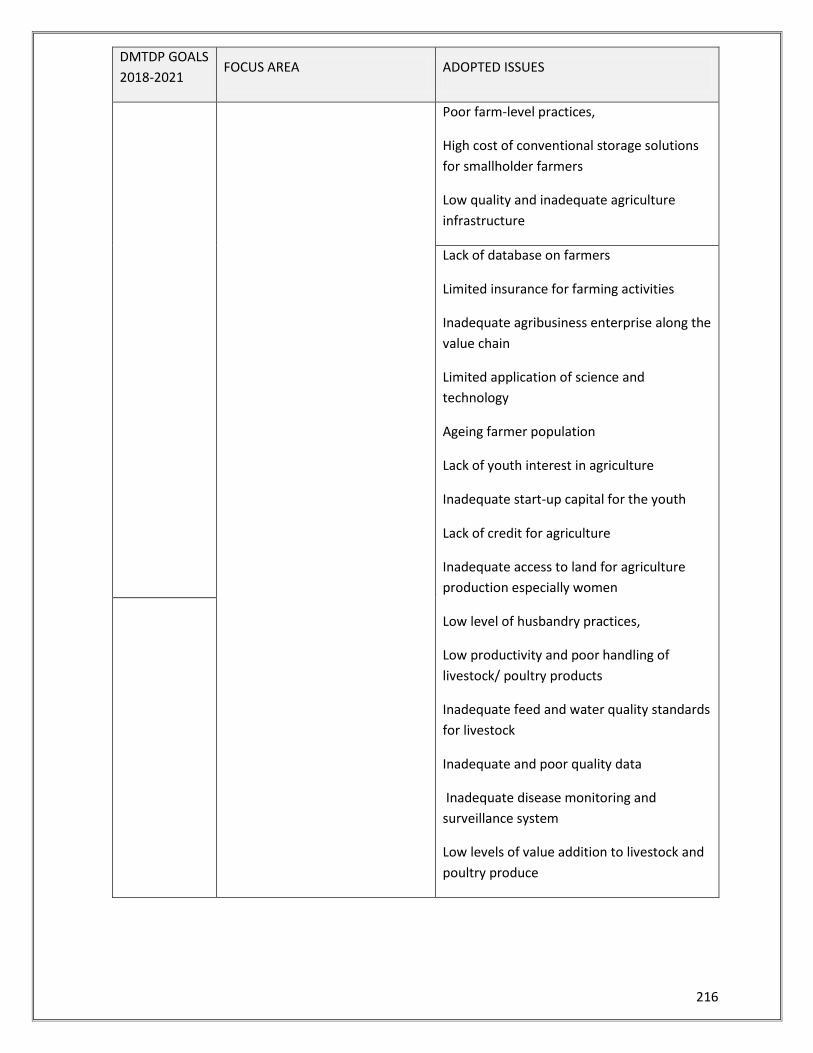
216
DMTDP GOALS
2018-2021 FOCUS AREA ADOPTED ISSUES
Poor farm-level practices,
High cost of conventional storage solutions
for smallholder farmers
Low quality and inadequate agriculture
infrastructure
Lack of database on farmers
Limited insurance for farming activities
Inadequate agribusiness enterprise along the
value chain
Limited application of science and
technology
Ageing farmer population
Lack of youth interest in agriculture
Inadequate start-up capital for the youth
Lack of credit for agriculture
Inadequate access to land for agriculture
production especially women
Low level of husbandry practices,
Low productivity and poor handling of
livestock/ poultry products
Inadequate feed and water quality standards
for livestock
Inadequate and poor quality data
Inadequate disease monitoring and
surveillance system
Low levels of value addition to livestock and
poultry produce
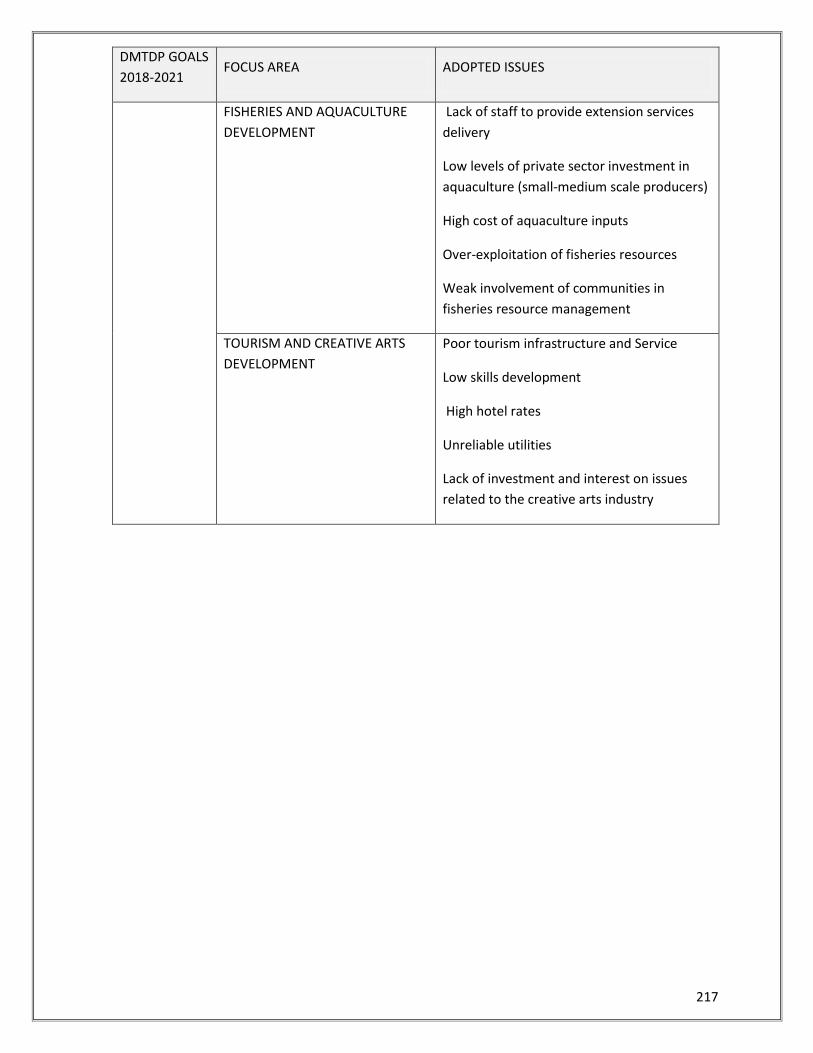
217
DMTDP GOALS
2018-2021 FOCUS AREA ADOPTED ISSUES
FISHERIES AND AQUACULTURE
DEVELOPMENT
Lack of staff to provide extension services
delivery
Low levels of private sector investment in
aquaculture (small-medium scale producers)
High cost of aquaculture inputs
Over-exploitation of fisheries resources
Weak involvement of communities in
fisheries resource management
TOURISM AND CREATIVE ARTS
DEVELOPMENT
Poor tourism infrastructure and Service
Low skills development
High hotel rates
Unreliable utilities
Lack of investment and interest on issues
related to the creative arts industry
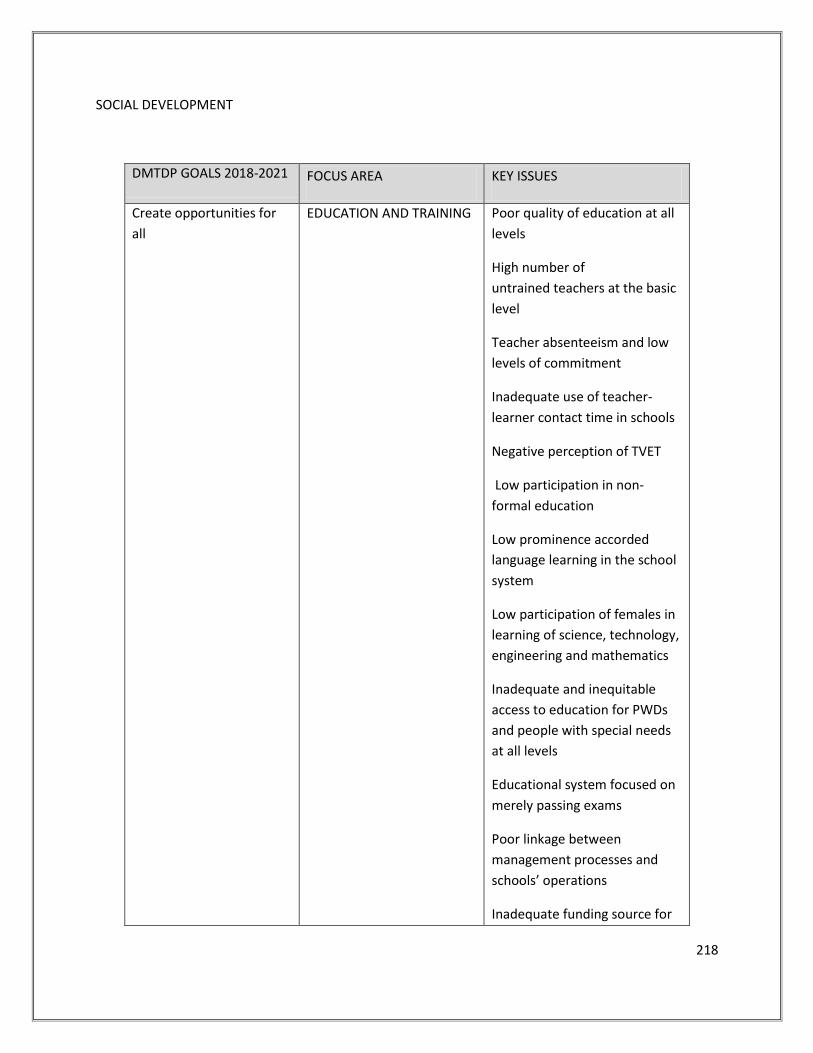
218
SOCIAL DEVELOPMENT
DMTDP GOALS 2018-2021 FOCUS AREA KEY ISSUES
Create opportunities for
all
EDUCATION AND TRAINING
Poor quality of education at all
levels
High number of
untrained teachers at the basic
level
Teacher absenteeism and low
levels of commitment
Inadequate use of teacher-
learner contact time in schools
Negative perception of TVET
Low participation in non-
formal education
Low prominence accorded
language learning in the school
system
Low participation of females in
learning of science, technology,
engineering and mathematics
Inadequate and inequitable
access to education for PWDs
and people with special needs
at all levels
Educational system focused on
merely passing exams
Poor linkage between
management processes and
schools’ operations
Inadequate funding source for
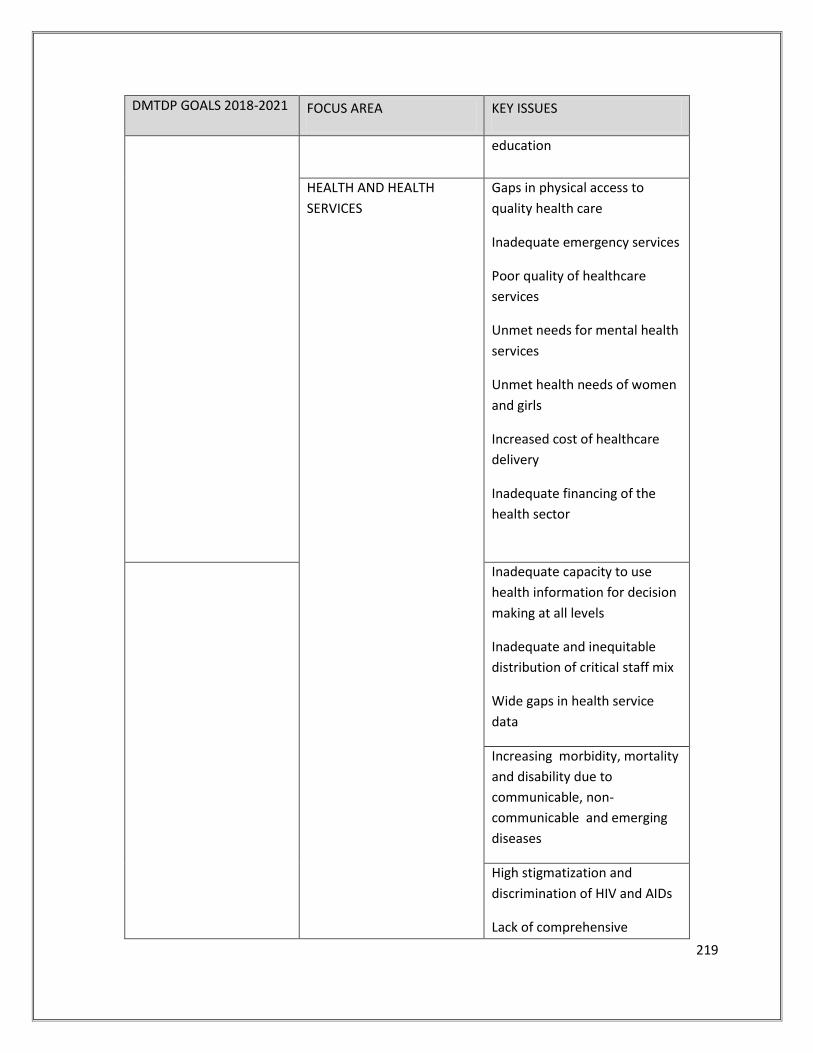
219
DMTDP GOALS 2018-2021 FOCUS AREA KEY ISSUES
education
HEALTH AND HEALTH
SERVICES
Gaps in physical access to
quality health care
Inadequate emergency services
Poor quality of healthcare
services
Unmet needs for mental health
services
Unmet health needs of women
and girls
Increased cost of healthcare
delivery
Inadequate financing of the
health sector
Inadequate capacity to use
health information for decision
making at all levels
Inadequate and inequitable
distribution of critical staff mix
Wide gaps in health service
data
Increasing morbidity, mortality
and disability due to
communicable, non-
communicable and emerging
diseases
High stigmatization and
discrimination of HIV and AIDs
Lack of comprehensive
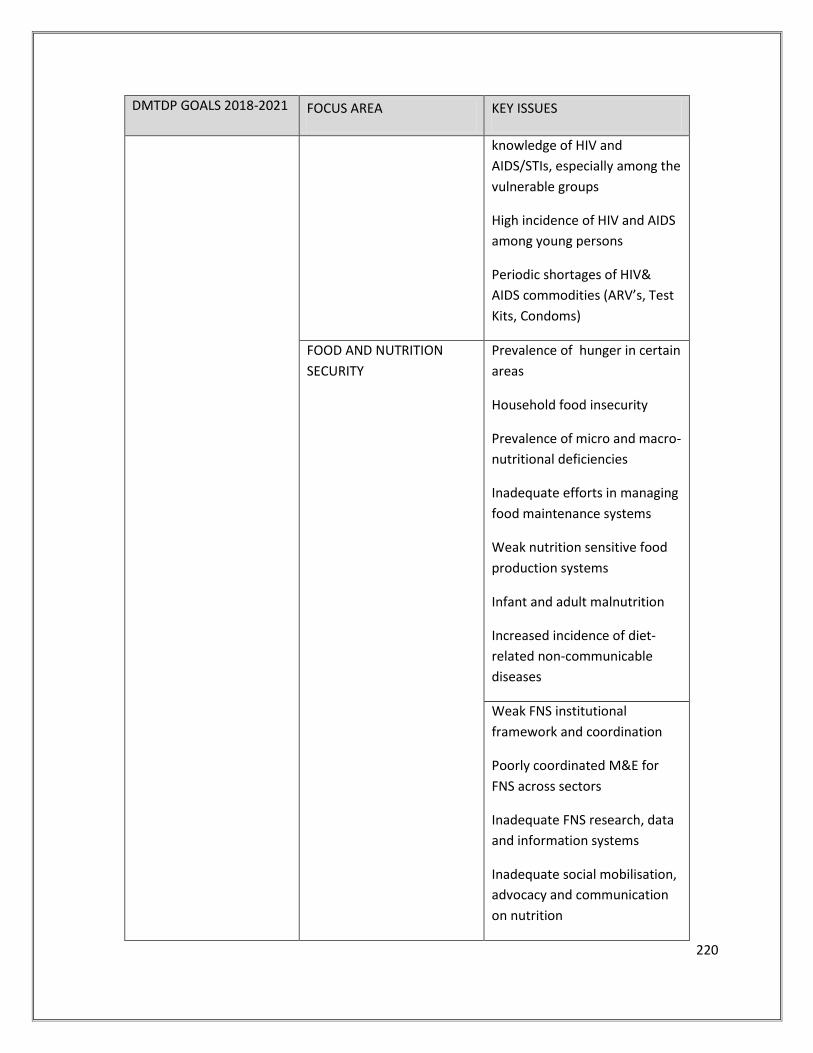
220
DMTDP GOALS 2018-2021 FOCUS AREA KEY ISSUES
knowledge of HIV and
AIDS/STIs, especially among the
vulnerable groups
High incidence of HIV and AIDS
among young persons
Periodic shortages of HIV&
AIDS commodities (ARV’s, Test
Kits, Condoms)
FOOD AND NUTRITION
SECURITY
Prevalence of hunger in certain
areas
Household food insecurity
Prevalence of micro and macro-
nutritional deficiencies
Inadequate efforts in managing
food maintenance systems
Weak nutrition sensitive food
production systems
Infant and adult malnutrition
Increased incidence of diet-
related non-communicable
diseases
Weak FNS institutional
framework and coordination
Poorly coordinated M&E for
FNS across sectors
Inadequate FNS research, data
and information systems
Inadequate social mobilisation,
advocacy and communication
on nutrition
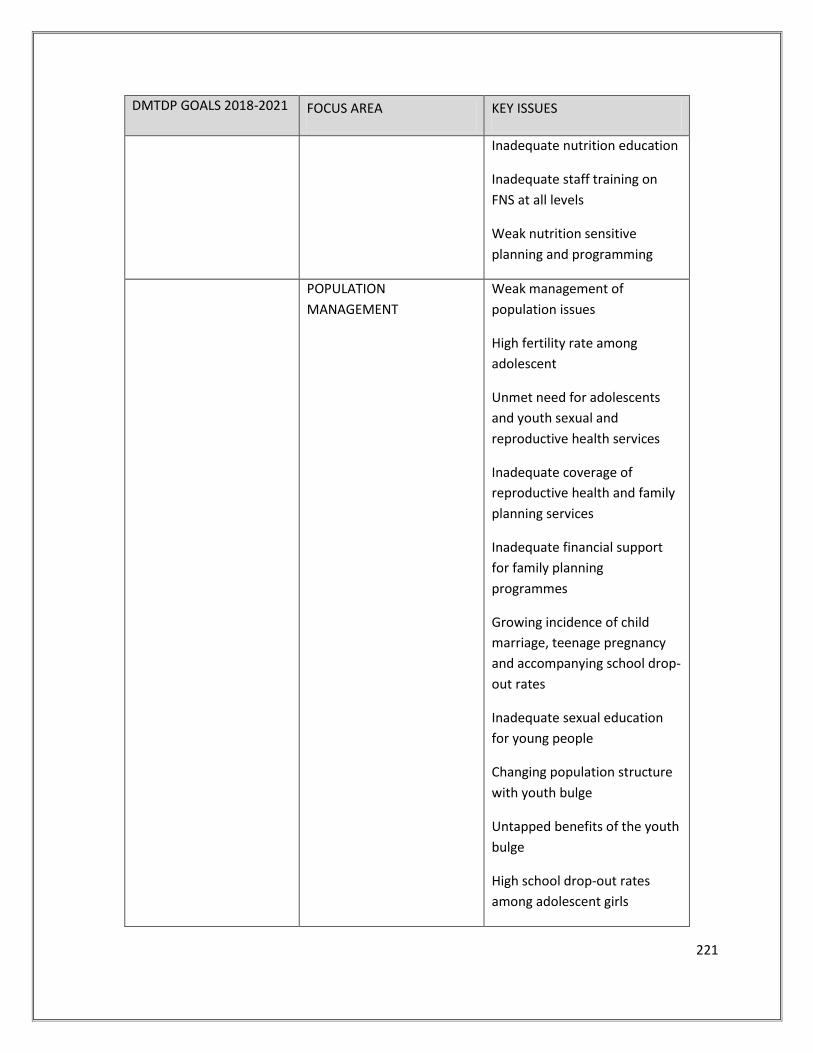
221
DMTDP GOALS 2018-2021 FOCUS AREA KEY ISSUES
Inadequate nutrition education
Inadequate staff training on
FNS at all levels
Weak nutrition sensitive
planning and programming
POPULATION
MANAGEMENT
Weak management of
population issues
High fertility rate among
adolescent
Unmet need for adolescents
and youth sexual and
reproductive health services
Inadequate coverage of
reproductive health and family
planning services
Inadequate financial support
for family planning
programmes
Growing incidence of child
marriage, teenage pregnancy
and accompanying school drop-
out rates
Inadequate sexual education
for young people
Changing population structure
with youth bulge
Untapped benefits of the youth
bulge
High school drop-out rates
among adolescent girls
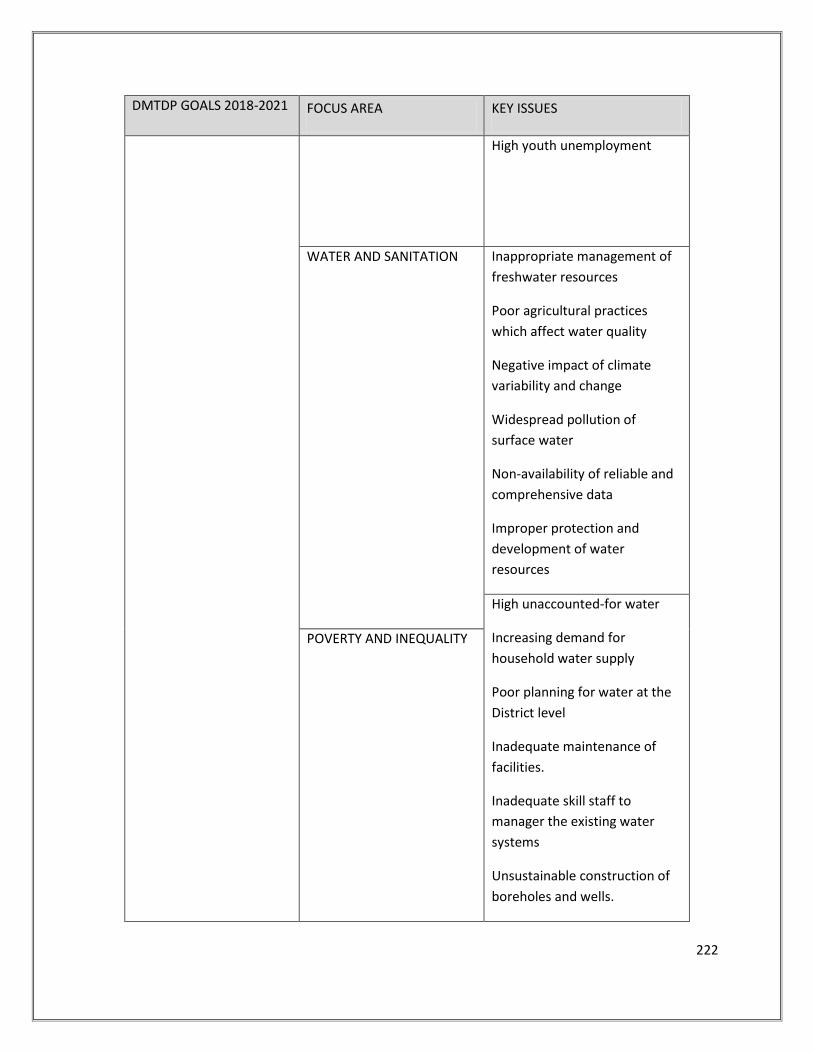
222
DMTDP GOALS 2018-2021 FOCUS AREA KEY ISSUES
High youth unemployment
WATER AND SANITATION
Inappropriate management of
freshwater resources
Poor agricultural practices
which affect water quality
Negative impact of climate
variability and change
Widespread pollution of
surface water
Non-availability of reliable and
comprehensive data
Improper protection and
development of water
resources
High unaccounted-for water
Increasing demand for
household water supply
Poor planning for water at the
District level
Inadequate maintenance of
facilities.
Inadequate skill staff to
manager the existing water
systems
Unsustainable construction of
boreholes and wells.
POVERTY AND INEQUALITY
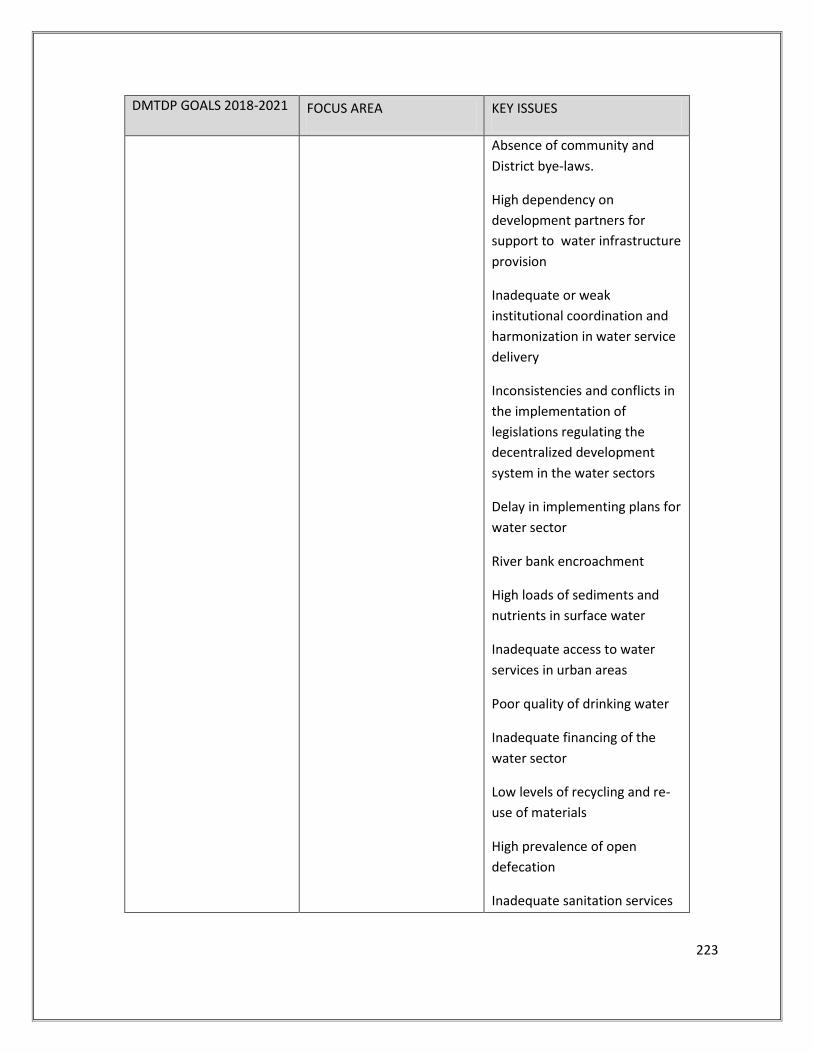
223
DMTDP GOALS 2018-2021 FOCUS AREA KEY ISSUES
Absence of community and
District bye-laws.
High dependency on
development partners for
support to water infrastructure
provision
Inadequate or weak
institutional coordination and
harmonization in water service
delivery
Inconsistencies and conflicts in
the implementation of
legislations regulating the
decentralized development
system in the water sectors
Delay in implementing plans for
water sector
River bank encroachment
High loads of sediments and
nutrients in surface water
Inadequate access to water
services in urban areas
Poor quality of drinking water
Inadequate financing of the
water sector
Low levels of recycling and re-
use of materials
High prevalence of open
defecation
Inadequate sanitation services
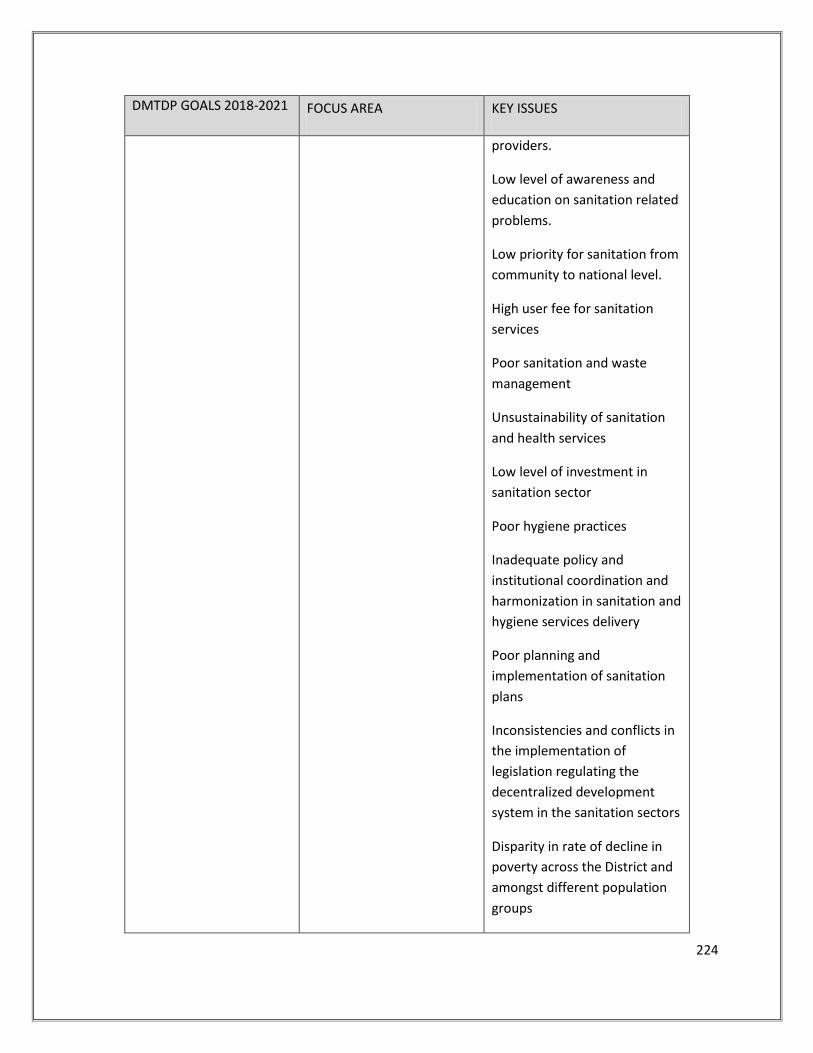
224
DMTDP GOALS 2018-2021 FOCUS AREA KEY ISSUES
providers.
Low level of awareness and
education on sanitation related
problems.
Low priority for sanitation from
community to national level.
High user fee for sanitation
services
Poor sanitation and waste
management
Unsustainability of sanitation
and health services
Low level of investment in
sanitation sector
Poor hygiene practices
Inadequate policy and
institutional coordination and
harmonization in sanitation and
hygiene services delivery
Poor planning and
implementation of sanitation
plans
Inconsistencies and conflicts in
the implementation of
legislation regulating the
decentralized development
system in the sanitation sectors
Disparity in rate of decline in
poverty across the District and
amongst different population
groups
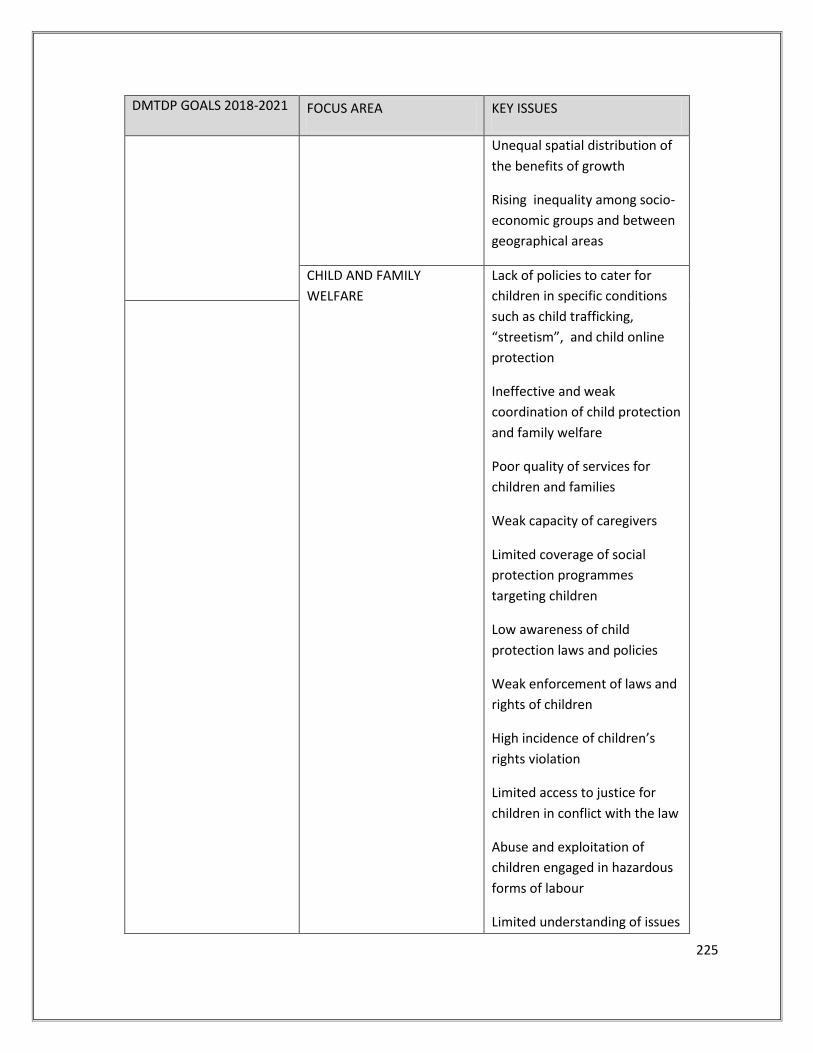
225
DMTDP GOALS 2018-2021 FOCUS AREA KEY ISSUES
Unequal spatial distribution of
the benefits of growth
Rising inequality among socio-
economic groups and between
geographical areas
CHILD AND FAMILY
WELFARE
Lack of policies to cater for
children in specific conditions
such as child trafficking,
“streetism”, and child online
protection
Ineffective and weak
coordination of child protection
and family welfare
Poor quality of services for
children and families
Weak capacity of caregivers
Limited coverage of social
protection programmes
targeting children
Low awareness of child
protection laws and policies
Weak enforcement of laws and
rights of children
High incidence of children’s
rights violation
Limited access to justice for
children in conflict with the law
Abuse and exploitation of
children engaged in hazardous
forms of labour
Limited understanding of issues
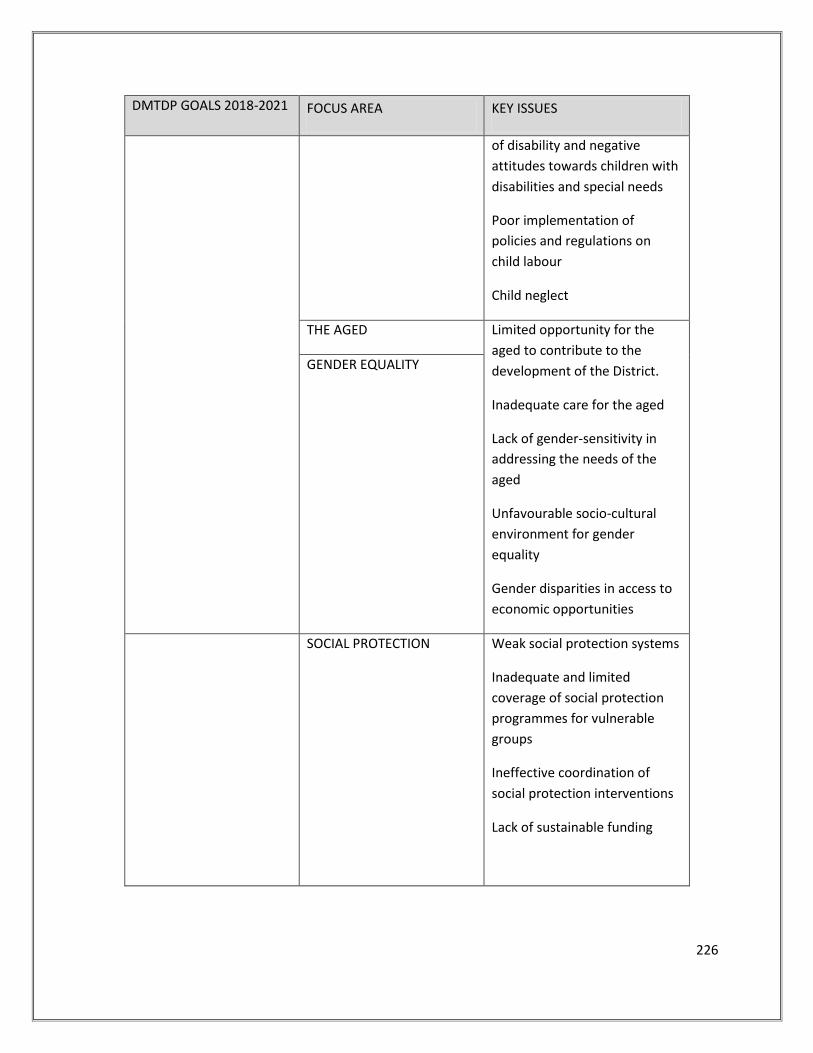
226
DMTDP GOALS 2018-2021 FOCUS AREA KEY ISSUES
of disability and negative
attitudes towards children with
disabilities and special needs
Poor implementation of
policies and regulations on
child labour
Child neglect
THE AGED Limited opportunity for the
aged to contribute to the
development of the District.
Inadequate care for the aged
Lack of gender-sensitivity in
addressing the needs of the
aged
Unfavourable socio-cultural
environment for gender
equality
Gender disparities in access to
economic opportunities
GENDER EQUALITY
SOCIAL PROTECTION
Weak social protection systems
Inadequate and limited
coverage of social protection
programmes for vulnerable
groups
Ineffective coordination of
social protection interventions
Lack of sustainable funding
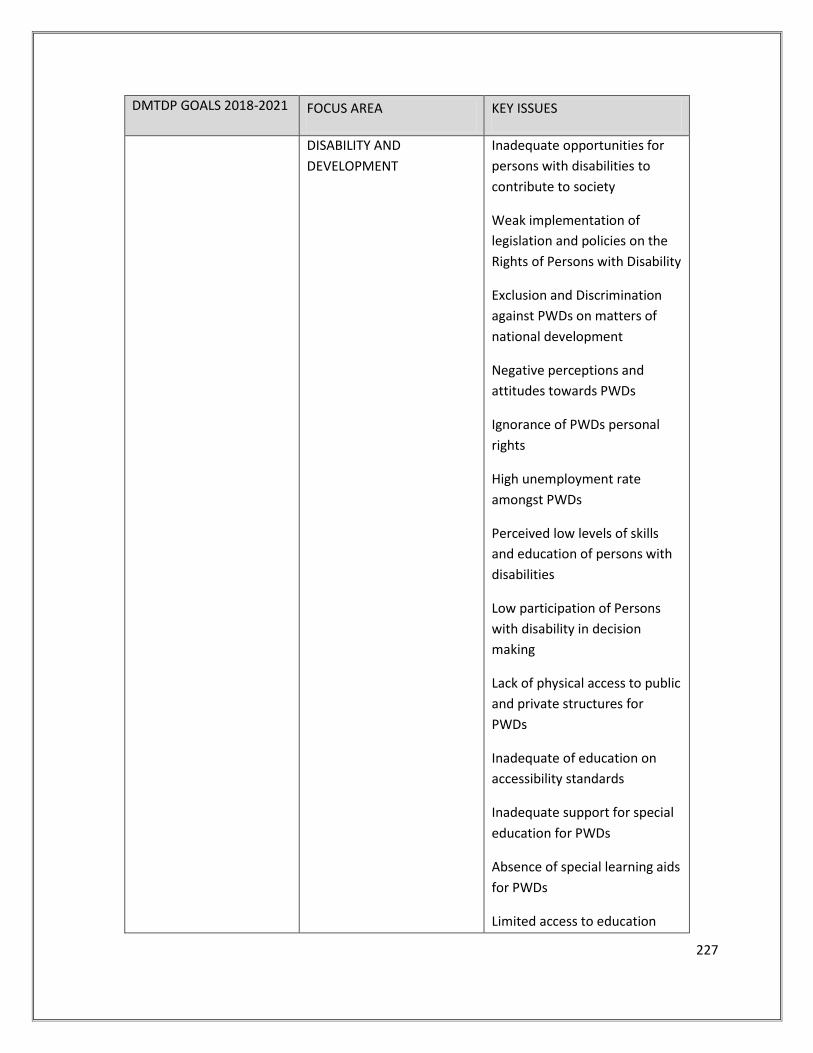
227
DMTDP GOALS 2018-2021 FOCUS AREA KEY ISSUES
DISABILITY AND
DEVELOPMENT
Inadequate opportunities for
persons with disabilities to
contribute to society
Weak implementation of
legislation and policies on the
Rights of Persons with Disability
Exclusion and Discrimination
against PWDs on matters of
national development
Negative perceptions and
attitudes towards PWDs
Ignorance of PWDs personal
rights
High unemployment rate
amongst PWDs
Perceived low levels of skills
and education of persons with
disabilities
Low participation of Persons
with disability in decision
making
Lack of physical access to public
and private structures for
PWDs
Inadequate of education on
accessibility standards
Inadequate support for special
education for PWDs
Absence of special learning aids
for PWDs
Limited access to education
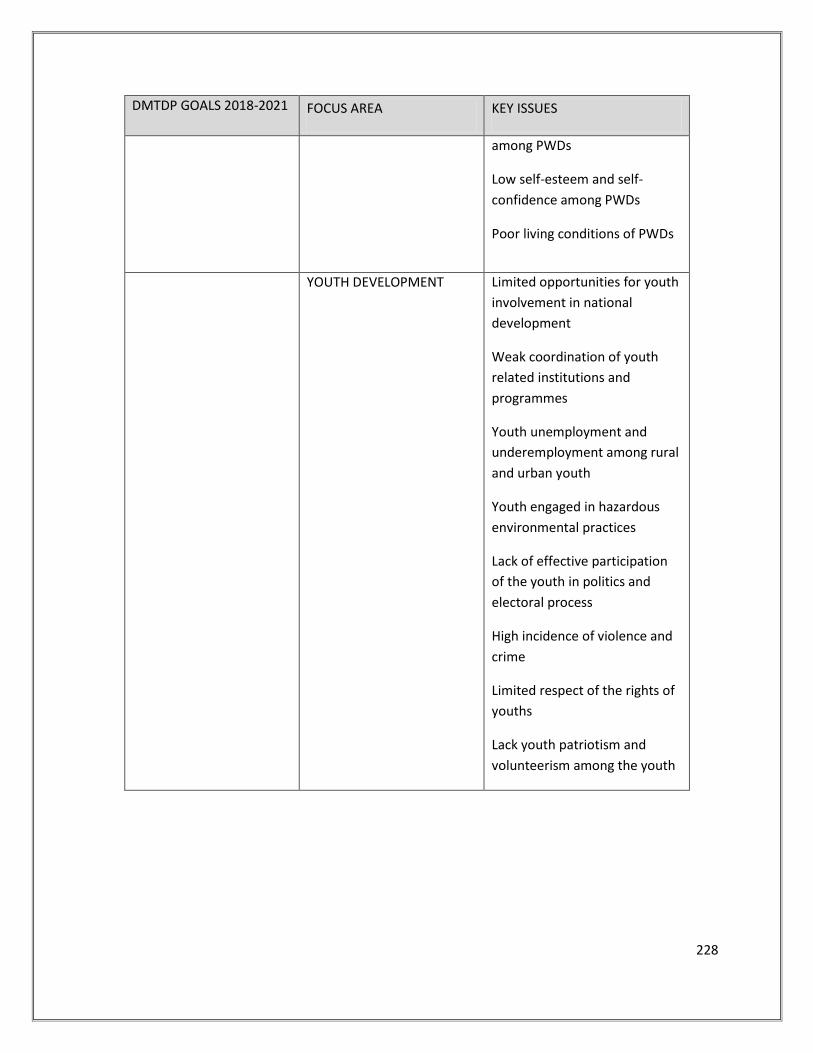
228
DMTDP GOALS 2018-2021 FOCUS AREA KEY ISSUES
among PWDs
Low self-esteem and self-
confidence among PWDs
Poor living conditions of PWDs
YOUTH DEVELOPMENT Limited opportunities for youth
involvement in national
development
Weak coordination of youth
related institutions and
programmes
Youth unemployment and
underemployment among rural
and urban youth
Youth engaged in hazardous
environmental practices
Lack of effective participation
of the youth in politics and
electoral process
High incidence of violence and
crime
Limited respect of the rights of
youths
Lack youth patriotism and
volunteerism among the youth
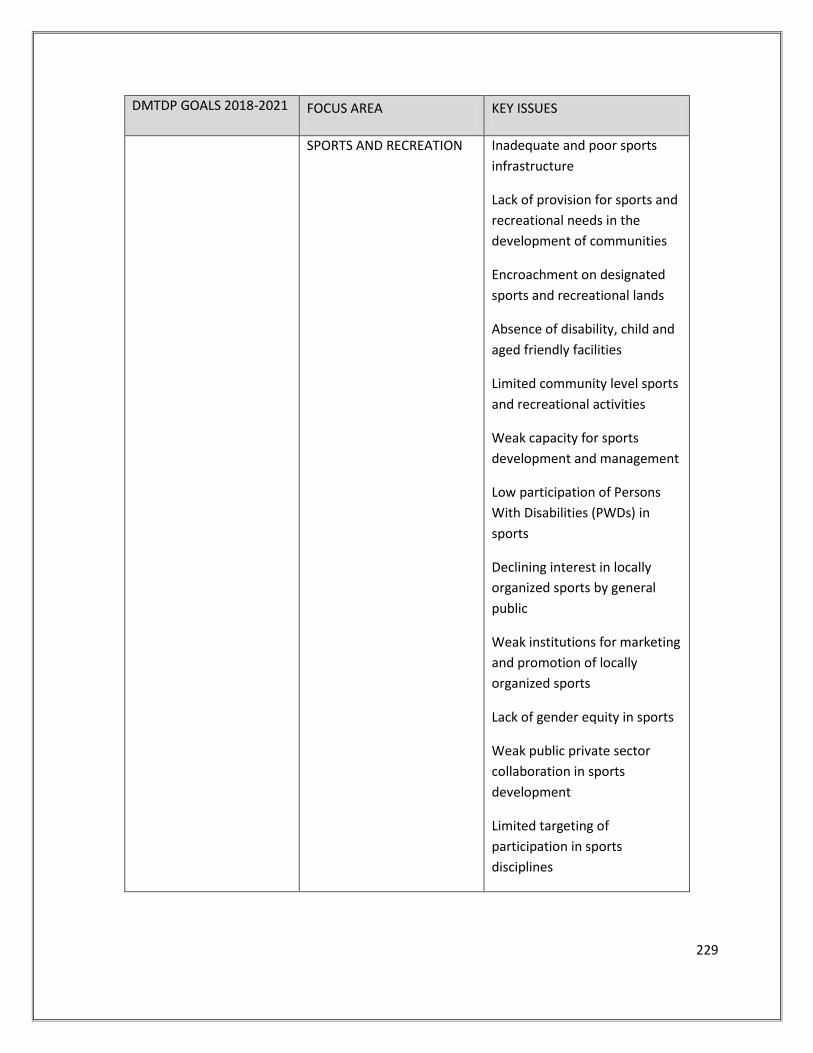
229
DMTDP GOALS 2018-2021 FOCUS AREA KEY ISSUES
SPORTS AND RECREATION
Inadequate and poor sports
infrastructure
Lack of provision for sports and
recreational needs in the
development of communities
Encroachment on designated
sports and recreational lands
Absence of disability, child and
aged friendly facilities
Limited community level sports
and recreational activities
Weak capacity for sports
development and management
Low participation of Persons
With Disabilities (PWDs) in
sports
Declining interest in locally
organized sports by general
public
Weak institutions for marketing
and promotion of locally
organized sports
Lack of gender equity in sports
Weak public private sector
collaboration in sports
development
Limited targeting of
participation in sports
disciplines
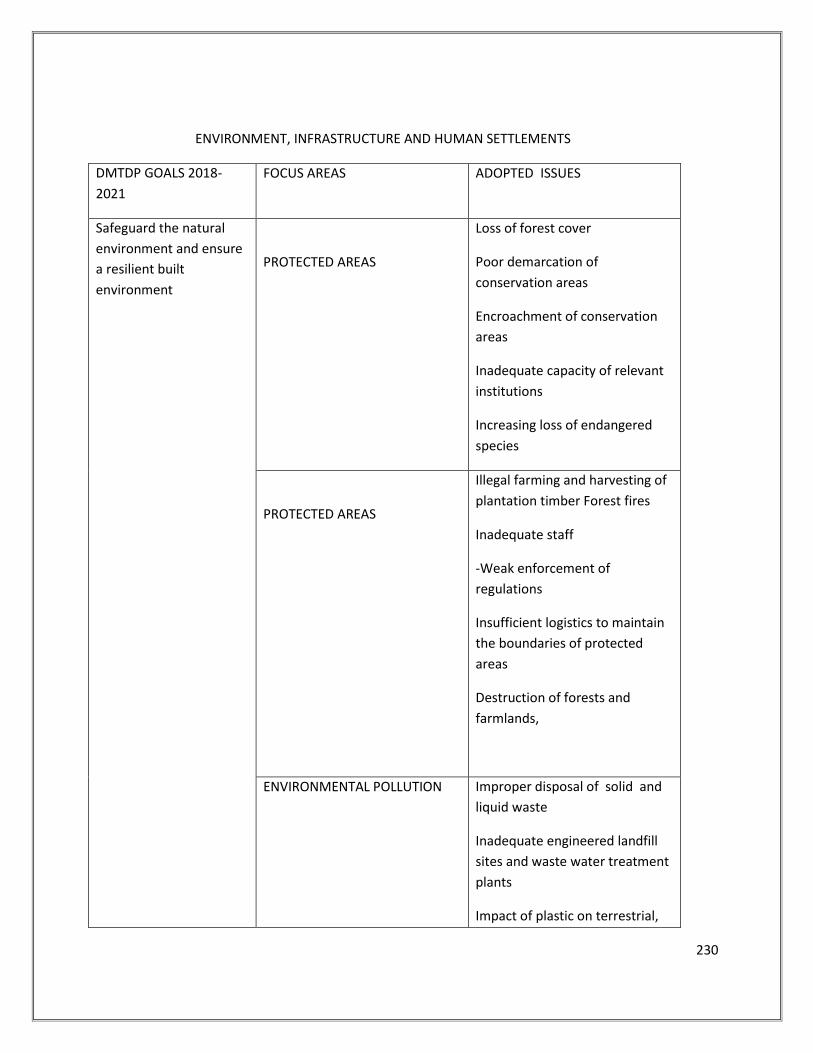
230
ENVIRONMENT, INFRASTRUCTURE AND HUMAN SETTLEMENTS
DMTDP GOALS 2018-
2021
FOCUS AREAS ADOPTED ISSUES
Safeguard the natural
environment and ensure
a resilient built
environment
PROTECTED AREAS
Loss of forest cover
Poor demarcation of
conservation areas
Encroachment of conservation
areas
Inadequate capacity of relevant
institutions
Increasing loss of endangered
species
PROTECTED AREAS
Illegal farming and harvesting of
plantation timber Forest fires
Inadequate staff
-Weak enforcement of
regulations
Insufficient logistics to maintain
the boundaries of protected
areas
Destruction of forests and
farmlands,
ENVIRONMENTAL POLLUTION Improper disposal of solid and
liquid waste
Inadequate engineered landfill
sites and waste water treatment
plants
Impact of plastic on terrestrial,
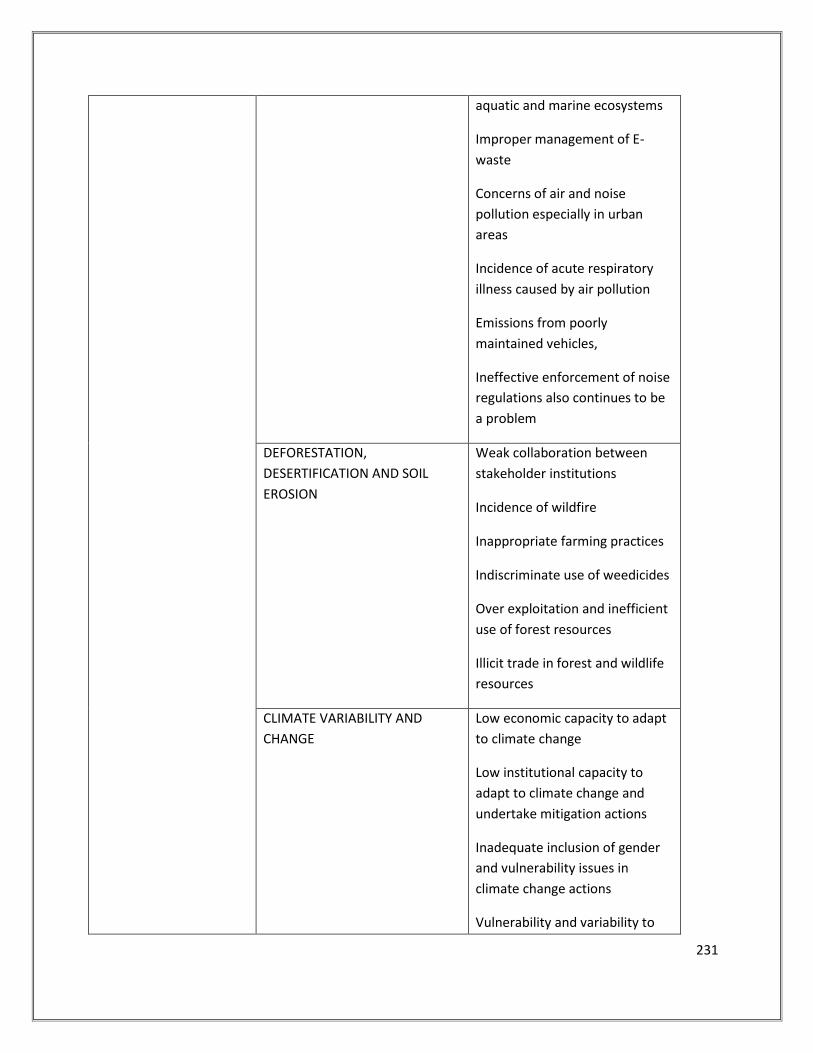
231
aquatic and marine ecosystems
Improper management of E-
waste
Concerns of air and noise
pollution especially in urban
areas
Incidence of acute respiratory
illness caused by air pollution
Emissions from poorly
maintained vehicles,
Ineffective enforcement of noise
regulations also continues to be
a problem
DEFORESTATION,
DESERTIFICATION AND SOIL
EROSION
Weak collaboration between
stakeholder institutions
Incidence of wildfire
Inappropriate farming practices
Indiscriminate use of weedicides
Over exploitation and inefficient
use of forest resources
Illicit trade in forest and wildlife
resources
CLIMATE VARIABILITY AND
CHANGE
Low economic capacity to adapt
to climate change
Low institutional capacity to
adapt to climate change and
undertake mitigation actions
Inadequate inclusion of gender
and vulnerability issues in
climate change actions
Vulnerability and variability to
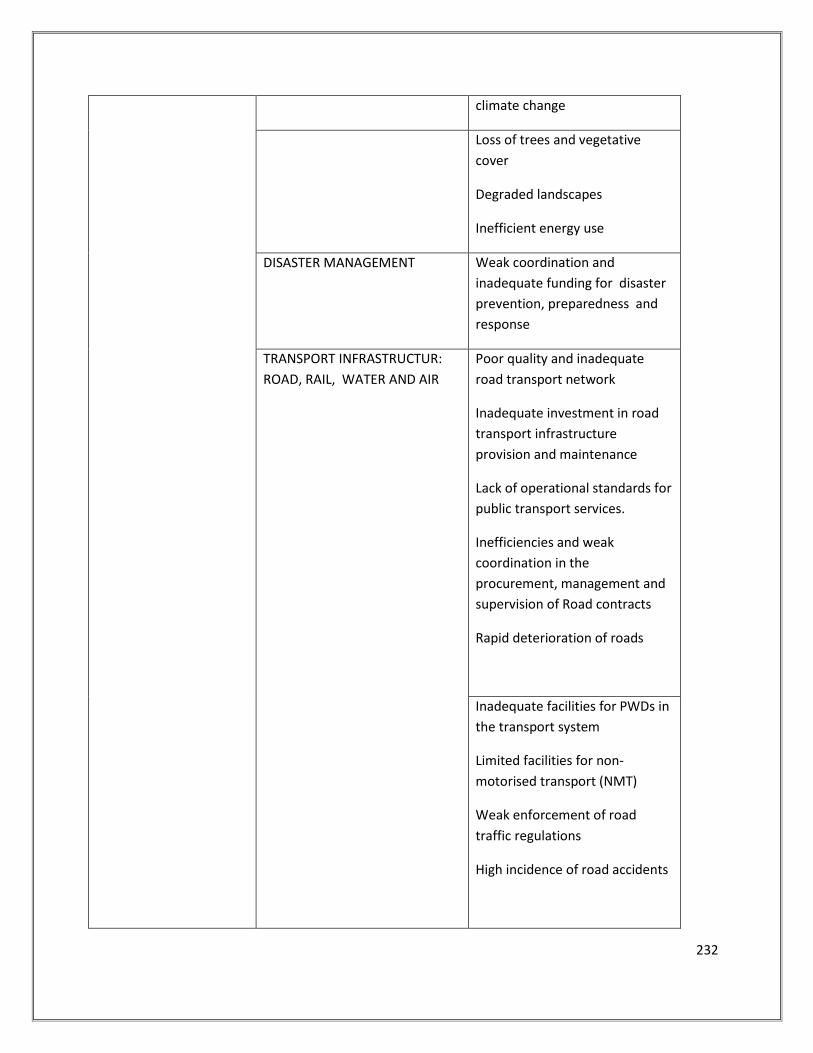
232
climate change
Loss of trees and vegetative
cover
Degraded landscapes
Inefficient energy use
DISASTER MANAGEMENT
Weak coordination and
inadequate funding for disaster
prevention, preparedness and
response
TRANSPORT INFRASTRUCTUR:
ROAD, RAIL, WATER AND AIR
Poor quality and inadequate
road transport network
Inadequate investment in road
transport infrastructure
provision and maintenance
Lack of operational standards for
public transport services.
Inefficiencies and weak
coordination in the
procurement, management and
supervision of Road contracts
Rapid deterioration of roads
Inadequate facilities for PWDs in
the transport system
Limited facilities for non-
motorised transport (NMT)
Weak enforcement of road
traffic regulations
High incidence of road accidents
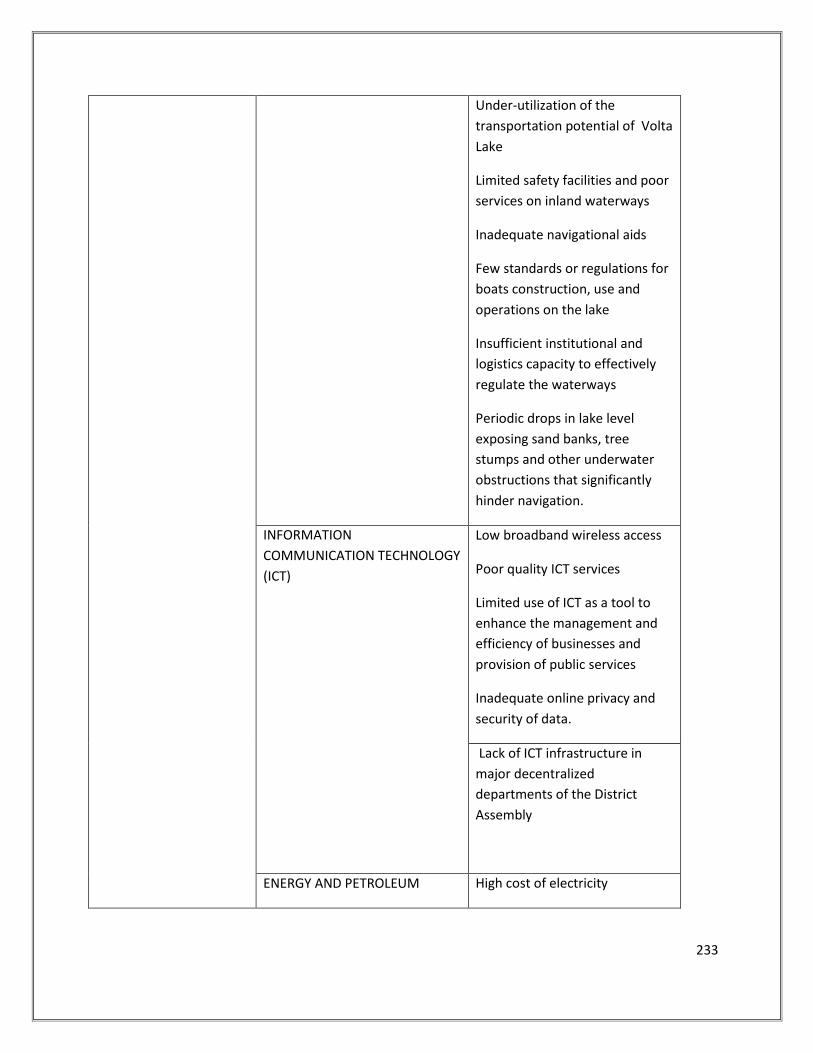
233
Under-utilization of the
transportation potential of Volta
Lake
Limited safety facilities and poor
services on inland waterways
Inadequate navigational aids
Few standards or regulations for
boats construction, use and
operations on the lake
Insufficient institutional and
logistics capacity to effectively
regulate the waterways
Periodic drops in lake level
exposing sand banks, tree
stumps and other underwater
obstructions that significantly
hinder navigation.
INFORMATION
COMMUNICATION TECHNOLOGY
(ICT)
Low broadband wireless access
Poor quality ICT services
Limited use of ICT as a tool to
enhance the management and
efficiency of businesses and
provision of public services
Inadequate online privacy and
security of data.
Lack of ICT infrastructure in
major decentralized
departments of the District
Assembly
ENERGY AND PETROLEUM High cost of electricity
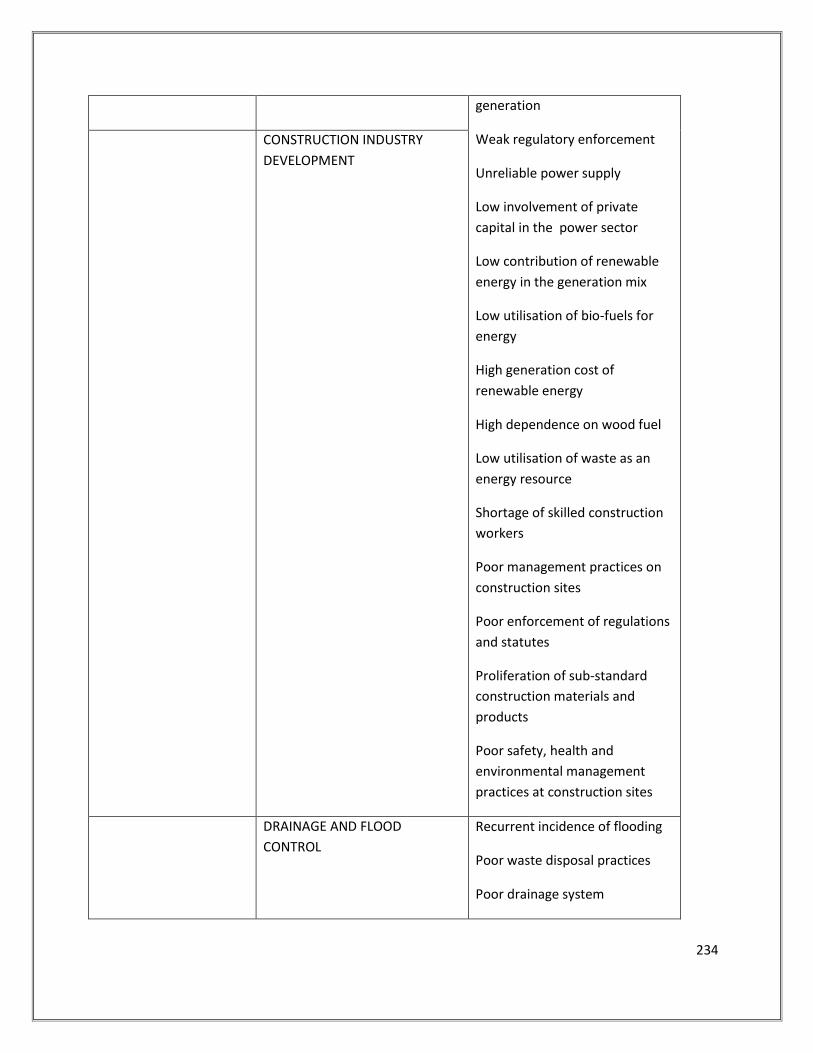
234
generation
Weak regulatory enforcement
Unreliable power supply
Low involvement of private
capital in the power sector
Low contribution of renewable
energy in the generation mix
Low utilisation of bio-fuels for
energy
High generation cost of
renewable energy
High dependence on wood fuel
Low utilisation of waste as an
energy resource
Shortage of skilled construction
workers
Poor management practices on
construction sites
Poor enforcement of regulations
and statutes
Proliferation of sub-standard
construction materials and
products
Poor safety, health and
environmental management
practices at construction sites
CONSTRUCTION INDUSTRY
DEVELOPMENT
DRAINAGE AND FLOOD
CONTROL
Recurrent incidence of flooding
Poor waste disposal practices
Poor drainage system
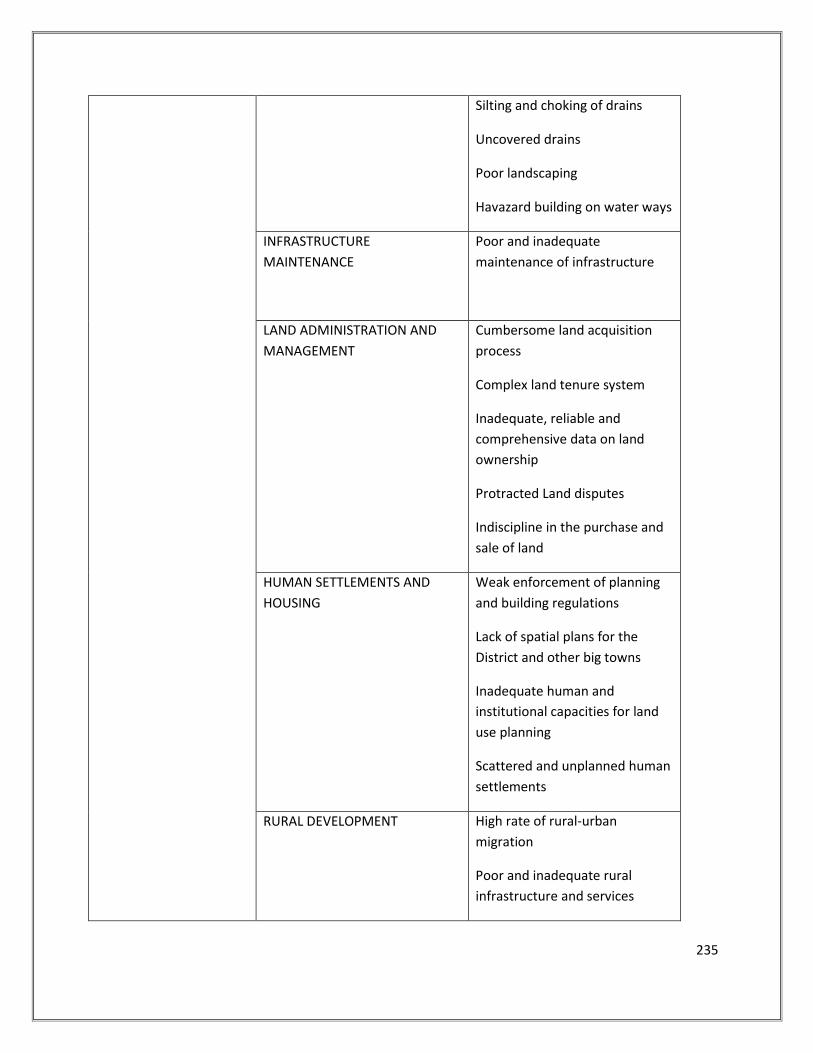
235
Silting and choking of drains
Uncovered drains
Poor landscaping
Havazard building on water ways
INFRASTRUCTURE
MAINTENANCE
Poor and inadequate
maintenance of infrastructure
LAND ADMINISTRATION AND
MANAGEMENT
Cumbersome land acquisition
process
Complex land tenure system
Inadequate, reliable and
comprehensive data on land
ownership
Protracted Land disputes
Indiscipline in the purchase and
sale of land
HUMAN SETTLEMENTS AND
HOUSING
Weak enforcement of planning
and building regulations
Lack of spatial plans for the
District and other big towns
Inadequate human and
institutional capacities for land
use planning
Scattered and unplanned human
settlements
RURAL DEVELOPMENT High rate of rural-urban
migration
Poor and inadequate rural
infrastructure and services
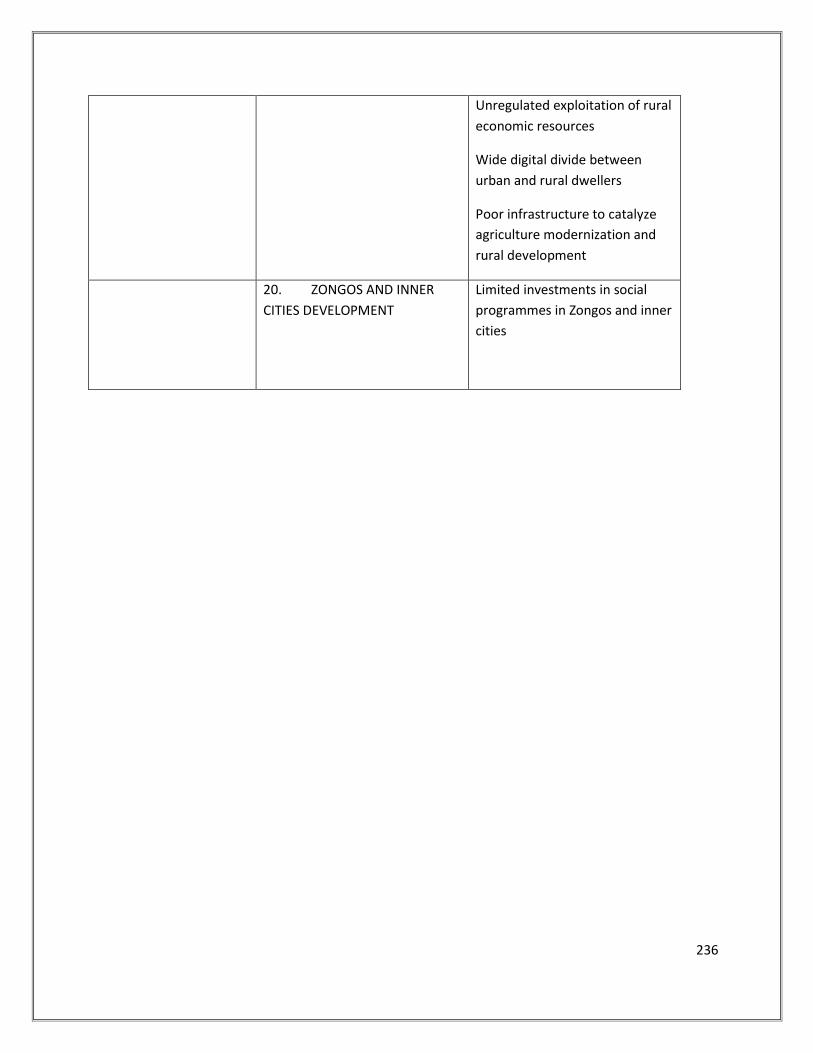
236
Unregulated exploitation of rural
economic resources
Wide digital divide between
urban and rural dwellers
Poor infrastructure to catalyze
agriculture modernization and
rural development
20. ZONGOS AND INNER
CITIES DEVELOPMENT
Limited investments in social
programmes in Zongos and inner
cities
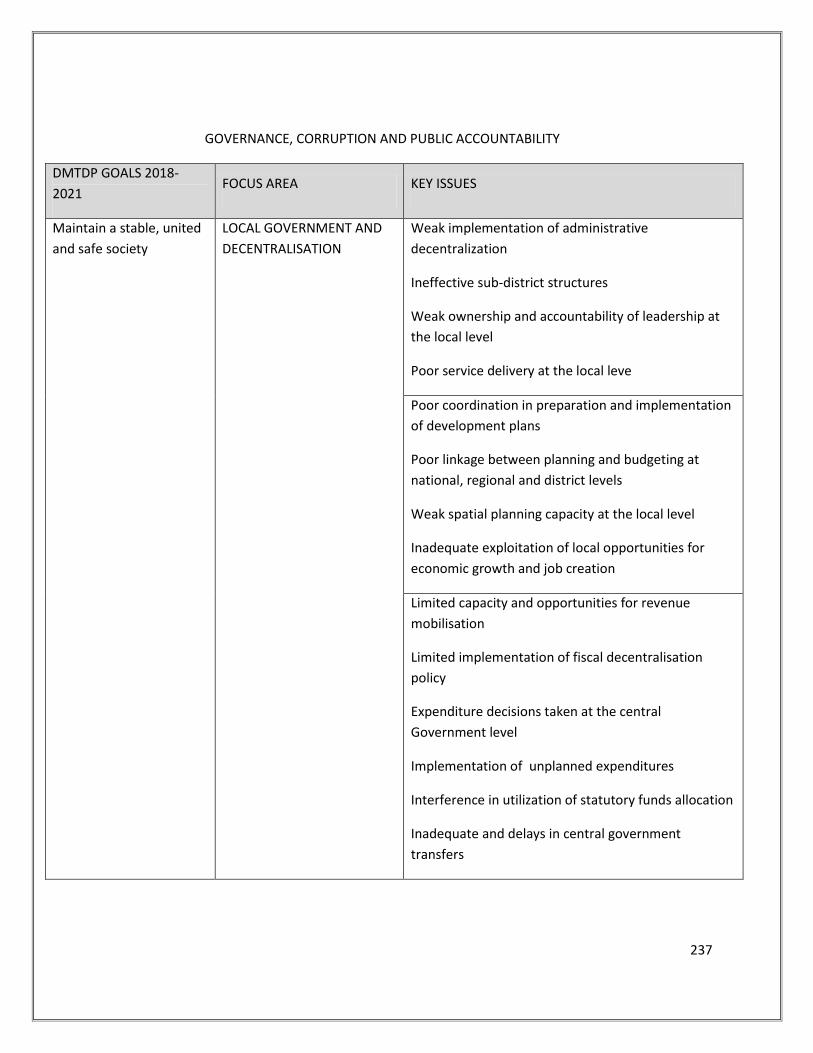
237
GOVERNANCE, CORRUPTION AND PUBLIC ACCOUNTABILITY
DMTDP GOALS 2018-
2021 FOCUS AREA KEY ISSUES
Maintain a stable, united
and safe society
LOCAL GOVERNMENT AND
DECENTRALISATION
Weak implementation of administrative
decentralization
Ineffective sub-district structures
Weak ownership and accountability of leadership at
the local level
Poor service delivery at the local leve
Poor coordination in preparation and implementation
of development plans
Poor linkage between planning and budgeting at
national, regional and district levels
Weak spatial planning capacity at the local level
Inadequate exploitation of local opportunities for
economic growth and job creation
Limited capacity and opportunities for revenue
mobilisation
Limited implementation of fiscal decentralisation
policy
Expenditure decisions taken at the central
Government level
Implementation of unplanned expenditures
Interference in utilization of statutory funds allocation
Inadequate and delays in central government
transfers
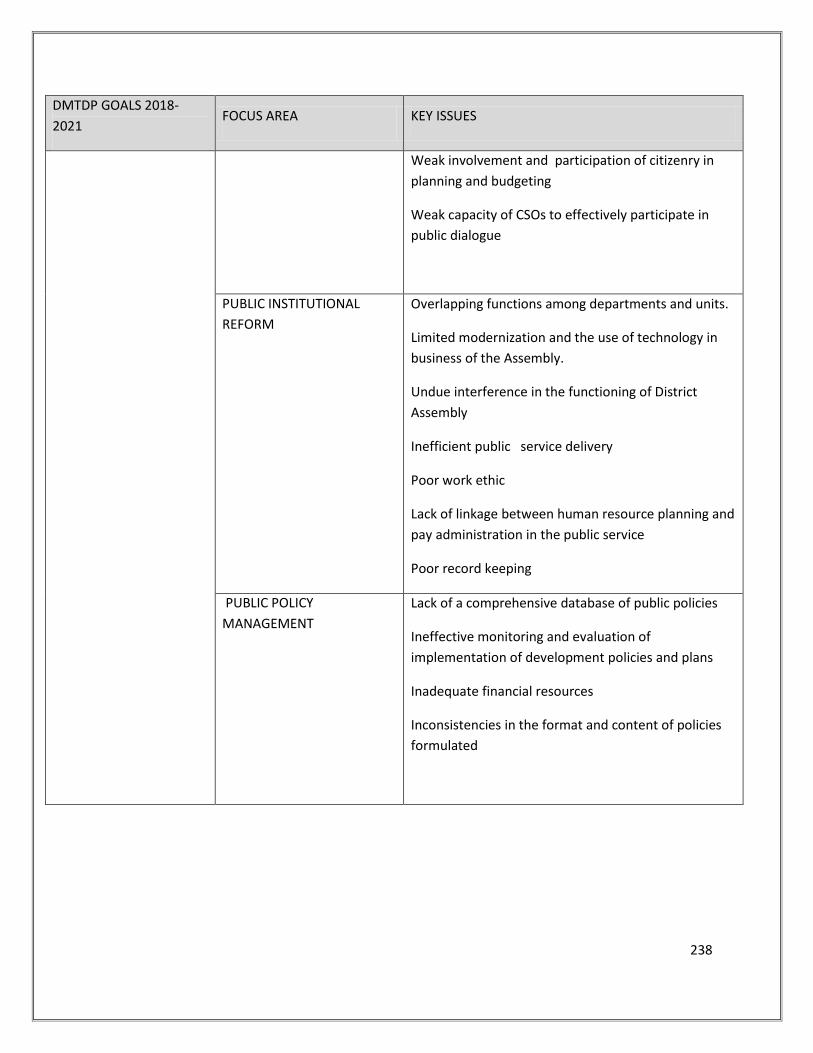
238
DMTDP GOALS 2018-
2021 FOCUS AREA KEY ISSUES
Weak involvement and participation of citizenry in
planning and budgeting
Weak capacity of CSOs to effectively participate in
public dialogue
PUBLIC INSTITUTIONAL
REFORM
Overlapping functions among departments and units.
Limited modernization and the use of technology in
business of the Assembly.
Undue interference in the functioning of District
Assembly
Inefficient public service delivery
Poor work ethic
Lack of linkage between human resource planning and
pay administration in the public service
Poor record keeping
PUBLIC POLICY
MANAGEMENT
Lack of a comprehensive database of public policies
Ineffective monitoring and evaluation of
implementation of development policies and plans
Inadequate financial resources
Inconsistencies in the format and content of policies
formulated
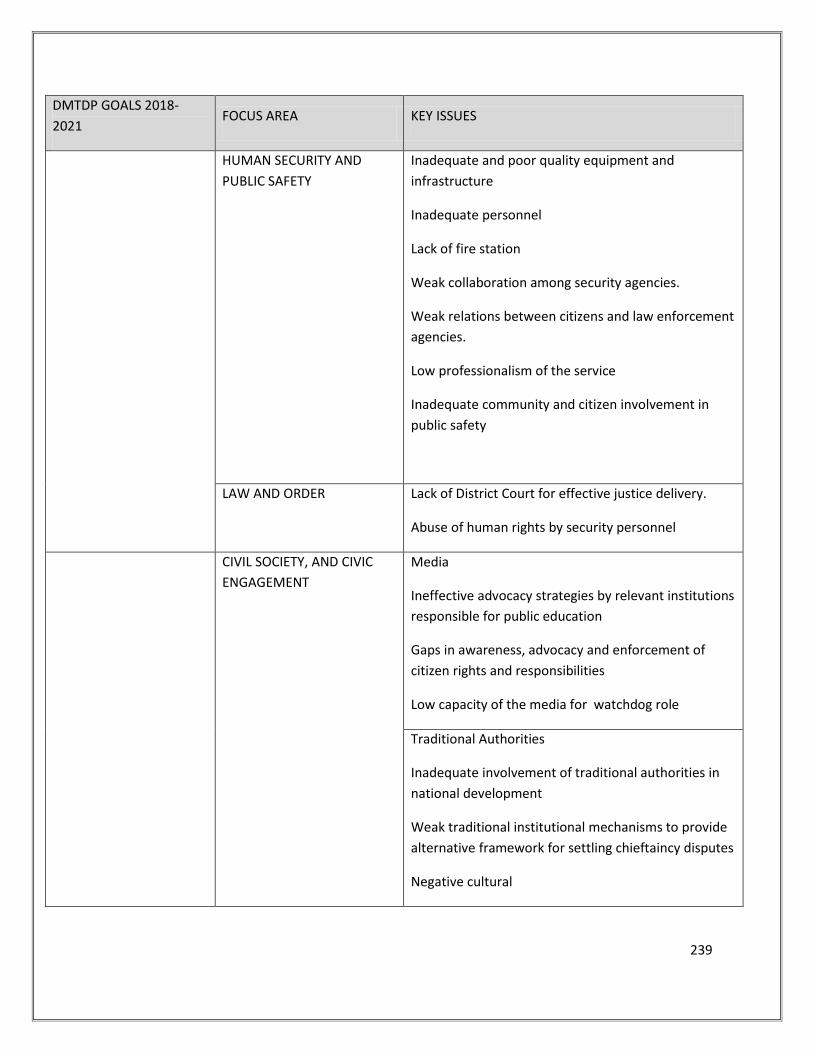
239
DMTDP GOALS 2018-
2021 FOCUS AREA KEY ISSUES
HUMAN SECURITY AND
PUBLIC SAFETY
Inadequate and poor quality equipment and
infrastructure
Inadequate personnel
Lack of fire station
Weak collaboration among security agencies.
Weak relations between citizens and law enforcement
agencies.
Low professionalism of the service
Inadequate community and citizen involvement in
public safety
LAW AND ORDER
Lack of District Court for effective justice delivery.
Abuse of human rights by security personnel
CIVIL SOCIETY, AND CIVIC
ENGAGEMENT
Media
Ineffective advocacy strategies by relevant institutions
responsible for public education
Gaps in awareness, advocacy and enforcement of
citizen rights and responsibilities
Low capacity of the media for watchdog role
Traditional Authorities
Inadequate involvement of traditional authorities in
national development
Weak traditional institutional mechanisms to provide
alternative framework for settling chieftaincy disputes
Negative cultural
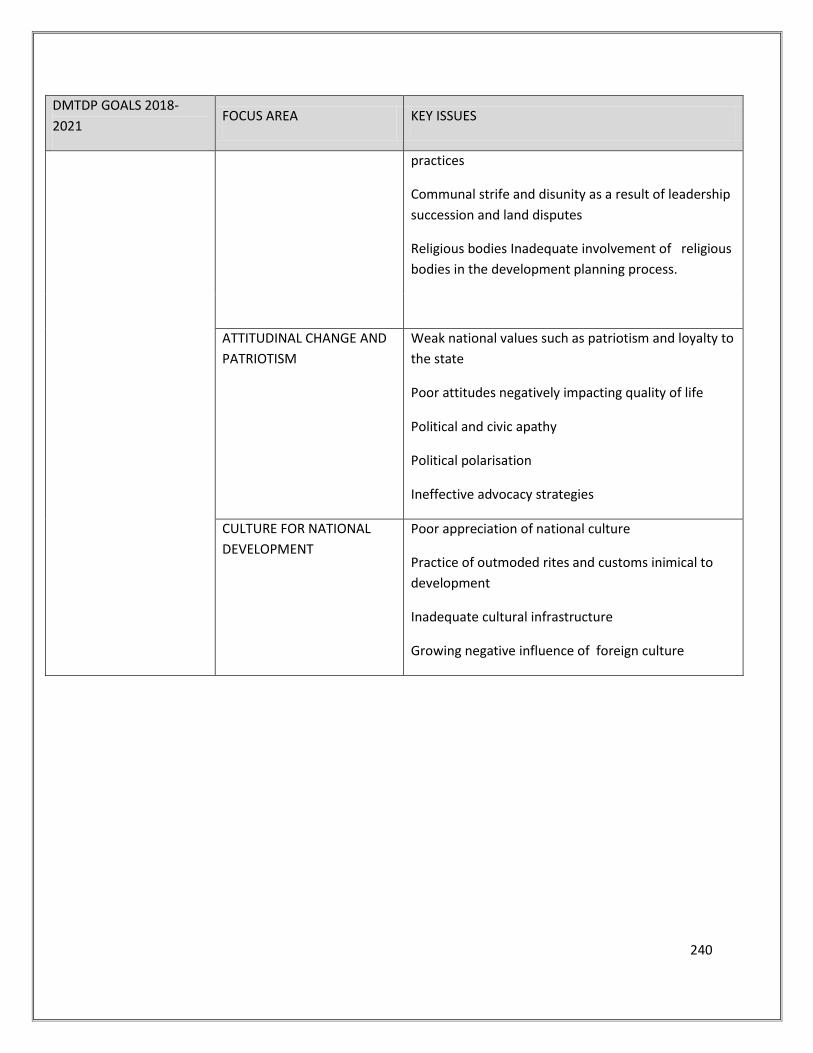
240
DMTDP GOALS 2018-
2021 FOCUS AREA KEY ISSUES
practices
Communal strife and disunity as a result of leadership
succession and land disputes
Religious bodies Inadequate involvement of religious
bodies in the development planning process.
ATTITUDINAL CHANGE AND
PATRIOTISM
Weak national values such as patriotism and loyalty to
the state
Poor attitudes negatively impacting quality of life
Political and civic apathy
Political polarisation
Ineffective advocacy strategies
CULTURE FOR NATIONAL
DEVELOPMENT
Poor appreciation of national culture
Practice of outmoded rites and customs inimical to
development
Inadequate cultural infrastructure
Growing negative influence of foreign culture
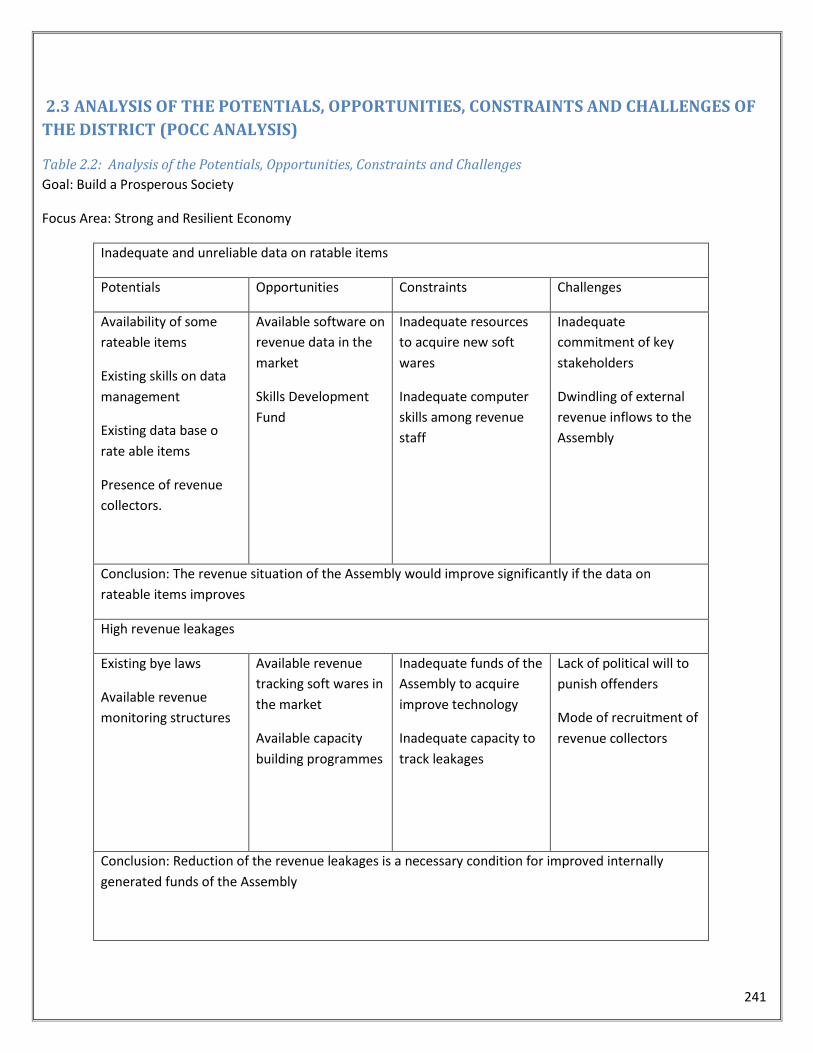
241
2.3 ANALYSIS OF THE POTENTIALS, OPPORTUNITIES, CONSTRAINTS AND CHALLENGES OF
THE DISTRICT (POCC ANALYSIS)
Table 2.2: Analysis of the Potentials, Opportunities, Constraints and Challenges
Goal: Build a Prosperous Society
Focus Area: Strong and Resilient Economy
Inadequate and unreliable data on ratable items
Potentials Opportunities Constraints Challenges
Availability of some
rateable items
Existing skills on data
management
Existing data base o
rate able items
Presence of revenue
collectors.
Available software on
revenue data in the
market
Skills Development
Fund
Inadequate resources
to acquire new soft
wares
Inadequate computer
skills among revenue
staff
Inadequate
commitment of key
stakeholders
Dwindling of external
revenue inflows to the
Assembly
Conclusion: The revenue situation of the Assembly would improve significantly if the data on
rateable items improves
High revenue leakages
Existing bye laws
Available revenue
monitoring structures
Available revenue
tracking soft wares in
the market
Available capacity
building programmes
Inadequate funds of the
Assembly to acquire
improve technology
Inadequate capacity to
track leakages
Lack of political will to
punish offenders
Mode of recruitment of
revenue collectors
Conclusion: Reduction of the revenue leakages is a necessary condition for improved internally
generated funds of the Assembly
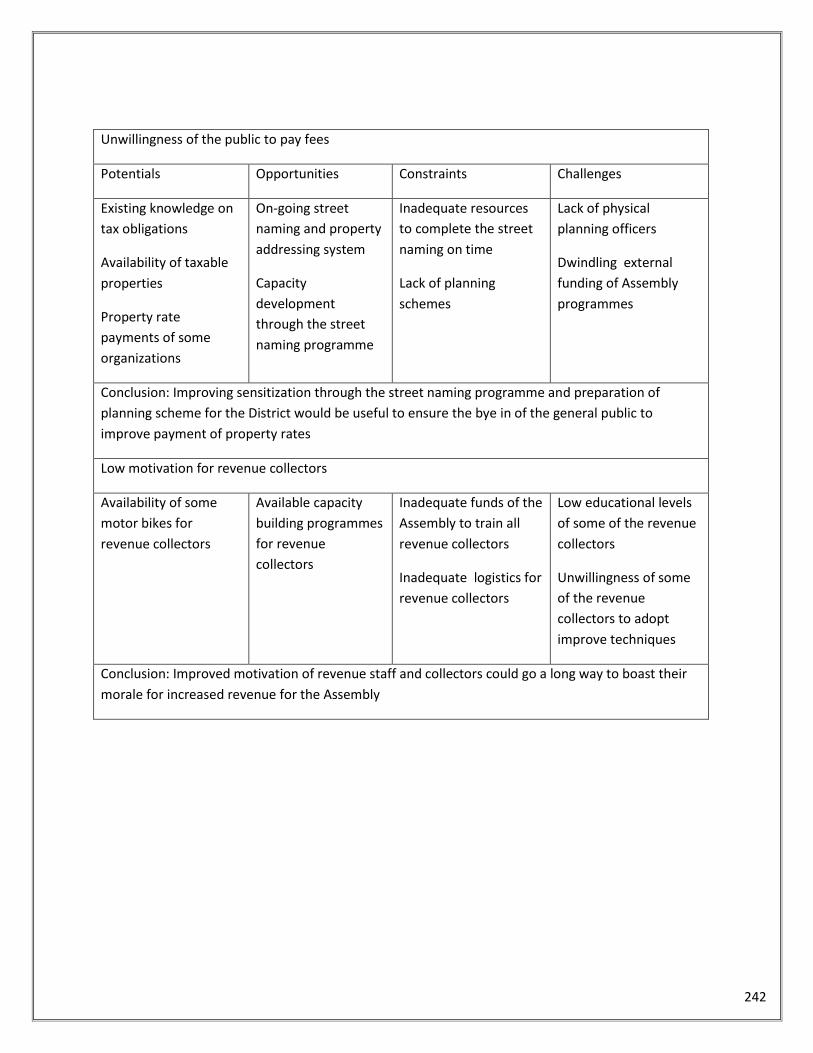
242
Unwillingness of the public to pay fees
Potentials Opportunities Constraints Challenges
Existing knowledge on
tax obligations
Availability of taxable
properties
Property rate
payments of some
organizations
On-going street
naming and property
addressing system
Capacity
development
through the street
naming programme
Inadequate resources
to complete the street
naming on time
Lack of planning
schemes
Lack of physical
planning officers
Dwindling external
funding of Assembly
programmes
Conclusion: Improving sensitization through the street naming programme and preparation of
planning scheme for the District would be useful to ensure the bye in of the general public to
improve payment of property rates
Low motivation for revenue collectors
Availability of some
motor bikes for
revenue collectors
Available capacity
building programmes
for revenue
collectors
Inadequate funds of the
Assembly to train all
revenue collectors
Inadequate logistics for
revenue collectors
Low educational levels
of some of the revenue
collectors
Unwillingness of some
of the revenue
collectors to adopt
improve techniques
Conclusion: Improved motivation of revenue staff and collectors could go a long way to boast their
morale for increased revenue for the Assembly
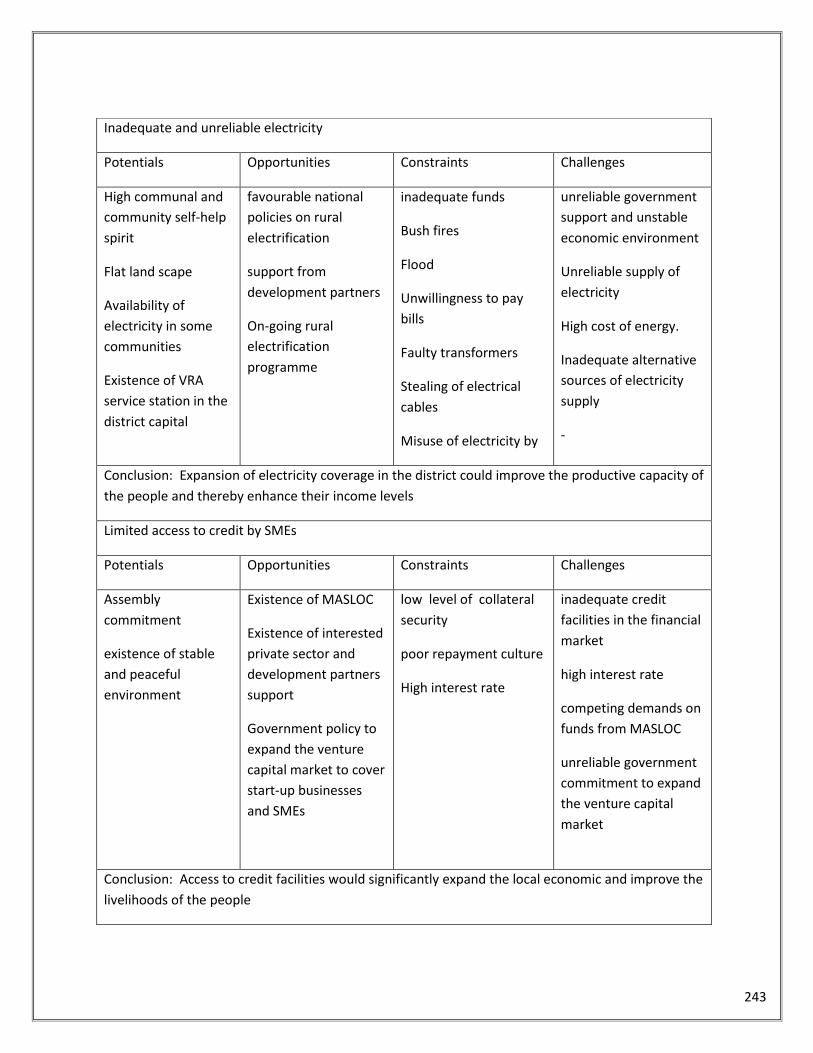
243
Inadequate and unreliable electricity
Potentials Opportunities Constraints Challenges
High communal and
community self-help
spirit
Flat land scape
Availability of
electricity in some
communities
Existence of VRA
service station in the
district capital
favourable national
policies on rural
electrification
support from
development partners
On-going rural
electrification
programme
inadequate funds
Bush fires
Flood
Unwillingness to pay
bills
Faulty transformers
Stealing of electrical
cables
Misuse of electricity by
unreliable government
support and unstable
economic environment
Unreliable supply of
electricity
High cost of energy.
Inadequate alternative
sources of electricity
supply
-
Conclusion: Expansion of electricity coverage in the district could improve the productive capacity of
the people and thereby enhance their income levels
Limited access to credit by SMEs
Potentials Opportunities Constraints Challenges
Assembly
commitment
existence of stable
and peaceful
environment
Existence of MASLOC
Existence of interested
private sector and
development partners
support
Government policy to
expand the venture
capital market to cover
start-up businesses
and SMEs
low level of collateral
security
poor repayment culture
High interest rate
inadequate credit
facilities in the financial
market
high interest rate
competing demands on
funds from MASLOC
unreliable government
commitment to expand
the venture capital
market
Conclusion: Access to credit facilities would significantly expand the local economic and improve the
livelihoods of the people
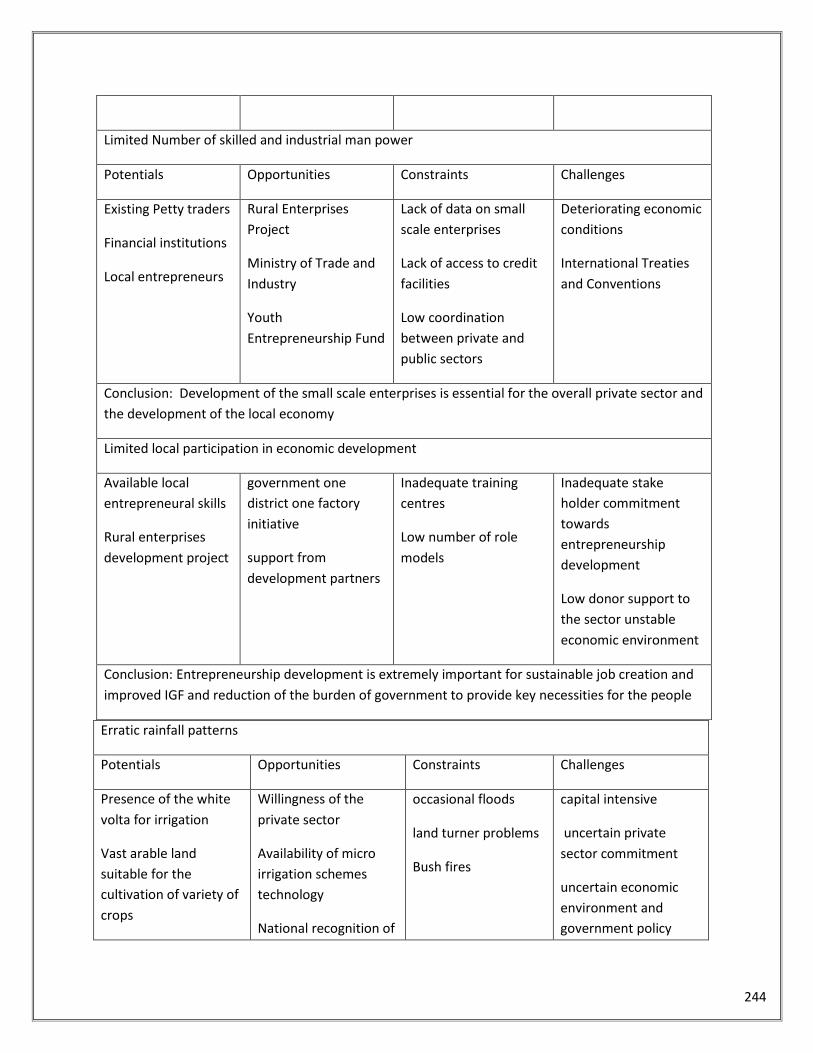
244
Erratic rainfall patterns
Potentials Opportunities Constraints Challenges
Presence of the white
volta for irrigation
Vast arable land
suitable for the
cultivation of variety of
crops
Willingness of the
private sector
Availability of micro
irrigation schemes
technology
National recognition of
occasional floods
land turner problems
Bush fires
capital intensive
uncertain private
sector commitment
uncertain economic
environment and
government policy
Limited Number of skilled and industrial man power
Potentials Opportunities Constraints Challenges
Existing Petty traders
Financial institutions
Local entrepreneurs
Rural Enterprises
Project
Ministry of Trade and
Industry
Youth
Entrepreneurship Fund
Lack of data on small
scale enterprises
Lack of access to credit
facilities
Low coordination
between private and
public sectors
Deteriorating economic
conditions
International Treaties
and Conventions
Conclusion: Development of the small scale enterprises is essential for the overall private sector and
the development of the local economy
Limited local participation in economic development
Available local
entrepreneural skills
Rural enterprises
development project
government one
district one factory
initiative
support from
development partners
Inadequate training
centres
Low number of role
models
Inadequate stake
holder commitment
towards
entrepreneurship
development
Low donor support to
the sector unstable
economic environment
Conclusion: Entrepreneurship development is extremely important for sustainable job creation and
improved IGF and reduction of the burden of government to provide key necessities for the people
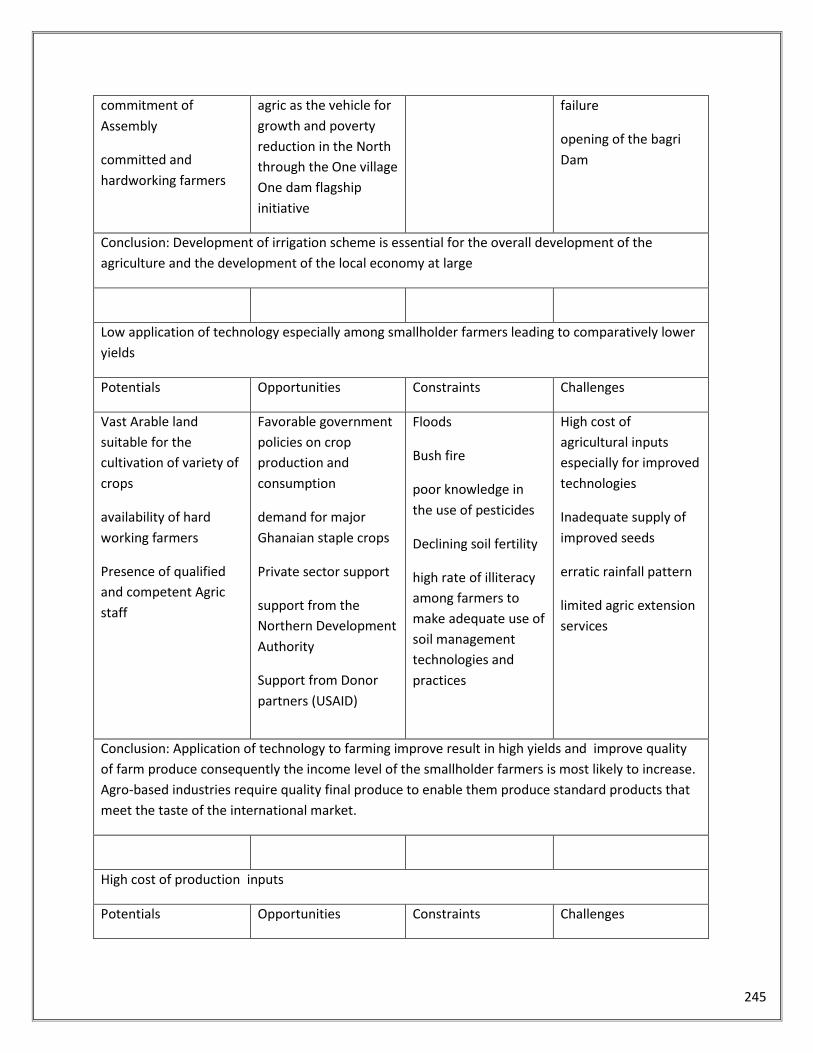
245
commitment of
Assembly
committed and
hardworking farmers
agric as the vehicle for
growth and poverty
reduction in the North
through the One village
One dam flagship
initiative
failure
opening of the bagri
Dam
Conclusion: Development of irrigation scheme is essential for the overall development of the
agriculture and the development of the local economy at large
Low application of technology especially among smallholder farmers leading to comparatively lower
yields
Potentials Opportunities Constraints Challenges
Vast Arable land
suitable for the
cultivation of variety of
crops
availability of hard
working farmers
Presence of qualified
and competent Agric
staff
Favorable government
policies on crop
production and
consumption
demand for major
Ghanaian staple crops
Private sector support
support from the
Northern Development
Authority
Support from Donor
partners (USAID)
Floods
Bush fire
poor knowledge in
the use of pesticides
Declining soil fertility
high rate of illiteracy
among farmers to
make adequate use of
soil management
technologies and
practices
High cost of
agricultural inputs
especially for improved
technologies
Inadequate supply of
improved seeds
erratic rainfall pattern
limited agric extension
services
Conclusion: Application of technology to farming improve result in high yields and improve quality
of farm produce consequently the income level of the smallholder farmers is most likely to increase.
Agro-based industries require quality final produce to enable them produce standard products that
meet the taste of the international market.
High cost of production inputs
Potentials Opportunities Constraints Challenges
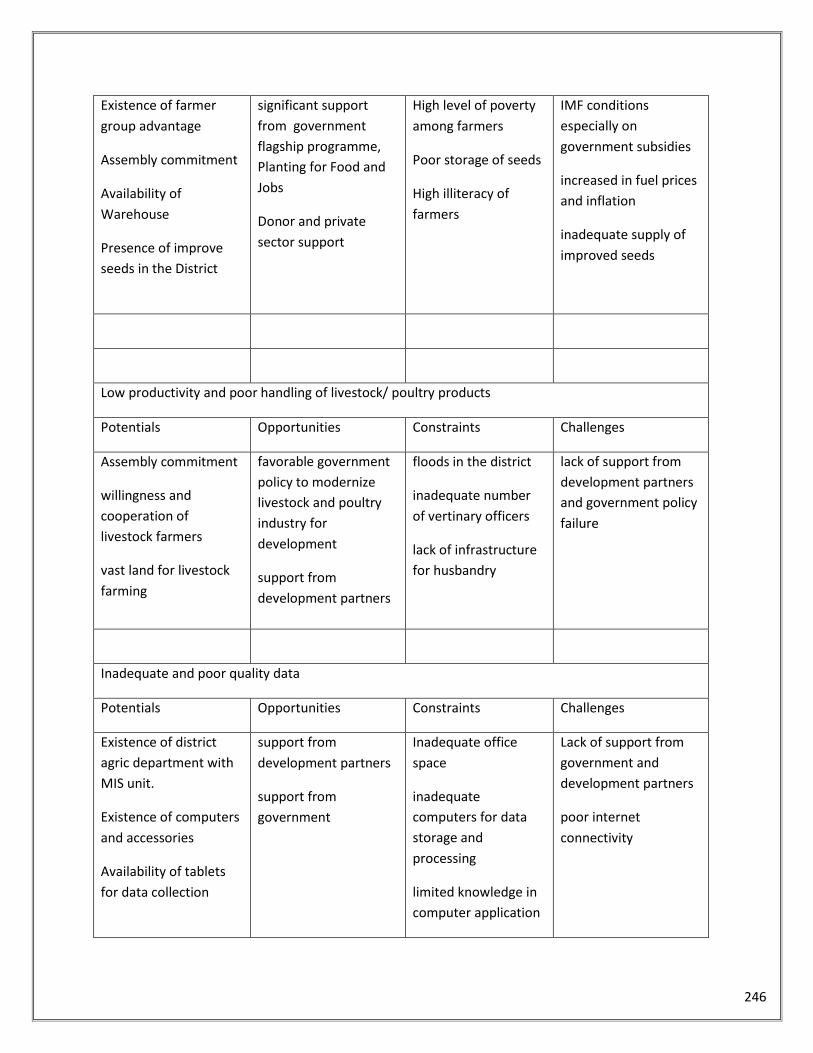
246
Existence of farmer
group advantage
Assembly commitment
Availability of
Warehouse
Presence of improve
seeds in the District
significant support
from government
flagship programme,
Planting for Food and
Jobs
Donor and private
sector support
High level of poverty
among farmers
Poor storage of seeds
High illiteracy of
farmers
IMF conditions
especially on
government subsidies
increased in fuel prices
and inflation
inadequate supply of
improved seeds
Low productivity and poor handling of livestock/ poultry products
Potentials Opportunities Constraints Challenges
Assembly commitment
willingness and
cooperation of
livestock farmers
vast land for livestock
farming
favorable government
policy to modernize
livestock and poultry
industry for
development
support from
development partners
floods in the district
inadequate number
of vertinary officers
lack of infrastructure
for husbandry
lack of support from
development partners
and government policy
failure
Inadequate and poor quality data
Potentials Opportunities Constraints Challenges
Existence of district
agric department with
MIS unit.
Existence of computers
and accessories
Availability of tablets
for data collection
support from
development partners
support from
government
Inadequate office
space
inadequate
computers for data
storage and
processing
limited knowledge in
computer application
Lack of support from
government and
development partners
poor internet
connectivity
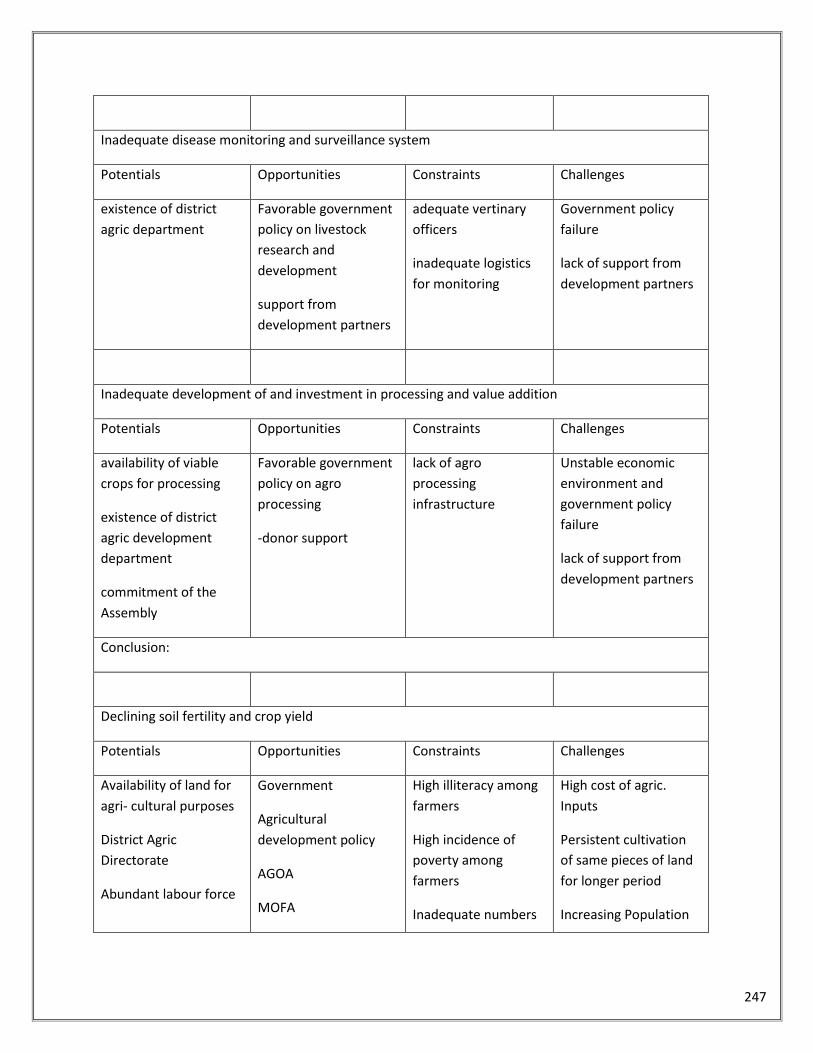
247
Inadequate disease monitoring and surveillance system
Potentials Opportunities Constraints Challenges
existence of district
agric department
Favorable government
policy on livestock
research and
development
support from
development partners
adequate vertinary
officers
inadequate logistics
for monitoring
Government policy
failure
lack of support from
development partners
Inadequate development of and investment in processing and value addition
Potentials Opportunities Constraints Challenges
availability of viable
crops for processing
existence of district
agric development
department
commitment of the
Assembly
Favorable government
policy on agro
processing
-donor support
lack of agro
processing
infrastructure
Unstable economic
environment and
government policy
failure
lack of support from
development partners
Conclusion:
Declining soil fertility and crop yield
Potentials Opportunities Constraints Challenges
Availability of land for
agri- cultural purposes
District Agric
Directorate
Abundant labour force
Government
Agricultural
development policy
AGOA
MOFA
High illiteracy among
farmers
High incidence of
poverty among
farmers
Inadequate numbers
High cost of agric.
Inputs
Persistent cultivation
of same pieces of land
for longer period
Increasing Population
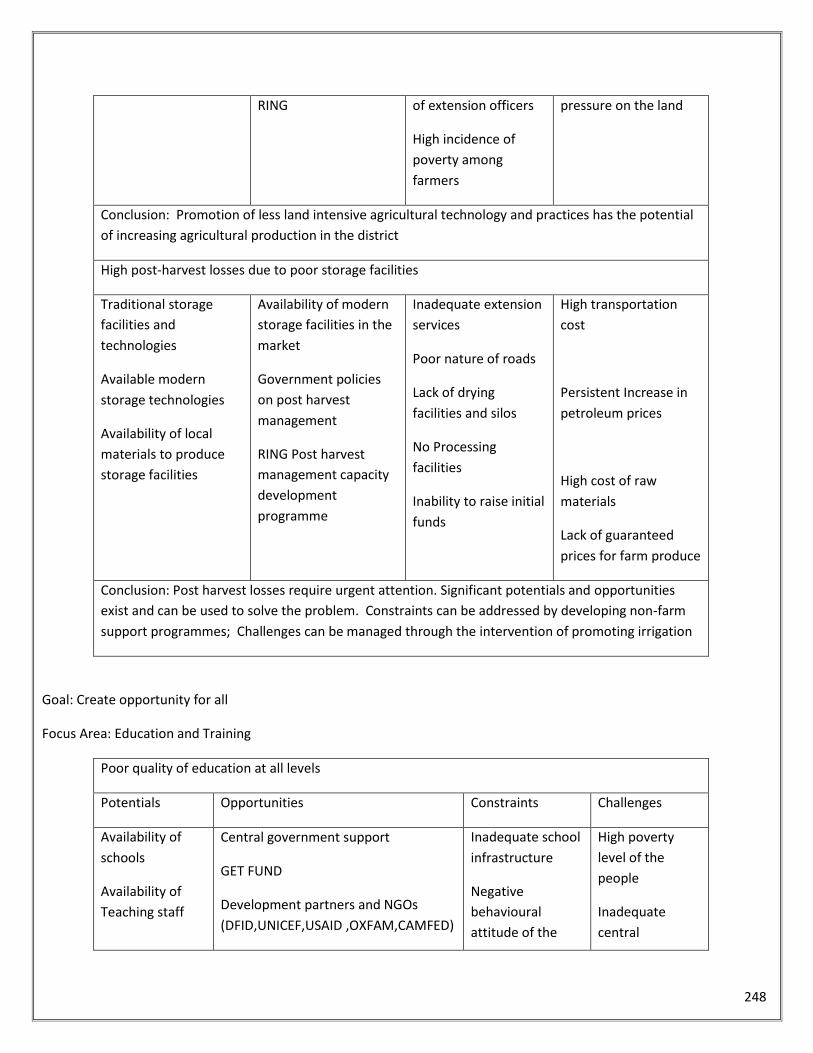
248
RING of extension officers
High incidence of
poverty among
farmers
pressure on the land
Conclusion: Promotion of less land intensive agricultural technology and practices has the potential
of increasing agricultural production in the district
High post-harvest losses due to poor storage facilities
Traditional storage
facilities and
technologies
Available modern
storage technologies
Availability of local
materials to produce
storage facilities
Availability of modern
storage facilities in the
market
Government policies
on post harvest
management
RING Post harvest
management capacity
development
programme
Inadequate extension
services
Poor nature of roads
Lack of drying
facilities and silos
No Processing
facilities
Inability to raise initial
funds
High transportation
cost
Persistent Increase in
petroleum prices
High cost of raw
materials
Lack of guaranteed
prices for farm produce
Conclusion: Post harvest losses require urgent attention. Significant potentials and opportunities
exist and can be used to solve the problem. Constraints can be addressed by developing non-farm
support programmes; Challenges can be managed through the intervention of promoting irrigation
Goal: Create opportunity for all
Focus Area: Education and Training
Poor quality of education at all levels
Potentials Opportunities Constraints Challenges
Availability of
schools
Availability of
Teaching staff
Central government support
GET FUND
Development partners and NGOs
(DFID,UNICEF,USAID ,OXFAM,CAMFED)
Inadequate school
infrastructure
Negative
behavioural
attitude of the
High poverty
level of the
people
Inadequate
central
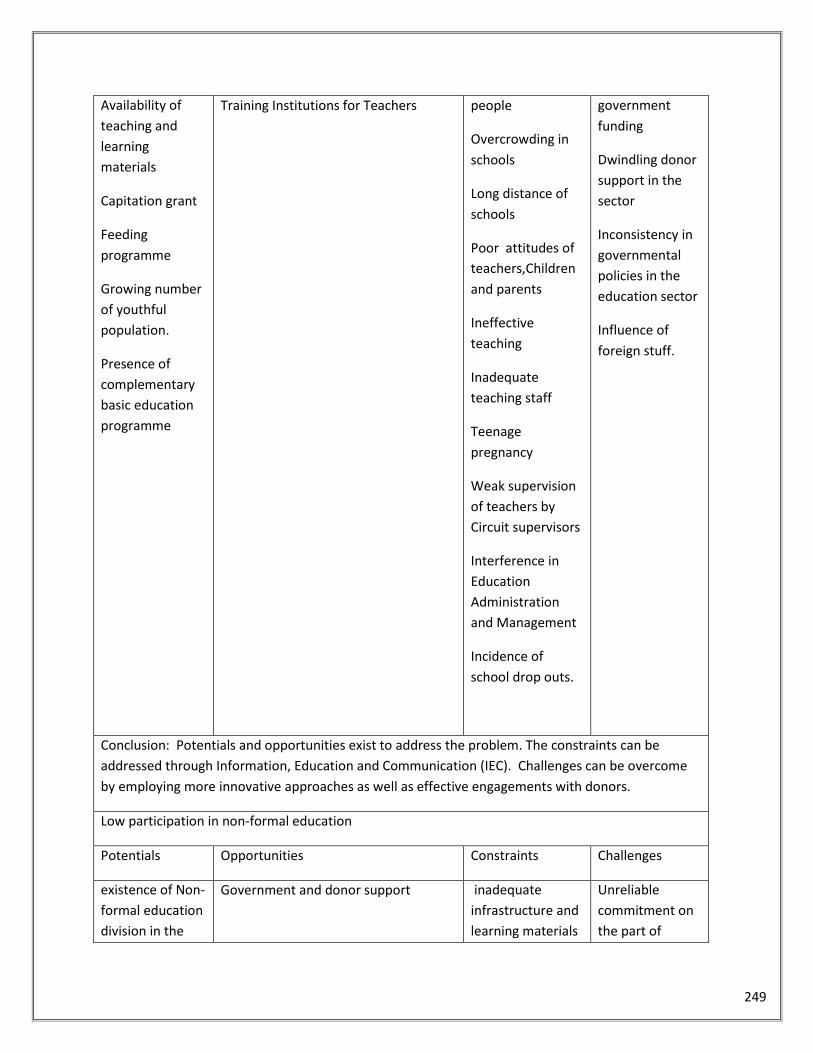
249
Availability of
teaching and
learning
materials
Capitation grant
Feeding
programme
Growing number
of youthful
population.
Presence of
complementary
basic education
programme
Training Institutions for Teachers
people
Overcrowding in
schools
Long distance of
schools
Poor attitudes of
teachers,Children
and parents
Ineffective
teaching
Inadequate
teaching staff
Teenage
pregnancy
Weak supervision
of teachers by
Circuit supervisors
Interference in
Education
Administration
and Management
Incidence of
school drop outs.
government
funding
Dwindling donor
support in the
sector
Inconsistency in
governmental
policies in the
education sector
Influence of
foreign stuff.
Conclusion: Potentials and opportunities exist to address the problem. The constraints can be
addressed through Information, Education and Communication (IEC). Challenges can be overcome
by employing more innovative approaches as well as effective engagements with donors.
Low participation in non-formal education
Potentials Opportunities Constraints Challenges
existence of Non-
formal education
division in the
Government and donor support inadequate
infrastructure and
learning materials
Unreliable
commitment on
the part of
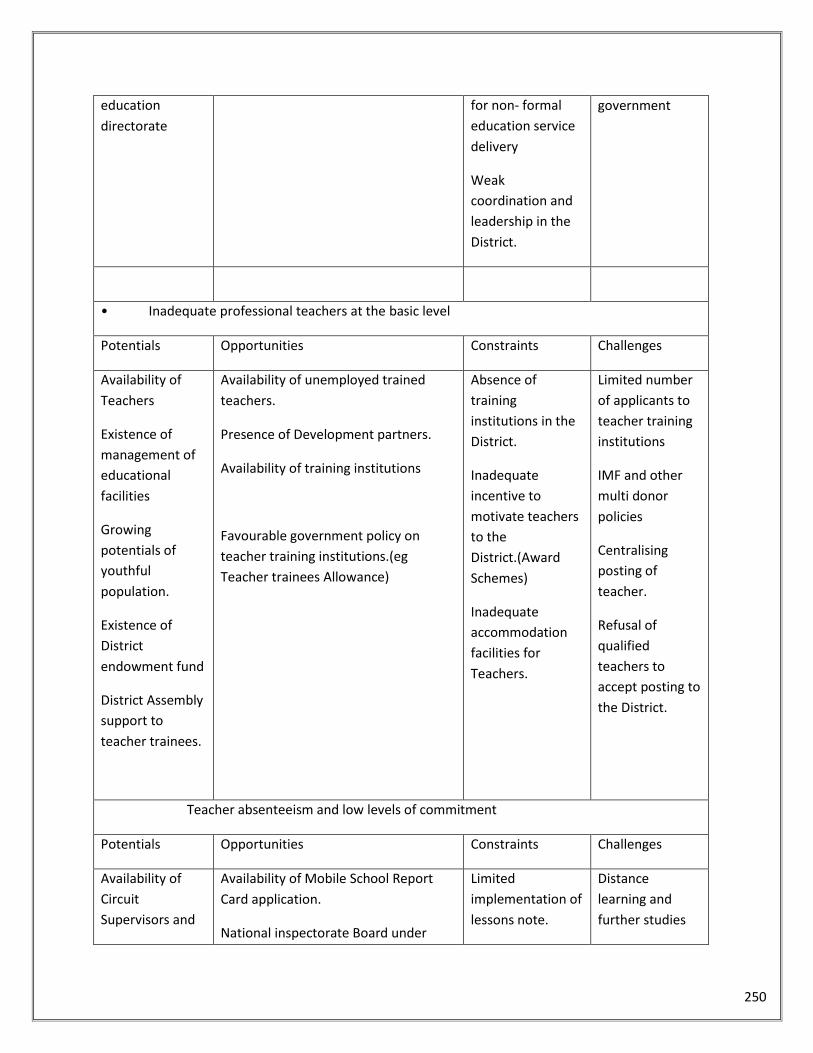
250
education
directorate
for non- formal
education service
delivery
Weak
coordination and
leadership in the
District.
government
• Inadequate professional teachers at the basic level
Potentials Opportunities Constraints Challenges
Availability of
Teachers
Existence of
management of
educational
facilities
Growing
potentials of
youthful
population.
Existence of
District
endowment fund
District Assembly
support to
teacher trainees.
Availability of unemployed trained
teachers.
Presence of Development partners.
Availability of training institutions
Favourable government policy on
teacher training institutions.(eg
Teacher trainees Allowance)
Absence of
training
institutions in the
District.
Inadequate
incentive to
motivate teachers
to the
District.(Award
Schemes)
Inadequate
accommodation
facilities for
Teachers.
Limited number
of applicants to
teacher training
institutions
IMF and other
multi donor
policies
Centralising
posting of
teacher.
Refusal of
qualified
teachers to
accept posting to
the District.
Teacher absenteeism and low levels of commitment
Potentials Opportunities Constraints Challenges
Availability of
Circuit
Supervisors and
Availability of Mobile School Report
Card application.
National inspectorate Board under
Limited
implementation of
lessons note.
Distance
learning and
further studies
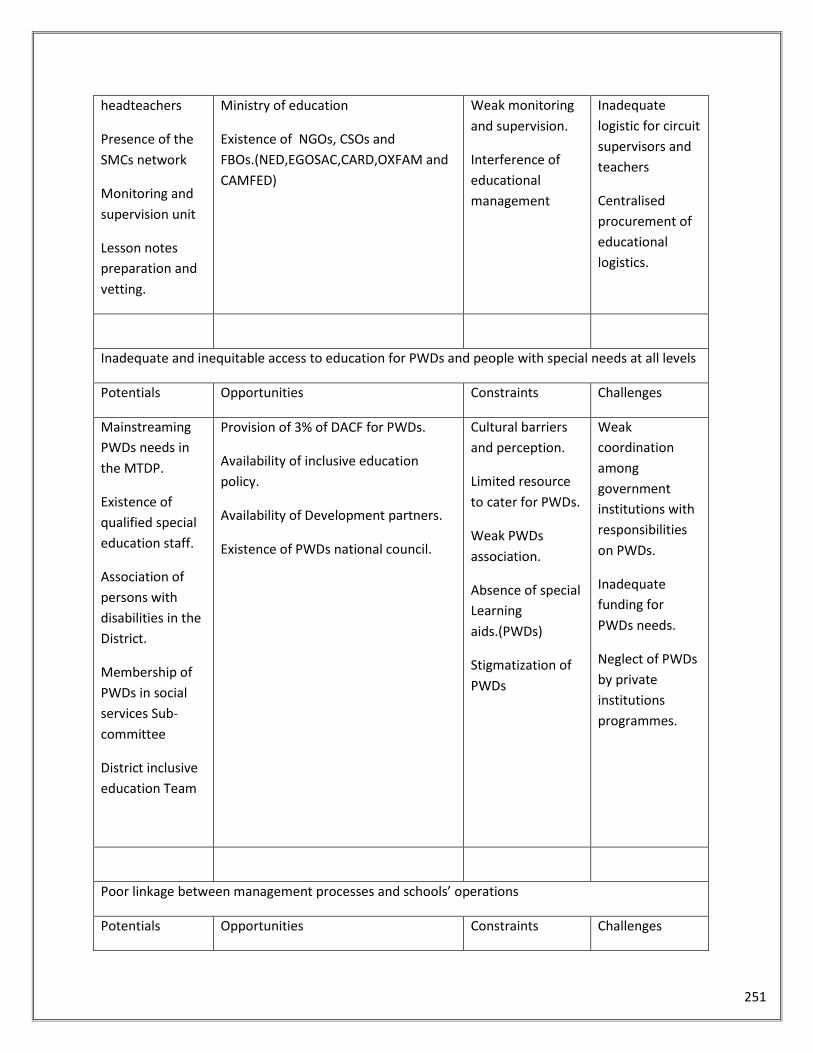
251
headteachers
Presence of the
SMCs network
Monitoring and
supervision unit
Lesson notes
preparation and
vetting.
Ministry of education
Existence of NGOs, CSOs and
FBOs.(NED,EGOSAC,CARD,OXFAM and
CAMFED)
Weak monitoring
and supervision.
Interference of
educational
management
Inadequate
logistic for circuit
supervisors and
teachers
Centralised
procurement of
educational
logistics.
Inadequate and inequitable access to education for PWDs and people with special needs at all levels
Potentials Opportunities Constraints Challenges
Mainstreaming
PWDs needs in
the MTDP.
Existence of
qualified special
education staff.
Association of
persons with
disabilities in the
District.
Membership of
PWDs in social
services Sub-
committee
District inclusive
education Team
Provision of 3% of DACF for PWDs.
Availability of inclusive education
policy.
Availability of Development partners.
Existence of PWDs national council.
Cultural barriers
and perception.
Limited resource
to cater for PWDs.
Weak PWDs
association.
Absence of special
Learning
aids.(PWDs)
Stigmatization of
PWDs
Weak
coordination
among
government
institutions with
responsibilities
on PWDs.
Inadequate
funding for
PWDs needs.
Neglect of PWDs
by private
institutions
programmes.
Poor linkage between management processes and schools’ operations
Potentials Opportunities Constraints Challenges
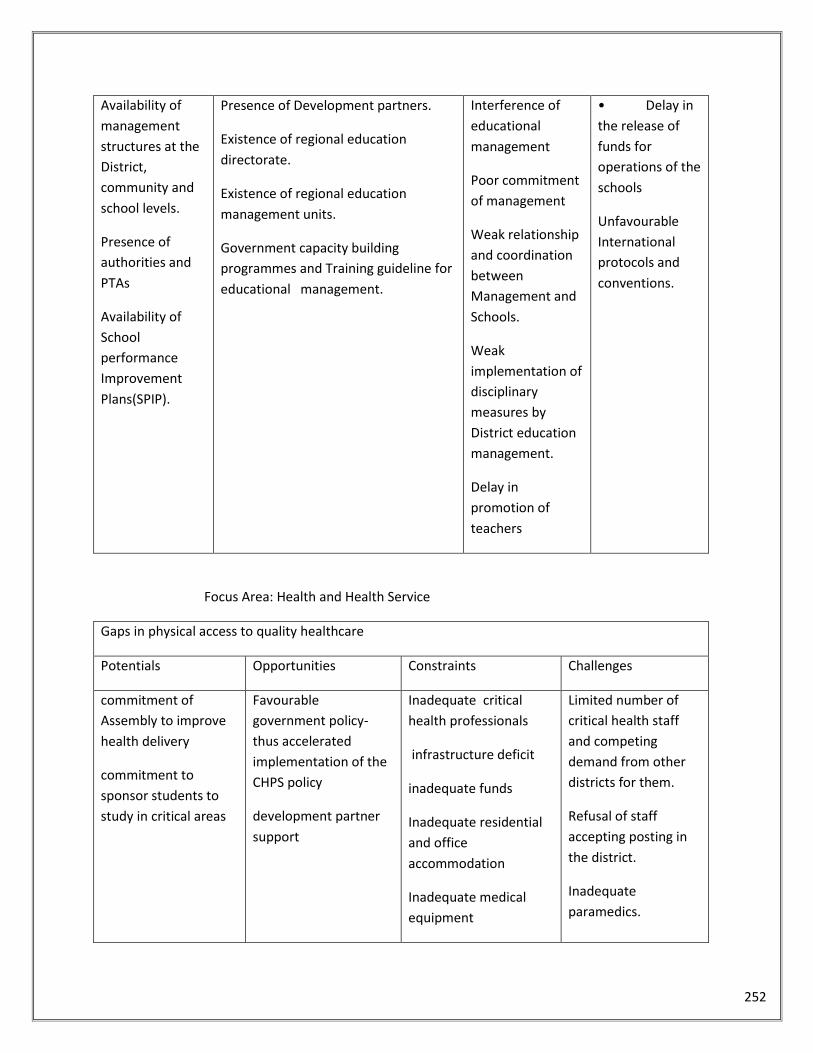
252
Availability of
management
structures at the
District,
community and
school levels.
Presence of
authorities and
PTAs
Availability of
School
performance
Improvement
Plans(SPIP).
Presence of Development partners.
Existence of regional education
directorate.
Existence of regional education
management units.
Government capacity building
programmes and Training guideline for
educational management.
Interference of
educational
management
Poor commitment
of management
Weak relationship
and coordination
between
Management and
Schools.
Weak
implementation of
disciplinary
measures by
District education
management.
Delay in
promotion of
teachers
• Delay in
the release of
funds for
operations of the
schools
Unfavourable
International
protocols and
conventions.
Focus Area: Health and Health Service
Gaps in physical access to quality healthcare
Potentials Opportunities Constraints Challenges
commitment of
Assembly to improve
health delivery
commitment to
sponsor students to
study in critical areas
Favourable
government policy-
thus accelerated
implementation of the
CHPS policy
development partner
support
Inadequate critical
health professionals
infrastructure deficit
inadequate funds
Inadequate residential
and office
accommodation
Inadequate medical
equipment
Limited number of
critical health staff
and competing
demand from other
districts for them.
Refusal of staff
accepting posting in
the district.
Inadequate
paramedics.
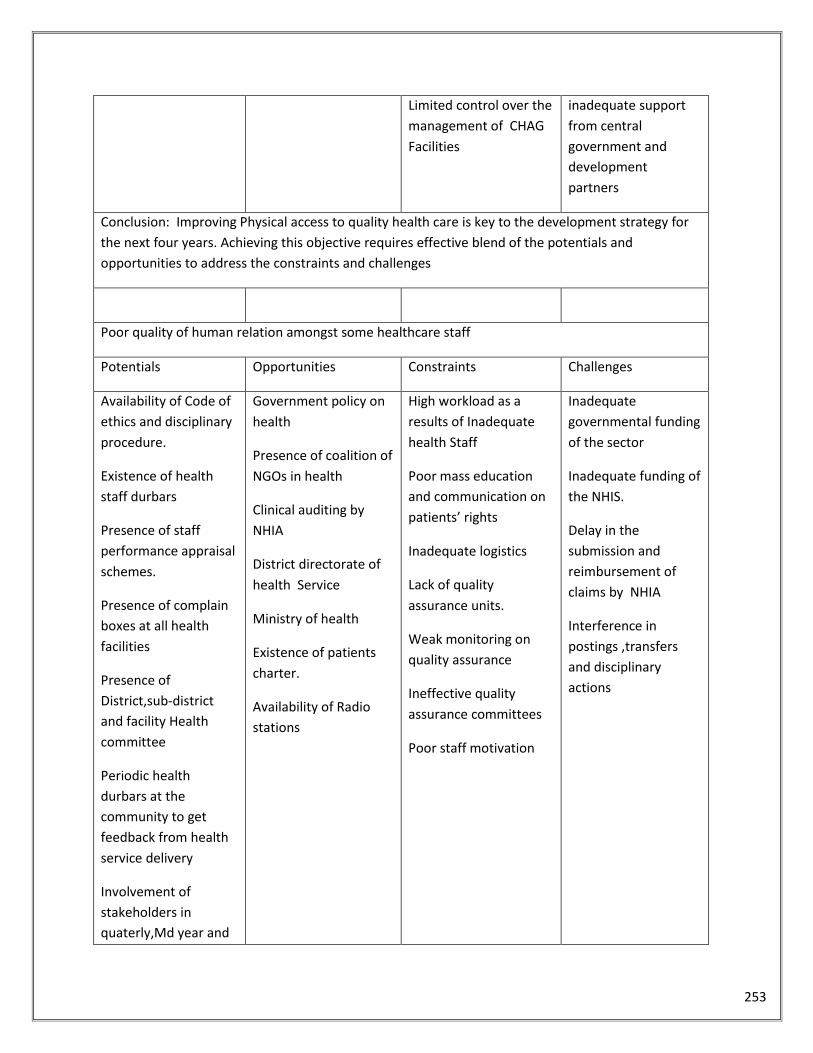
253
Limited control over the
management of CHAG
Facilities
inadequate support
from central
government and
development
partners
Conclusion: Improving Physical access to quality health care is key to the development strategy for
the next four years. Achieving this objective requires effective blend of the potentials and
opportunities to address the constraints and challenges
Poor quality of human relation amongst some healthcare staff
Potentials Opportunities Constraints Challenges
Availability of Code of
ethics and disciplinary
procedure.
Existence of health
staff durbars
Presence of staff
performance appraisal
schemes.
Presence of complain
boxes at all health
facilities
Presence of
District,sub-district
and facility Health
committee
Periodic health
durbars at the
community to get
feedback from health
service delivery
Involvement of
stakeholders in
quaterly,Md year and
Government policy on
health
Presence of coalition of
NGOs in health
Clinical auditing by
NHIA
District directorate of
health Service
Ministry of health
Existence of patients
charter.
Availability of Radio
stations
High workload as a
results of Inadequate
health Staff
Poor mass education
and communication on
patients’ rights
Inadequate logistics
Lack of quality
assurance units.
Weak monitoring on
quality assurance
Ineffective quality
assurance committees
Poor staff motivation
Inadequate
governmental funding
of the sector
Inadequate funding of
the NHIS.
Delay in the
submission and
reimbursement of
claims by NHIA
Interference in
postings ,transfers
and disciplinary
actions
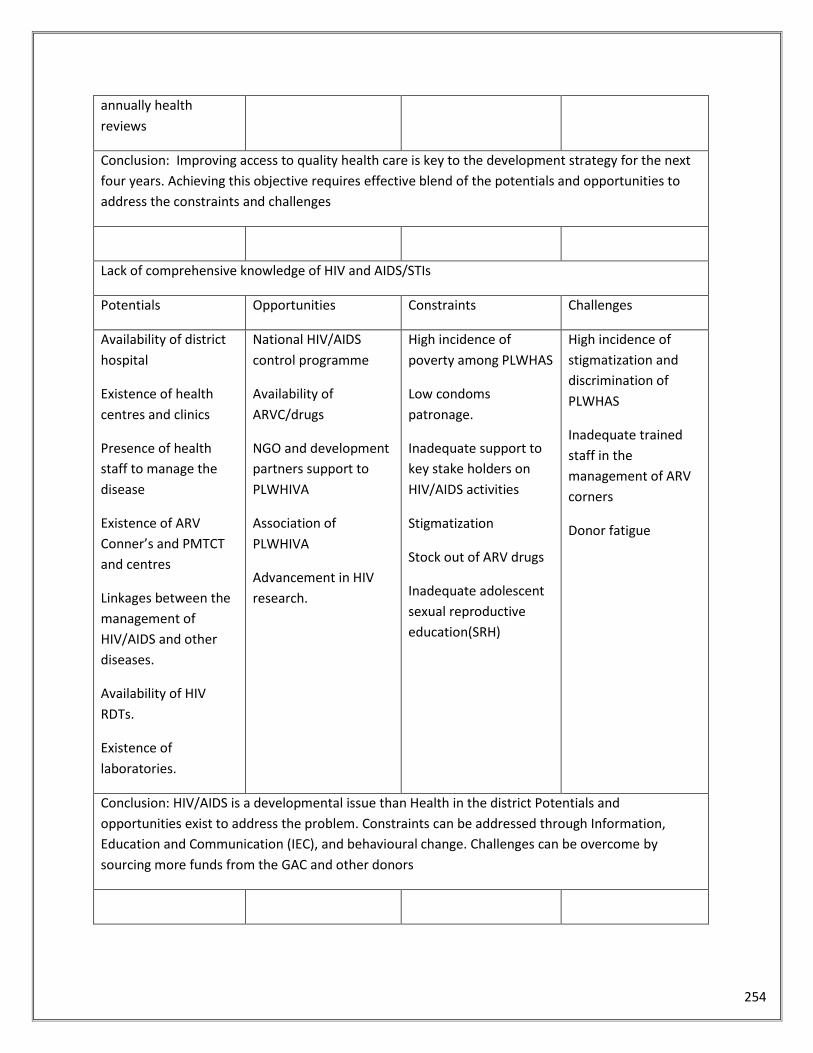
254
annually health
reviews
Conclusion: Improving access to quality health care is key to the development strategy for the next
four years. Achieving this objective requires effective blend of the potentials and opportunities to
address the constraints and challenges
Lack of comprehensive knowledge of HIV and AIDS/STIs
Potentials Opportunities Constraints Challenges
Availability of district
hospital
Existence of health
centres and clinics
Presence of health
staff to manage the
disease
Existence of ARV
Conner’s and PMTCT
and centres
Linkages between the
management of
HIV/AIDS and other
diseases.
Availability of HIV
RDTs.
Existence of
laboratories.
National HIV/AIDS
control programme
Availability of
ARVC/drugs
NGO and development
partners support to
PLWHIVA
Association of
PLWHIVA
Advancement in HIV
research.
High incidence of
poverty among PLWHAS
Low condoms
patronage.
Inadequate support to
key stake holders on
HIV/AIDS activities
Stigmatization
Stock out of ARV drugs
Inadequate adolescent
sexual reproductive
education(SRH)
High incidence of
stigmatization and
discrimination of
PLWHAS
Inadequate trained
staff in the
management of ARV
corners
Donor fatigue
Conclusion: HIV/AIDS is a developmental issue than Health in the district Potentials and
opportunities exist to address the problem. Constraints can be addressed through Information,
Education and Communication (IEC), and behavioural change. Challenges can be overcome by
sourcing more funds from the GAC and other donors
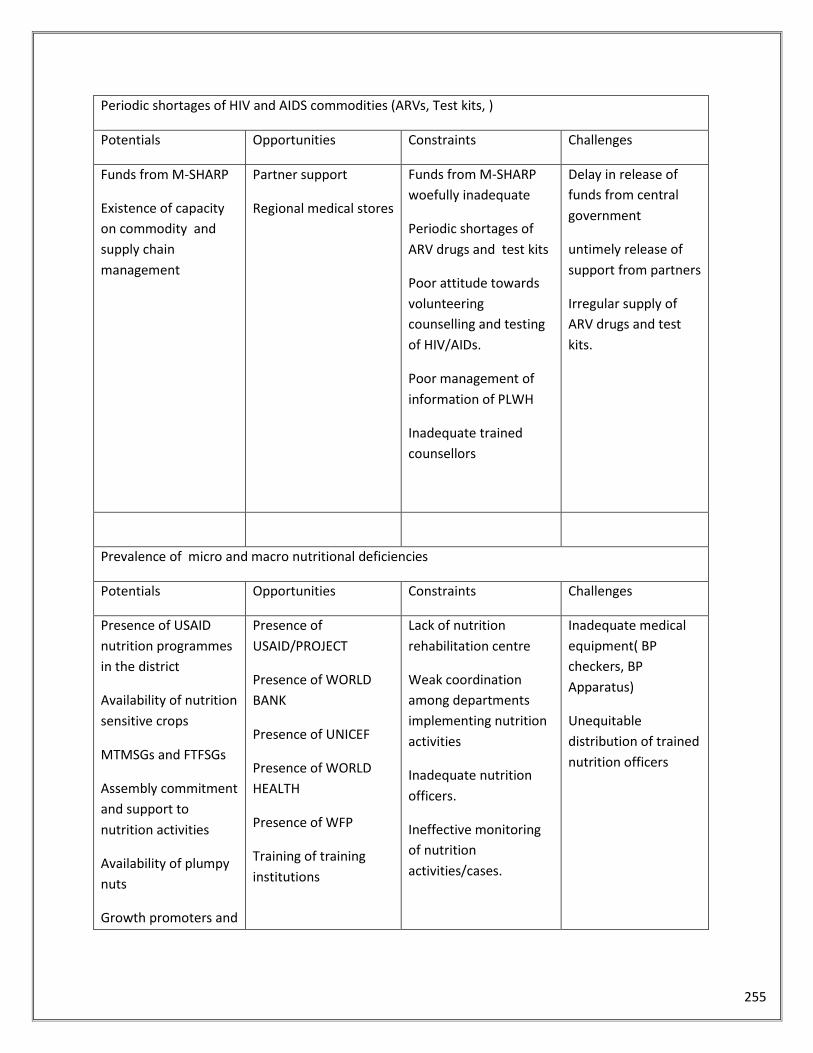
255
Periodic shortages of HIV and AIDS commodities (ARVs, Test kits, )
Potentials Opportunities Constraints Challenges
Funds from M-SHARP
Existence of capacity
on commodity and
supply chain
management
Partner support
Regional medical stores
Funds from M-SHARP
woefully inadequate
Periodic shortages of
ARV drugs and test kits
Poor attitude towards
volunteering
counselling and testing
of HIV/AIDs.
Poor management of
information of PLWH
Inadequate trained
counsellors
Delay in release of
funds from central
government
untimely release of
support from partners
Irregular supply of
ARV drugs and test
kits.
Prevalence of micro and macro nutritional deficiencies
Potentials Opportunities Constraints Challenges
Presence of USAID
nutrition programmes
in the district
Availability of nutrition
sensitive crops
MTMSGs and FTFSGs
Assembly commitment
and support to
nutrition activities
Availability of plumpy
nuts
Growth promoters and
Presence of
USAID/PROJECT
Presence of WORLD
BANK
Presence of UNICEF
Presence of WORLD
HEALTH
Presence of WFP
Training of training
institutions
Lack of nutrition
rehabilitation centre
Weak coordination
among departments
implementing nutrition
activities
Inadequate nutrition
officers.
Ineffective monitoring
of nutrition
activities/cases.
Inadequate medical
equipment( BP
checkers, BP
Apparatus)
Unequitable
distribution of trained
nutrition officers
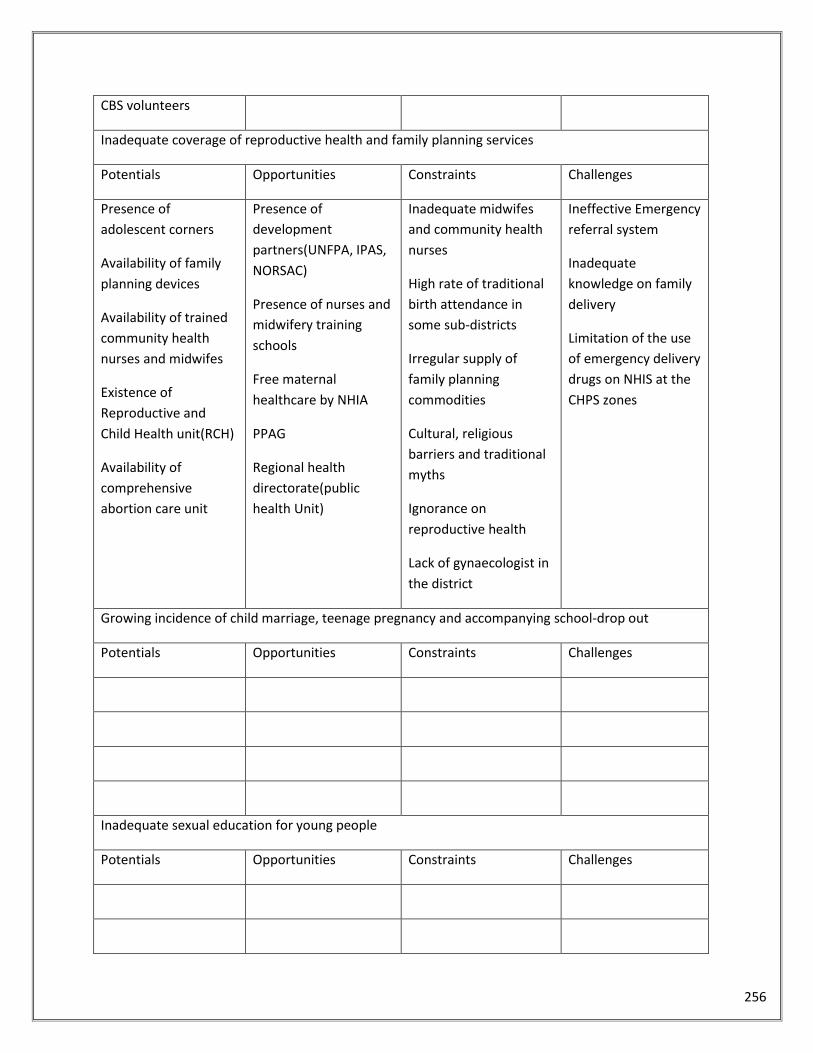
256
CBS volunteers
Inadequate coverage of reproductive health and family planning services
Potentials Opportunities Constraints Challenges
Presence of
adolescent corners
Availability of family
planning devices
Availability of trained
community health
nurses and midwifes
Existence of
Reproductive and
Child Health unit(RCH)
Availability of
comprehensive
abortion care unit
Presence of
development
partners(UNFPA, IPAS,
NORSAC)
Presence of nurses and
midwifery training
schools
Free maternal
healthcare by NHIA
PPAG
Regional health
directorate(public
health Unit)
Inadequate midwifes
and community health
nurses
High rate of traditional
birth attendance in
some sub-districts
Irregular supply of
family planning
commodities
Cultural, religious
barriers and traditional
myths
Ignorance on
reproductive health
Lack of gynaecologist in
the district
Ineffective Emergency
referral system
Inadequate
knowledge on family
delivery
Limitation of the use
of emergency delivery
drugs on NHIS at the
CHPS zones
Growing incidence of child marriage, teenage pregnancy and accompanying school-drop out
Potentials Opportunities Constraints Challenges
Inadequate sexual education for young people
Potentials Opportunities Constraints Challenges
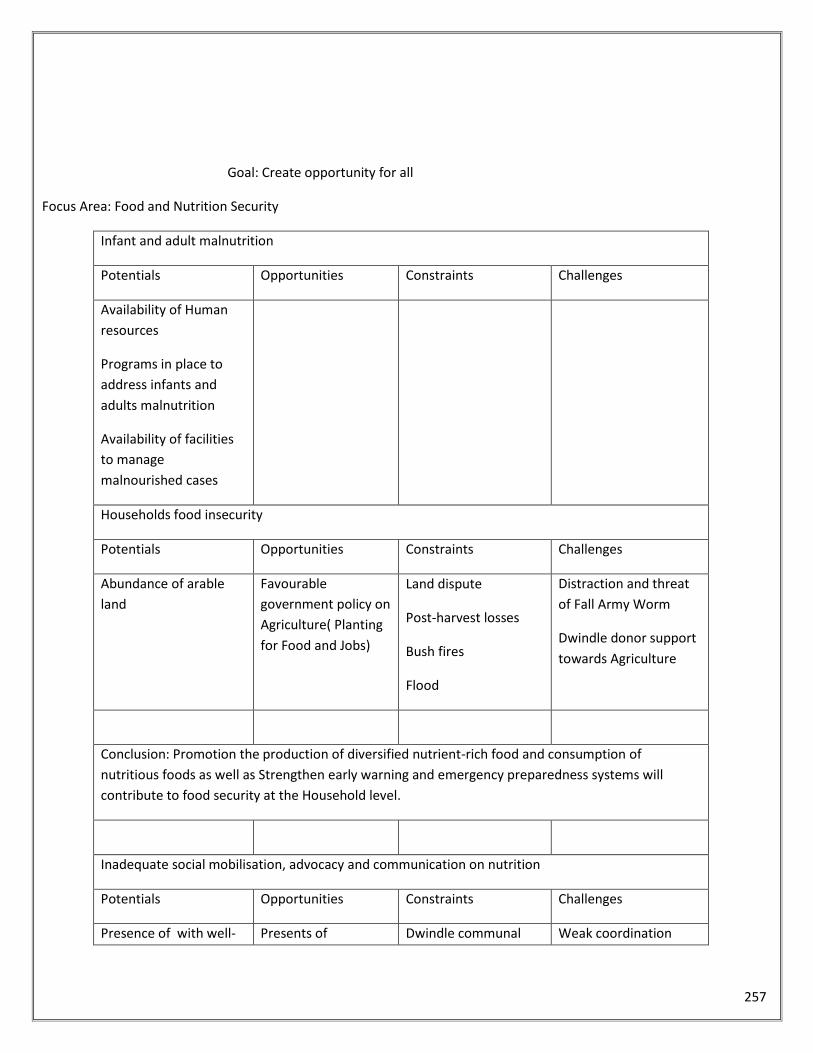
257
Goal: Create opportunity for all
Focus Area: Food and Nutrition Security
Infant and adult malnutrition
Potentials Opportunities Constraints Challenges
Availability of Human
resources
Programs in place to
address infants and
adults malnutrition
Availability of facilities
to manage
malnourished cases
Households food insecurity
Potentials Opportunities Constraints Challenges
Abundance of arable
land
Favourable
government policy on
Agriculture( Planting
for Food and Jobs)
Land dispute
Post-harvest losses
Bush fires
Flood
Distraction and threat
of Fall Army Worm
Dwindle donor support
towards Agriculture
Conclusion: Promotion the production of diversified nutrient-rich food and consumption of
nutritious foods as well as Strengthen early warning and emergency preparedness systems will
contribute to food security at the Household level.
Inadequate social mobilisation, advocacy and communication on nutrition
Potentials Opportunities Constraints Challenges
Presence of with well- Presents of Dwindle communal Weak coordination
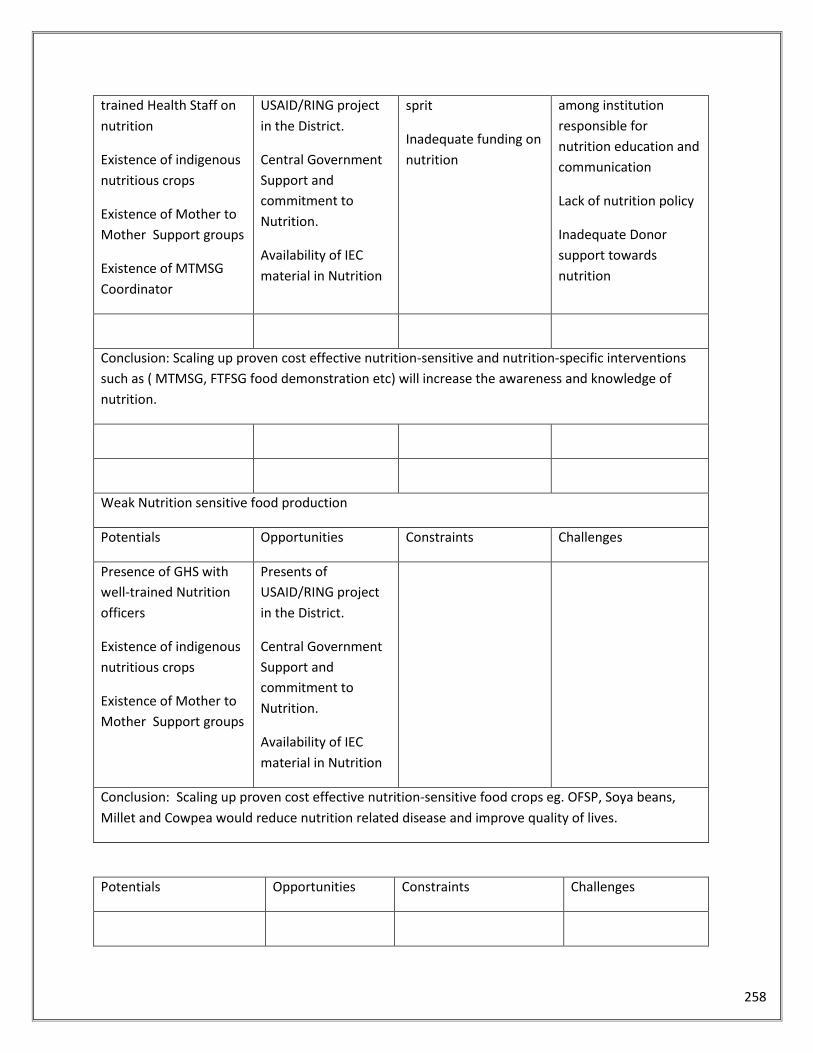
258
trained Health Staff on
nutrition
Existence of indigenous
nutritious crops
Existence of Mother to
Mother Support groups
Existence of MTMSG
Coordinator
USAID/RING project
in the District.
Central Government
Support and
commitment to
Nutrition.
Availability of IEC
material in Nutrition
sprit
Inadequate funding on
nutrition
among institution
responsible for
nutrition education and
communication
Lack of nutrition policy
Inadequate Donor
support towards
nutrition
Conclusion: Scaling up proven cost effective nutrition-sensitive and nutrition-specific interventions
such as ( MTMSG, FTFSG food demonstration etc) will increase the awareness and knowledge of
nutrition.
Weak Nutrition sensitive food production
Potentials Opportunities Constraints Challenges
Presence of GHS with
well-trained Nutrition
officers
Existence of indigenous
nutritious crops
Existence of Mother to
Mother Support groups
Presents of
USAID/RING project
in the District.
Central Government
Support and
commitment to
Nutrition.
Availability of IEC
material in Nutrition
Conclusion: Scaling up proven cost effective nutrition-sensitive food crops eg. OFSP, Soya beans,
Millet and Cowpea would reduce nutrition related disease and improve quality of lives.
Potentials Opportunities Constraints Challenges
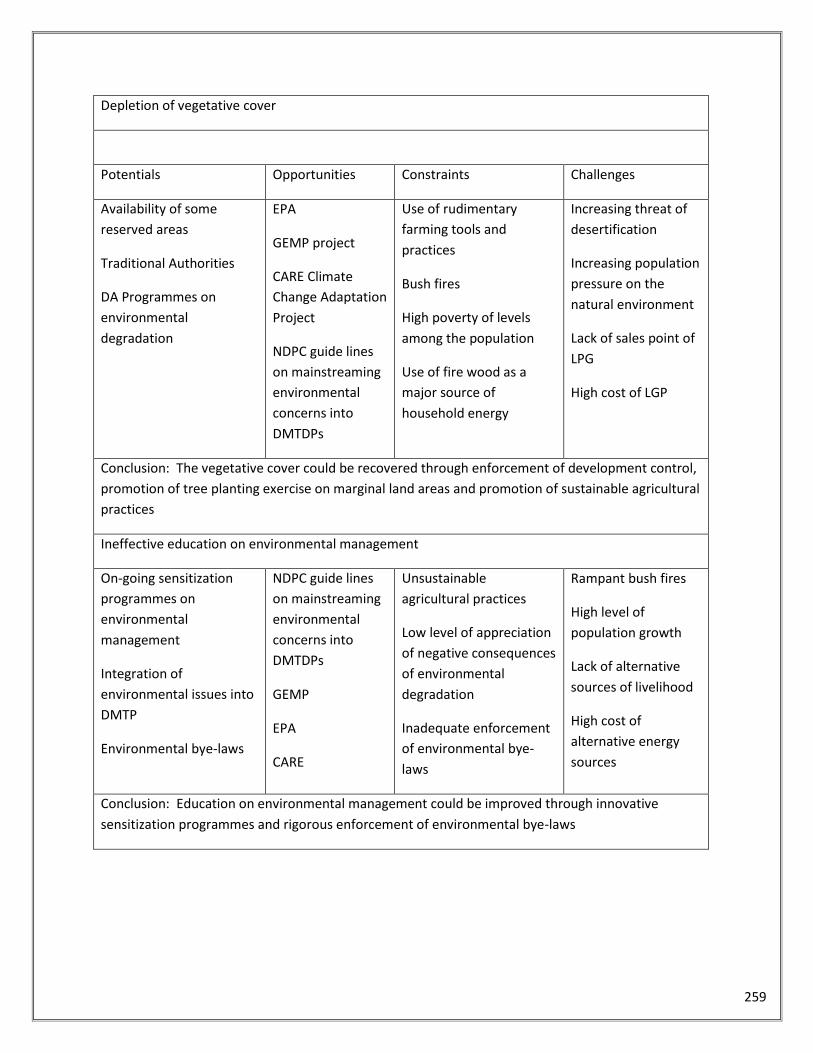
259
Depletion of vegetative cover
Potentials Opportunities Constraints Challenges
Availability of some
reserved areas
Traditional Authorities
DA Programmes on
environmental
degradation
EPA
GEMP project
CARE Climate
Change Adaptation
Project
NDPC guide lines
on mainstreaming
environmental
concerns into
DMTDPs
Use of rudimentary
farming tools and
practices
Bush fires
High poverty of levels
among the population
Use of fire wood as a
major source of
household energy
Increasing threat of
desertification
Increasing population
pressure on the
natural environment
Lack of sales point of
LPG
High cost of LGP
Conclusion: The vegetative cover could be recovered through enforcement of development control,
promotion of tree planting exercise on marginal land areas and promotion of sustainable agricultural
practices
Ineffective education on environmental management
On-going sensitization
programmes on
environmental
management
Integration of
environmental issues into
DMTP
Environmental bye-laws
NDPC guide lines
on mainstreaming
environmental
concerns into
DMTDPs
GEMP
EPA
CARE
Unsustainable
agricultural practices
Low level of appreciation
of negative consequences
of environmental
degradation
Inadequate enforcement
of environmental bye-
laws
Rampant bush fires
High level of
population growth
Lack of alternative
sources of livelihood
High cost of
alternative energy
sources
Conclusion: Education on environmental management could be improved through innovative
sensitization programmes and rigorous enforcement of environmental bye-laws
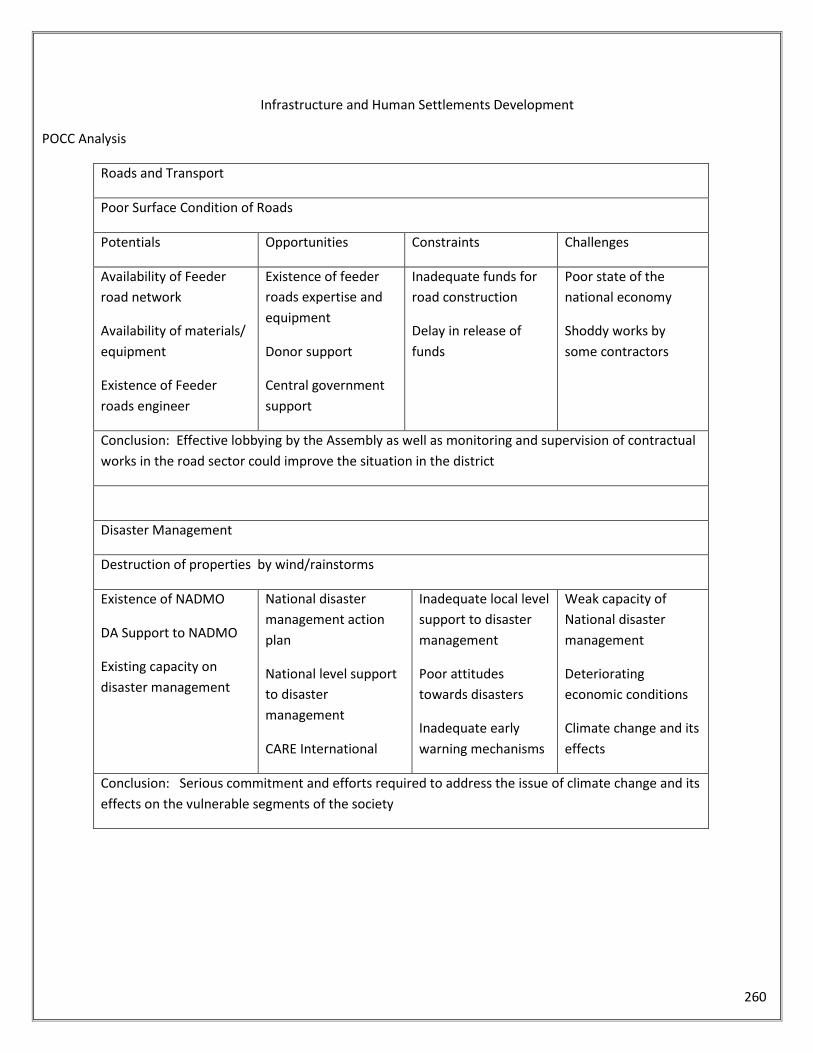
260
Infrastructure and Human Settlements Development
POCC Analysis
Roads and Transport
Poor Surface Condition of Roads
Potentials Opportunities Constraints Challenges
Availability of Feeder
road network
Availability of materials/
equipment
Existence of Feeder
roads engineer
Existence of feeder
roads expertise and
equipment
Donor support
Central government
support
Inadequate funds for
road construction
Delay in release of
funds
Poor state of the
national economy
Shoddy works by
some contractors
Conclusion: Effective lobbying by the Assembly as well as monitoring and supervision of contractual
works in the road sector could improve the situation in the district
Disaster Management
Destruction of properties by wind/rainstorms
Existence of NADMO
DA Support to NADMO
Existing capacity on
disaster management
National disaster
management action
plan
National level support
to disaster
management
CARE International
Inadequate local level
support to disaster
management
Poor attitudes
towards disasters
Inadequate early
warning mechanisms
Weak capacity of
National disaster
management
Deteriorating
economic conditions
Climate change and its
effects
Conclusion: Serious commitment and efforts required to address the issue of climate change and its
effects on the vulnerable segments of the society
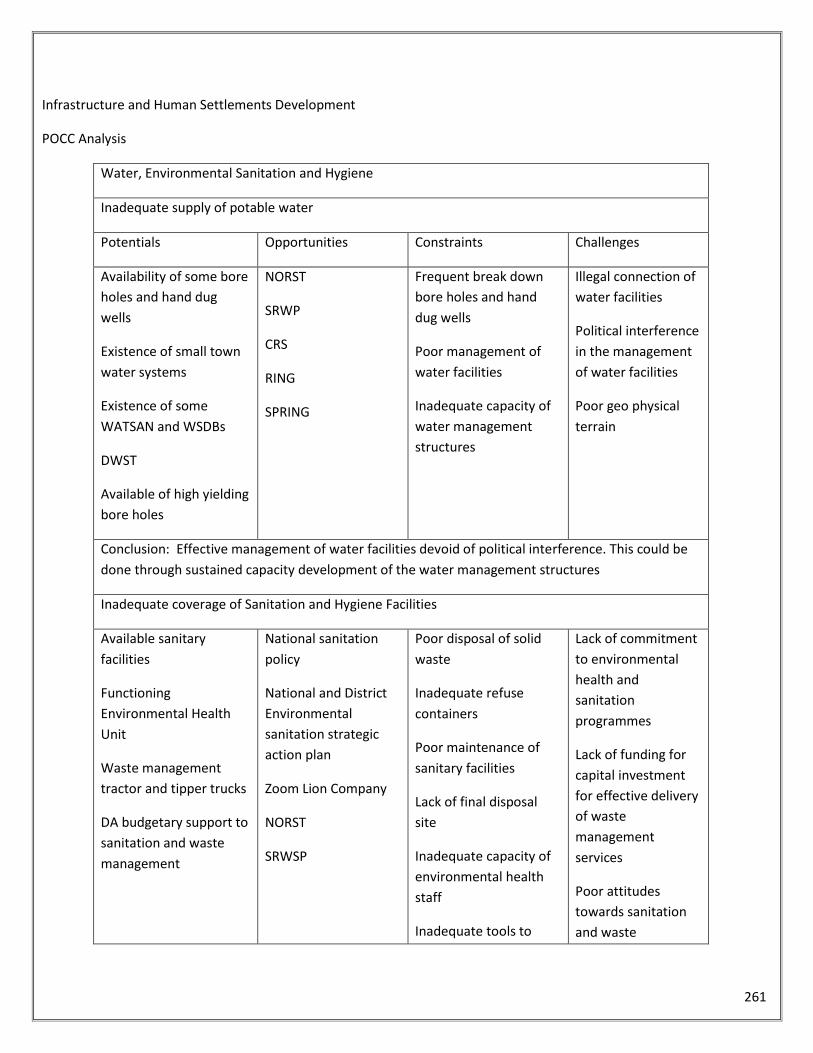
261
Infrastructure and Human Settlements Development
POCC Analysis
Water, Environmental Sanitation and Hygiene
Inadequate supply of potable water
Potentials Opportunities Constraints Challenges
Availability of some bore
holes and hand dug
wells
Existence of small town
water systems
Existence of some
WATSAN and WSDBs
DWST
Available of high yielding
bore holes
NORST
SRWP
CRS
RING
SPRING
Frequent break down
bore holes and hand
dug wells
Poor management of
water facilities
Inadequate capacity of
water management
structures
Illegal connection of
water facilities
Political interference
in the management
of water facilities
Poor geo physical
terrain
Conclusion: Effective management of water facilities devoid of political interference. This could be
done through sustained capacity development of the water management structures
Inadequate coverage of Sanitation and Hygiene Facilities
Available sanitary
facilities
Functioning
Environmental Health
Unit
Waste management
tractor and tipper trucks
DA budgetary support to
sanitation and waste
management
National sanitation
policy
National and District
Environmental
sanitation strategic
action plan
Zoom Lion Company
NORST
SRWSP
Poor disposal of solid
waste
Inadequate refuse
containers
Poor maintenance of
sanitary facilities
Lack of final disposal
site
Inadequate capacity of
environmental health
staff
Inadequate tools to
Lack of commitment
to environmental
health and
sanitation
programmes
Lack of funding for
capital investment
for effective delivery
of waste
management
services
Poor attitudes
towards sanitation
and waste
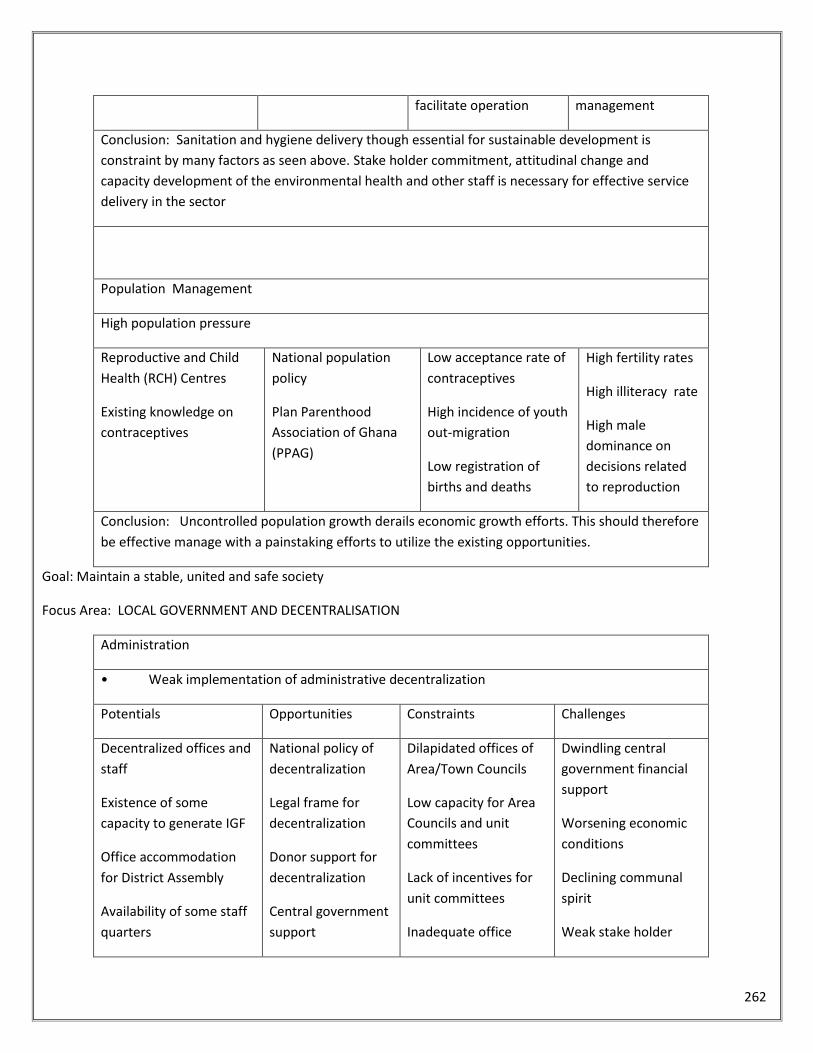
262
facilitate operation management
Conclusion: Sanitation and hygiene delivery though essential for sustainable development is
constraint by many factors as seen above. Stake holder commitment, attitudinal change and
capacity development of the environmental health and other staff is necessary for effective service
delivery in the sector
Population Management
High population pressure
Reproductive and Child
Health (RCH) Centres
Existing knowledge on
contraceptives
National population
policy
Plan Parenthood
Association of Ghana
(PPAG)
Low acceptance rate of
contraceptives
High incidence of youth
out-migration
Low registration of
births and deaths
High fertility rates
High illiteracy rate
High male
dominance on
decisions related
to reproduction
Conclusion: Uncontrolled population growth derails economic growth efforts. This should therefore
be effective manage with a painstaking efforts to utilize the existing opportunities.
Goal: Maintain a stable, united and safe society
Focus Area: LOCAL GOVERNMENT AND DECENTRALISATION
Administration
• Weak implementation of administrative decentralization
Potentials Opportunities Constraints Challenges
Decentralized offices and
staff
Existence of some
capacity to generate IGF
Office accommodation
for District Assembly
Availability of some staff
quarters
National policy of
decentralization
Legal frame for
decentralization
Donor support for
decentralization
Central government
support
Dilapidated offices of
Area/Town Councils
Low capacity for Area
Councils and unit
committees
Lack of incentives for
unit committees
Inadequate office
Dwindling central
government financial
support
Worsening economic
conditions
Declining communal
spirit
Weak stake holder
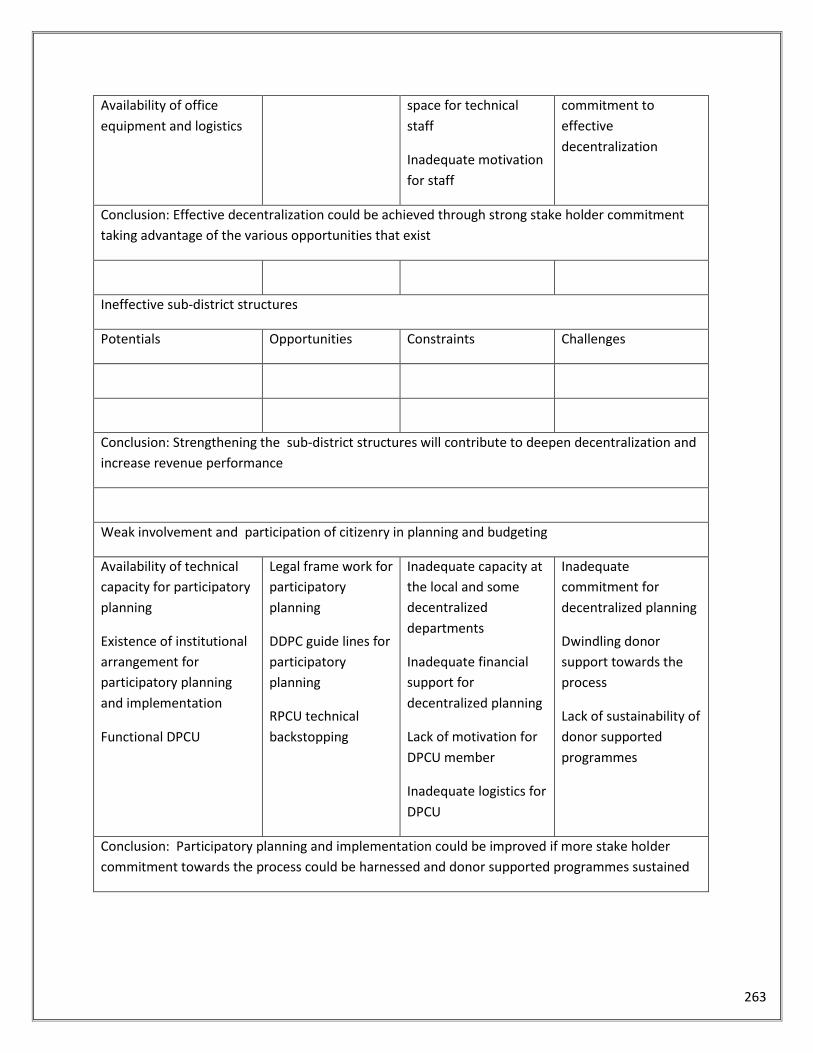
263
Availability of office
equipment and logistics
space for technical
staff
Inadequate motivation
for staff
commitment to
effective
decentralization
Conclusion: Effective decentralization could be achieved through strong stake holder commitment
taking advantage of the various opportunities that exist
Ineffective sub-district structures
Potentials Opportunities Constraints Challenges
Conclusion: Strengthening the sub-district structures will contribute to deepen decentralization and
increase revenue performance
Weak involvement and participation of citizenry in planning and budgeting
Availability of technical
capacity for participatory
planning
Existence of institutional
arrangement for
participatory planning
and implementation
Functional DPCU
Legal frame work for
participatory
planning
DDPC guide lines for
participatory
planning
RPCU technical
backstopping
Inadequate capacity at
the local and some
decentralized
departments
Inadequate financial
support for
decentralized planning
Lack of motivation for
DPCU member
Inadequate logistics for
DPCU
Inadequate
commitment for
decentralized planning
Dwindling donor
support towards the
process
Lack of sustainability of
donor supported
programmes
Conclusion: Participatory planning and implementation could be improved if more stake holder
commitment towards the process could be harnessed and donor supported programmes sustained
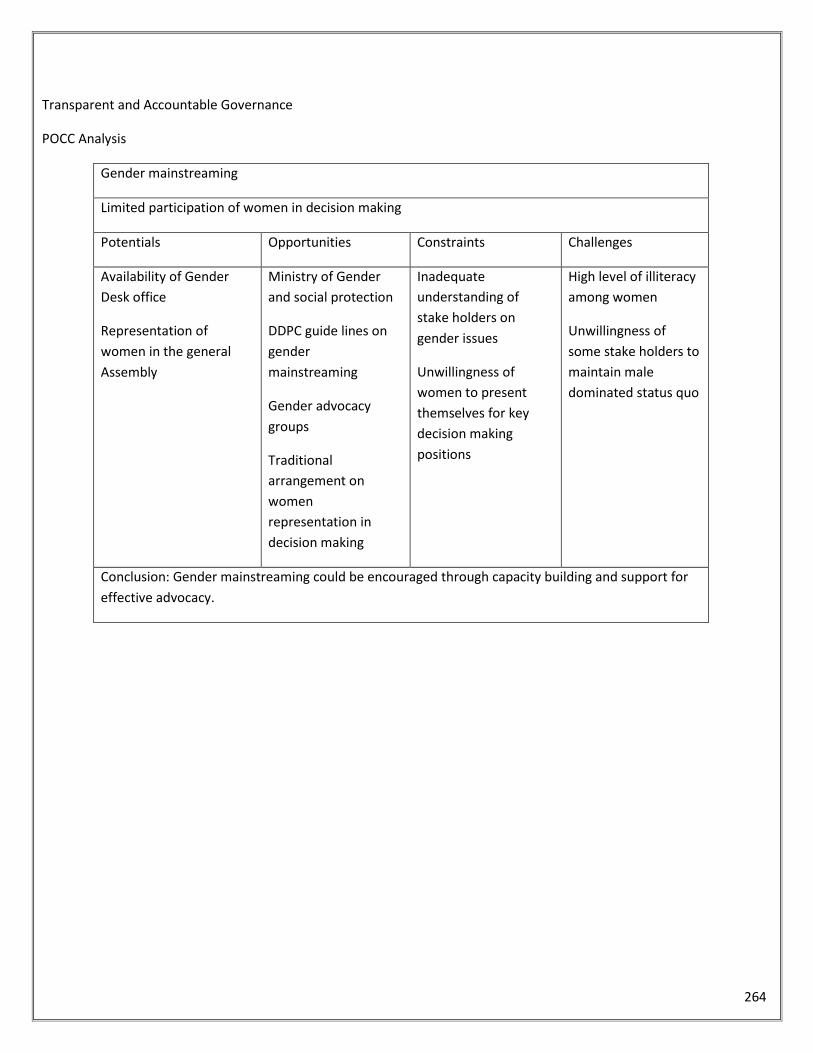
264
Transparent and Accountable Governance
POCC Analysis
Gender mainstreaming
Limited participation of women in decision making
Potentials Opportunities Constraints Challenges
Availability of Gender
Desk office
Representation of
women in the general
Assembly
Ministry of Gender
and social protection
DDPC guide lines on
gender
mainstreaming
Gender advocacy
groups
Traditional
arrangement on
women
representation in
decision making
Inadequate
understanding of
stake holders on
gender issues
Unwillingness of
women to present
themselves for key
decision making
positions
High level of illiteracy
among women
Unwillingness of
some stake holders to
maintain male
dominated status quo
Conclusion: Gender mainstreaming could be encouraged through capacity building and support for
effective advocacy.
265
CHAPTER THREE
3.0 DEVELOPMENT PROJECTIONS, ADOPTED GOALS, SUB-GOALS, OBJECTIVES AND
STRATEGIES This chapter provide information on Development projections of the 2018-2012 MTDP, Adopted Goals, and Objective as
well clearly define strategies to achieve the targeted goals and objectices
3.1 District Goal Kpandai District Assembly aims at improving the quality of life of the people through accelerated access to quality
education and health care delivery system, vigorous expansion of socio-economic infrastructure, improved agricultural
production, effective partnership between the private and public sectors as well as efficient management of the natural
resource base in the context of a sound and sustainable environmental management practices and within a broader
grassroots participation in decision making in the development process
3.2 District Sector Specific Goals In consonance with the district development goal and objectives, and to enhance implementation, monitoring and
evaluation of the planned activities, various sector goals, objectives and strategies were developed as follows:
3.2.1 Adopted Goal under Economic Development
Build a Prosperous Society
3.2.2 Adopted Goal under Social Development
Create opportunities for all
3.2.3 Adopted Goal under Environment, Infrastructure and Human Settlements Development
Safeguard the natural environment and ensure a resilient built environment
3.2.4 Adopted Goal under Governance, Corruption and Public Accountability
Maintain a stable, united and safe society
3.3 Development Projections In keeping with the district development priorities and the goal, projections have been made to serve as input into the
formulation of the sector goals, objectives and strategies to achieve the overall district goal.
The projections were made using the exponential model and taking into consideration assumptions in various sectors of
the district development. The development thresholds of the various sectors were also taken into consideration.
3.3.1 Population Projection
The population of the district was projected based on the following assumptions:
Current fertility rate averages
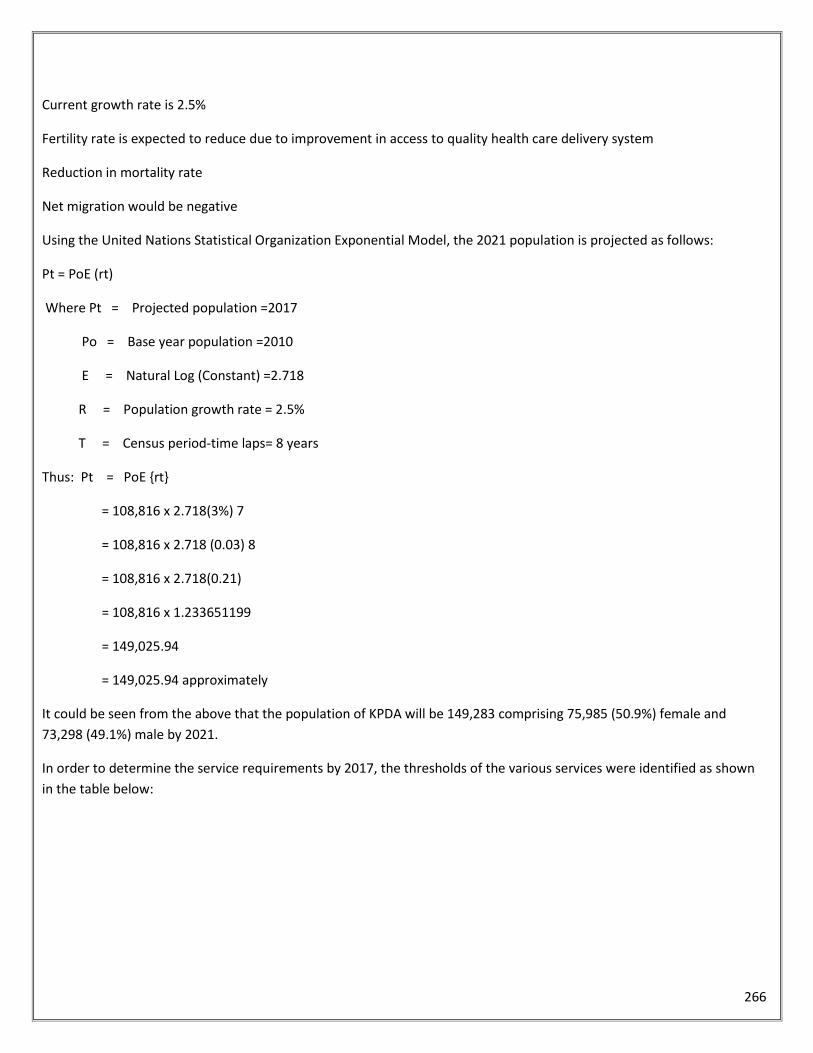
266
Current growth rate is 2.5%
Fertility rate is expected to reduce due to improvement in access to quality health care delivery system
Reduction in mortality rate
Net migration would be negative
Using the United Nations Statistical Organization Exponential Model, the 2021 population is projected as follows:
Pt = PoE (rt)
Where Pt = Projected population =2017
Po = Base year population =2010
E = Natural Log (Constant) =2.718
R = Population growth rate = 2.5%
T = Census period-time laps= 8 years
Thus: Pt = PoE {rt}
= 108,816 x 2.718(3%) 7
= 108,816 x 2.718 (0.03) 8
= 108,816 x 2.718(0.21)
= 108,816 x 1.233651199
= 149,025.94
= 149,025.94 approximately
It could be seen from the above that the population of KPDA will be 149,283 comprising 75,985 (50.9%) female and
73,298 (49.1%) male by 2021.
In order to determine the service requirements by 2017, the thresholds of the various services were identified as shown
in the table below:
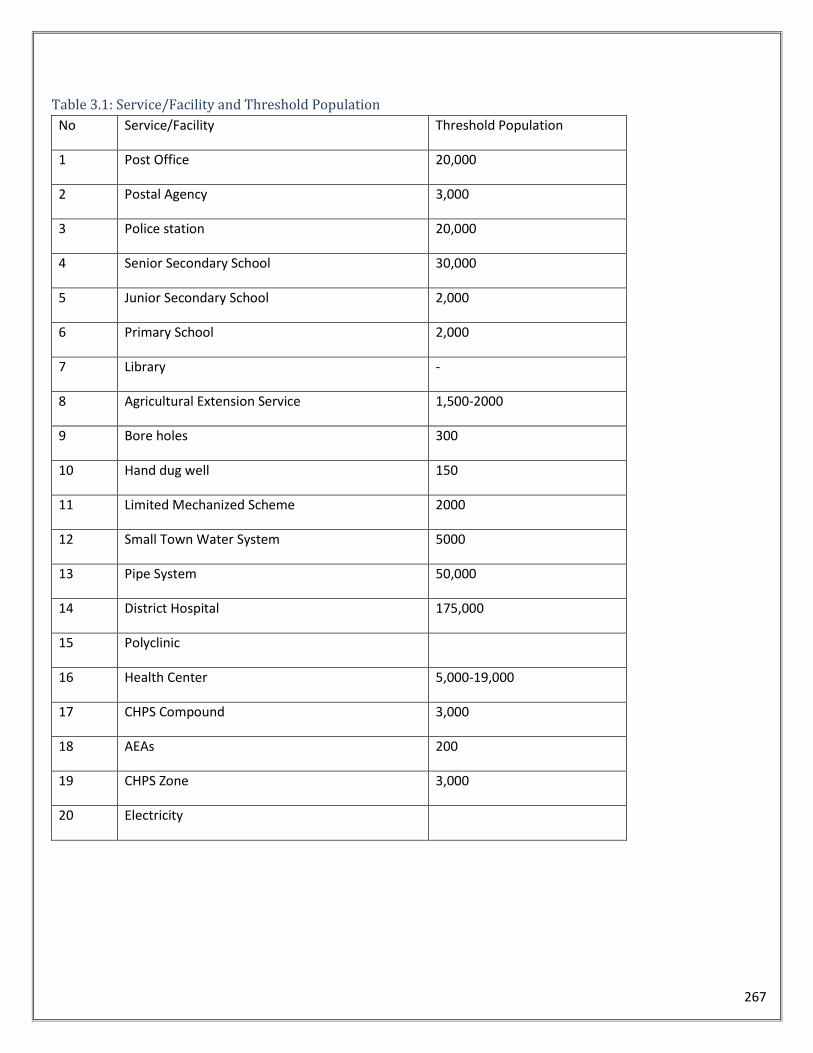
267
Table 3.1: Service/Facility and Threshold Population
No Service/Facility Threshold Population
1 Post Office 20,000
2 Postal Agency 3,000
3 Police station 20,000
4 Senior Secondary School 30,000
5 Junior Secondary School 2,000
6 Primary School 2,000
7 Library -
8 Agricultural Extension Service 1,500-2000
9 Bore holes 300
10 Hand dug well 150
11 Limited Mechanized Scheme 2000
12 Small Town Water System 5000
13 Pipe System 50,000
14 District Hospital 175,000
15 Polyclinic
16 Health Center 5,000-19,000
17 CHPS Compound 3,000
18 AEAs 200
19 CHPS Zone 3,000
20 Electricity
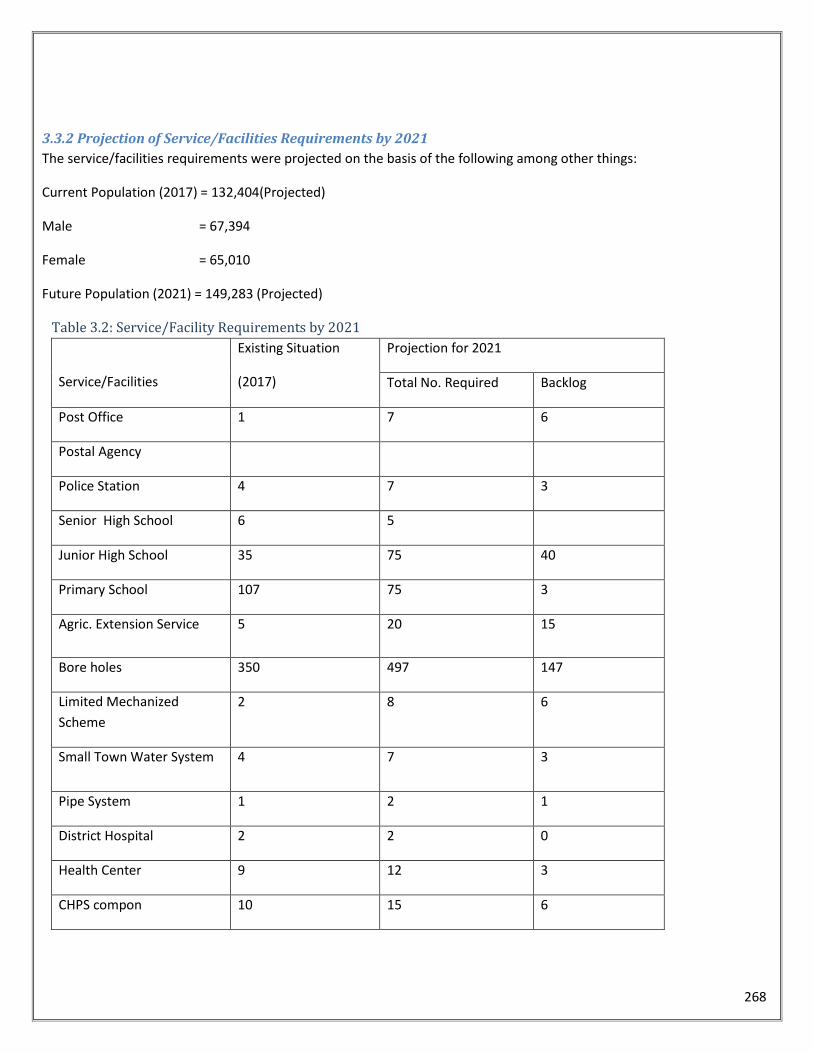
268
3.3.2 Projection of Service/Facilities Requirements by 2021
The service/facilities requirements were projected on the basis of the following among other things:
Current Population (2017) = 132,404(Projected)
Male = 67,394
Female = 65,010
Future Population (2021) = 149,283 (Projected)
Table 3.2: Service/Facility Requirements by 2021
Service/Facilities
Existing Situation
(2017)
Projection for 2021
Total No. Required Backlog
Post Office 1 7 6
Postal Agency
Police Station 4 7 3
Senior High School 6 5
Junior High School 35 75 40
Primary School 107 75 3
Agric. Extension Service 5 20 15
Bore holes 350 497 147
Limited Mechanized
Scheme
2 8 6
Small Town Water System 4 7 3
Pipe System 1 2 1
District Hospital 2 2 0
Health Center 9 12 3
CHPS compon 10 15 6
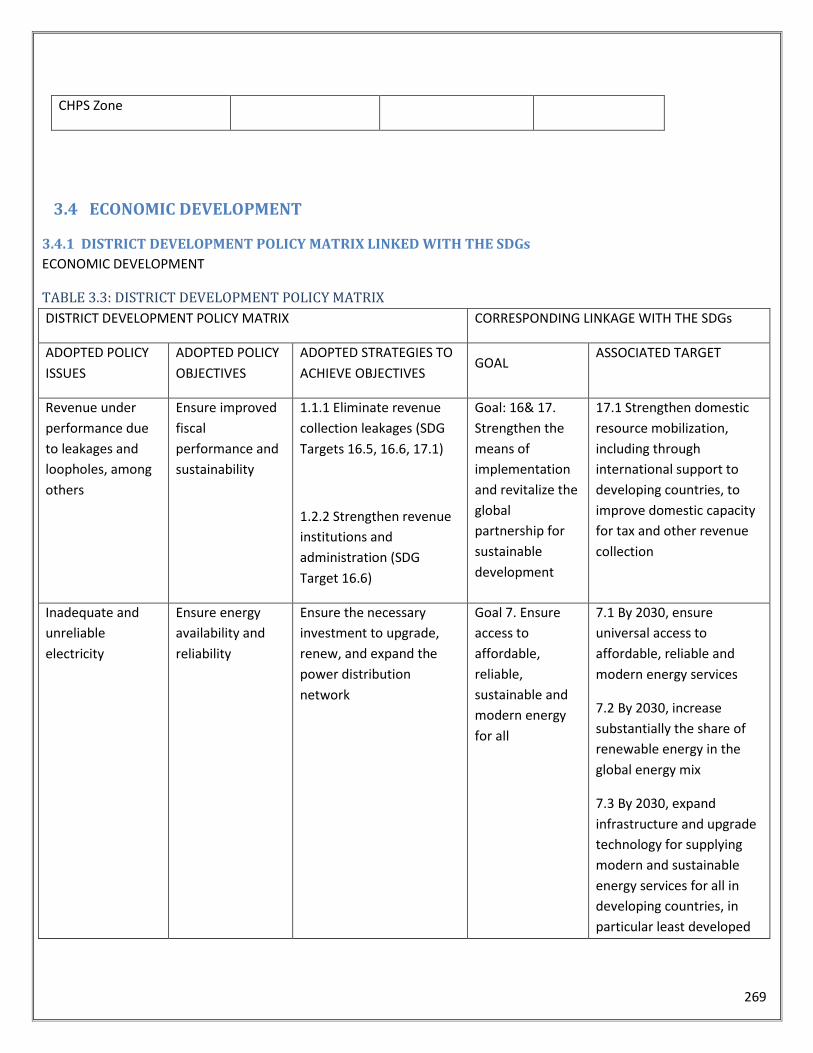
269
CHPS Zone
3.4 ECONOMIC DEVELOPMENT
3.4.1 DISTRICT DEVELOPMENT POLICY MATRIX LINKED WITH THE SDGs
ECONOMIC DEVELOPMENT
TABLE 3.3: DISTRICT DEVELOPMENT POLICY MATRIX
DISTRICT DEVELOPMENT POLICY MATRIX CORRESPONDING LINKAGE WITH THE SDGs
ADOPTED POLICY
ISSUES
ADOPTED POLICY
OBJECTIVES
ADOPTED STRATEGIES TO
ACHIEVE OBJECTIVES GOAL
ASSOCIATED TARGET
Revenue under
performance due
to leakages and
loopholes, among
others
Ensure improved
fiscal
performance and
sustainability
1.1.1 Eliminate revenue
collection leakages (SDG
Targets 16.5, 16.6, 17.1)
1.2.2 Strengthen revenue
institutions and
administration (SDG
Target 16.6)
Goal: 16& 17.
Strengthen the
means of
implementation
and revitalize the
global
partnership for
sustainable
development
17.1 Strengthen domestic
resource mobilization,
including through
international support to
developing countries, to
improve domestic capacity
for tax and other revenue
collection
Inadequate and
unreliable
electricity
Ensure energy
availability and
reliability
Ensure the necessary
investment to upgrade,
renew, and expand the
power distribution
network
Goal 7. Ensure
access to
affordable,
reliable,
sustainable and
modern energy
for all
7.1 By 2030, ensure
universal access to
affordable, reliable and
modern energy services
7.2 By 2030, increase
substantially the share of
renewable energy in the
global energy mix
7.3 By 2030, expand
infrastructure and upgrade
technology for supplying
modern and sustainable
energy services for all in
developing countries, in
particular least developed
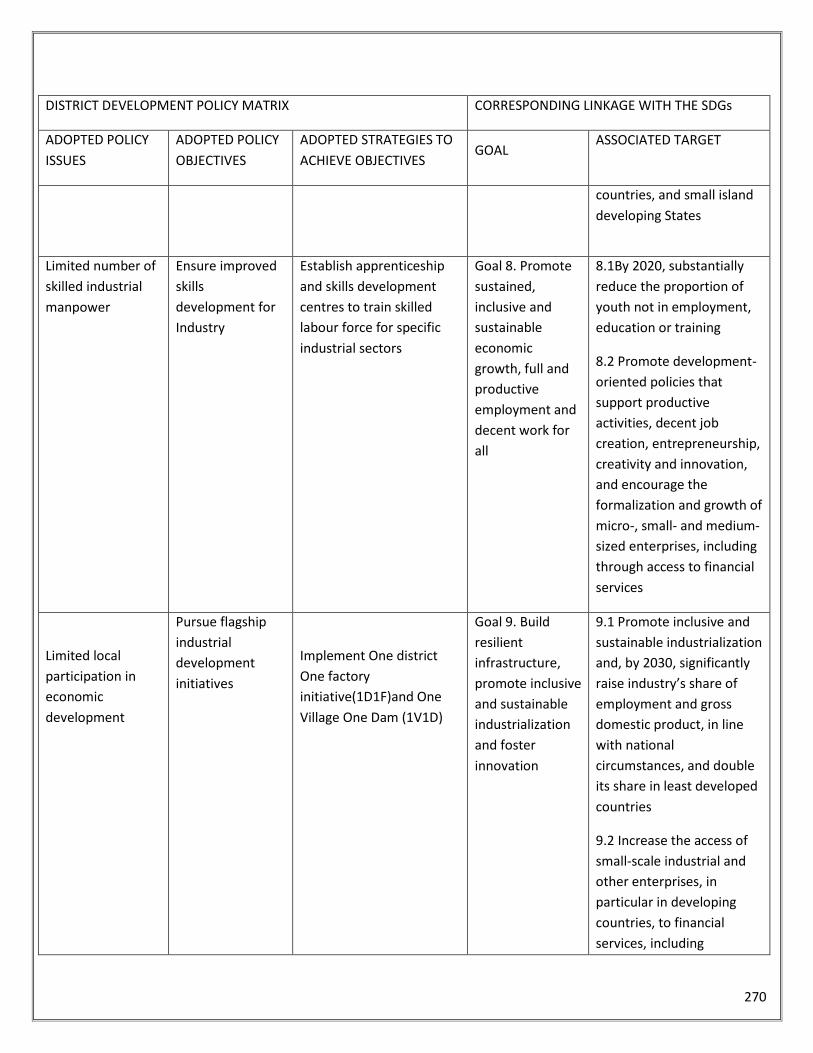
270
DISTRICT DEVELOPMENT POLICY MATRIX CORRESPONDING LINKAGE WITH THE SDGs
ADOPTED POLICY
ISSUES
ADOPTED POLICY
OBJECTIVES
ADOPTED STRATEGIES TO
ACHIEVE OBJECTIVES GOAL
ASSOCIATED TARGET
countries, and small island
developing States
Limited number of
skilled industrial
manpower
Ensure improved
skills
development for
Industry
Establish apprenticeship
and skills development
centres to train skilled
labour force for specific
industrial sectors
Goal 8. Promote
sustained,
inclusive and
sustainable
economic
growth, full and
productive
employment and
decent work for
all
8.1By 2020, substantially
reduce the proportion of
youth not in employment,
education or training
8.2 Promote development-
oriented policies that
support productive
activities, decent job
creation, entrepreneurship,
creativity and innovation,
and encourage the
formalization and growth of
micro-, small- and medium-
sized enterprises, including
through access to financial
services
Limited local
participation in
economic
development
Pursue flagship
industrial
development
initiatives
Implement One district
One factory
initiative(1D1F)and One
Village One Dam (1V1D)
Goal 9. Build
resilient
infrastructure,
promote inclusive
and sustainable
industrialization
and foster
innovation
9.1 Promote inclusive and
sustainable industrialization
and, by 2030, significantly
raise industry’s share of
employment and gross
domestic product, in line
with national
circumstances, and double
its share in least developed
countries
9.2 Increase the access of
small-scale industrial and
other enterprises, in
particular in developing
countries, to financial
services, including
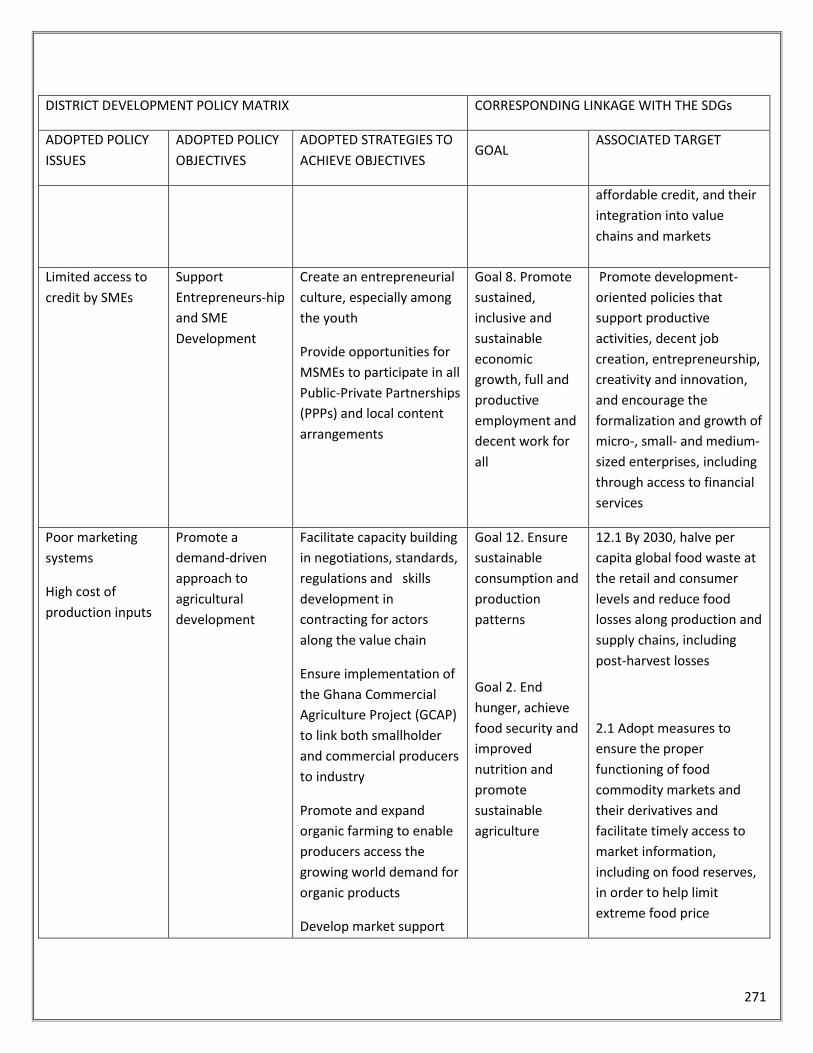
271
DISTRICT DEVELOPMENT POLICY MATRIX CORRESPONDING LINKAGE WITH THE SDGs
ADOPTED POLICY
ISSUES
ADOPTED POLICY
OBJECTIVES
ADOPTED STRATEGIES TO
ACHIEVE OBJECTIVES GOAL
ASSOCIATED TARGET
affordable credit, and their
integration into value
chains and markets
Limited access to
credit by SMEs
Support
Entrepreneurs-hip
and SME
Development
Create an entrepreneurial
culture, especially among
the youth
Provide opportunities for
MSMEs to participate in all
Public-Private Partnerships
(PPPs) and local content
arrangements
Goal 8. Promote
sustained,
inclusive and
sustainable
economic
growth, full and
productive
employment and
decent work for
all
Promote development-
oriented policies that
support productive
activities, decent job
creation, entrepreneurship,
creativity and innovation,
and encourage the
formalization and growth of
micro-, small- and medium-
sized enterprises, including
through access to financial
services
Poor marketing
systems
High cost of
production inputs
Promote a
demand-driven
approach to
agricultural
development
Facilitate capacity building
in negotiations, standards,
regulations and skills
development in
contracting for actors
along the value chain
Ensure implementation of
the Ghana Commercial
Agriculture Project (GCAP)
to link both smallholder
and commercial producers
to industry
Promote and expand
organic farming to enable
producers access the
growing world demand for
organic products
Develop market support
Goal 12. Ensure
sustainable
consumption and
production
patterns
Goal 2. End
hunger, achieve
food security and
improved
nutrition and
promote
sustainable
agriculture
12.1 By 2030, halve per
capita global food waste at
the retail and consumer
levels and reduce food
losses along production and
supply chains, including
post-harvest losses
2.1 Adopt measures to
ensure the proper
functioning of food
commodity markets and
their derivatives and
facilitate timely access to
market information,
including on food reserves,
in order to help limit
extreme food price
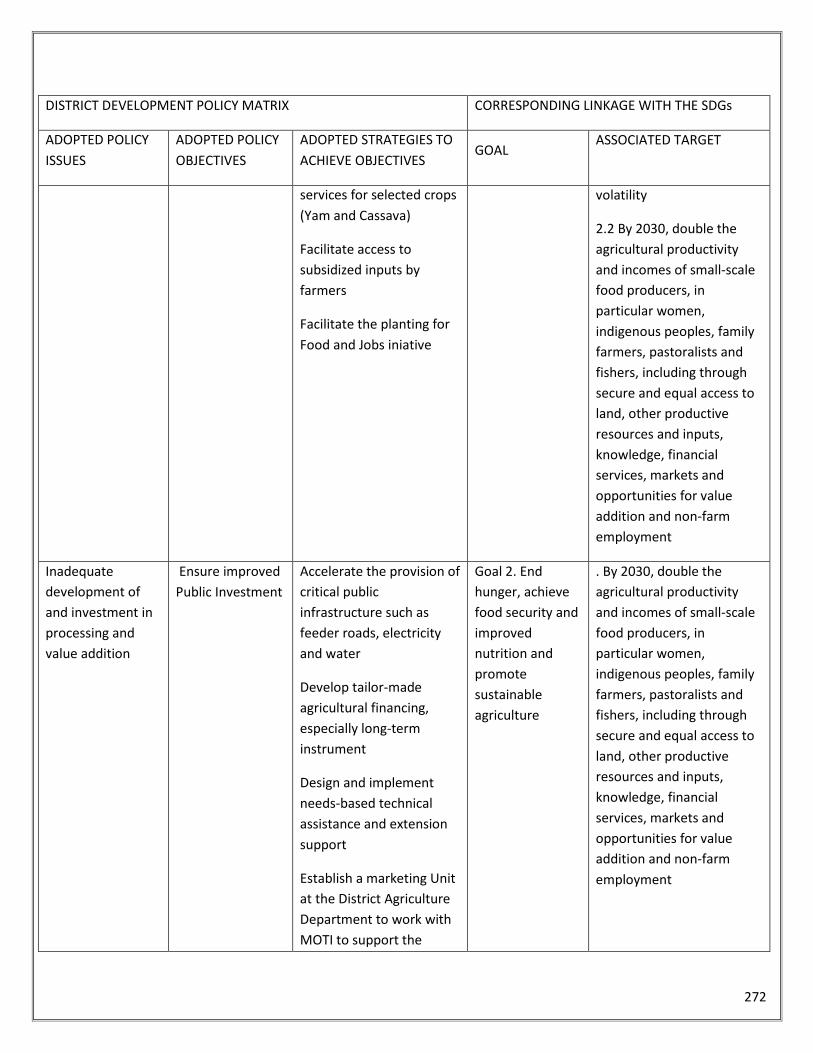
272
DISTRICT DEVELOPMENT POLICY MATRIX CORRESPONDING LINKAGE WITH THE SDGs
ADOPTED POLICY
ISSUES
ADOPTED POLICY
OBJECTIVES
ADOPTED STRATEGIES TO
ACHIEVE OBJECTIVES GOAL
ASSOCIATED TARGET
services for selected crops
(Yam and Cassava)
Facilitate access to
subsidized inputs by
farmers
Facilitate the planting for
Food and Jobs iniative
volatility
2.2 By 2030, double the
agricultural productivity
and incomes of small-scale
food producers, in
particular women,
indigenous peoples, family
farmers, pastoralists and
fishers, including through
secure and equal access to
land, other productive
resources and inputs,
knowledge, financial
services, markets and
opportunities for value
addition and non-farm
employment
Inadequate
development of
and investment in
processing and
value addition
Ensure improved
Public Investment
Accelerate the provision of
critical public
infrastructure such as
feeder roads, electricity
and water
Develop tailor-made
agricultural financing,
especially long-term
instrument
Design and implement
needs-based technical
assistance and extension
support
Establish a marketing Unit
at the District Agriculture
Department to work with
MOTI to support the
Goal 2. End
hunger, achieve
food security and
improved
nutrition and
promote
sustainable
agriculture
. By 2030, double the
agricultural productivity
and incomes of small-scale
food producers, in
particular women,
indigenous peoples, family
farmers, pastoralists and
fishers, including through
secure and equal access to
land, other productive
resources and inputs,
knowledge, financial
services, markets and
opportunities for value
addition and non-farm
employment
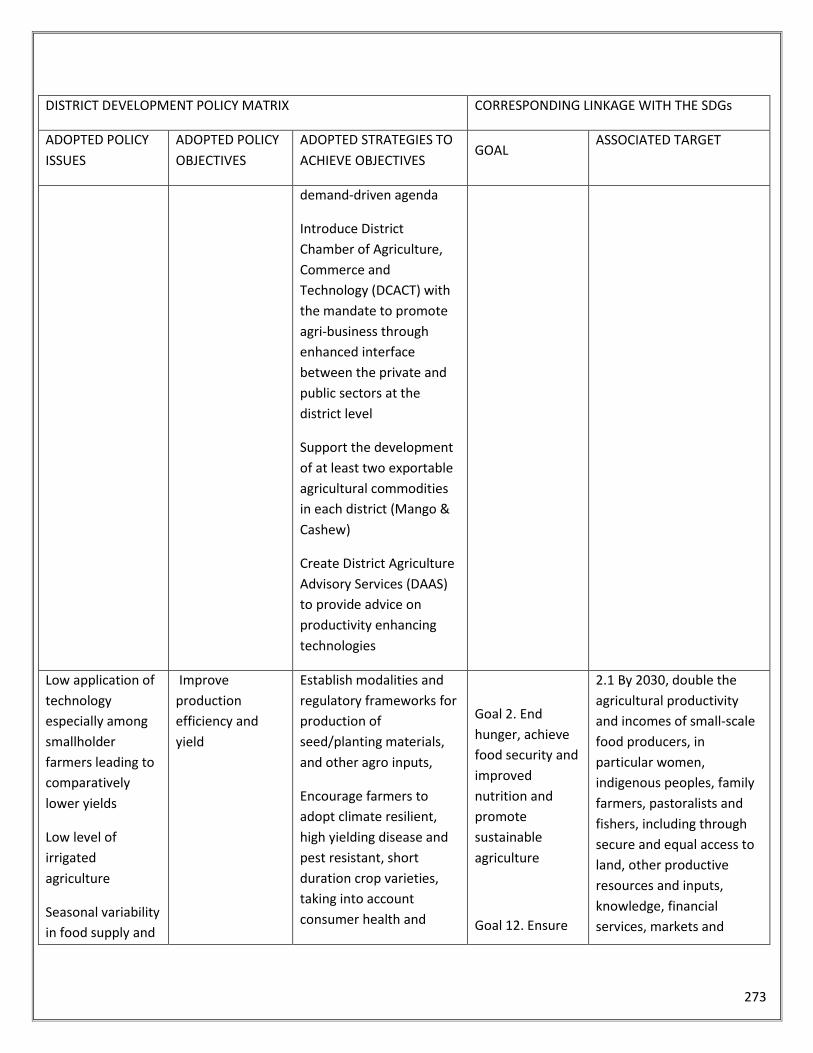
273
DISTRICT DEVELOPMENT POLICY MATRIX CORRESPONDING LINKAGE WITH THE SDGs
ADOPTED POLICY
ISSUES
ADOPTED POLICY
OBJECTIVES
ADOPTED STRATEGIES TO
ACHIEVE OBJECTIVES GOAL
ASSOCIATED TARGET
demand-driven agenda
Introduce District
Chamber of Agriculture,
Commerce and
Technology (DCACT) with
the mandate to promote
agri-business through
enhanced interface
between the private and
public sectors at the
district level
Support the development
of at least two exportable
agricultural commodities
in each district (Mango &
Cashew)
Create District Agriculture
Advisory Services (DAAS)
to provide advice on
productivity enhancing
technologies
Low application of
technology
especially among
smallholder
farmers leading to
comparatively
lower yields
Low level of
irrigated
agriculture
Seasonal variability
in food supply and
Improve
production
efficiency and
yield
Establish modalities and
regulatory frameworks for
production of
seed/planting materials,
and other agro inputs,
Encourage farmers to
adopt climate resilient,
high yielding disease and
pest resistant, short
duration crop varieties,
taking into account
consumer health and
Goal 2. End
hunger, achieve
food security and
improved
nutrition and
promote
sustainable
agriculture
Goal 12. Ensure
2.1 By 2030, double the
agricultural productivity
and incomes of small-scale
food producers, in
particular women,
indigenous peoples, family
farmers, pastoralists and
fishers, including through
secure and equal access to
land, other productive
resources and inputs,
knowledge, financial
services, markets and
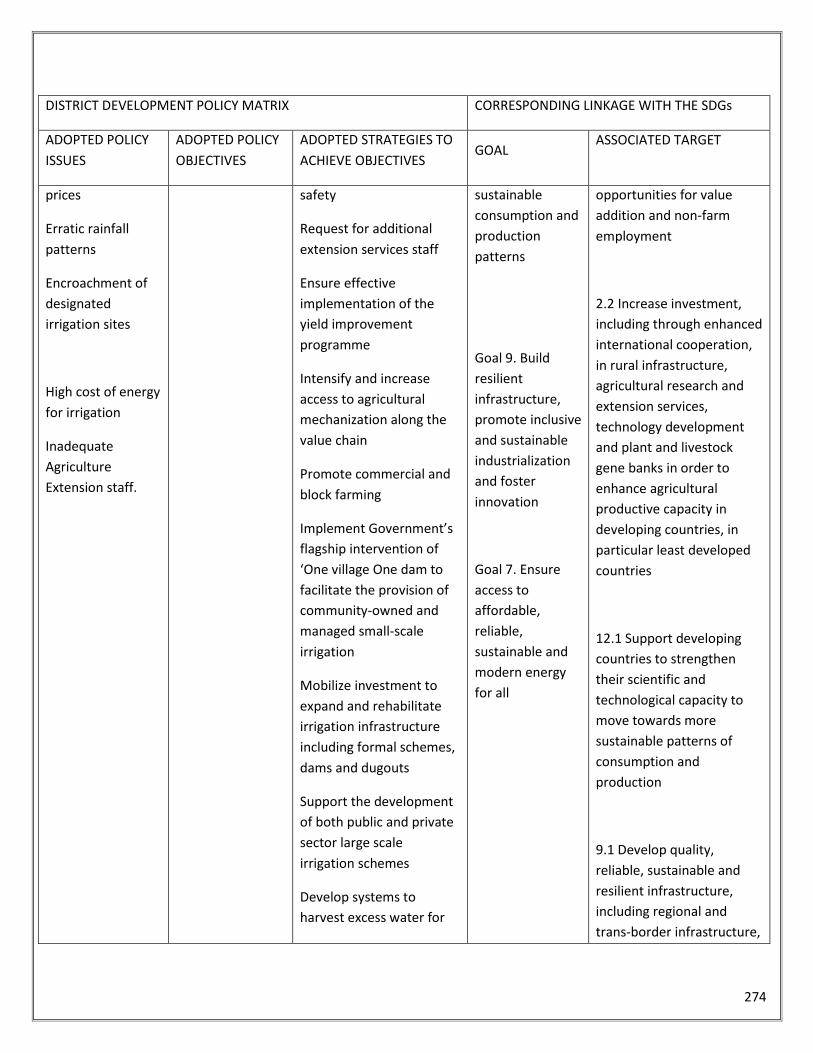
274
DISTRICT DEVELOPMENT POLICY MATRIX CORRESPONDING LINKAGE WITH THE SDGs
ADOPTED POLICY
ISSUES
ADOPTED POLICY
OBJECTIVES
ADOPTED STRATEGIES TO
ACHIEVE OBJECTIVES GOAL
ASSOCIATED TARGET
prices
Erratic rainfall
patterns
Encroachment of
designated
irrigation sites
High cost of energy
for irrigation
Inadequate
Agriculture
Extension staff.
safety
Request for additional
extension services staff
Ensure effective
implementation of the
yield improvement
programme
Intensify and increase
access to agricultural
mechanization along the
value chain
Promote commercial and
block farming
Implement Government’s
flagship intervention of
‘One village One dam to
facilitate the provision of
community-owned and
managed small-scale
irrigation
Mobilize investment to
expand and rehabilitate
irrigation infrastructure
including formal schemes,
dams and dugouts
Support the development
of both public and private
sector large scale
irrigation schemes
Develop systems to
harvest excess water for
sustainable
consumption and
production
patterns
Goal 9. Build
resilient
infrastructure,
promote inclusive
and sustainable
industrialization
and foster
innovation
Goal 7. Ensure
access to
affordable,
reliable,
sustainable and
modern energy
for all
opportunities for value
addition and non-farm
employment
2.2 Increase investment,
including through enhanced
international cooperation,
in rural infrastructure,
agricultural research and
extension services,
technology development
and plant and livestock
gene banks in order to
enhance agricultural
productive capacity in
developing countries, in
particular least developed
countries
12.1 Support developing
countries to strengthen
their scientific and
technological capacity to
move towards more
sustainable patterns of
consumption and
production
9.1 Develop quality,
reliable, sustainable and
resilient infrastructure,
including regional and
trans-border infrastructure,
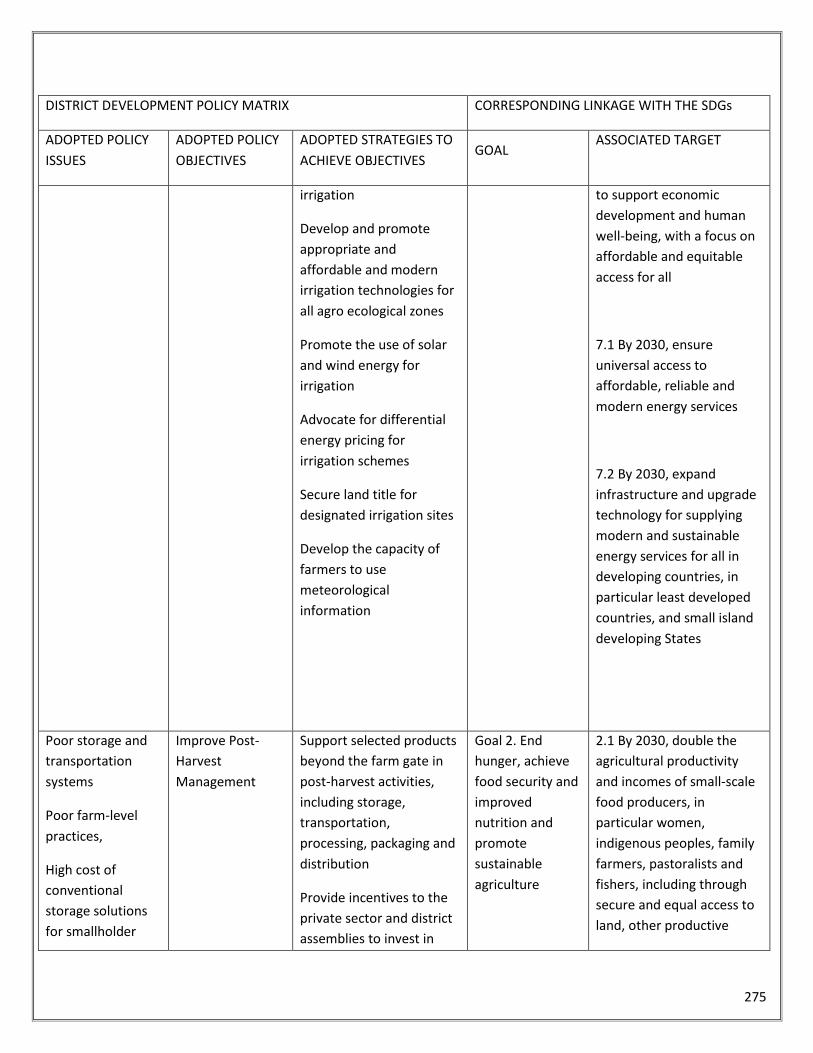
275
DISTRICT DEVELOPMENT POLICY MATRIX CORRESPONDING LINKAGE WITH THE SDGs
ADOPTED POLICY
ISSUES
ADOPTED POLICY
OBJECTIVES
ADOPTED STRATEGIES TO
ACHIEVE OBJECTIVES GOAL
ASSOCIATED TARGET
irrigation
Develop and promote
appropriate and
affordable and modern
irrigation technologies for
all agro ecological zones
Promote the use of solar
and wind energy for
irrigation
Advocate for differential
energy pricing for
irrigation schemes
Secure land title for
designated irrigation sites
Develop the capacity of
farmers to use
meteorological
information
to support economic
development and human
well-being, with a focus on
affordable and equitable
access for all
7.1 By 2030, ensure
universal access to
affordable, reliable and
modern energy services
7.2 By 2030, expand
infrastructure and upgrade
technology for supplying
modern and sustainable
energy services for all in
developing countries, in
particular least developed
countries, and small island
developing States
Poor storage and
transportation
systems
Poor farm-level
practices,
High cost of
conventional
storage solutions
for smallholder
Improve Post-
Harvest
Management
Support selected products
beyond the farm gate in
post-harvest activities,
including storage,
transportation,
processing, packaging and
distribution
Provide incentives to the
private sector and district
assemblies to invest in
Goal 2. End
hunger, achieve
food security and
improved
nutrition and
promote
sustainable
agriculture
2.1 By 2030, double the
agricultural productivity
and incomes of small-scale
food producers, in
particular women,
indigenous peoples, family
farmers, pastoralists and
fishers, including through
secure and equal access to
land, other productive
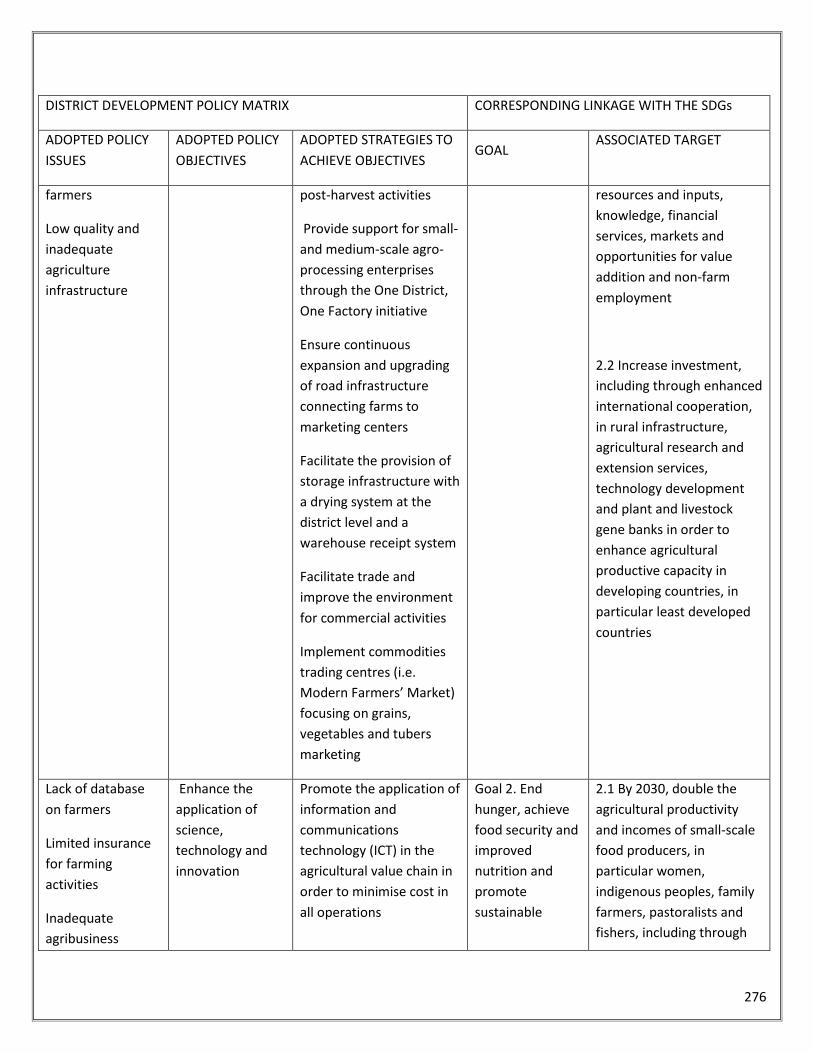
276
DISTRICT DEVELOPMENT POLICY MATRIX CORRESPONDING LINKAGE WITH THE SDGs
ADOPTED POLICY
ISSUES
ADOPTED POLICY
OBJECTIVES
ADOPTED STRATEGIES TO
ACHIEVE OBJECTIVES GOAL
ASSOCIATED TARGET
farmers
Low quality and
inadequate
agriculture
infrastructure
post-harvest activities
Provide support for small-
and medium-scale agro-
processing enterprises
through the One District,
One Factory initiative
Ensure continuous
expansion and upgrading
of road infrastructure
connecting farms to
marketing centers
Facilitate the provision of
storage infrastructure with
a drying system at the
district level and a
warehouse receipt system
Facilitate trade and
improve the environment
for commercial activities
Implement commodities
trading centres (i.e.
Modern Farmers’ Market)
focusing on grains,
vegetables and tubers
marketing
resources and inputs,
knowledge, financial
services, markets and
opportunities for value
addition and non-farm
employment
2.2 Increase investment,
including through enhanced
international cooperation,
in rural infrastructure,
agricultural research and
extension services,
technology development
and plant and livestock
gene banks in order to
enhance agricultural
productive capacity in
developing countries, in
particular least developed
countries
Lack of database
on farmers
Limited insurance
for farming
activities
Inadequate
agribusiness
Enhance the
application of
science,
technology and
innovation
Promote the application of
information and
communications
technology (ICT) in the
agricultural value chain in
order to minimise cost in
all operations
Goal 2. End
hunger, achieve
food security and
improved
nutrition and
promote
sustainable
2.1 By 2030, double the
agricultural productivity
and incomes of small-scale
food producers, in
particular women,
indigenous peoples, family
farmers, pastoralists and
fishers, including through
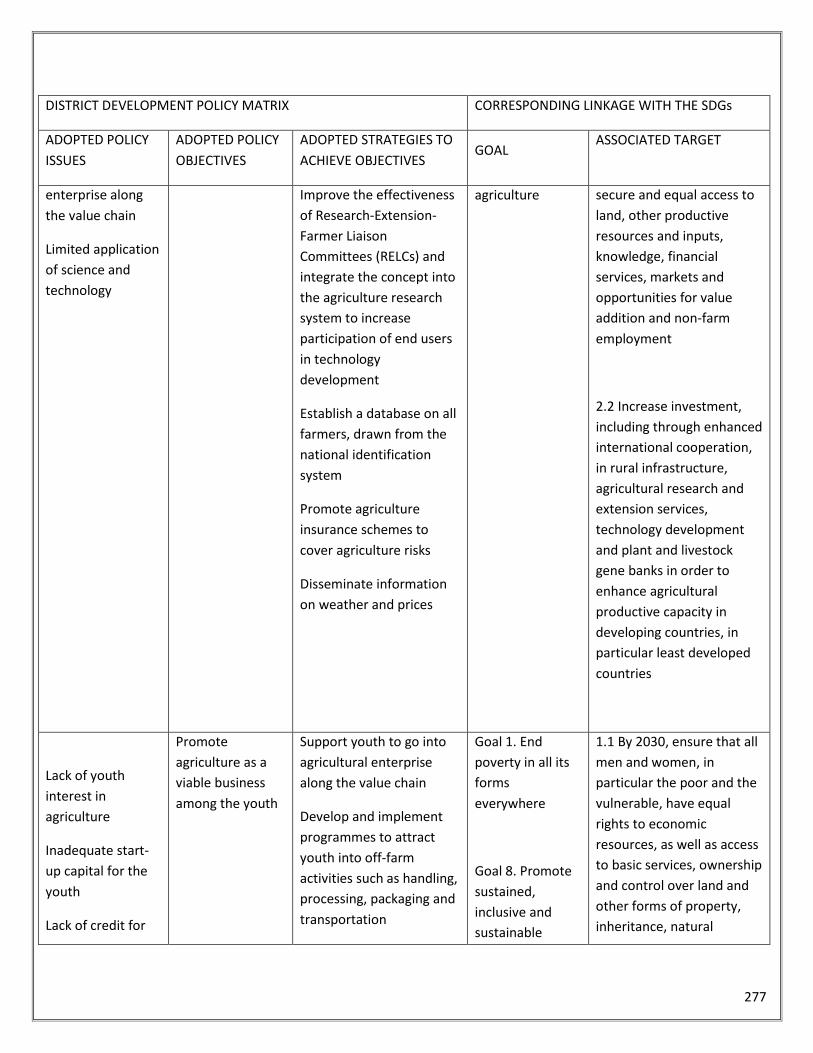
277
DISTRICT DEVELOPMENT POLICY MATRIX CORRESPONDING LINKAGE WITH THE SDGs
ADOPTED POLICY
ISSUES
ADOPTED POLICY
OBJECTIVES
ADOPTED STRATEGIES TO
ACHIEVE OBJECTIVES GOAL
ASSOCIATED TARGET
enterprise along
the value chain
Limited application
of science and
technology
Improve the effectiveness
of Research-Extension-
Farmer Liaison
Committees (RELCs) and
integrate the concept into
the agriculture research
system to increase
participation of end users
in technology
development
Establish a database on all
farmers, drawn from the
national identification
system
Promote agriculture
insurance schemes to
cover agriculture risks
Disseminate information
on weather and prices
agriculture secure and equal access to
land, other productive
resources and inputs,
knowledge, financial
services, markets and
opportunities for value
addition and non-farm
employment
2.2 Increase investment,
including through enhanced
international cooperation,
in rural infrastructure,
agricultural research and
extension services,
technology development
and plant and livestock
gene banks in order to
enhance agricultural
productive capacity in
developing countries, in
particular least developed
countries
Lack of youth
interest in
agriculture
Inadequate start-
up capital for the
youth
Lack of credit for
Promote
agriculture as a
viable business
among the youth
Support youth to go into
agricultural enterprise
along the value chain
Develop and implement
programmes to attract
youth into off-farm
activities such as handling,
processing, packaging and
transportation
Goal 1. End
poverty in all its
forms
everywhere
Goal 8. Promote
sustained,
inclusive and
sustainable
1.1 By 2030, ensure that all
men and women, in
particular the poor and the
vulnerable, have equal
rights to economic
resources, as well as access
to basic services, ownership
and control over land and
other forms of property,
inheritance, natural
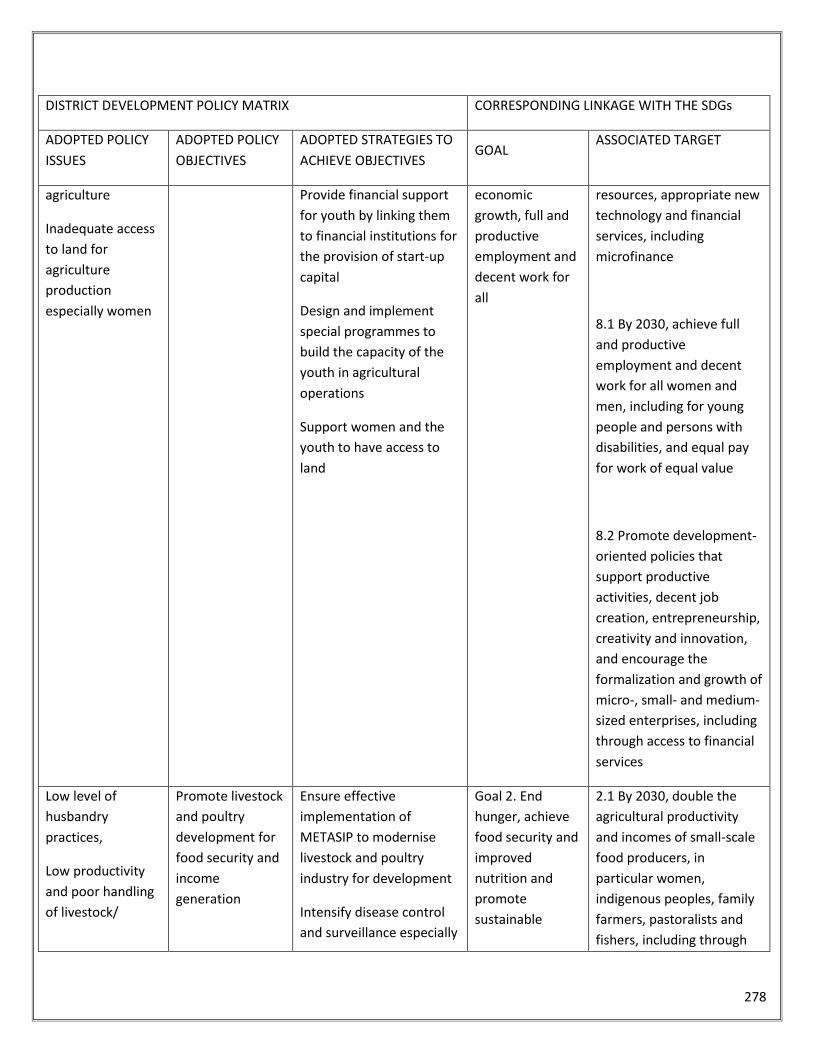
278
DISTRICT DEVELOPMENT POLICY MATRIX CORRESPONDING LINKAGE WITH THE SDGs
ADOPTED POLICY
ISSUES
ADOPTED POLICY
OBJECTIVES
ADOPTED STRATEGIES TO
ACHIEVE OBJECTIVES GOAL
ASSOCIATED TARGET
agriculture
Inadequate access
to land for
agriculture
production
especially women
Provide financial support
for youth by linking them
to financial institutions for
the provision of start-up
capital
Design and implement
special programmes to
build the capacity of the
youth in agricultural
operations
Support women and the
youth to have access to
land
economic
growth, full and
productive
employment and
decent work for
all
resources, appropriate new
technology and financial
services, including
microfinance
8.1 By 2030, achieve full
and productive
employment and decent
work for all women and
men, including for young
people and persons with
disabilities, and equal pay
for work of equal value
8.2 Promote development-
oriented policies that
support productive
activities, decent job
creation, entrepreneurship,
creativity and innovation,
and encourage the
formalization and growth of
micro-, small- and medium-
sized enterprises, including
through access to financial
services
Low level of
husbandry
practices,
Low productivity
and poor handling
of livestock/
Promote livestock
and poultry
development for
food security and
income
generation
Ensure effective
implementation of
METASIP to modernise
livestock and poultry
industry for development
Intensify disease control
and surveillance especially
Goal 2. End
hunger, achieve
food security and
improved
nutrition and
promote
sustainable
2.1 By 2030, double the
agricultural productivity
and incomes of small-scale
food producers, in
particular women,
indigenous peoples, family
farmers, pastoralists and
fishers, including through
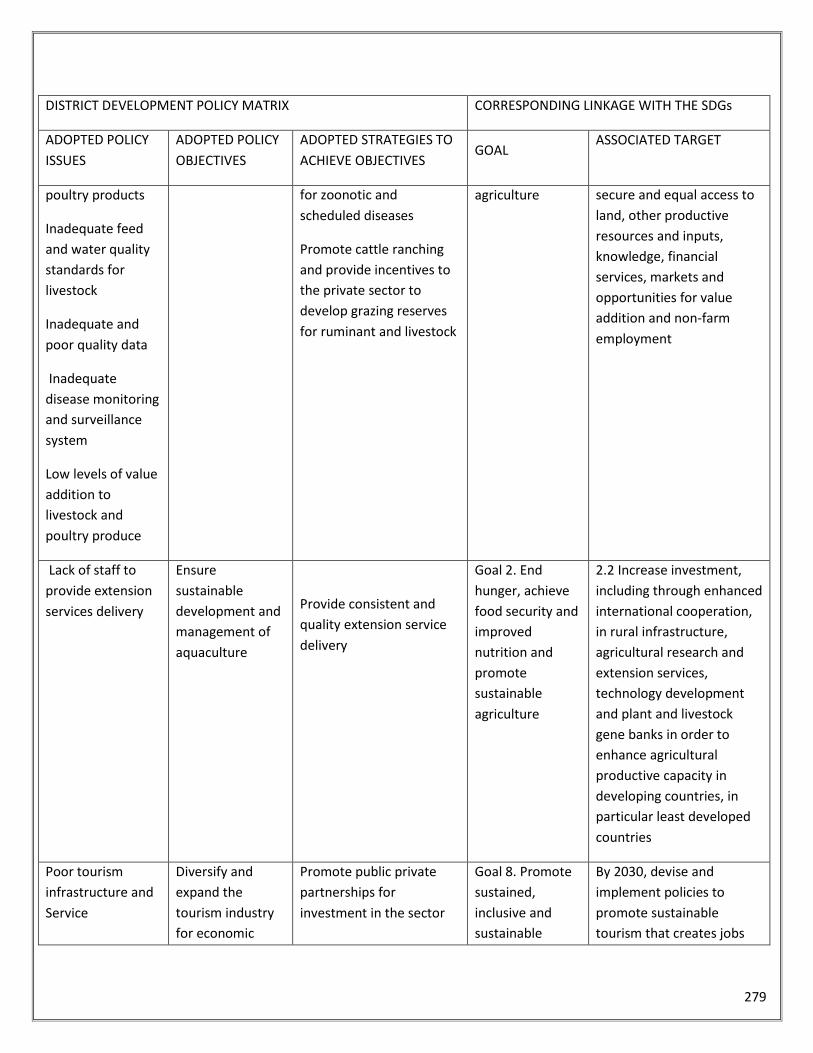
279
DISTRICT DEVELOPMENT POLICY MATRIX CORRESPONDING LINKAGE WITH THE SDGs
ADOPTED POLICY
ISSUES
ADOPTED POLICY
OBJECTIVES
ADOPTED STRATEGIES TO
ACHIEVE OBJECTIVES GOAL
ASSOCIATED TARGET
poultry products
Inadequate feed
and water quality
standards for
livestock
Inadequate and
poor quality data
Inadequate
disease monitoring
and surveillance
system
Low levels of value
addition to
livestock and
poultry produce
for zoonotic and
scheduled diseases
Promote cattle ranching
and provide incentives to
the private sector to
develop grazing reserves
for ruminant and livestock
agriculture secure and equal access to
land, other productive
resources and inputs,
knowledge, financial
services, markets and
opportunities for value
addition and non-farm
employment
Lack of staff to
provide extension
services delivery
Ensure
sustainable
development and
management of
aquaculture
Provide consistent and
quality extension service
delivery
Goal 2. End
hunger, achieve
food security and
improved
nutrition and
promote
sustainable
agriculture
2.2 Increase investment,
including through enhanced
international cooperation,
in rural infrastructure,
agricultural research and
extension services,
technology development
and plant and livestock
gene banks in order to
enhance agricultural
productive capacity in
developing countries, in
particular least developed
countries
Poor tourism
infrastructure and
Service
Diversify and
expand the
tourism industry
for economic
Promote public private
partnerships for
investment in the sector
Goal 8. Promote
sustained,
inclusive and
sustainable
By 2030, devise and
implement policies to
promote sustainable
tourism that creates jobs
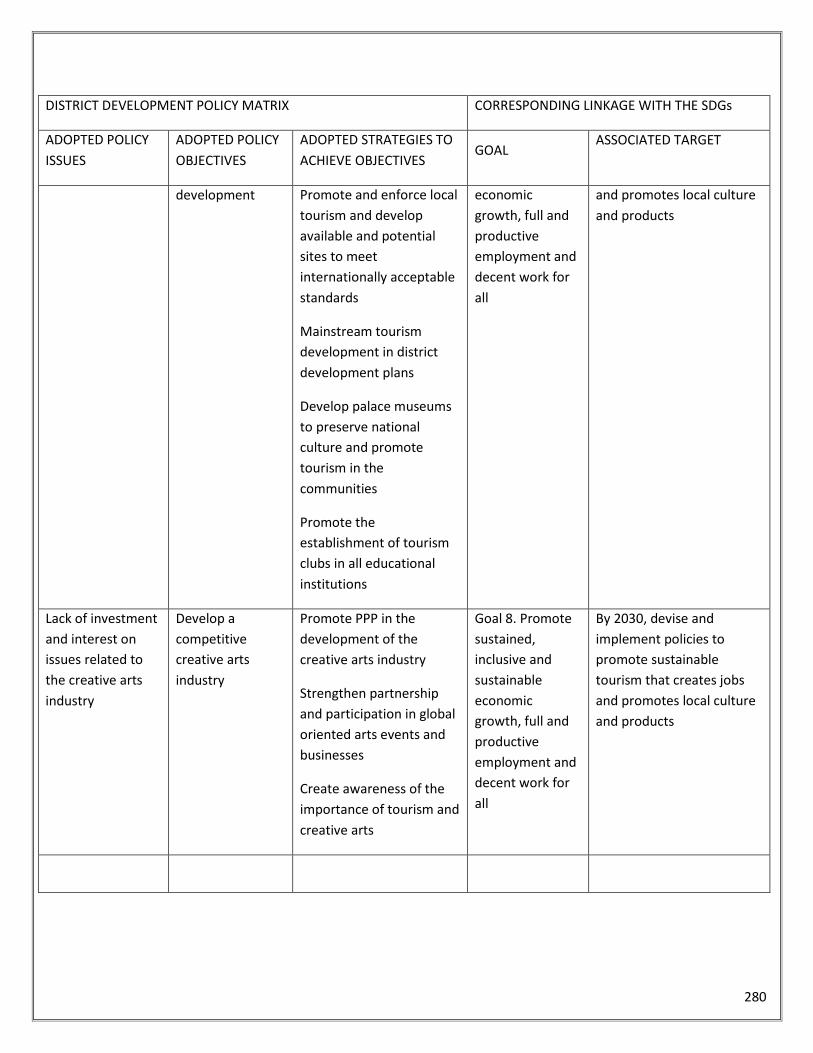
280
DISTRICT DEVELOPMENT POLICY MATRIX CORRESPONDING LINKAGE WITH THE SDGs
ADOPTED POLICY
ISSUES
ADOPTED POLICY
OBJECTIVES
ADOPTED STRATEGIES TO
ACHIEVE OBJECTIVES GOAL
ASSOCIATED TARGET
development
Promote and enforce local
tourism and develop
available and potential
sites to meet
internationally acceptable
standards
Mainstream tourism
development in district
development plans
Develop palace museums
to preserve national
culture and promote
tourism in the
communities
Promote the
establishment of tourism
clubs in all educational
institutions
economic
growth, full and
productive
employment and
decent work for
all
and promotes local culture
and products
Lack of investment
and interest on
issues related to
the creative arts
industry
Develop a
competitive
creative arts
industry
Promote PPP in the
development of the
creative arts industry
Strengthen partnership
and participation in global
oriented arts events and
businesses
Create awareness of the
importance of tourism and
creative arts
Goal 8. Promote
sustained,
inclusive and
sustainable
economic
growth, full and
productive
employment and
decent work for
all
By 2030, devise and
implement policies to
promote sustainable
tourism that creates jobs
and promotes local culture
and products
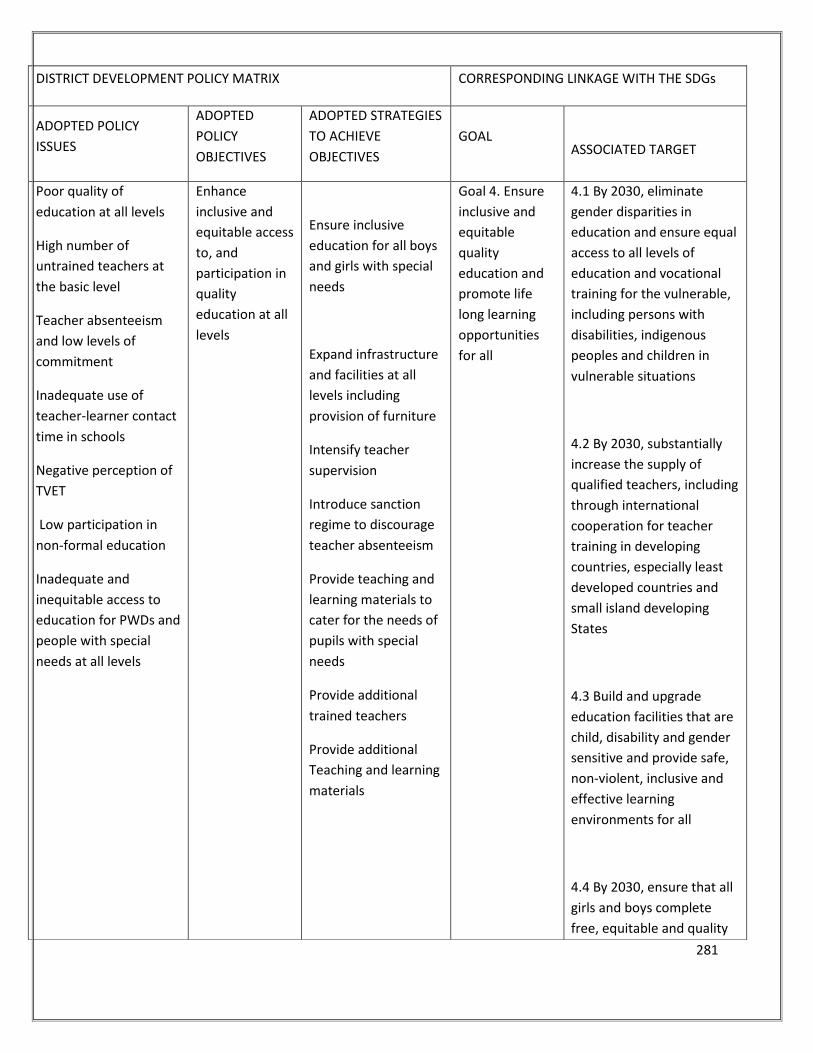
281
DISTRICT DEVELOPMENT POLICY MATRIX CORRESPONDING LINKAGE WITH THE SDGs
ADOPTED POLICY
ISSUES
ADOPTED
POLICY
OBJECTIVES
ADOPTED STRATEGIES
TO ACHIEVE
OBJECTIVES
GOAL
ASSOCIATED TARGET
Poor quality of
education at all levels
High number of
untrained teachers at
the basic level
Teacher absenteeism
and low levels of
commitment
Inadequate use of
teacher-learner contact
time in schools
Negative perception of
TVET
Low participation in
non-formal education
Inadequate and
inequitable access to
education for PWDs and
people with special
needs at all levels
Enhance
inclusive and
equitable access
to, and
participation in
quality
education at all
levels
Ensure inclusive
education for all boys
and girls with special
needs
Expand infrastructure
and facilities at all
levels including
provision of furniture
Intensify teacher
supervision
Introduce sanction
regime to discourage
teacher absenteeism
Provide teaching and
learning materials to
cater for the needs of
pupils with special
needs
Provide additional
trained teachers
Provide additional
Teaching and learning
materials
Goal 4. Ensure
inclusive and
equitable
quality
education and
promote life
long learning
opportunities
for all
4.1 By 2030, eliminate
gender disparities in
education and ensure equal
access to all levels of
education and vocational
training for the vulnerable,
including persons with
disabilities, indigenous
peoples and children in
vulnerable situations
4.2 By 2030, substantially
increase the supply of
qualified teachers, including
through international
cooperation for teacher
training in developing
countries, especially least
developed countries and
small island developing
States
4.3 Build and upgrade
education facilities that are
child, disability and gender
sensitive and provide safe,
non-violent, inclusive and
effective learning
environments for all
4.4 By 2030, ensure that all
girls and boys complete
free, equitable and quality
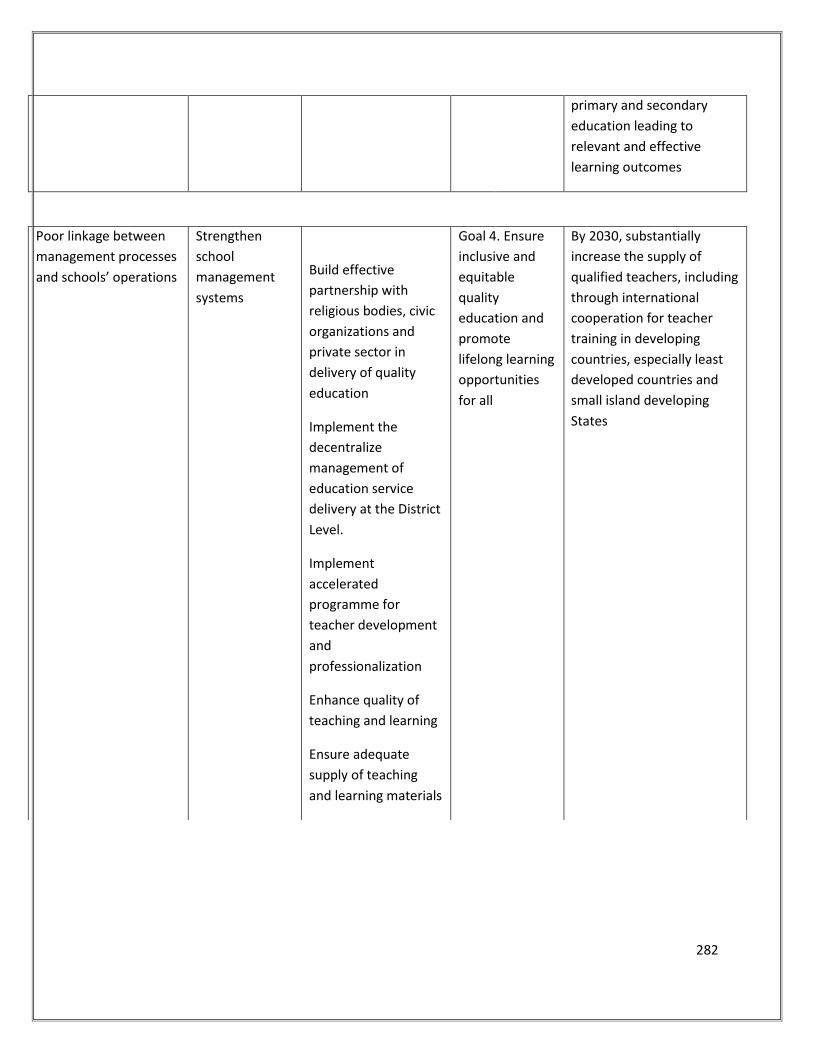
282
primary and secondary
education leading to
relevant and effective
learning outcomes
Poor linkage between
management processes
and schools’ operations
Strengthen
school
management
systems
Build effective
partnership with
religious bodies, civic
organizations and
private sector in
delivery of quality
education
Implement the
decentralize
management of
education service
delivery at the District
Level.
Implement
accelerated
programme for
teacher development
and
professionalization
Enhance quality of
teaching and learning
Ensure adequate
supply of teaching
and learning materials
Goal 4. Ensure
inclusive and
equitable
quality
education and
promote
lifelong learning
opportunities
for all
By 2030, substantially
increase the supply of
qualified teachers, including
through international
cooperation for teacher
training in developing
countries, especially least
developed countries and
small island developing
States
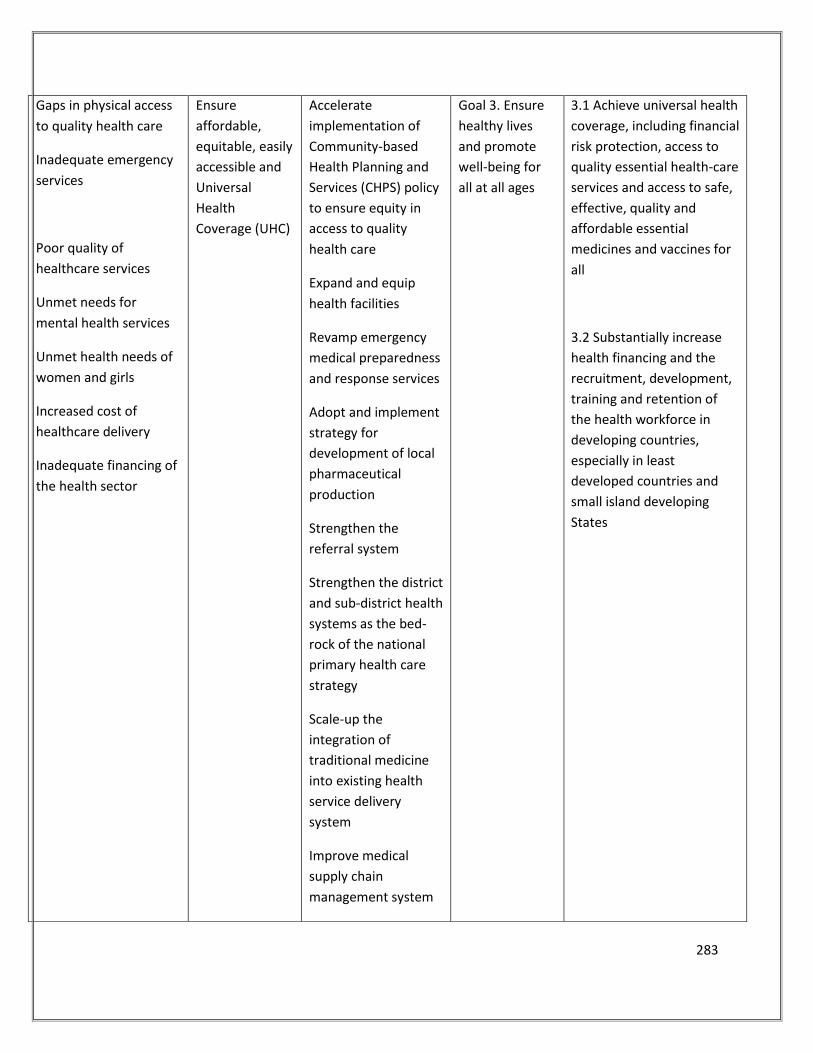
283
Gaps in physical access
to quality health care
Inadequate emergency
services
Poor quality of
healthcare services
Unmet needs for
mental health services
Unmet health needs of
women and girls
Increased cost of
healthcare delivery
Inadequate financing of
the health sector
Ensure
affordable,
equitable, easily
accessible and
Universal
Health
Coverage (UHC)
Accelerate
implementation of
Community-based
Health Planning and
Services (CHPS) policy
to ensure equity in
access to quality
health care
Expand and equip
health facilities
Revamp emergency
medical preparedness
and response services
Adopt and implement
strategy for
development of local
pharmaceutical
production
Strengthen the
referral system
Strengthen the district
and sub-district health
systems as the bed-
rock of the national
primary health care
strategy
Scale-up the
integration of
traditional medicine
into existing health
service delivery
system
Improve medical
supply chain
management system
Goal 3. Ensure
healthy lives
and promote
well-being for
all at all ages
3.1 Achieve universal health
coverage, including financial
risk protection, access to
quality essential health-care
services and access to safe,
effective, quality and
affordable essential
medicines and vaccines for
all
3.2 Substantially increase
health financing and the
recruitment, development,
training and retention of
the health workforce in
developing countries,
especially in least
developed countries and
small island developing
States
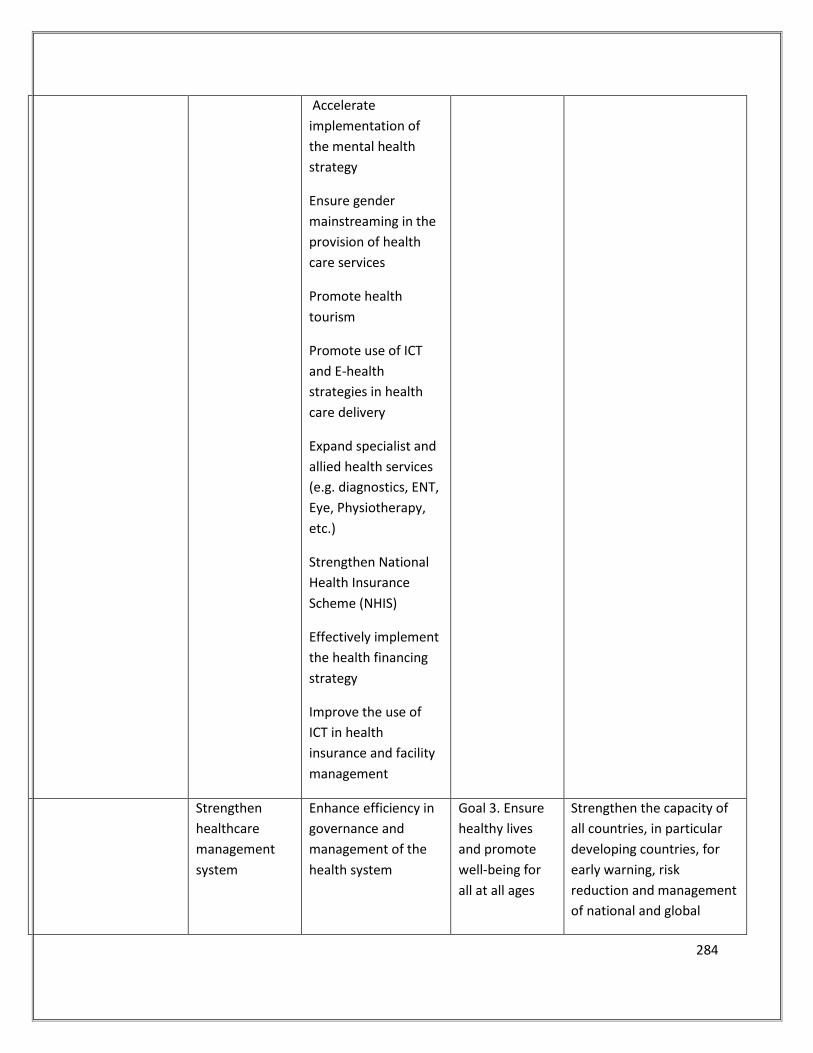
284
Accelerate
implementation of
the mental health
strategy
Ensure gender
mainstreaming in the
provision of health
care services
Promote health
tourism
Promote use of ICT
and E-health
strategies in health
care delivery
Expand specialist and
allied health services
(e.g. diagnostics, ENT,
Eye, Physiotherapy,
etc.)
Strengthen National
Health Insurance
Scheme (NHIS)
Effectively implement
the health financing
strategy
Improve the use of
ICT in health
insurance and facility
management
Strengthen
healthcare
management
system
Enhance efficiency in
governance and
management of the
health system
Goal 3. Ensure
healthy lives
and promote
well-being for
all at all ages
Strengthen the capacity of
all countries, in particular
developing countries, for
early warning, risk
reduction and management
of national and global
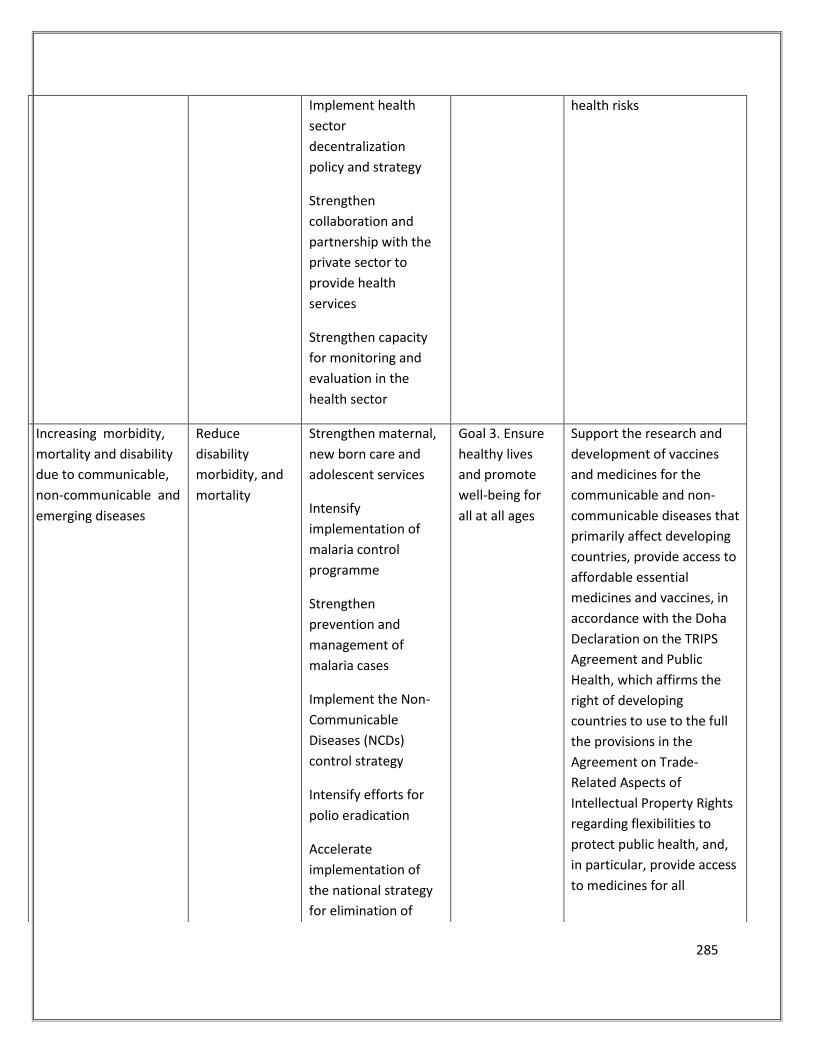
285
Implement health
sector
decentralization
policy and strategy
Strengthen
collaboration and
partnership with the
private sector to
provide health
services
Strengthen capacity
for monitoring and
evaluation in the
health sector
health risks
Increasing morbidity,
mortality and disability
due to communicable,
non-communicable and
emerging diseases
Reduce
disability
morbidity, and
mortality
Strengthen maternal,
new born care and
adolescent services
Intensify
implementation of
malaria control
programme
Strengthen
prevention and
management of
malaria cases
Implement the Non-
Communicable
Diseases (NCDs)
control strategy
Intensify efforts for
polio eradication
Accelerate
implementation of
the national strategy
for elimination of
Goal 3. Ensure
healthy lives
and promote
well-being for
all at all ages
Support the research and
development of vaccines
and medicines for the
communicable and non-
communicable diseases that
primarily affect developing
countries, provide access to
affordable essential
medicines and vaccines, in
accordance with the Doha
Declaration on the TRIPS
Agreement and Public
Health, which affirms the
right of developing
countries to use to the full
the provisions in the
Agreement on Trade-
Related Aspects of
Intellectual Property Rights
regarding flexibilities to
protect public health, and,
in particular, provide access
to medicines for all
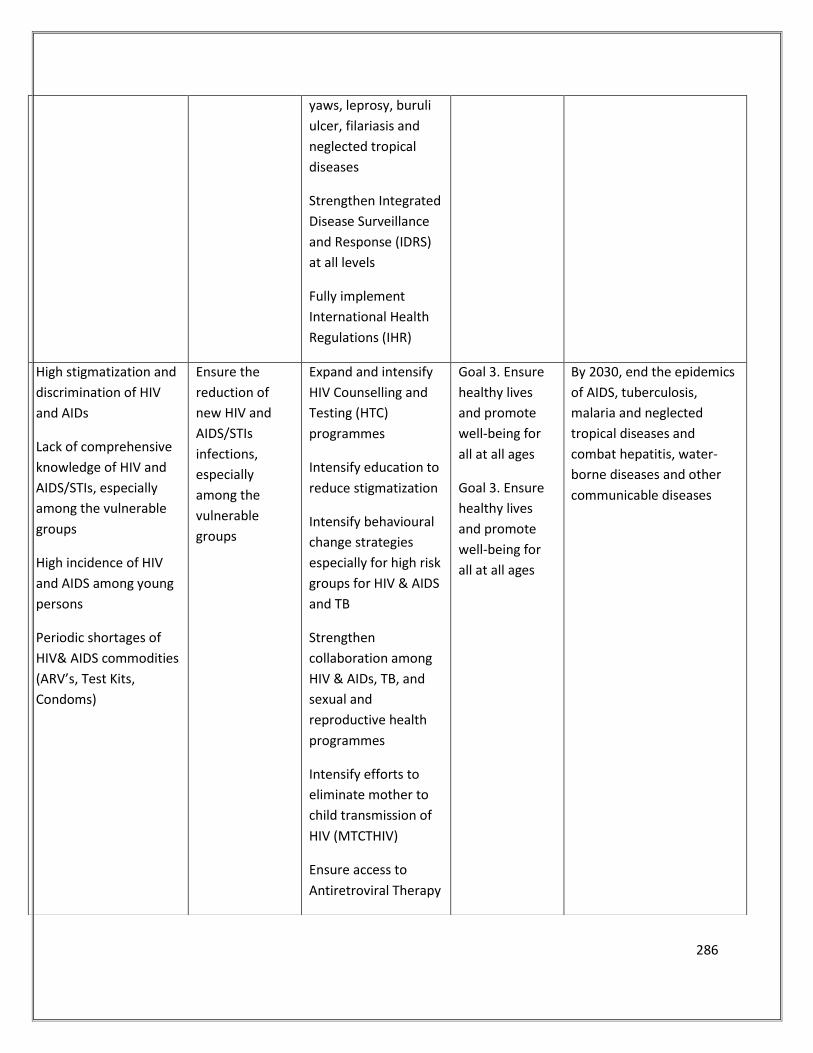
286
yaws, leprosy, buruli
ulcer, filariasis and
neglected tropical
diseases
Strengthen Integrated
Disease Surveillance
and Response (IDRS)
at all levels
Fully implement
International Health
Regulations (IHR)
High stigmatization and
discrimination of HIV
and AIDs
Lack of comprehensive
knowledge of HIV and
AIDS/STIs, especially
among the vulnerable
groups
High incidence of HIV
and AIDS among young
persons
Periodic shortages of
HIV& AIDS commodities
(ARV’s, Test Kits,
Condoms)
Ensure the
reduction of
new HIV and
AIDS/STIs
infections,
especially
among the
vulnerable
groups
Expand and intensify
HIV Counselling and
Testing (HTC)
programmes
Intensify education to
reduce stigmatization
Intensify behavioural
change strategies
especially for high risk
groups for HIV & AIDS
and TB
Strengthen
collaboration among
HIV & AIDs, TB, and
sexual and
reproductive health
programmes
Intensify efforts to
eliminate mother to
child transmission of
HIV (MTCTHIV)
Ensure access to
Antiretroviral Therapy
Goal 3. Ensure
healthy lives
and promote
well-being for
all at all ages
Goal 3. Ensure
healthy lives
and promote
well-being for
all at all ages
By 2030, end the epidemics
of AIDS, tuberculosis,
malaria and neglected
tropical diseases and
combat hepatitis, water-
borne diseases and other
communicable diseases
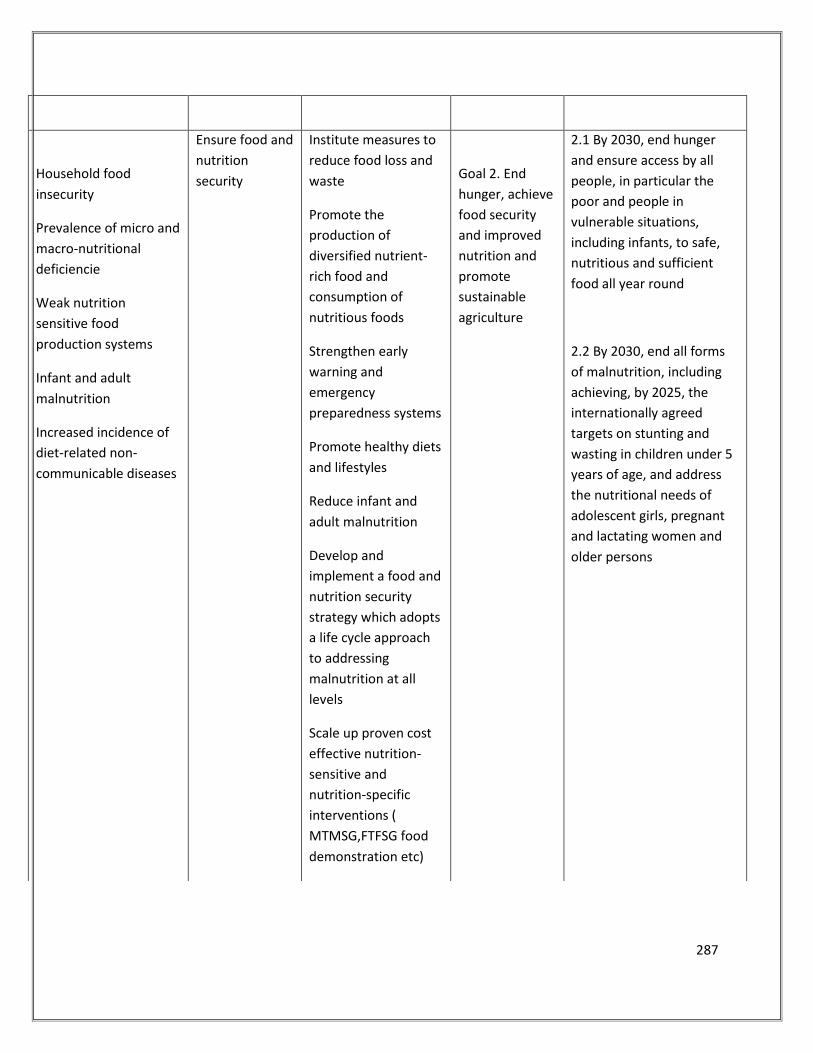
287
Household food
insecurity
Prevalence of micro and
macro-nutritional
deficiencie
Weak nutrition
sensitive food
production systems
Infant and adult
malnutrition
Increased incidence of
diet-related non-
communicable diseases
Ensure food and
nutrition
security
Institute measures to
reduce food loss and
waste
Promote the
production of
diversified nutrient-
rich food and
consumption of
nutritious foods
Strengthen early
warning and
emergency
preparedness systems
Promote healthy diets
and lifestyles
Reduce infant and
adult malnutrition
Develop and
implement a food and
nutrition security
strategy which adopts
a life cycle approach
to addressing
malnutrition at all
levels
Scale up proven cost
effective nutrition-
sensitive and
nutrition-specific
interventions (
MTMSG,FTFSG food
demonstration etc)
Goal 2. End
hunger, achieve
food security
and improved
nutrition and
promote
sustainable
agriculture
2.1 By 2030, end hunger
and ensure access by all
people, in particular the
poor and people in
vulnerable situations,
including infants, to safe,
nutritious and sufficient
food all year round
2.2 By 2030, end all forms
of malnutrition, including
achieving, by 2025, the
internationally agreed
targets on stunting and
wasting in children under 5
years of age, and address
the nutritional needs of
adolescent girls, pregnant
and lactating women and
older persons
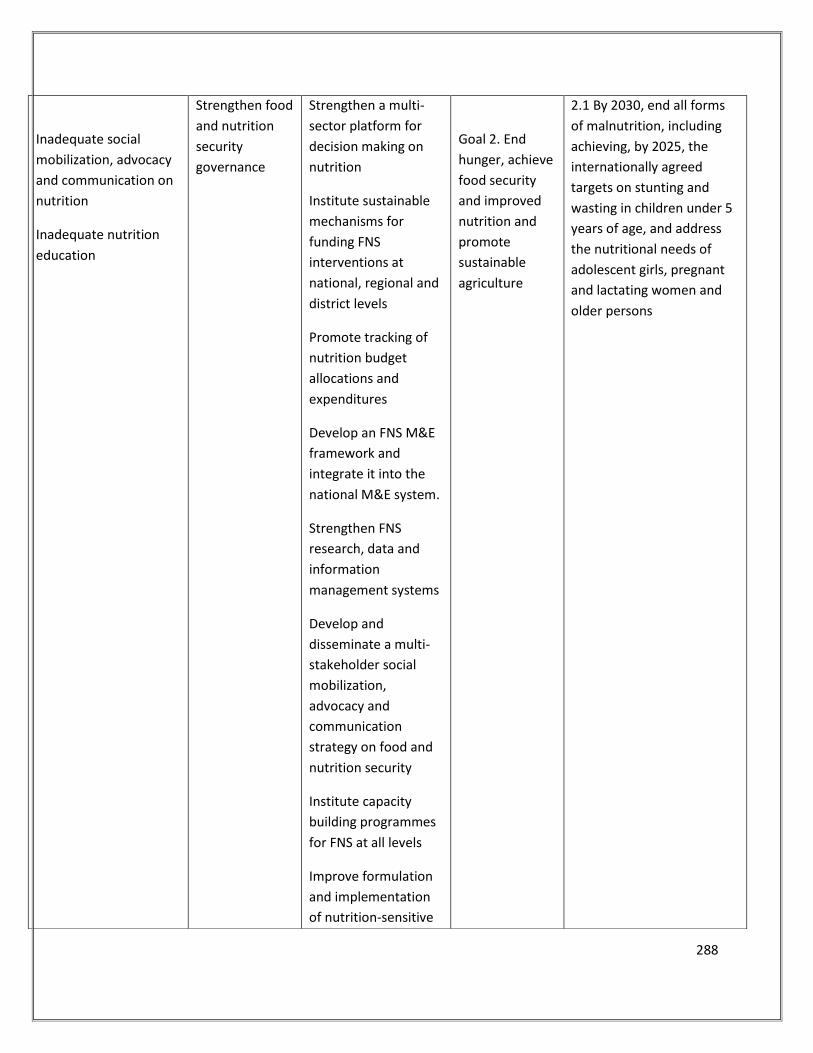
288
Inadequate social
mobilization, advocacy
and communication on
nutrition
Inadequate nutrition
education
Strengthen food
and nutrition
security
governance
Strengthen a multi-
sector platform for
decision making on
nutrition
Institute sustainable
mechanisms for
funding FNS
interventions at
national, regional and
district levels
Promote tracking of
nutrition budget
allocations and
expenditures
Develop an FNS M&E
framework and
integrate it into the
national M&E system.
Strengthen FNS
research, data and
information
management systems
Develop and
disseminate a multi-
stakeholder social
mobilization,
advocacy and
communication
strategy on food and
nutrition security
Institute capacity
building programmes
for FNS at all levels
Improve formulation
and implementation
of nutrition-sensitive
Goal 2. End
hunger, achieve
food security
and improved
nutrition and
promote
sustainable
agriculture
2.1 By 2030, end all forms
of malnutrition, including
achieving, by 2025, the
internationally agreed
targets on stunting and
wasting in children under 5
years of age, and address
the nutritional needs of
adolescent girls, pregnant
and lactating women and
older persons
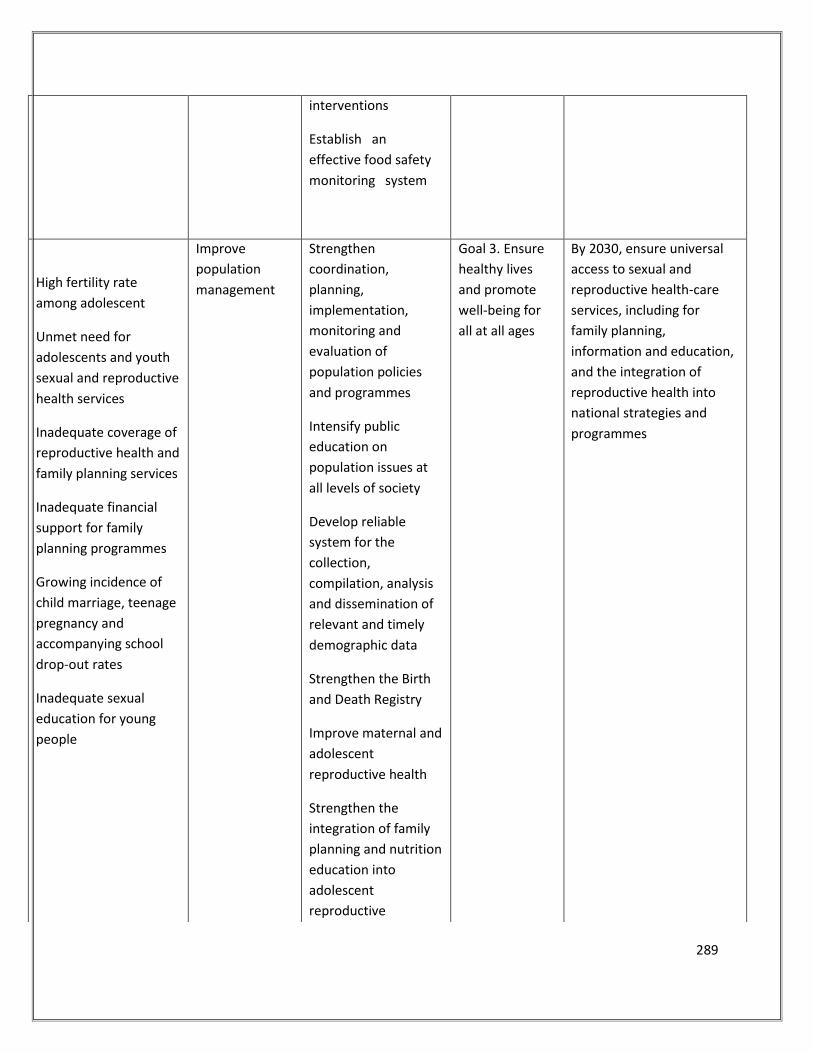
289
interventions
Establish an
effective food safety
monitoring system
High fertility rate
among adolescent
Unmet need for
adolescents and youth
sexual and reproductive
health services
Inadequate coverage of
reproductive health and
family planning services
Inadequate financial
support for family
planning programmes
Growing incidence of
child marriage, teenage
pregnancy and
accompanying school
drop-out rates
Inadequate sexual
education for young
people
Improve
population
management
Strengthen
coordination,
planning,
implementation,
monitoring and
evaluation of
population policies
and programmes
Intensify public
education on
population issues at
all levels of society
Develop reliable
system for the
collection,
compilation, analysis
and dissemination of
relevant and timely
demographic data
Strengthen the Birth
and Death Registry
Improve maternal and
adolescent
reproductive health
Strengthen the
integration of family
planning and nutrition
education into
adolescent
reproductive
Goal 3. Ensure
healthy lives
and promote
well-being for
all at all ages
By 2030, ensure universal
access to sexual and
reproductive health-care
services, including for
family planning,
information and education,
and the integration of
reproductive health into
national strategies and
programmes
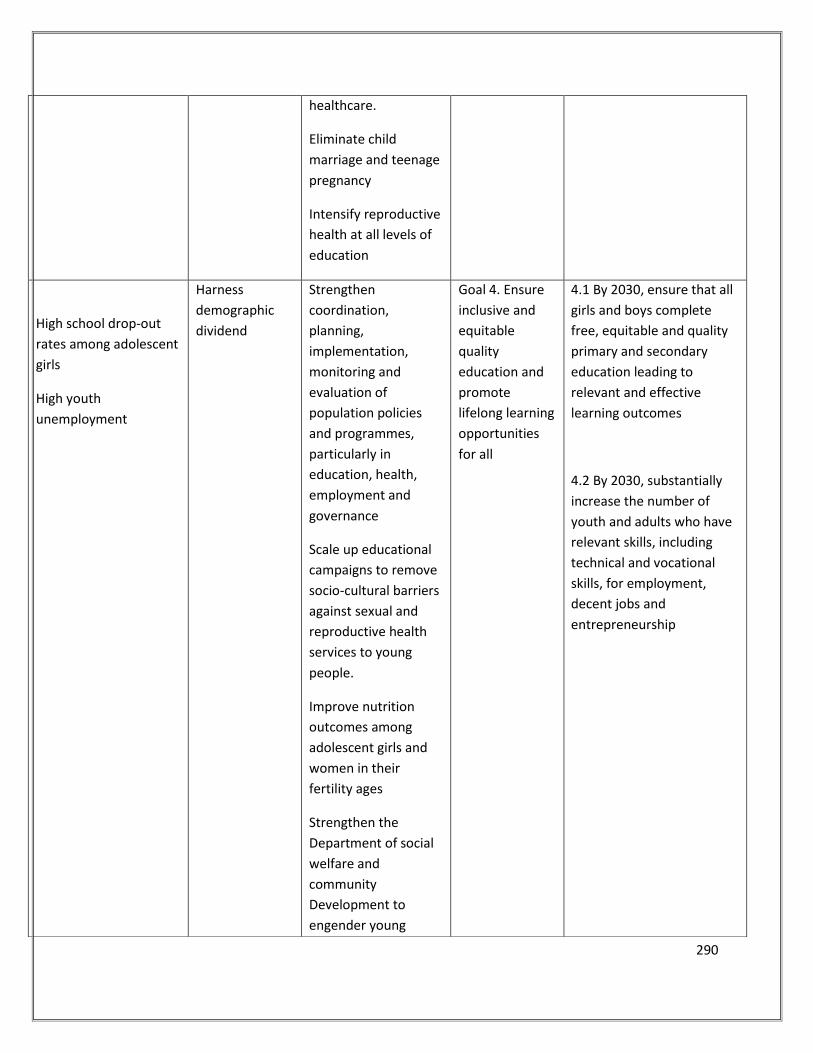
290
healthcare.
Eliminate child
marriage and teenage
pregnancy
Intensify reproductive
health at all levels of
education
High school drop-out
rates among adolescent
girls
High youth
unemployment
Harness
demographic
dividend
Strengthen
coordination,
planning,
implementation,
monitoring and
evaluation of
population policies
and programmes,
particularly in
education, health,
employment and
governance
Scale up educational
campaigns to remove
socio-cultural barriers
against sexual and
reproductive health
services to young
people.
Improve nutrition
outcomes among
adolescent girls and
women in their
fertility ages
Strengthen the
Department of social
welfare and
community
Development to
engender young
Goal 4. Ensure
inclusive and
equitable
quality
education and
promote
lifelong learning
opportunities
for all
4.1 By 2030, ensure that all
girls and boys complete
free, equitable and quality
primary and secondary
education leading to
relevant and effective
learning outcomes
4.2 By 2030, substantially
increase the number of
youth and adults who have
relevant skills, including
technical and vocational
skills, for employment,
decent jobs and
entrepreneurship
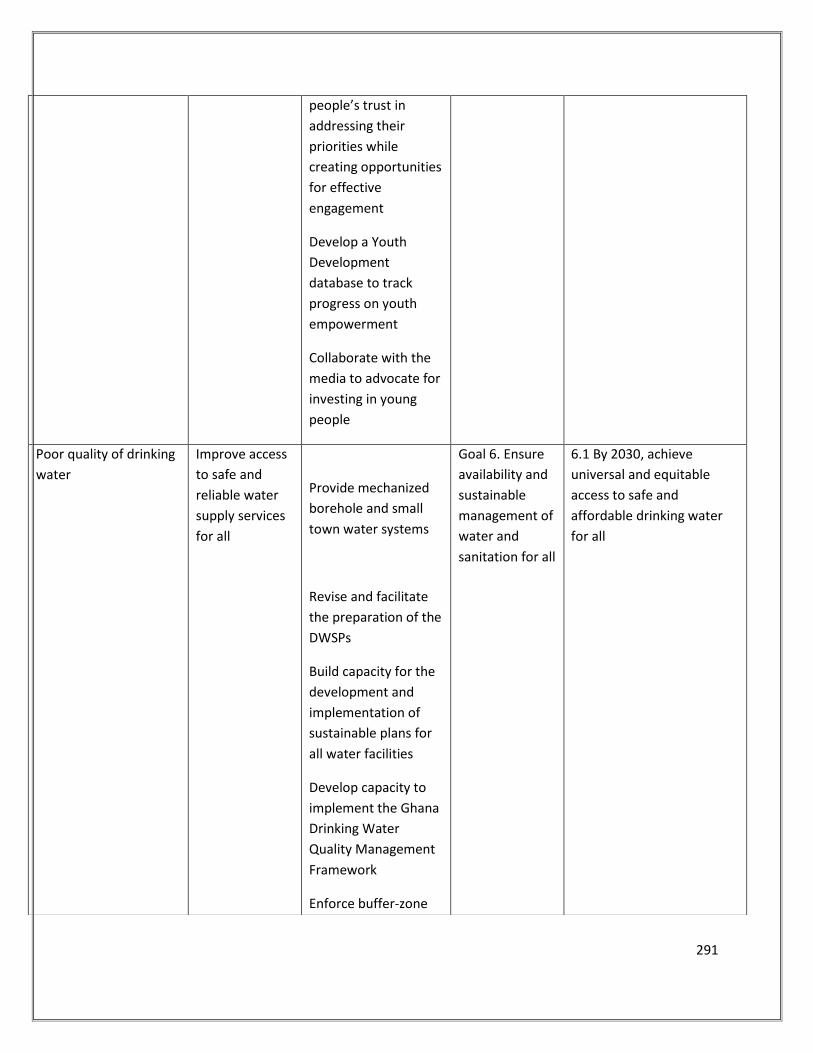
291
people’s trust in
addressing their
priorities while
creating opportunities
for effective
engagement
Develop a Youth
Development
database to track
progress on youth
empowerment
Collaborate with the
media to advocate for
investing in young
people
Poor quality of drinking
water
Improve access
to safe and
reliable water
supply services
for all
Provide mechanized
borehole and small
town water systems
Revise and facilitate
the preparation of the
DWSPs
Build capacity for the
development and
implementation of
sustainable plans for
all water facilities
Develop capacity to
implement the Ghana
Drinking Water
Quality Management
Framework
Enforce buffer-zone
Goal 6. Ensure
availability and
sustainable
management of
water and
sanitation for all
6.1 By 2030, achieve
universal and equitable
access to safe and
affordable drinking water
for all
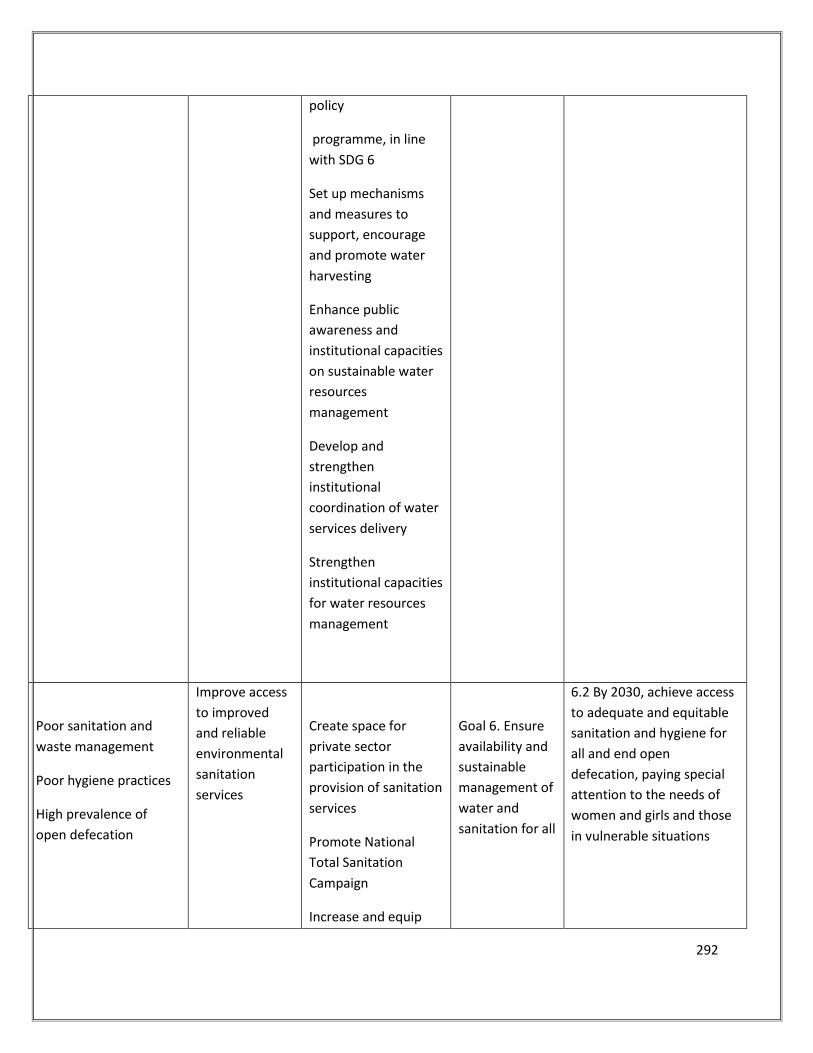
292
policy
programme, in line
with SDG 6
Set up mechanisms
and measures to
support, encourage
and promote water
harvesting
Enhance public
awareness and
institutional capacities
on sustainable water
resources
management
Develop and
strengthen
institutional
coordination of water
services delivery
Strengthen
institutional capacities
for water resources
management
Poor sanitation and
waste management
Poor hygiene practices
High prevalence of
open defecation
Improve access
to improved
and reliable
environmental
sanitation
services
Create space for
private sector
participation in the
provision of sanitation
services
Promote National
Total Sanitation
Campaign
Increase and equip
Goal 6. Ensure
availability and
sustainable
management of
water and
sanitation for all
6.2 By 2030, achieve access
to adequate and equitable
sanitation and hygiene for
all and end open
defecation, paying special
attention to the needs of
women and girls and those
in vulnerable situations
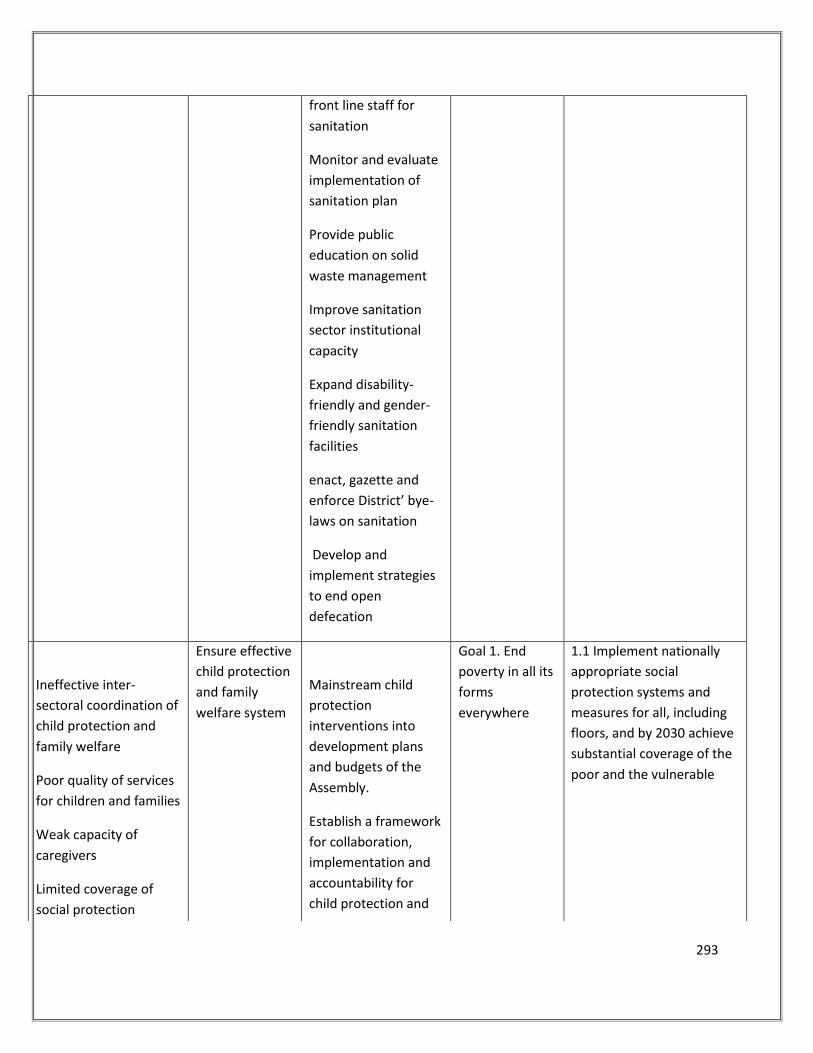
293
front line staff for
sanitation
Monitor and evaluate
implementation of
sanitation plan
Provide public
education on solid
waste management
Improve sanitation
sector institutional
capacity
Expand disability-
friendly and gender-
friendly sanitation
facilities
enact, gazette and
enforce District’ bye-
laws on sanitation
Develop and
implement strategies
to end open
defecation
Ineffective inter-
sectoral coordination of
child protection and
family welfare
Poor quality of services
for children and families
Weak capacity of
caregivers
Limited coverage of
social protection
Ensure effective
child protection
and family
welfare system
Mainstream child
protection
interventions into
development plans
and budgets of the
Assembly.
Establish a framework
for collaboration,
implementation and
accountability for
child protection and
Goal 1. End
poverty in all its
forms
everywhere
1.1 Implement nationally
appropriate social
protection systems and
measures for all, including
floors, and by 2030 achieve
substantial coverage of the
poor and the vulnerable
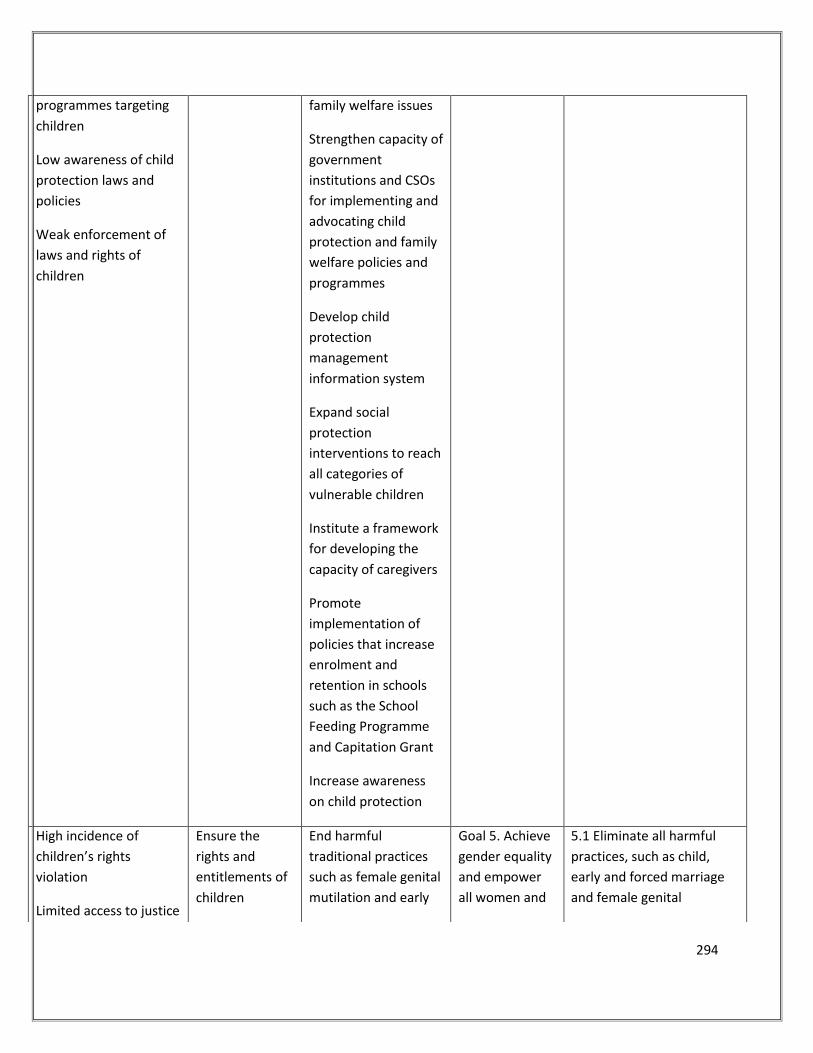
294
programmes targeting
children
Low awareness of child
protection laws and
policies
Weak enforcement of
laws and rights of
children
family welfare issues
Strengthen capacity of
government
institutions and CSOs
for implementing and
advocating child
protection and family
welfare policies and
programmes
Develop child
protection
management
information system
Expand social
protection
interventions to reach
all categories of
vulnerable children
Institute a framework
for developing the
capacity of caregivers
Promote
implementation of
policies that increase
enrolment and
retention in schools
such as the School
Feeding Programme
and Capitation Grant
Increase awareness
on child protection
High incidence of
children’s rights
violation
Limited access to justice
Ensure the
rights and
entitlements of
children
End harmful
traditional practices
such as female genital
mutilation and early
Goal 5. Achieve
gender equality
and empower
all women and
5.1 Eliminate all harmful
practices, such as child,
early and forced marriage
and female genital
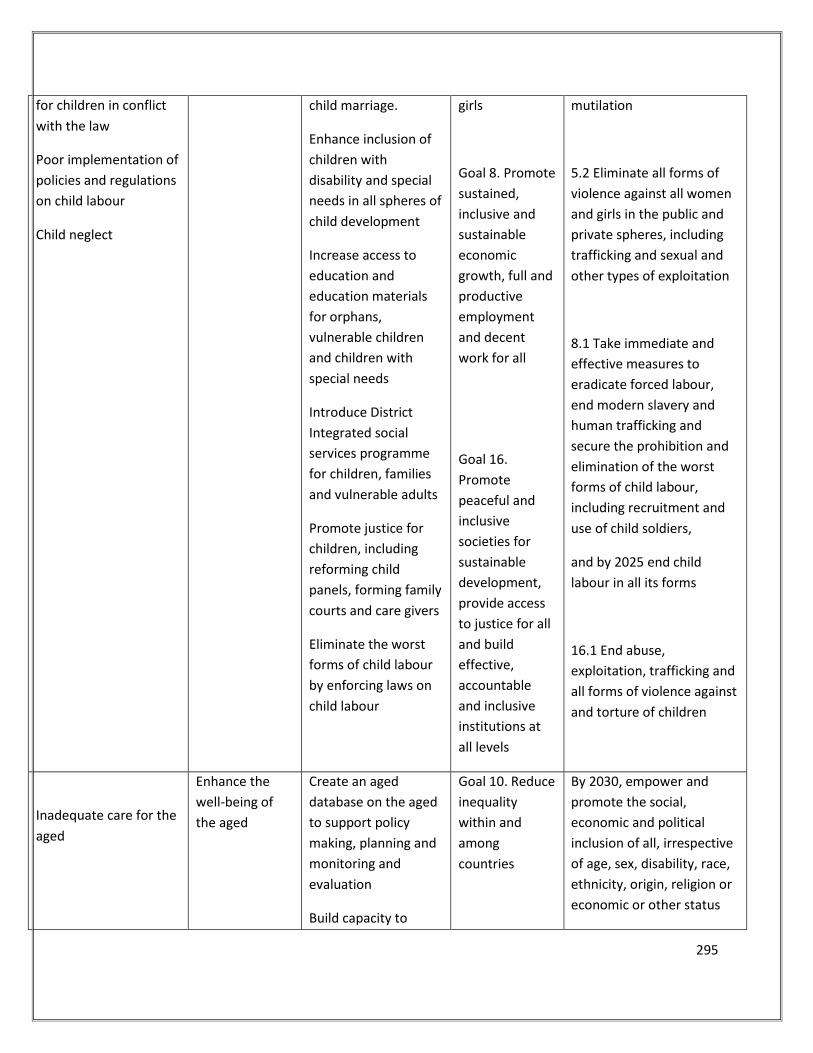
295
for children in conflict
with the law
Poor implementation of
policies and regulations
on child labour
Child neglect
child marriage.
Enhance inclusion of
children with
disability and special
needs in all spheres of
child development
Increase access to
education and
education materials
for orphans,
vulnerable children
and children with
special needs
Introduce District
Integrated social
services programme
for children, families
and vulnerable adults
Promote justice for
children, including
reforming child
panels, forming family
courts and care givers
Eliminate the worst
forms of child labour
by enforcing laws on
child labour
girls
Goal 8. Promote
sustained,
inclusive and
sustainable
economic
growth, full and
productive
employment
and decent
work for all
Goal 16.
Promote
peaceful and
inclusive
societies for
sustainable
development,
provide access
to justice for all
and build
effective,
accountable
and inclusive
institutions at
all levels
mutilation
5.2 Eliminate all forms of
violence against all women
and girls in the public and
private spheres, including
trafficking and sexual and
other types of exploitation
8.1 Take immediate and
effective measures to
eradicate forced labour,
end modern slavery and
human trafficking and
secure the prohibition and
elimination of the worst
forms of child labour,
including recruitment and
use of child soldiers,
and by 2025 end child
labour in all its forms
16.1 End abuse,
exploitation, trafficking and
all forms of violence against
and torture of children
Inadequate care for the
aged
Enhance the
well-being of
the aged
Create an aged
database on the aged
to support policy
making, planning and
monitoring and
evaluation
Build capacity to
Goal 10. Reduce
inequality
within and
among
countries
By 2030, empower and
promote the social,
economic and political
inclusion of all, irrespective
of age, sex, disability, race,
ethnicity, origin, religion or
economic or other status
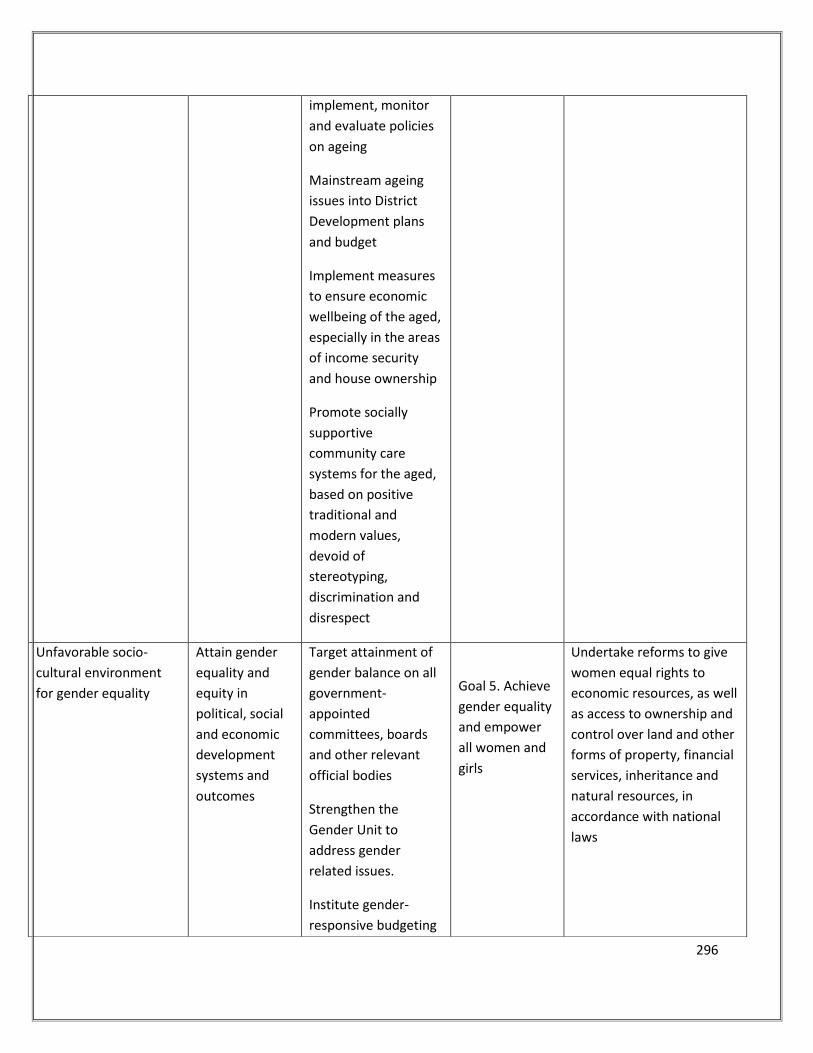
296
implement, monitor
and evaluate policies
on ageing
Mainstream ageing
issues into District
Development plans
and budget
Implement measures
to ensure economic
wellbeing of the aged,
especially in the areas
of income security
and house ownership
Promote socially
supportive
community care
systems for the aged,
based on positive
traditional and
modern values,
devoid of
stereotyping,
discrimination and
disrespect
Unfavorable socio-
cultural environment
for gender equality
Attain gender
equality and
equity in
political, social
and economic
development
systems and
outcomes
Target attainment of
gender balance on all
government-
appointed
committees, boards
and other relevant
official bodies
Strengthen the
Gender Unit to
address gender
related issues.
Institute gender-
responsive budgeting
Goal 5. Achieve
gender equality
and empower
all women and
girls
Undertake reforms to give
women equal rights to
economic resources, as well
as access to ownership and
control over land and other
forms of property, financial
services, inheritance and
natural resources, in
accordance with national
laws
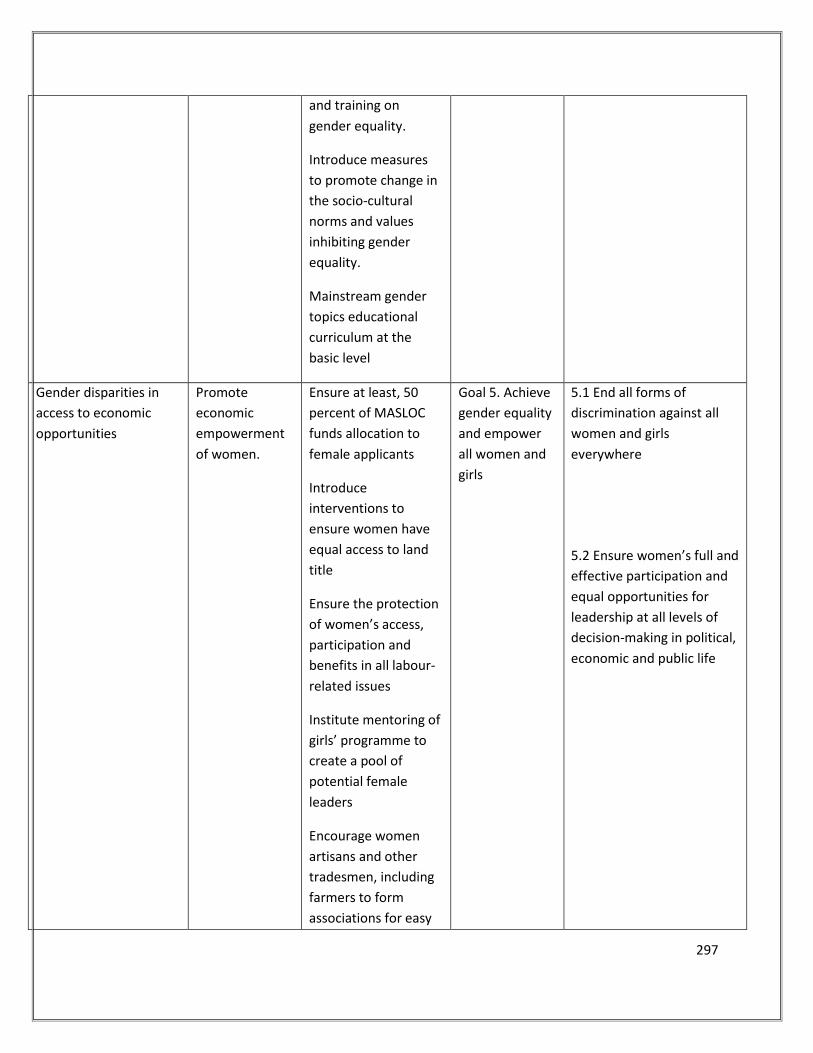
297
and training on
gender equality.
Introduce measures
to promote change in
the socio-cultural
norms and values
inhibiting gender
equality.
Mainstream gender
topics educational
curriculum at the
basic level
Gender disparities in
access to economic
opportunities
Promote
economic
empowerment
of women.
Ensure at least, 50
percent of MASLOC
funds allocation to
female applicants
Introduce
interventions to
ensure women have
equal access to land
title
Ensure the protection
of women’s access,
participation and
benefits in all labour-
related issues
Institute mentoring of
girls’ programme to
create a pool of
potential female
leaders
Encourage women
artisans and other
tradesmen, including
farmers to form
associations for easy
Goal 5. Achieve
gender equality
and empower
all women and
girls
5.1 End all forms of
discrimination against all
women and girls
everywhere
5.2 Ensure women’s full and
effective participation and
equal opportunities for
leadership at all levels of
decision-making in political,
economic and public life
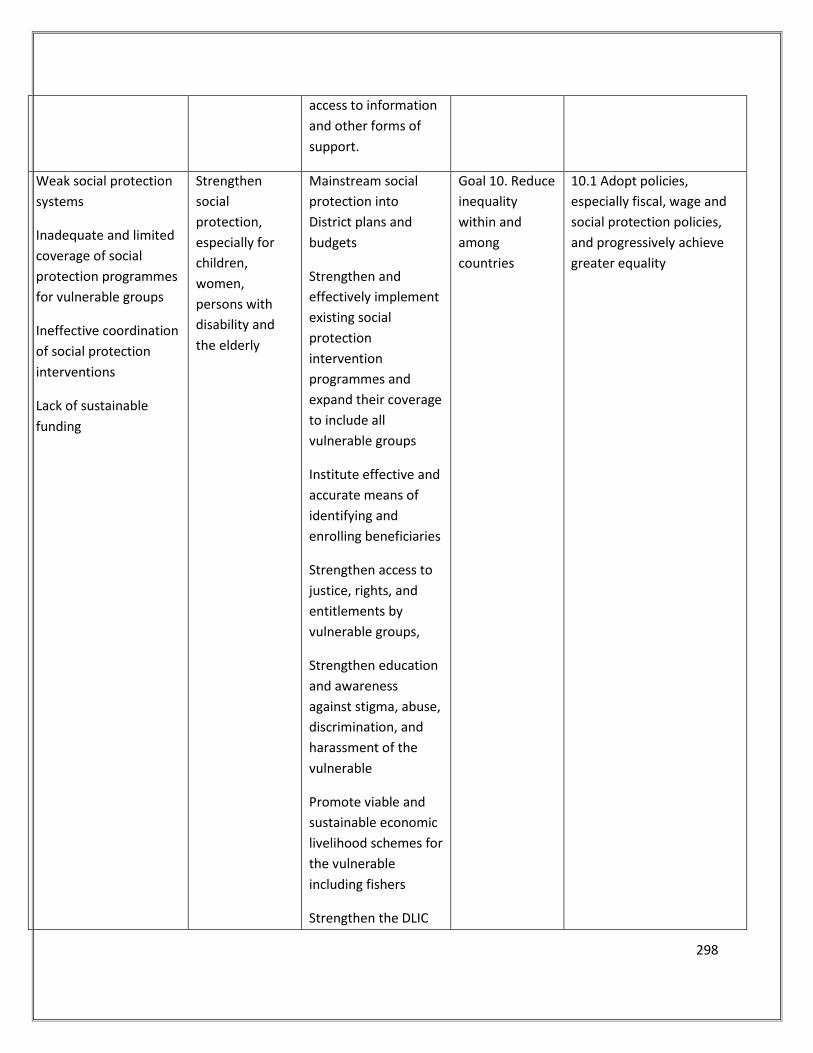
298
access to information
and other forms of
support.
Weak social protection
systems
Inadequate and limited
coverage of social
protection programmes
for vulnerable groups
Ineffective coordination
of social protection
interventions
Lack of sustainable
funding
Strengthen
social
protection,
especially for
children,
women,
persons with
disability and
the elderly
Mainstream social
protection into
District plans and
budgets
Strengthen and
effectively implement
existing social
protection
intervention
programmes and
expand their coverage
to include all
vulnerable groups
Institute effective and
accurate means of
identifying and
enrolling beneficiaries
Strengthen access to
justice, rights, and
entitlements by
vulnerable groups,
Strengthen education
and awareness
against stigma, abuse,
discrimination, and
harassment of the
vulnerable
Promote viable and
sustainable economic
livelihood schemes for
the vulnerable
including fishers
Strengthen the DLIC
Goal 10. Reduce
inequality
within and
among
countries
10.1 Adopt policies,
especially fiscal, wage and
social protection policies,
and progressively achieve
greater equality
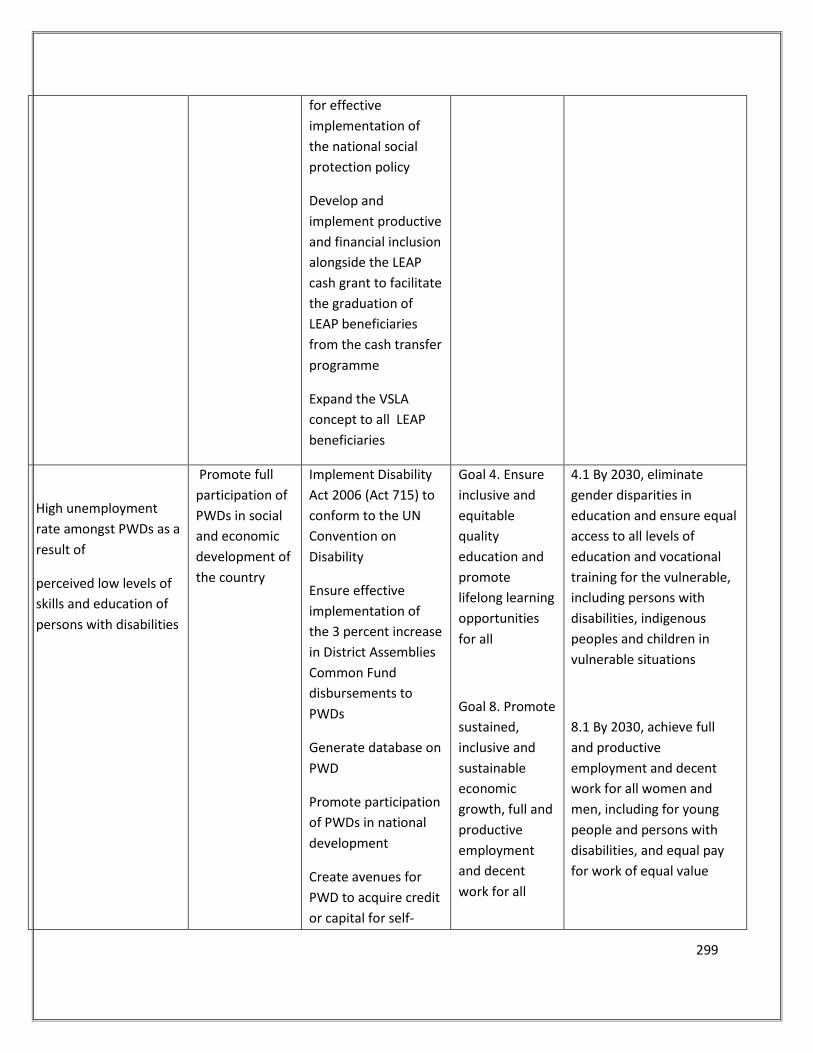
299
for effective
implementation of
the national social
protection policy
Develop and
implement productive
and financial inclusion
alongside the LEAP
cash grant to facilitate
the graduation of
LEAP beneficiaries
from the cash transfer
programme
Expand the VSLA
concept to all LEAP
beneficiaries
High unemployment
rate amongst PWDs as a
result of
perceived low levels of
skills and education of
persons with disabilities
Promote full
participation of
PWDs in social
and economic
development of
the country
Implement Disability
Act 2006 (Act 715) to
conform to the UN
Convention on
Disability
Ensure effective
implementation of
the 3 percent increase
in District Assemblies
Common Fund
disbursements to
PWDs
Generate database on
PWD
Promote participation
of PWDs in national
development
Create avenues for
PWD to acquire credit
or capital for self-
Goal 4. Ensure
inclusive and
equitable
quality
education and
promote
lifelong learning
opportunities
for all
Goal 8. Promote
sustained,
inclusive and
sustainable
economic
growth, full and
productive
employment
and decent
work for all
4.1 By 2030, eliminate
gender disparities in
education and ensure equal
access to all levels of
education and vocational
training for the vulnerable,
including persons with
disabilities, indigenous
peoples and children in
vulnerable situations
8.1 By 2030, achieve full
and productive
employment and decent
work for all women and
men, including for young
people and persons with
disabilities, and equal pay
for work of equal value
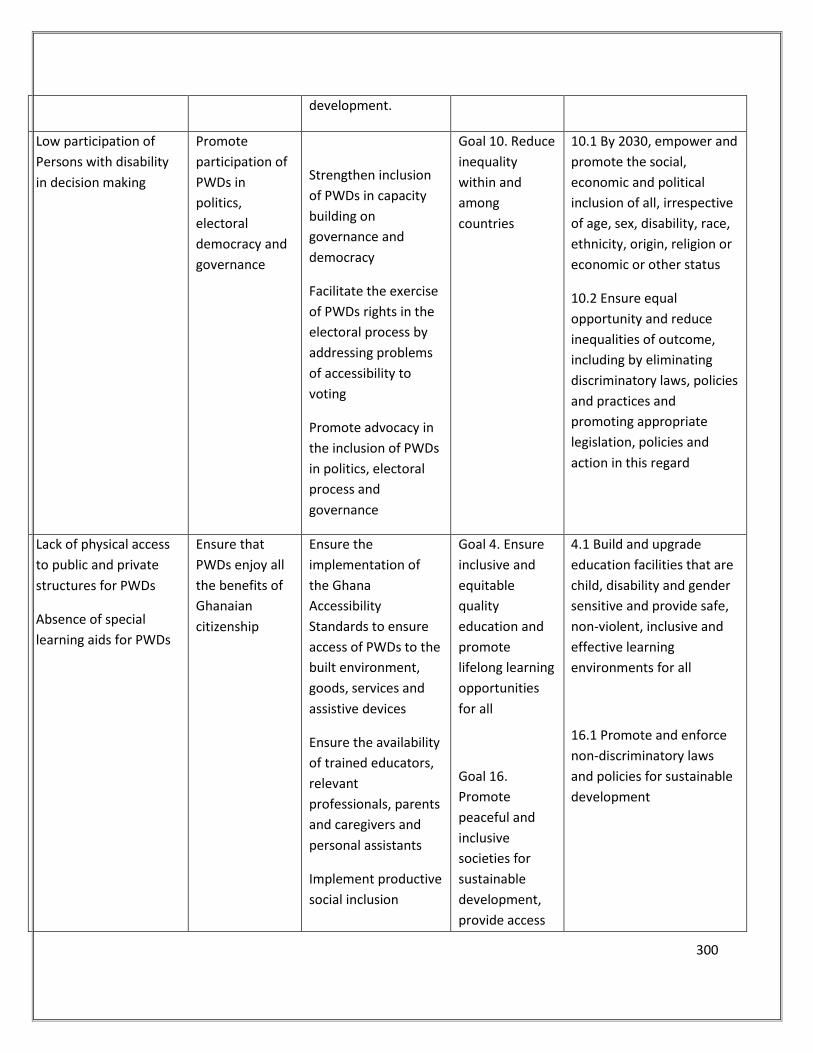
300
development.
Low participation of
Persons with disability
in decision making
Promote
participation of
PWDs in
politics,
electoral
democracy and
governance
Strengthen inclusion
of PWDs in capacity
building on
governance and
democracy
Facilitate the exercise
of PWDs rights in the
electoral process by
addressing problems
of accessibility to
voting
Promote advocacy in
the inclusion of PWDs
in politics, electoral
process and
governance
Goal 10. Reduce
inequality
within and
among
countries
10.1 By 2030, empower and
promote the social,
economic and political
inclusion of all, irrespective
of age, sex, disability, race,
ethnicity, origin, religion or
economic or other status
10.2 Ensure equal
opportunity and reduce
inequalities of outcome,
including by eliminating
discriminatory laws, policies
and practices and
promoting appropriate
legislation, policies and
action in this regard
Lack of physical access
to public and private
structures for PWDs
Absence of special
learning aids for PWDs
Ensure that
PWDs enjoy all
the benefits of
Ghanaian
citizenship
Ensure the
implementation of
the Ghana
Accessibility
Standards to ensure
access of PWDs to the
built environment,
goods, services and
assistive devices
Ensure the availability
of trained educators,
relevant
professionals, parents
and caregivers and
personal assistants
Implement productive
social inclusion
Goal 4. Ensure
inclusive and
equitable
quality
education and
promote
lifelong learning
opportunities
for all
Goal 16.
Promote
peaceful and
inclusive
societies for
sustainable
development,
provide access
4.1 Build and upgrade
education facilities that are
child, disability and gender
sensitive and provide safe,
non-violent, inclusive and
effective learning
environments for all
16.1 Promote and enforce
non-discriminatory laws
and policies for sustainable
development
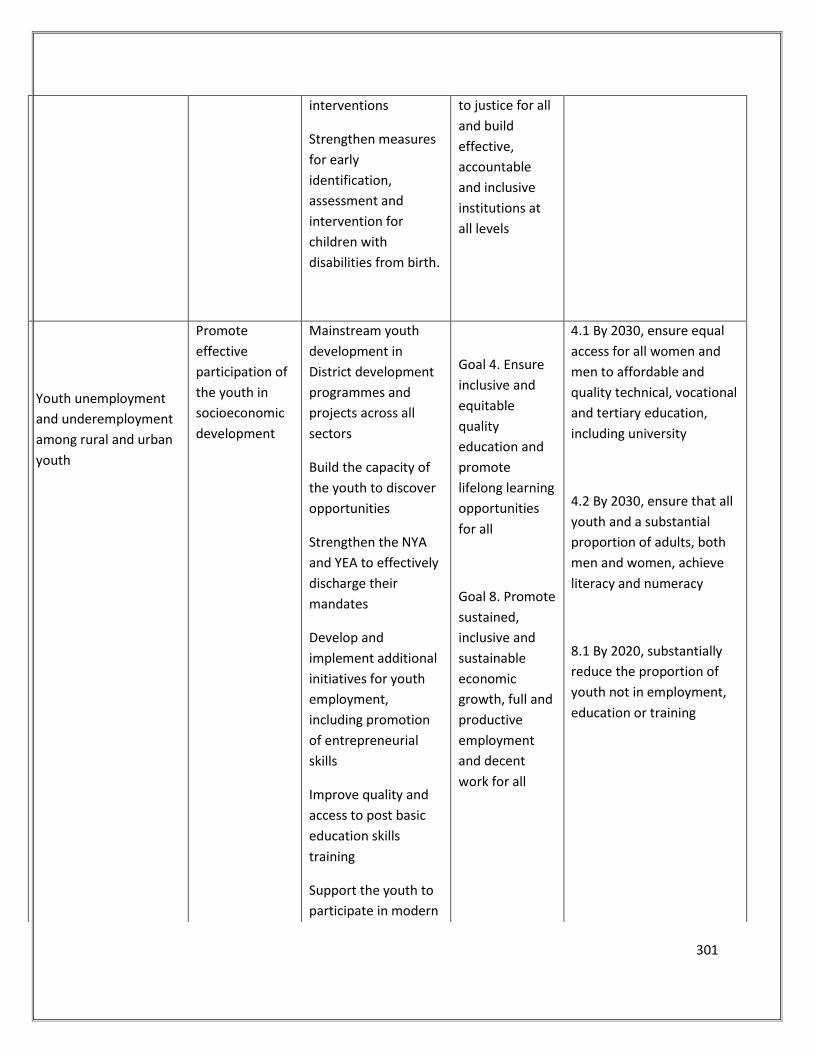
301
interventions
Strengthen measures
for early
identification,
assessment and
intervention for
children with
disabilities from birth.
to justice for all
and build
effective,
accountable
and inclusive
institutions at
all levels
Youth unemployment
and underemployment
among rural and urban
youth
Promote
effective
participation of
the youth in
socioeconomic
development
Mainstream youth
development in
District development
programmes and
projects across all
sectors
Build the capacity of
the youth to discover
opportunities
Strengthen the NYA
and YEA to effectively
discharge their
mandates
Develop and
implement additional
initiatives for youth
employment,
including promotion
of entrepreneurial
skills
Improve quality and
access to post basic
education skills
training
Support the youth to
participate in modern
Goal 4. Ensure
inclusive and
equitable
quality
education and
promote
lifelong learning
opportunities
for all
Goal 8. Promote
sustained,
inclusive and
sustainable
economic
growth, full and
productive
employment
and decent
work for all
4.1 By 2030, ensure equal
access for all women and
men to affordable and
quality technical, vocational
and tertiary education,
including university
4.2 By 2030, ensure that all
youth and a substantial
proportion of adults, both
men and women, achieve
literacy and numeracy
8.1 By 2020, substantially
reduce the proportion of
youth not in employment,
education or training
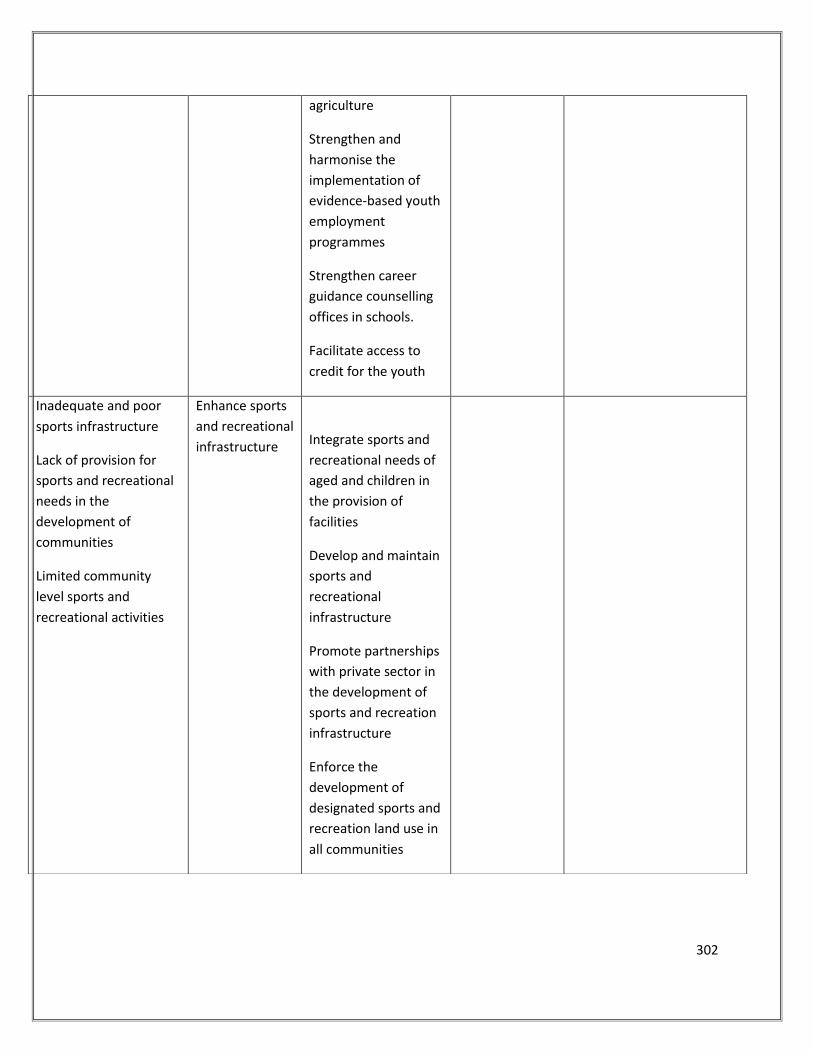
302
agriculture
Strengthen and
harmonise the
implementation of
evidence-based youth
employment
programmes
Strengthen career
guidance counselling
offices in schools.
Facilitate access to
credit for the youth
Inadequate and poor
sports infrastructure
Lack of provision for
sports and recreational
needs in the
development of
communities
Limited community
level sports and
recreational activities
Enhance sports
and recreational
infrastructure
Integrate sports and
recreational needs of
aged and children in
the provision of
facilities
Develop and maintain
sports and
recreational
infrastructure
Promote partnerships
with private sector in
the development of
sports and recreation
infrastructure
Enforce the
development of
designated sports and
recreation land use in
all communities
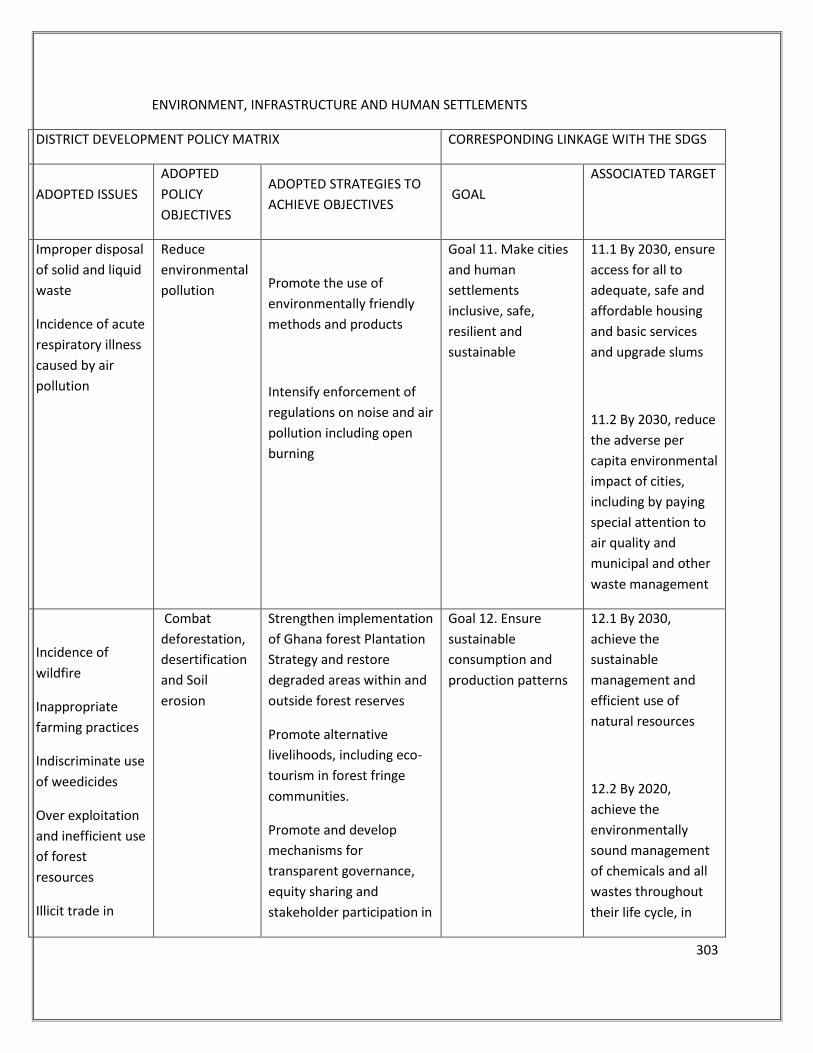
303
ENVIRONMENT, INFRASTRUCTURE AND HUMAN SETTLEMENTS
DISTRICT DEVELOPMENT POLICY MATRIX CORRESPONDING LINKAGE WITH THE SDGS
ADOPTED ISSUES
ADOPTED
POLICY
OBJECTIVES
ADOPTED STRATEGIES TO
ACHIEVE OBJECTIVES GOAL
ASSOCIATED TARGET
Improper disposal
of solid and liquid
waste
Incidence of acute
respiratory illness
caused by air
pollution
Reduce
environmental
pollution
Promote the use of
environmentally friendly
methods and products
Intensify enforcement of
regulations on noise and air
pollution including open
burning
Goal 11. Make cities
and human
settlements
inclusive, safe,
resilient and
sustainable
11.1 By 2030, ensure
access for all to
adequate, safe and
affordable housing
and basic services
and upgrade slums
11.2 By 2030, reduce
the adverse per
capita environmental
impact of cities,
including by paying
special attention to
air quality and
municipal and other
waste management
Incidence of
wildfire
Inappropriate
farming practices
Indiscriminate use
of weedicides
Over exploitation
and inefficient use
of forest
resources
Illicit trade in
Combat
deforestation,
desertification
and Soil
erosion
Strengthen implementation
of Ghana forest Plantation
Strategy and restore
degraded areas within and
outside forest reserves
Promote alternative
livelihoods, including eco-
tourism in forest fringe
communities.
Promote and develop
mechanisms for
transparent governance,
equity sharing and
stakeholder participation in
Goal 12. Ensure
sustainable
consumption and
production patterns
12.1 By 2030,
achieve the
sustainable
management and
efficient use of
natural resources
12.2 By 2020,
achieve the
environmentally
sound management
of chemicals and all
wastes throughout
their life cycle, in
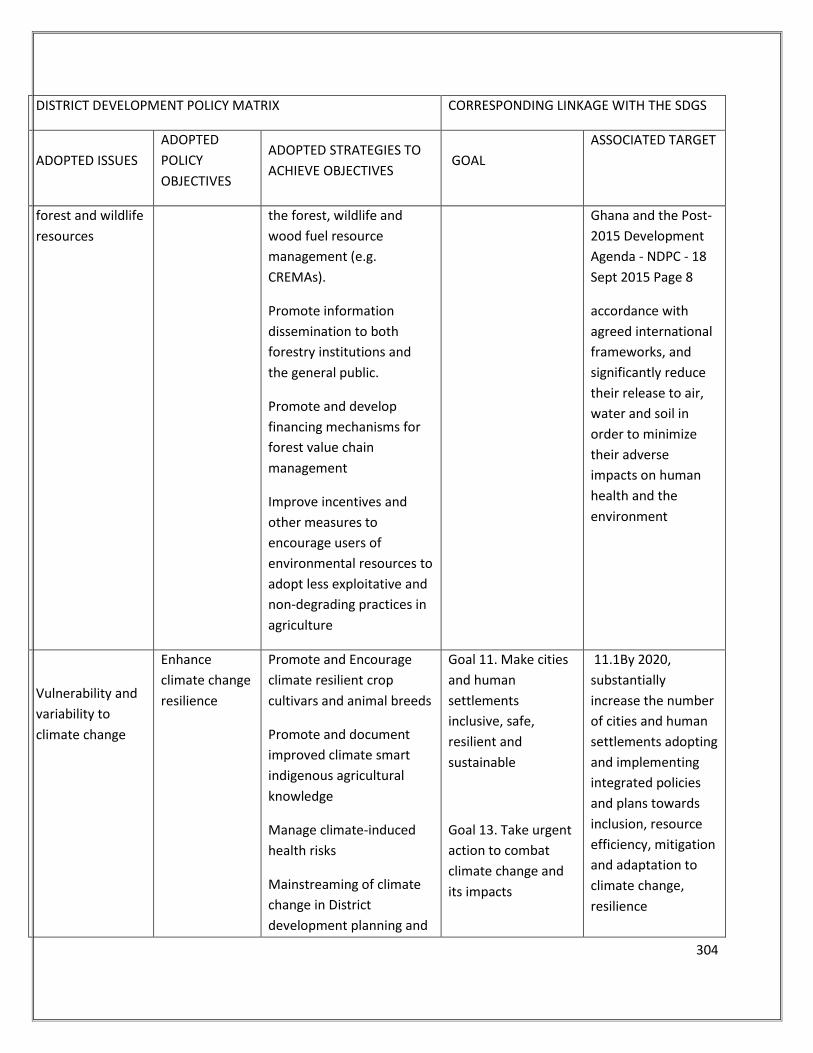
304
DISTRICT DEVELOPMENT POLICY MATRIX CORRESPONDING LINKAGE WITH THE SDGS
ADOPTED ISSUES
ADOPTED
POLICY
OBJECTIVES
ADOPTED STRATEGIES TO
ACHIEVE OBJECTIVES GOAL
ASSOCIATED TARGET
forest and wildlife
resources
the forest, wildlife and
wood fuel resource
management (e.g.
CREMAs).
Promote information
dissemination to both
forestry institutions and
the general public.
Promote and develop
financing mechanisms for
forest value chain
management
Improve incentives and
other measures to
encourage users of
environmental resources to
adopt less exploitative and
non-degrading practices in
agriculture
Ghana and the Post-
2015 Development
Agenda - NDPC - 18
Sept 2015 Page 8
accordance with
agreed international
frameworks, and
significantly reduce
their release to air,
water and soil in
order to minimize
their adverse
impacts on human
health and the
environment
Vulnerability and
variability to
climate change
Enhance
climate change
resilience
Promote and Encourage
climate resilient crop
cultivars and animal breeds
Promote and document
improved climate smart
indigenous agricultural
knowledge
Manage climate-induced
health risks
Mainstreaming of climate
change in District
development planning and
Goal 11. Make cities
and human
settlements
inclusive, safe,
resilient and
sustainable
Goal 13. Take urgent
action to combat
climate change and
its impacts
11.1By 2020,
substantially
increase the number
of cities and human
settlements adopting
and implementing
integrated policies
and plans towards
inclusion, resource
efficiency, mitigation
and adaptation to
climate change,
resilience
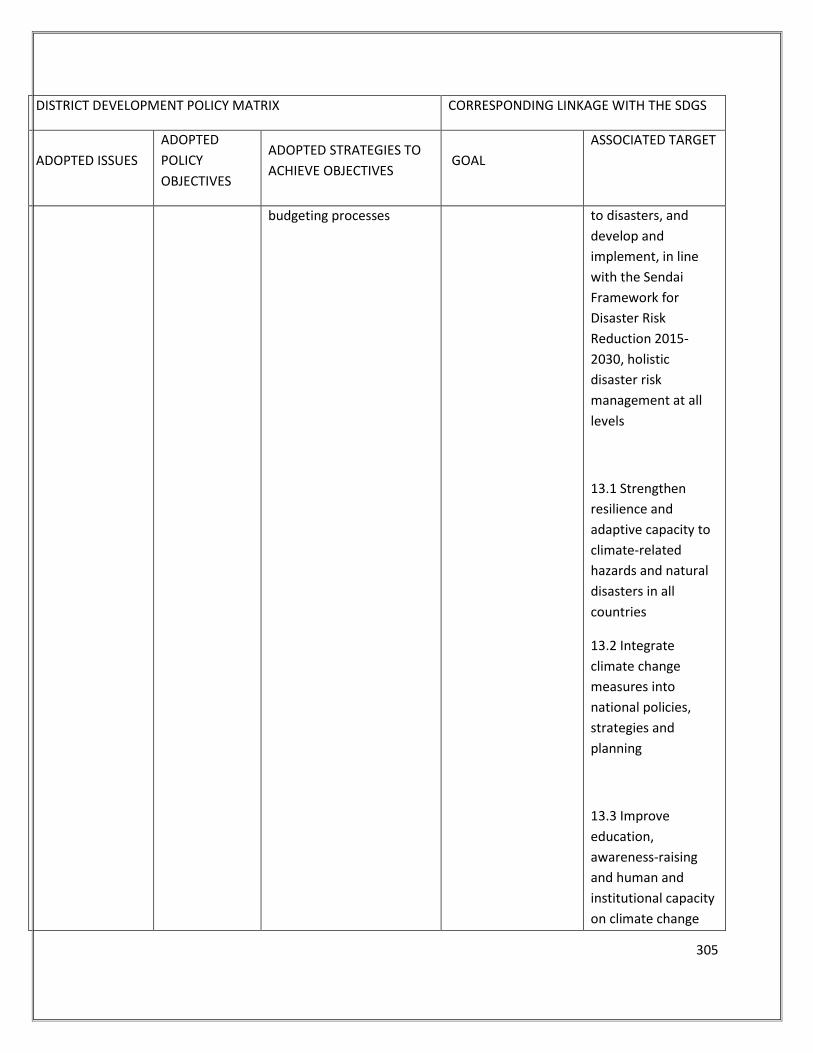
305
DISTRICT DEVELOPMENT POLICY MATRIX CORRESPONDING LINKAGE WITH THE SDGS
ADOPTED ISSUES
ADOPTED
POLICY
OBJECTIVES
ADOPTED STRATEGIES TO
ACHIEVE OBJECTIVES GOAL
ASSOCIATED TARGET
budgeting processes to disasters, and
develop and
implement, in line
with the Sendai
Framework for
Disaster Risk
Reduction 2015-
2030, holistic
disaster risk
management at all
levels
13.1 Strengthen
resilience and
adaptive capacity to
climate-related
hazards and natural
disasters in all
countries
13.2 Integrate
climate change
measures into
national policies,
strategies and
planning
13.3 Improve
education,
awareness-raising
and human and
institutional capacity
on climate change
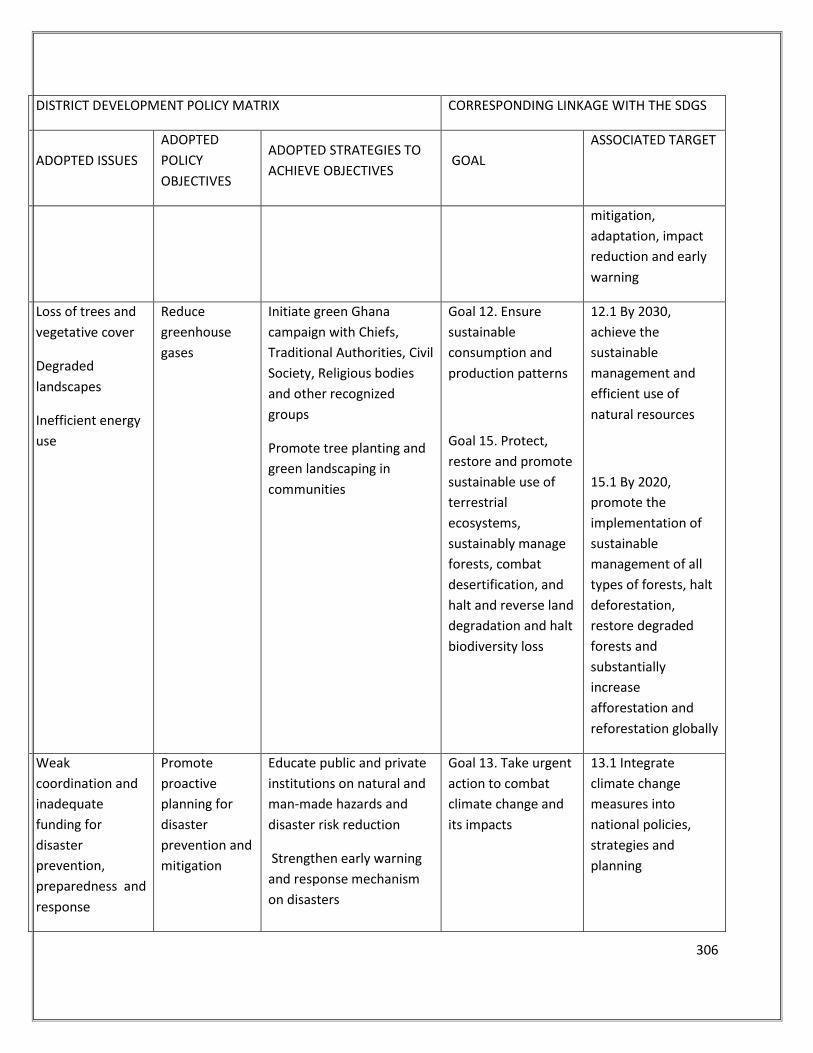
306
DISTRICT DEVELOPMENT POLICY MATRIX CORRESPONDING LINKAGE WITH THE SDGS
ADOPTED ISSUES
ADOPTED
POLICY
OBJECTIVES
ADOPTED STRATEGIES TO
ACHIEVE OBJECTIVES GOAL
ASSOCIATED TARGET
mitigation,
adaptation, impact
reduction and early
warning
Loss of trees and
vegetative cover
Degraded
landscapes
Inefficient energy
use
Reduce
greenhouse
gases
Initiate green Ghana
campaign with Chiefs,
Traditional Authorities, Civil
Society, Religious bodies
and other recognized
groups
Promote tree planting and
green landscaping in
communities
Goal 12. Ensure
sustainable
consumption and
production patterns
Goal 15. Protect,
restore and promote
sustainable use of
terrestrial
ecosystems,
sustainably manage
forests, combat
desertification, and
halt and reverse land
degradation and halt
biodiversity loss
12.1 By 2030,
achieve the
sustainable
management and
efficient use of
natural resources
15.1 By 2020,
promote the
implementation of
sustainable
management of all
types of forests, halt
deforestation,
restore degraded
forests and
substantially
increase
afforestation and
reforestation globally
Weak
coordination and
inadequate
funding for
disaster
prevention,
preparedness and
response
Promote
proactive
planning for
disaster
prevention and
mitigation
Educate public and private
institutions on natural and
man-made hazards and
disaster risk reduction
Strengthen early warning
and response mechanism
on disasters
Goal 13. Take urgent
action to combat
climate change and
its impacts
13.1 Integrate
climate change
measures into
national policies,
strategies and
planning
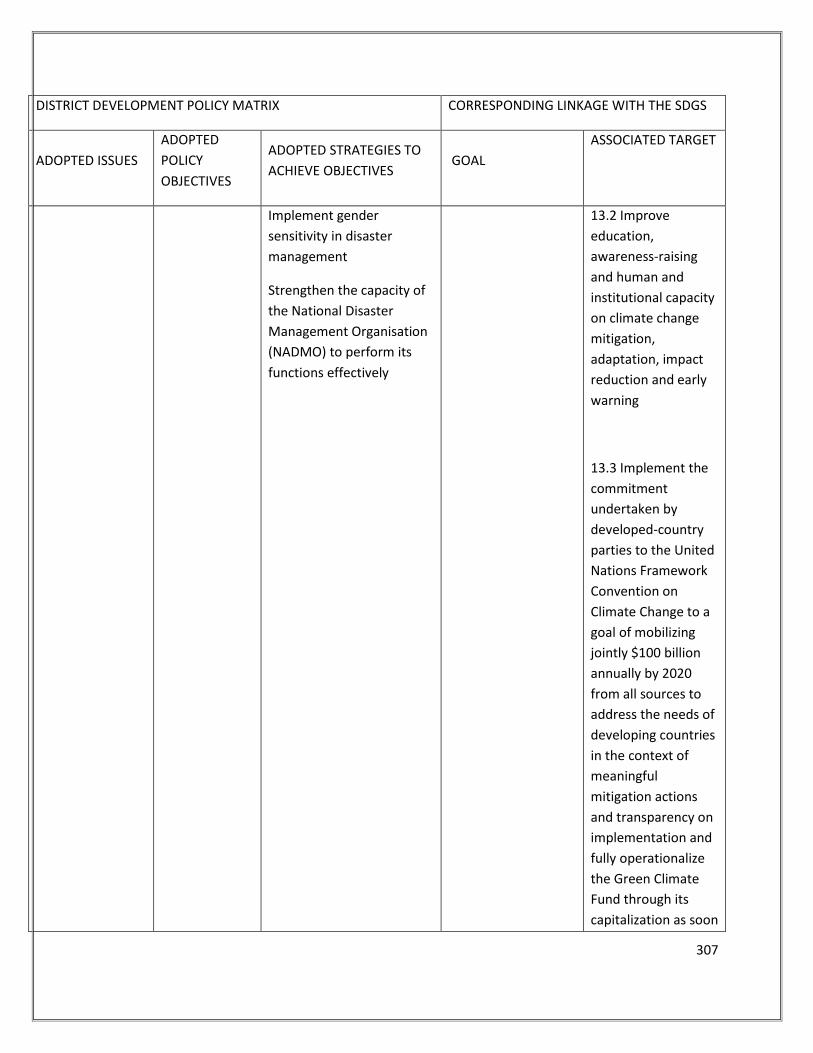
307
DISTRICT DEVELOPMENT POLICY MATRIX CORRESPONDING LINKAGE WITH THE SDGS
ADOPTED ISSUES
ADOPTED
POLICY
OBJECTIVES
ADOPTED STRATEGIES TO
ACHIEVE OBJECTIVES GOAL
ASSOCIATED TARGET
Implement gender
sensitivity in disaster
management
Strengthen the capacity of
the National Disaster
Management Organisation
(NADMO) to perform its
functions effectively
13.2 Improve
education,
awareness-raising
and human and
institutional capacity
on climate change
mitigation,
adaptation, impact
reduction and early
warning
13.3 Implement the
commitment
undertaken by
developed-country
parties to the United
Nations Framework
Convention on
Climate Change to a
goal of mobilizing
jointly $100 billion
annually by 2020
from all sources to
address the needs of
developing countries
in the context of
meaningful
mitigation actions
and transparency on
implementation and
fully operationalize
the Green Climate
Fund through its
capitalization as soon
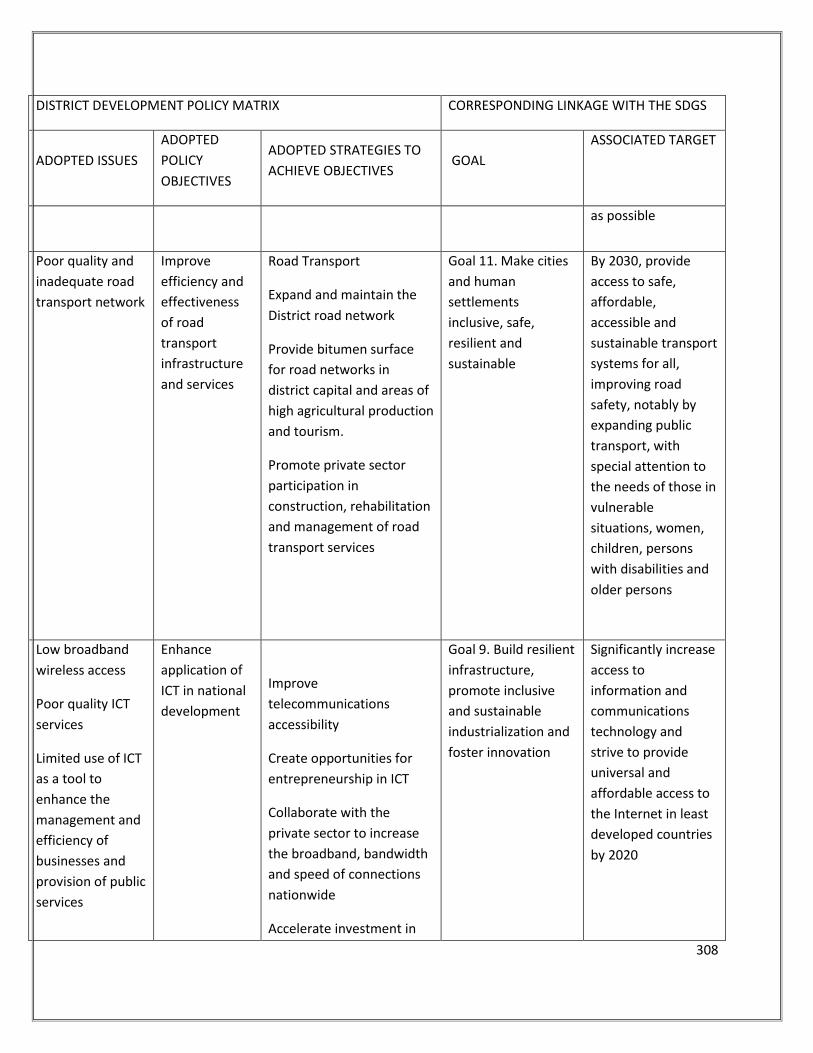
308
DISTRICT DEVELOPMENT POLICY MATRIX CORRESPONDING LINKAGE WITH THE SDGS
ADOPTED ISSUES
ADOPTED
POLICY
OBJECTIVES
ADOPTED STRATEGIES TO
ACHIEVE OBJECTIVES GOAL
ASSOCIATED TARGET
as possible
Poor quality and
inadequate road
transport network
Improve
efficiency and
effectiveness
of road
transport
infrastructure
and services
Road Transport
Expand and maintain the
District road network
Provide bitumen surface
for road networks in
district capital and areas of
high agricultural production
and tourism.
Promote private sector
participation in
construction, rehabilitation
and management of road
transport services
Goal 11. Make cities
and human
settlements
inclusive, safe,
resilient and
sustainable
By 2030, provide
access to safe,
affordable,
accessible and
sustainable transport
systems for all,
improving road
safety, notably by
expanding public
transport, with
special attention to
the needs of those in
vulnerable
situations, women,
children, persons
with disabilities and
older persons
Low broadband
wireless access
Poor quality ICT
services
Limited use of ICT
as a tool to
enhance the
management and
efficiency of
businesses and
provision of public
services
Enhance
application of
ICT in national
development
Improve
telecommunications
accessibility
Create opportunities for
entrepreneurship in ICT
Collaborate with the
private sector to increase
the broadband, bandwidth
and speed of connections
nationwide
Accelerate investment in
Goal 9. Build resilient
infrastructure,
promote inclusive
and sustainable
industrialization and
foster innovation
Significantly increase
access to
information and
communications
technology and
strive to provide
universal and
affordable access to
the Internet in least
developed countries
by 2020
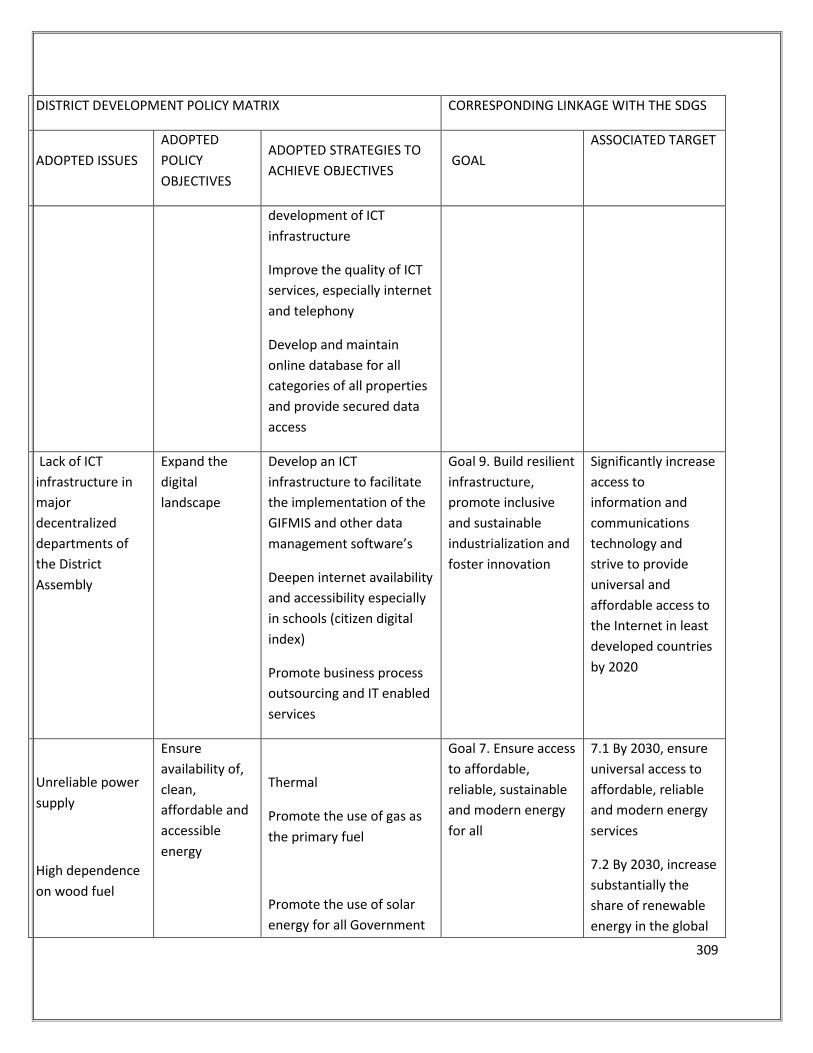
309
DISTRICT DEVELOPMENT POLICY MATRIX CORRESPONDING LINKAGE WITH THE SDGS
ADOPTED ISSUES
ADOPTED
POLICY
OBJECTIVES
ADOPTED STRATEGIES TO
ACHIEVE OBJECTIVES GOAL
ASSOCIATED TARGET
development of ICT
infrastructure
Improve the quality of ICT
services, especially internet
and telephony
Develop and maintain
online database for all
categories of all properties
and provide secured data
access
Lack of ICT
infrastructure in
major
decentralized
departments of
the District
Assembly
Expand the
digital
landscape
Develop an ICT
infrastructure to facilitate
the implementation of the
GIFMIS and other data
management software’s
Deepen internet availability
and accessibility especially
in schools (citizen digital
index)
Promote business process
outsourcing and IT enabled
services
Goal 9. Build resilient
infrastructure,
promote inclusive
and sustainable
industrialization and
foster innovation
Significantly increase
access to
information and
communications
technology and
strive to provide
universal and
affordable access to
the Internet in least
developed countries
by 2020
Unreliable power
supply
High dependence
on wood fuel
Ensure
availability of,
clean,
affordable and
accessible
energy
Thermal
Promote the use of gas as
the primary fuel
Promote the use of solar
energy for all Government
Goal 7. Ensure access
to affordable,
reliable, sustainable
and modern energy
for all
7.1 By 2030, ensure
universal access to
affordable, reliable
and modern energy
services
7.2 By 2030, increase
substantially the
share of renewable
energy in the global
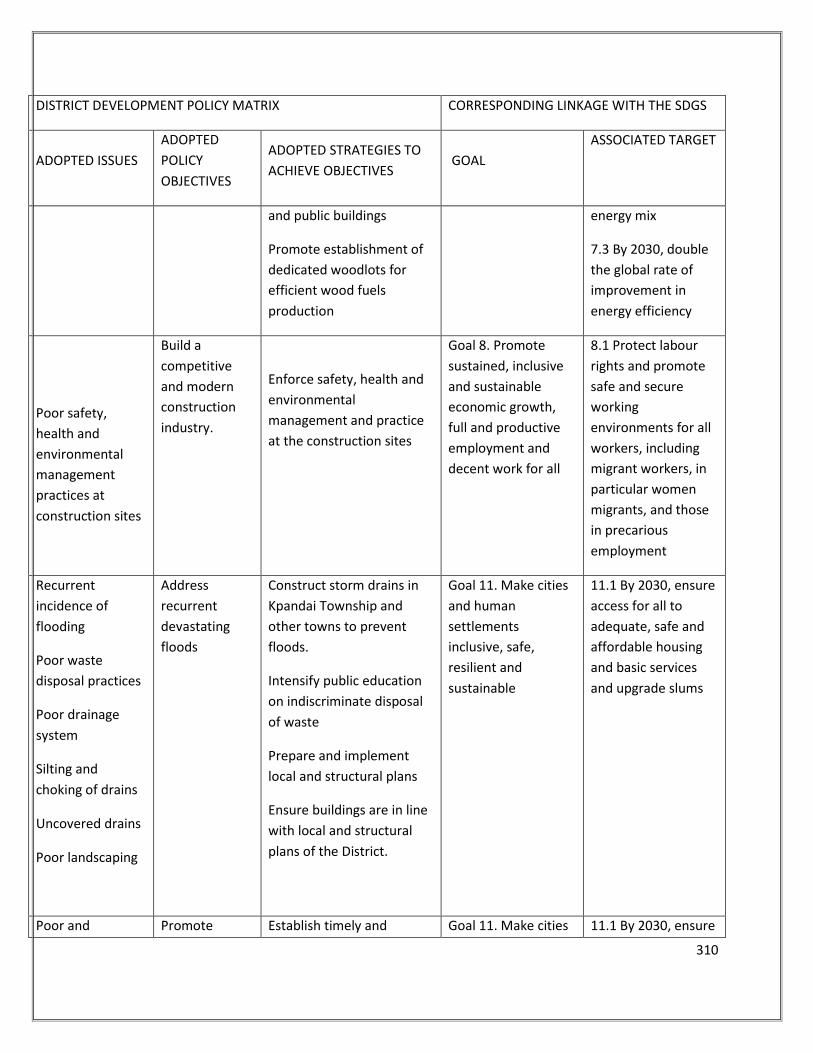
310
DISTRICT DEVELOPMENT POLICY MATRIX CORRESPONDING LINKAGE WITH THE SDGS
ADOPTED ISSUES
ADOPTED
POLICY
OBJECTIVES
ADOPTED STRATEGIES TO
ACHIEVE OBJECTIVES GOAL
ASSOCIATED TARGET
and public buildings
Promote establishment of
dedicated woodlots for
efficient wood fuels
production
energy mix
7.3 By 2030, double
the global rate of
improvement in
energy efficiency
Poor safety,
health and
environmental
management
practices at
construction sites
Build a
competitive
and modern
construction
industry.
Enforce safety, health and
environmental
management and practice
at the construction sites
Goal 8. Promote
sustained, inclusive
and sustainable
economic growth,
full and productive
employment and
decent work for all
8.1 Protect labour
rights and promote
safe and secure
working
environments for all
workers, including
migrant workers, in
particular women
migrants, and those
in precarious
employment
Recurrent
incidence of
flooding
Poor waste
disposal practices
Poor drainage
system
Silting and
choking of drains
Uncovered drains
Poor landscaping
Address
recurrent
devastating
floods
Construct storm drains in
Kpandai Township and
other towns to prevent
floods.
Intensify public education
on indiscriminate disposal
of waste
Prepare and implement
local and structural plans
Ensure buildings are in line
with local and structural
plans of the District.
Goal 11. Make cities
and human
settlements
inclusive, safe,
resilient and
sustainable
11.1 By 2030, ensure
access for all to
adequate, safe and
affordable housing
and basic services
and upgrade slums
Poor and Promote Establish timely and Goal 11. Make cities 11.1 By 2030, ensure
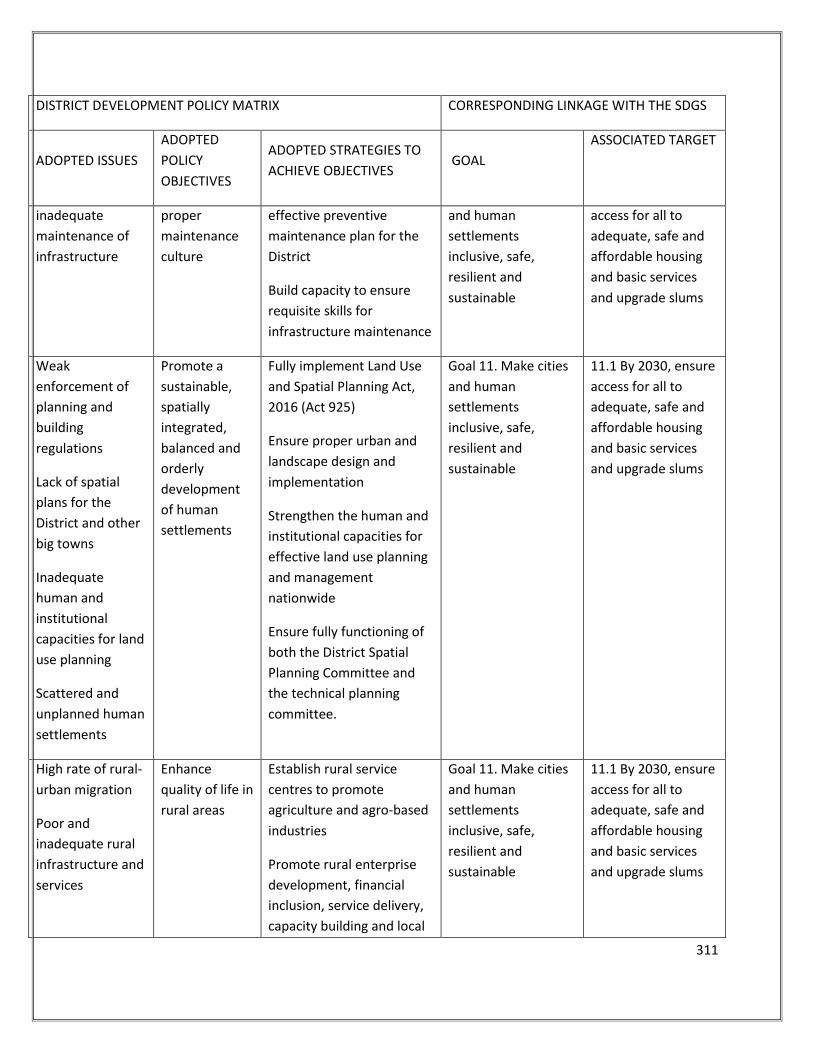
311
DISTRICT DEVELOPMENT POLICY MATRIX CORRESPONDING LINKAGE WITH THE SDGS
ADOPTED ISSUES
ADOPTED
POLICY
OBJECTIVES
ADOPTED STRATEGIES TO
ACHIEVE OBJECTIVES GOAL
ASSOCIATED TARGET
inadequate
maintenance of
infrastructure
proper
maintenance
culture
effective preventive
maintenance plan for the
District
Build capacity to ensure
requisite skills for
infrastructure maintenance
and human
settlements
inclusive, safe,
resilient and
sustainable
access for all to
adequate, safe and
affordable housing
and basic services
and upgrade slums
Weak
enforcement of
planning and
building
regulations
Lack of spatial
plans for the
District and other
big towns
Inadequate
human and
institutional
capacities for land
use planning
Scattered and
unplanned human
settlements
Promote a
sustainable,
spatially
integrated,
balanced and
orderly
development
of human
settlements
Fully implement Land Use
and Spatial Planning Act,
2016 (Act 925)
Ensure proper urban and
landscape design and
implementation
Strengthen the human and
institutional capacities for
effective land use planning
and management
nationwide
Ensure fully functioning of
both the District Spatial
Planning Committee and
the technical planning
committee.
Goal 11. Make cities
and human
settlements
inclusive, safe,
resilient and
sustainable
11.1 By 2030, ensure
access for all to
adequate, safe and
affordable housing
and basic services
and upgrade slums
High rate of rural-
urban migration
Poor and
inadequate rural
infrastructure and
services
Enhance
quality of life in
rural areas
Establish rural service
centres to promote
agriculture and agro-based
industries
Promote rural enterprise
development, financial
inclusion, service delivery,
capacity building and local
Goal 11. Make cities
and human
settlements
inclusive, safe,
resilient and
sustainable
11.1 By 2030, ensure
access for all to
adequate, safe and
affordable housing
and basic services
and upgrade slums
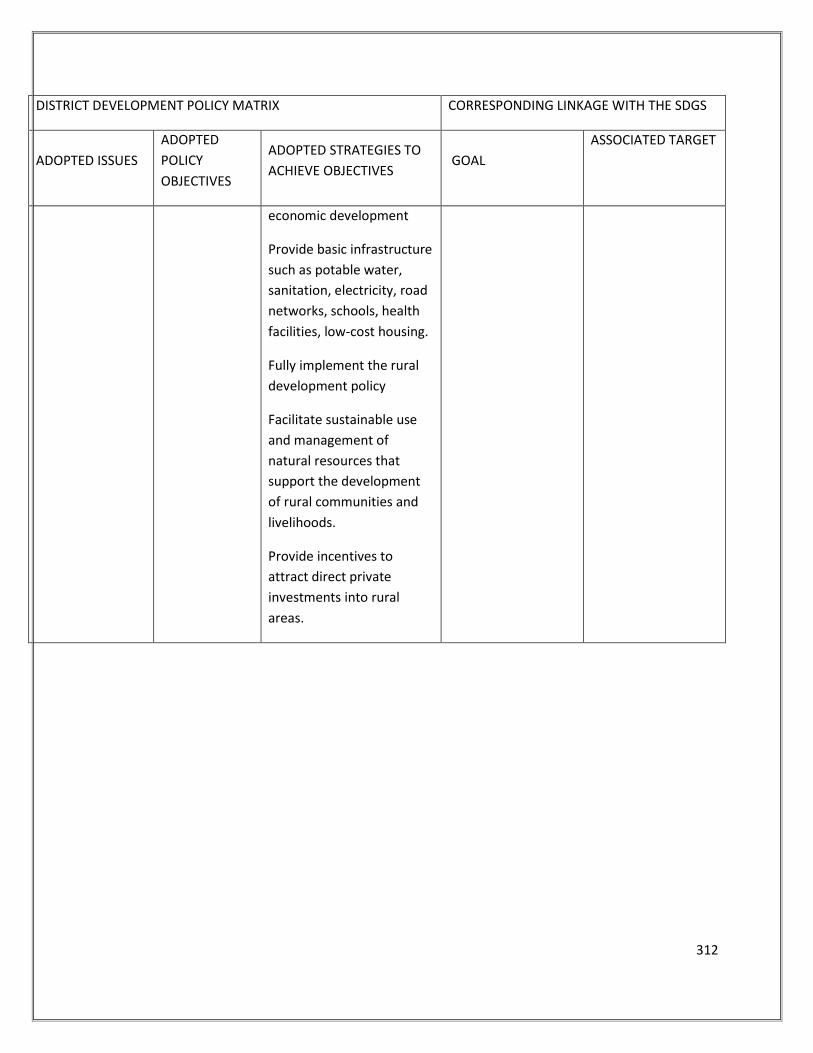
312
DISTRICT DEVELOPMENT POLICY MATRIX CORRESPONDING LINKAGE WITH THE SDGS
ADOPTED ISSUES
ADOPTED
POLICY
OBJECTIVES
ADOPTED STRATEGIES TO
ACHIEVE OBJECTIVES GOAL
ASSOCIATED TARGET
economic development
Provide basic infrastructure
such as potable water,
sanitation, electricity, road
networks, schools, health
facilities, low-cost housing.
Fully implement the rural
development policy
Facilitate sustainable use
and management of
natural resources that
support the development
of rural communities and
livelihoods.
Provide incentives to
attract direct private
investments into rural
areas.
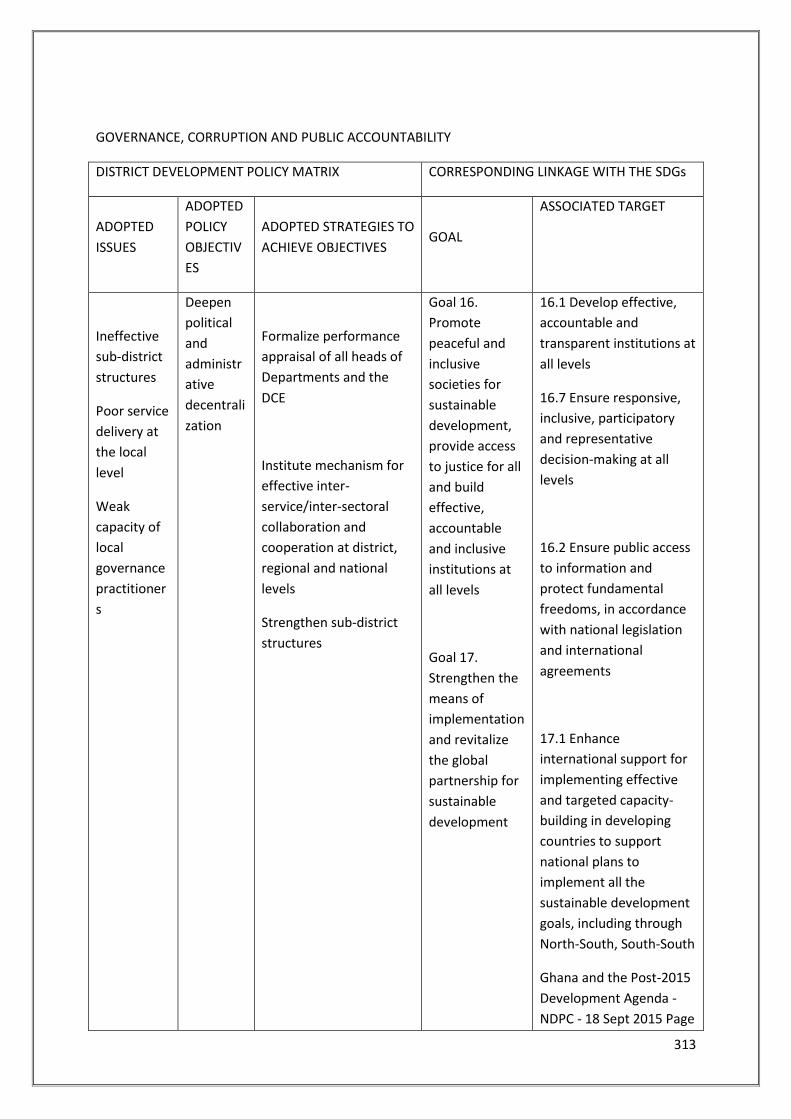
313
GOVERNANCE, CORRUPTION AND PUBLIC ACCOUNTABILITY
DISTRICT DEVELOPMENT POLICY MATRIX CORRESPONDING LINKAGE WITH THE SDGs
ADOPTED
ISSUES
ADOPTED
POLICY
OBJECTIV
ES
ADOPTED STRATEGIES TO
ACHIEVE OBJECTIVES GOAL
ASSOCIATED TARGET
Ineffective
sub-district
structures
Poor service
delivery at
the local
level
Weak
capacity of
local
governance
practitioner
s
Deepen
political
and
administr
ative
decentrali
zation
Formalize performance
appraisal of all heads of
Departments and the
DCE
Institute mechanism for
effective inter-
service/inter-sectoral
collaboration and
cooperation at district,
regional and national
levels
Strengthen sub-district
structures
Goal 16.
Promote
peaceful and
inclusive
societies for
sustainable
development,
provide access
to justice for all
and build
effective,
accountable
and inclusive
institutions at
all levels
Goal 17.
Strengthen the
means of
implementation
and revitalize
the global
partnership for
sustainable
development
16.1 Develop effective,
accountable and
transparent institutions at
all levels
16.7 Ensure responsive,
inclusive, participatory
and representative
decision-making at all
levels
16.2 Ensure public access
to information and
protect fundamental
freedoms, in accordance
with national legislation
and international
agreements
17.1 Enhance
international support for
implementing effective
and targeted capacity-
building in developing
countries to support
national plans to
implement all the
sustainable development
goals, including through
North-South, South-South
Ghana and the Post-2015
Development Agenda -
NDPC - 18 Sept 2015 Page
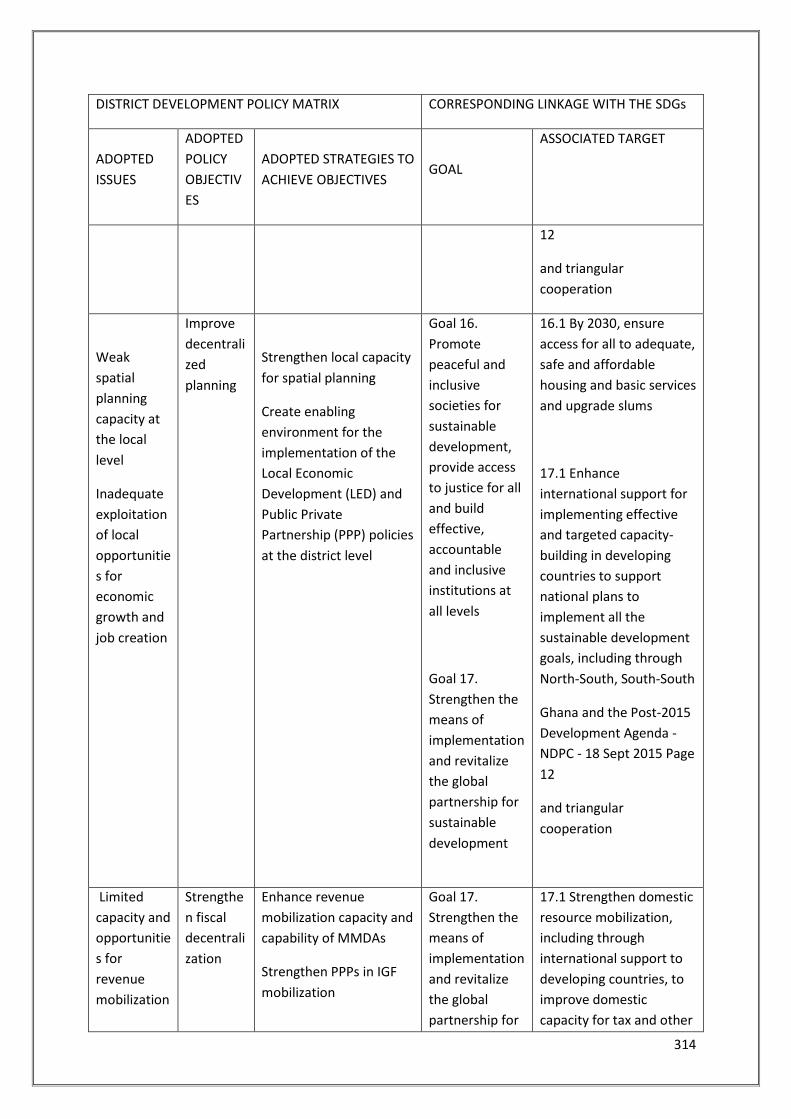
314
DISTRICT DEVELOPMENT POLICY MATRIX CORRESPONDING LINKAGE WITH THE SDGs
ADOPTED
ISSUES
ADOPTED
POLICY
OBJECTIV
ES
ADOPTED STRATEGIES TO
ACHIEVE OBJECTIVES GOAL
ASSOCIATED TARGET
12
and triangular
cooperation
Weak
spatial
planning
capacity at
the local
level
Inadequate
exploitation
of local
opportunitie
s for
economic
growth and
job creation
Improve
decentrali
zed
planning
Strengthen local capacity
for spatial planning
Create enabling
environment for the
implementation of the
Local Economic
Development (LED) and
Public Private
Partnership (PPP) policies
at the district level
Goal 16.
Promote
peaceful and
inclusive
societies for
sustainable
development,
provide access
to justice for all
and build
effective,
accountable
and inclusive
institutions at
all levels
Goal 17.
Strengthen the
means of
implementation
and revitalize
the global
partnership for
sustainable
development
16.1 By 2030, ensure
access for all to adequate,
safe and affordable
housing and basic services
and upgrade slums
17.1 Enhance
international support for
implementing effective
and targeted capacity-
building in developing
countries to support
national plans to
implement all the
sustainable development
goals, including through
North-South, South-South
Ghana and the Post-2015
Development Agenda -
NDPC - 18 Sept 2015 Page
12
and triangular
cooperation
Limited
capacity and
opportunitie
s for
revenue
mobilization
Strengthe
n fiscal
decentrali
zation
Enhance revenue
mobilization capacity and
capability of MMDAs
Strengthen PPPs in IGF
mobilization
Goal 17.
Strengthen the
means of
implementation
and revitalize
the global
partnership for
17.1 Strengthen domestic
resource mobilization,
including through
international support to
developing countries, to
improve domestic
capacity for tax and other
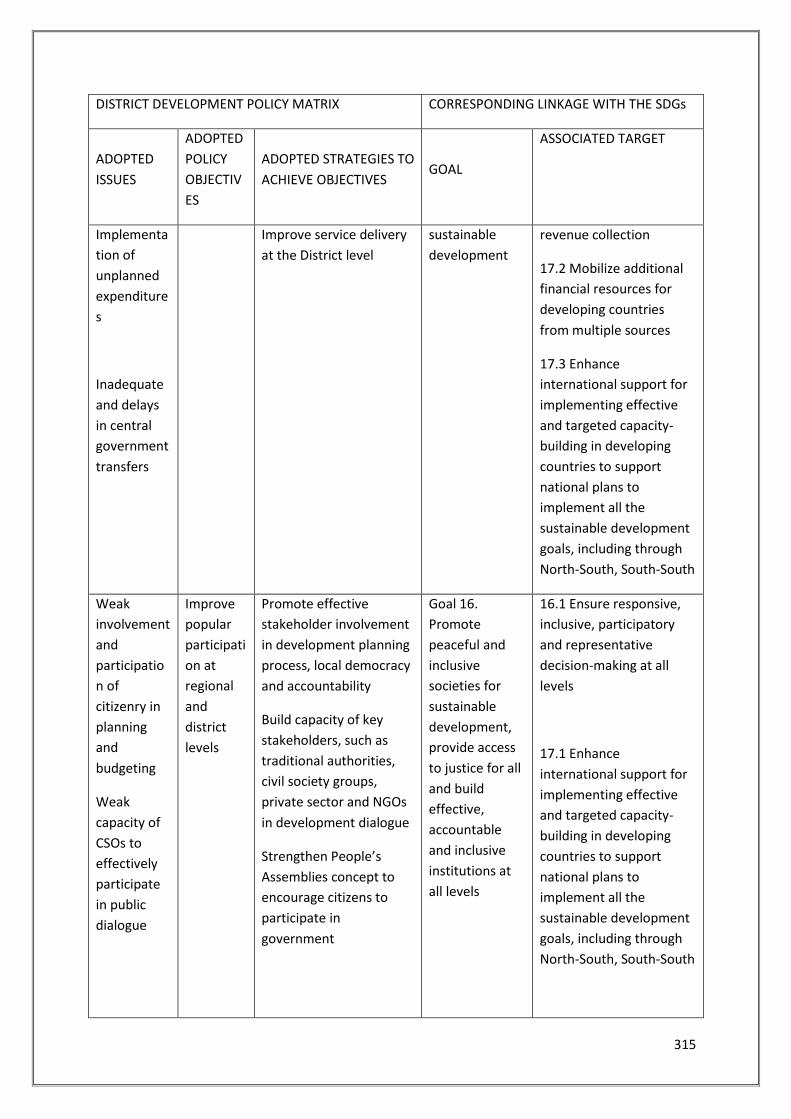
315
DISTRICT DEVELOPMENT POLICY MATRIX CORRESPONDING LINKAGE WITH THE SDGs
ADOPTED
ISSUES
ADOPTED
POLICY
OBJECTIV
ES
ADOPTED STRATEGIES TO
ACHIEVE OBJECTIVES GOAL
ASSOCIATED TARGET
Implementa
tion of
unplanned
expenditure
s
Inadequate
and delays
in central
government
transfers
Improve service delivery
at the District level
sustainable
development
revenue collection
17.2 Mobilize additional
financial resources for
developing countries
from multiple sources
17.3 Enhance
international support for
implementing effective
and targeted capacity-
building in developing
countries to support
national plans to
implement all the
sustainable development
goals, including through
North-South, South-South
Weak
involvement
and
participatio
n of
citizenry in
planning
and
budgeting
Weak
capacity of
CSOs to
effectively
participate
in public
dialogue
Improve
popular
participati
on at
regional
and
district
levels
Promote effective
stakeholder involvement
in development planning
process, local democracy
and accountability
Build capacity of key
stakeholders, such as
traditional authorities,
civil society groups,
private sector and NGOs
in development dialogue
Strengthen People’s
Assemblies concept to
encourage citizens to
participate in
government
Goal 16.
Promote
peaceful and
inclusive
societies for
sustainable
development,
provide access
to justice for all
and build
effective,
accountable
and inclusive
institutions at
all levels
16.1 Ensure responsive,
inclusive, participatory
and representative
decision-making at all
levels
17.1 Enhance
international support for
implementing effective
and targeted capacity-
building in developing
countries to support
national plans to
implement all the
sustainable development
goals, including through
North-South, South-South
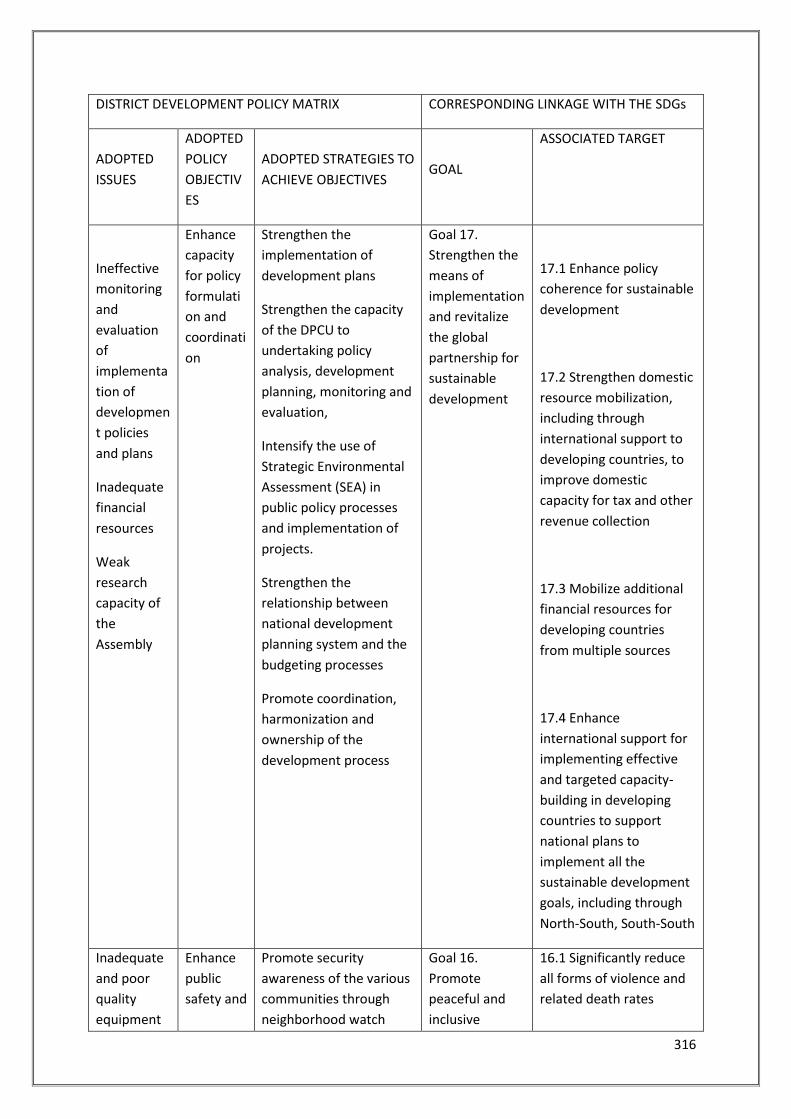
316
DISTRICT DEVELOPMENT POLICY MATRIX CORRESPONDING LINKAGE WITH THE SDGs
ADOPTED
ISSUES
ADOPTED
POLICY
OBJECTIV
ES
ADOPTED STRATEGIES TO
ACHIEVE OBJECTIVES GOAL
ASSOCIATED TARGET
Ineffective
monitoring
and
evaluation
of
implementa
tion of
developmen
t policies
and plans
Inadequate
financial
resources
Weak
research
capacity of
the
Assembly
Enhance
capacity
for policy
formulati
on and
coordinati
on
Strengthen the
implementation of
development plans
Strengthen the capacity
of the DPCU to
undertaking policy
analysis, development
planning, monitoring and
evaluation,
Intensify the use of
Strategic Environmental
Assessment (SEA) in
public policy processes
and implementation of
projects.
Strengthen the
relationship between
national development
planning system and the
budgeting processes
Promote coordination,
harmonization and
ownership of the
development process
Goal 17.
Strengthen the
means of
implementation
and revitalize
the global
partnership for
sustainable
development
17.1 Enhance policy
coherence for sustainable
development
17.2 Strengthen domestic
resource mobilization,
including through
international support to
developing countries, to
improve domestic
capacity for tax and other
revenue collection
17.3 Mobilize additional
financial resources for
developing countries
from multiple sources
17.4 Enhance
international support for
implementing effective
and targeted capacity-
building in developing
countries to support
national plans to
implement all the
sustainable development
goals, including through
North-South, South-South
Inadequate
and poor
quality
equipment
Enhance
public
safety and
Promote security
awareness of the various
communities through
neighborhood watch
Goal 16.
Promote
peaceful and
inclusive
16.1 Significantly reduce
all forms of violence and
related death rates
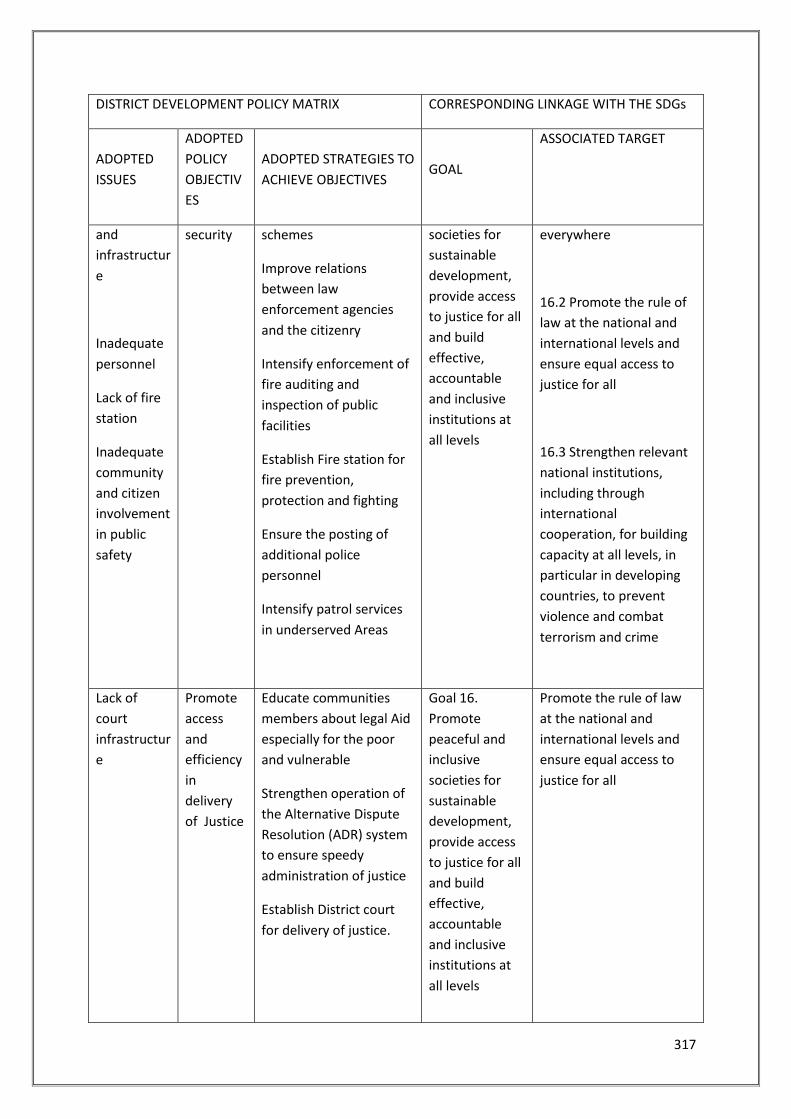
317
DISTRICT DEVELOPMENT POLICY MATRIX CORRESPONDING LINKAGE WITH THE SDGs
ADOPTED
ISSUES
ADOPTED
POLICY
OBJECTIV
ES
ADOPTED STRATEGIES TO
ACHIEVE OBJECTIVES GOAL
ASSOCIATED TARGET
and
infrastructur
e
Inadequate
personnel
Lack of fire
station
Inadequate
community
and citizen
involvement
in public
safety
security schemes
Improve relations
between law
enforcement agencies
and the citizenry
Intensify enforcement of
fire auditing and
inspection of public
facilities
Establish Fire station for
fire prevention,
protection and fighting
Ensure the posting of
additional police
personnel
Intensify patrol services
in underserved Areas
societies for
sustainable
development,
provide access
to justice for all
and build
effective,
accountable
and inclusive
institutions at
all levels
everywhere
16.2 Promote the rule of
law at the national and
international levels and
ensure equal access to
justice for all
16.3 Strengthen relevant
national institutions,
including through
international
cooperation, for building
capacity at all levels, in
particular in developing
countries, to prevent
violence and combat
terrorism and crime
Lack of
court
infrastructur
e
Promote
access
and
efficiency
in
delivery
of Justice
Educate communities
members about legal Aid
especially for the poor
and vulnerable
Strengthen operation of
the Alternative Dispute
Resolution (ADR) system
to ensure speedy
administration of justice
Establish District court
for delivery of justice.
Goal 16.
Promote
peaceful and
inclusive
societies for
sustainable
development,
provide access
to justice for all
and build
effective,
accountable
and inclusive
institutions at
all levels
Promote the rule of law
at the national and
international levels and
ensure equal access to
justice for all
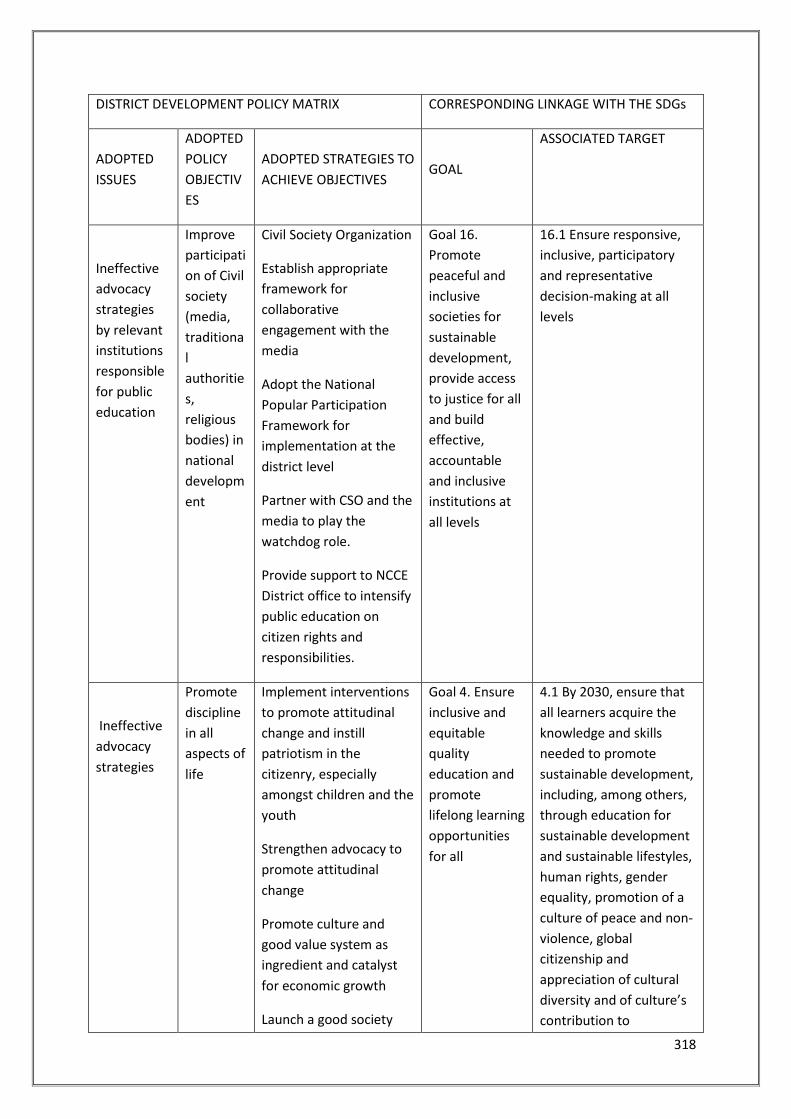
318
DISTRICT DEVELOPMENT POLICY MATRIX CORRESPONDING LINKAGE WITH THE SDGs
ADOPTED
ISSUES
ADOPTED
POLICY
OBJECTIV
ES
ADOPTED STRATEGIES TO
ACHIEVE OBJECTIVES GOAL
ASSOCIATED TARGET
Ineffective
advocacy
strategies
by relevant
institutions
responsible
for public
education
Improve
participati
on of Civil
society
(media,
traditiona
l
authoritie
s,
religious
bodies) in
national
developm
ent
Civil Society Organization
Establish appropriate
framework for
collaborative
engagement with the
media
Adopt the National
Popular Participation
Framework for
implementation at the
district level
Partner with CSO and the
media to play the
watchdog role.
Provide support to NCCE
District office to intensify
public education on
citizen rights and
responsibilities.
Goal 16.
Promote
peaceful and
inclusive
societies for
sustainable
development,
provide access
to justice for all
and build
effective,
accountable
and inclusive
institutions at
all levels
16.1 Ensure responsive,
inclusive, participatory
and representative
decision-making at all
levels
Ineffective
advocacy
strategies
Promote
discipline
in all
aspects of
life
Implement interventions
to promote attitudinal
change and instill
patriotism in the
citizenry, especially
amongst children and the
youth
Strengthen advocacy to
promote attitudinal
change
Promote culture and
good value system as
ingredient and catalyst
for economic growth
Launch a good society
Goal 4. Ensure
inclusive and
equitable
quality
education and
promote
lifelong learning
opportunities
for all
4.1 By 2030, ensure that
all learners acquire the
knowledge and skills
needed to promote
sustainable development,
including, among others,
through education for
sustainable development
and sustainable lifestyles,
human rights, gender
equality, promotion of a
culture of peace and non-
violence, global
citizenship and
appreciation of cultural
diversity and of culture’s
contribution to
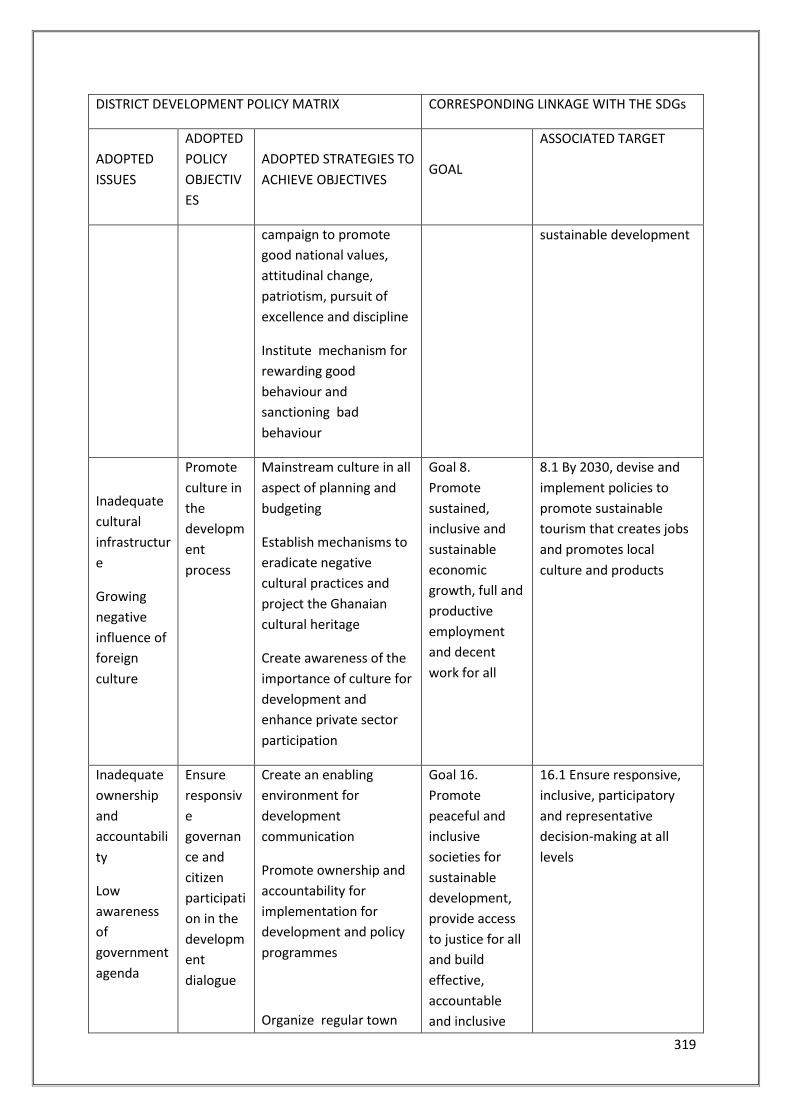
319
DISTRICT DEVELOPMENT POLICY MATRIX CORRESPONDING LINKAGE WITH THE SDGs
ADOPTED
ISSUES
ADOPTED
POLICY
OBJECTIV
ES
ADOPTED STRATEGIES TO
ACHIEVE OBJECTIVES GOAL
ASSOCIATED TARGET
campaign to promote
good national values,
attitudinal change,
patriotism, pursuit of
excellence and discipline
Institute mechanism for
rewarding good
behaviour and
sanctioning bad
behaviour
sustainable development
Inadequate
cultural
infrastructur
e
Growing
negative
influence of
foreign
culture
Promote
culture in
the
developm
ent
process
Mainstream culture in all
aspect of planning and
budgeting
Establish mechanisms to
eradicate negative
cultural practices and
project the Ghanaian
cultural heritage
Create awareness of the
importance of culture for
development and
enhance private sector
participation
Goal 8.
Promote
sustained,
inclusive and
sustainable
economic
growth, full and
productive
employment
and decent
work for all
8.1 By 2030, devise and
implement policies to
promote sustainable
tourism that creates jobs
and promotes local
culture and products
Inadequate
ownership
and
accountabili
ty
Low
awareness
of
government
agenda
Ensure
responsiv
e
governan
ce and
citizen
participati
on in the
developm
ent
dialogue
Create an enabling
environment for
development
communication
Promote ownership and
accountability for
implementation for
development and policy
programmes
Organize regular town
Goal 16.
Promote
peaceful and
inclusive
societies for
sustainable
development,
provide access
to justice for all
and build
effective,
accountable
and inclusive
16.1 Ensure responsive,
inclusive, participatory
and representative
decision-making at all
levels
320
DISTRICT DEVELOPMENT POLICY MATRIX CORRESPONDING LINKAGE WITH THE SDGs
ADOPTED
ISSUES
ADOPTED
POLICY
OBJECTIV
ES
ADOPTED STRATEGIES TO
ACHIEVE OBJECTIVES GOAL
ASSOCIATED TARGET
hall meetings institutions at
all levels
321
CHAPTER FOUR
4.0 DEVELOPMENT PROGRAMMES
4.1 Introduction
This chapter is devoted to the generation of specific development activities or programmes that are
anticipated to contribute to and promote the achievement of the development objectives, Strategies
and goals.
After the analysis of the district’s problems, potentials, opportunities, constraints and challenges
pertaining to prioritised development issues, formulation of development goals, objectives and
strategies which are consistent with the developmental needs and aspirations of the people of the
district. There is the need to generate district specific programmes for the attainment of the goals
and objectives of the people.
4.2 Composite Programme of Action Using the format provided by the NDPC guidelines on the preparation of the DMTDP, the following
programme of activities have been packaged under each pillar of the Agenda for Jobs: Creating
Prosperity and Equal Opportunity for All
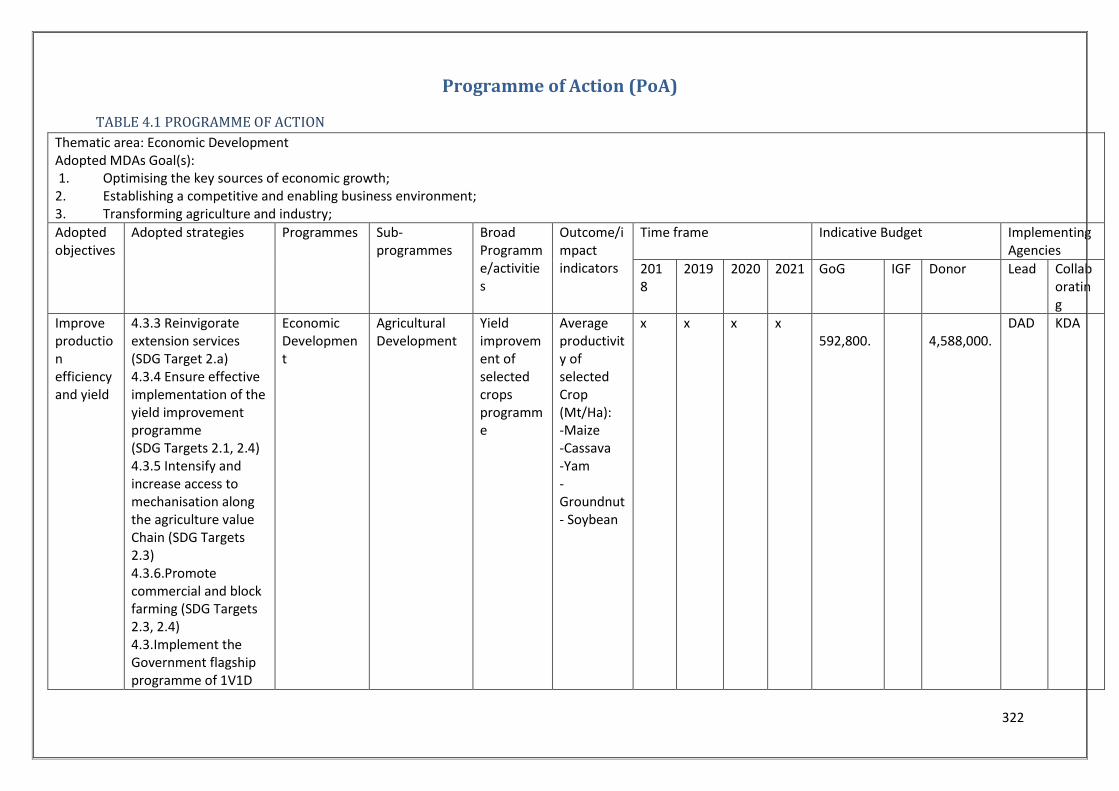
322
Programme of Action (PoA)
TABLE 4.1 PROGRAMME OF ACTION
Thematic area: Economic Development Adopted MDAs Goal(s): 1. Optimising the key sources of economic growth; 2. Establishing a competitive and enabling business environment; 3. Transforming agriculture and industry;
Adopted objectives
Adopted strategies Programmes Sub-programmes
Broad Programme/activities
Outcome/impact indicators
Time frame Indicative Budget Implementing Agencies
2018
2019 2020 2021 GoG IGF Donor Lead Collaborating
Improve production efficiency and yield
4.3.3 Reinvigorate extension services (SDG Target 2.a) 4.3.4 Ensure effective implementation of the yield improvement programme (SDG Targets 2.1, 2.4) 4.3.5 Intensify and increase access to mechanisation along the agriculture value Chain (SDG Targets 2.3) 4.3.6.Promote commercial and block farming (SDG Targets 2.3, 2.4) 4.3.Implement the Government flagship programme of 1V1D
Economic Development
Agricultural Development
Yield improvement of selected crops programme
Average productivity of selected Crop (Mt/Ha): -Maize -Cassava -Yam - Groundnut - Soybean
x x x x 592,800.
4,588,000.
DAD KDA
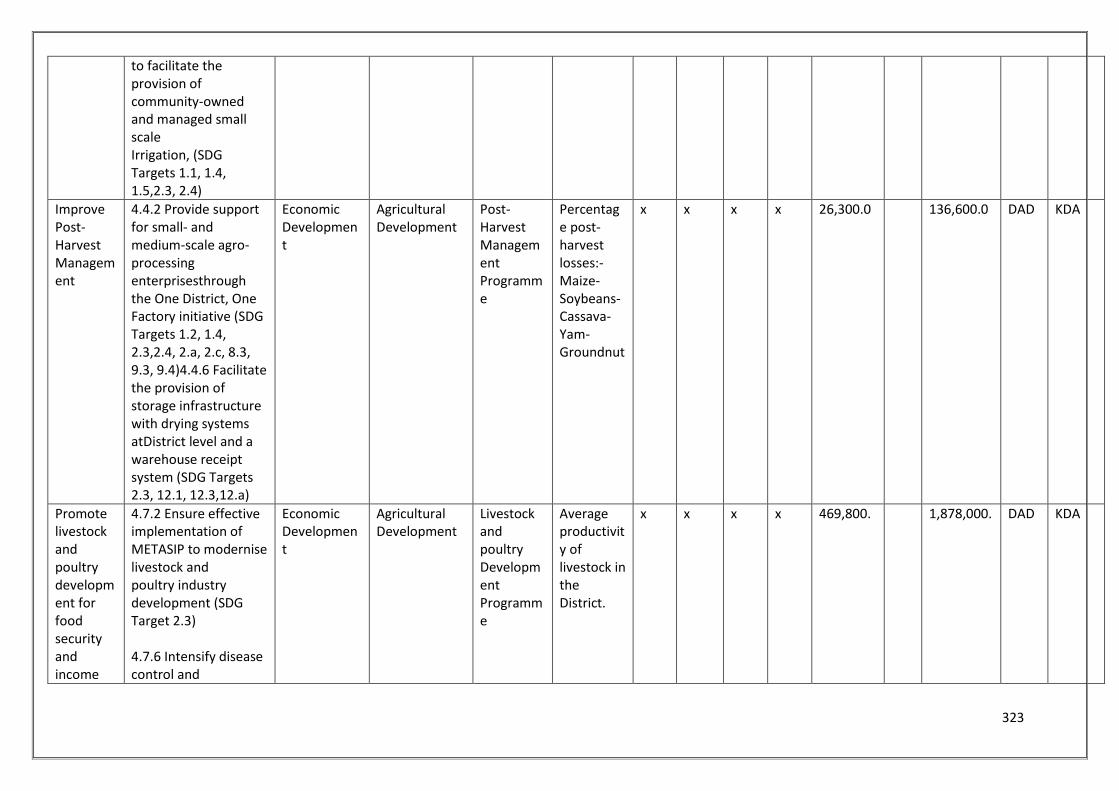
323
to facilitate the provision of community-owned and managed small scale Irrigation, (SDG Targets 1.1, 1.4, 1.5,2.3, 2.4)
Improve Post-Harvest Management
4.4.2 Provide support for small- and medium-scale agro-processing enterprisesthrough the One District, One Factory initiative (SDG Targets 1.2, 1.4, 2.3,2.4, 2.a, 2.c, 8.3, 9.3, 9.4)4.4.6 Facilitate the provision of storage infrastructure with drying systems atDistrict level and a warehouse receipt system (SDG Targets 2.3, 12.1, 12.3,12.a)
Economic Development
Agricultural Development
Post-Harvest Management Programme
Percentage post-harvest losses:- Maize- Soybeans- Cassava- Yam-Groundnut
x x x x 26,300.0 136,600.0 DAD KDA
Promote livestock and poultry development for food security and income
4.7.2 Ensure effective implementation of METASIP to modernise livestock and poultry industry development (SDG Target 2.3) 4.7.6 Intensify disease control and
Economic Development
Agricultural Development
Livestock and poultry Development Programme
Average productivity of livestock in the District.
x x x x 469,800. 1,878,000. DAD KDA
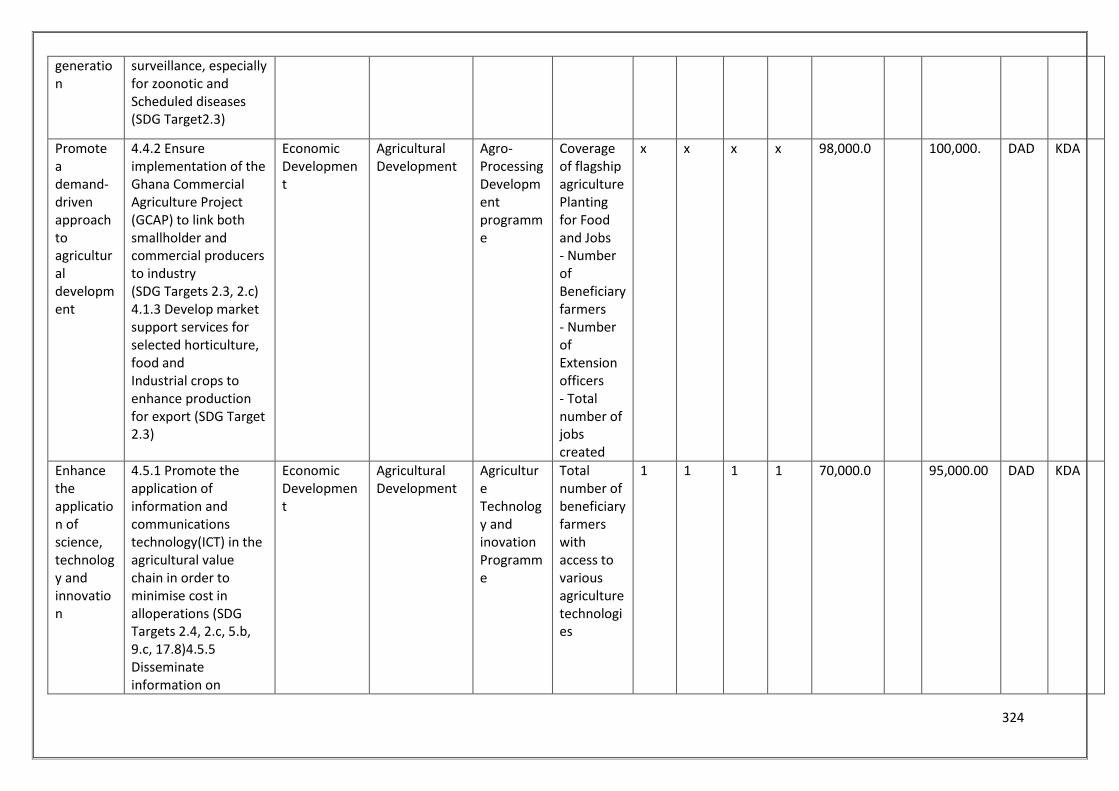
324
generation
surveillance, especially for zoonotic and Scheduled diseases (SDG Target2.3)
Promote a demand-driven approach to agricultural development
4.4.2 Ensure implementation of the Ghana Commercial Agriculture Project (GCAP) to link both smallholder and commercial producers to industry (SDG Targets 2.3, 2.c) 4.1.3 Develop market support services for selected horticulture, food and Industrial crops to enhance production for export (SDG Target 2.3)
Economic Development
Agricultural Development
Agro-Processing Development programme
Coverage of flagship agriculture Planting for Food and Jobs - Number of Beneficiary farmers - Number of Extension officers - Total number of jobs created
x x x x 98,000.0 100,000. DAD KDA
Enhance the application of science, technology and innovation
4.5.1 Promote the application of information and communications technology(ICT) in the agricultural value chain in order to minimise cost in alloperations (SDG Targets 2.4, 2.c, 5.b, 9.c, 17.8)4.5.5 Disseminate information on
Economic Development
Agricultural Development
Agriculture Technology and inovation Programme
Total number of beneficiaryfarmers with access to various agriculture technologies
1 1 1 1 70,000.0 95,000.00 DAD KDA
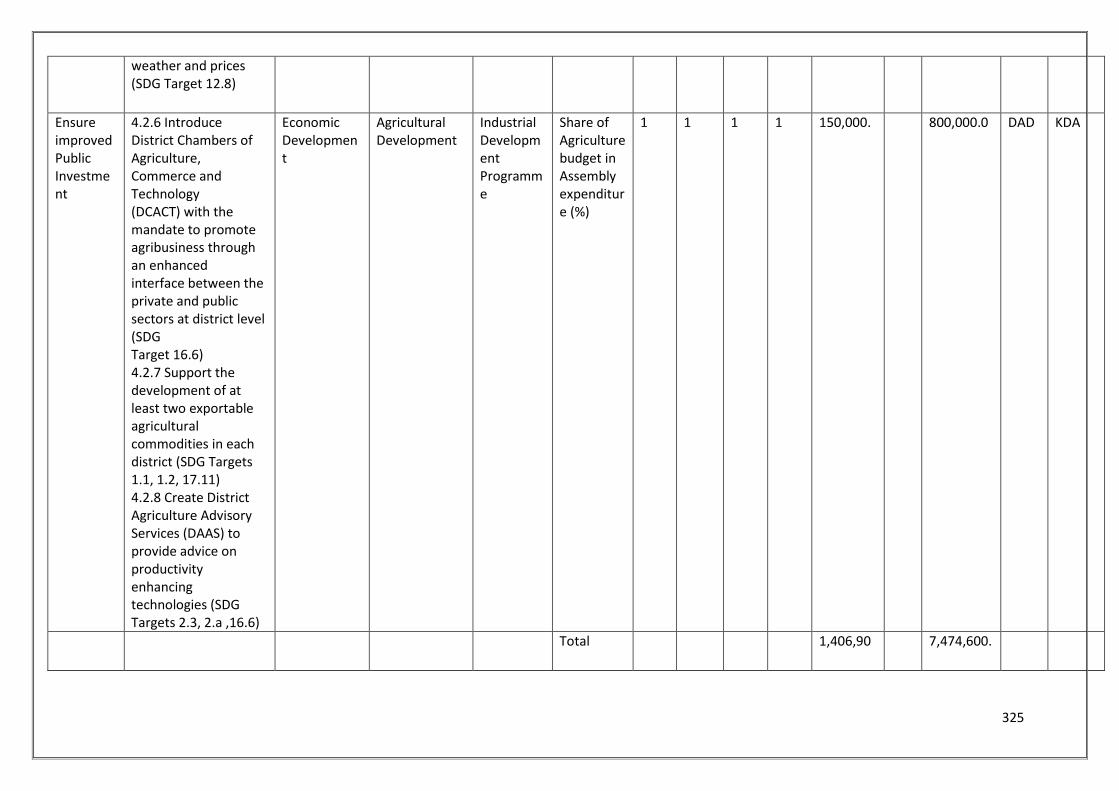
325
weather and prices (SDG Target 12.8)
Ensure improved Public Investment
4.2.6 Introduce District Chambers of Agriculture, Commerce and Technology (DCACT) with the mandate to promote agribusiness through an enhanced interface between the private and public sectors at district level (SDG Target 16.6) 4.2.7 Support the development of at least two exportable agricultural commodities in each district (SDG Targets 1.1, 1.2, 17.11) 4.2.8 Create District Agriculture Advisory Services (DAAS) to provide advice on productivity enhancing technologies (SDG Targets 2.3, 2.a ,16.6)
Economic Development
Agricultural Development
Industrial Development Programme
Share of Agriculture budget in Assembly expenditure (%)
1 1 1 1 150,000. 800,000.0 DAD KDA
Total 1,406,90 7,474,600.
326
CHAPTER FIVE
5.0 Annual Action Plans of the Kpandai District Assembly
5.1 Introduction This Chapter provides details action plans for various years under the 2018-2021 MTDP as well as
information on structural and local plans. Current government policies on decentralization indicate that
District Assemblies, as Planning Authorities, are fully responsible for the formulation, implementation,
monitoring and evaluation of policies, programs and projects within their areas of jurisdiction (Act 462).
This means that the KPDA together with all its agencies or departments has a primary responsibility for
the plan implementation and assessment of project impacts. This responsibility of the Assembly is led
by the District Planning and Coordinating Unit (DPCU), which has a frontline responsibility for the
coordination of plan implementation. The Regional Planning and Coordinating Unit, financiers of
activities and other relevant bodies support this effort.
The Annual Action Plans for the years 2018-2021 are contained herewith. The District Assembly will
ensure that there is little deviation, if any.
5.2 The District Assembly The District Assembly is charged with the overall responsibility for the process of implementation,
monitoring and evaluation of the programs and projects. Tapping available Human and Technical
resources of the DPCU and all other relevant agencies can enhance performance of this role. The
District Assembly is to perform the following specific functions.
Generation and provision of funds for selected projects
Setting up a framework and platform for co-ordination and co-operation among the institutions involved
in the implementation of the plan
Identification of bottlenecks and provision of appropriate antidotes
Identification, invitation and attraction of potential donors into the area
Periodic revision of plan implementation procedures and effective adjustments in response to changing
circumstances
327
5.3 Decentralized Departments and Agencies The Departments and agencies as major actors in the process of implementation, monitoring and
evaluation will provide technical support and facilitate appropriate procedures for the execution of
programs and projects.
5.4 Financing Agencies and Non-Governmental Organizations (NGOs) Development Partners play a key role in the development of not only KPDA but also Ghana at large.
Financing development initiatives is a known significant constraining factor in the district development
effort. A greater proportion of the plan is expected to be financed through donor agencies and Non-
Governmental Organizations (NGOs). It is therefore expected that donors and financiers will find
interest in the District Medium-Term Development Plan and contribute substantially to its
implementation by increasing budget allocation to the KPDA considering its numerous developmental
problems.
5.5 Regional Coordinating Council It is expected that the RCC through its Regional Planning Coordinating Unit (RPCU) is expected to
support the KPDA in the provision of technical backstopping, direction, monitoring and evaluation of the
implementation of the plan.
5.6 Mobilization of Funds In a bid to mobilize funds, the following approaches may yield the desired results:
Encourage and train various actors especially the Town and Area Councils to develop project proposals
based on the plan to raise funds
Encourage corporate bodies such as financial institutions and other profit making organizations to
respond to their social responsibilities by supporting the KPDA Development Plan.
Disseminate the plan at sub-district and community levels to solicit support and commitment for
successful implementation
It is expected that the KPDA, with support from the RCC will market this Development oriented plan
both locally and externally in order to raise funds and mobilize requisite skills for its implementation.
Organizations operating in the KPDA and beyond should be aware of the existence of this plan especially
aspects that relate to their operational areas or sectors.
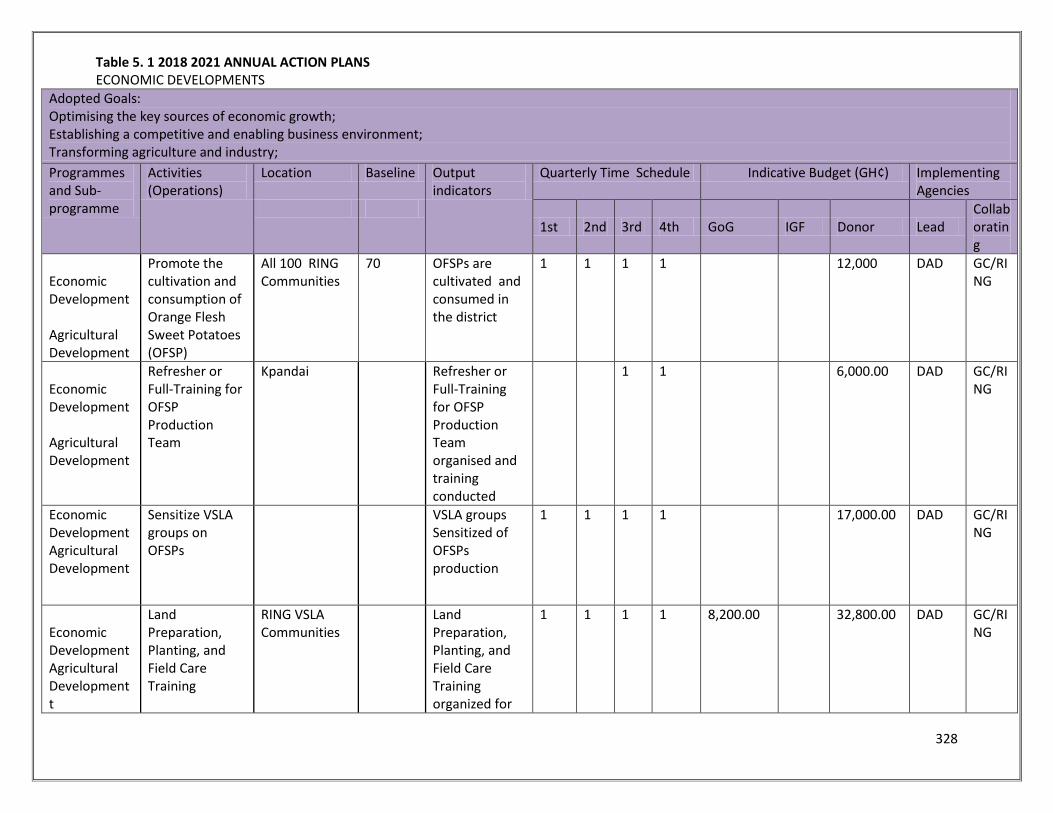
328
Table 5. 1 2018 2021 ANNUAL ACTION PLANS ECONOMIC DEVELOPMENTS
Adopted Goals: Optimising the key sources of economic growth; Establishing a competitive and enabling business environment; Transforming agriculture and industry;
Programmes and Sub-programme
Activities (Operations)
Location Baseline Output indicators
Quarterly Time Schedule Indicative Budget (GH¢) Implementing Agencies
1st 2nd 3rd 4th GoG IGF Donor Lead
Collaborating
Economic Development Agricultural Development
Promote the cultivation and consumption of Orange Flesh Sweet Potatoes (OFSP)
All 100 RING Communities
70 OFSPs are cultivated and consumed in the district
1 1 1 1 12,000 DAD GC/RING
Economic Development Agricultural Development
Refresher or Full-Training for OFSP Production Team
Kpandai Refresher or Full-Training for OFSP Production Team organised and training conducted
1 1 6,000.00 DAD GC/RING
Economic Development Agricultural Development
Sensitize VSLA groups on OFSPs
VSLA groups Sensitized of OFSPs production
1 1 1 1 17,000.00 DAD GC/RING
Economic Development Agricultural Development t
Land Preparation, Planting, and Field Care Training
RING VSLA Communities
Land Preparation, Planting, and Field Care Training organized for
1 1 1 1 8,200.00 32,800.00 DAD GC/RING
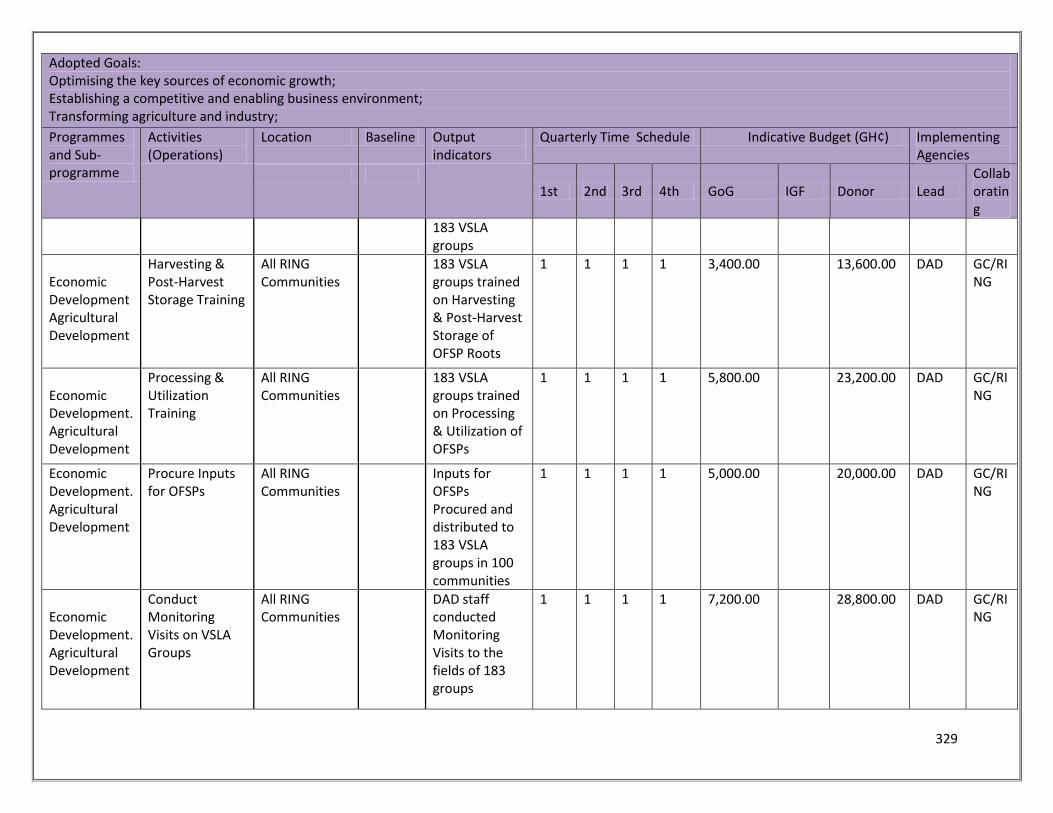
329
Adopted Goals: Optimising the key sources of economic growth; Establishing a competitive and enabling business environment; Transforming agriculture and industry;
Programmes and Sub-programme
Activities (Operations)
Location Baseline Output indicators
Quarterly Time Schedule Indicative Budget (GH¢) Implementing Agencies
1st 2nd 3rd 4th GoG IGF Donor Lead
Collaborating
183 VSLA groups
Economic Development Agricultural Development
Harvesting & Post-Harvest Storage Training
All RING Communities
183 VSLA groups trained on Harvesting & Post-Harvest Storage of OFSP Roots
1 1 1 1 3,400.00 13,600.00 DAD GC/RING
Economic Development. Agricultural Development
Processing & Utilization Training
All RING Communities
183 VSLA groups trained on Processing & Utilization of OFSPs
1 1 1 1 5,800.00 23,200.00 DAD GC/RING
Economic Development. Agricultural Development
Procure Inputs for OFSPs
All RING Communities
Inputs for OFSPs Procured and distributed to 183 VSLA groups in 100 communities
1 1 1 1 5,000.00 20,000.00 DAD GC/RING
Economic Development. Agricultural Development
Conduct Monitoring Visits on VSLA Groups
All RING Communities
DAD staff conducted Monitoring Visits to the fields of 183 groups
1 1 1 1 7,200.00 28,800.00 DAD GC/RING
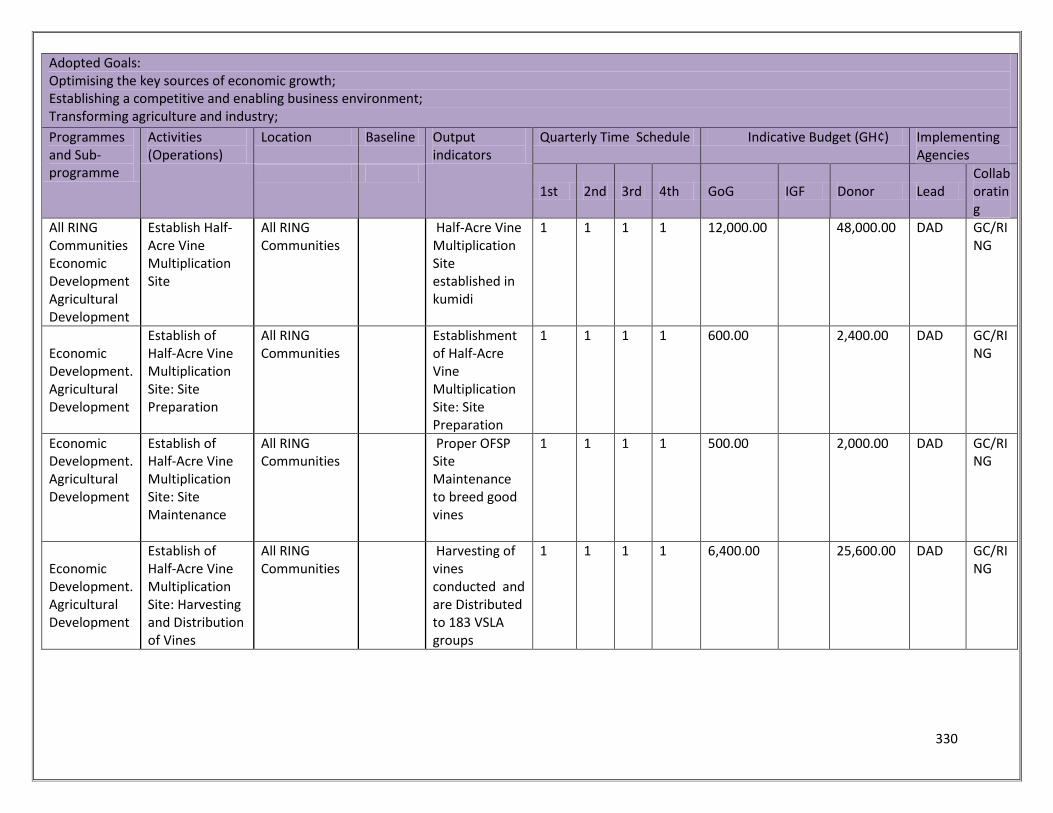
330
Adopted Goals: Optimising the key sources of economic growth; Establishing a competitive and enabling business environment; Transforming agriculture and industry;
Programmes and Sub-programme
Activities (Operations)
Location Baseline Output indicators
Quarterly Time Schedule Indicative Budget (GH¢) Implementing Agencies
1st 2nd 3rd 4th GoG IGF Donor Lead
Collaborating
All RING Communities Economic Development Agricultural Development
Establish Half-Acre Vine Multiplication Site
All RING Communities
Half-Acre Vine Multiplication Site established in kumidi
1 1 1 1 12,000.00 48,000.00 DAD GC/RING
Economic Development. Agricultural Development
Establish of Half-Acre Vine Multiplication Site: Site Preparation
All RING Communities
Establishment of Half-Acre Vine Multiplication Site: Site Preparation
1 1 1 1 600.00 2,400.00 DAD GC/RING
Economic Development. Agricultural Development
Establish of Half-Acre Vine Multiplication Site: Site Maintenance
All RING Communities
Proper OFSP Site Maintenance to breed good vines
1 1 1 1 500.00 2,000.00 DAD GC/RING
Economic Development. Agricultural Development
Establish of Half-Acre Vine Multiplication Site: Harvesting and Distribution of Vines
All RING Communities
Harvesting of vines conducted and are Distributed to 183 VSLA groups
1 1 1 1 6,400.00 25,600.00 DAD GC/RING
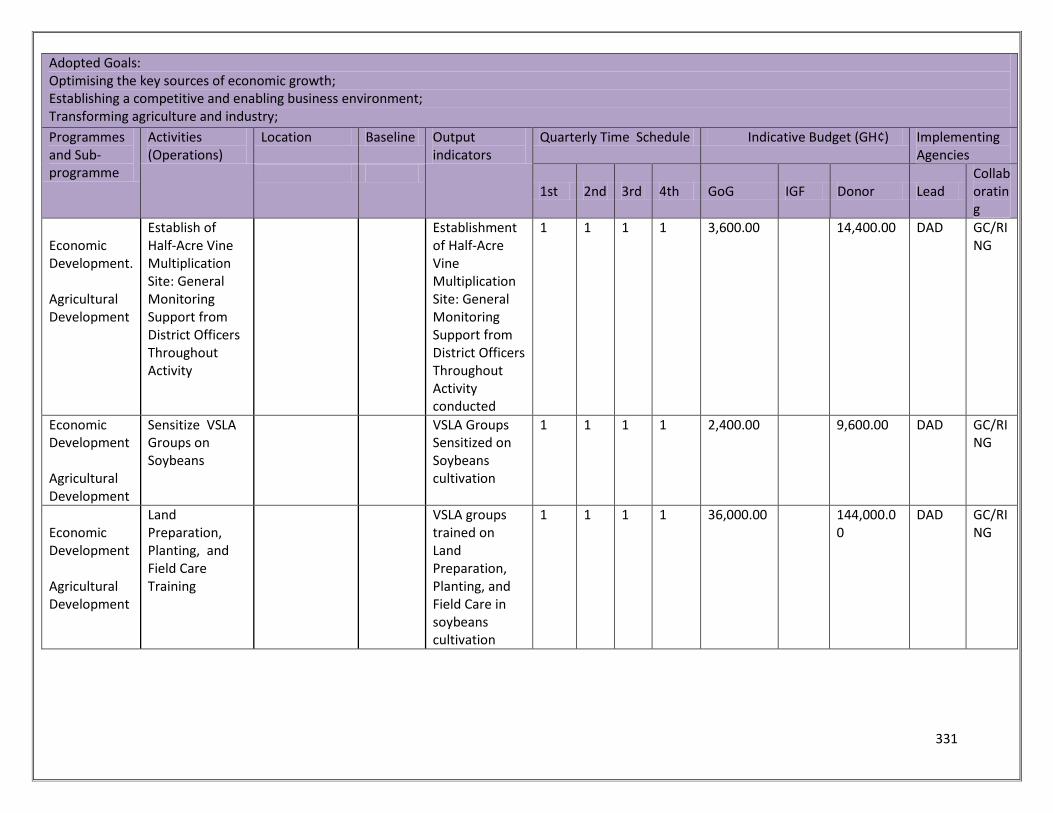
331
Adopted Goals: Optimising the key sources of economic growth; Establishing a competitive and enabling business environment; Transforming agriculture and industry;
Programmes and Sub-programme
Activities (Operations)
Location Baseline Output indicators
Quarterly Time Schedule Indicative Budget (GH¢) Implementing Agencies
1st 2nd 3rd 4th GoG IGF Donor Lead
Collaborating
Economic Development. Agricultural Development
Establish of Half-Acre Vine Multiplication Site: General Monitoring Support from District Officers Throughout Activity
Establishment of Half-Acre Vine Multiplication Site: General Monitoring Support from District Officers Throughout Activity conducted
1 1 1 1 3,600.00 14,400.00 DAD GC/RING
Economic Development Agricultural Development
Sensitize VSLA Groups on Soybeans
VSLA Groups Sensitized on Soybeans cultivation
1 1 1 1 2,400.00 9,600.00 DAD GC/RING
Economic Development Agricultural Development
Land Preparation, Planting, and Field Care Training
VSLA groups trained on Land Preparation, Planting, and Field Care in soybeans cultivation
1 1 1 1 36,000.00 144,000.00
DAD GC/RING
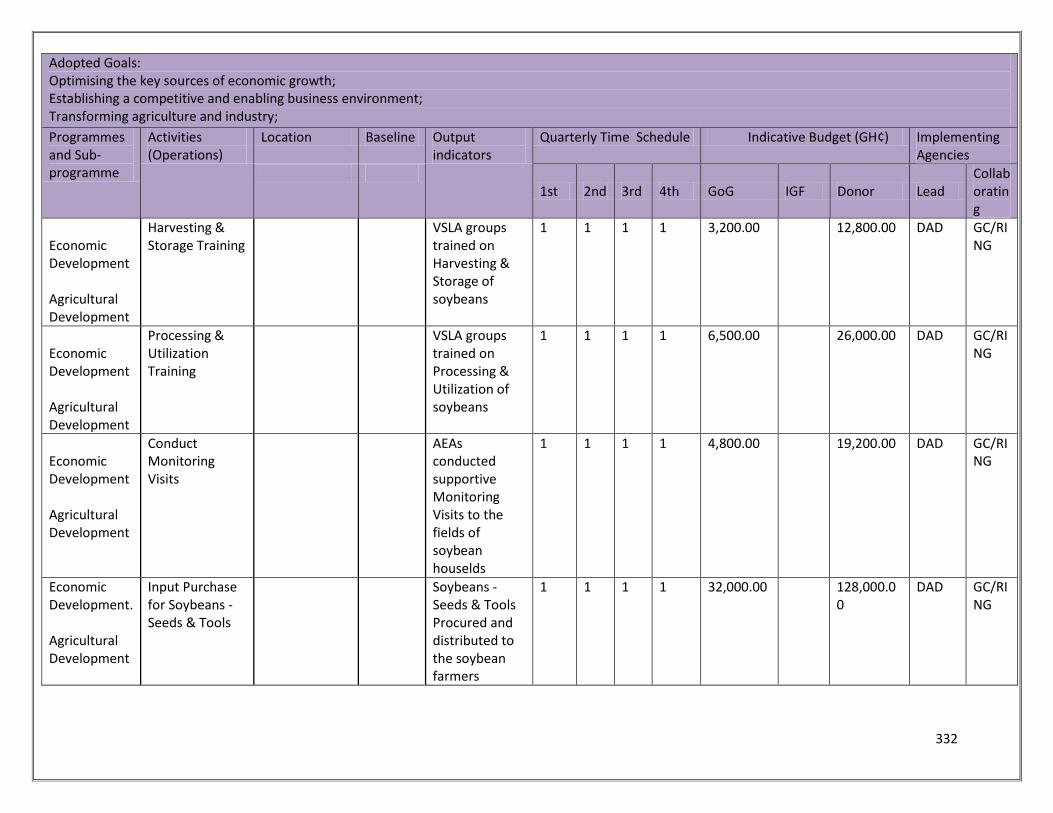
332
Adopted Goals: Optimising the key sources of economic growth; Establishing a competitive and enabling business environment; Transforming agriculture and industry;
Programmes and Sub-programme
Activities (Operations)
Location Baseline Output indicators
Quarterly Time Schedule Indicative Budget (GH¢) Implementing Agencies
1st 2nd 3rd 4th GoG IGF Donor Lead
Collaborating
Economic Development Agricultural Development
Harvesting & Storage Training
VSLA groups trained on Harvesting & Storage of soybeans
1 1 1 1 3,200.00 12,800.00 DAD GC/RING
Economic Development Agricultural Development
Processing & Utilization Training
VSLA groups trained on Processing & Utilization of soybeans
1 1 1 1 6,500.00 26,000.00 DAD GC/RING
Economic Development Agricultural Development
Conduct Monitoring Visits
AEAs conducted supportive Monitoring Visits to the fields of soybean houselds
1 1 1 1 4,800.00 19,200.00 DAD GC/RING
Economic Development. Agricultural Development
Input Purchase for Soybeans - Seeds & Tools
Soybeans - Seeds & Tools Procured and distributed to the soybean farmers
1 1 1 1 32,000.00 128,000.00
DAD GC/RING
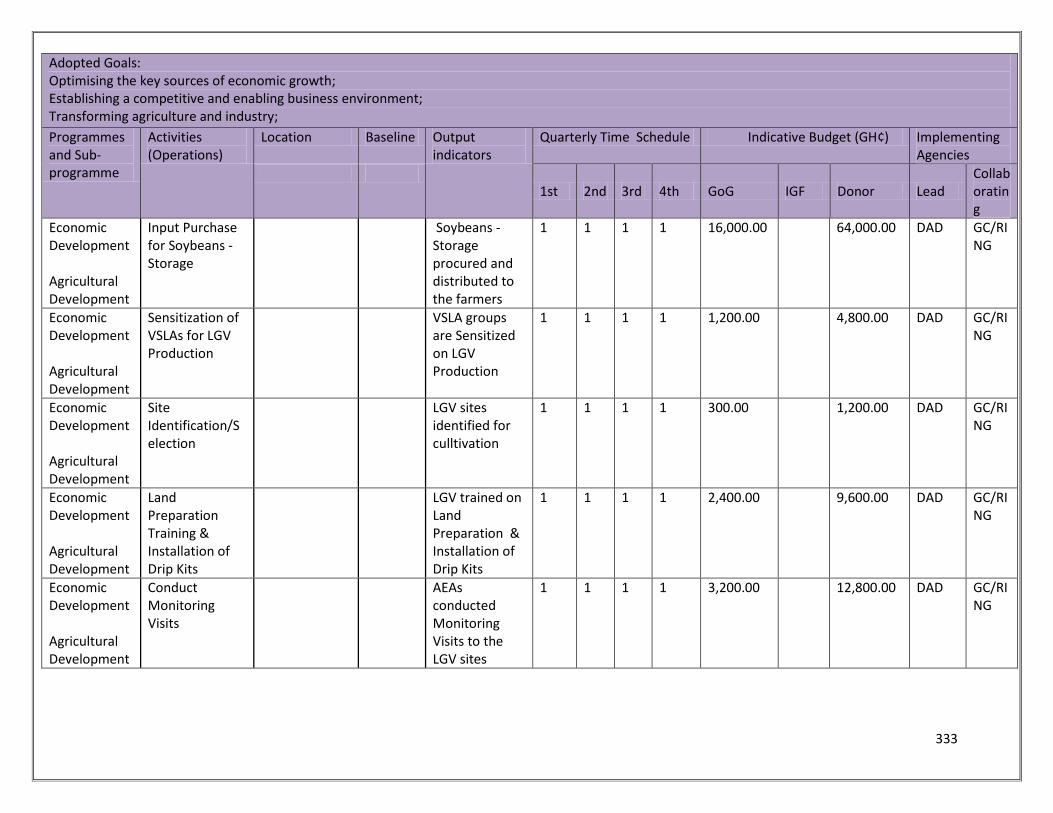
333
Adopted Goals: Optimising the key sources of economic growth; Establishing a competitive and enabling business environment; Transforming agriculture and industry;
Programmes and Sub-programme
Activities (Operations)
Location Baseline Output indicators
Quarterly Time Schedule Indicative Budget (GH¢) Implementing Agencies
1st 2nd 3rd 4th GoG IGF Donor Lead
Collaborating
Economic Development Agricultural Development
Input Purchase for Soybeans - Storage
Soybeans - Storage procured and distributed to the farmers
1 1 1 1 16,000.00 64,000.00 DAD GC/RING
Economic Development Agricultural Development
Sensitization of VSLAs for LGV Production
VSLA groups are Sensitized on LGV Production
1 1 1 1 1,200.00 4,800.00 DAD GC/RING
Economic Development Agricultural Development
Site Identification/Selection
LGV sites identified for culltivation
1 1 1 1 300.00 1,200.00 DAD GC/RING
Economic Development Agricultural Development
Land Preparation Training & Installation of Drip Kits
LGV trained on Land Preparation & Installation of Drip Kits
1 1 1 1 2,400.00 9,600.00 DAD GC/RING
Economic Development Agricultural Development
Conduct Monitoring Visits
AEAs conducted Monitoring Visits to the LGV sites
1 1 1 1 3,200.00 12,800.00 DAD GC/RING
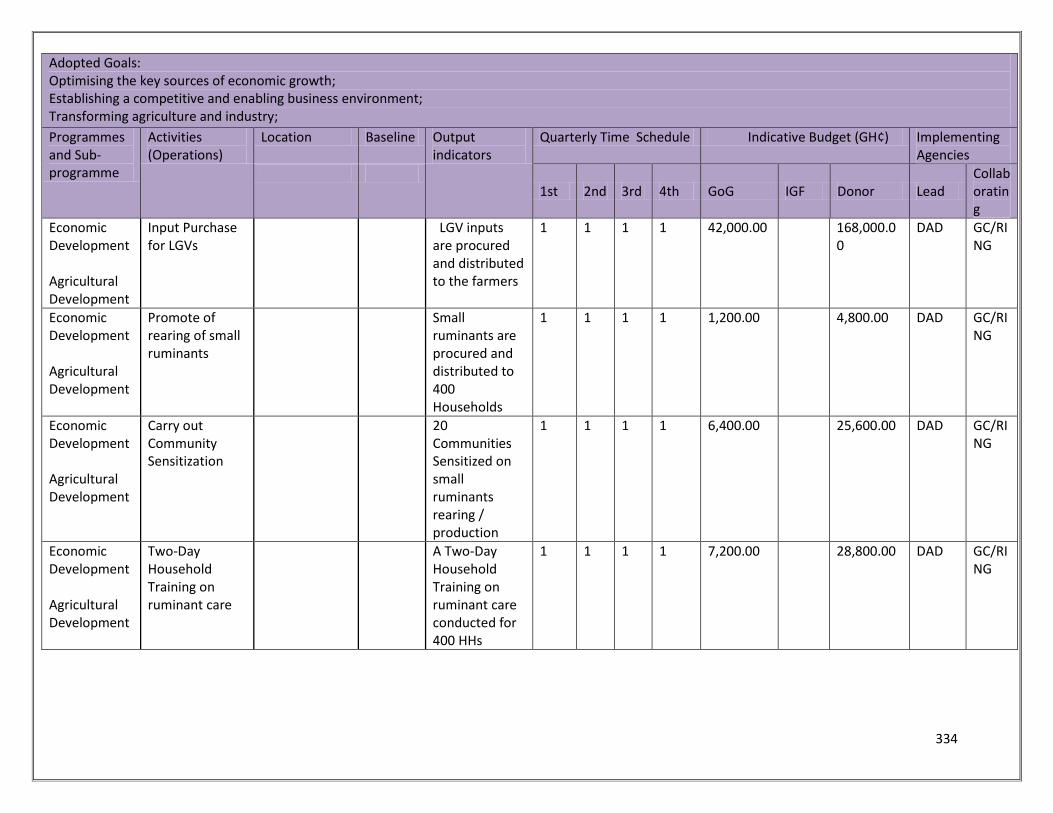
334
Adopted Goals: Optimising the key sources of economic growth; Establishing a competitive and enabling business environment; Transforming agriculture and industry;
Programmes and Sub-programme
Activities (Operations)
Location Baseline Output indicators
Quarterly Time Schedule Indicative Budget (GH¢) Implementing Agencies
1st 2nd 3rd 4th GoG IGF Donor Lead
Collaborating
Economic Development Agricultural Development
Input Purchase for LGVs
LGV inputs are procured and distributed to the farmers
1 1 1 1 42,000.00 168,000.00
DAD GC/RING
Economic Development Agricultural Development
Promote of rearing of small ruminants
Small ruminants are procured and distributed to 400 Households
1 1 1 1 1,200.00 4,800.00 DAD GC/RING
Economic Development Agricultural Development
Carry out Community Sensitization
20 Communities Sensitized on small ruminants rearing / production
1 1 1 1 6,400.00 25,600.00 DAD GC/RING
Economic Development Agricultural Development
Two-Day Household Training on ruminant care
A Two-Day Household Training on ruminant care conducted for 400 HHs
1 1 1 1 7,200.00 28,800.00 DAD GC/RING
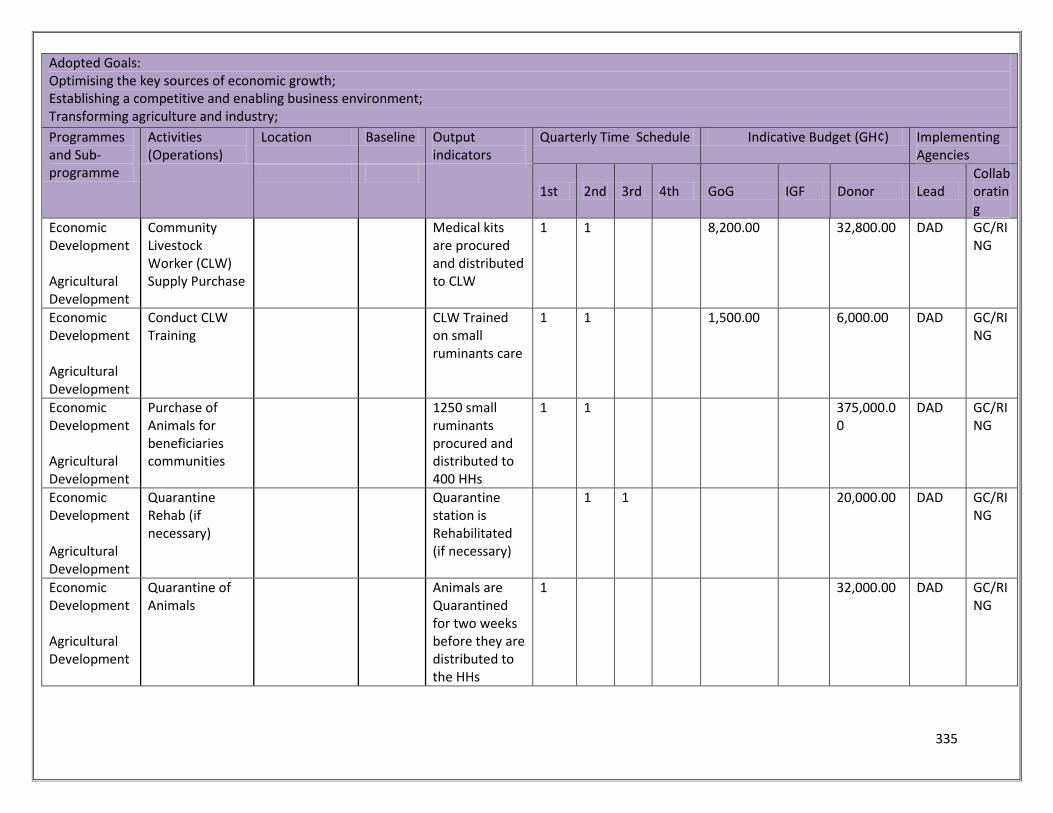
335
Adopted Goals: Optimising the key sources of economic growth; Establishing a competitive and enabling business environment; Transforming agriculture and industry;
Programmes and Sub-programme
Activities (Operations)
Location Baseline Output indicators
Quarterly Time Schedule Indicative Budget (GH¢) Implementing Agencies
1st 2nd 3rd 4th GoG IGF Donor Lead
Collaborating
Economic Development Agricultural Development
Community Livestock Worker (CLW) Supply Purchase
Medical kits are procured and distributed to CLW
1 1 8,200.00 32,800.00 DAD GC/RING
Economic Development Agricultural Development
Conduct CLW Training
CLW Trained on small ruminants care
1 1 1,500.00 6,000.00 DAD GC/RING
Economic Development Agricultural Development
Purchase of Animals for beneficiaries communities
1250 small ruminants procured and distributed to 400 HHs
1 1 375,000.00
DAD GC/RING
Economic Development Agricultural Development
Quarantine Rehab (if necessary)
Quarantine station is Rehabilitated (if necessary)
1 1 20,000.00 DAD GC/RING
Economic Development Agricultural Development
Quarantine of Animals
Animals are Quarantined for two weeks before they are distributed to the HHs
1 32,000.00 DAD GC/RING
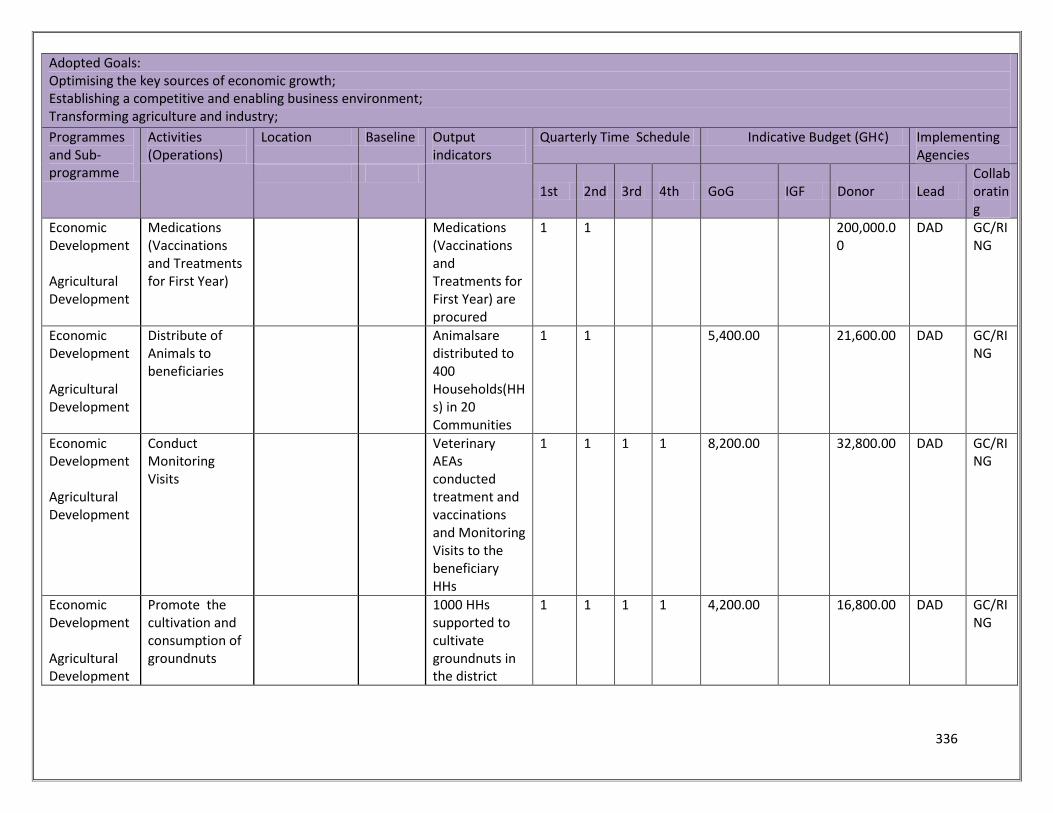
336
Adopted Goals: Optimising the key sources of economic growth; Establishing a competitive and enabling business environment; Transforming agriculture and industry;
Programmes and Sub-programme
Activities (Operations)
Location Baseline Output indicators
Quarterly Time Schedule Indicative Budget (GH¢) Implementing Agencies
1st 2nd 3rd 4th GoG IGF Donor Lead
Collaborating
Economic Development Agricultural Development
Medications (Vaccinations and Treatments for First Year)
Medications (Vaccinations and Treatments for First Year) are procured
1 1 200,000.00
DAD GC/RING
Economic Development Agricultural Development
Distribute of Animals to beneficiaries
Animalsare distributed to 400 Households(HHs) in 20 Communities
1 1 5,400.00 21,600.00 DAD GC/RING
Economic Development Agricultural Development
Conduct Monitoring Visits
Veterinary AEAs conducted treatment and vaccinations and Monitoring Visits to the beneficiary HHs
1 1 1 1 8,200.00 32,800.00 DAD GC/RING
Economic Development Agricultural Development
Promote the cultivation and consumption of groundnuts
1000 HHs supported to cultivate groundnuts in the district
1 1 1 1 4,200.00 16,800.00 DAD GC/RING
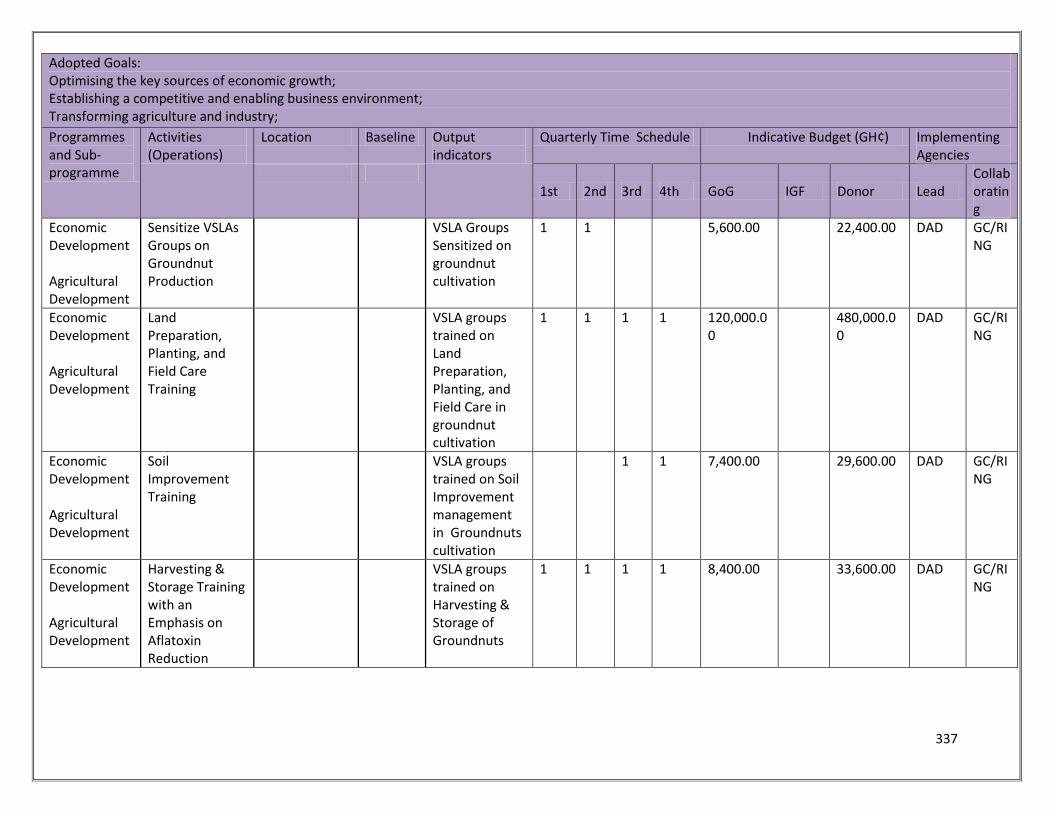
337
Adopted Goals: Optimising the key sources of economic growth; Establishing a competitive and enabling business environment; Transforming agriculture and industry;
Programmes and Sub-programme
Activities (Operations)
Location Baseline Output indicators
Quarterly Time Schedule Indicative Budget (GH¢) Implementing Agencies
1st 2nd 3rd 4th GoG IGF Donor Lead
Collaborating
Economic Development Agricultural Development
Sensitize VSLAs Groups on Groundnut Production
VSLA Groups Sensitized on groundnut cultivation
1 1 5,600.00 22,400.00 DAD GC/RING
Economic Development Agricultural Development
Land Preparation, Planting, and Field Care Training
VSLA groups trained on Land Preparation, Planting, and Field Care in groundnut cultivation
1 1 1 1 120,000.00
480,000.00
DAD GC/RING
Economic Development Agricultural Development
Soil Improvement Training
VSLA groups trained on Soil Improvement management in Groundnuts cultivation
1 1 7,400.00 29,600.00 DAD GC/RING
Economic Development Agricultural Development
Harvesting & Storage Training with an Emphasis on Aflatoxin Reduction
VSLA groups trained on Harvesting & Storage of Groundnuts
1 1 1 1 8,400.00 33,600.00 DAD GC/RING
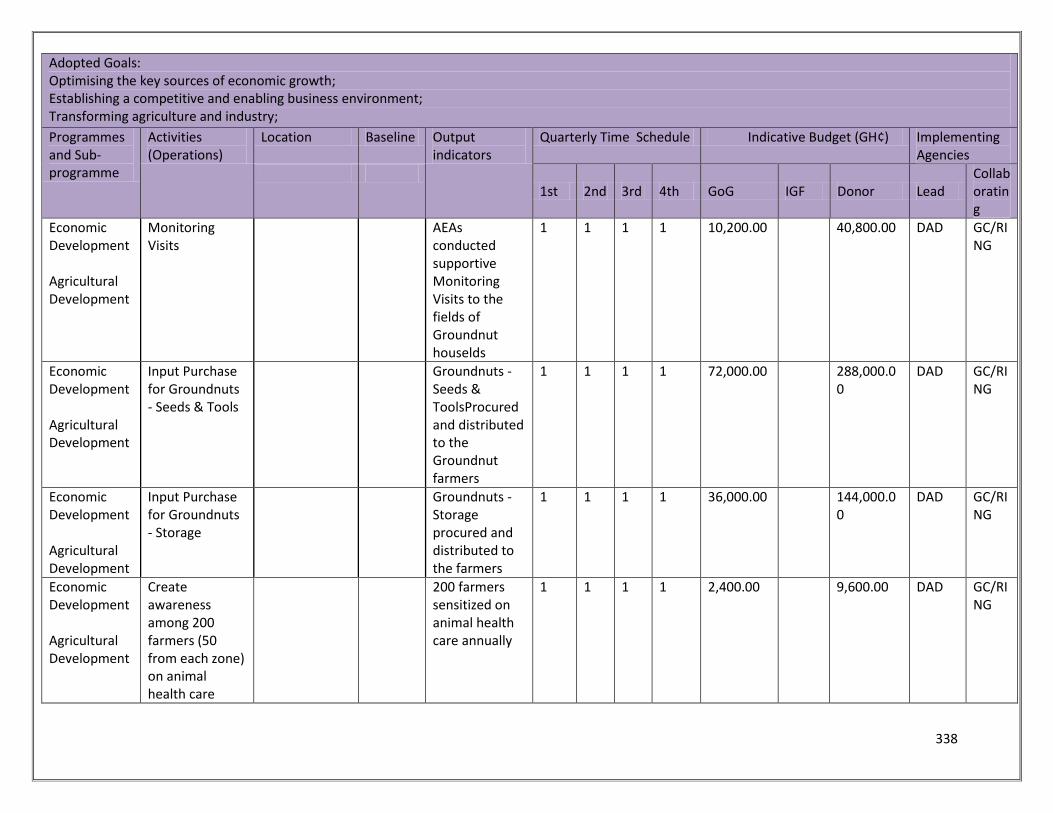
338
Adopted Goals: Optimising the key sources of economic growth; Establishing a competitive and enabling business environment; Transforming agriculture and industry;
Programmes and Sub-programme
Activities (Operations)
Location Baseline Output indicators
Quarterly Time Schedule Indicative Budget (GH¢) Implementing Agencies
1st 2nd 3rd 4th GoG IGF Donor Lead
Collaborating
Economic Development Agricultural Development
Monitoring Visits
AEAs conducted supportive Monitoring Visits to the fields of Groundnut houselds
1 1 1 1 10,200.00 40,800.00 DAD GC/RING
Economic Development Agricultural Development
Input Purchase for Groundnuts - Seeds & Tools
Groundnuts - Seeds & ToolsProcured and distributed to the Groundnut farmers
1 1 1 1 72,000.00 288,000.00
DAD GC/RING
Economic Development Agricultural Development
Input Purchase for Groundnuts - Storage
Groundnuts - Storage procured and distributed to the farmers
1 1 1 1 36,000.00 144,000.00
DAD GC/RING
Economic Development Agricultural Development
Create awareness among 200 farmers (50 from each zone) on animal health care
200 farmers sensitized on animal health care annually
1 1 1 1 2,400.00 9,600.00 DAD GC/RING
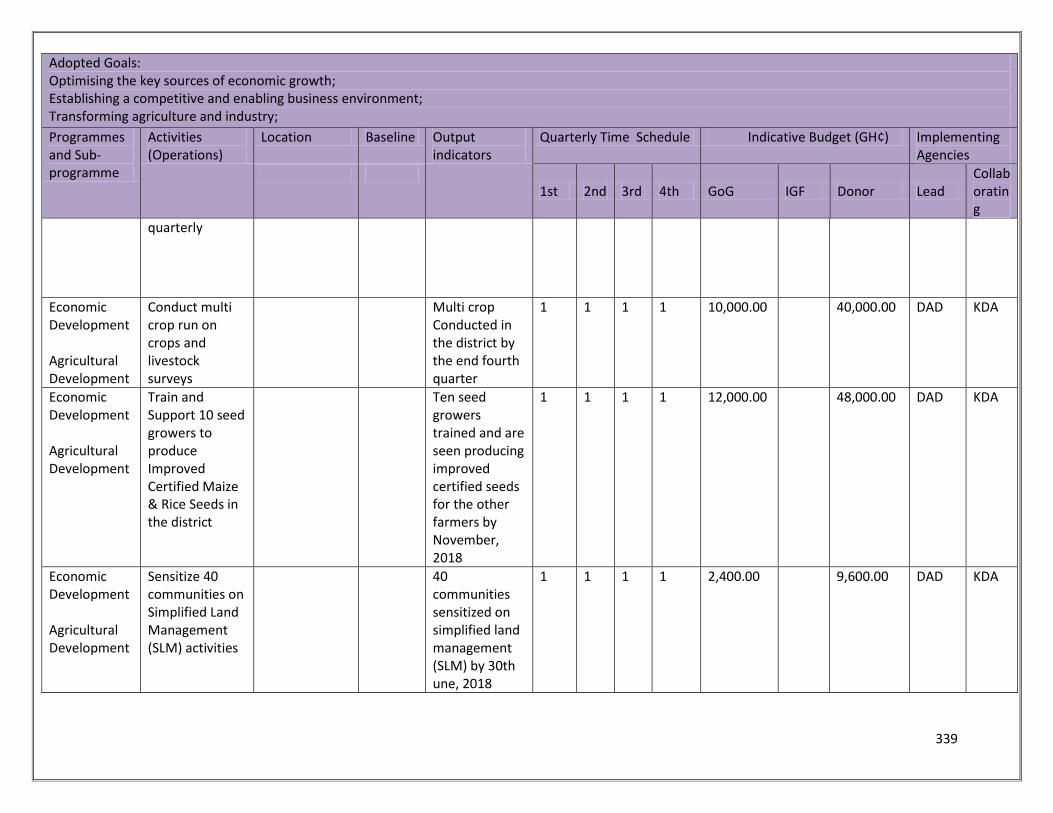
339
Adopted Goals: Optimising the key sources of economic growth; Establishing a competitive and enabling business environment; Transforming agriculture and industry;
Programmes and Sub-programme
Activities (Operations)
Location Baseline Output indicators
Quarterly Time Schedule Indicative Budget (GH¢) Implementing Agencies
1st 2nd 3rd 4th GoG IGF Donor Lead
Collaborating
quarterly
Economic Development Agricultural Development
Conduct multi crop run on crops and livestock surveys
Multi crop Conducted in the district by the end fourth quarter
1 1 1 1 10,000.00 40,000.00 DAD KDA
Economic Development Agricultural Development
Train and Support 10 seed growers to produce Improved Certified Maize & Rice Seeds in the district
Ten seed growers trained and are seen producing improved certified seeds for the other farmers by November, 2018
1 1 1 1 12,000.00 48,000.00 DAD KDA
Economic Development Agricultural Development
Sensitize 40 communities on Simplified Land Management (SLM) activities
40 communities sensitized on simplified land management (SLM) by 30th une, 2018
1 1 1 1 2,400.00 9,600.00 DAD KDA
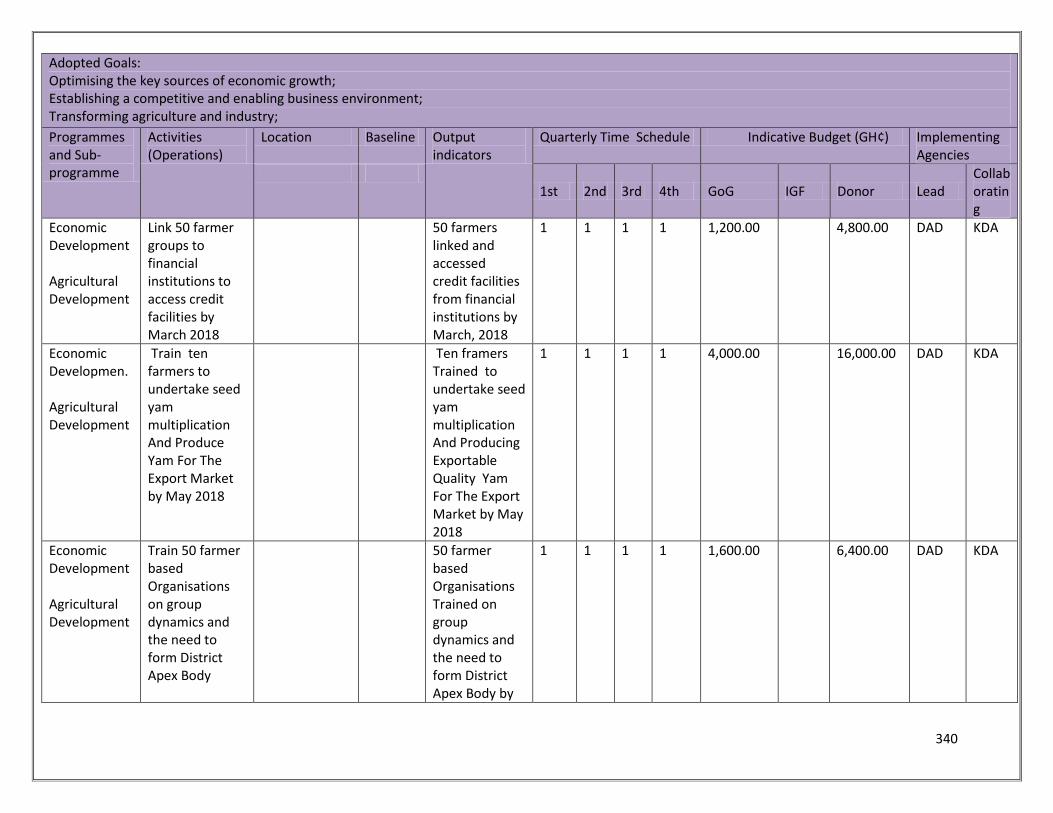
340
Adopted Goals: Optimising the key sources of economic growth; Establishing a competitive and enabling business environment; Transforming agriculture and industry;
Programmes and Sub-programme
Activities (Operations)
Location Baseline Output indicators
Quarterly Time Schedule Indicative Budget (GH¢) Implementing Agencies
1st 2nd 3rd 4th GoG IGF Donor Lead
Collaborating
Economic Development Agricultural Development
Link 50 farmer groups to financial institutions to access credit facilities by March 2018
50 farmers linked and accessed credit facilities from financial institutions by March, 2018
1 1 1 1 1,200.00 4,800.00 DAD KDA
Economic Developmen. Agricultural Development
Train ten farmers to undertake seed yam multiplication And Produce Yam For The Export Market by May 2018
Ten framers Trained to undertake seed yam multiplication And Producing Exportable Quality Yam For The Export Market by May 2018
1 1 1 1 4,000.00 16,000.00 DAD KDA
Economic Development Agricultural Development
Train 50 farmer based Organisations on group dynamics and the need to form District Apex Body
50 farmer based Organisations Trained on group dynamics and the need to form District Apex Body by
1 1 1 1 1,600.00 6,400.00 DAD KDA
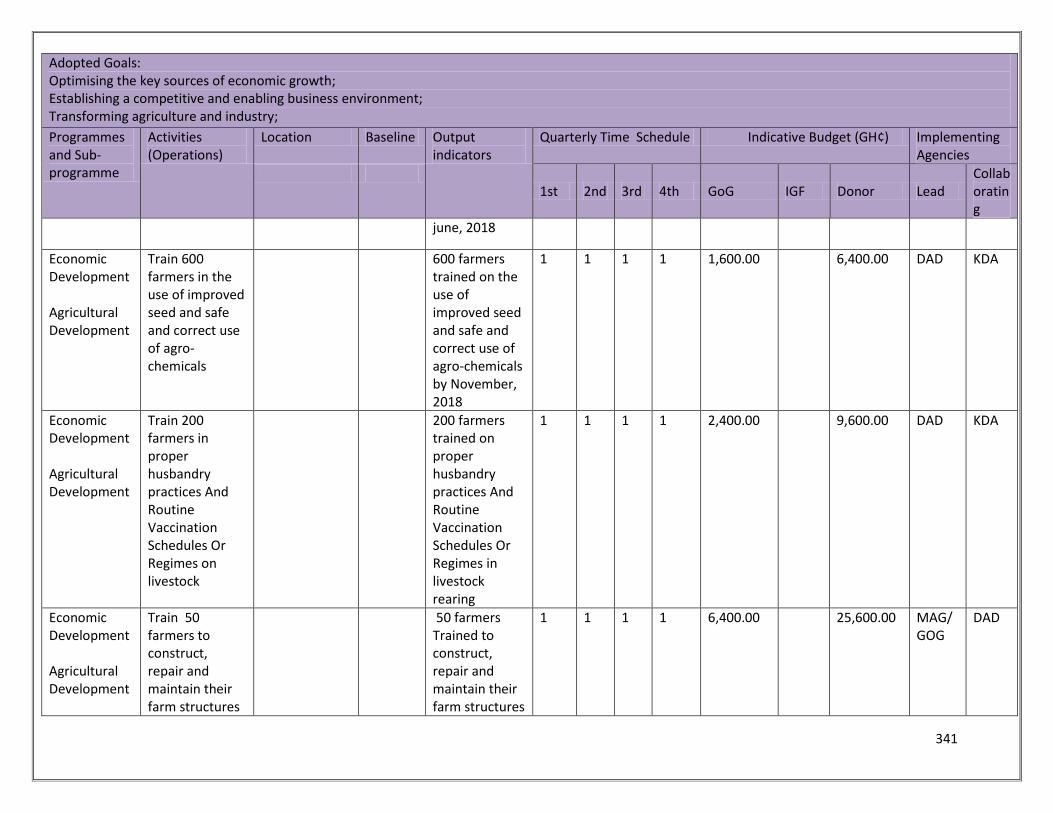
341
Adopted Goals: Optimising the key sources of economic growth; Establishing a competitive and enabling business environment; Transforming agriculture and industry;
Programmes and Sub-programme
Activities (Operations)
Location Baseline Output indicators
Quarterly Time Schedule Indicative Budget (GH¢) Implementing Agencies
1st 2nd 3rd 4th GoG IGF Donor Lead
Collaborating
june, 2018
Economic Development Agricultural Development
Train 600 farmers in the use of improved seed and safe and correct use of agro-chemicals
600 farmers trained on the use of improved seed and safe and correct use of agro-chemicals by November, 2018
1 1 1 1 1,600.00 6,400.00 DAD KDA
Economic Development Agricultural Development
Train 200 farmers in proper husbandry practices And Routine Vaccination Schedules Or Regimes on livestock
200 farmers trained on proper husbandry practices And Routine Vaccination Schedules Or Regimes in livestock rearing
1 1 1 1 2,400.00 9,600.00 DAD KDA
Economic Development Agricultural Development
Train 50 farmers to construct, repair and maintain their farm structures
50 farmers Trained to construct, repair and maintain their farm structures
1 1 1 1 6,400.00 25,600.00 MAG/GOG
DAD
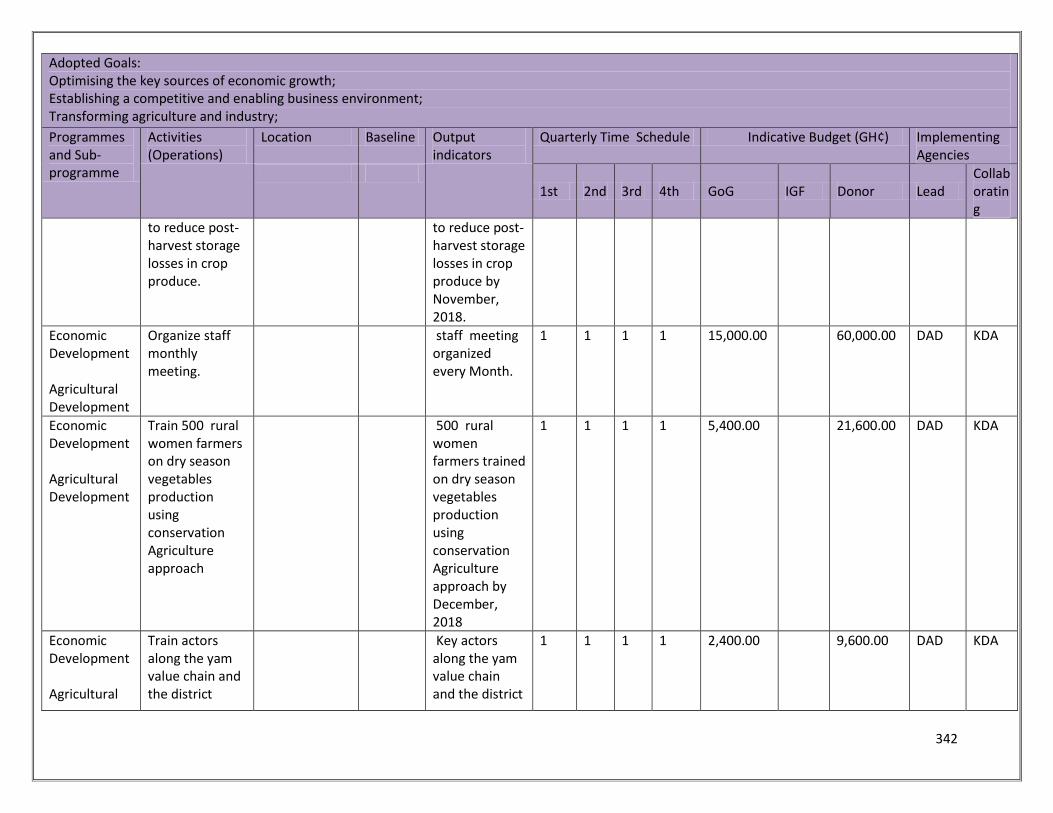
342
Adopted Goals: Optimising the key sources of economic growth; Establishing a competitive and enabling business environment; Transforming agriculture and industry;
Programmes and Sub-programme
Activities (Operations)
Location Baseline Output indicators
Quarterly Time Schedule Indicative Budget (GH¢) Implementing Agencies
1st 2nd 3rd 4th GoG IGF Donor Lead
Collaborating
to reduce post-harvest storage losses in crop produce.
to reduce post-harvest storage losses in crop produce by November, 2018.
Economic Development Agricultural Development
Organize staff monthly meeting.
staff meeting organized every Month.
1 1 1 1 15,000.00 60,000.00 DAD KDA
Economic Development Agricultural Development
Train 500 rural women farmers on dry season vegetables production using conservation Agriculture approach
500 rural women farmers trained on dry season vegetables production using conservation Agriculture approach by December, 2018
1 1 1 1 5,400.00 21,600.00 DAD KDA
Economic Development Agricultural
Train actors along the yam value chain and the district
Key actors along the yam value chain and the district
1 1 1 1 2,400.00 9,600.00 DAD KDA
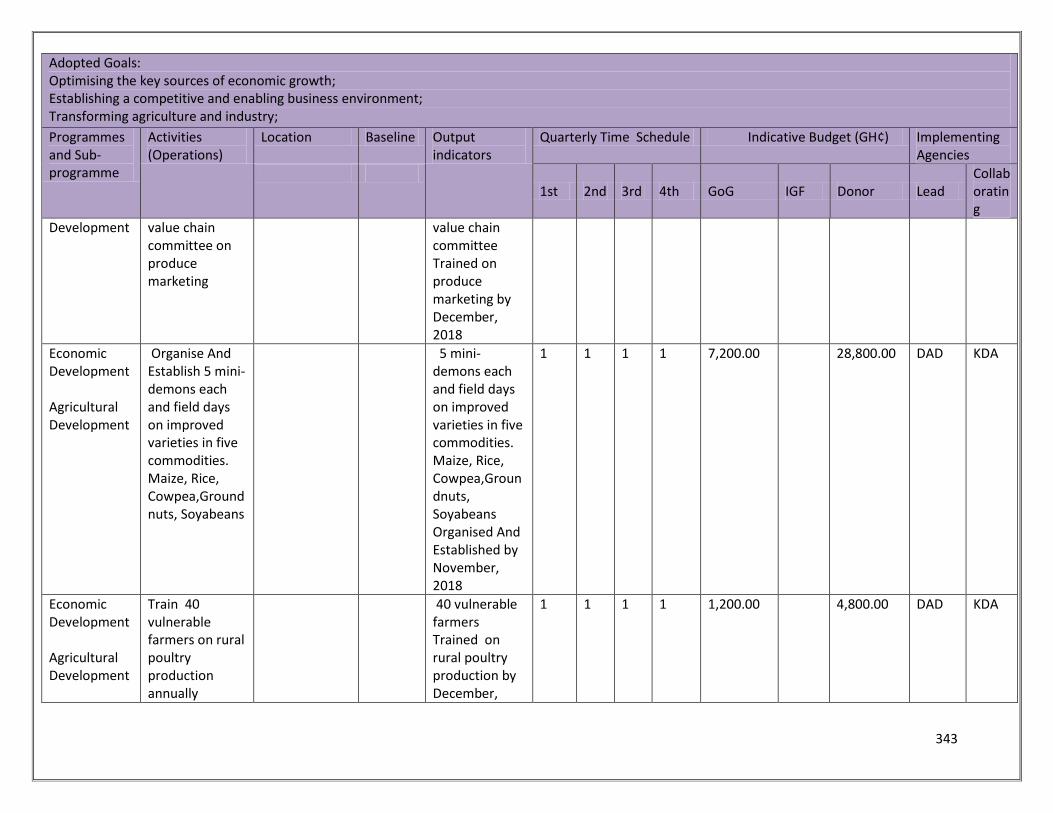
343
Adopted Goals: Optimising the key sources of economic growth; Establishing a competitive and enabling business environment; Transforming agriculture and industry;
Programmes and Sub-programme
Activities (Operations)
Location Baseline Output indicators
Quarterly Time Schedule Indicative Budget (GH¢) Implementing Agencies
1st 2nd 3rd 4th GoG IGF Donor Lead
Collaborating
Development value chain committee on produce marketing
value chain committee Trained on produce marketing by December, 2018
Economic Development Agricultural Development
Organise And Establish 5 mini-demons each and field days on improved varieties in five commodities. Maize, Rice, Cowpea,Groundnuts, Soyabeans
5 mini-demons each and field days on improved varieties in five commodities. Maize, Rice, Cowpea,Groundnuts, Soyabeans Organised And Established by November, 2018
1 1 1 1 7,200.00 28,800.00 DAD KDA
Economic Development Agricultural Development
Train 40 vulnerable farmers on rural poultry production annually
40 vulnerable farmers Trained on rural poultry production by December,
1 1 1 1 1,200.00 4,800.00 DAD KDA
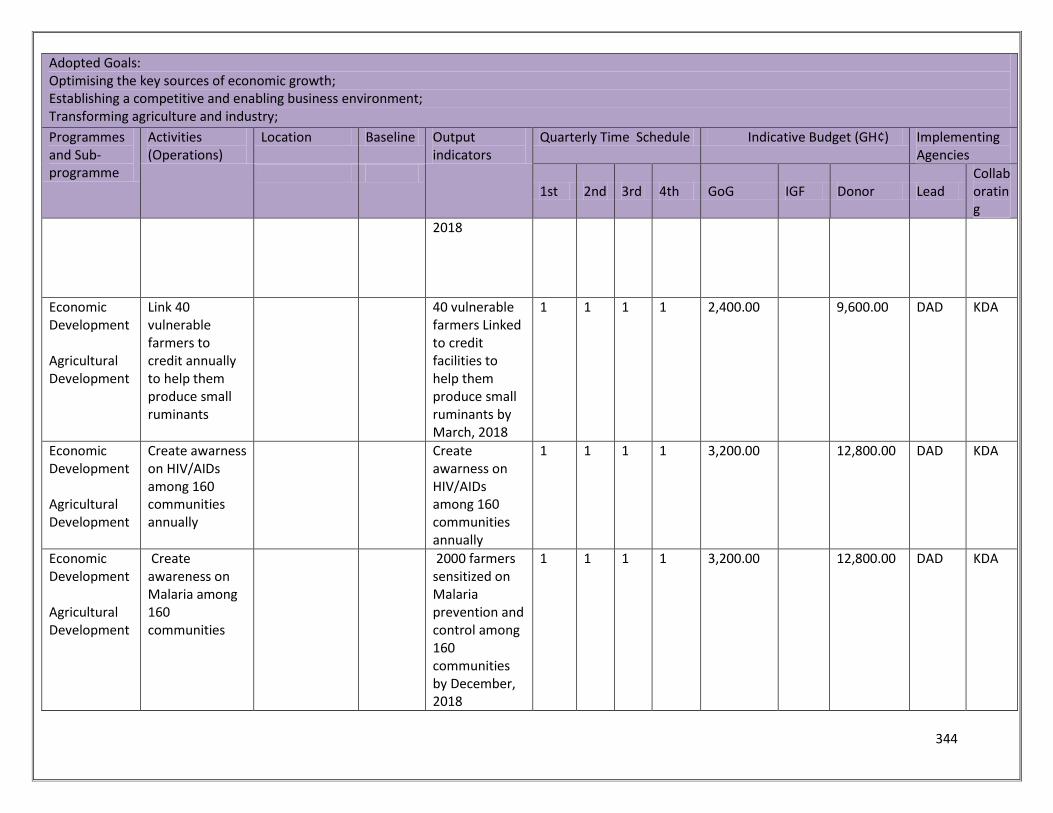
344
Adopted Goals: Optimising the key sources of economic growth; Establishing a competitive and enabling business environment; Transforming agriculture and industry;
Programmes and Sub-programme
Activities (Operations)
Location Baseline Output indicators
Quarterly Time Schedule Indicative Budget (GH¢) Implementing Agencies
1st 2nd 3rd 4th GoG IGF Donor Lead
Collaborating
2018
Economic Development Agricultural Development
Link 40 vulnerable farmers to credit annually to help them produce small ruminants
40 vulnerable farmers Linked to credit facilities to help them produce small ruminants by March, 2018
1 1 1 1 2,400.00 9,600.00 DAD KDA
Economic Development Agricultural Development
Create awarness on HIV/AIDs among 160 communities annually
Create awarness on HIV/AIDs among 160 communities annually
1 1 1 1 3,200.00 12,800.00 DAD KDA
Economic Development Agricultural Development
Create awareness on Malaria among 160 communities
2000 farmers sensitized on Malaria prevention and control among 160 communities by December, 2018
1 1 1 1 3,200.00 12,800.00 DAD KDA
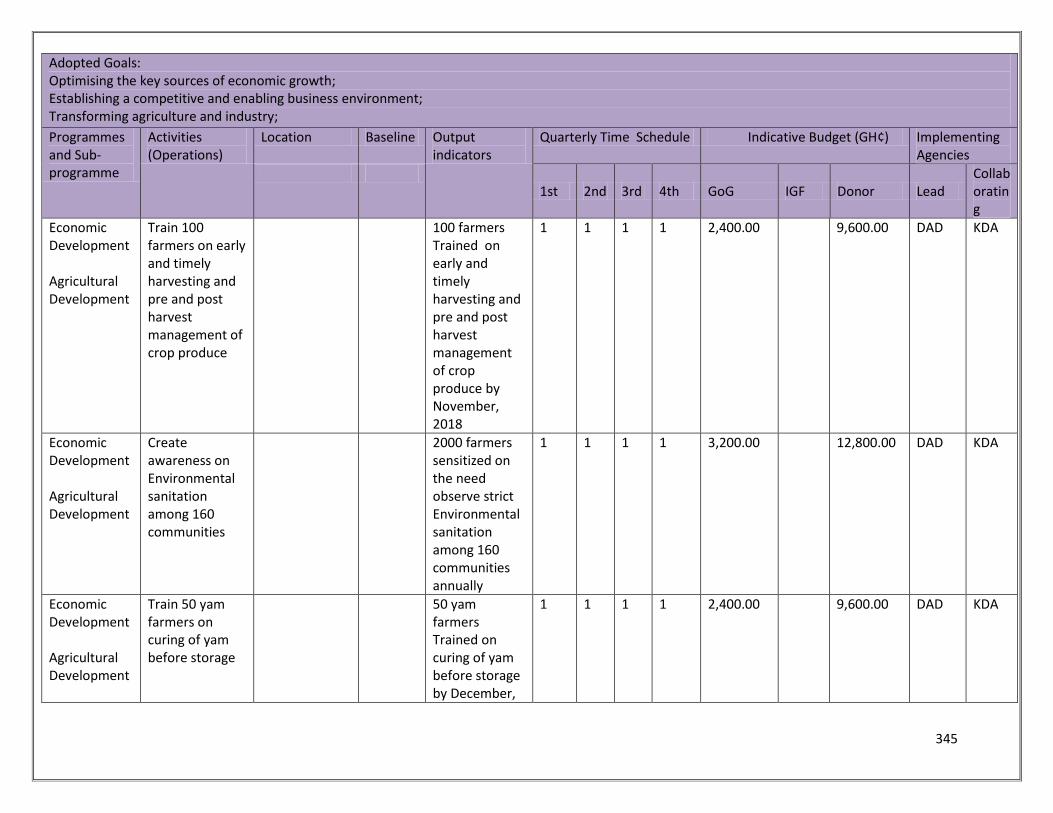
345
Adopted Goals: Optimising the key sources of economic growth; Establishing a competitive and enabling business environment; Transforming agriculture and industry;
Programmes and Sub-programme
Activities (Operations)
Location Baseline Output indicators
Quarterly Time Schedule Indicative Budget (GH¢) Implementing Agencies
1st 2nd 3rd 4th GoG IGF Donor Lead
Collaborating
Economic Development Agricultural Development
Train 100 farmers on early and timely harvesting and pre and post harvest management of crop produce
100 farmers Trained on early and timely harvesting and pre and post harvest management of crop produce by November, 2018
1 1 1 1 2,400.00 9,600.00 DAD KDA
Economic Development Agricultural Development
Create awareness on Environmental sanitation among 160 communities
2000 farmers sensitized on the need observe strict Environmental sanitation among 160 communities annually
1 1 1 1 3,200.00 12,800.00 DAD KDA
Economic Development Agricultural Development
Train 50 yam farmers on curing of yam before storage
50 yam farmers Trained on curing of yam before storage by December,
1 1 1 1 2,400.00 9,600.00 DAD KDA
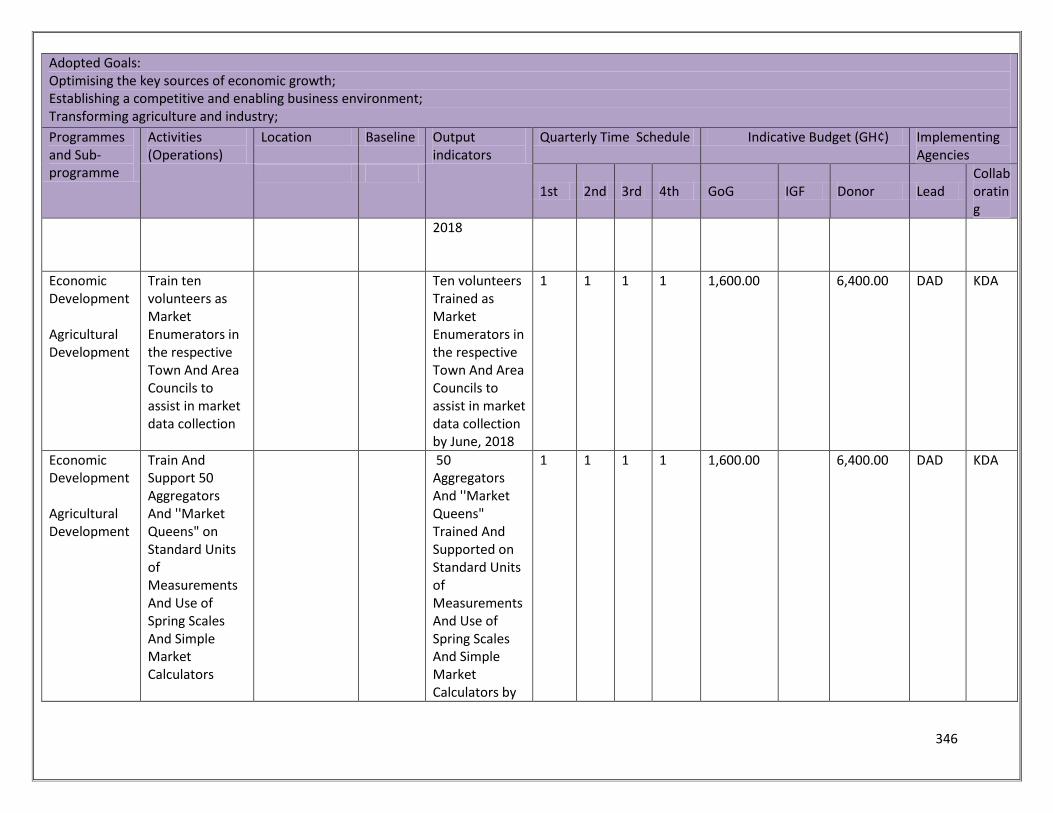
346
Adopted Goals: Optimising the key sources of economic growth; Establishing a competitive and enabling business environment; Transforming agriculture and industry;
Programmes and Sub-programme
Activities (Operations)
Location Baseline Output indicators
Quarterly Time Schedule Indicative Budget (GH¢) Implementing Agencies
1st 2nd 3rd 4th GoG IGF Donor Lead
Collaborating
2018
Economic Development Agricultural Development
Train ten volunteers as Market Enumerators in the respective Town And Area Councils to assist in market data collection
Ten volunteers Trained as Market Enumerators in the respective Town And Area Councils to assist in market data collection by June, 2018
1 1 1 1 1,600.00 6,400.00 DAD KDA
Economic Development Agricultural Development
Train And Support 50 Aggregators And ''Market Queens" on Standard Units of Measurements And Use of Spring Scales And Simple Market Calculators
50 Aggregators And ''Market Queens" Trained And Supported on Standard Units of Measurements And Use of Spring Scales And Simple Market Calculators by
1 1 1 1 1,600.00 6,400.00 DAD KDA
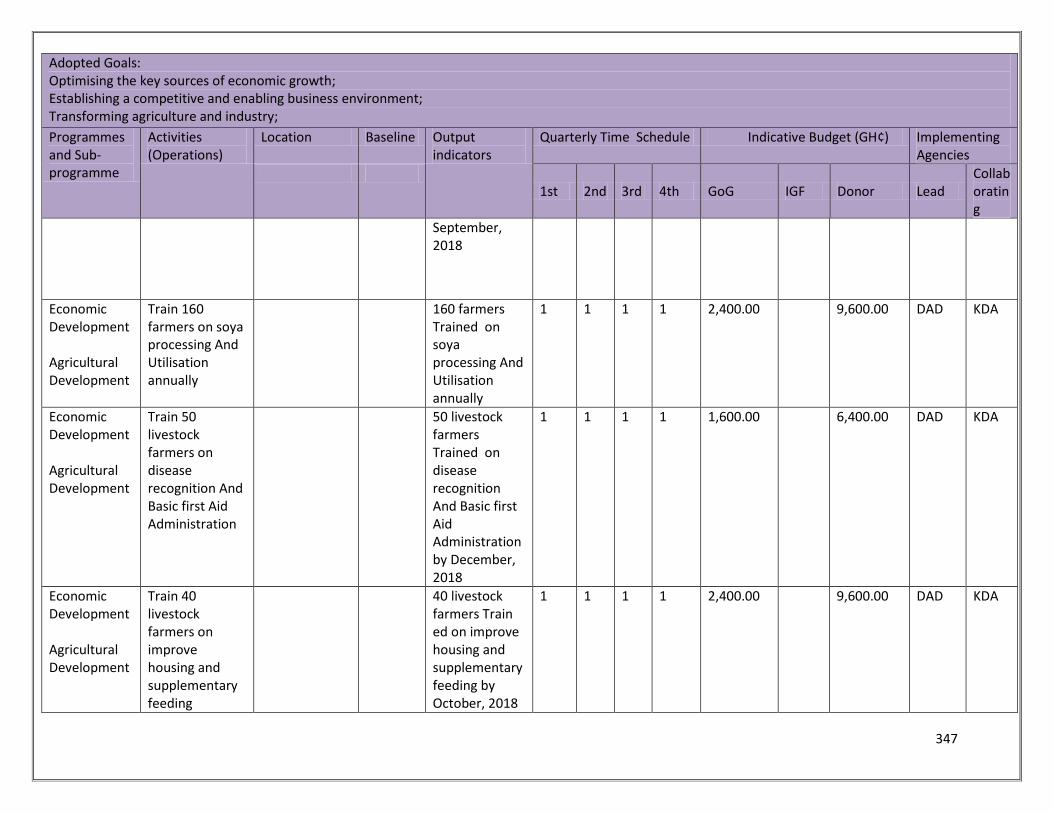
347
Adopted Goals: Optimising the key sources of economic growth; Establishing a competitive and enabling business environment; Transforming agriculture and industry;
Programmes and Sub-programme
Activities (Operations)
Location Baseline Output indicators
Quarterly Time Schedule Indicative Budget (GH¢) Implementing Agencies
1st 2nd 3rd 4th GoG IGF Donor Lead
Collaborating
September, 2018
Economic Development Agricultural Development
Train 160 farmers on soya processing And Utilisation annually
160 farmers Trained on soya processing And Utilisation annually
1 1 1 1 2,400.00 9,600.00 DAD KDA
Economic Development Agricultural Development
Train 50 livestock farmers on disease recognition And Basic first Aid Administration
50 livestock farmers Trained on disease recognition And Basic first Aid Administration by December, 2018
1 1 1 1 1,600.00 6,400.00 DAD KDA
Economic Development Agricultural Development
Train 40 livestock farmers on improve housing and supplementary feeding
40 livestock farmers Train ed on improve housing and supplementary feeding by October, 2018
1 1 1 1 2,400.00 9,600.00 DAD KDA
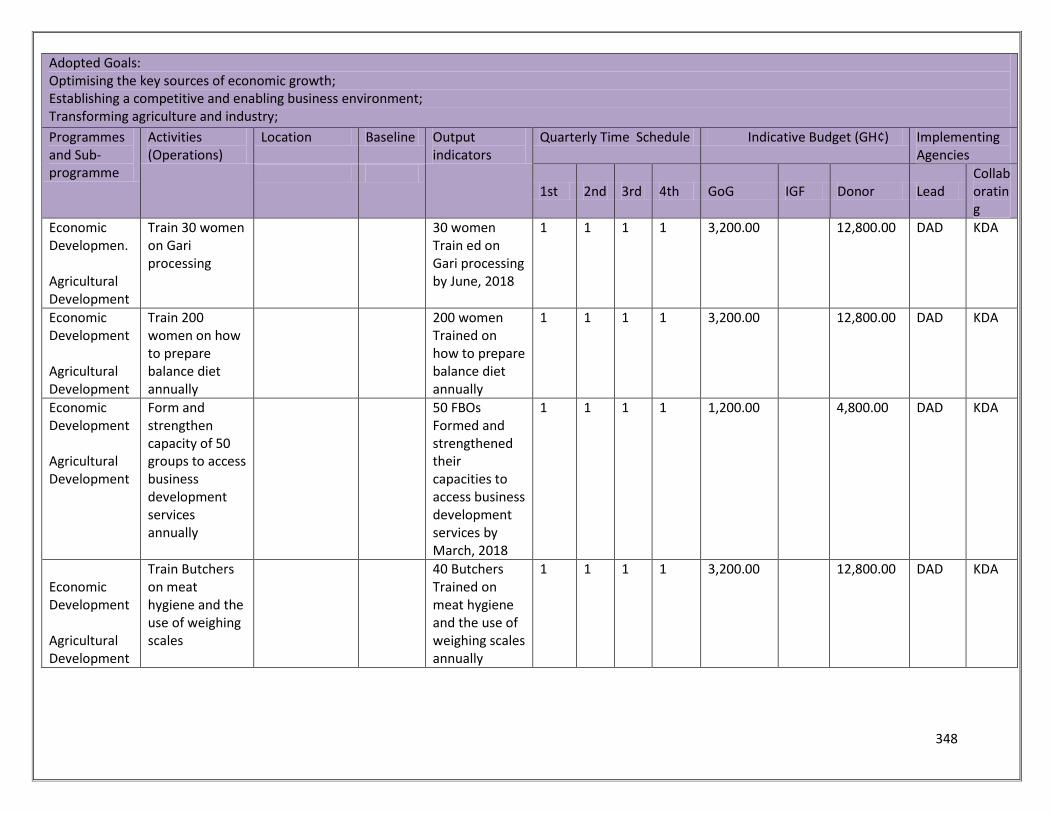
348
Adopted Goals: Optimising the key sources of economic growth; Establishing a competitive and enabling business environment; Transforming agriculture and industry;
Programmes and Sub-programme
Activities (Operations)
Location Baseline Output indicators
Quarterly Time Schedule Indicative Budget (GH¢) Implementing Agencies
1st 2nd 3rd 4th GoG IGF Donor Lead
Collaborating
Economic Developmen. Agricultural Development
Train 30 women on Gari processing
30 women Train ed on Gari processing by June, 2018
1 1 1 1 3,200.00 12,800.00 DAD KDA
Economic Development Agricultural Development
Train 200 women on how to prepare balance diet annually
200 women Trained on how to prepare balance diet annually
1 1 1 1 3,200.00 12,800.00 DAD KDA
Economic Development Agricultural Development
Form and strengthen capacity of 50 groups to access business development services annually
50 FBOs Formed and strengthened their capacities to access business development services by March, 2018
1 1 1 1 1,200.00 4,800.00 DAD KDA
Economic Development Agricultural Development
Train Butchers on meat hygiene and the use of weighing scales
40 Butchers Trained on meat hygiene and the use of weighing scales annually
1 1 1 1 3,200.00 12,800.00 DAD KDA
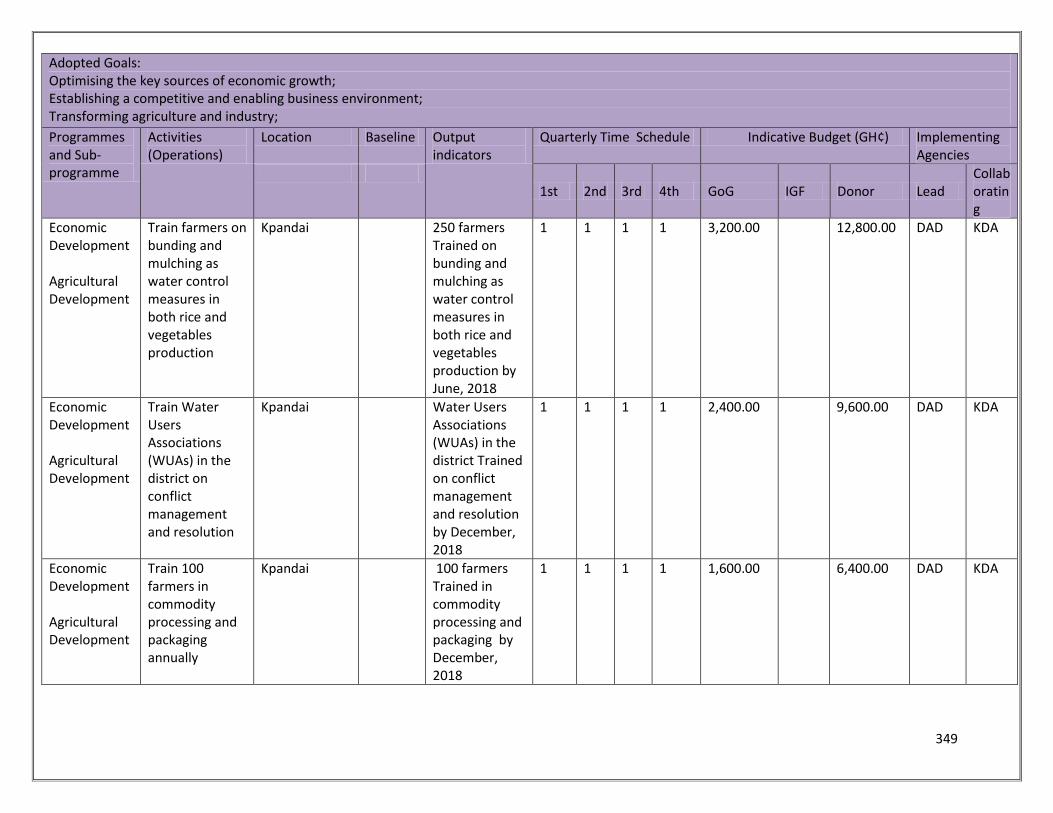
349
Adopted Goals: Optimising the key sources of economic growth; Establishing a competitive and enabling business environment; Transforming agriculture and industry;
Programmes and Sub-programme
Activities (Operations)
Location Baseline Output indicators
Quarterly Time Schedule Indicative Budget (GH¢) Implementing Agencies
1st 2nd 3rd 4th GoG IGF Donor Lead
Collaborating
Economic Development Agricultural Development
Train farmers on bunding and mulching as water control measures in both rice and vegetables production
Kpandai 250 farmers Trained on bunding and mulching as water control measures in both rice and vegetables production by June, 2018
1 1 1 1 3,200.00 12,800.00 DAD KDA
Economic Development Agricultural Development
Train Water Users Associations (WUAs) in the district on conflict management and resolution
Kpandai Water Users Associations (WUAs) in the district Trained on conflict management and resolution by December, 2018
1 1 1 1 2,400.00 9,600.00 DAD KDA
Economic Development Agricultural Development
Train 100 farmers in commodity processing and packaging annually
Kpandai 100 farmers Trained in commodity processing and packaging by December, 2018
1 1 1 1 1,600.00 6,400.00 DAD KDA
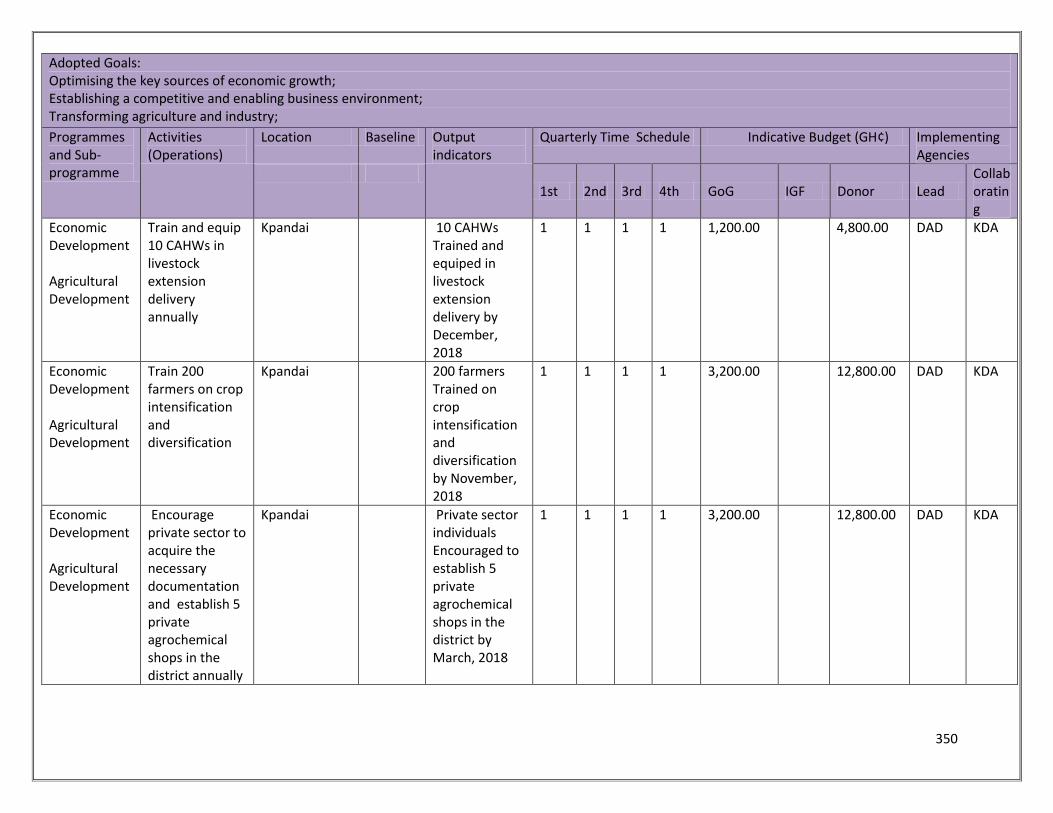
350
Adopted Goals: Optimising the key sources of economic growth; Establishing a competitive and enabling business environment; Transforming agriculture and industry;
Programmes and Sub-programme
Activities (Operations)
Location Baseline Output indicators
Quarterly Time Schedule Indicative Budget (GH¢) Implementing Agencies
1st 2nd 3rd 4th GoG IGF Donor Lead
Collaborating
Economic Development Agricultural Development
Train and equip 10 CAHWs in livestock extension delivery annually
Kpandai 10 CAHWs Trained and equiped in livestock extension delivery by December, 2018
1 1 1 1 1,200.00 4,800.00 DAD KDA
Economic Development Agricultural Development
Train 200 farmers on crop intensification and diversification
Kpandai 200 farmers Trained on crop intensification and diversification by November, 2018
1 1 1 1 3,200.00 12,800.00 DAD KDA
Economic Development Agricultural Development
Encourage private sector to acquire the necessary documentation and establish 5 private agrochemical shops in the district annually
Kpandai Private sector individuals Encouraged to establish 5 private agrochemical shops in the district by March, 2018
1 1 1 1 3,200.00 12,800.00 DAD KDA
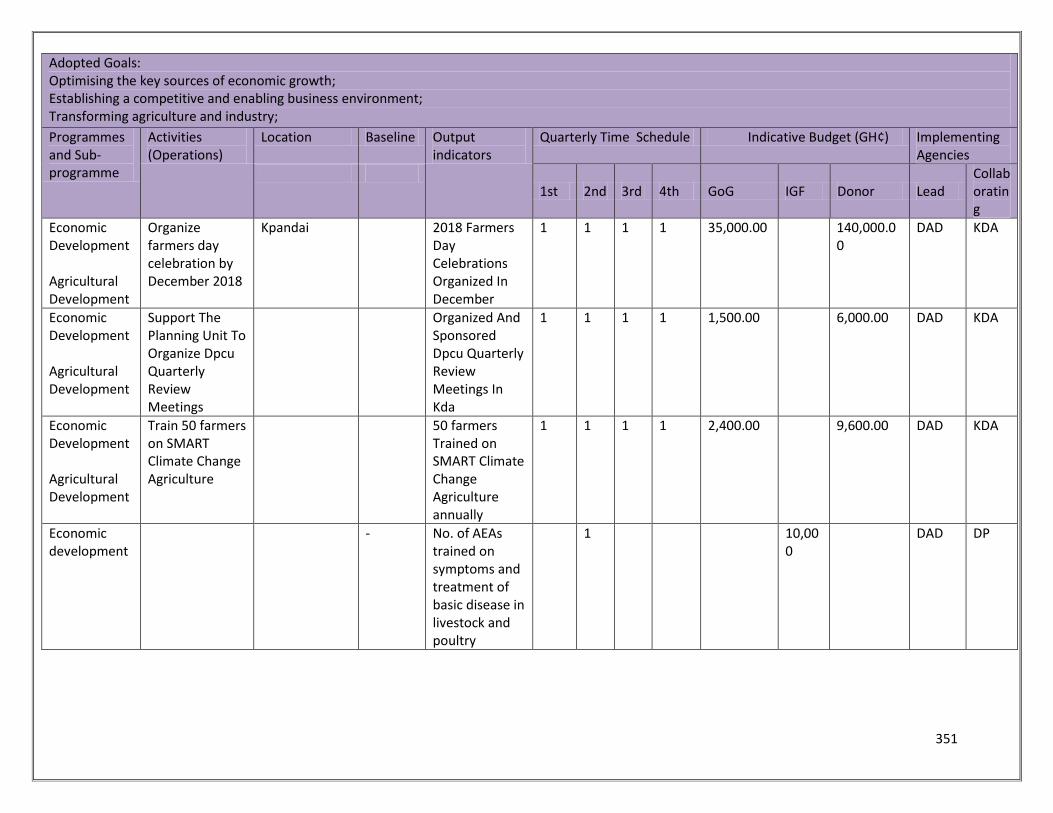
351
Adopted Goals: Optimising the key sources of economic growth; Establishing a competitive and enabling business environment; Transforming agriculture and industry;
Programmes and Sub-programme
Activities (Operations)
Location Baseline Output indicators
Quarterly Time Schedule Indicative Budget (GH¢) Implementing Agencies
1st 2nd 3rd 4th GoG IGF Donor Lead
Collaborating
Economic Development Agricultural Development
Organize farmers day celebration by December 2018
Kpandai 2018 Farmers Day Celebrations Organized In December
1 1 1 1 35,000.00 140,000.00
DAD KDA
Economic Development Agricultural Development
Support The Planning Unit To Organize Dpcu Quarterly Review Meetings
Organized And Sponsored Dpcu Quarterly Review Meetings In Kda
1 1 1 1 1,500.00 6,000.00 DAD KDA
Economic Development Agricultural Development
Train 50 farmers on SMART Climate Change Agriculture
50 farmers Trained on SMART Climate Change Agriculture annually
1 1 1 1 2,400.00 9,600.00 DAD KDA
Economic development
- No. of AEAs trained on symptoms and treatment of basic disease in livestock and poultry
1 10,000
DAD DP
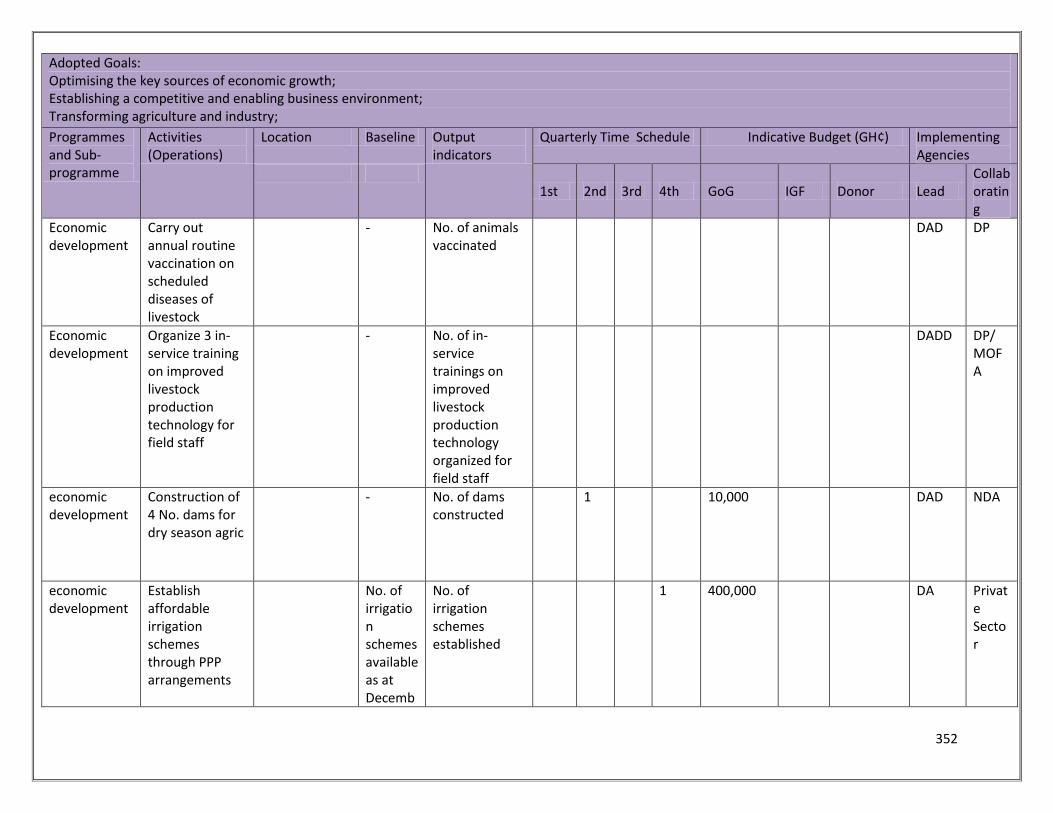
352
Adopted Goals: Optimising the key sources of economic growth; Establishing a competitive and enabling business environment; Transforming agriculture and industry;
Programmes and Sub-programme
Activities (Operations)
Location Baseline Output indicators
Quarterly Time Schedule Indicative Budget (GH¢) Implementing Agencies
1st 2nd 3rd 4th GoG IGF Donor Lead
Collaborating
Economic development
Carry out annual routine vaccination on scheduled diseases of livestock
- No. of animals vaccinated
DAD DP
Economic development
Organize 3 in-service training on improved livestock production technology for field staff
- No. of in-service trainings on improved livestock production technology organized for field staff
DADD DP/ MOFA
economic development
Construction of 4 No. dams for dry season agric
- No. of dams constructed
1 10,000 DAD NDA
economic development
Establish affordable irrigation schemes through PPP arrangements
No. of irrigation schemes available as at Decemb
No. of irrigation schemes established
1 400,000 DA Private Sector
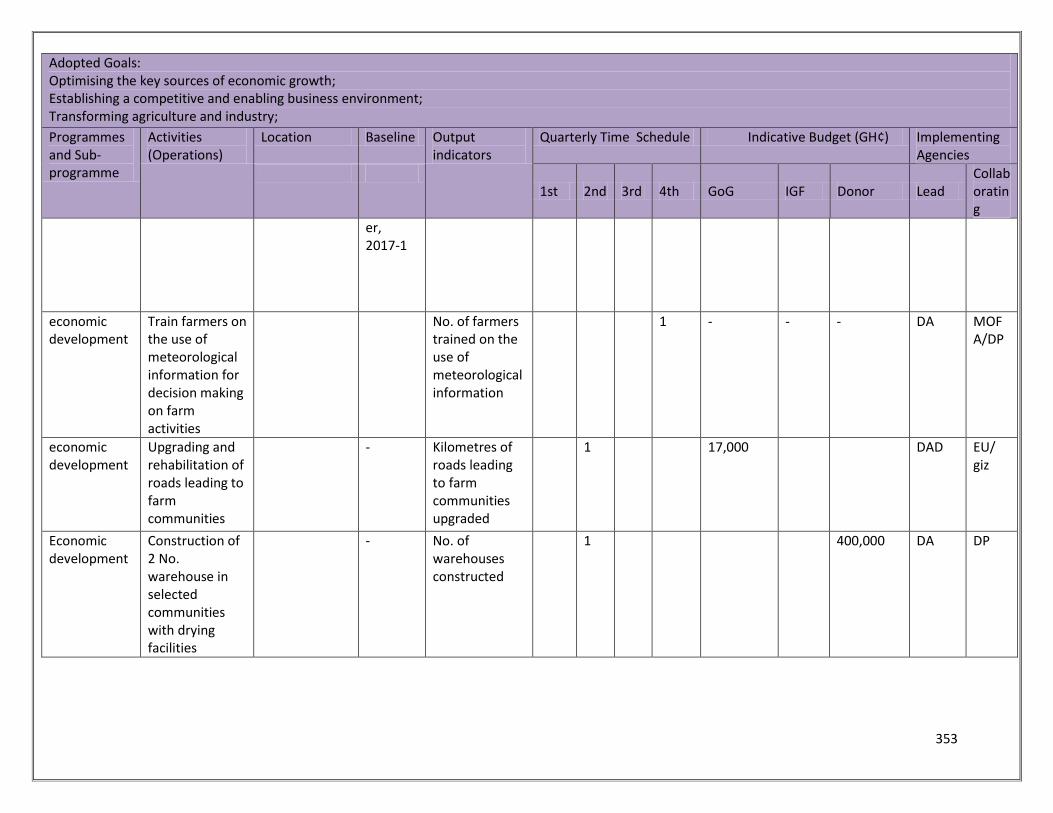
353
Adopted Goals: Optimising the key sources of economic growth; Establishing a competitive and enabling business environment; Transforming agriculture and industry;
Programmes and Sub-programme
Activities (Operations)
Location Baseline Output indicators
Quarterly Time Schedule Indicative Budget (GH¢) Implementing Agencies
1st 2nd 3rd 4th GoG IGF Donor Lead
Collaborating
er, 2017-1
economic development
Train farmers on the use of meteorological information for decision making on farm activities
No. of farmers trained on the use of meteorological information
1 - - - DA MOFA/DP
economic development
Upgrading and rehabilitation of roads leading to farm communities
- Kilometres of roads leading to farm communities upgraded
1 17,000 DAD EU/ giz
Economic development
Construction of 2 No. warehouse in selected communities with drying facilities
- No. of warehouses constructed
1 400,000 DA DP
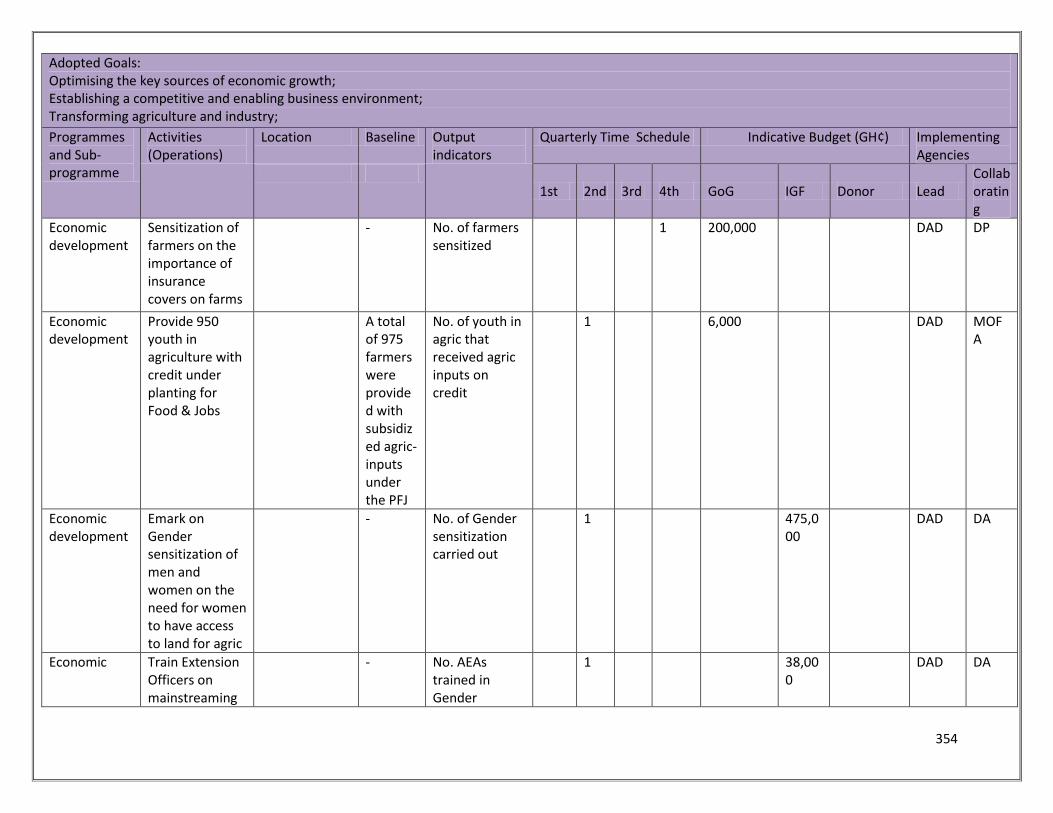
354
Adopted Goals: Optimising the key sources of economic growth; Establishing a competitive and enabling business environment; Transforming agriculture and industry;
Programmes and Sub-programme
Activities (Operations)
Location Baseline Output indicators
Quarterly Time Schedule Indicative Budget (GH¢) Implementing Agencies
1st 2nd 3rd 4th GoG IGF Donor Lead
Collaborating
Economic development
Sensitization of farmers on the importance of insurance covers on farms
- No. of farmers sensitized
1 200,000 DAD DP
Economic development
Provide 950 youth in agriculture with credit under planting for Food & Jobs
A total of 975 farmers were provided with subsidized agric-inputs under the PFJ
No. of youth in agric that received agric inputs on credit
1 6,000 DAD MOFA
Economic development
Emark on Gender sensitization of men and women on the need for women to have access to land for agric
- No. of Gender sensitization carried out
1 475,000
DAD DA
Economic Train Extension Officers on mainstreaming
- No. AEAs trained in Gender
1 38,000
DAD DA
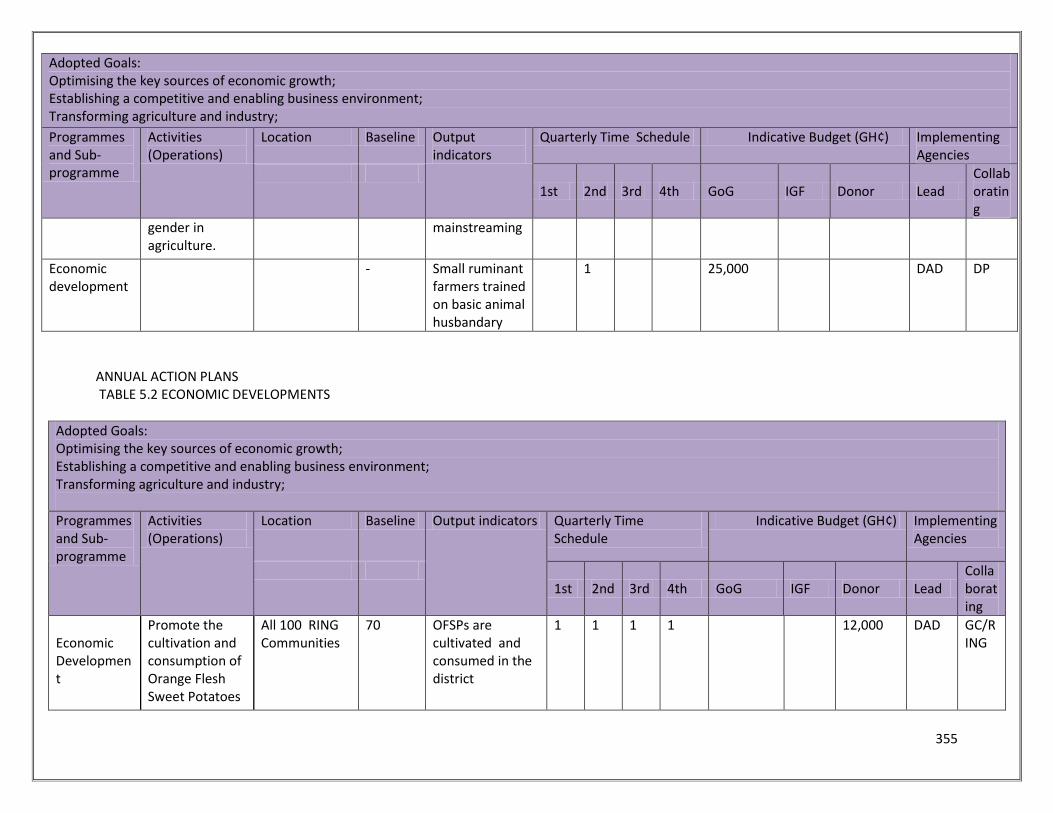
355
Adopted Goals: Optimising the key sources of economic growth; Establishing a competitive and enabling business environment; Transforming agriculture and industry;
Programmes and Sub-programme
Activities (Operations)
Location Baseline Output indicators
Quarterly Time Schedule Indicative Budget (GH¢) Implementing Agencies
1st 2nd 3rd 4th GoG IGF Donor Lead
Collaborating
gender in agriculture.
mainstreaming
Economic development
- Small ruminant farmers trained on basic animal husbandary
1 25,000 DAD DP
ANNUAL ACTION PLANS TABLE 5.2 ECONOMIC DEVELOPMENTS
Adopted Goals: Optimising the key sources of economic growth; Establishing a competitive and enabling business environment; Transforming agriculture and industry;
Programmes and Sub-programme
Activities (Operations)
Location Baseline Output indicators Quarterly Time Schedule
Indicative Budget (GH¢) Implementing Agencies
1st 2nd 3rd 4th GoG IGF Donor Lead
Collaborating
Economic Development
Promote the cultivation and consumption of Orange Flesh Sweet Potatoes
All 100 RING Communities
70 OFSPs are cultivated and consumed in the district
1 1 1 1 12,000 DAD GC/RING
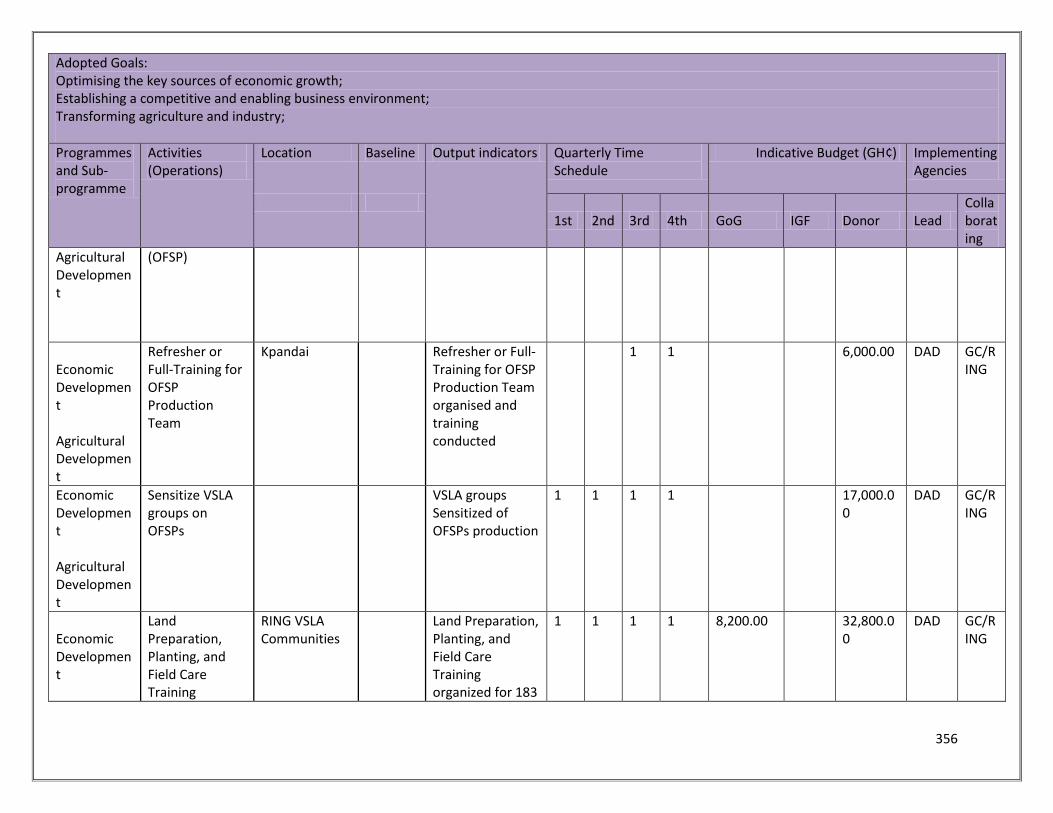
356
Adopted Goals: Optimising the key sources of economic growth; Establishing a competitive and enabling business environment; Transforming agriculture and industry;
Programmes and Sub-programme
Activities (Operations)
Location Baseline Output indicators Quarterly Time Schedule
Indicative Budget (GH¢) Implementing Agencies
1st 2nd 3rd 4th GoG IGF Donor Lead
Collaborating
Agricultural Development
(OFSP)
Economic Development Agricultural Development
Refresher or Full-Training for OFSP Production Team
Kpandai Refresher or Full-Training for OFSP Production Team organised and training conducted
1 1 6,000.00 DAD GC/RING
Economic Development Agricultural Development
Sensitize VSLA groups on OFSPs
VSLA groups Sensitized of OFSPs production
1 1 1 1 17,000.00
DAD GC/RING
Economic Development
Land Preparation, Planting, and Field Care Training
RING VSLA Communities
Land Preparation, Planting, and Field Care Training organized for 183
1 1 1 1 8,200.00 32,800.00
DAD GC/RING
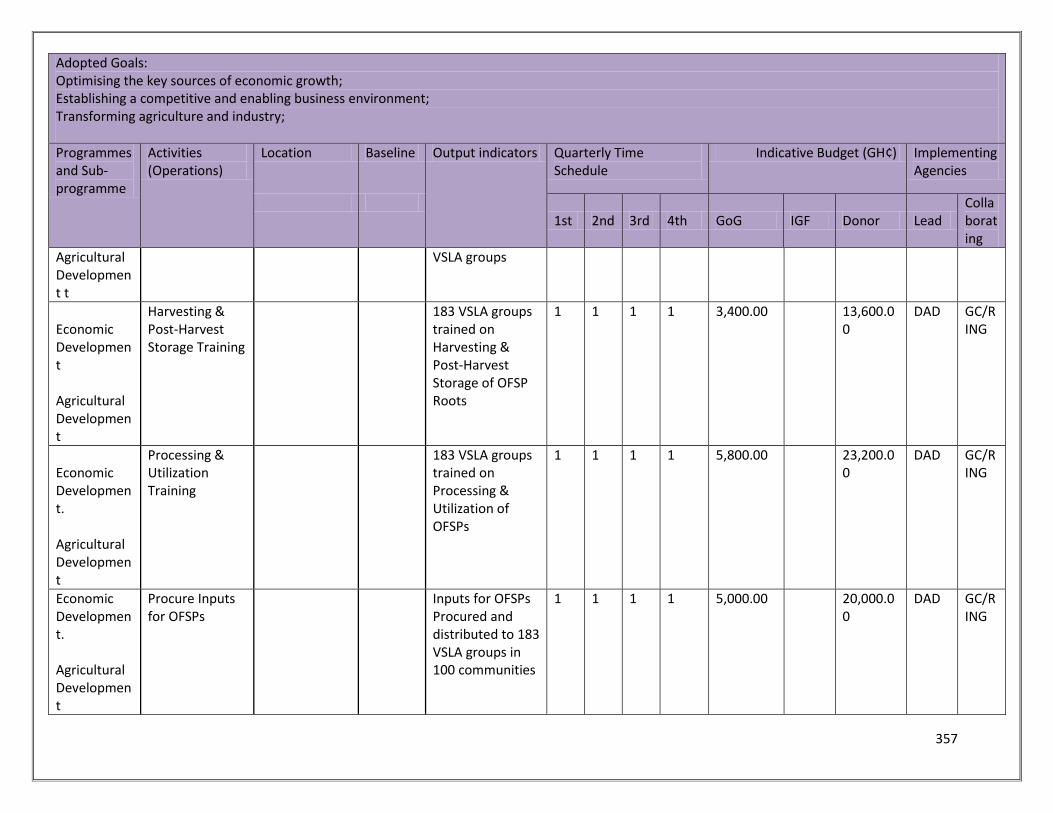
357
Adopted Goals: Optimising the key sources of economic growth; Establishing a competitive and enabling business environment; Transforming agriculture and industry;
Programmes and Sub-programme
Activities (Operations)
Location Baseline Output indicators Quarterly Time Schedule
Indicative Budget (GH¢) Implementing Agencies
1st 2nd 3rd 4th GoG IGF Donor Lead
Collaborating
Agricultural Development t
VSLA groups
Economic Development Agricultural Development
Harvesting & Post-Harvest Storage Training
183 VSLA groups trained on Harvesting & Post-Harvest Storage of OFSP Roots
1 1 1 1 3,400.00 13,600.00
DAD GC/RING
Economic Development. Agricultural Development
Processing & Utilization Training
183 VSLA groups trained on Processing & Utilization of OFSPs
1 1 1 1 5,800.00 23,200.00
DAD GC/RING
Economic Development. Agricultural Development
Procure Inputs for OFSPs
Inputs for OFSPs Procured and distributed to 183 VSLA groups in 100 communities
1 1 1 1 5,000.00 20,000.00
DAD GC/RING
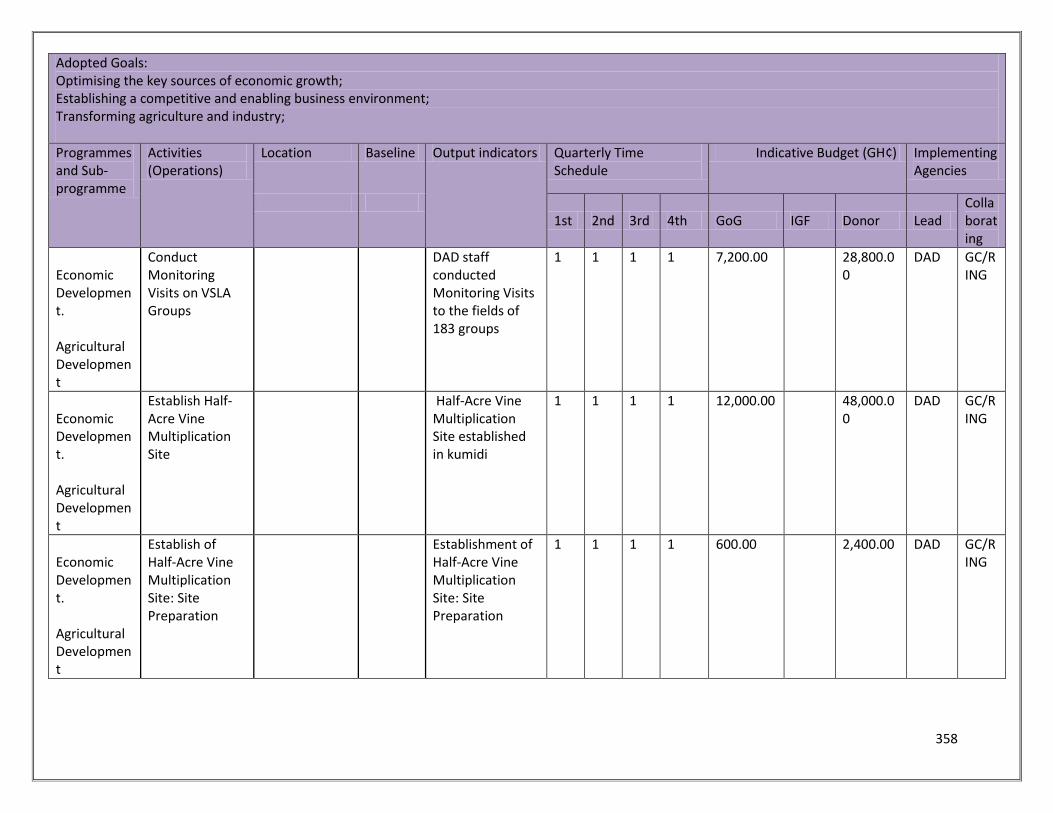
358
Adopted Goals: Optimising the key sources of economic growth; Establishing a competitive and enabling business environment; Transforming agriculture and industry;
Programmes and Sub-programme
Activities (Operations)
Location Baseline Output indicators Quarterly Time Schedule
Indicative Budget (GH¢) Implementing Agencies
1st 2nd 3rd 4th GoG IGF Donor Lead
Collaborating
Economic Development. Agricultural Development
Conduct Monitoring Visits on VSLA Groups
DAD staff conducted Monitoring Visits to the fields of 183 groups
1 1 1 1 7,200.00 28,800.00
DAD GC/RING
Economic Development. Agricultural Development
Establish Half-Acre Vine Multiplication Site
Half-Acre Vine Multiplication Site established in kumidi
1 1 1 1 12,000.00 48,000.00
DAD GC/RING
Economic Development. Agricultural Development
Establish of Half-Acre Vine Multiplication Site: Site Preparation
Establishment of Half-Acre Vine Multiplication Site: Site Preparation
1 1 1 1 600.00 2,400.00 DAD GC/RING
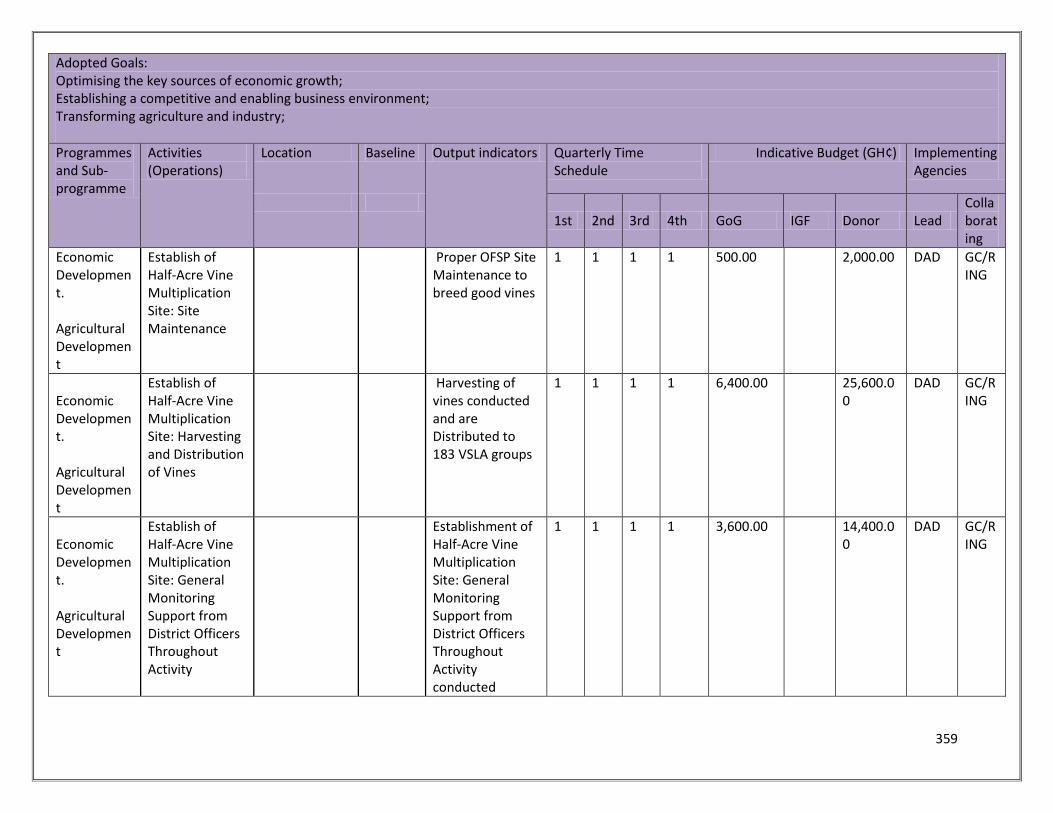
359
Adopted Goals: Optimising the key sources of economic growth; Establishing a competitive and enabling business environment; Transforming agriculture and industry;
Programmes and Sub-programme
Activities (Operations)
Location Baseline Output indicators Quarterly Time Schedule
Indicative Budget (GH¢) Implementing Agencies
1st 2nd 3rd 4th GoG IGF Donor Lead
Collaborating
Economic Development. Agricultural Development
Establish of Half-Acre Vine Multiplication Site: Site Maintenance
Proper OFSP Site Maintenance to breed good vines
1 1 1 1 500.00 2,000.00 DAD GC/RING
Economic Development. Agricultural Development
Establish of Half-Acre Vine Multiplication Site: Harvesting and Distribution of Vines
Harvesting of vines conducted and are Distributed to 183 VSLA groups
1 1 1 1 6,400.00 25,600.00
DAD GC/RING
Economic Development. Agricultural Development
Establish of Half-Acre Vine Multiplication Site: General Monitoring Support from District Officers Throughout Activity
Establishment of Half-Acre Vine Multiplication Site: General Monitoring Support from District Officers Throughout Activity conducted
1 1 1 1 3,600.00 14,400.00
DAD GC/RING
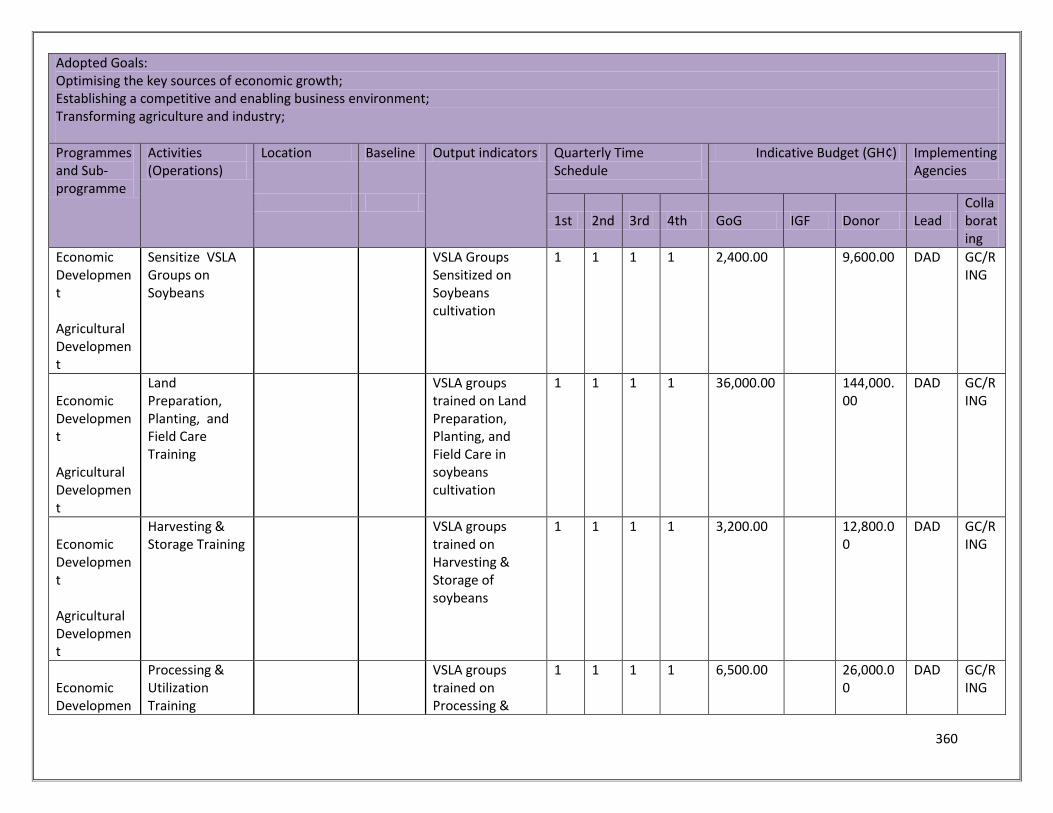
360
Adopted Goals: Optimising the key sources of economic growth; Establishing a competitive and enabling business environment; Transforming agriculture and industry;
Programmes and Sub-programme
Activities (Operations)
Location Baseline Output indicators Quarterly Time Schedule
Indicative Budget (GH¢) Implementing Agencies
1st 2nd 3rd 4th GoG IGF Donor Lead
Collaborating
Economic Development Agricultural Development
Sensitize VSLA Groups on Soybeans
VSLA Groups Sensitized on Soybeans cultivation
1 1 1 1 2,400.00 9,600.00 DAD GC/RING
Economic Development Agricultural Development
Land Preparation, Planting, and Field Care Training
VSLA groups trained on Land Preparation, Planting, and Field Care in soybeans cultivation
1 1 1 1 36,000.00 144,000.00
DAD GC/RING
Economic Development Agricultural Development
Harvesting & Storage Training
VSLA groups trained on Harvesting & Storage of soybeans
1 1 1 1 3,200.00 12,800.00
DAD GC/RING
Economic Developmen
Processing & Utilization Training
VSLA groups trained on Processing &
1 1 1 1 6,500.00 26,000.00
DAD GC/RING
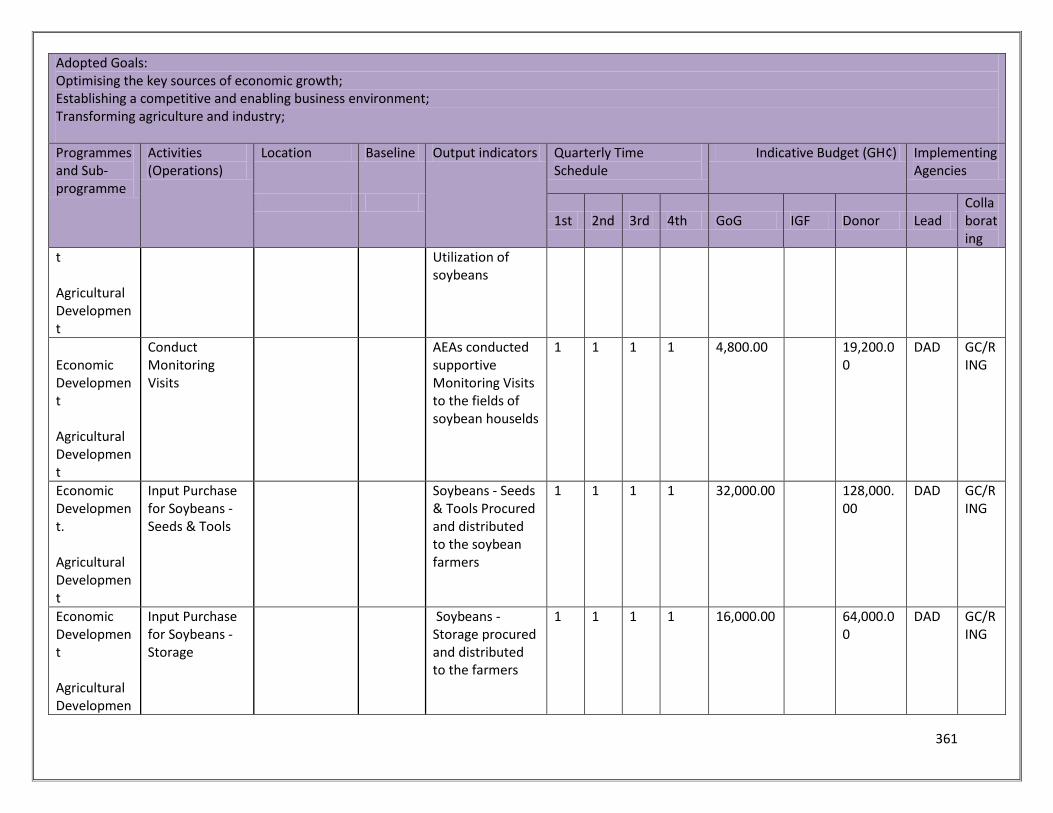
361
Adopted Goals: Optimising the key sources of economic growth; Establishing a competitive and enabling business environment; Transforming agriculture and industry;
Programmes and Sub-programme
Activities (Operations)
Location Baseline Output indicators Quarterly Time Schedule
Indicative Budget (GH¢) Implementing Agencies
1st 2nd 3rd 4th GoG IGF Donor Lead
Collaborating
t Agricultural Development
Utilization of soybeans
Economic Development Agricultural Development
Conduct Monitoring Visits
AEAs conducted supportive Monitoring Visits to the fields of soybean houselds
1 1 1 1 4,800.00 19,200.00
DAD GC/RING
Economic Development. Agricultural Development
Input Purchase for Soybeans - Seeds & Tools
Soybeans - Seeds & Tools Procured and distributed to the soybean farmers
1 1 1 1 32,000.00 128,000.00
DAD GC/RING
Economic Development Agricultural Developmen
Input Purchase for Soybeans - Storage
Soybeans - Storage procured and distributed to the farmers
1 1 1 1 16,000.00 64,000.00
DAD GC/RING
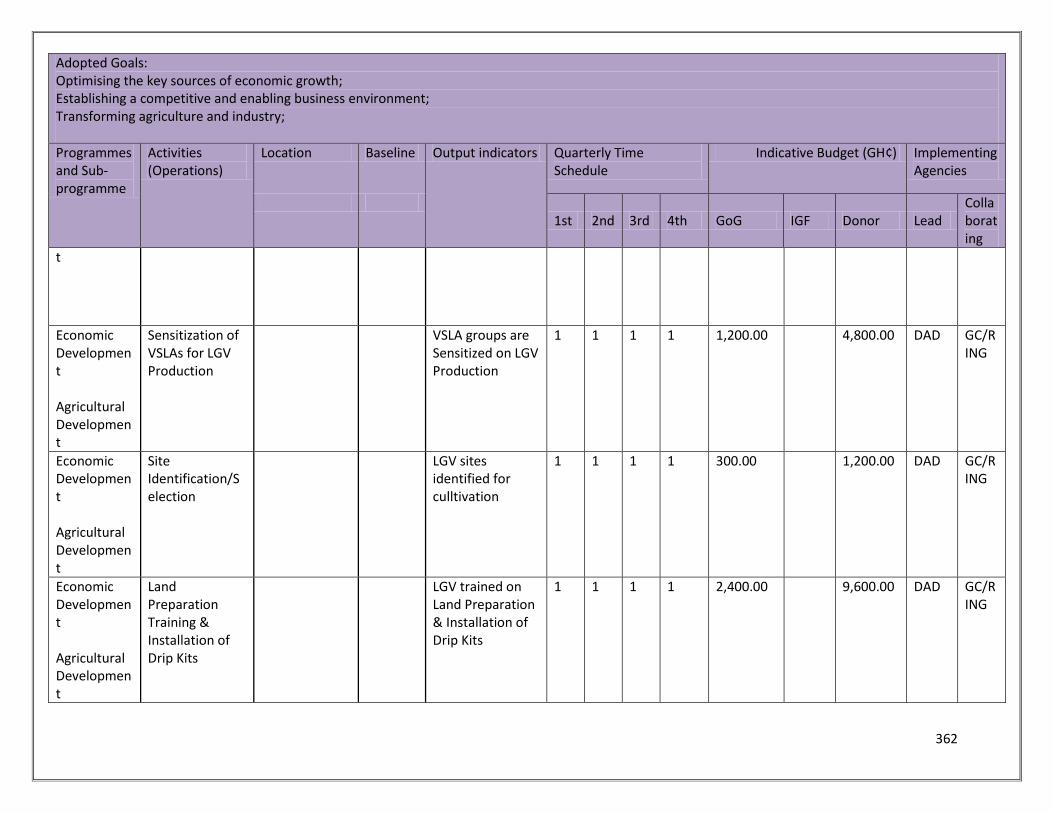
362
Adopted Goals: Optimising the key sources of economic growth; Establishing a competitive and enabling business environment; Transforming agriculture and industry;
Programmes and Sub-programme
Activities (Operations)
Location Baseline Output indicators Quarterly Time Schedule
Indicative Budget (GH¢) Implementing Agencies
1st 2nd 3rd 4th GoG IGF Donor Lead
Collaborating
t
Economic Development Agricultural Development
Sensitization of VSLAs for LGV Production
VSLA groups are Sensitized on LGV Production
1 1 1 1 1,200.00 4,800.00 DAD GC/RING
Economic Development Agricultural Development
Site Identification/Selection
LGV sites identified for culltivation
1 1 1 1 300.00 1,200.00 DAD GC/RING
Economic Development Agricultural Development
Land Preparation Training & Installation of Drip Kits
LGV trained on Land Preparation & Installation of Drip Kits
1 1 1 1 2,400.00 9,600.00 DAD GC/RING
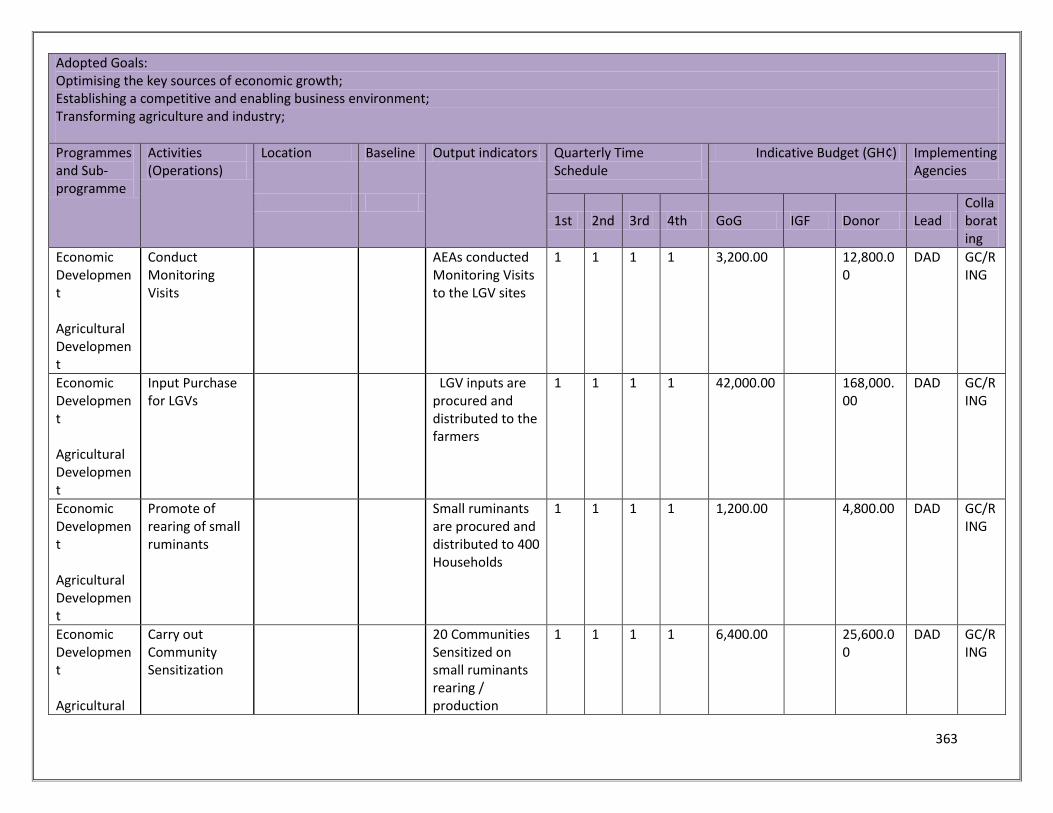
363
Adopted Goals: Optimising the key sources of economic growth; Establishing a competitive and enabling business environment; Transforming agriculture and industry;
Programmes and Sub-programme
Activities (Operations)
Location Baseline Output indicators Quarterly Time Schedule
Indicative Budget (GH¢) Implementing Agencies
1st 2nd 3rd 4th GoG IGF Donor Lead
Collaborating
Economic Development Agricultural Development
Conduct Monitoring Visits
AEAs conducted Monitoring Visits to the LGV sites
1 1 1 1 3,200.00 12,800.00
DAD GC/RING
Economic Development Agricultural Development
Input Purchase for LGVs
LGV inputs are procured and distributed to the farmers
1 1 1 1 42,000.00 168,000.00
DAD GC/RING
Economic Development Agricultural Development
Promote of rearing of small ruminants
Small ruminants are procured and distributed to 400 Households
1 1 1 1 1,200.00 4,800.00 DAD GC/RING
Economic Development Agricultural
Carry out Community Sensitization
20 Communities Sensitized on small ruminants rearing / production
1 1 1 1 6,400.00 25,600.00
DAD GC/RING
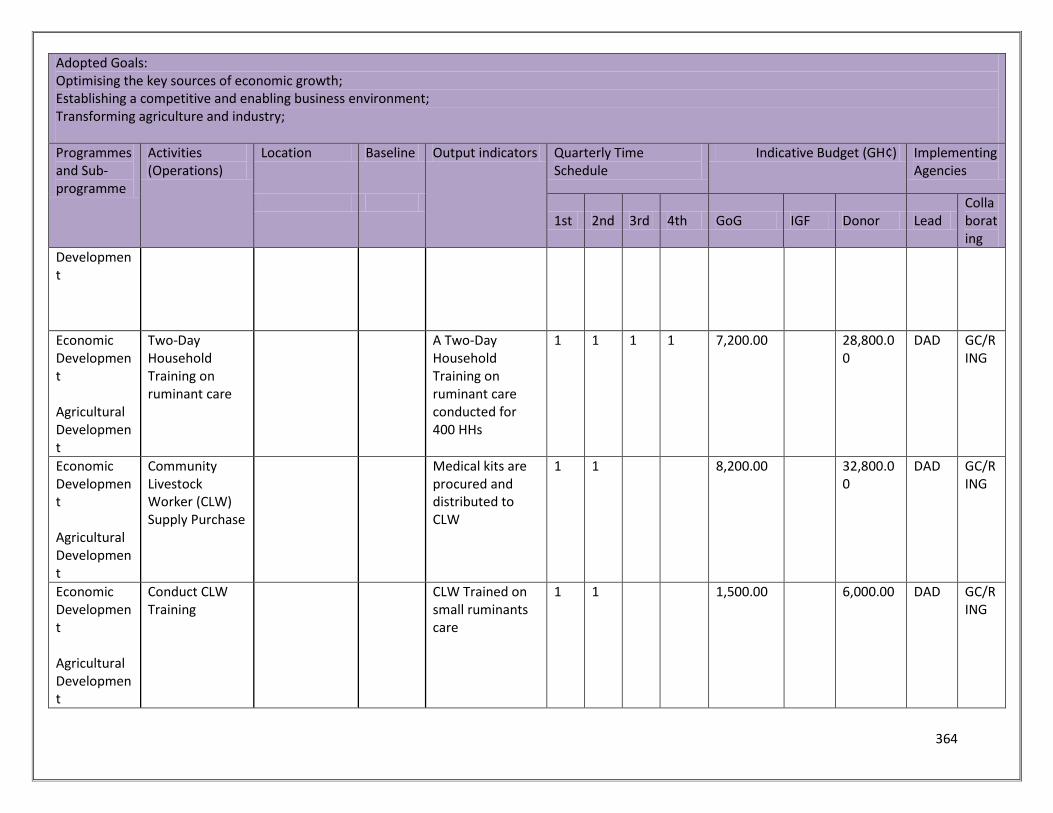
364
Adopted Goals: Optimising the key sources of economic growth; Establishing a competitive and enabling business environment; Transforming agriculture and industry;
Programmes and Sub-programme
Activities (Operations)
Location Baseline Output indicators Quarterly Time Schedule
Indicative Budget (GH¢) Implementing Agencies
1st 2nd 3rd 4th GoG IGF Donor Lead
Collaborating
Development
Economic Development Agricultural Development
Two-Day Household Training on ruminant care
A Two-Day Household Training on ruminant care conducted for 400 HHs
1 1 1 1 7,200.00 28,800.00
DAD GC/RING
Economic Development Agricultural Development
Community Livestock Worker (CLW) Supply Purchase
Medical kits are procured and distributed to CLW
1 1 8,200.00 32,800.00
DAD GC/RING
Economic Development Agricultural Development
Conduct CLW Training
CLW Trained on small ruminants care
1 1 1,500.00 6,000.00 DAD GC/RING
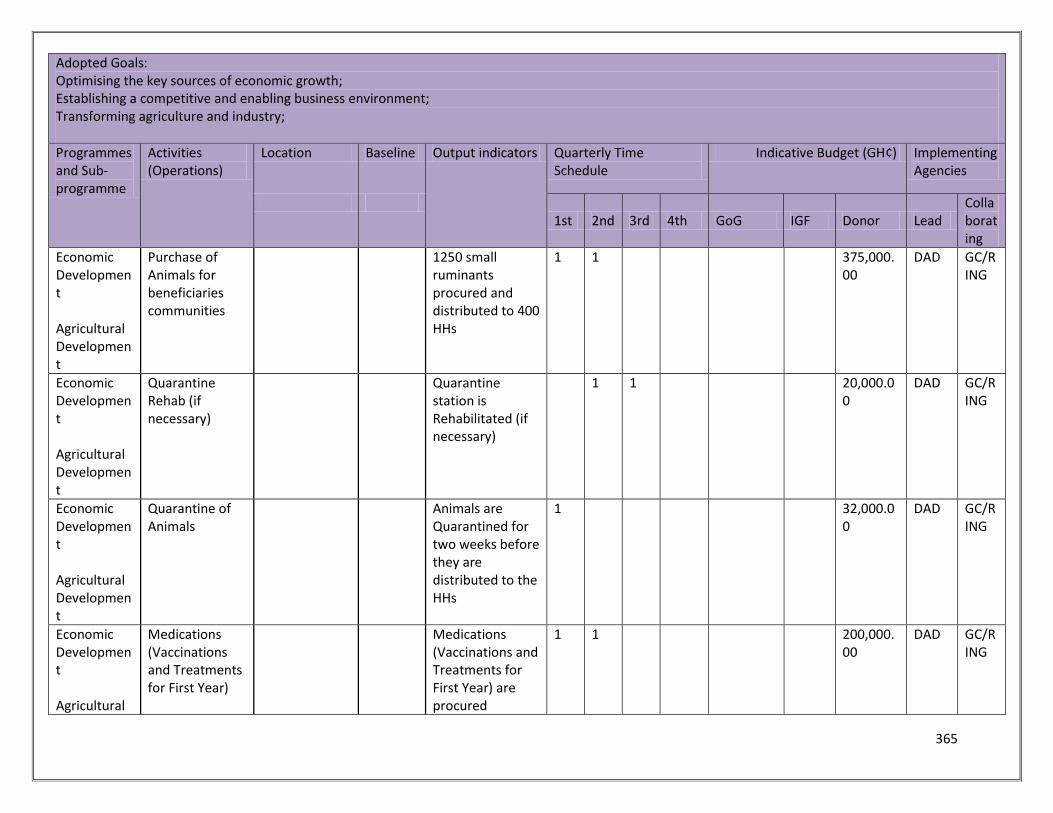
365
Adopted Goals: Optimising the key sources of economic growth; Establishing a competitive and enabling business environment; Transforming agriculture and industry;
Programmes and Sub-programme
Activities (Operations)
Location Baseline Output indicators Quarterly Time Schedule
Indicative Budget (GH¢) Implementing Agencies
1st 2nd 3rd 4th GoG IGF Donor Lead
Collaborating
Economic Development Agricultural Development
Purchase of Animals for beneficiaries communities
1250 small ruminants procured and distributed to 400 HHs
1 1 375,000.00
DAD GC/RING
Economic Development Agricultural Development
Quarantine Rehab (if necessary)
Quarantine station is Rehabilitated (if necessary)
1 1 20,000.00
DAD GC/RING
Economic Development Agricultural Development
Quarantine of Animals
Animals are Quarantined for two weeks before they are distributed to the HHs
1 32,000.00
DAD GC/RING
Economic Development Agricultural
Medications (Vaccinations and Treatments for First Year)
Medications (Vaccinations and Treatments for First Year) are procured
1 1 200,000.00
DAD GC/RING
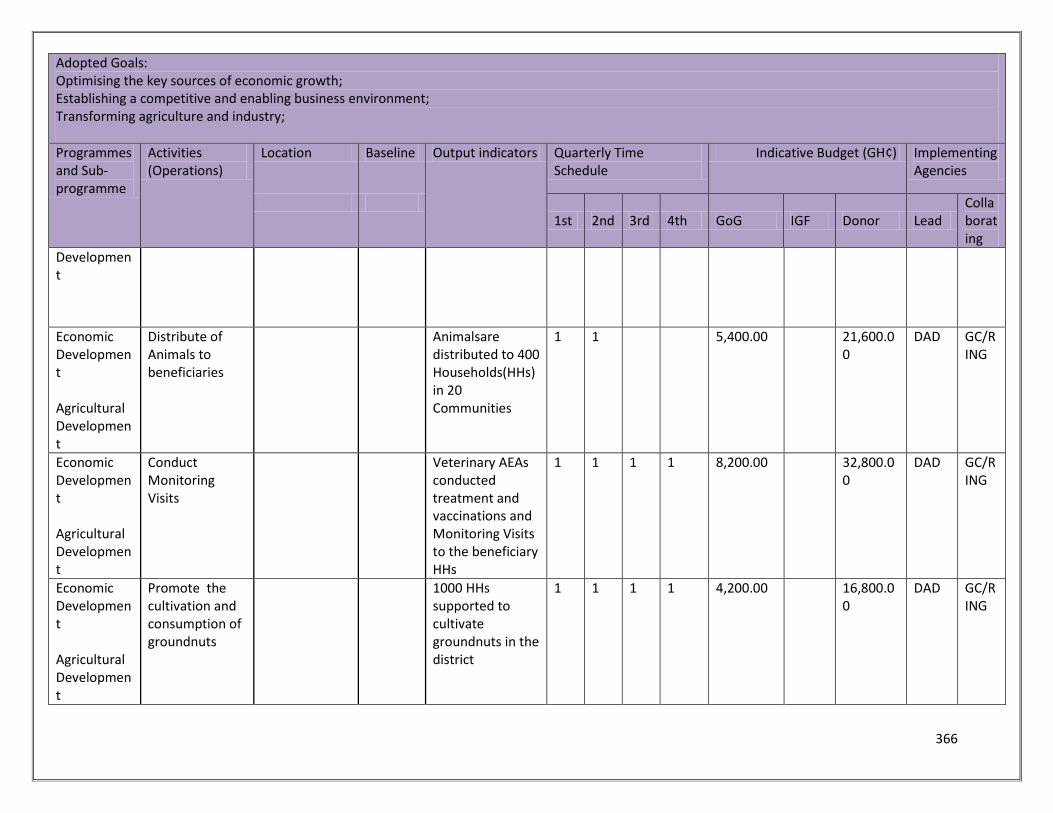
366
Adopted Goals: Optimising the key sources of economic growth; Establishing a competitive and enabling business environment; Transforming agriculture and industry;
Programmes and Sub-programme
Activities (Operations)
Location Baseline Output indicators Quarterly Time Schedule
Indicative Budget (GH¢) Implementing Agencies
1st 2nd 3rd 4th GoG IGF Donor Lead
Collaborating
Development
Economic Development Agricultural Development
Distribute of Animals to beneficiaries
Animalsare distributed to 400 Households(HHs) in 20 Communities
1 1 5,400.00 21,600.00
DAD GC/RING
Economic Development Agricultural Development
Conduct Monitoring Visits
Veterinary AEAs conducted treatment and vaccinations and Monitoring Visits to the beneficiary HHs
1 1 1 1 8,200.00 32,800.00
DAD GC/RING
Economic Development Agricultural Development
Promote the cultivation and consumption of groundnuts
1000 HHs supported to cultivate groundnuts in the district
1 1 1 1 4,200.00 16,800.00
DAD GC/RING
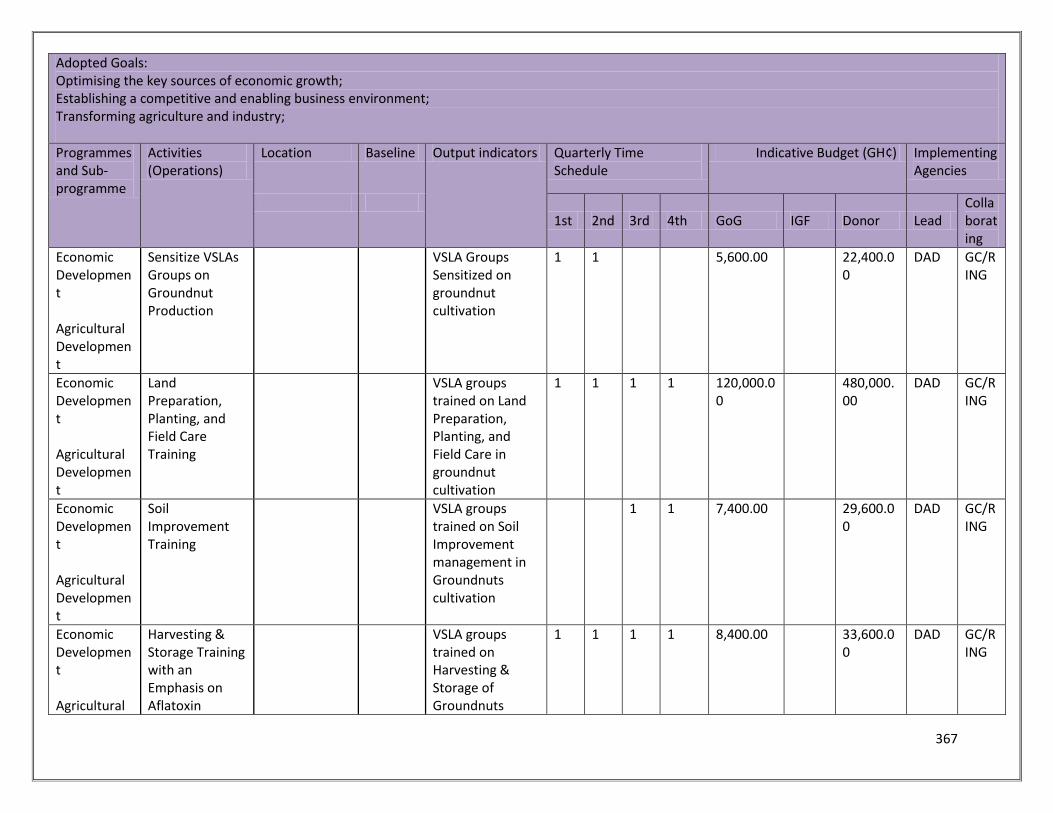
367
Adopted Goals: Optimising the key sources of economic growth; Establishing a competitive and enabling business environment; Transforming agriculture and industry;
Programmes and Sub-programme
Activities (Operations)
Location Baseline Output indicators Quarterly Time Schedule
Indicative Budget (GH¢) Implementing Agencies
1st 2nd 3rd 4th GoG IGF Donor Lead
Collaborating
Economic Development Agricultural Development
Sensitize VSLAs Groups on Groundnut Production
VSLA Groups Sensitized on groundnut cultivation
1 1 5,600.00 22,400.00
DAD GC/RING
Economic Development Agricultural Development
Land Preparation, Planting, and Field Care Training
VSLA groups trained on Land Preparation, Planting, and Field Care in groundnut cultivation
1 1 1 1 120,000.00
480,000.00
DAD GC/RING
Economic Development Agricultural Development
Soil Improvement Training
VSLA groups trained on Soil Improvement management in Groundnuts cultivation
1 1 7,400.00 29,600.00
DAD GC/RING
Economic Development Agricultural
Harvesting & Storage Training with an Emphasis on Aflatoxin
VSLA groups trained on Harvesting & Storage of Groundnuts
1 1 1 1 8,400.00 33,600.00
DAD GC/RING
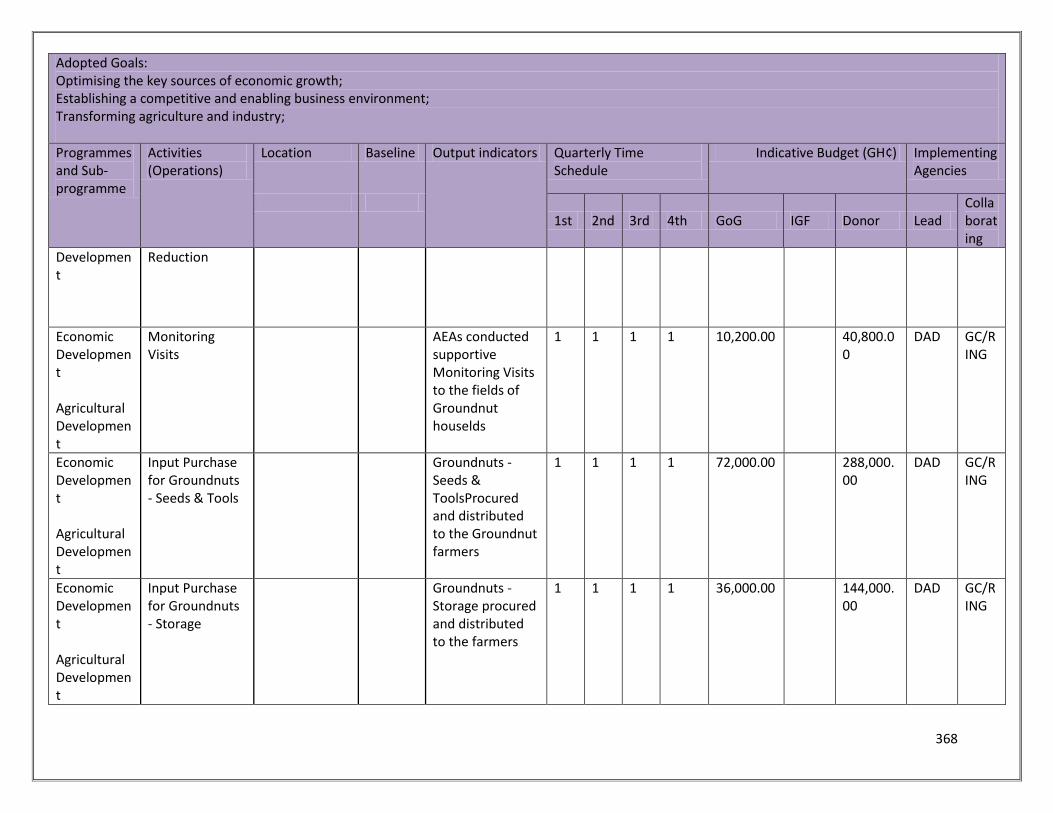
368
Adopted Goals: Optimising the key sources of economic growth; Establishing a competitive and enabling business environment; Transforming agriculture and industry;
Programmes and Sub-programme
Activities (Operations)
Location Baseline Output indicators Quarterly Time Schedule
Indicative Budget (GH¢) Implementing Agencies
1st 2nd 3rd 4th GoG IGF Donor Lead
Collaborating
Development
Reduction
Economic Development Agricultural Development
Monitoring Visits
AEAs conducted supportive Monitoring Visits to the fields of Groundnut houselds
1 1 1 1 10,200.00 40,800.00
DAD GC/RING
Economic Development Agricultural Development
Input Purchase for Groundnuts - Seeds & Tools
Groundnuts - Seeds & ToolsProcured and distributed to the Groundnut farmers
1 1 1 1 72,000.00 288,000.00
DAD GC/RING
Economic Development Agricultural Development
Input Purchase for Groundnuts - Storage
Groundnuts - Storage procured and distributed to the farmers
1 1 1 1 36,000.00 144,000.00
DAD GC/RING
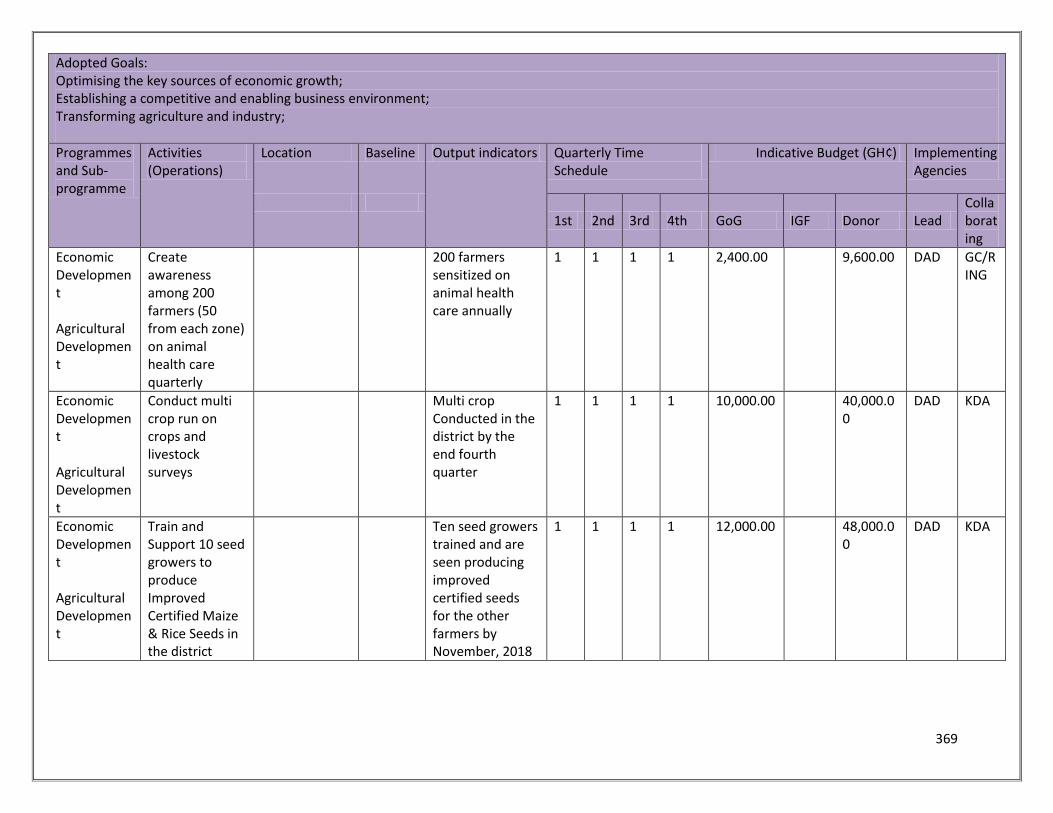
369
Adopted Goals: Optimising the key sources of economic growth; Establishing a competitive and enabling business environment; Transforming agriculture and industry;
Programmes and Sub-programme
Activities (Operations)
Location Baseline Output indicators Quarterly Time Schedule
Indicative Budget (GH¢) Implementing Agencies
1st 2nd 3rd 4th GoG IGF Donor Lead
Collaborating
Economic Development Agricultural Development
Create awareness among 200 farmers (50 from each zone) on animal health care quarterly
200 farmers sensitized on animal health care annually
1 1 1 1 2,400.00 9,600.00 DAD GC/RING
Economic Development Agricultural Development
Conduct multi crop run on crops and livestock surveys
Multi crop Conducted in the district by the end fourth quarter
1 1 1 1 10,000.00 40,000.00
DAD KDA
Economic Development Agricultural Development
Train and Support 10 seed growers to produce Improved Certified Maize & Rice Seeds in the district
Ten seed growers trained and are seen producing improved certified seeds for the other farmers by November, 2018
1 1 1 1 12,000.00 48,000.00
DAD KDA
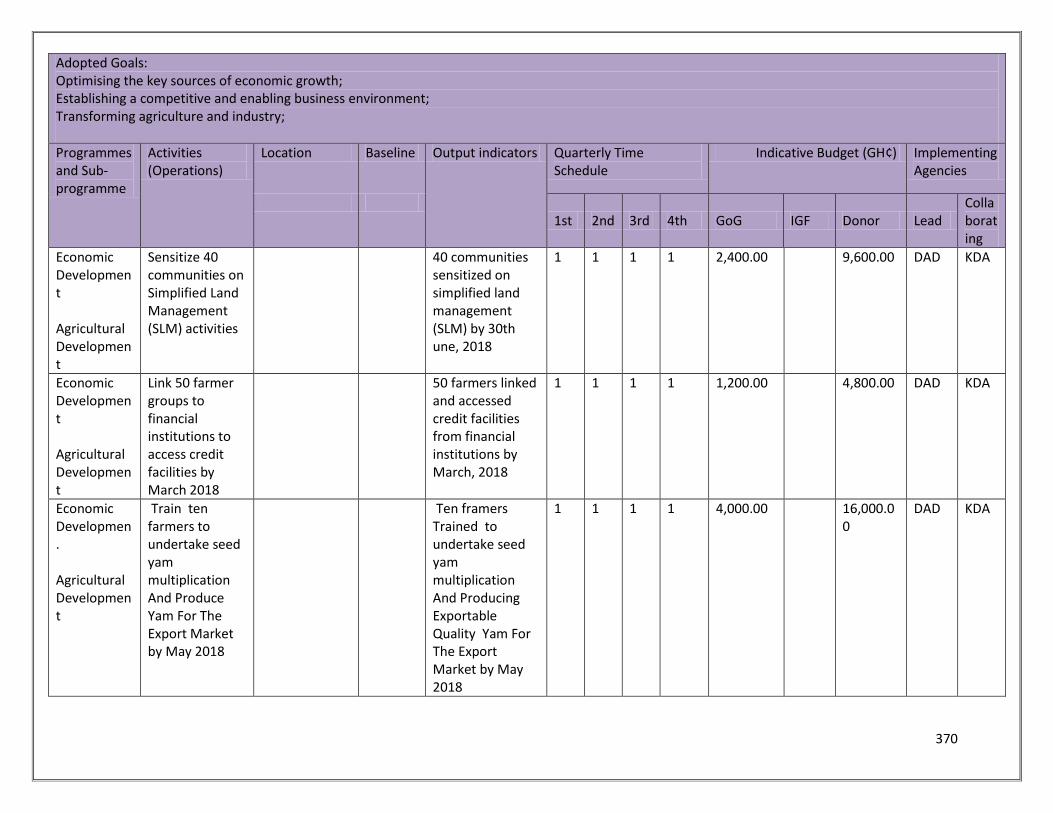
370
Adopted Goals: Optimising the key sources of economic growth; Establishing a competitive and enabling business environment; Transforming agriculture and industry;
Programmes and Sub-programme
Activities (Operations)
Location Baseline Output indicators Quarterly Time Schedule
Indicative Budget (GH¢) Implementing Agencies
1st 2nd 3rd 4th GoG IGF Donor Lead
Collaborating
Economic Development Agricultural Development
Sensitize 40 communities on Simplified Land Management (SLM) activities
40 communities sensitized on simplified land management (SLM) by 30th une, 2018
1 1 1 1 2,400.00 9,600.00 DAD KDA
Economic Development Agricultural Development
Link 50 farmer groups to financial institutions to access credit facilities by March 2018
50 farmers linked and accessed credit facilities from financial institutions by March, 2018
1 1 1 1 1,200.00 4,800.00 DAD KDA
Economic Developmen. Agricultural Development
Train ten farmers to undertake seed yam multiplication And Produce Yam For The Export Market by May 2018
Ten framers Trained to undertake seed yam multiplication And Producing Exportable Quality Yam For The Export Market by May 2018
1 1 1 1 4,000.00 16,000.00
DAD KDA
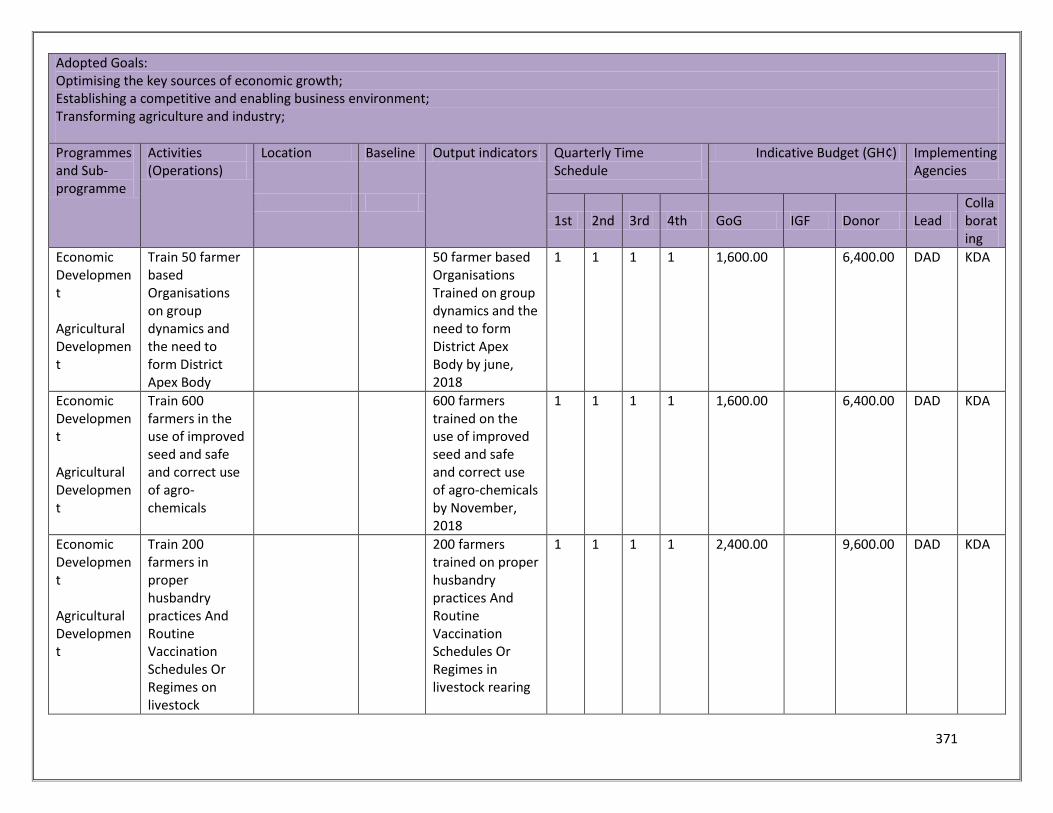
371
Adopted Goals: Optimising the key sources of economic growth; Establishing a competitive and enabling business environment; Transforming agriculture and industry;
Programmes and Sub-programme
Activities (Operations)
Location Baseline Output indicators Quarterly Time Schedule
Indicative Budget (GH¢) Implementing Agencies
1st 2nd 3rd 4th GoG IGF Donor Lead
Collaborating
Economic Development Agricultural Development
Train 50 farmer based Organisations on group dynamics and the need to form District Apex Body
50 farmer based Organisations Trained on group dynamics and the need to form District Apex Body by june, 2018
1 1 1 1 1,600.00 6,400.00 DAD KDA
Economic Development Agricultural Development
Train 600 farmers in the use of improved seed and safe and correct use of agro-chemicals
600 farmers trained on the use of improved seed and safe and correct use of agro-chemicals by November, 2018
1 1 1 1 1,600.00 6,400.00 DAD KDA
Economic Development Agricultural Development
Train 200 farmers in proper husbandry practices And Routine Vaccination Schedules Or Regimes on livestock
200 farmers trained on proper husbandry practices And Routine Vaccination Schedules Or Regimes in livestock rearing
1 1 1 1 2,400.00 9,600.00 DAD KDA
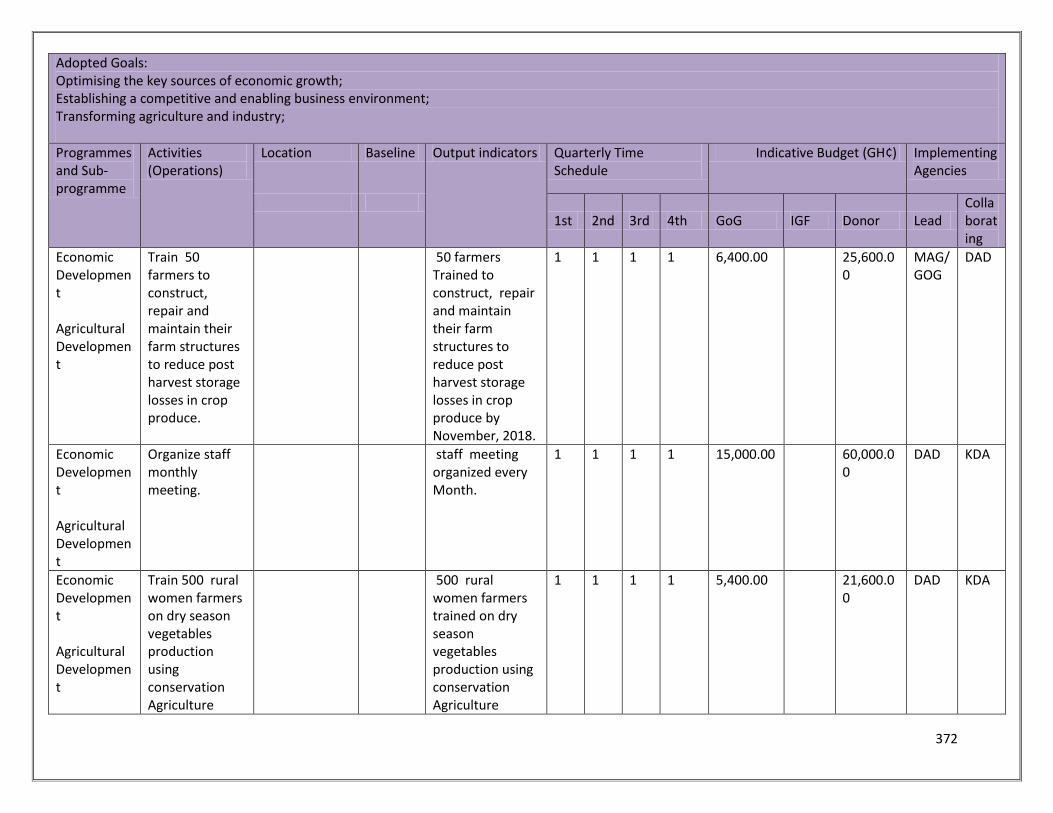
372
Adopted Goals: Optimising the key sources of economic growth; Establishing a competitive and enabling business environment; Transforming agriculture and industry;
Programmes and Sub-programme
Activities (Operations)
Location Baseline Output indicators Quarterly Time Schedule
Indicative Budget (GH¢) Implementing Agencies
1st 2nd 3rd 4th GoG IGF Donor Lead
Collaborating
Economic Development Agricultural Development
Train 50 farmers to construct, repair and maintain their farm structures to reduce post harvest storage losses in crop produce.
50 farmers Trained to construct, repair and maintain their farm structures to reduce post harvest storage losses in crop produce by November, 2018.
1 1 1 1 6,400.00 25,600.00
MAG/GOG
DAD
Economic Development Agricultural Development
Organize staff monthly meeting.
staff meeting organized every Month.
1 1 1 1 15,000.00 60,000.00
DAD KDA
Economic Development Agricultural Development
Train 500 rural women farmers on dry season vegetables production using conservation Agriculture
500 rural women farmers trained on dry season vegetables production using conservation Agriculture
1 1 1 1 5,400.00 21,600.00
DAD KDA
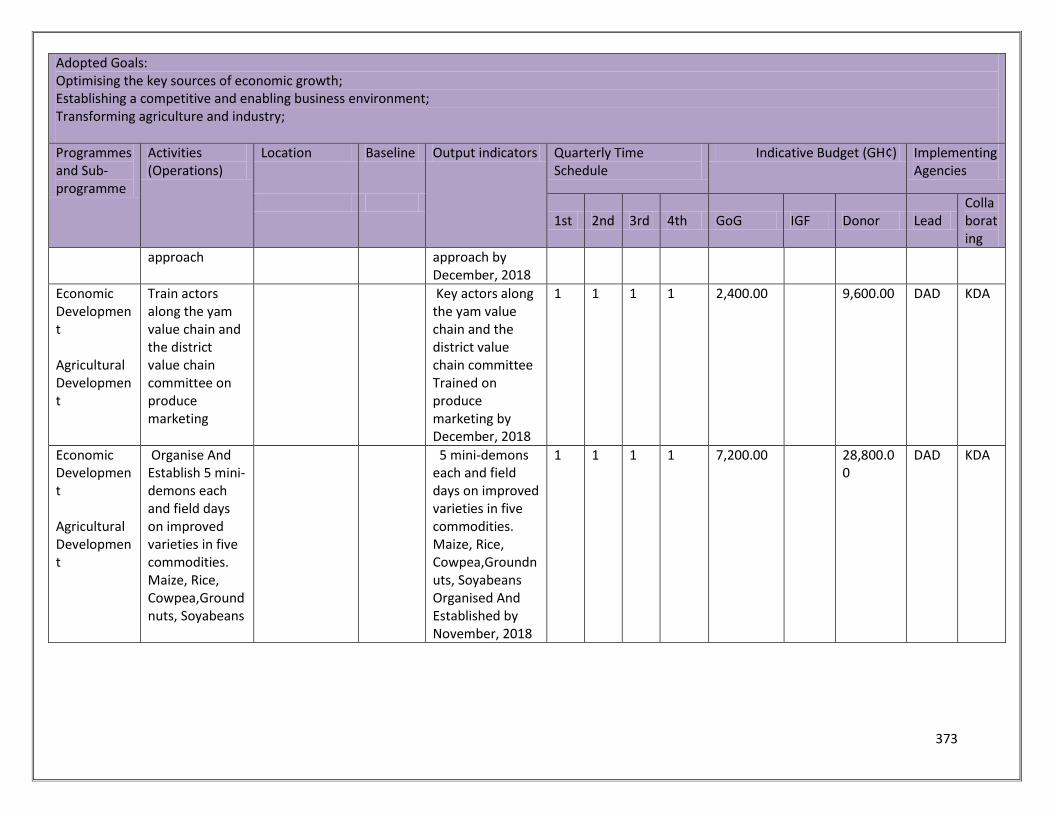
373
Adopted Goals: Optimising the key sources of economic growth; Establishing a competitive and enabling business environment; Transforming agriculture and industry;
Programmes and Sub-programme
Activities (Operations)
Location Baseline Output indicators Quarterly Time Schedule
Indicative Budget (GH¢) Implementing Agencies
1st 2nd 3rd 4th GoG IGF Donor Lead
Collaborating
approach approach by December, 2018
Economic Development Agricultural Development
Train actors along the yam value chain and the district value chain committee on produce marketing
Key actors along the yam value chain and the district value chain committee Trained on produce marketing by December, 2018
1 1 1 1 2,400.00 9,600.00 DAD KDA
Economic Development Agricultural Development
Organise And Establish 5 mini-demons each and field days on improved varieties in five commodities. Maize, Rice, Cowpea,Groundnuts, Soyabeans
5 mini-demons each and field days on improved varieties in five commodities. Maize, Rice, Cowpea,Groundnuts, Soyabeans Organised And Established by November, 2018
1 1 1 1 7,200.00 28,800.00
DAD KDA
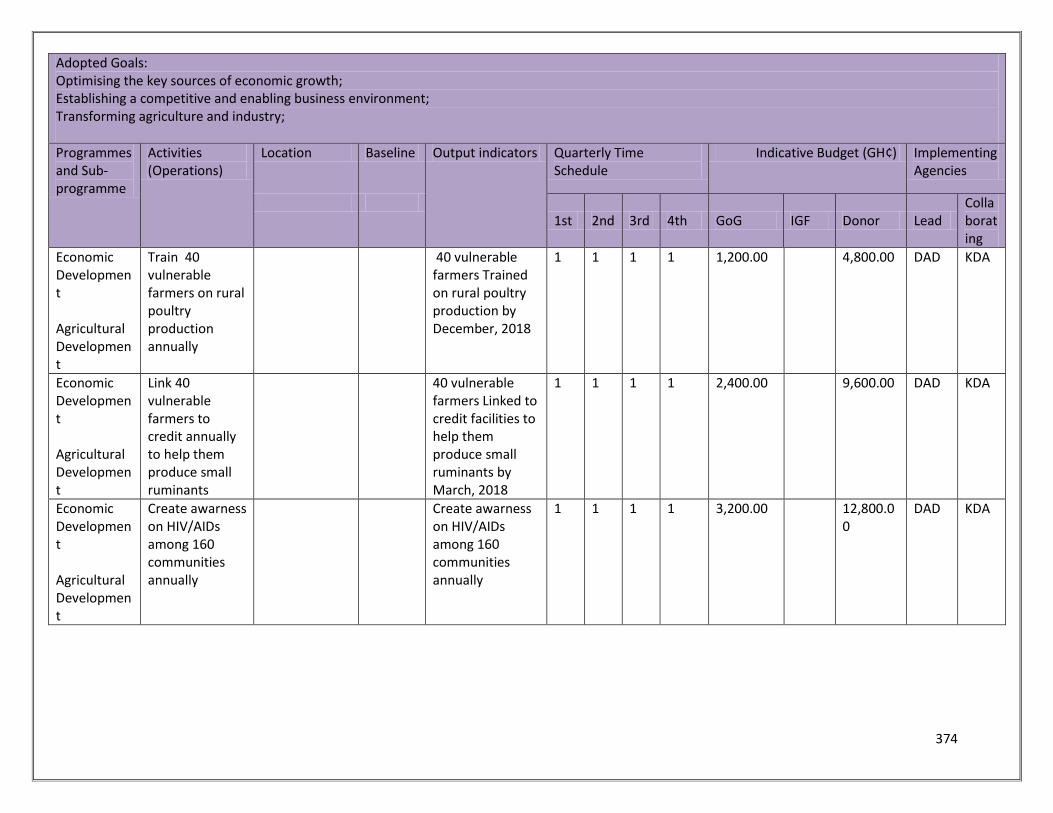
374
Adopted Goals: Optimising the key sources of economic growth; Establishing a competitive and enabling business environment; Transforming agriculture and industry;
Programmes and Sub-programme
Activities (Operations)
Location Baseline Output indicators Quarterly Time Schedule
Indicative Budget (GH¢) Implementing Agencies
1st 2nd 3rd 4th GoG IGF Donor Lead
Collaborating
Economic Development Agricultural Development
Train 40 vulnerable farmers on rural poultry production annually
40 vulnerable farmers Trained on rural poultry production by December, 2018
1 1 1 1 1,200.00 4,800.00 DAD KDA
Economic Development Agricultural Development
Link 40 vulnerable farmers to credit annually to help them produce small ruminants
40 vulnerable farmers Linked to credit facilities to help them produce small ruminants by March, 2018
1 1 1 1 2,400.00 9,600.00 DAD KDA
Economic Development Agricultural Development
Create awarness on HIV/AIDs among 160 communities annually
Create awarness on HIV/AIDs among 160 communities annually
1 1 1 1 3,200.00 12,800.00
DAD KDA
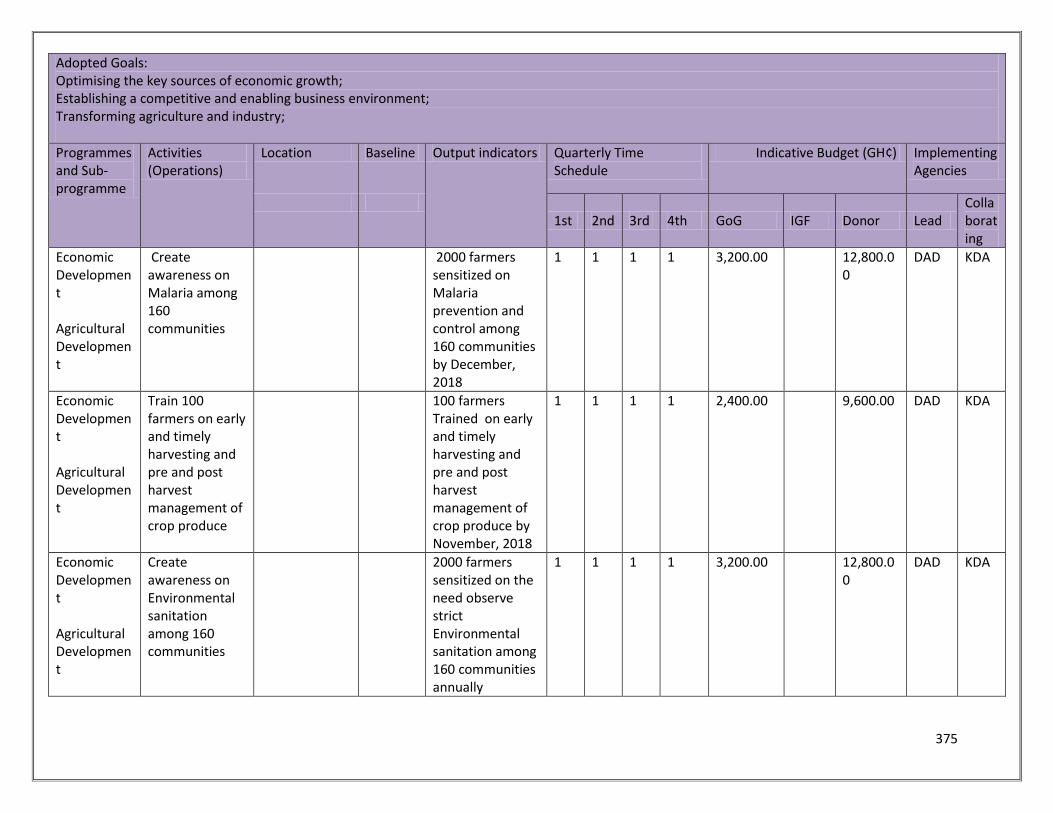
375
Adopted Goals: Optimising the key sources of economic growth; Establishing a competitive and enabling business environment; Transforming agriculture and industry;
Programmes and Sub-programme
Activities (Operations)
Location Baseline Output indicators Quarterly Time Schedule
Indicative Budget (GH¢) Implementing Agencies
1st 2nd 3rd 4th GoG IGF Donor Lead
Collaborating
Economic Development Agricultural Development
Create awareness on Malaria among 160 communities
2000 farmers sensitized on Malaria prevention and control among 160 communities by December, 2018
1 1 1 1 3,200.00 12,800.00
DAD KDA
Economic Development Agricultural Development
Train 100 farmers on early and timely harvesting and pre and post harvest management of crop produce
100 farmers Trained on early and timely harvesting and pre and post harvest management of crop produce by November, 2018
1 1 1 1 2,400.00 9,600.00 DAD KDA
Economic Development Agricultural Development
Create awareness on Environmental sanitation among 160 communities
2000 farmers sensitized on the need observe strict Environmental sanitation among 160 communities annually
1 1 1 1 3,200.00 12,800.00
DAD KDA
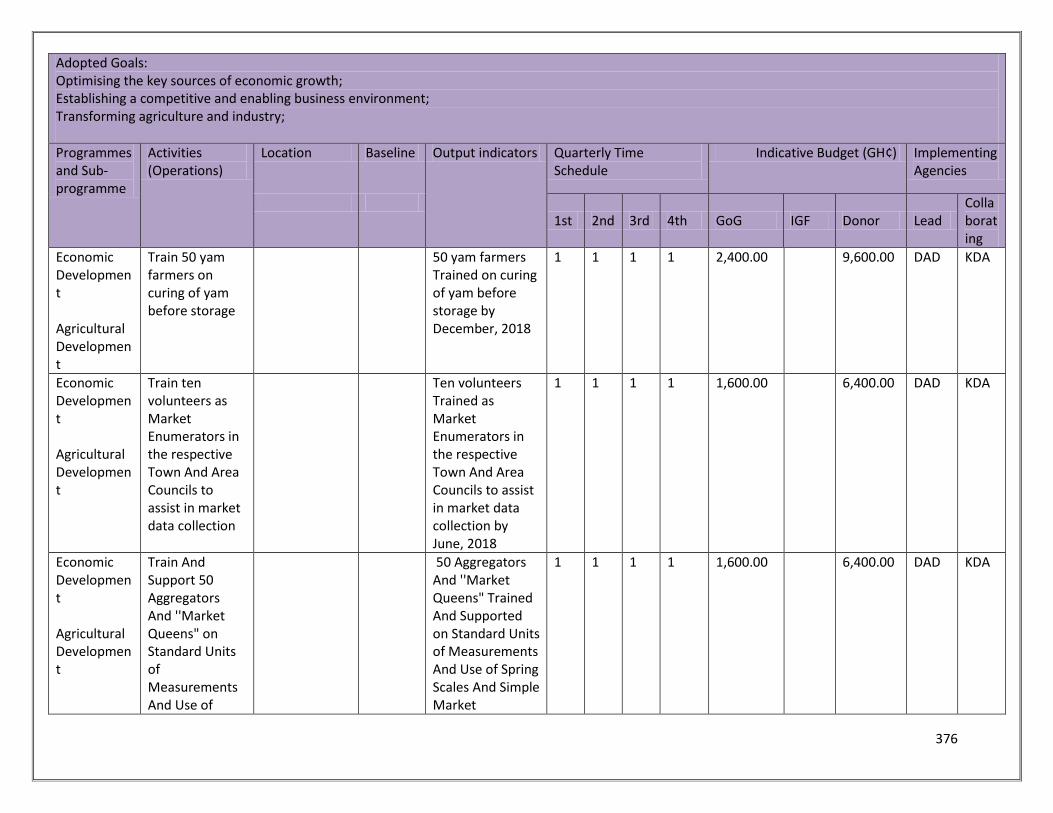
376
Adopted Goals: Optimising the key sources of economic growth; Establishing a competitive and enabling business environment; Transforming agriculture and industry;
Programmes and Sub-programme
Activities (Operations)
Location Baseline Output indicators Quarterly Time Schedule
Indicative Budget (GH¢) Implementing Agencies
1st 2nd 3rd 4th GoG IGF Donor Lead
Collaborating
Economic Development Agricultural Development
Train 50 yam farmers on curing of yam before storage
50 yam farmers Trained on curing of yam before storage by December, 2018
1 1 1 1 2,400.00 9,600.00 DAD KDA
Economic Development Agricultural Development
Train ten volunteers as Market Enumerators in the respective Town And Area Councils to assist in market data collection
Ten volunteers Trained as Market Enumerators in the respective Town And Area Councils to assist in market data collection by June, 2018
1 1 1 1 1,600.00 6,400.00 DAD KDA
Economic Development Agricultural Development
Train And Support 50 Aggregators And ''Market Queens" on Standard Units of Measurements And Use of
50 Aggregators And ''Market Queens" Trained And Supported on Standard Units of Measurements And Use of Spring Scales And Simple Market
1 1 1 1 1,600.00 6,400.00 DAD KDA
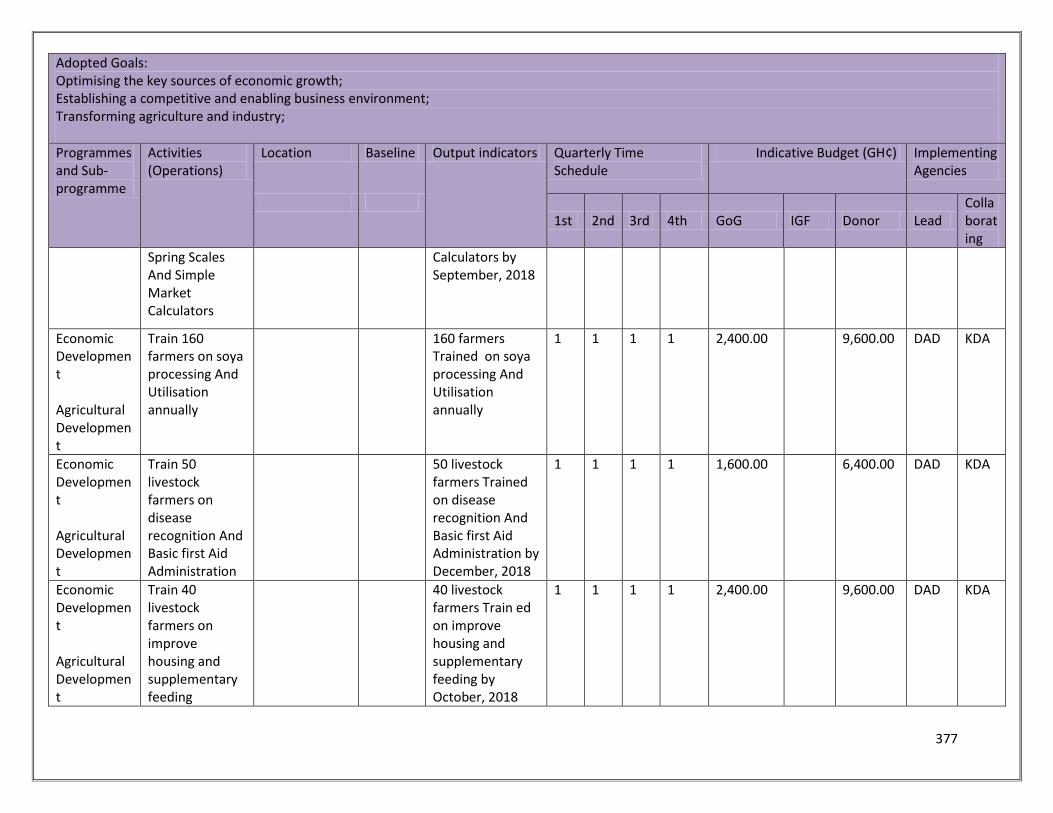
377
Adopted Goals: Optimising the key sources of economic growth; Establishing a competitive and enabling business environment; Transforming agriculture and industry;
Programmes and Sub-programme
Activities (Operations)
Location Baseline Output indicators Quarterly Time Schedule
Indicative Budget (GH¢) Implementing Agencies
1st 2nd 3rd 4th GoG IGF Donor Lead
Collaborating
Spring Scales And Simple Market Calculators
Calculators by September, 2018
Economic Development Agricultural Development
Train 160 farmers on soya processing And Utilisation annually
160 farmers Trained on soya processing And Utilisation annually
1 1 1 1 2,400.00 9,600.00 DAD KDA
Economic Development Agricultural Development
Train 50 livestock farmers on disease recognition And Basic first Aid Administration
50 livestock farmers Trained on disease recognition And Basic first Aid Administration by December, 2018
1 1 1 1 1,600.00 6,400.00 DAD KDA
Economic Development Agricultural Development
Train 40 livestock farmers on improve housing and supplementary feeding
40 livestock farmers Train ed on improve housing and supplementary feeding by October, 2018
1 1 1 1 2,400.00 9,600.00 DAD KDA
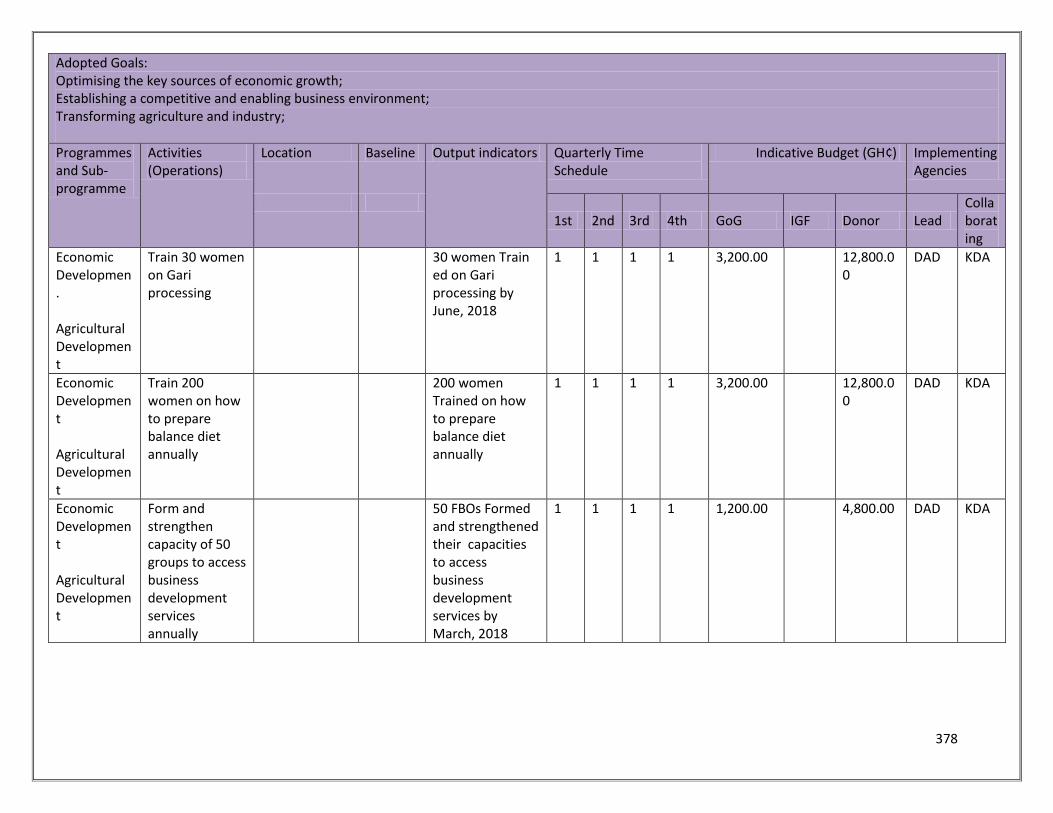
378
Adopted Goals: Optimising the key sources of economic growth; Establishing a competitive and enabling business environment; Transforming agriculture and industry;
Programmes and Sub-programme
Activities (Operations)
Location Baseline Output indicators Quarterly Time Schedule
Indicative Budget (GH¢) Implementing Agencies
1st 2nd 3rd 4th GoG IGF Donor Lead
Collaborating
Economic Developmen. Agricultural Development
Train 30 women on Gari processing
30 women Train ed on Gari processing by June, 2018
1 1 1 1 3,200.00 12,800.00
DAD KDA
Economic Development Agricultural Development
Train 200 women on how to prepare balance diet annually
200 women Trained on how to prepare balance diet annually
1 1 1 1 3,200.00 12,800.00
DAD KDA
Economic Development Agricultural Development
Form and strengthen capacity of 50 groups to access business development services annually
50 FBOs Formed and strengthened their capacities to access business development services by March, 2018
1 1 1 1 1,200.00 4,800.00 DAD KDA
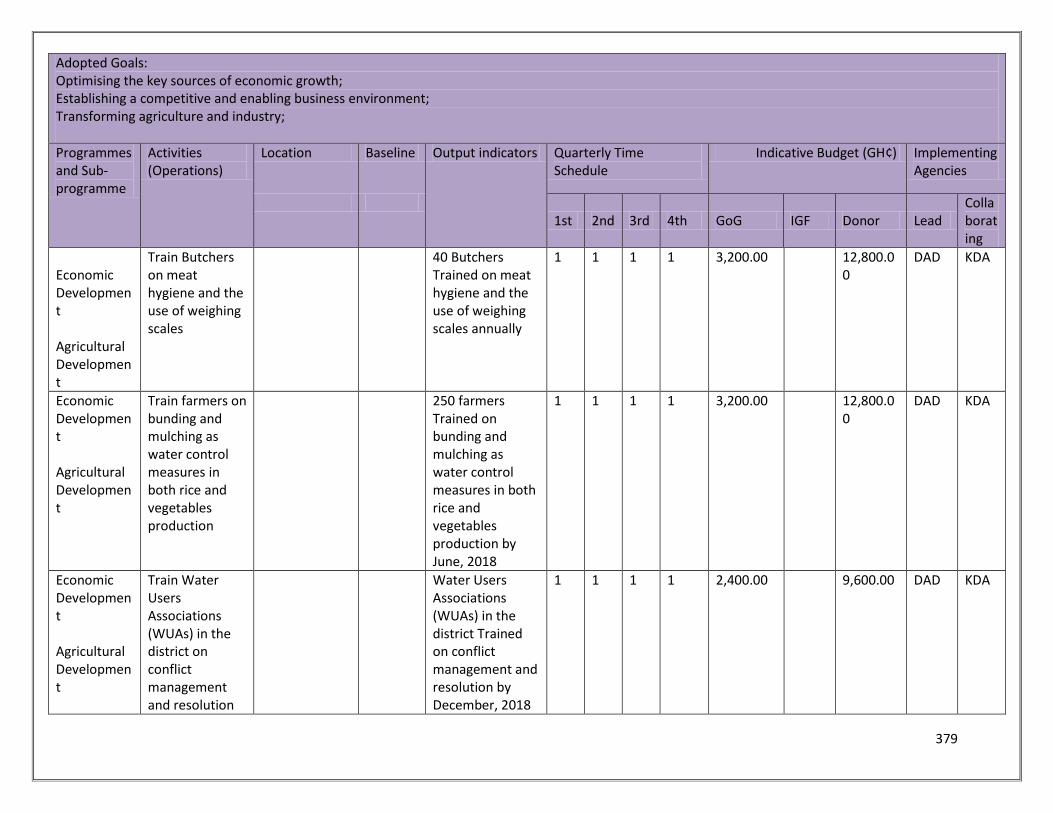
379
Adopted Goals: Optimising the key sources of economic growth; Establishing a competitive and enabling business environment; Transforming agriculture and industry;
Programmes and Sub-programme
Activities (Operations)
Location Baseline Output indicators Quarterly Time Schedule
Indicative Budget (GH¢) Implementing Agencies
1st 2nd 3rd 4th GoG IGF Donor Lead
Collaborating
Economic Development Agricultural Development
Train Butchers on meat hygiene and the use of weighing scales
40 Butchers Trained on meat hygiene and the use of weighing scales annually
1 1 1 1 3,200.00 12,800.00
DAD KDA
Economic Development Agricultural Development
Train farmers on bunding and mulching as water control measures in both rice and vegetables production
250 farmers Trained on bunding and mulching as water control measures in both rice and vegetables production by June, 2018
1 1 1 1 3,200.00 12,800.00
DAD KDA
Economic Development Agricultural Development
Train Water Users Associations (WUAs) in the district on conflict management and resolution
Water Users Associations (WUAs) in the district Trained on conflict management and resolution by December, 2018
1 1 1 1 2,400.00 9,600.00 DAD KDA
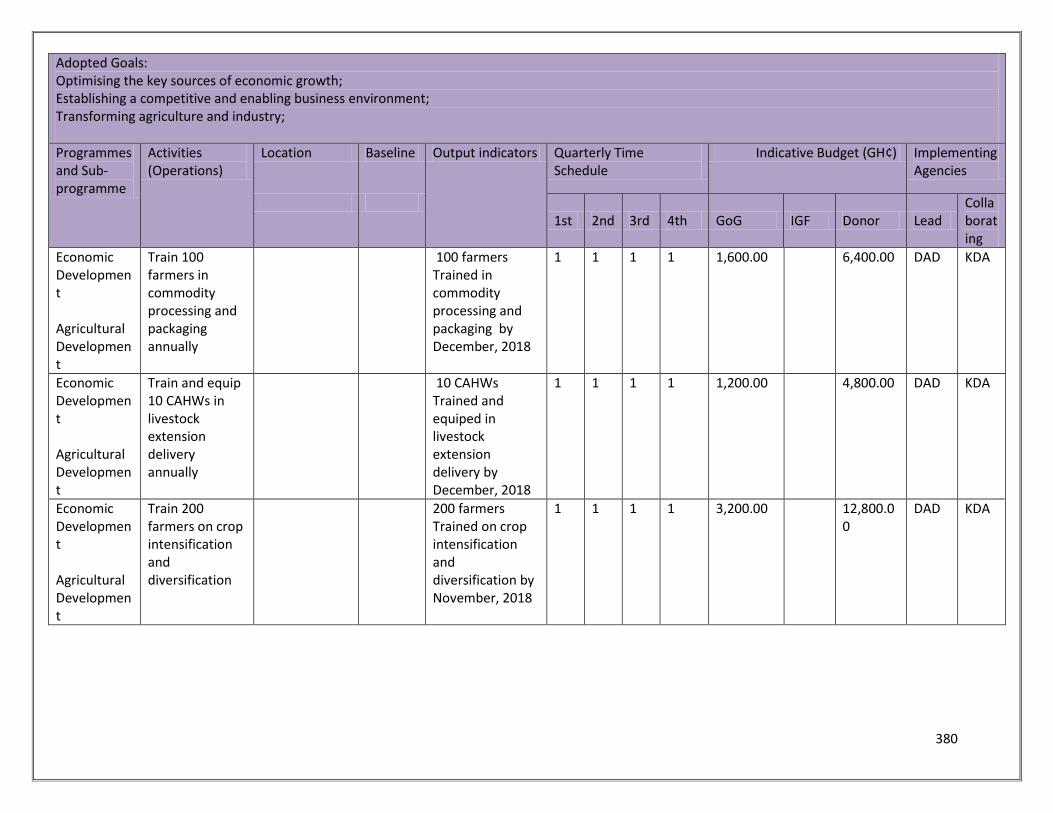
380
Adopted Goals: Optimising the key sources of economic growth; Establishing a competitive and enabling business environment; Transforming agriculture and industry;
Programmes and Sub-programme
Activities (Operations)
Location Baseline Output indicators Quarterly Time Schedule
Indicative Budget (GH¢) Implementing Agencies
1st 2nd 3rd 4th GoG IGF Donor Lead
Collaborating
Economic Development Agricultural Development
Train 100 farmers in commodity processing and packaging annually
100 farmers Trained in commodity processing and packaging by December, 2018
1 1 1 1 1,600.00 6,400.00 DAD KDA
Economic Development Agricultural Development
Train and equip 10 CAHWs in livestock extension delivery annually
10 CAHWs Trained and equiped in livestock extension delivery by December, 2018
1 1 1 1 1,200.00 4,800.00 DAD KDA
Economic Development Agricultural Development
Train 200 farmers on crop intensification and diversification
200 farmers Trained on crop intensification and diversification by November, 2018
1 1 1 1 3,200.00 12,800.00
DAD KDA
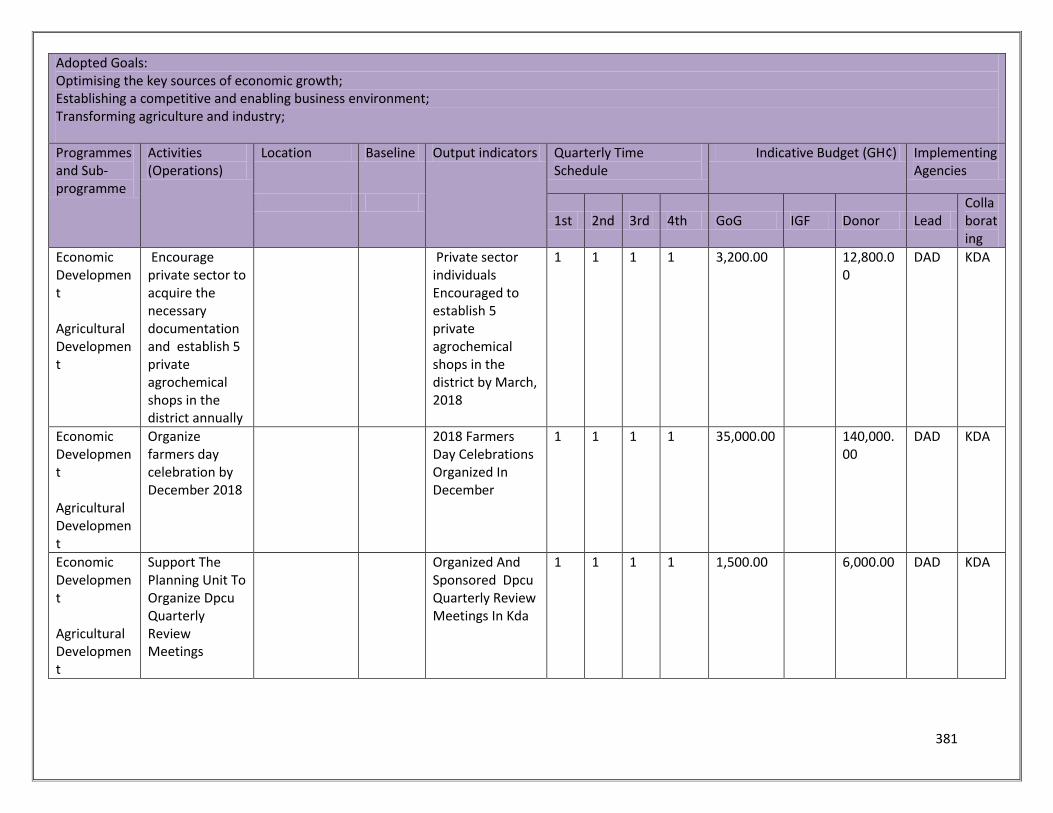
381
Adopted Goals: Optimising the key sources of economic growth; Establishing a competitive and enabling business environment; Transforming agriculture and industry;
Programmes and Sub-programme
Activities (Operations)
Location Baseline Output indicators Quarterly Time Schedule
Indicative Budget (GH¢) Implementing Agencies
1st 2nd 3rd 4th GoG IGF Donor Lead
Collaborating
Economic Development Agricultural Development
Encourage private sector to acquire the necessary documentation and establish 5 private agrochemical shops in the district annually
Private sector individuals Encouraged to establish 5 private agrochemical shops in the district by March, 2018
1 1 1 1 3,200.00 12,800.00
DAD KDA
Economic Development Agricultural Development
Organize farmers day celebration by December 2018
2018 Farmers Day Celebrations Organized In December
1 1 1 1 35,000.00 140,000.00
DAD KDA
Economic Development Agricultural Development
Support The Planning Unit To Organize Dpcu Quarterly Review Meetings
Organized And Sponsored Dpcu Quarterly Review Meetings In Kda
1 1 1 1 1,500.00 6,000.00 DAD KDA
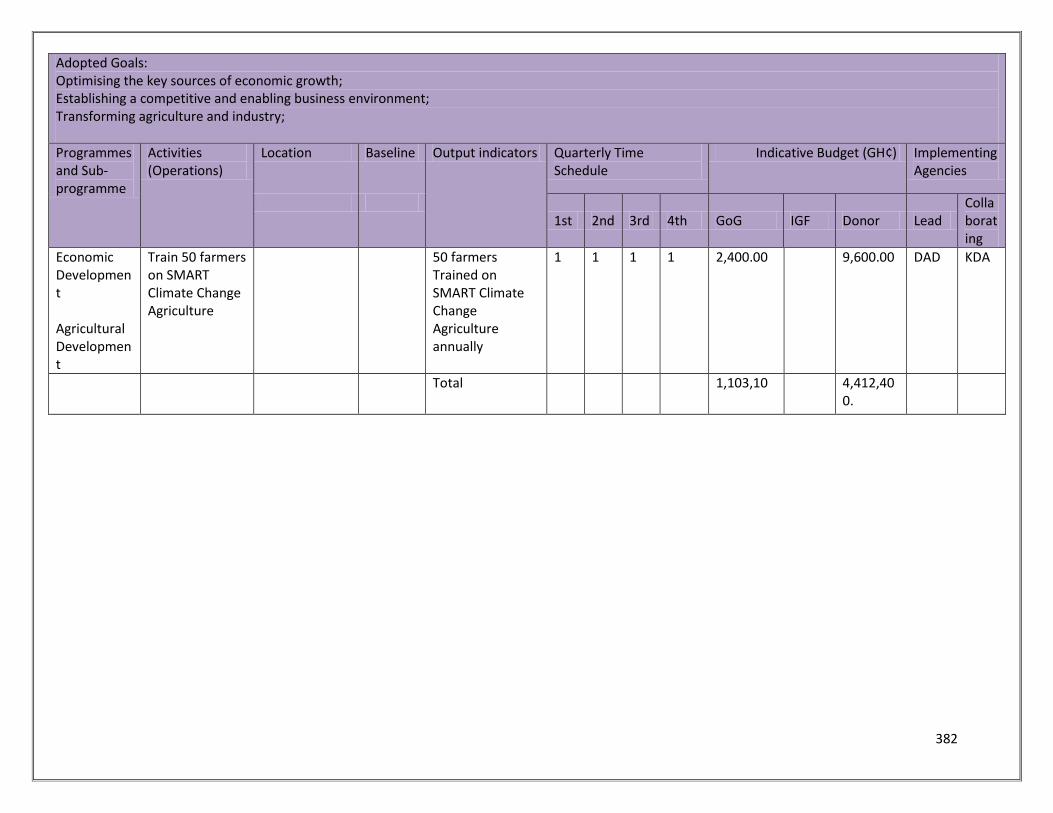
382
Adopted Goals: Optimising the key sources of economic growth; Establishing a competitive and enabling business environment; Transforming agriculture and industry;
Programmes and Sub-programme
Activities (Operations)
Location Baseline Output indicators Quarterly Time Schedule
Indicative Budget (GH¢) Implementing Agencies
1st 2nd 3rd 4th GoG IGF Donor Lead
Collaborating
Economic Development Agricultural Development
Train 50 farmers on SMART Climate Change Agriculture
50 farmers Trained on SMART Climate Change Agriculture annually
1 1 1 1 2,400.00 9,600.00 DAD KDA
Total 1,103,10 4,412,400.
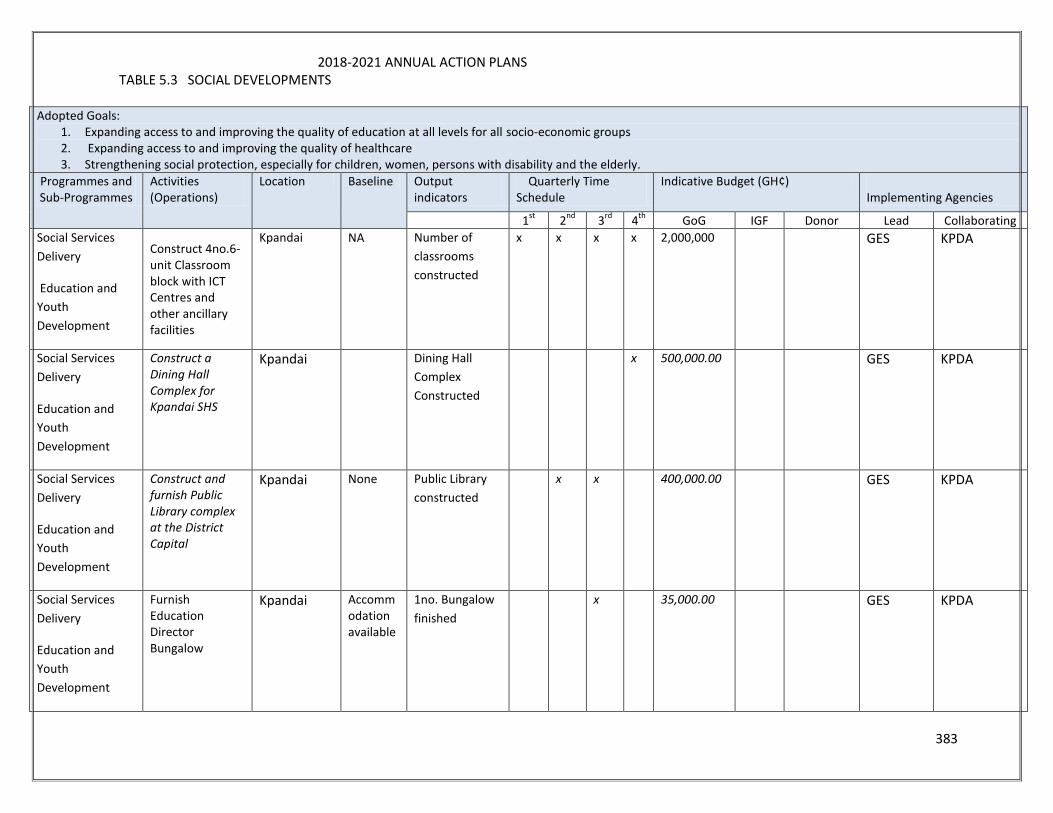
383
2018-2021 ANNUAL ACTION PLANS TABLE 5.3 SOCIAL DEVELOPMENTS
Adopted Goals: 1. Expanding access to and improving the quality of education at all levels for all socio-economic groups 2. Expanding access to and improving the quality of healthcare 3. Strengthening social protection, especially for children, women, persons with disability and the elderly.
Programmes and Sub-Programmes
Activities (Operations)
Location Baseline Output indicators
Quarterly Time Schedule
Indicative Budget (GH¢) Implementing Agencies
1st
2nd
3rd
4th
GoG IGF Donor Lead Collaborating
Social Services
Delivery
Education and
Youth
Development
Construct 4no.6-unit Classroom block with ICT Centres and other ancillary facilities
Kpandai NA Number of
classrooms
constructed
x x x x 2,000,000 GES KPDA
Social Services
Delivery
Education and
Youth
Development
Construct a Dining Hall Complex for Kpandai SHS
Kpandai Dining Hall
Complex
Constructed
x 500,000.00 GES KPDA
Social Services
Delivery
Education and
Youth
Development
Construct and furnish Public Library complex at the District Capital
Kpandai None Public Library
constructed
x x 400,000.00 GES KPDA
Social Services
Delivery
Education and
Youth
Development
Furnish Education Director Bungalow
Kpandai Accommodation available
1no. Bungalow
finished
x 35,000.00 GES KPDA
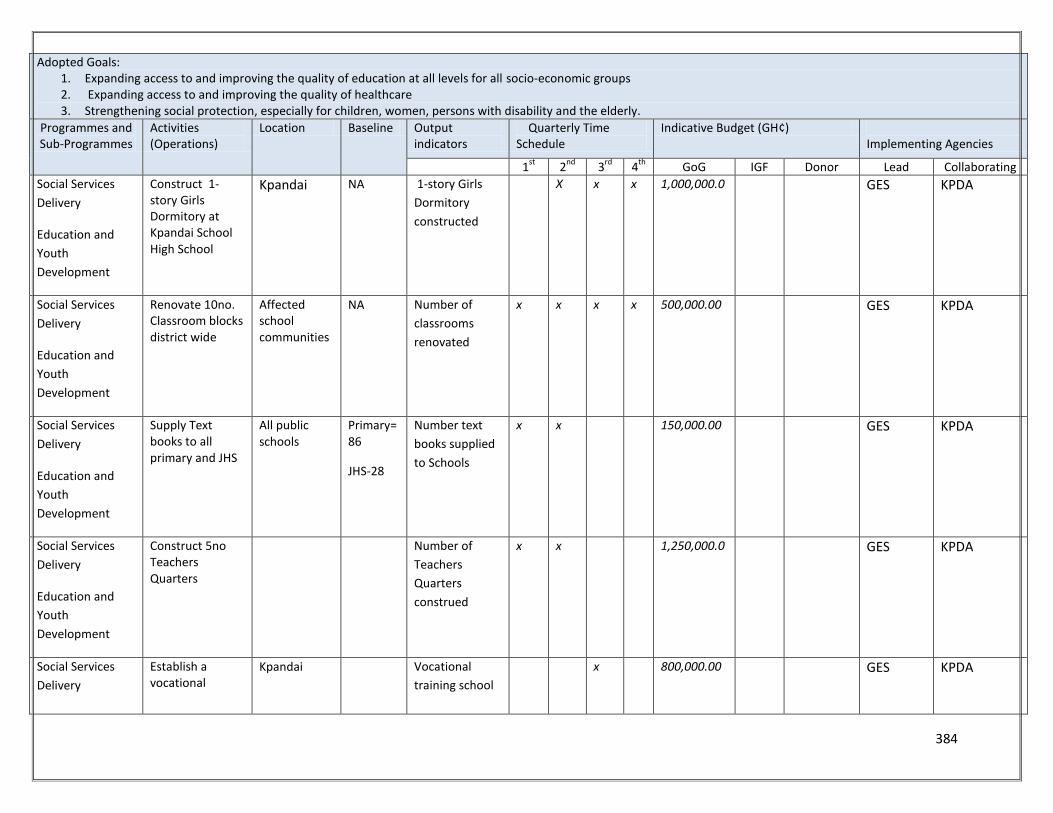
384
Adopted Goals: 1. Expanding access to and improving the quality of education at all levels for all socio-economic groups 2. Expanding access to and improving the quality of healthcare 3. Strengthening social protection, especially for children, women, persons with disability and the elderly.
Programmes and Sub-Programmes
Activities (Operations)
Location Baseline Output indicators
Quarterly Time Schedule
Indicative Budget (GH¢) Implementing Agencies
1st
2nd
3rd
4th
GoG IGF Donor Lead Collaborating
Social Services
Delivery
Education and
Youth
Development
Construct 1-story Girls Dormitory at Kpandai School High School
Kpandai NA 1-story Girls
Dormitory
constructed
X x x 1,000,000.0 GES KPDA
Social Services
Delivery
Education and
Youth
Development
Renovate 10no. Classroom blocks district wide
Affected school communities
NA Number of
classrooms
renovated
x x x x 500,000.00 GES KPDA
Social Services
Delivery
Education and
Youth
Development
Supply Text books to all primary and JHS
All public schools
Primary=86
JHS-28
Number text
books supplied
to Schools
x x 150,000.00 GES KPDA
Social Services
Delivery
Education and
Youth
Development
Construct 5no Teachers Quarters
Number of
Teachers
Quarters
construed
x x 1,250,000.0 GES KPDA
Social Services
Delivery
Establish a vocational
Kpandai Vocational
training school
x 800,000.00 GES KPDA
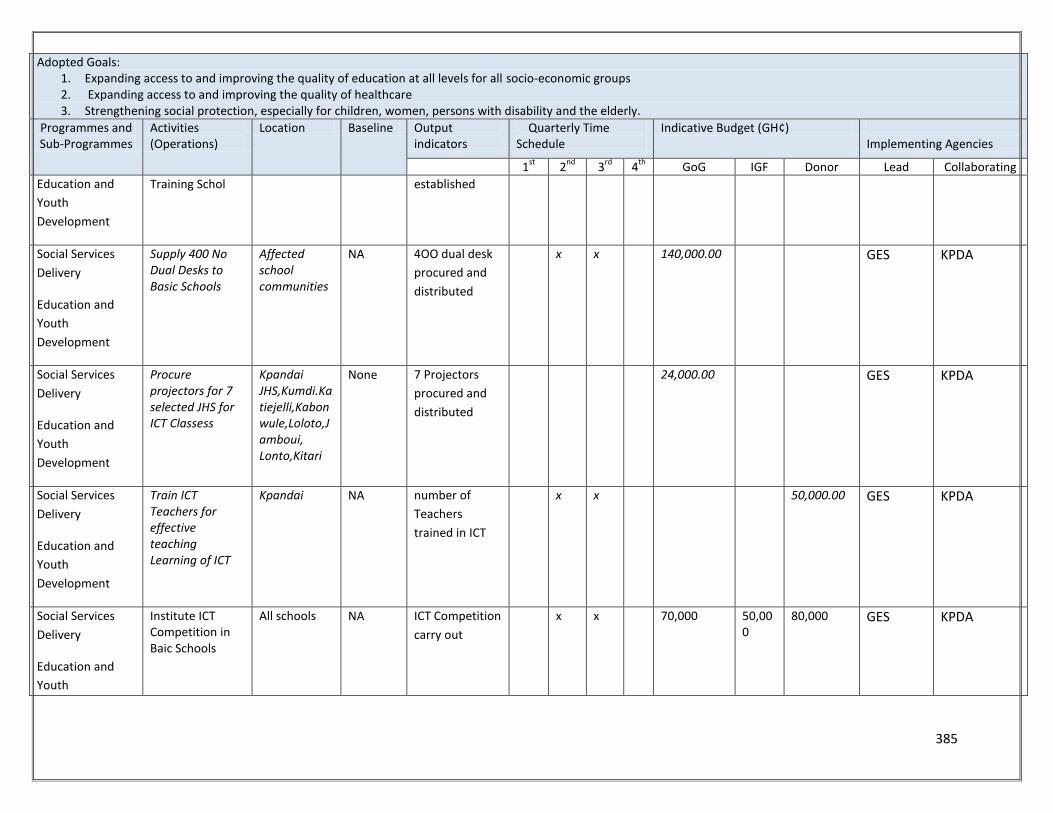
385
Adopted Goals: 1. Expanding access to and improving the quality of education at all levels for all socio-economic groups 2. Expanding access to and improving the quality of healthcare 3. Strengthening social protection, especially for children, women, persons with disability and the elderly.
Programmes and Sub-Programmes
Activities (Operations)
Location Baseline Output indicators
Quarterly Time Schedule
Indicative Budget (GH¢) Implementing Agencies
1st
2nd
3rd
4th
GoG IGF Donor Lead Collaborating
Education and
Youth
Development
Training Schol established
Social Services
Delivery
Education and
Youth
Development
Supply 400 No Dual Desks to Basic Schools
Affected school communities
NA 4OO dual desk
procured and
distributed
x x 140,000.00 GES KPDA
Social Services
Delivery
Education and
Youth
Development
Procure projectors for 7 selected JHS for ICT Classess
Kpandai JHS,Kumdi.Katiejelli,Kabonwule,Loloto,Jamboui, Lonto,Kitari
None 7 Projectors
procured and
distributed
24,000.00 GES KPDA
Social Services
Delivery
Education and
Youth
Development
Train ICT Teachers for effective teaching Learning of ICT
Kpandai NA number of
Teachers
trained in ICT
x x 50,000.00 GES KPDA
Social Services
Delivery
Education and
Youth
Institute ICT Competition in Baic Schools
All schools NA ICT Competition
carry out
x x 70,000 50,000
80,000 GES KPDA
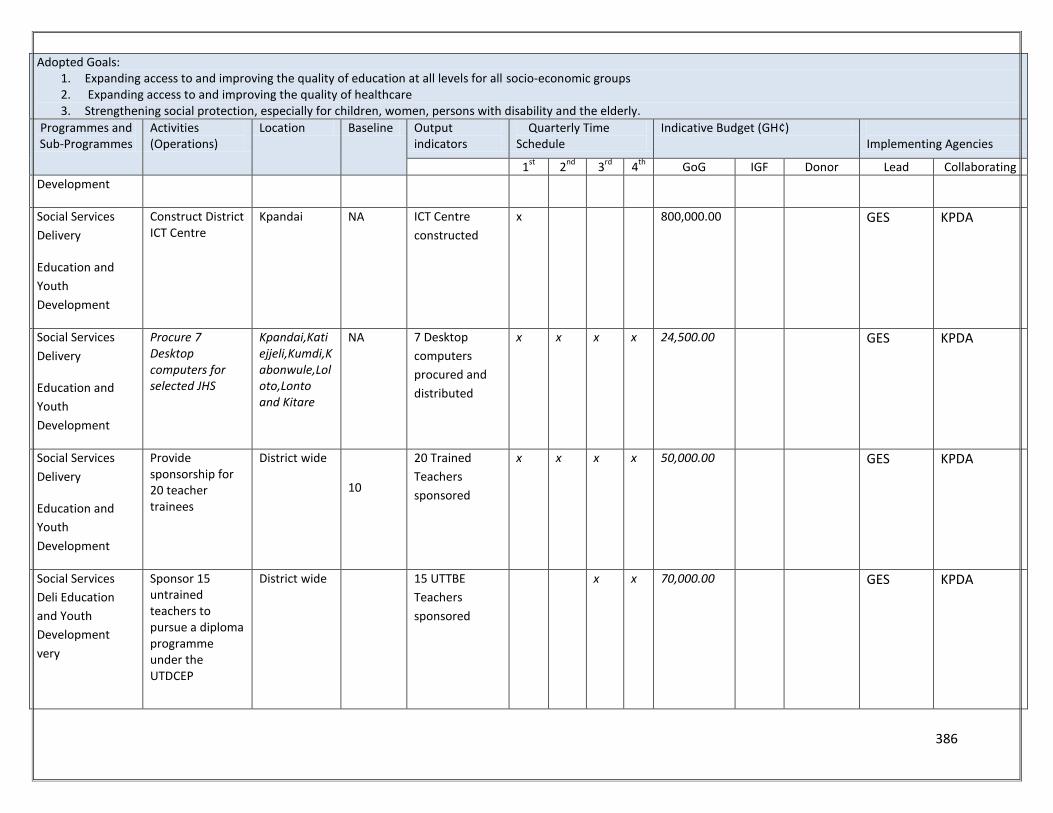
386
Adopted Goals: 1. Expanding access to and improving the quality of education at all levels for all socio-economic groups 2. Expanding access to and improving the quality of healthcare 3. Strengthening social protection, especially for children, women, persons with disability and the elderly.
Programmes and Sub-Programmes
Activities (Operations)
Location Baseline Output indicators
Quarterly Time Schedule
Indicative Budget (GH¢) Implementing Agencies
1st
2nd
3rd
4th
GoG IGF Donor Lead Collaborating
Development
Social Services
Delivery
Education and
Youth
Development
Construct District ICT Centre
Kpandai NA ICT Centre
constructed
x 800,000.00 GES KPDA
Social Services
Delivery
Education and
Youth
Development
Procure 7 Desktop computers for selected JHS
Kpandai,Katiejjeli,Kumdi,Kabonwule,Loloto,Lonto and Kitare
NA 7 Desktop
computers
procured and
distributed
x x x x 24,500.00 GES KPDA
Social Services
Delivery
Education and
Youth
Development
Provide sponsorship for 20 teacher trainees
District wide
10
20 Trained
Teachers
sponsored
x x x x 50,000.00 GES KPDA
Social Services
Deli Education
and Youth
Development
very
Sponsor 15 untrained teachers to pursue a diploma programme under the UTDCEP
District wide 15 UTTBE
Teachers
sponsored
x x 70,000.00 GES KPDA
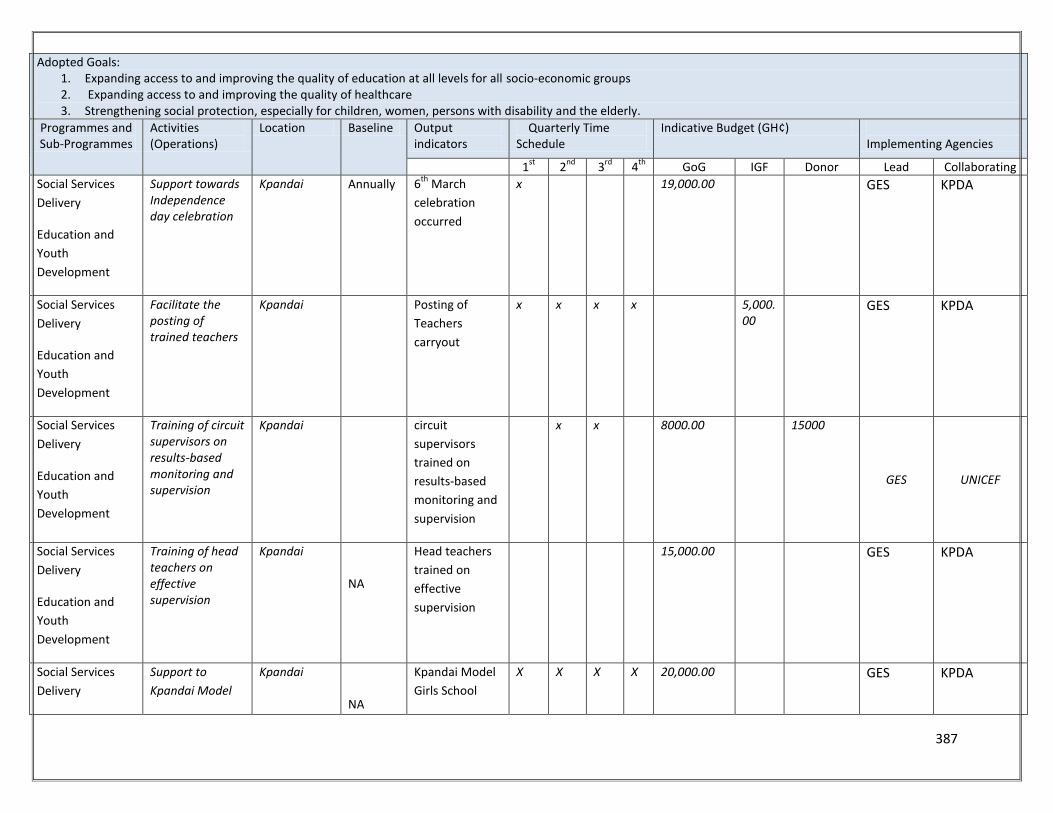
387
Adopted Goals: 1. Expanding access to and improving the quality of education at all levels for all socio-economic groups 2. Expanding access to and improving the quality of healthcare 3. Strengthening social protection, especially for children, women, persons with disability and the elderly.
Programmes and Sub-Programmes
Activities (Operations)
Location Baseline Output indicators
Quarterly Time Schedule
Indicative Budget (GH¢) Implementing Agencies
1st
2nd
3rd
4th
GoG IGF Donor Lead Collaborating
Social Services
Delivery
Education and
Youth
Development
Support towards Independence day celebration
Kpandai Annually 6th
March
celebration
occurred
x 19,000.00 GES KPDA
Social Services
Delivery
Education and
Youth
Development
Facilitate the posting of trained teachers
Kpandai Posting of
Teachers
carryout
x x x x 5,000.00
GES KPDA
Social Services
Delivery
Education and
Youth
Development
Training of circuit supervisors on results-based monitoring and supervision
Kpandai circuit
supervisors
trained on
results-based
monitoring and
supervision
x x 8000.00 15000
GES UNICEF
Social Services
Delivery
Education and
Youth
Development
Training of head teachers on effective supervision
Kpandai NA
Head teachers
trained on
effective
supervision
15,000.00 GES KPDA
Social Services
Delivery
Support to
Kpandai Model
Kpandai NA
Kpandai Model
Girls School
X X X X 20,000.00
GES KPDA
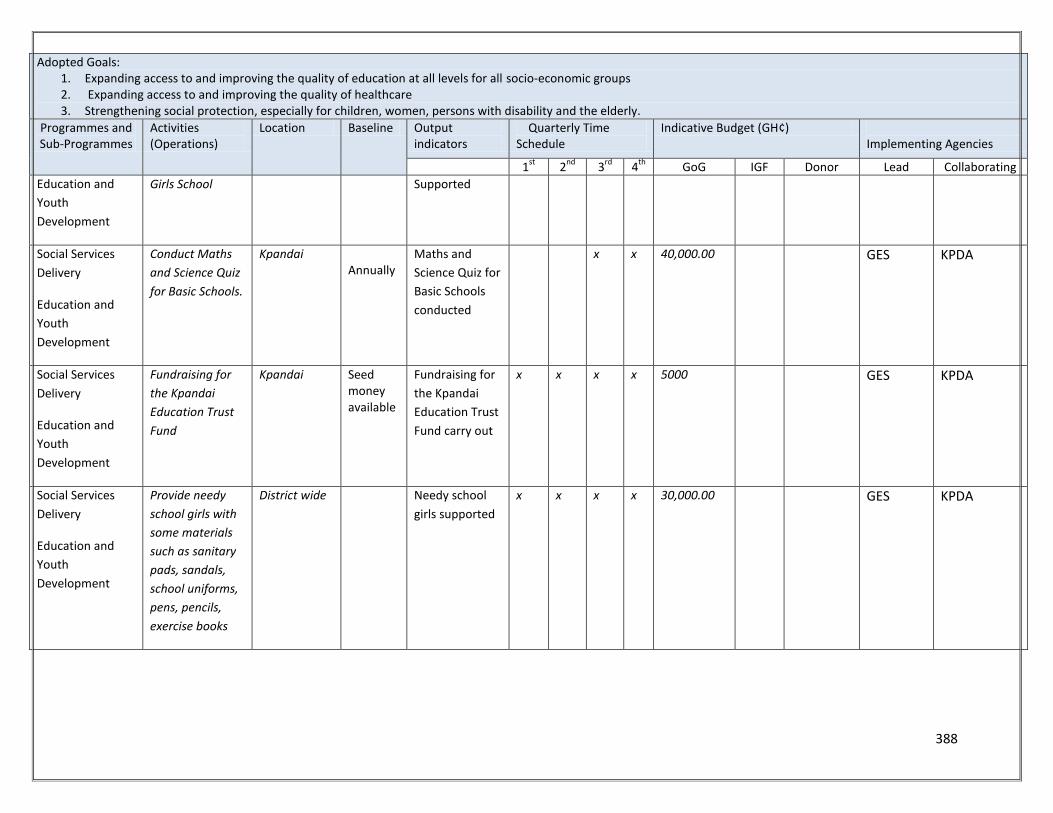
388
Adopted Goals: 1. Expanding access to and improving the quality of education at all levels for all socio-economic groups 2. Expanding access to and improving the quality of healthcare 3. Strengthening social protection, especially for children, women, persons with disability and the elderly.
Programmes and Sub-Programmes
Activities (Operations)
Location Baseline Output indicators
Quarterly Time Schedule
Indicative Budget (GH¢) Implementing Agencies
1st
2nd
3rd
4th
GoG IGF Donor Lead Collaborating
Education and
Youth
Development
Girls School Supported
Social Services
Delivery
Education and
Youth
Development
Conduct Maths
and Science Quiz
for Basic Schools.
Kpandai Annually
Maths and
Science Quiz for
Basic Schools
conducted
x x 40,000.00
GES KPDA
Social Services
Delivery
Education and
Youth
Development
Fundraising for
the Kpandai
Education Trust
Fund
Kpandai Seed money available
Fundraising for
the Kpandai
Education Trust
Fund carry out
x x x x 5000
GES KPDA
Social Services
Delivery
Education and
Youth
Development
Provide needy
school girls with
some materials
such as sanitary
pads, sandals,
school uniforms,
pens, pencils,
exercise books
District wide
Needy school
girls supported
x x x x 30,000.00
GES KPDA
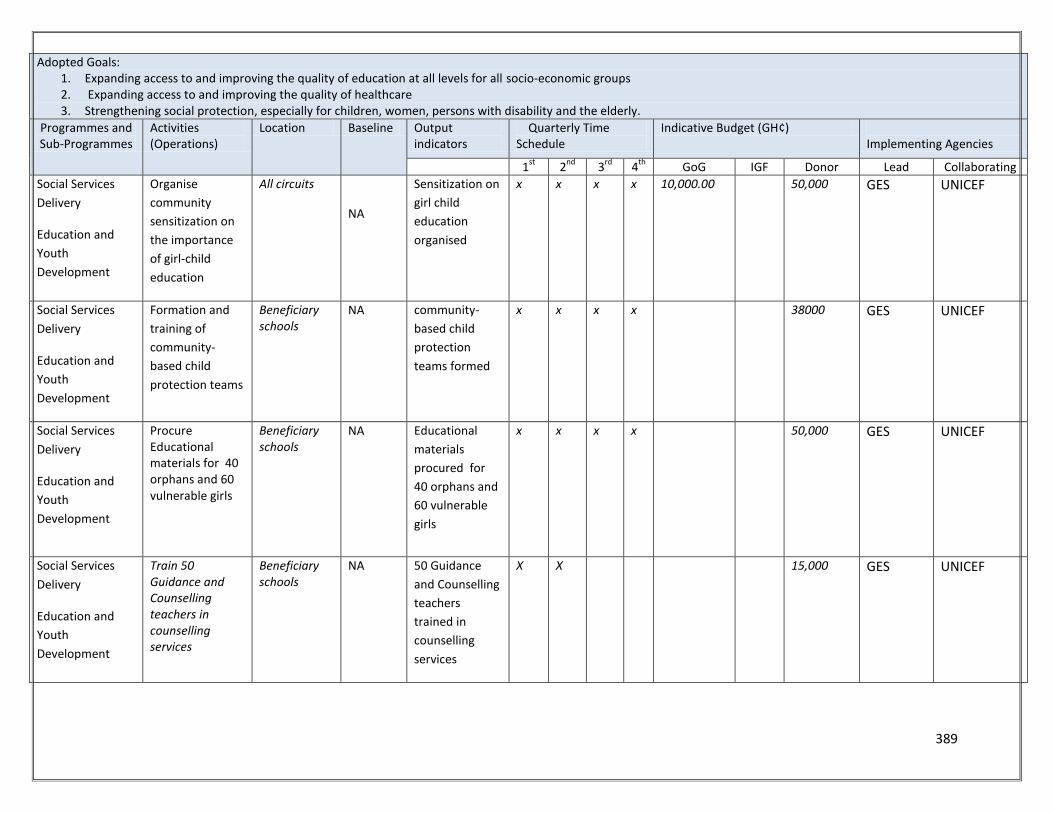
389
Adopted Goals: 1. Expanding access to and improving the quality of education at all levels for all socio-economic groups 2. Expanding access to and improving the quality of healthcare 3. Strengthening social protection, especially for children, women, persons with disability and the elderly.
Programmes and Sub-Programmes
Activities (Operations)
Location Baseline Output indicators
Quarterly Time Schedule
Indicative Budget (GH¢) Implementing Agencies
1st
2nd
3rd
4th
GoG IGF Donor Lead Collaborating
Social Services
Delivery
Education and
Youth
Development
Organise
community
sensitization on
the importance
of girl-child
education
All circuits
NA
Sensitization on
girl child
education
organised
x x x x 10,000.00 50,000 GES UNICEF
Social Services
Delivery
Education and
Youth
Development
Formation and
training of
community-
based child
protection teams
Beneficiary schools
NA community-
based child
protection
teams formed
x x x x 38000 GES UNICEF
Social Services
Delivery
Education and
Youth
Development
Procure Educational materials for 40 orphans and 60 vulnerable girls
Beneficiary schools
NA Educational
materials
procured for
40 orphans and
60 vulnerable
girls
x x x x 50,000 GES UNICEF
Social Services
Delivery
Education and
Youth
Development
Train 50 Guidance and Counselling teachers in counselling services
Beneficiary schools
NA 50 Guidance
and Counselling
teachers
trained in
counselling
services
X X
15,000 GES UNICEF
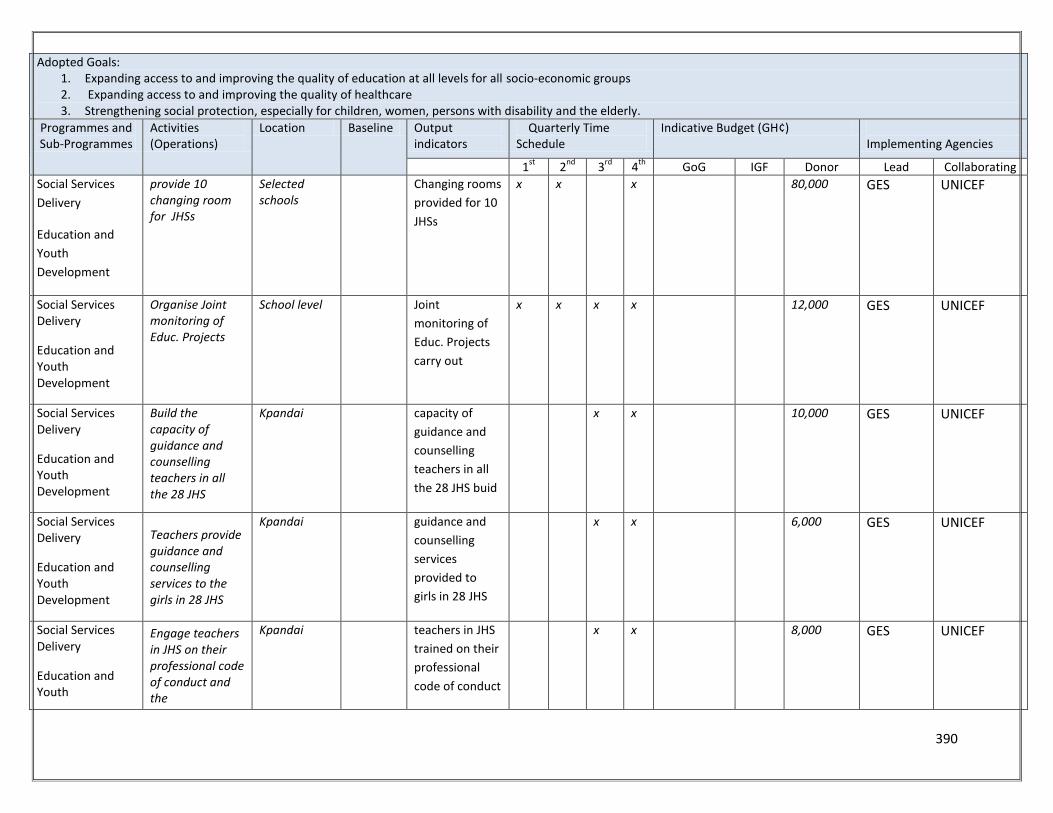
390
Adopted Goals: 1. Expanding access to and improving the quality of education at all levels for all socio-economic groups 2. Expanding access to and improving the quality of healthcare 3. Strengthening social protection, especially for children, women, persons with disability and the elderly.
Programmes and Sub-Programmes
Activities (Operations)
Location Baseline Output indicators
Quarterly Time Schedule
Indicative Budget (GH¢) Implementing Agencies
1st
2nd
3rd
4th
GoG IGF Donor Lead Collaborating
Social Services
Delivery
Education and
Youth
Development
provide 10 changing room for JHSs
Selected schools
Changing rooms
provided for 10
JHSs
x x x
80,000 GES UNICEF
Social Services Delivery
Education and Youth Development
Organise Joint monitoring of Educ. Projects
School level Joint
monitoring of
Educ. Projects
carry out
x x x x
12,000 GES UNICEF
Social Services Delivery
Education and Youth Development
Build the capacity of guidance and counselling teachers in all the 28 JHS
Kpandai capacity of
guidance and
counselling
teachers in all
the 28 JHS buid
x x
10,000 GES UNICEF
Social Services Delivery
Education and Youth Development
Teachers provide guidance and counselling services to the girls in 28 JHS
Kpandai guidance and
counselling
services
provided to
girls in 28 JHS
x x
6,000 GES UNICEF
Social Services Delivery
Education and Youth
Engage teachers in JHS on their professional code of conduct and the
Kpandai teachers in JHS
trained on their
professional
code of conduct
x x
8,000 GES UNICEF
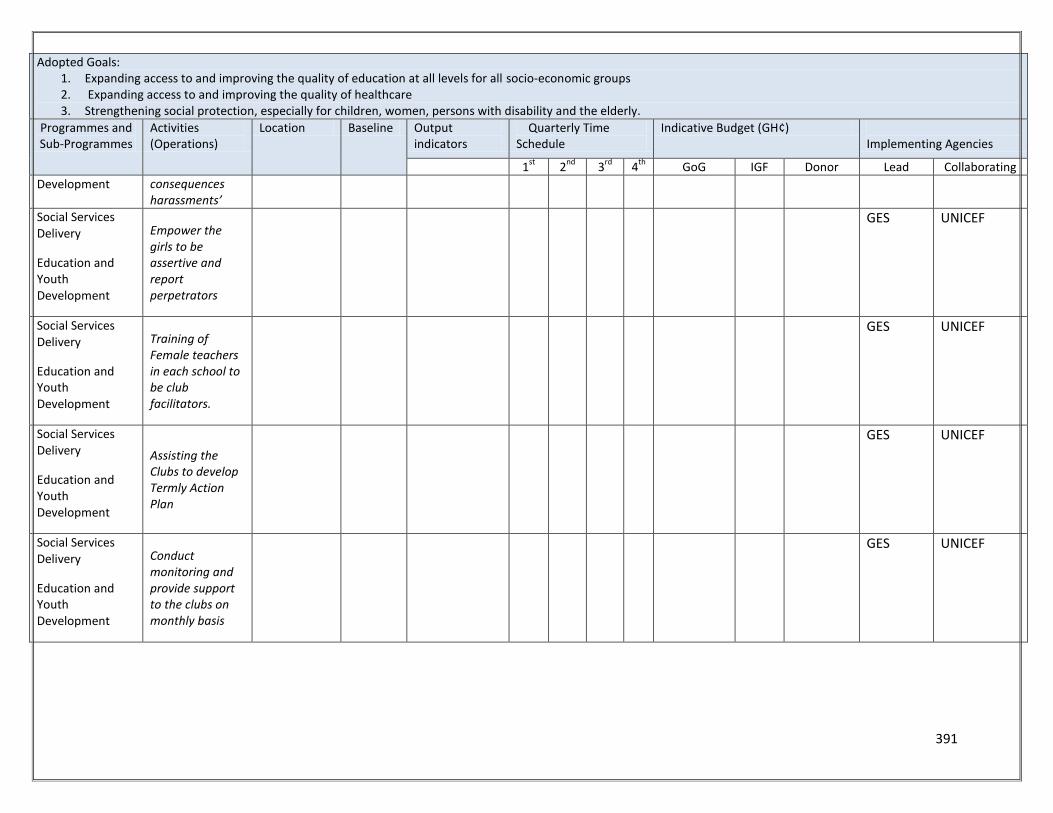
391
Adopted Goals: 1. Expanding access to and improving the quality of education at all levels for all socio-economic groups 2. Expanding access to and improving the quality of healthcare 3. Strengthening social protection, especially for children, women, persons with disability and the elderly.
Programmes and Sub-Programmes
Activities (Operations)
Location Baseline Output indicators
Quarterly Time Schedule
Indicative Budget (GH¢) Implementing Agencies
1st
2nd
3rd
4th
GoG IGF Donor Lead Collaborating
Development consequences harassments’
Social Services Delivery
Education and Youth Development
Empower the girls to be assertive and report perpetrators
GES UNICEF
Social Services Delivery
Education and Youth Development
Training of Female teachers in each school to be club facilitators.
GES UNICEF
Social Services Delivery
Education and Youth Development
Assisting the Clubs to develop Termly Action Plan
GES UNICEF
Social Services Delivery
Education and Youth Development
Conduct monitoring and provide support to the clubs on monthly basis
GES UNICEF
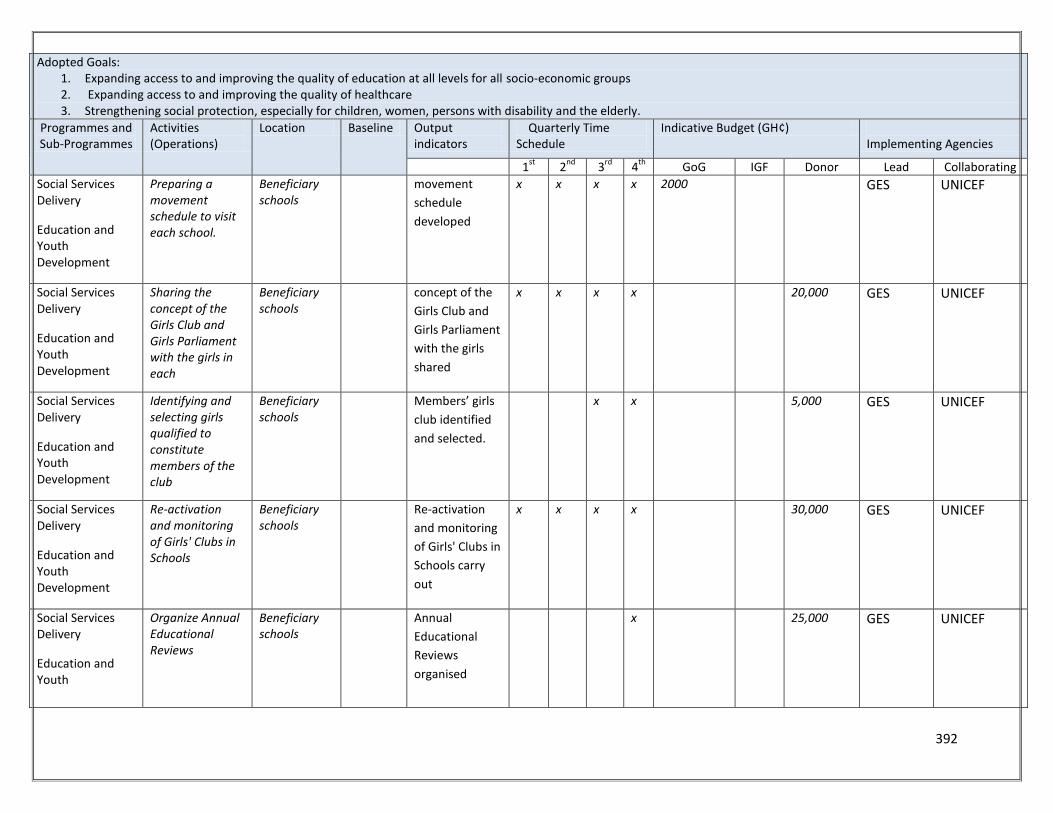
392
Adopted Goals: 1. Expanding access to and improving the quality of education at all levels for all socio-economic groups 2. Expanding access to and improving the quality of healthcare 3. Strengthening social protection, especially for children, women, persons with disability and the elderly.
Programmes and Sub-Programmes
Activities (Operations)
Location Baseline Output indicators
Quarterly Time Schedule
Indicative Budget (GH¢) Implementing Agencies
1st
2nd
3rd
4th
GoG IGF Donor Lead Collaborating
Social Services Delivery
Education and Youth Development
Preparing a movement schedule to visit each school.
Beneficiary schools
movement
schedule
developed
x x x x 2000 GES UNICEF
Social Services Delivery
Education and Youth Development
Sharing the concept of the Girls Club and Girls Parliament with the girls in each
Beneficiary schools
concept of the
Girls Club and
Girls Parliament
with the girls
shared
x x x x 20,000 GES UNICEF
Social Services Delivery
Education and Youth Development
Identifying and selecting girls qualified to constitute members of the club
Beneficiary schools
Members’ girls
club identified
and selected.
x x 5,000 GES UNICEF
Social Services Delivery
Education and Youth Development
Re-activation and monitoring of Girls' Clubs in Schools
Beneficiary schools
Re-activation
and monitoring
of Girls' Clubs in
Schools carry
out
x x x x 30,000 GES UNICEF
Social Services Delivery
Education and Youth
Organize Annual Educational Reviews
Beneficiary schools
Annual
Educational
Reviews
organised
x 25,000 GES UNICEF
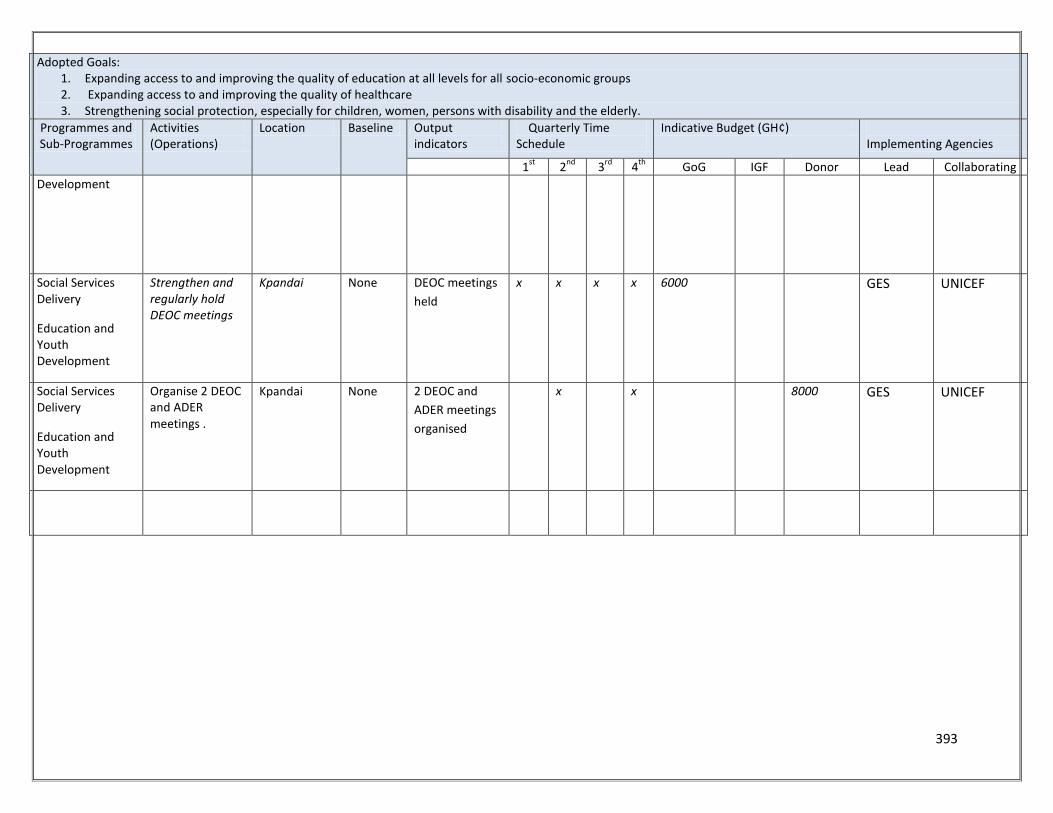
393
Adopted Goals: 1. Expanding access to and improving the quality of education at all levels for all socio-economic groups 2. Expanding access to and improving the quality of healthcare 3. Strengthening social protection, especially for children, women, persons with disability and the elderly.
Programmes and Sub-Programmes
Activities (Operations)
Location Baseline Output indicators
Quarterly Time Schedule
Indicative Budget (GH¢) Implementing Agencies
1st
2nd
3rd
4th
GoG IGF Donor Lead Collaborating
Development
Social Services Delivery
Education and Youth Development
Strengthen and regularly hold DEOC meetings
Kpandai None DEOC meetings
held
x x x x 6000 GES UNICEF
Social Services Delivery
Education and Youth Development
Organise 2 DEOC and ADER meetings .
Kpandai None 2 DEOC and
ADER meetings
organised
x x 8000 GES UNICEF
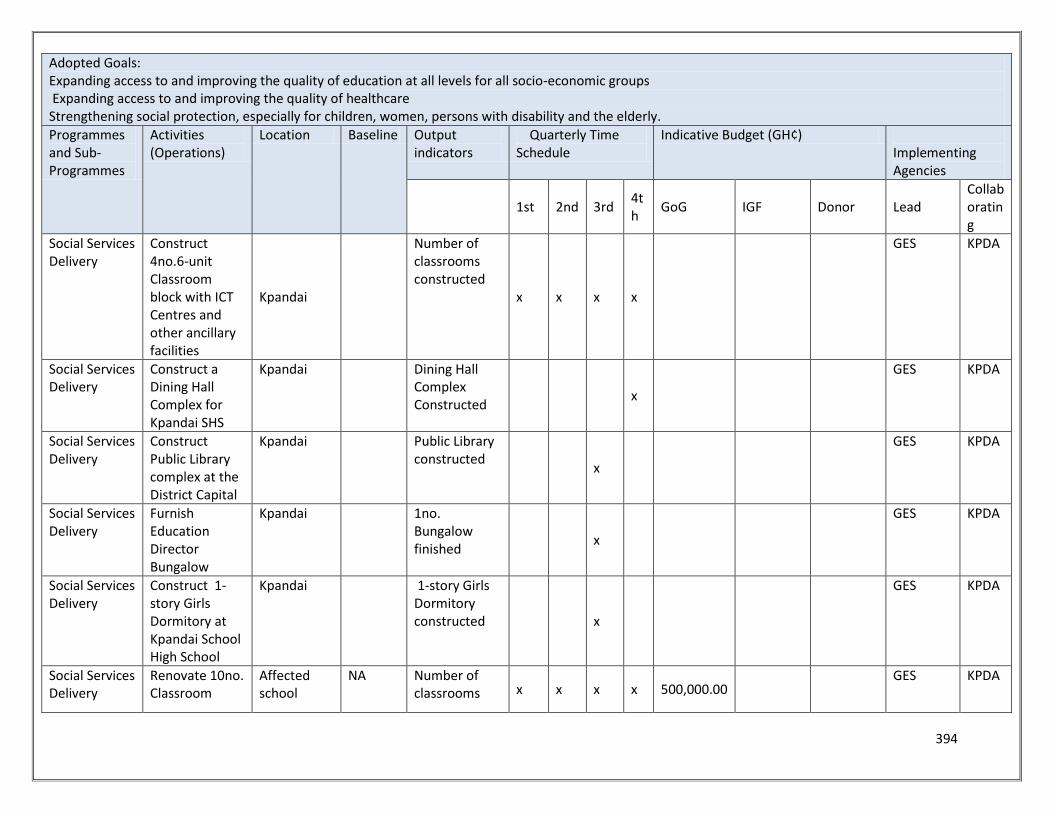
394
Adopted Goals: Expanding access to and improving the quality of education at all levels for all socio-economic groups Expanding access to and improving the quality of healthcare Strengthening social protection, especially for children, women, persons with disability and the elderly.
Programmes and Sub-Programmes
Activities (Operations)
Location Baseline Output indicators
Quarterly Time Schedule
Indicative Budget (GH¢) Implementing Agencies
1st 2nd 3rd 4th
GoG IGF Donor Lead Collaborating
Social Services Delivery
Construct 4no.6-unit Classroom block with ICT Centres and other ancillary facilities
Kpandai
Number of classrooms constructed
x x x x
GES KPDA
Social Services Delivery
Construct a Dining Hall Complex for Kpandai SHS
Kpandai Dining Hall Complex Constructed
x
GES KPDA
Social Services Delivery
Construct Public Library complex at the District Capital
Kpandai Public Library constructed
x
GES KPDA
Social Services Delivery
Furnish Education Director Bungalow
Kpandai 1no. Bungalow finished
x
GES KPDA
Social Services Delivery
Construct 1-story Girls Dormitory at Kpandai School High School
Kpandai 1-story Girls Dormitory constructed x
GES KPDA
Social Services Delivery
Renovate 10no. Classroom
Affected school
NA Number of classrooms x x x x 500,000.00
GES KPDA
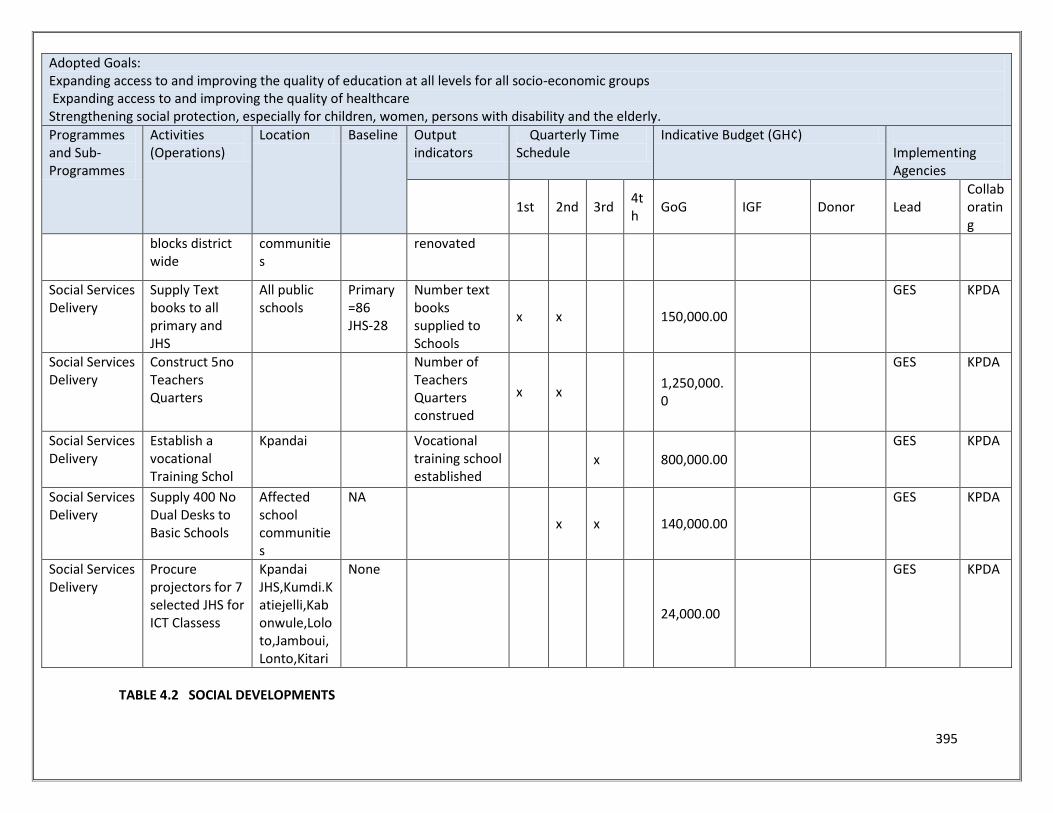
395
Adopted Goals: Expanding access to and improving the quality of education at all levels for all socio-economic groups Expanding access to and improving the quality of healthcare Strengthening social protection, especially for children, women, persons with disability and the elderly.
Programmes and Sub-Programmes
Activities (Operations)
Location Baseline Output indicators
Quarterly Time Schedule
Indicative Budget (GH¢) Implementing Agencies
1st 2nd 3rd 4th
GoG IGF Donor Lead Collaborating
blocks district wide
communities
renovated
Social Services Delivery
Supply Text books to all primary and JHS
All public schools
Primary=86 JHS-28
Number text books supplied to Schools
x x 150,000.00
GES KPDA
Social Services Delivery
Construct 5no Teachers Quarters
Number of Teachers Quarters construed
x x 1,250,000.0
GES KPDA
Social Services Delivery
Establish a vocational Training Schol
Kpandai Vocational training school established
x 800,000.00
GES KPDA
Social Services Delivery
Supply 400 No Dual Desks to Basic Schools
Affected school communities
NA
x x 140,000.00
GES KPDA
Social Services Delivery
Procure projectors for 7 selected JHS for ICT Classess
Kpandai JHS,Kumdi.Katiejelli,Kabonwule,Loloto,Jamboui, Lonto,Kitari
None
24,000.00
GES KPDA
TABLE 4.2 SOCIAL DEVELOPMENTS
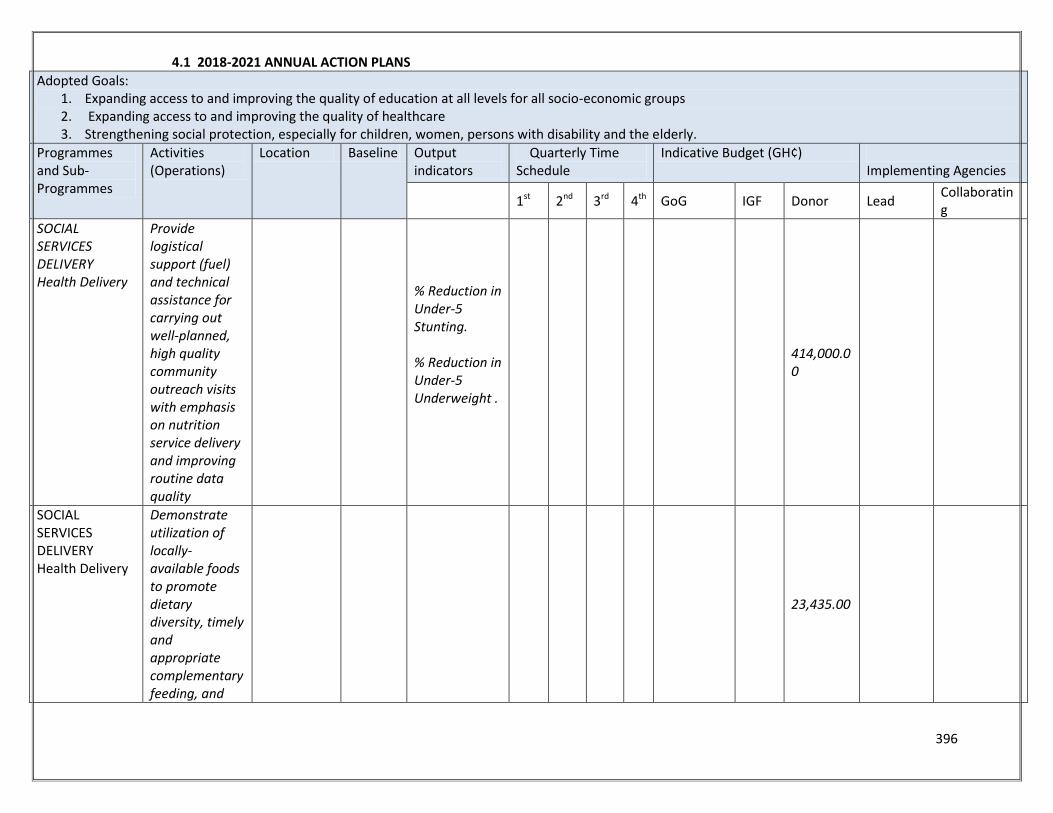
396
4.1 2018-2021 ANNUAL ACTION PLANS
Adopted Goals: 1. Expanding access to and improving the quality of education at all levels for all socio-economic groups 2. Expanding access to and improving the quality of healthcare 3. Strengthening social protection, especially for children, women, persons with disability and the elderly.
Programmes and Sub-Programmes
Activities (Operations)
Location Baseline Output indicators
Quarterly Time Schedule
Indicative Budget (GH¢) Implementing Agencies
1st 2nd 3rd 4th GoG IGF Donor Lead Collaborating
SOCIAL SERVICES DELIVERY Health Delivery
Provide logistical support (fuel) and technical assistance for carrying out well-planned, high quality community outreach visits with emphasis on nutrition service delivery and improving routine data quality
% Reduction in Under-5 Stunting. % Reduction in Under-5 Underweight .
414,000.00
SOCIAL SERVICES DELIVERY Health Delivery
Demonstrate utilization of locally-available foods to promote dietary diversity, timely and appropriate complementary feeding, and
23,435.00
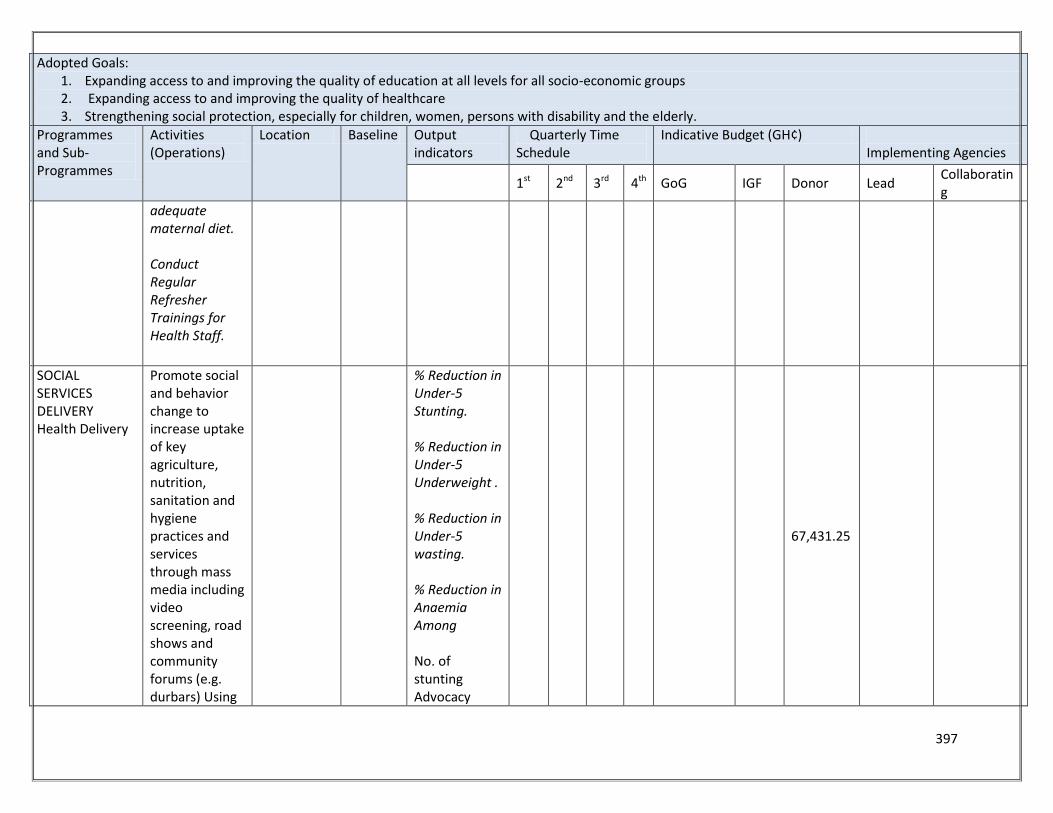
397
Adopted Goals: 1. Expanding access to and improving the quality of education at all levels for all socio-economic groups 2. Expanding access to and improving the quality of healthcare 3. Strengthening social protection, especially for children, women, persons with disability and the elderly.
Programmes and Sub-Programmes
Activities (Operations)
Location Baseline Output indicators
Quarterly Time Schedule
Indicative Budget (GH¢) Implementing Agencies
1st 2nd 3rd 4th GoG IGF Donor Lead Collaborating
adequate maternal diet. Conduct Regular Refresher Trainings for Health Staff.
SOCIAL SERVICES DELIVERY Health Delivery
Promote social and behavior change to increase uptake of key agriculture, nutrition, sanitation and hygiene practices and services through mass media including video screening, road shows and community forums (e.g. durbars) Using
% Reduction in Under-5 Stunting. % Reduction in Under-5 Underweight . % Reduction in Under-5 wasting. % Reduction in Anaemia Among No. of stunting Advocacy
67,431.25
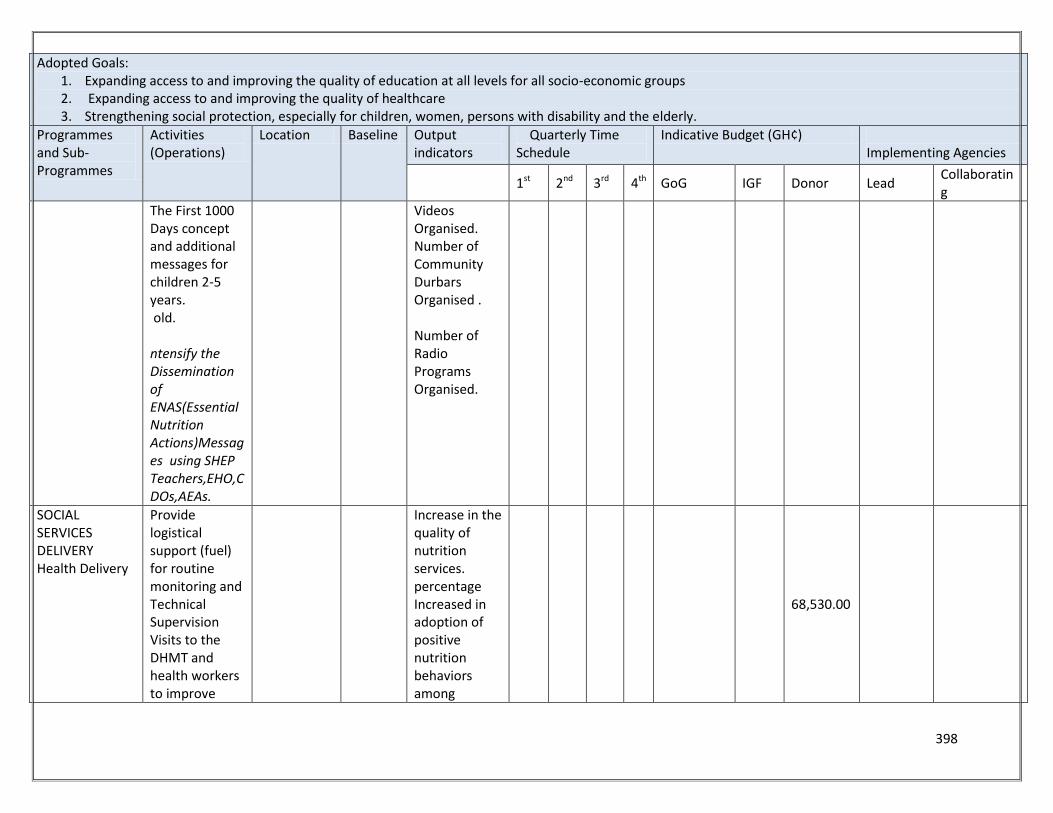
398
Adopted Goals: 1. Expanding access to and improving the quality of education at all levels for all socio-economic groups 2. Expanding access to and improving the quality of healthcare 3. Strengthening social protection, especially for children, women, persons with disability and the elderly.
Programmes and Sub-Programmes
Activities (Operations)
Location Baseline Output indicators
Quarterly Time Schedule
Indicative Budget (GH¢) Implementing Agencies
1st 2nd 3rd 4th GoG IGF Donor Lead Collaborating
The First 1000 Days concept and additional messages for children 2-5 years. old. ntensify the Dissemination of ENAS(Essential Nutrition Actions)Messages using SHEP Teachers,EHO,CDOs,AEAs.
Videos Organised. Number of Community Durbars Organised . Number of Radio Programs Organised.
SOCIAL SERVICES DELIVERY Health Delivery
Provide logistical support (fuel) for routine monitoring and Technical Supervision Visits to the DHMT and health workers to improve
Increase in the quality of nutrition services. percentage Increased in adoption of positive nutrition behaviors among
68,530.00
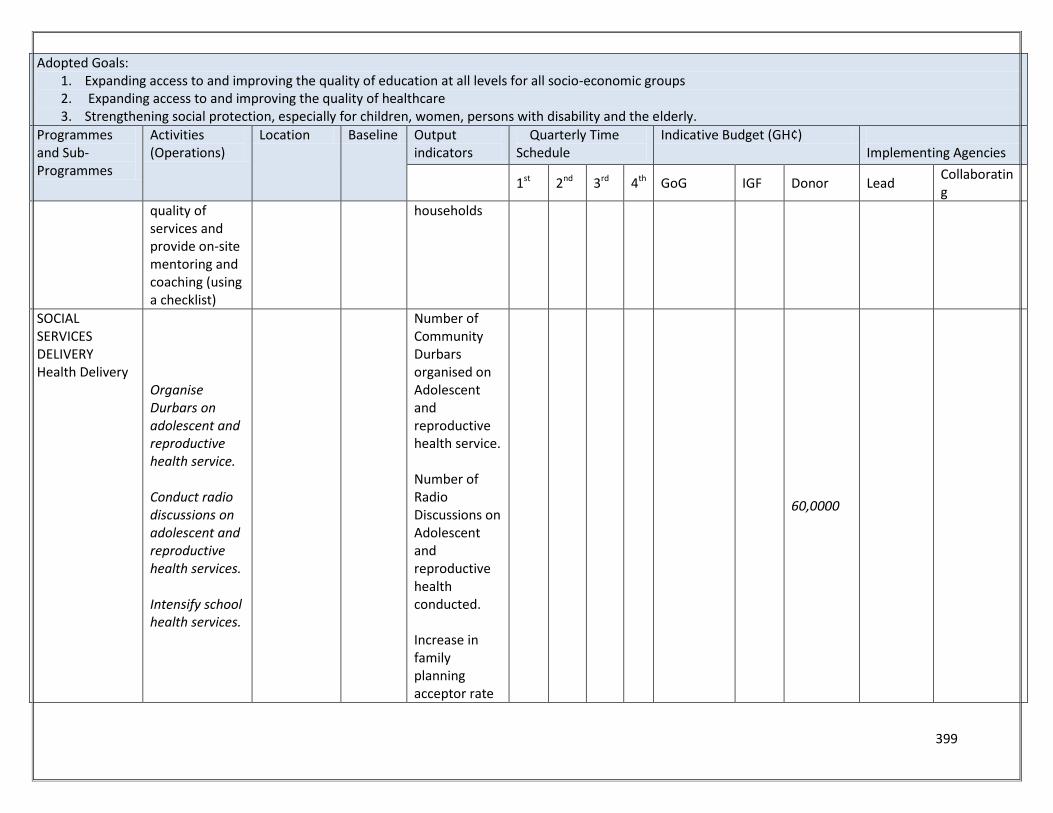
399
Adopted Goals: 1. Expanding access to and improving the quality of education at all levels for all socio-economic groups 2. Expanding access to and improving the quality of healthcare 3. Strengthening social protection, especially for children, women, persons with disability and the elderly.
Programmes and Sub-Programmes
Activities (Operations)
Location Baseline Output indicators
Quarterly Time Schedule
Indicative Budget (GH¢) Implementing Agencies
1st 2nd 3rd 4th GoG IGF Donor Lead Collaborating
quality of services and provide on-site mentoring and coaching (using a checklist)
households
SOCIAL SERVICES DELIVERY Health Delivery
Organise Durbars on adolescent and reproductive health service. Conduct radio discussions on adolescent and reproductive health services. Intensify school health services.
Number of Community Durbars organised on Adolescent and reproductive health service. Number of Radio Discussions on Adolescent and reproductive health conducted. Increase in family planning acceptor rate
60,0000
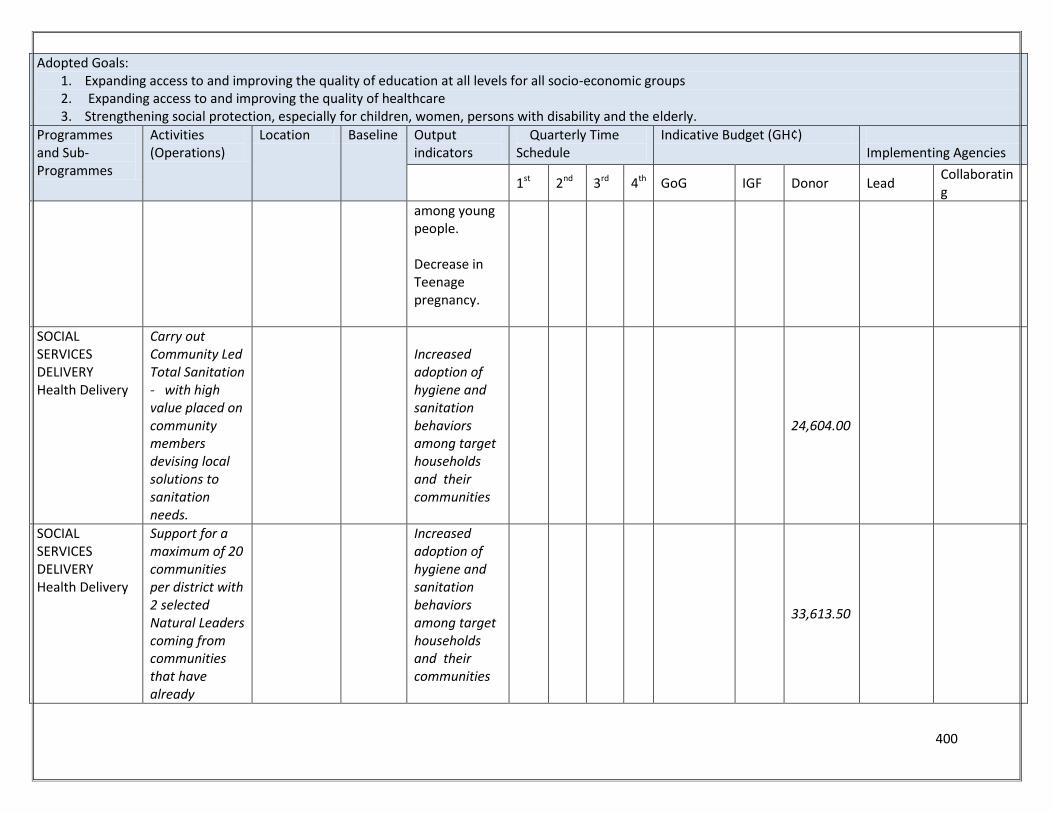
400
Adopted Goals: 1. Expanding access to and improving the quality of education at all levels for all socio-economic groups 2. Expanding access to and improving the quality of healthcare 3. Strengthening social protection, especially for children, women, persons with disability and the elderly.
Programmes and Sub-Programmes
Activities (Operations)
Location Baseline Output indicators
Quarterly Time Schedule
Indicative Budget (GH¢) Implementing Agencies
1st 2nd 3rd 4th GoG IGF Donor Lead Collaborating
among young people. Decrease in Teenage pregnancy.
SOCIAL SERVICES DELIVERY Health Delivery
Carry out Community Led Total Sanitation - with high value placed on community members devising local solutions to sanitation needs.
Increased adoption of hygiene and sanitation behaviors among target households and their communities
24,604.00
SOCIAL SERVICES DELIVERY Health Delivery
Support for a maximum of 20 communities per district with 2 selected Natural Leaders coming from communities that have already
Increased adoption of hygiene and sanitation behaviors among target households and their communities
33,613.50
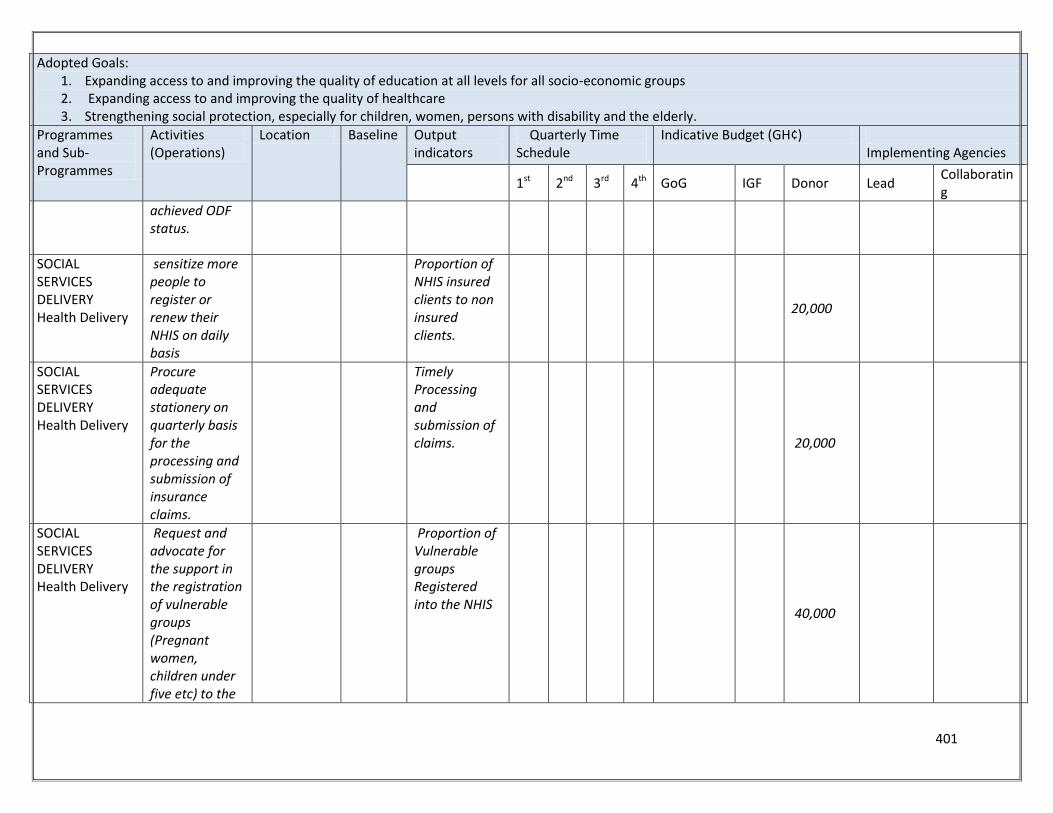
401
Adopted Goals: 1. Expanding access to and improving the quality of education at all levels for all socio-economic groups 2. Expanding access to and improving the quality of healthcare 3. Strengthening social protection, especially for children, women, persons with disability and the elderly.
Programmes and Sub-Programmes
Activities (Operations)
Location Baseline Output indicators
Quarterly Time Schedule
Indicative Budget (GH¢) Implementing Agencies
1st 2nd 3rd 4th GoG IGF Donor Lead Collaborating
achieved ODF status.
SOCIAL SERVICES DELIVERY Health Delivery
sensitize more people to register or renew their NHIS on daily basis
Proportion of NHIS insured clients to non insured clients.
20,000
SOCIAL SERVICES DELIVERY Health Delivery
Procure adequate stationery on quarterly basis for the processing and submission of insurance claims.
Timely Processing and submission of claims.
20,000
SOCIAL SERVICES DELIVERY Health Delivery
Request and advocate for the support in the registration of vulnerable groups (Pregnant women, children under five etc) to the
Proportion of Vulnerable groups Registered into the NHIS
40,000
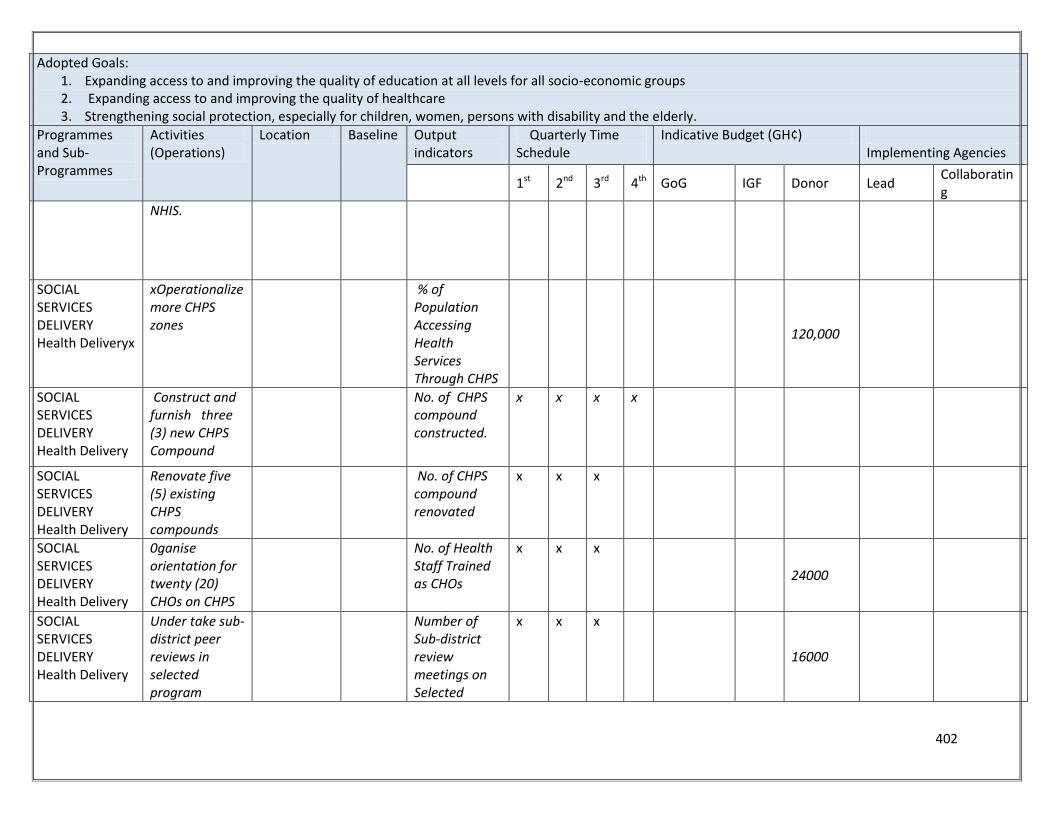
402
Adopted Goals: 1. Expanding access to and improving the quality of education at all levels for all socio-economic groups 2. Expanding access to and improving the quality of healthcare 3. Strengthening social protection, especially for children, women, persons with disability and the elderly.
Programmes and Sub-Programmes
Activities (Operations)
Location Baseline Output indicators
Quarterly Time Schedule
Indicative Budget (GH¢) Implementing Agencies
1st 2nd 3rd 4th GoG IGF Donor Lead Collaborating
NHIS.
SOCIAL SERVICES DELIVERY Health Deliveryx
xOperationalize more CHPS zones
% of Population Accessing Health Services Through CHPS
120,000
SOCIAL SERVICES DELIVERY Health Delivery
Construct and furnish three (3) new CHPS Compound
No. of CHPS compound constructed.
x x x x
SOCIAL SERVICES DELIVERY Health Delivery
Renovate five (5) existing CHPS compounds
No. of CHPS compound renovated
x x x
SOCIAL SERVICES DELIVERY Health Delivery
0ganise orientation for twenty (20) CHOs on CHPS
No. of Health Staff Trained as CHOs
x x x
24000
SOCIAL SERVICES DELIVERY Health Delivery
Under take sub-district peer reviews in selected program
Number of Sub-district review meetings on Selected
x x x
16000
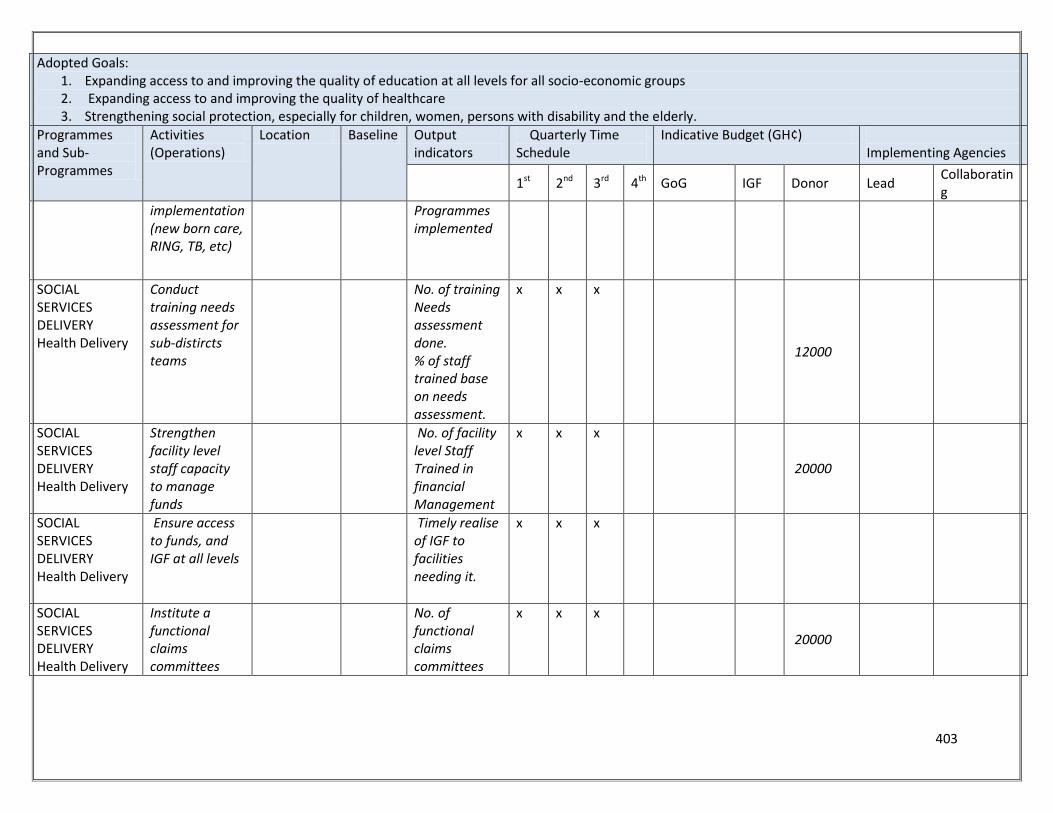
403
Adopted Goals: 1. Expanding access to and improving the quality of education at all levels for all socio-economic groups 2. Expanding access to and improving the quality of healthcare 3. Strengthening social protection, especially for children, women, persons with disability and the elderly.
Programmes and Sub-Programmes
Activities (Operations)
Location Baseline Output indicators
Quarterly Time Schedule
Indicative Budget (GH¢) Implementing Agencies
1st 2nd 3rd 4th GoG IGF Donor Lead Collaborating
implementation (new born care, RING, TB, etc)
Programmes implemented
SOCIAL SERVICES DELIVERY Health Delivery
Conduct training needs assessment for sub-distircts teams
No. of training Needs assessment done. % of staff trained base on needs assessment.
x x x
12000
SOCIAL SERVICES DELIVERY Health Delivery
Strengthen facility level staff capacity to manage funds
No. of facility level Staff Trained in financial Management
x x x
20000
SOCIAL SERVICES DELIVERY Health Delivery
Ensure access to funds, and IGF at all levels
Timely realise of IGF to facilities needing it.
x x x
SOCIAL SERVICES DELIVERY Health Delivery
Institute a functional claims committees
No. of functional claims committees
x x x
20000
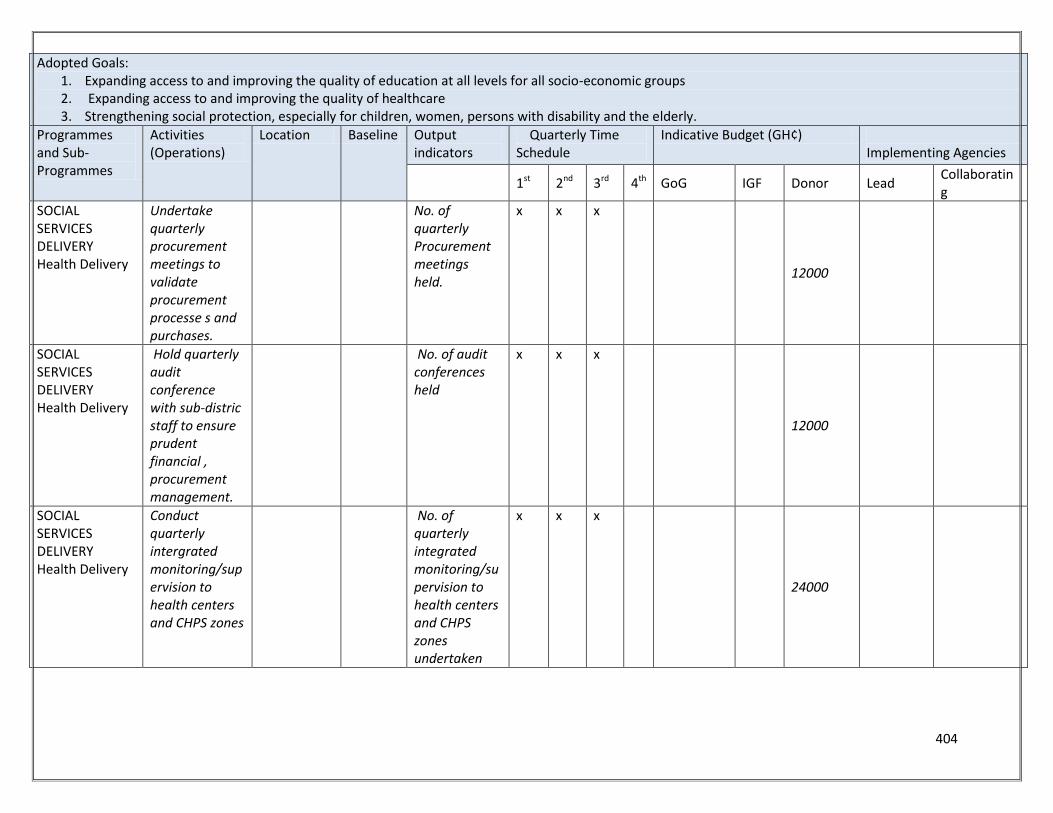
404
Adopted Goals: 1. Expanding access to and improving the quality of education at all levels for all socio-economic groups 2. Expanding access to and improving the quality of healthcare 3. Strengthening social protection, especially for children, women, persons with disability and the elderly.
Programmes and Sub-Programmes
Activities (Operations)
Location Baseline Output indicators
Quarterly Time Schedule
Indicative Budget (GH¢) Implementing Agencies
1st 2nd 3rd 4th GoG IGF Donor Lead Collaborating
SOCIAL SERVICES DELIVERY Health Delivery
Undertake quarterly procurement meetings to validate procurement processe s and purchases.
No. of quarterly Procurement meetings held.
x x x
12000
SOCIAL SERVICES DELIVERY Health Delivery
Hold quarterly audit conference with sub-distric staff to ensure prudent financial , procurement management.
No. of audit conferences held
x x x
12000
SOCIAL SERVICES DELIVERY Health Delivery
Conduct quarterly intergrated monitoring/supervision to health centers and CHPS zones
No. of quarterly integrated monitoring/supervision to health centers and CHPS zones undertaken
x x x
24000
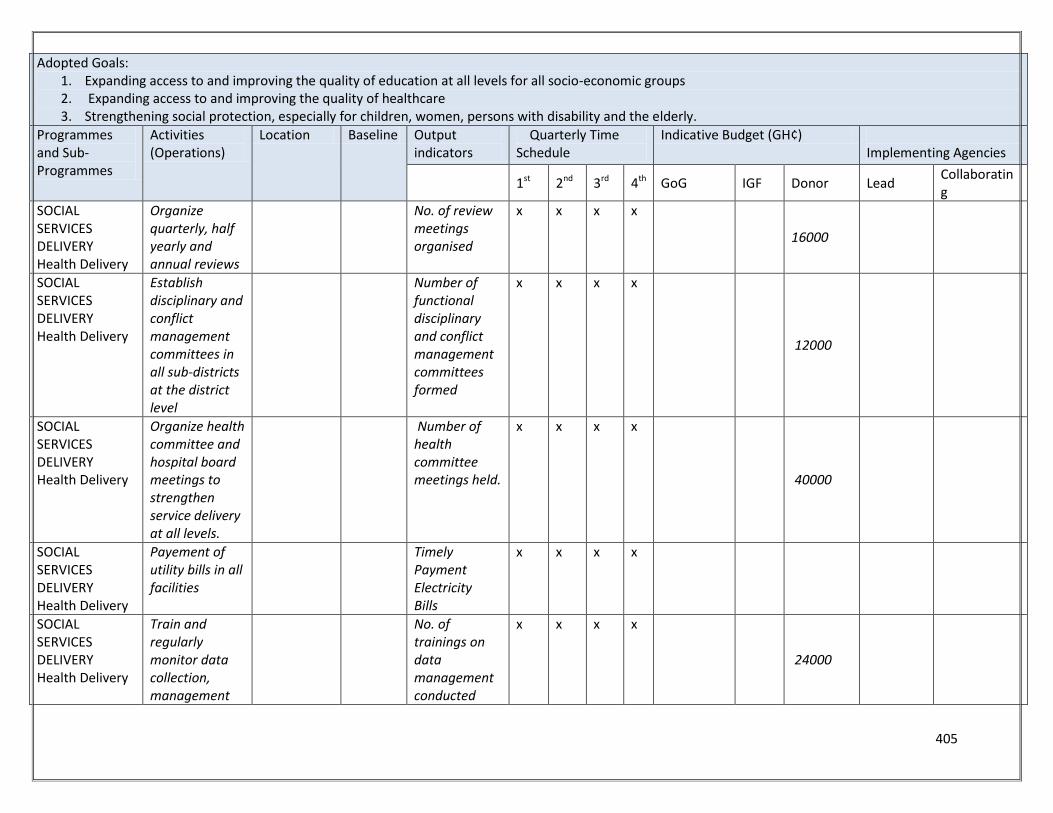
405
Adopted Goals: 1. Expanding access to and improving the quality of education at all levels for all socio-economic groups 2. Expanding access to and improving the quality of healthcare 3. Strengthening social protection, especially for children, women, persons with disability and the elderly.
Programmes and Sub-Programmes
Activities (Operations)
Location Baseline Output indicators
Quarterly Time Schedule
Indicative Budget (GH¢) Implementing Agencies
1st 2nd 3rd 4th GoG IGF Donor Lead Collaborating
SOCIAL SERVICES DELIVERY Health Delivery
Organize quarterly, half yearly and annual reviews
No. of review meetings organised
x x x x
16000
SOCIAL SERVICES DELIVERY Health Delivery
Establish disciplinary and conflict management committees in all sub-districts at the district level
Number of functional disciplinary and conflict management committees formed
x x x x
12000
SOCIAL SERVICES DELIVERY Health Delivery
Organize health committee and hospital board meetings to strengthen service delivery at all levels.
Number of health committee meetings held.
x x x x
40000
SOCIAL SERVICES DELIVERY Health Delivery
Payement of utility bills in all facilities
Timely Payment Electricity Bills
x x x x
SOCIAL SERVICES DELIVERY Health Delivery
Train and regularly monitor data collection, management
No. of trainings on data management conducted
x x x x
24000
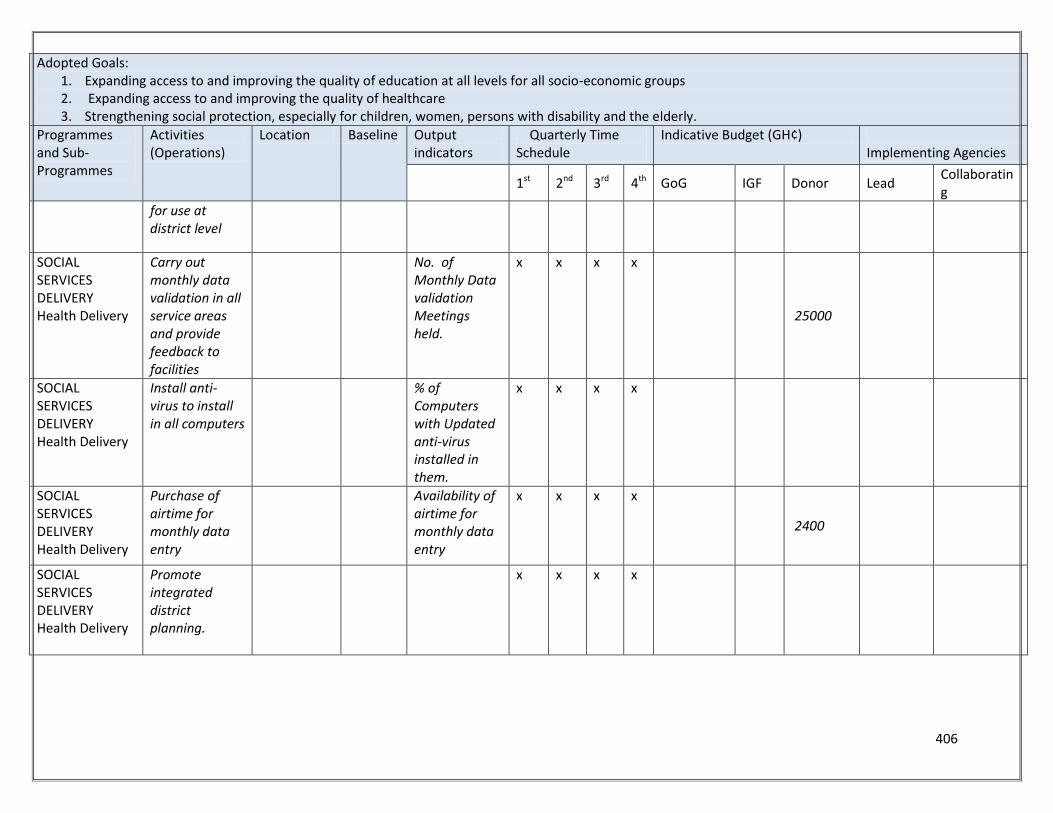
406
Adopted Goals: 1. Expanding access to and improving the quality of education at all levels for all socio-economic groups 2. Expanding access to and improving the quality of healthcare 3. Strengthening social protection, especially for children, women, persons with disability and the elderly.
Programmes and Sub-Programmes
Activities (Operations)
Location Baseline Output indicators
Quarterly Time Schedule
Indicative Budget (GH¢) Implementing Agencies
1st 2nd 3rd 4th GoG IGF Donor Lead Collaborating
for use at district level
SOCIAL SERVICES DELIVERY Health Delivery
Carry out monthly data validation in all service areas and provide feedback to facilities
No. of Monthly Data validation Meetings held.
x x x x
25000
SOCIAL SERVICES DELIVERY Health Delivery
Install anti-virus to install in all computers
% of Computers with Updated anti-virus installed in them.
x x x x
SOCIAL SERVICES DELIVERY Health Delivery
Purchase of airtime for monthly data entry
Availability of airtime for monthly data entry
x x x x
2400
SOCIAL SERVICES DELIVERY Health Delivery
Promote integrated district planning.
x x x x
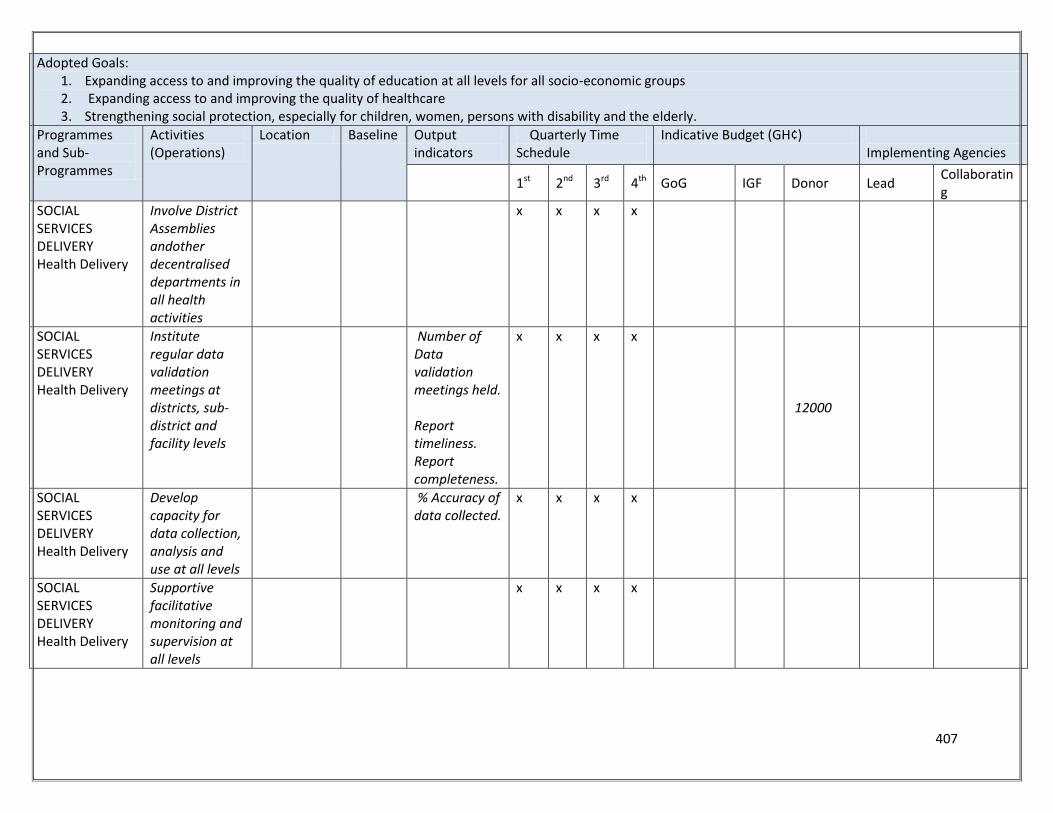
407
Adopted Goals: 1. Expanding access to and improving the quality of education at all levels for all socio-economic groups 2. Expanding access to and improving the quality of healthcare 3. Strengthening social protection, especially for children, women, persons with disability and the elderly.
Programmes and Sub-Programmes
Activities (Operations)
Location Baseline Output indicators
Quarterly Time Schedule
Indicative Budget (GH¢) Implementing Agencies
1st 2nd 3rd 4th GoG IGF Donor Lead Collaborating
SOCIAL SERVICES DELIVERY Health Delivery
Involve District Assemblies andother decentralised departments in all health activities
x x x x
SOCIAL SERVICES DELIVERY Health Delivery
Institute regular data validation meetings at districts, sub-district and facility levels
Number of Data validation meetings held. Report timeliness. Report completeness.
x x x x
12000
SOCIAL SERVICES DELIVERY Health Delivery
Develop capacity for data collection, analysis and use at all levels
% Accuracy of data collected.
x x x x
SOCIAL SERVICES DELIVERY Health Delivery
Supportive facilitative monitoring and supervision at all levels
x x x x
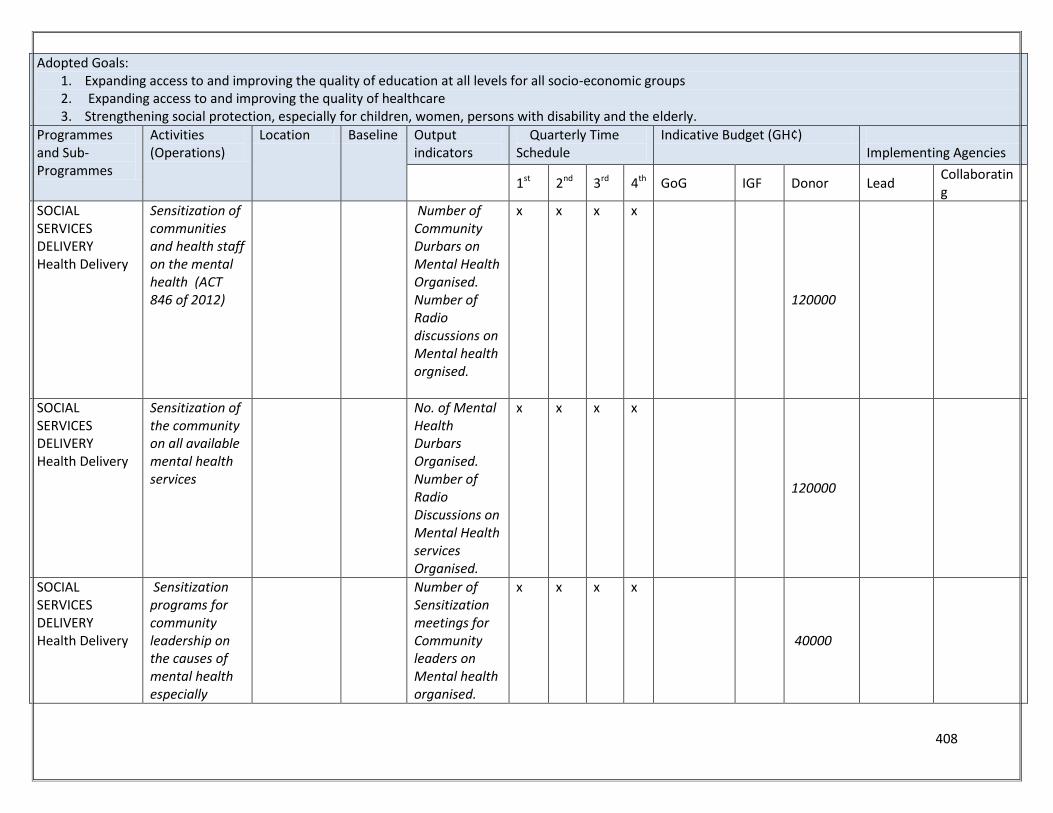
408
Adopted Goals: 1. Expanding access to and improving the quality of education at all levels for all socio-economic groups 2. Expanding access to and improving the quality of healthcare 3. Strengthening social protection, especially for children, women, persons with disability and the elderly.
Programmes and Sub-Programmes
Activities (Operations)
Location Baseline Output indicators
Quarterly Time Schedule
Indicative Budget (GH¢) Implementing Agencies
1st 2nd 3rd 4th GoG IGF Donor Lead Collaborating
SOCIAL SERVICES DELIVERY Health Delivery
Sensitization of communities and health staff on the mental health (ACT 846 of 2012)
Number of Community Durbars on Mental Health Organised. Number of Radio discussions on Mental health orgnised.
x x x x
120000
SOCIAL SERVICES DELIVERY Health Delivery
Sensitization of the community on all available mental health services
No. of Mental Health Durbars Organised. Number of Radio Discussions on Mental Health services Organised.
x x x x
120000
SOCIAL SERVICES DELIVERY Health Delivery
Sensitization programs for community leadership on the causes of mental health especially
Number of Sensitization meetings for Community leaders on Mental health organised.
x x x x
40000
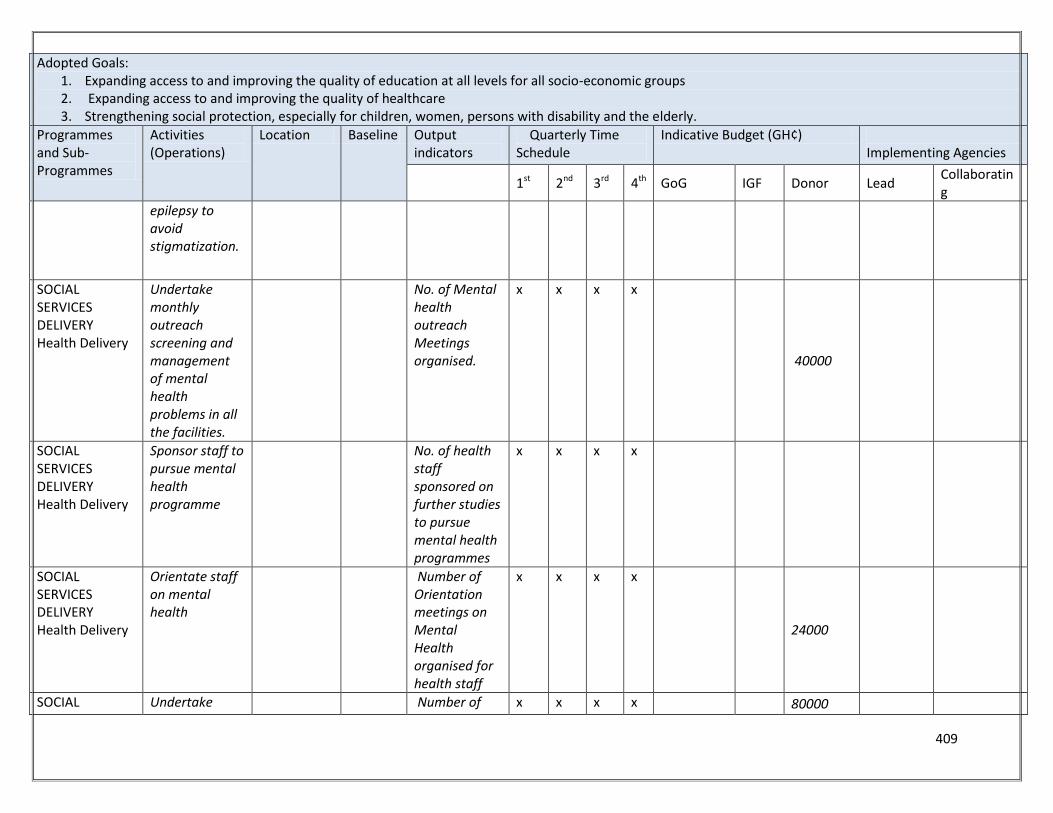
409
Adopted Goals: 1. Expanding access to and improving the quality of education at all levels for all socio-economic groups 2. Expanding access to and improving the quality of healthcare 3. Strengthening social protection, especially for children, women, persons with disability and the elderly.
Programmes and Sub-Programmes
Activities (Operations)
Location Baseline Output indicators
Quarterly Time Schedule
Indicative Budget (GH¢) Implementing Agencies
1st 2nd 3rd 4th GoG IGF Donor Lead Collaborating
epilepsy to avoid stigmatization.
SOCIAL SERVICES DELIVERY Health Delivery
Undertake monthly outreach screening and management of mental health problems in all the facilities.
No. of Mental health outreach Meetings organised.
x x x x
40000
SOCIAL SERVICES DELIVERY Health Delivery
Sponsor staff to pursue mental health programme
No. of health staff sponsored on further studies to pursue mental health programmes
x x x x
SOCIAL SERVICES DELIVERY Health Delivery
Orientate staff on mental health
Number of Orientation meetings on Mental Health organised for health staff
x x x x
24000
SOCIAL Undertake Number of x x x x 80000
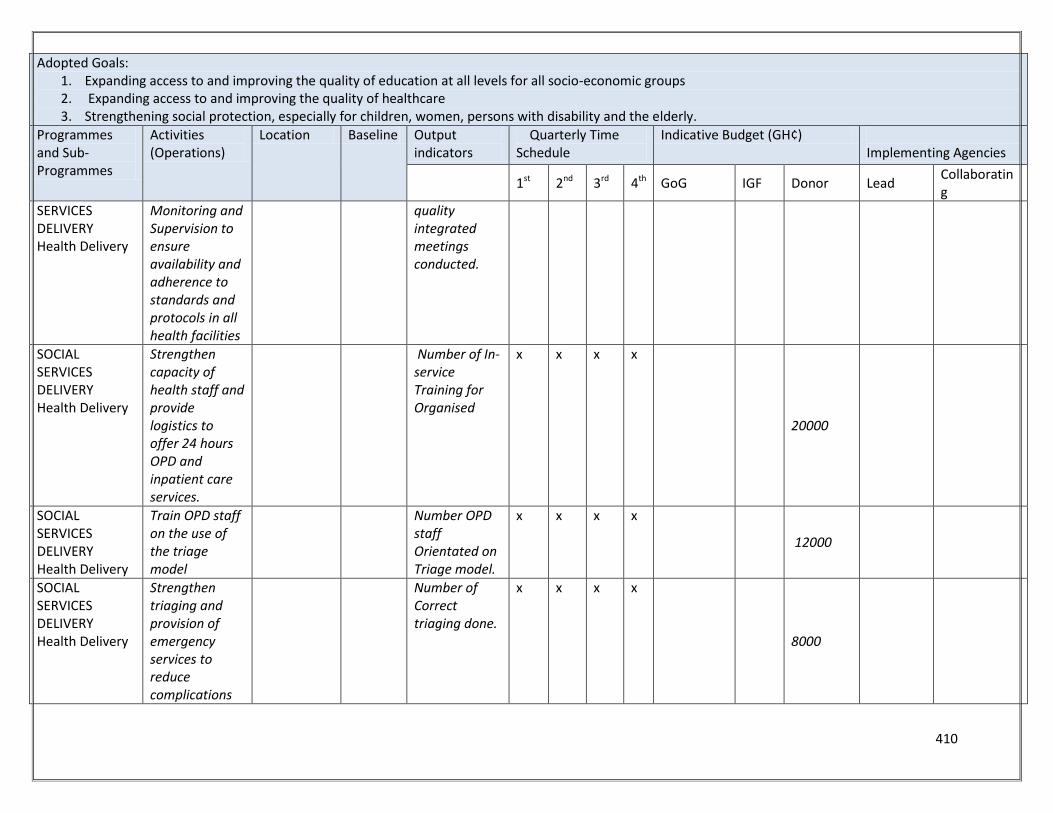
410
Adopted Goals: 1. Expanding access to and improving the quality of education at all levels for all socio-economic groups 2. Expanding access to and improving the quality of healthcare 3. Strengthening social protection, especially for children, women, persons with disability and the elderly.
Programmes and Sub-Programmes
Activities (Operations)
Location Baseline Output indicators
Quarterly Time Schedule
Indicative Budget (GH¢) Implementing Agencies
1st 2nd 3rd 4th GoG IGF Donor Lead Collaborating
SERVICES DELIVERY Health Delivery
Monitoring and Supervision to ensure availability and adherence to standards and protocols in all health facilities
quality integrated meetings conducted.
SOCIAL SERVICES DELIVERY Health Delivery
Strengthen capacity of health staff and provide logistics to offer 24 hours OPD and inpatient care services.
Number of In-service Training for Organised
x x x x
20000
SOCIAL SERVICES DELIVERY Health Delivery
Train OPD staff on the use of the triage model
Number OPD staff Orientated on Triage model.
x x x x
12000
SOCIAL SERVICES DELIVERY Health Delivery
Strengthen triaging and provision of emergency services to reduce complications
Number of Correct triaging done.
x x x x
8000
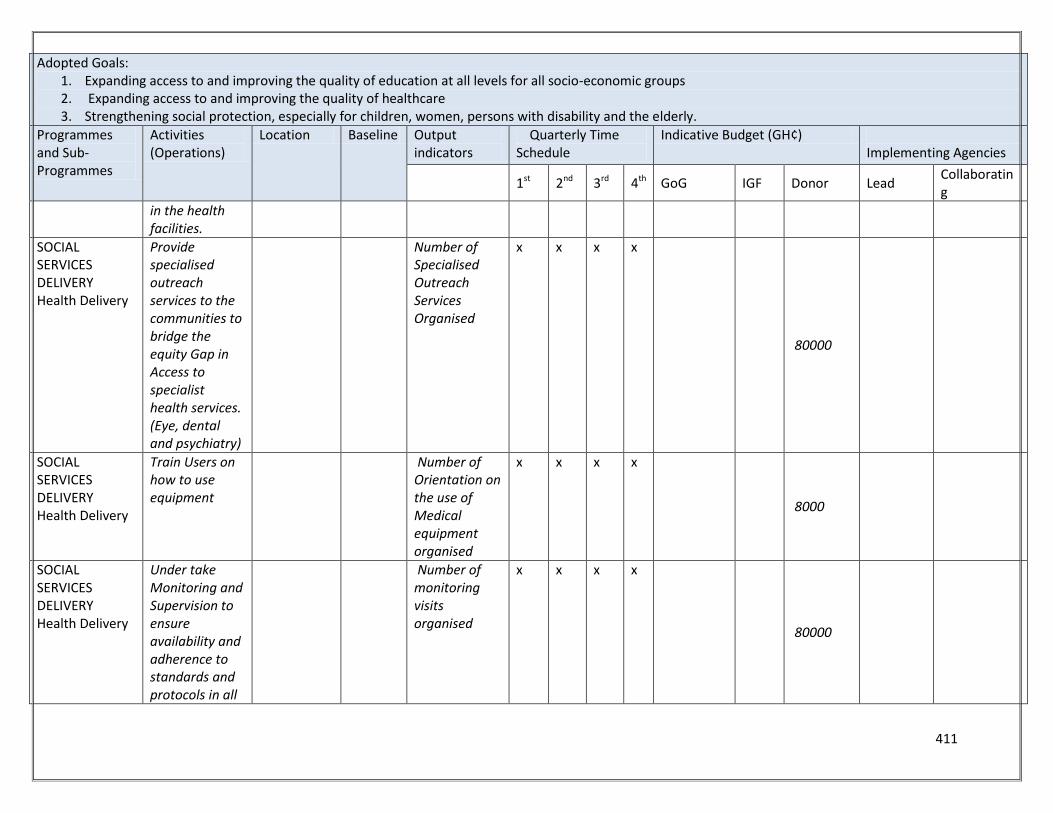
411
Adopted Goals: 1. Expanding access to and improving the quality of education at all levels for all socio-economic groups 2. Expanding access to and improving the quality of healthcare 3. Strengthening social protection, especially for children, women, persons with disability and the elderly.
Programmes and Sub-Programmes
Activities (Operations)
Location Baseline Output indicators
Quarterly Time Schedule
Indicative Budget (GH¢) Implementing Agencies
1st 2nd 3rd 4th GoG IGF Donor Lead Collaborating
in the health facilities.
SOCIAL SERVICES DELIVERY Health Delivery
Provide specialised outreach services to the communities to bridge the equity Gap in Access to specialist health services. (Eye, dental and psychiatry)
Number of Specialised Outreach Services Organised
x x x x
80000
SOCIAL SERVICES DELIVERY Health Delivery
Train Users on how to use equipment
Number of Orientation on the use of Medical equipment organised
x x x x
8000
SOCIAL SERVICES DELIVERY Health Delivery
Under take Monitoring and Supervision to ensure availability and adherence to standards and protocols in all
Number of monitoring visits organised
x x x x
80000
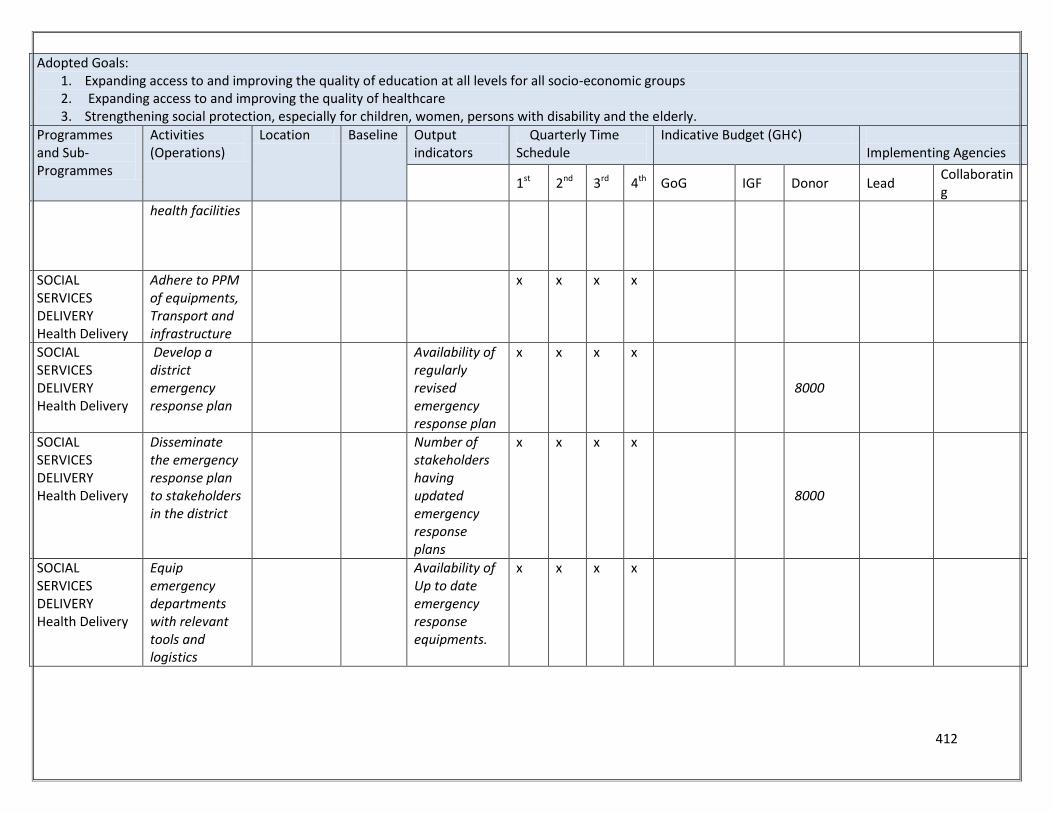
412
Adopted Goals: 1. Expanding access to and improving the quality of education at all levels for all socio-economic groups 2. Expanding access to and improving the quality of healthcare 3. Strengthening social protection, especially for children, women, persons with disability and the elderly.
Programmes and Sub-Programmes
Activities (Operations)
Location Baseline Output indicators
Quarterly Time Schedule
Indicative Budget (GH¢) Implementing Agencies
1st 2nd 3rd 4th GoG IGF Donor Lead Collaborating
health facilities
SOCIAL SERVICES DELIVERY Health Delivery
Adhere to PPM of equipments, Transport and infrastructure
x x x x
SOCIAL SERVICES DELIVERY Health Delivery
Develop a district emergency response plan
Availability of regularly revised emergency response plan
x x x x
8000
SOCIAL SERVICES DELIVERY Health Delivery
Disseminate the emergency response plan to stakeholders in the district
Number of stakeholders having updated emergency response plans
x x x x
8000
SOCIAL SERVICES DELIVERY Health Delivery
Equip emergency departments with relevant tools and logistics
Availability of Up to date emergency response equipments.
x x x x
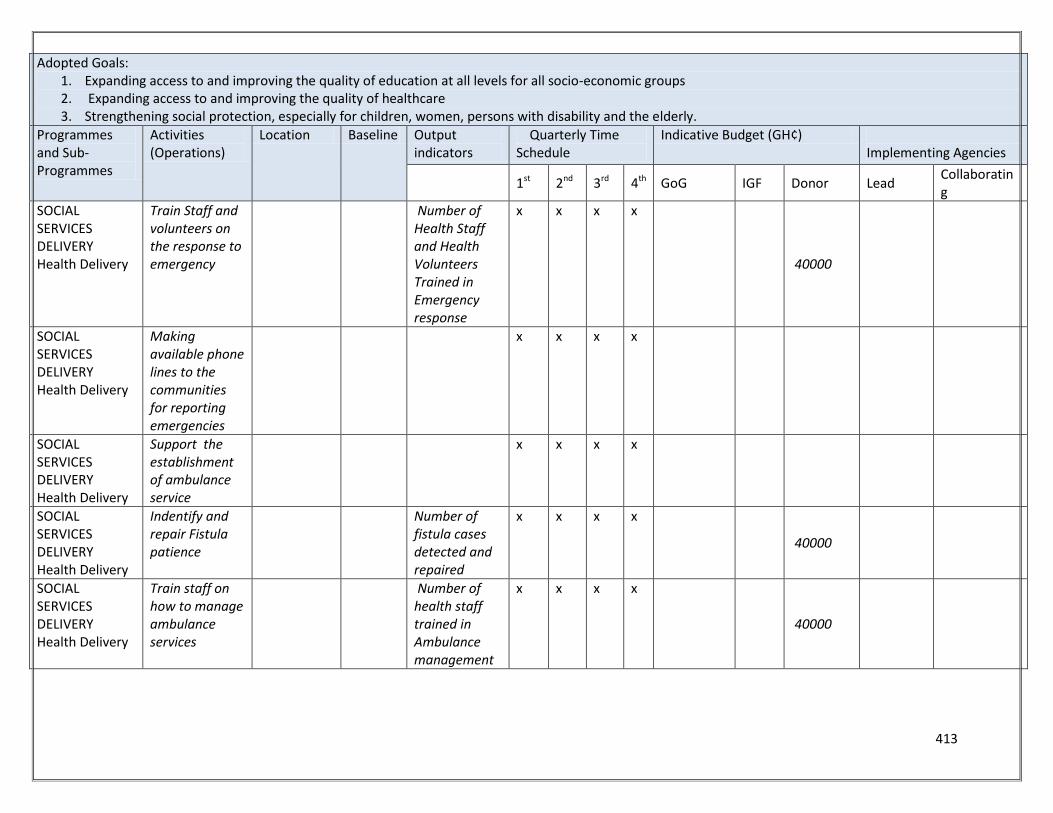
413
Adopted Goals: 1. Expanding access to and improving the quality of education at all levels for all socio-economic groups 2. Expanding access to and improving the quality of healthcare 3. Strengthening social protection, especially for children, women, persons with disability and the elderly.
Programmes and Sub-Programmes
Activities (Operations)
Location Baseline Output indicators
Quarterly Time Schedule
Indicative Budget (GH¢) Implementing Agencies
1st 2nd 3rd 4th GoG IGF Donor Lead Collaborating
SOCIAL SERVICES DELIVERY Health Delivery
Train Staff and volunteers on the response to emergency
Number of Health Staff and Health Volunteers Trained in Emergency response
x x x x
40000
SOCIAL SERVICES DELIVERY Health Delivery
Making available phone lines to the communities for reporting emergencies
x x x x
SOCIAL SERVICES DELIVERY Health Delivery
Support the establishment of ambulance service
x x x x
SOCIAL SERVICES DELIVERY Health Delivery
Indentify and repair Fistula patience
Number of fistula cases detected and repaired
x x x x
40000
SOCIAL SERVICES DELIVERY Health Delivery
Train staff on how to manage ambulance services
Number of health staff trained in Ambulance management
x x x x
40000
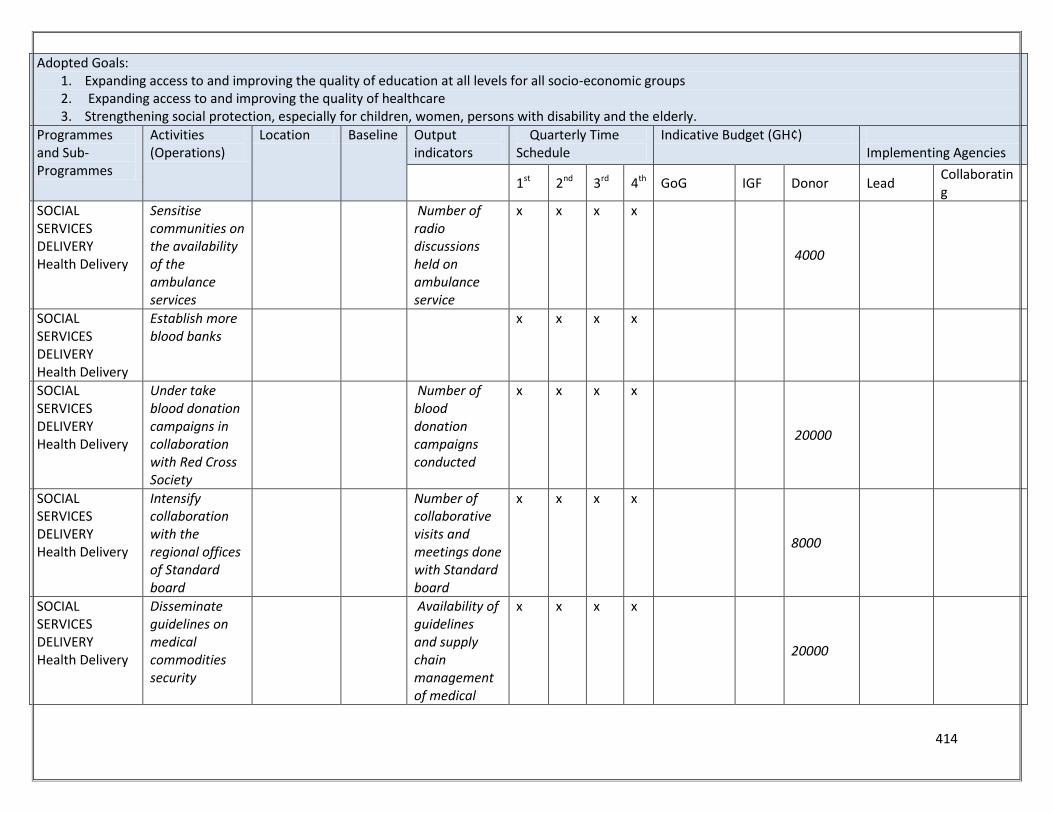
414
Adopted Goals: 1. Expanding access to and improving the quality of education at all levels for all socio-economic groups 2. Expanding access to and improving the quality of healthcare 3. Strengthening social protection, especially for children, women, persons with disability and the elderly.
Programmes and Sub-Programmes
Activities (Operations)
Location Baseline Output indicators
Quarterly Time Schedule
Indicative Budget (GH¢) Implementing Agencies
1st 2nd 3rd 4th GoG IGF Donor Lead Collaborating
SOCIAL SERVICES DELIVERY Health Delivery
Sensitise communities on the availability of the ambulance services
Number of radio discussions held on ambulance service
x x x x
4000
SOCIAL SERVICES DELIVERY Health Delivery
Establish more blood banks
x x x x
SOCIAL SERVICES DELIVERY Health Delivery
Under take blood donation campaigns in collaboration with Red Cross Society
Number of blood donation campaigns conducted
x x x x
20000
SOCIAL SERVICES DELIVERY Health Delivery
Intensify collaboration with the regional offices of Standard board
Number of collaborative visits and meetings done with Standard board
x x x x
8000
SOCIAL SERVICES DELIVERY Health Delivery
Disseminate guidelines on medical commodities security
Availability of guidelines and supply chain management of medical
x x x x
20000
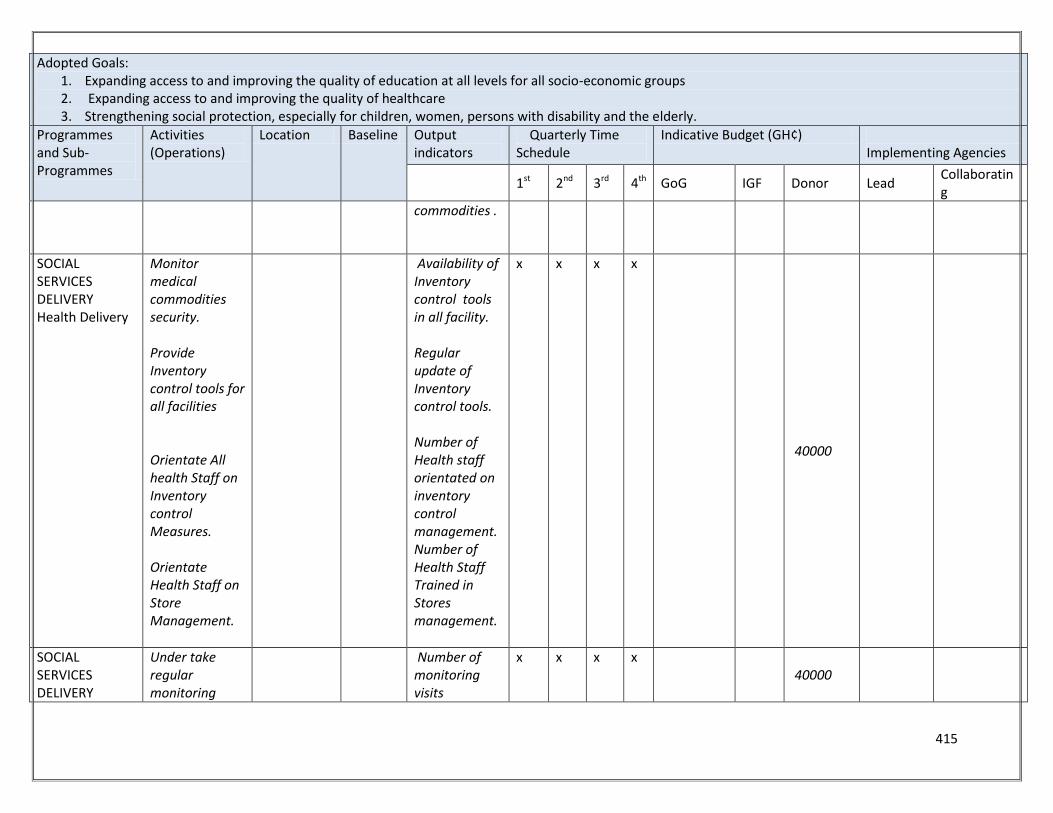
415
Adopted Goals: 1. Expanding access to and improving the quality of education at all levels for all socio-economic groups 2. Expanding access to and improving the quality of healthcare 3. Strengthening social protection, especially for children, women, persons with disability and the elderly.
Programmes and Sub-Programmes
Activities (Operations)
Location Baseline Output indicators
Quarterly Time Schedule
Indicative Budget (GH¢) Implementing Agencies
1st 2nd 3rd 4th GoG IGF Donor Lead Collaborating
commodities .
SOCIAL SERVICES DELIVERY Health Delivery
Monitor medical commodities security. Provide Inventory control tools for all facilities Orientate All health Staff on Inventory control Measures. Orientate Health Staff on Store Management.
Availability of Inventory control tools in all facility. Regular update of Inventory control tools. Number of Health staff orientated on inventory control management. Number of Health Staff Trained in Stores management.
x x x x
40000
SOCIAL SERVICES DELIVERY
Under take regular monitoring
Number of monitoring visits
x x x x 40000
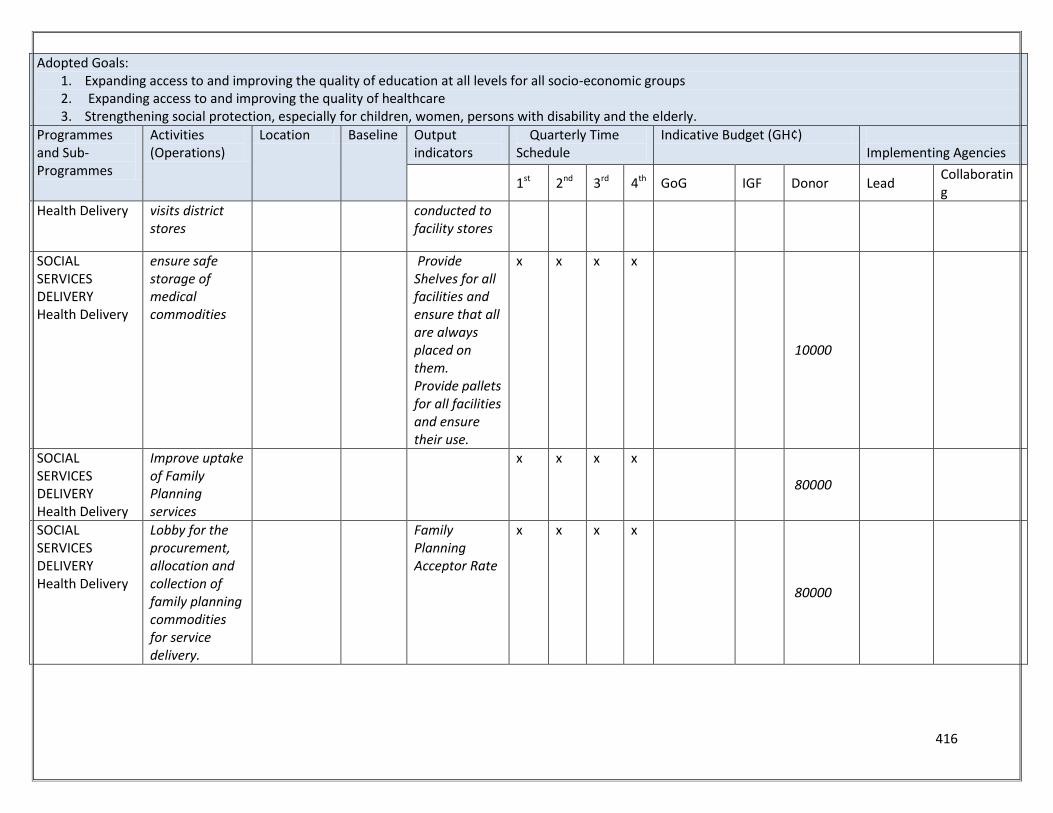
416
Adopted Goals: 1. Expanding access to and improving the quality of education at all levels for all socio-economic groups 2. Expanding access to and improving the quality of healthcare 3. Strengthening social protection, especially for children, women, persons with disability and the elderly.
Programmes and Sub-Programmes
Activities (Operations)
Location Baseline Output indicators
Quarterly Time Schedule
Indicative Budget (GH¢) Implementing Agencies
1st 2nd 3rd 4th GoG IGF Donor Lead Collaborating
Health Delivery visits district stores
conducted to facility stores
SOCIAL SERVICES DELIVERY Health Delivery
ensure safe storage of medical commodities
Provide Shelves for all facilities and ensure that all are always placed on them. Provide pallets for all facilities and ensure their use.
x x x x
10000
SOCIAL SERVICES DELIVERY Health Delivery
Improve uptake of Family Planning services
x x x x
80000
SOCIAL SERVICES DELIVERY Health Delivery
Lobby for the procurement, allocation and collection of family planning commodities for service delivery.
Family Planning Acceptor Rate
x x x x
80000
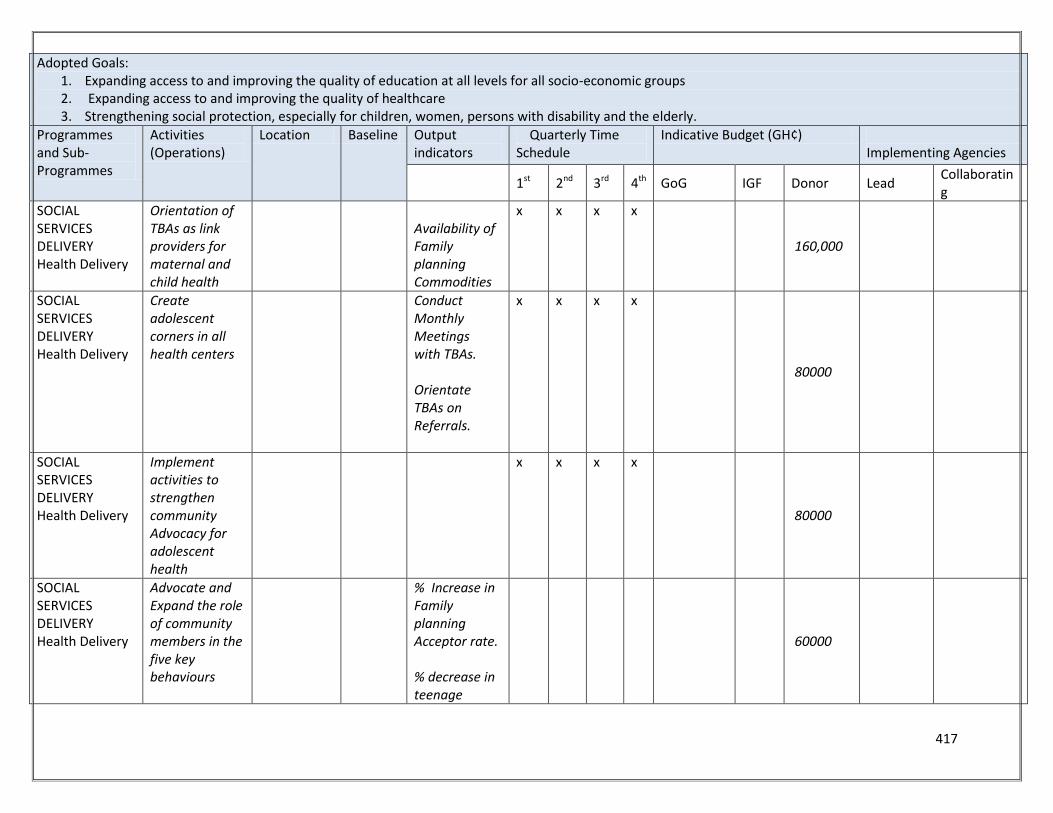
417
Adopted Goals: 1. Expanding access to and improving the quality of education at all levels for all socio-economic groups 2. Expanding access to and improving the quality of healthcare 3. Strengthening social protection, especially for children, women, persons with disability and the elderly.
Programmes and Sub-Programmes
Activities (Operations)
Location Baseline Output indicators
Quarterly Time Schedule
Indicative Budget (GH¢) Implementing Agencies
1st 2nd 3rd 4th GoG IGF Donor Lead Collaborating
SOCIAL SERVICES DELIVERY Health Delivery
Orientation of TBAs as link providers for maternal and child health
Availability of Family planning Commodities
x x x x
160,000
SOCIAL SERVICES DELIVERY Health Delivery
Create adolescent corners in all health centers
Conduct Monthly Meetings with TBAs. Orientate TBAs on Referrals.
x x x x
80000
SOCIAL SERVICES DELIVERY Health Delivery
Implement activities to strengthen community Advocacy for adolescent health
x x x x
80000
SOCIAL SERVICES DELIVERY Health Delivery
Advocate and Expand the role of community members in the five key behaviours
% Increase in Family planning Acceptor rate. % decrease in teenage
60000
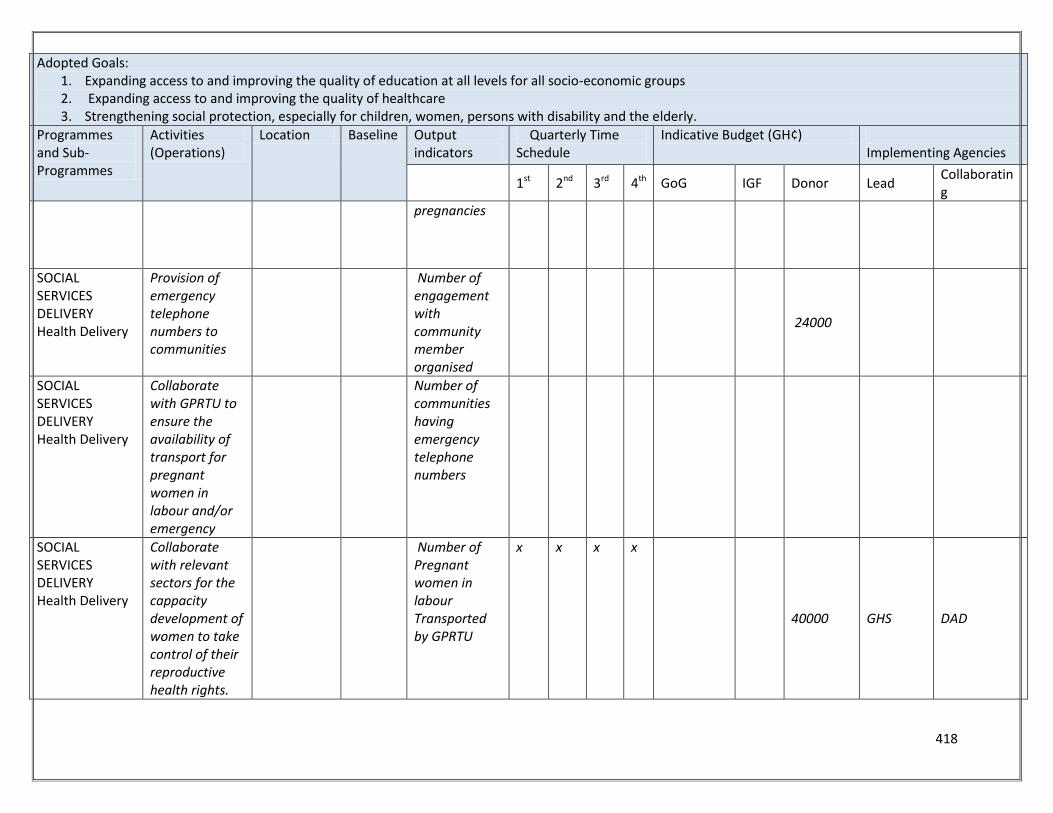
418
Adopted Goals: 1. Expanding access to and improving the quality of education at all levels for all socio-economic groups 2. Expanding access to and improving the quality of healthcare 3. Strengthening social protection, especially for children, women, persons with disability and the elderly.
Programmes and Sub-Programmes
Activities (Operations)
Location Baseline Output indicators
Quarterly Time Schedule
Indicative Budget (GH¢) Implementing Agencies
1st 2nd 3rd 4th GoG IGF Donor Lead Collaborating
pregnancies
SOCIAL SERVICES DELIVERY Health Delivery
Provision of emergency telephone numbers to communities
Number of engagement with community member organised
24000
SOCIAL SERVICES DELIVERY Health Delivery
Collaborate with GPRTU to ensure the availability of transport for pregnant women in labour and/or emergency
Number of communities having emergency telephone numbers
SOCIAL SERVICES DELIVERY Health Delivery
Collaborate with relevant sectors for the cappacity development of women to take control of their reproductive health rights.
Number of Pregnant women in labour Transported by GPRTU
x x x x
40000 GHS DAD

419
Adopted Goals: 1. Expanding access to and improving the quality of education at all levels for all socio-economic groups 2. Expanding access to and improving the quality of healthcare 3. Strengthening social protection, especially for children, women, persons with disability and the elderly.
Programmes and Sub-Programmes
Activities (Operations)
Location Baseline Output indicators
Quarterly Time Schedule
Indicative Budget (GH¢) Implementing Agencies
1st 2nd 3rd 4th GoG IGF Donor Lead Collaborating
SOCIAL SERVICES DELIVERY Health Delivery
Advocate and lobby for equipment and logistics support for the management of delivery and resuscitation of the new borns.
Number of Discussions on women reproductive rights organised
x x x
GHS DAD
SOCIAL SERVICES DELIVERY Health Delivery
Advocate for DAs to sponsor more candidates for midwifery training
Availability of delivery and resuscitation equipment at all delivery pointss
x x x
GHS DAD
SOCIAL SERVICES DELIVERY Health Delivery
Celebration of child health promotion week
Number of health staff sponsored to pursue midwifery
x x x
24,000 GHS DAD
SOCIAL SERVICES DELIVERY Health Delivery
Undertake weekly home visits to neonates and their mothers
x x x
160000 GHS DA
SOCIAL SERVICES DELIVERY
Hold review meetings with staff and
Number of
Weekly home visits
x x x 80,1000 EHU DSWCD

420
Adopted Goals: 1. Expanding access to and improving the quality of education at all levels for all socio-economic groups 2. Expanding access to and improving the quality of healthcare 3. Strengthening social protection, especially for children, women, persons with disability and the elderly.
Programmes and Sub-Programmes
Activities (Operations)
Location Baseline Output indicators
Quarterly Time Schedule
Indicative Budget (GH¢) Implementing Agencies
1st 2nd 3rd 4th GoG IGF Donor Lead Collaborating
Health Delivery volunteers on new born care activities.
conducted
SOCIAL SERVICES DELIVERY Health Delivery
Organize Refresher training for NICCU staff on care of neonates
Number of Quarterly Review meetings organised.
x x x
40,000 EHU DSWCD
SOCIAL SERVICES DELIVERY Health Delivery
Audit all neonatal deaths
Number of Refresher Trainings Organised.
x x x
8,000 GHS NHIS
SOCIAL SERVICES DELIVERY Health Delivery
Implement community based child survival interventions (CCM, MCHPN,)
Number of Neonatal deaths audited
x x x
800000 GHS NHIS
SOCIAL SERVICES DELIVERY Health Delivery
Re-inforce the 5 key health behaviors among community members
Number of Case of diarrhoea,Malaria,RTI managered by Community Health volunteers. Number of
x x x
9600 GHS DA
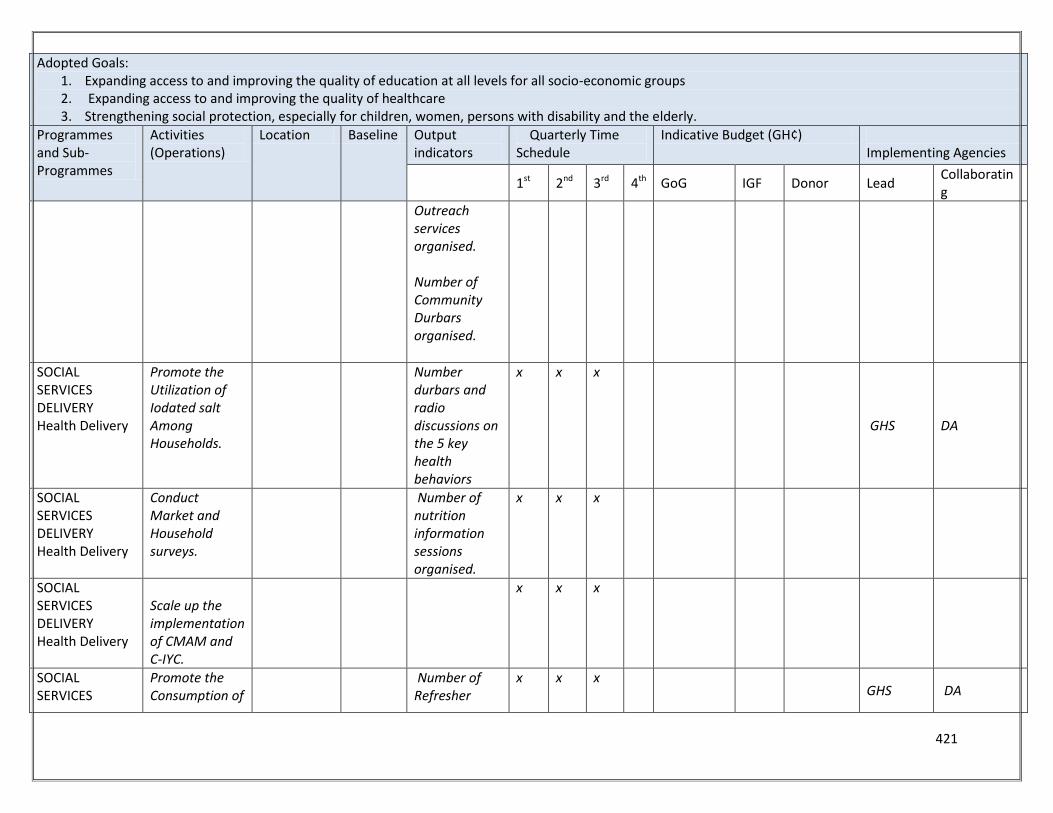
421
Adopted Goals: 1. Expanding access to and improving the quality of education at all levels for all socio-economic groups 2. Expanding access to and improving the quality of healthcare 3. Strengthening social protection, especially for children, women, persons with disability and the elderly.
Programmes and Sub-Programmes
Activities (Operations)
Location Baseline Output indicators
Quarterly Time Schedule
Indicative Budget (GH¢) Implementing Agencies
1st 2nd 3rd 4th GoG IGF Donor Lead Collaborating
Outreach services organised. Number of Community Durbars organised.
SOCIAL SERVICES DELIVERY Health Delivery
Promote the Utilization of Iodated salt Among Households.
Number durbars and radio discussions on the 5 key health behaviors
x x x
GHS DA
SOCIAL SERVICES DELIVERY Health Delivery
Conduct Market and Household surveys.
Number of nutrition information sessions organised.
x x x
SOCIAL SERVICES DELIVERY Health Delivery
Scale up the implementation of CMAM and C-IYC.
x x x
SOCIAL SERVICES
Promote the Consumption of
Number of Refresher
x x x GHS DA
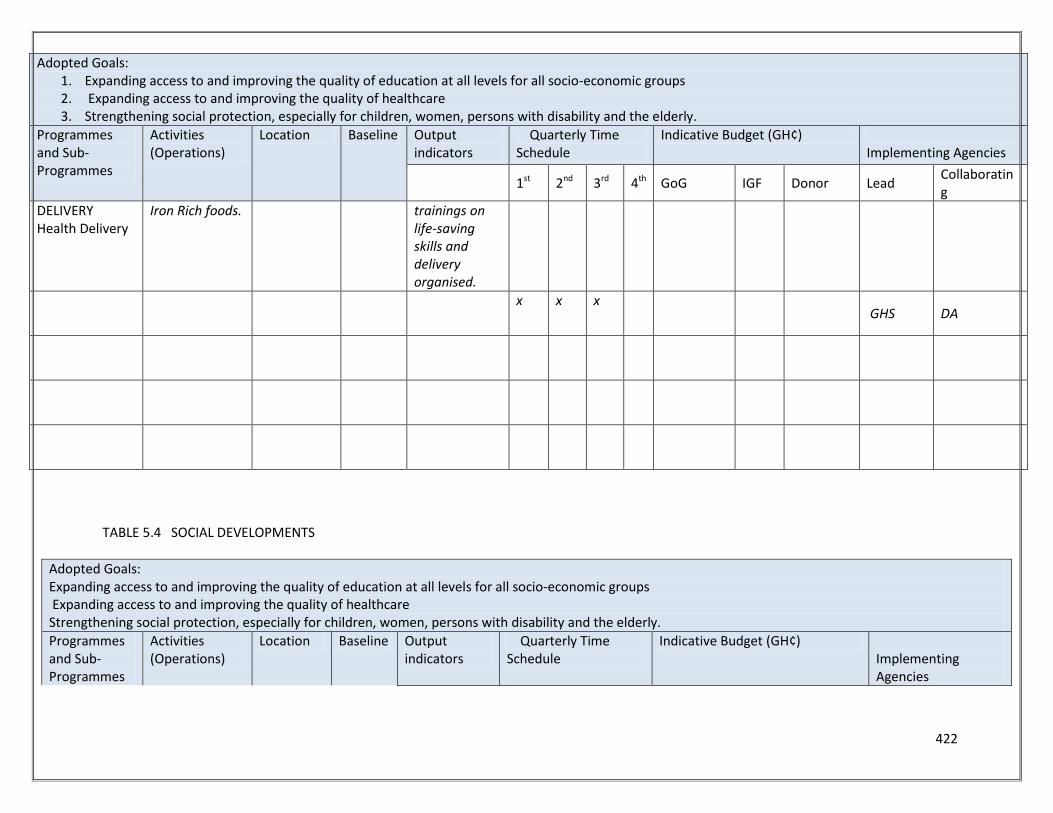
422
Adopted Goals: 1. Expanding access to and improving the quality of education at all levels for all socio-economic groups 2. Expanding access to and improving the quality of healthcare 3. Strengthening social protection, especially for children, women, persons with disability and the elderly.
Programmes and Sub-Programmes
Activities (Operations)
Location Baseline Output indicators
Quarterly Time Schedule
Indicative Budget (GH¢) Implementing Agencies
1st 2nd 3rd 4th GoG IGF Donor Lead Collaborating
DELIVERY Health Delivery
Iron Rich foods. trainings on life-saving skills and delivery organised.
x x x GHS DA
TABLE 5.4 SOCIAL DEVELOPMENTS
Adopted Goals: Expanding access to and improving the quality of education at all levels for all socio-economic groups Expanding access to and improving the quality of healthcare Strengthening social protection, especially for children, women, persons with disability and the elderly.
Programmes and Sub-Programmes
Activities (Operations)
Location Baseline Output indicators
Quarterly Time Schedule
Indicative Budget (GH¢) Implementing Agencies
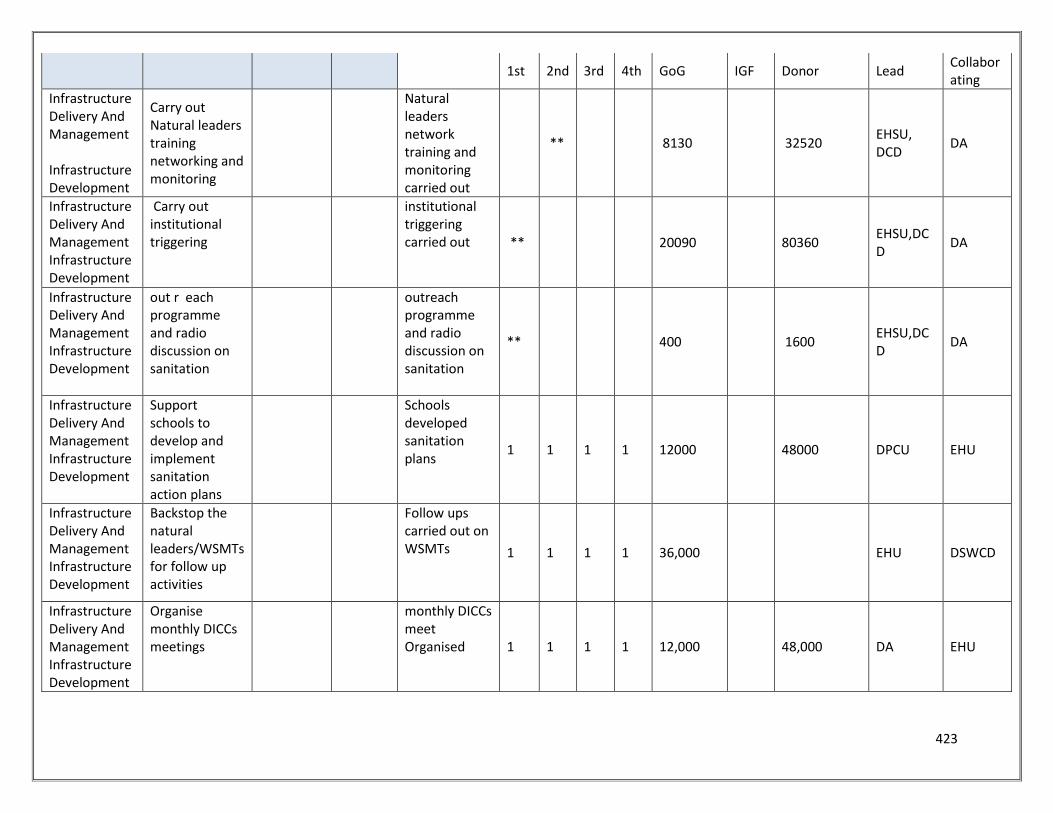
423
1st 2nd 3rd 4th GoG IGF Donor Lead Collaborating
Infrastructure Delivery And Management Infrastructure Development
Carry out Natural leaders training networking and monitoring
Natural leaders network training and monitoring carried out
** 8130 32520 EHSU, DCD
DA
Infrastructure Delivery And Management Infrastructure Development
Carry out institutional triggering
institutional triggering carried out ** 20090 80360
EHSU,DCD
DA
Infrastructure Delivery And Management Infrastructure Development
out r each programme and radio discussion on sanitation
outreach programme and radio discussion on sanitation
** 400 1600 EHSU,DCD
DA
Infrastructure Delivery And Management Infrastructure Development
Support schools to develop and implement sanitation action plans
Schools developed sanitation plans
1 1 1 1 12000 48000 DPCU EHU
Infrastructure Delivery And Management Infrastructure Development
Backstop the natural leaders/WSMTs for follow up activities
Follow ups carried out on WSMTs 1 1 1 1 36,000 EHU DSWCD
Infrastructure Delivery And Management Infrastructure Development
Organise monthly DICCs meetings
monthly DICCs meet Organised 1 1 1 1 12,000 48,000 DA EHU
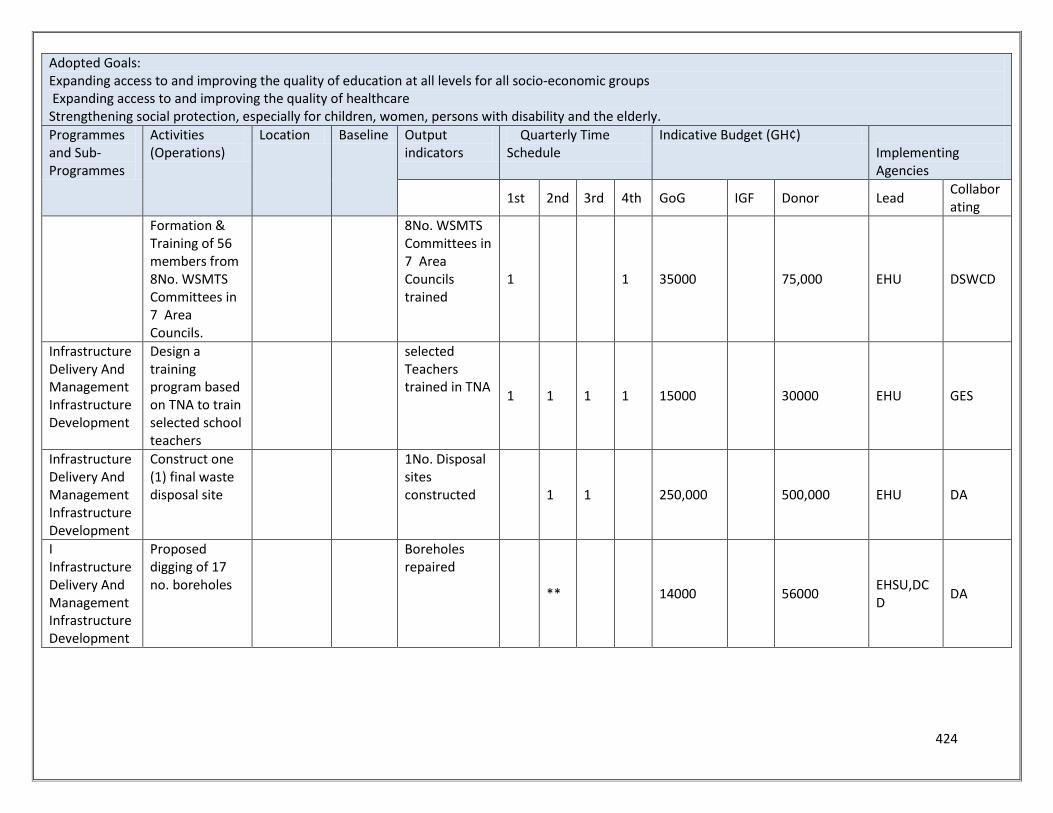
424
Adopted Goals: Expanding access to and improving the quality of education at all levels for all socio-economic groups Expanding access to and improving the quality of healthcare Strengthening social protection, especially for children, women, persons with disability and the elderly.
Programmes and Sub-Programmes
Activities (Operations)
Location Baseline Output indicators
Quarterly Time Schedule
Indicative Budget (GH¢) Implementing Agencies
1st 2nd 3rd 4th GoG IGF Donor Lead Collaborating
Formation & Training of 56 members from 8No. WSMTS Committees in 7 Area Councils.
8No. WSMTS Committees in 7 Area Councils trained
1 1 35000 75,000 EHU DSWCD
Infrastructure Delivery And Management Infrastructure Development
Design a training program based on TNA to train selected school teachers
selected Teachers trained in TNA
1 1 1 1 15000 30000 EHU GES
Infrastructure Delivery And Management Infrastructure Development
Construct one (1) final waste disposal site
1No. Disposal sites constructed 1 1 250,000 500,000 EHU DA
I Infrastructure Delivery And Management Infrastructure Development
Proposed digging of 17 no. boreholes
Boreholes repaired
** 14000 56000 EHSU,DCD
DA
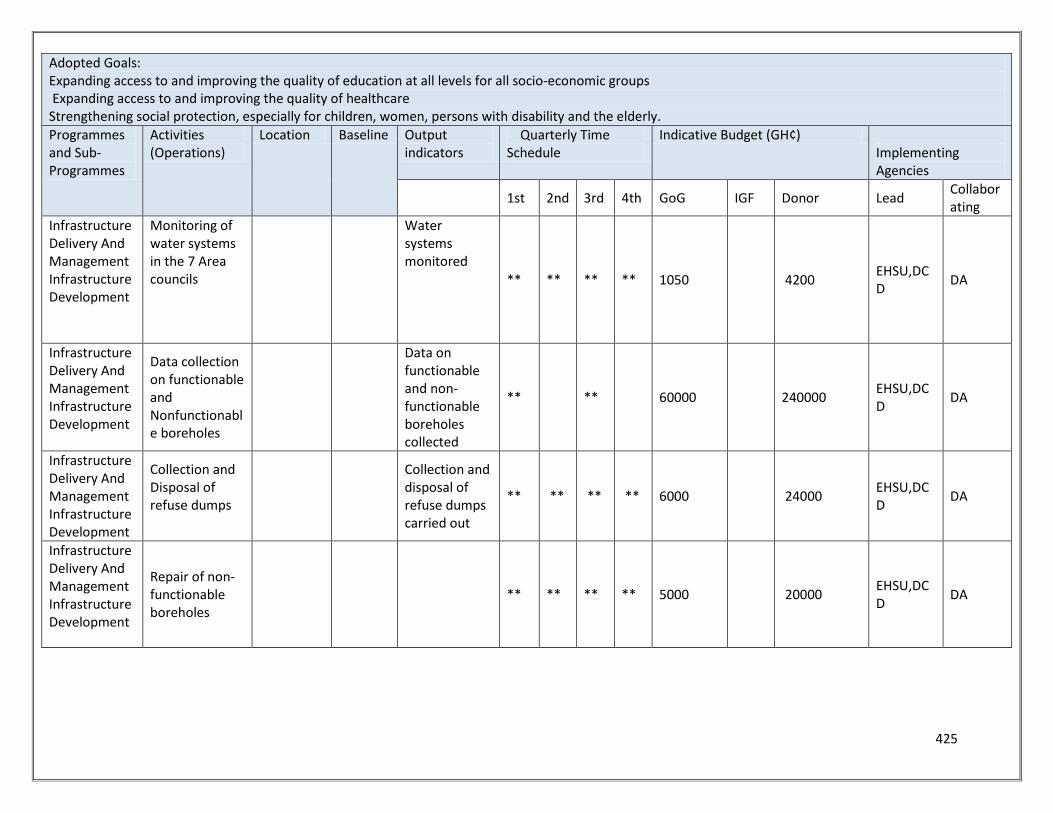
425
Adopted Goals: Expanding access to and improving the quality of education at all levels for all socio-economic groups Expanding access to and improving the quality of healthcare Strengthening social protection, especially for children, women, persons with disability and the elderly.
Programmes and Sub-Programmes
Activities (Operations)
Location Baseline Output indicators
Quarterly Time Schedule
Indicative Budget (GH¢) Implementing Agencies
1st 2nd 3rd 4th GoG IGF Donor Lead Collaborating
Infrastructure Delivery And Management Infrastructure Development
Monitoring of water systems in the 7 Area councils
Water systems monitored
** ** ** ** 1050 4200 EHSU,DCD
DA
Infrastructure Delivery And Management Infrastructure Development
Data collection on functionable and Nonfunctionable boreholes
Data on functionable and non-functionable boreholes collected
** ** 60000 240000 EHSU,DCD
DA
Infrastructure Delivery And Management Infrastructure Development
Collection and Disposal of refuse dumps
Collection and disposal of refuse dumps carried out
** ** ** ** 6000 24000 EHSU,DCD
DA
Infrastructure Delivery And Management Infrastructure Development
Repair of non-functionable boreholes
** ** ** ** 5000 20000 EHSU,DCD
DA
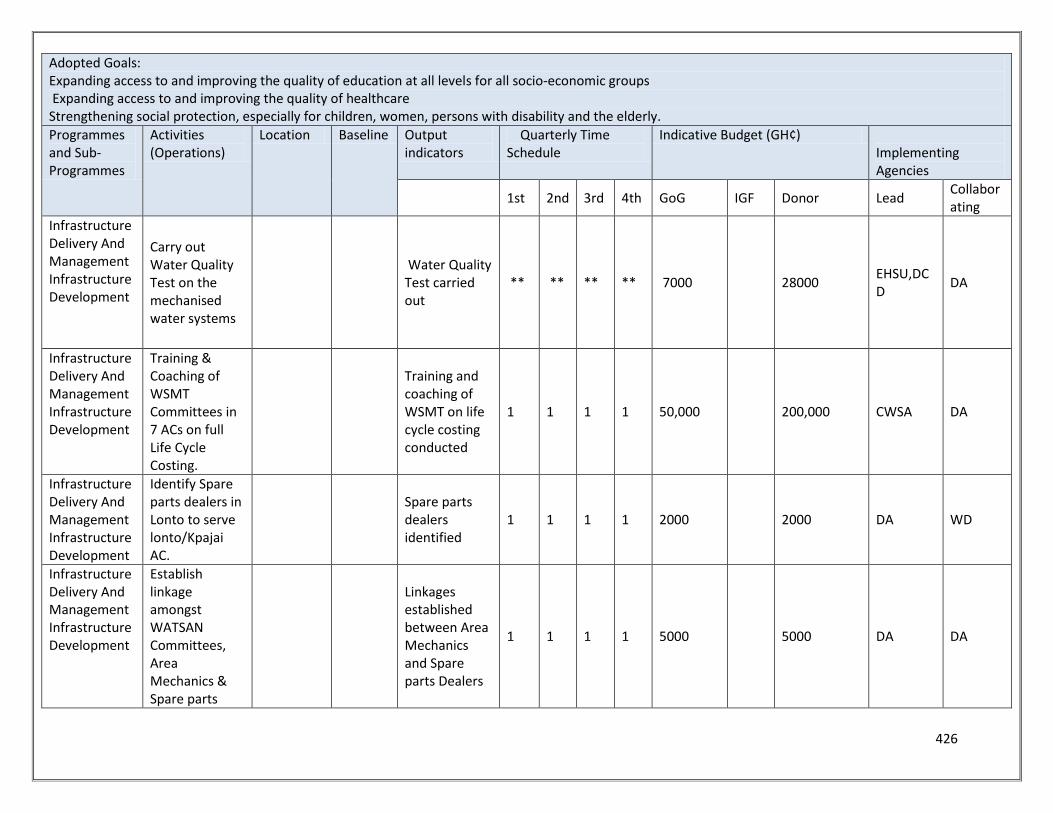
426
Adopted Goals: Expanding access to and improving the quality of education at all levels for all socio-economic groups Expanding access to and improving the quality of healthcare Strengthening social protection, especially for children, women, persons with disability and the elderly.
Programmes and Sub-Programmes
Activities (Operations)
Location Baseline Output indicators
Quarterly Time Schedule
Indicative Budget (GH¢) Implementing Agencies
1st 2nd 3rd 4th GoG IGF Donor Lead Collaborating
Infrastructure Delivery And Management Infrastructure Development
Carry out Water Quality Test on the mechanised water systems
Water Quality Test carried out
** ** ** ** 7000 28000 EHSU,DCD
DA
Infrastructure Delivery And Management Infrastructure Development
Training & Coaching of WSMT Committees in 7 ACs on full Life Cycle Costing.
Training and coaching of WSMT on life cycle costing conducted
1 1 1 1 50,000 200,000 CWSA DA
Infrastructure Delivery And Management Infrastructure Development
Identify Spare parts dealers in Lonto to serve lonto/Kpajai AC.
Spare parts dealers identified
1 1 1 1 2000 2000 DA WD
Infrastructure Delivery And Management Infrastructure Development
Establish linkage amongst WATSAN Committees, Area Mechanics & Spare parts
Linkages established between Area Mechanics and Spare parts Dealers
1 1 1 1 5000 5000 DA DA
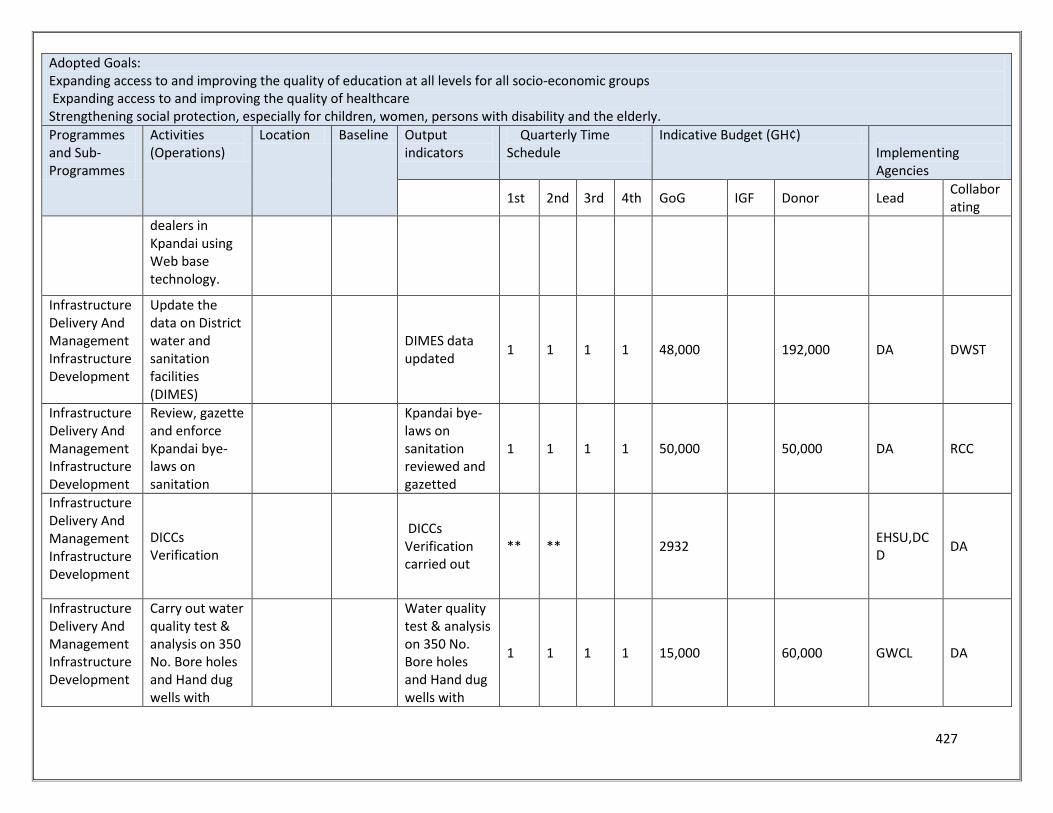
427
Adopted Goals: Expanding access to and improving the quality of education at all levels for all socio-economic groups Expanding access to and improving the quality of healthcare Strengthening social protection, especially for children, women, persons with disability and the elderly.
Programmes and Sub-Programmes
Activities (Operations)
Location Baseline Output indicators
Quarterly Time Schedule
Indicative Budget (GH¢) Implementing Agencies
1st 2nd 3rd 4th GoG IGF Donor Lead Collaborating
dealers in Kpandai using Web base technology.
Infrastructure Delivery And Management Infrastructure Development
Update the data on District water and sanitation facilities (DIMES)
DIMES data updated
1 1 1 1 48,000 192,000 DA DWST
Infrastructure Delivery And Management Infrastructure Development
Review, gazette and enforce Kpandai bye-laws on sanitation
Kpandai bye-laws on sanitation reviewed and gazetted
1 1 1 1 50,000 50,000 DA RCC
Infrastructure Delivery And Management Infrastructure Development
DICCs Verification
DICCs Verification carried out
** **
2932 EHSU,DCD
DA
Infrastructure Delivery And Management Infrastructure Development
Carry out water quality test & analysis on 350 No. Bore holes and Hand dug wells with
Water quality test & analysis on 350 No. Bore holes and Hand dug wells with
1 1 1 1 15,000 60,000 GWCL DA
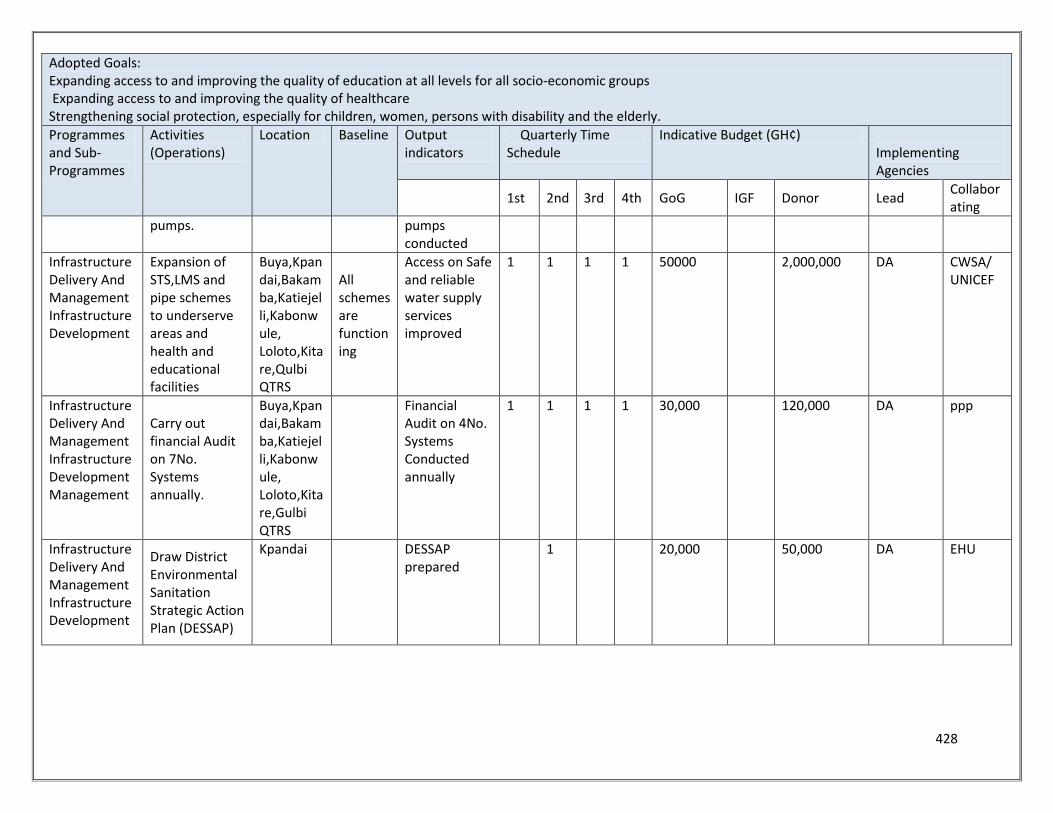
428
Adopted Goals: Expanding access to and improving the quality of education at all levels for all socio-economic groups Expanding access to and improving the quality of healthcare Strengthening social protection, especially for children, women, persons with disability and the elderly.
Programmes and Sub-Programmes
Activities (Operations)
Location Baseline Output indicators
Quarterly Time Schedule
Indicative Budget (GH¢) Implementing Agencies
1st 2nd 3rd 4th GoG IGF Donor Lead Collaborating
pumps. pumps conducted
Infrastructure Delivery And Management Infrastructure Development
Expansion of STS,LMS and pipe schemes to underserve areas and health and educational facilities
Buya,Kpandai,Bakamba,Katiejelli,Kabonwule, Loloto,Kitare,Qulbi QTRS
All schemes are functioning
Access on Safe and reliable water supply services improved
1 1 1 1 50000 2,000,000 DA CWSA/ UNICEF
Infrastructure Delivery And Management Infrastructure Development Management
Carry out financial Audit on 7No. Systems annually.
Buya,Kpandai,Bakamba,Katiejelli,Kabonwule, Loloto,Kitare,Gulbi QTRS
Financial Audit on 4No. Systems Conducted annually
1 1 1 1 30,000 120,000 DA ppp
Infrastructure Delivery And Management Infrastructure Development
Draw District Environmental Sanitation Strategic Action Plan (DESSAP)
Kpandai DESSAP prepared
1 20,000 50,000 DA EHU
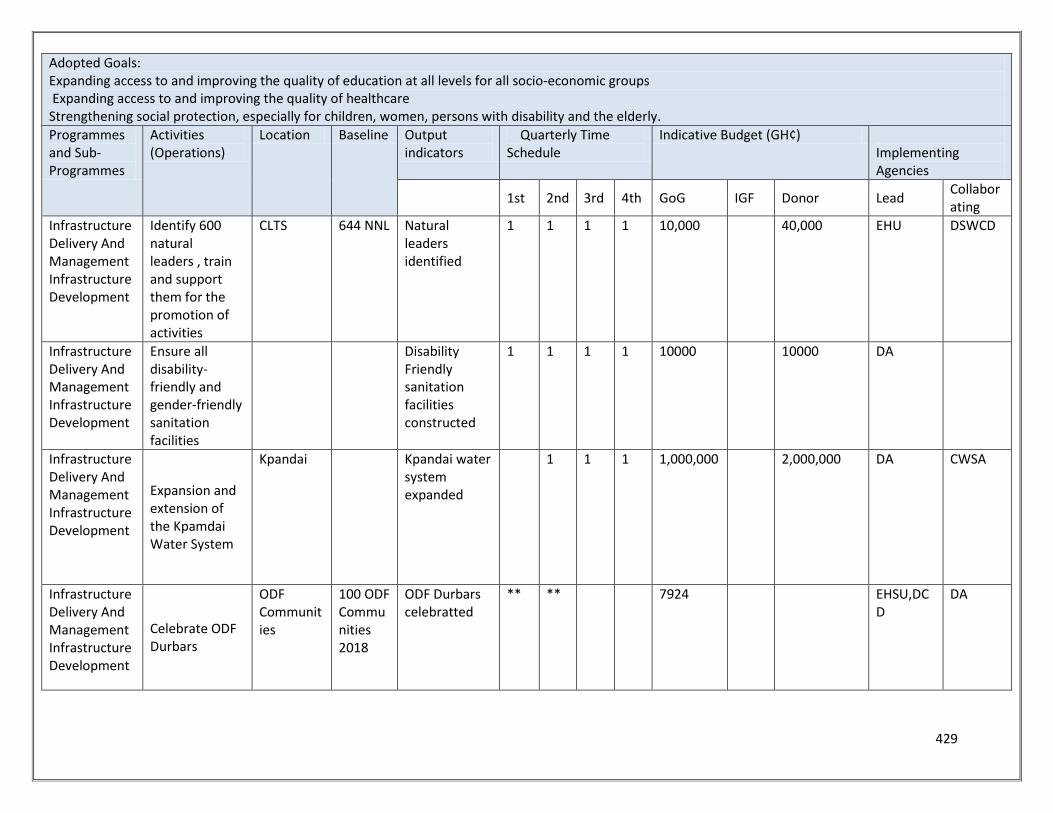
429
Adopted Goals: Expanding access to and improving the quality of education at all levels for all socio-economic groups Expanding access to and improving the quality of healthcare Strengthening social protection, especially for children, women, persons with disability and the elderly.
Programmes and Sub-Programmes
Activities (Operations)
Location Baseline Output indicators
Quarterly Time Schedule
Indicative Budget (GH¢) Implementing Agencies
1st 2nd 3rd 4th GoG IGF Donor Lead Collaborating
Infrastructure Delivery And Management Infrastructure Development
Identify 600 natural leaders , train and support them for the promotion of activities
CLTS 644 NNL Natural leaders identified
1 1 1 1 10,000 40,000 EHU DSWCD
Infrastructure Delivery And Management Infrastructure Development
Ensure all disability-friendly and gender-friendly sanitation facilities
Disability Friendly sanitation facilities constructed
1 1 1 1 10000 10000 DA
Infrastructure Delivery And Management Infrastructure Development
Expansion and extension of the Kpamdai Water System
Kpandai Kpandai water system expanded
1 1 1 1,000,000 2,000,000 DA CWSA
Infrastructure Delivery And Management Infrastructure Development
Celebrate ODF Durbars
ODF Communities
100 ODF Communities 2018
ODF Durbars celebratted
** ** 7924 EHSU,DCD
DA
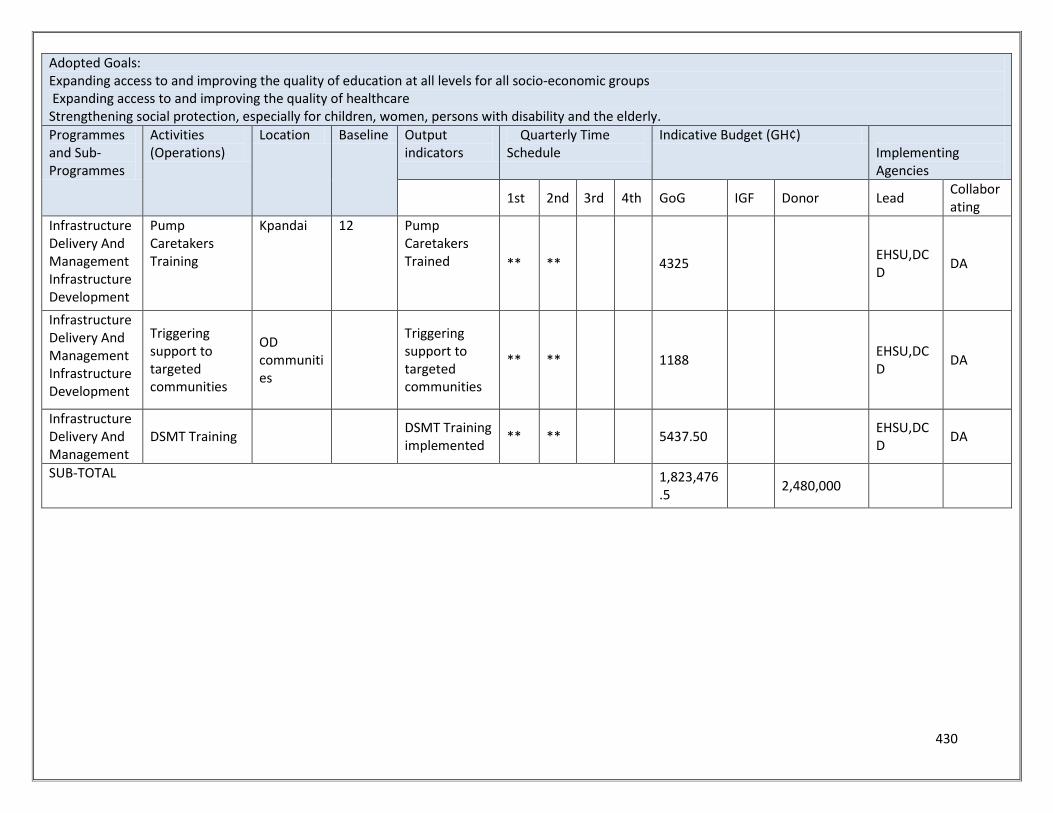
430
Adopted Goals: Expanding access to and improving the quality of education at all levels for all socio-economic groups Expanding access to and improving the quality of healthcare Strengthening social protection, especially for children, women, persons with disability and the elderly.
Programmes and Sub-Programmes
Activities (Operations)
Location Baseline Output indicators
Quarterly Time Schedule
Indicative Budget (GH¢) Implementing Agencies
1st 2nd 3rd 4th GoG IGF Donor Lead Collaborating
Infrastructure Delivery And Management Infrastructure Development
Pump Caretakers Training
Kpandai 12 Pump Caretakers Trained ** **
4325
EHSU,DCD
DA
Infrastructure Delivery And Management Infrastructure Development
Triggering support to targeted communities
OD communities
Triggering support to targeted communities
** **
1188 EHSU,DCD
DA
Infrastructure Delivery And Management
DSMT Training
DSMT Training implemented
** **
5437.50 EHSU,DCD
DA
SUB-TOTAL 1,823,476.5
2,480,000
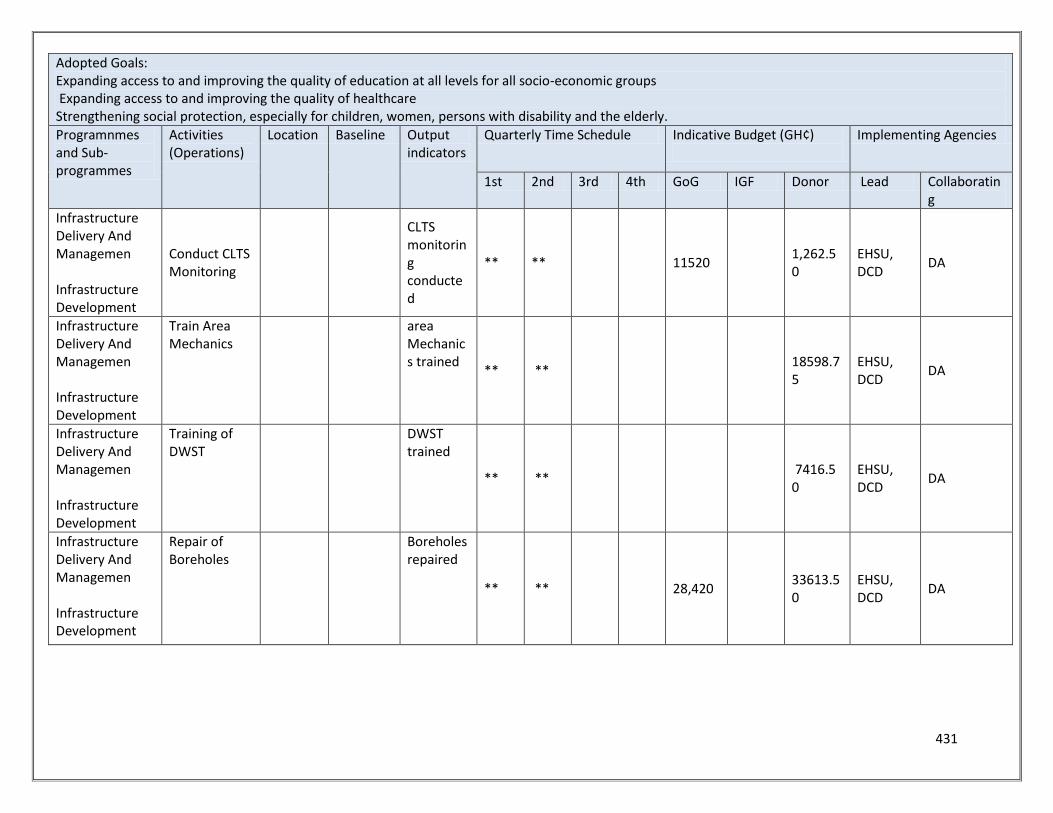
431
Adopted Goals: Expanding access to and improving the quality of education at all levels for all socio-economic groups Expanding access to and improving the quality of healthcare Strengthening social protection, especially for children, women, persons with disability and the elderly.
Programnmes and Sub-programmes
Activities (Operations)
Location Baseline Output indicators
Quarterly Time Schedule Indicative Budget (GH¢)
Implementing Agencies
1st 2nd 3rd 4th GoG IGF Donor Lead Collaborating
Infrastructure Delivery And Managemen Infrastructure Development
Conduct CLTS Monitoring
CLTS monitoring conducted
** ** 11520 1,262.50
EHSU, DCD
DA
Infrastructure Delivery And Managemen Infrastructure Development
Train Area Mechanics
area Mechanics trained
** ** 18598.75
EHSU, DCD
DA
Infrastructure Delivery And Managemen Infrastructure Development
Training of DWST
DWST trained
** ** 7416.50
EHSU, DCD
DA
Infrastructure Delivery And Managemen Infrastructure Development
Repair of Boreholes
Boreholes repaired
** ** 28,420 33613.50
EHSU, DCD
DA
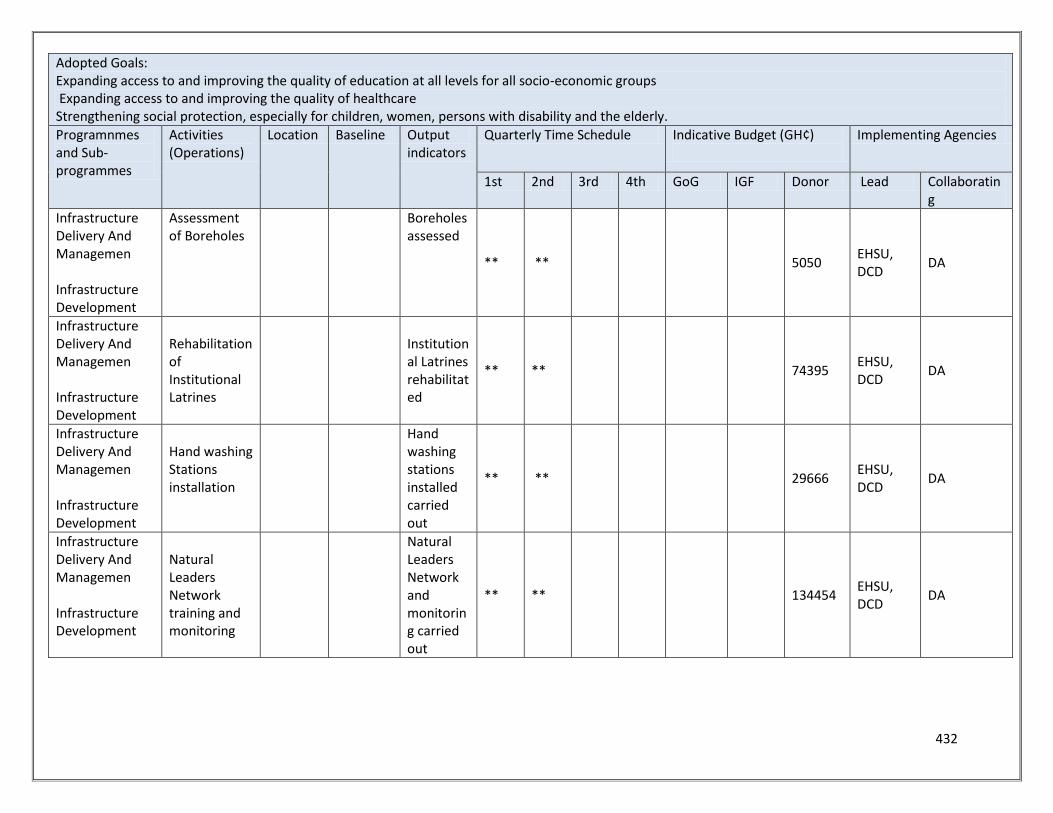
432
Adopted Goals: Expanding access to and improving the quality of education at all levels for all socio-economic groups Expanding access to and improving the quality of healthcare Strengthening social protection, especially for children, women, persons with disability and the elderly.
Programnmes and Sub-programmes
Activities (Operations)
Location Baseline Output indicators
Quarterly Time Schedule Indicative Budget (GH¢)
Implementing Agencies
1st 2nd 3rd 4th GoG IGF Donor Lead Collaborating
Infrastructure Delivery And Managemen Infrastructure Development
Assessment of Boreholes
Boreholes assessed
** **
5050 EHSU, DCD
DA
Infrastructure Delivery And Managemen Infrastructure Development
Rehabilitation of Institutional Latrines
Institutional Latrines rehabilitated
** **
74395 EHSU, DCD
DA
Infrastructure Delivery And Managemen Infrastructure Development
Hand washing Stations installation
Hand washing stations installed carried out
** **
29666 EHSU, DCD
DA
Infrastructure Delivery And Managemen Infrastructure Development
Natural Leaders Network training and monitoring
Natural Leaders Network and monitoring carried out
** **
134454 EHSU, DCD
DA
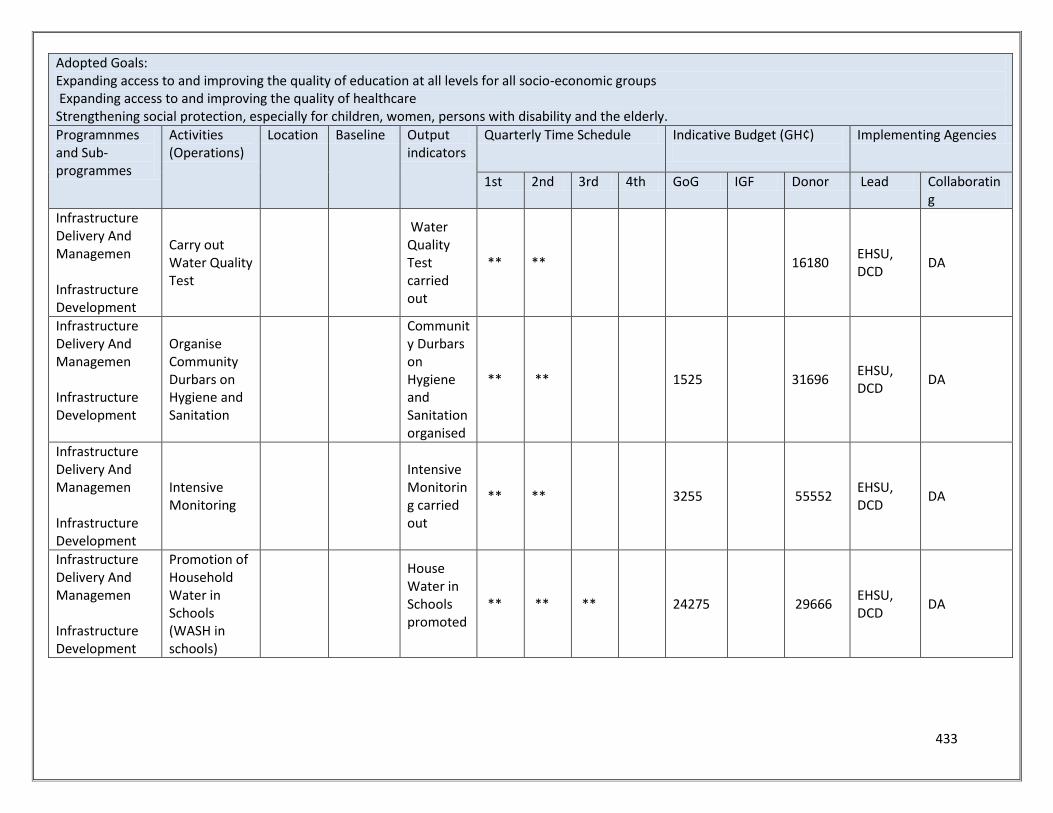
433
Adopted Goals: Expanding access to and improving the quality of education at all levels for all socio-economic groups Expanding access to and improving the quality of healthcare Strengthening social protection, especially for children, women, persons with disability and the elderly.
Programnmes and Sub-programmes
Activities (Operations)
Location Baseline Output indicators
Quarterly Time Schedule Indicative Budget (GH¢)
Implementing Agencies
1st 2nd 3rd 4th GoG IGF Donor Lead Collaborating
Infrastructure Delivery And Managemen Infrastructure Development
Carry out Water Quality Test
Water Quality Test carried out
** **
16180 EHSU, DCD
DA
Infrastructure Delivery And Managemen Infrastructure Development
Organise Community Durbars on Hygiene and Sanitation
Community Durbars on Hygiene and Sanitation organised
** ** 1525 31696 EHSU, DCD
DA
Infrastructure Delivery And Managemen Infrastructure Development
Intensive Monitoring
Intensive Monitoring carried out
** ** 3255 55552 EHSU, DCD
DA
Infrastructure Delivery And Managemen Infrastructure Development
Promotion of Household Water in Schools (WASH in schools)
House Water in Schools promoted
** ** ** 24275 29666 EHSU, DCD
DA
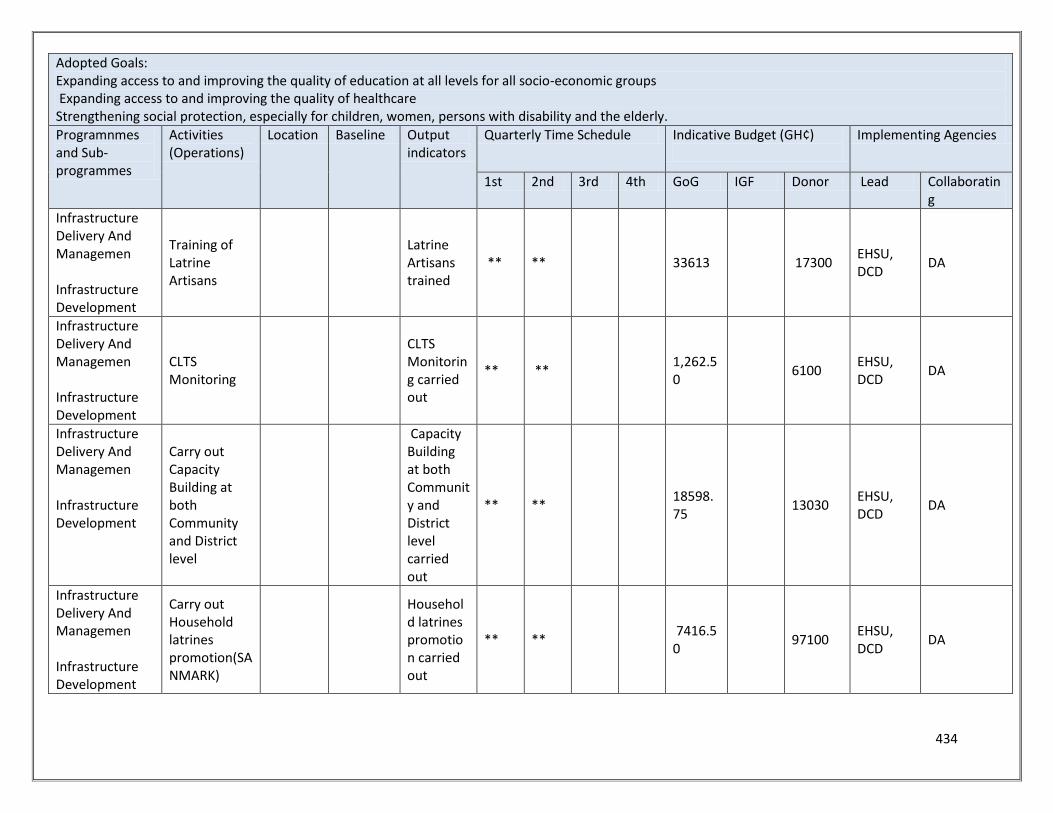
434
Adopted Goals: Expanding access to and improving the quality of education at all levels for all socio-economic groups Expanding access to and improving the quality of healthcare Strengthening social protection, especially for children, women, persons with disability and the elderly.
Programnmes and Sub-programmes
Activities (Operations)
Location Baseline Output indicators
Quarterly Time Schedule Indicative Budget (GH¢)
Implementing Agencies
1st 2nd 3rd 4th GoG IGF Donor Lead Collaborating
Infrastructure Delivery And Managemen Infrastructure Development
Training of Latrine Artisans
Latrine Artisans trained
** ** 33613 17300 EHSU, DCD
DA
Infrastructure Delivery And Managemen Infrastructure Development
CLTS Monitoring
CLTS Monitoring carried out
** ** 1,262.50
6100 EHSU, DCD
DA
Infrastructure Delivery And Managemen Infrastructure Development
Carry out Capacity Building at both Community and District level
Capacity Building at both Community and District level carried out
** ** 18598.75
13030 EHSU, DCD
DA
Infrastructure Delivery And Managemen Infrastructure Development
Carry out Household latrines promotion(SANMARK)
Household latrines promotion carried out
** ** 7416.50
97100 EHSU, DCD
DA
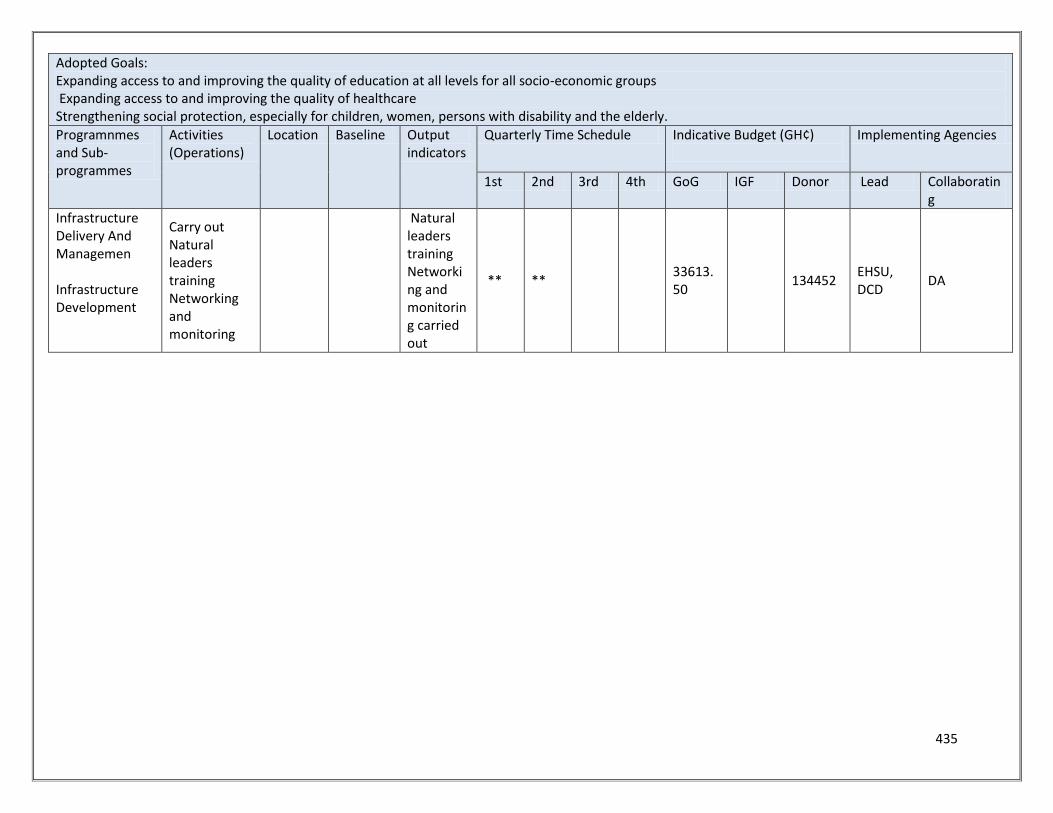
435
Adopted Goals: Expanding access to and improving the quality of education at all levels for all socio-economic groups Expanding access to and improving the quality of healthcare Strengthening social protection, especially for children, women, persons with disability and the elderly.
Programnmes and Sub-programmes
Activities (Operations)
Location Baseline Output indicators
Quarterly Time Schedule Indicative Budget (GH¢)
Implementing Agencies
1st 2nd 3rd 4th GoG IGF Donor Lead Collaborating
Infrastructure Delivery And Managemen Infrastructure Development
Carry out Natural leaders training Networking and monitoring
Natural leaders training Networking and monitoring carried out
** ** 33613.50
134452 EHSU, DCD
DA
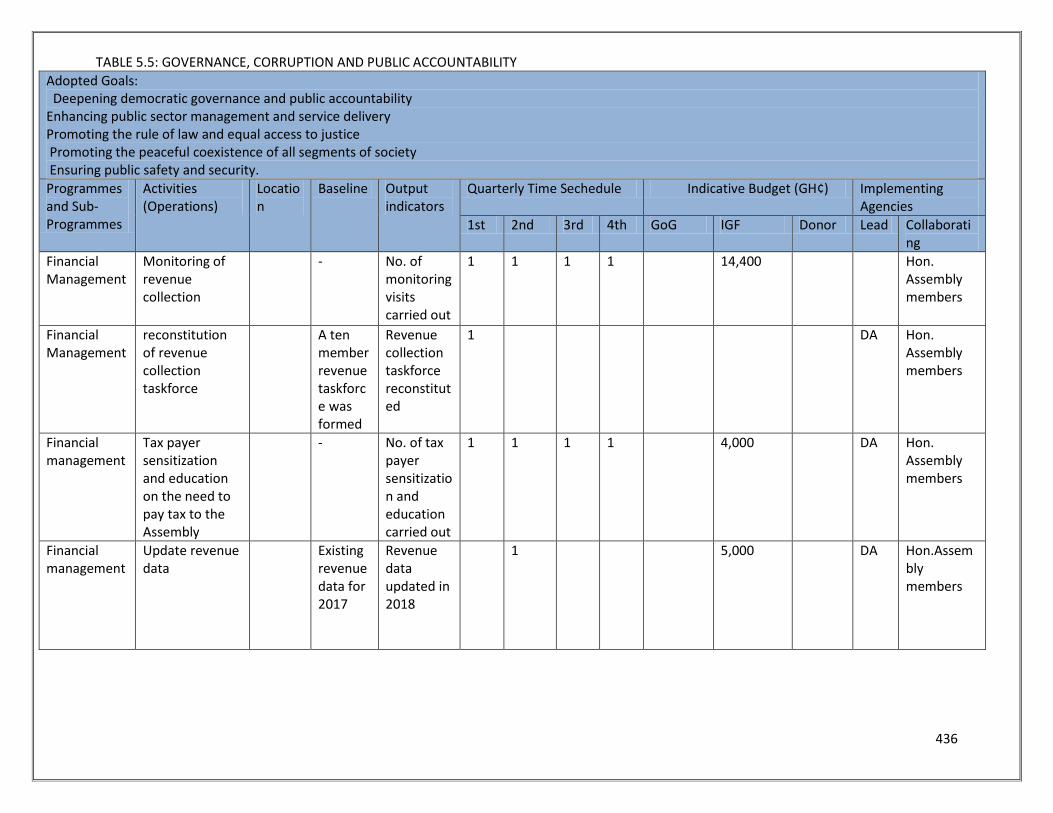
436
TABLE 5.5: GOVERNANCE, CORRUPTION AND PUBLIC ACCOUNTABILITY
Adopted Goals: Deepening democratic governance and public accountability Enhancing public sector management and service delivery Promoting the rule of law and equal access to justice Promoting the peaceful coexistence of all segments of society Ensuring public safety and security.
Programmes and Sub-Programmes
Activities (Operations)
Location
Baseline Output indicators
Quarterly Time Sechedule Indicative Budget (GH¢) Implementing Agencies
1st 2nd 3rd 4th GoG IGF Donor Lead Collaborating
Financial Management
Monitoring of revenue collection
- No. of monitoring visits carried out
1 1 1 1 14,400 Hon. Assembly members
Financial Management
reconstitution of revenue collection taskforce
A ten member revenue taskforce was formed
Revenue collection taskforce reconstituted
1 DA Hon. Assembly members
Financial management
Tax payer sensitization and education on the need to pay tax to the Assembly
- No. of tax payer sensitization and education carried out
1 1 1 1 4,000 DA Hon. Assembly members
Financial management
Update revenue data
Existing revenue data for 2017
Revenue data updated in 2018
1 5,000 DA Hon.Assembly members
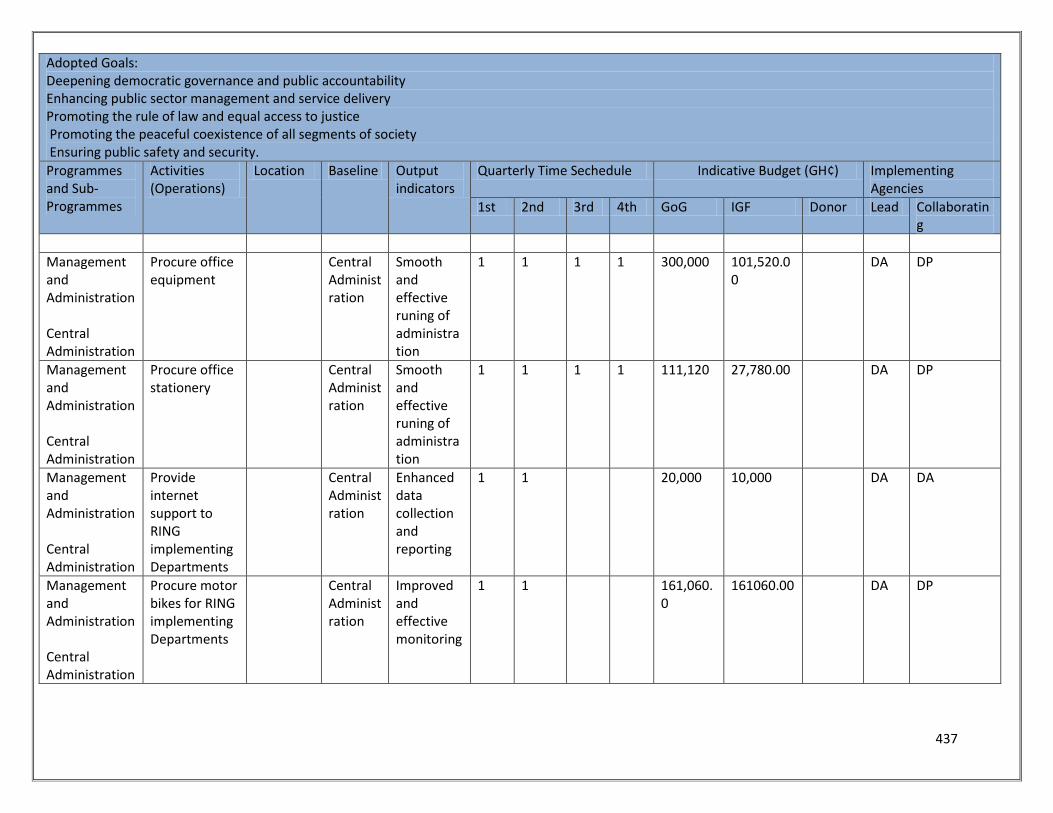
437
Adopted Goals: Deepening democratic governance and public accountability Enhancing public sector management and service delivery Promoting the rule of law and equal access to justice Promoting the peaceful coexistence of all segments of society Ensuring public safety and security.
Programmes and Sub-Programmes
Activities (Operations)
Location Baseline Output indicators
Quarterly Time Sechedule Indicative Budget (GH¢) Implementing Agencies
1st 2nd 3rd 4th GoG IGF Donor Lead Collaborating
Management and Administration Central Administration
Procure office equipment
Central Administration
Smooth and effective runing of administration
1 1 1 1 300,000 101,520.00
DA DP
Management and Administration Central Administration
Procure office stationery
Central Administration
Smooth and effective runing of administration
1 1 1 1 111,120 27,780.00 DA DP
Management and Administration Central Administration
Provide internet support to RING implementing Departments
Central Administration
Enhanced data collection and reporting
1 1 20,000 10,000 DA DA
Management and Administration Central Administration
Procure motor bikes for RING implementing Departments
Central Administration
Improved and effective monitoring
1 1 161,060.0
161060.00 DA DP
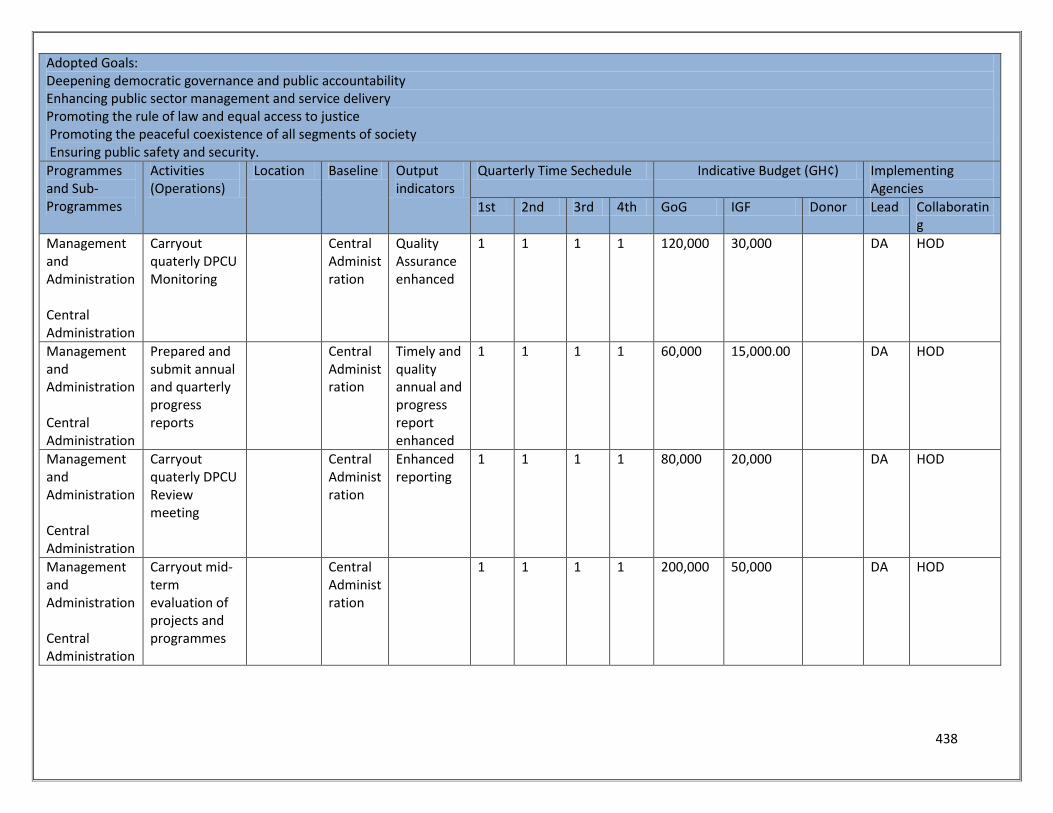
438
Adopted Goals: Deepening democratic governance and public accountability Enhancing public sector management and service delivery Promoting the rule of law and equal access to justice Promoting the peaceful coexistence of all segments of society Ensuring public safety and security.
Programmes and Sub-Programmes
Activities (Operations)
Location Baseline Output indicators
Quarterly Time Sechedule Indicative Budget (GH¢) Implementing Agencies
1st 2nd 3rd 4th GoG IGF Donor Lead Collaborating
Management and Administration Central Administration
Carryout quaterly DPCU Monitoring
Central Administration
Quality Assurance enhanced
1 1 1 1 120,000 30,000 DA HOD
Management and Administration Central Administration
Prepared and submit annual and quarterly progress reports
Central Administration
Timely and quality annual and progress report enhanced
1 1 1 1 60,000 15,000.00 DA HOD
Management and Administration Central Administration
Carryout quaterly DPCU Review meeting
Central Administration
Enhanced reporting
1 1 1 1 80,000 20,000 DA HOD
Management and Administration Central Administration
Carryout mid-term evaluation of projects and programmes
Central Administration
1 1 1 1 200,000 50,000 DA HOD
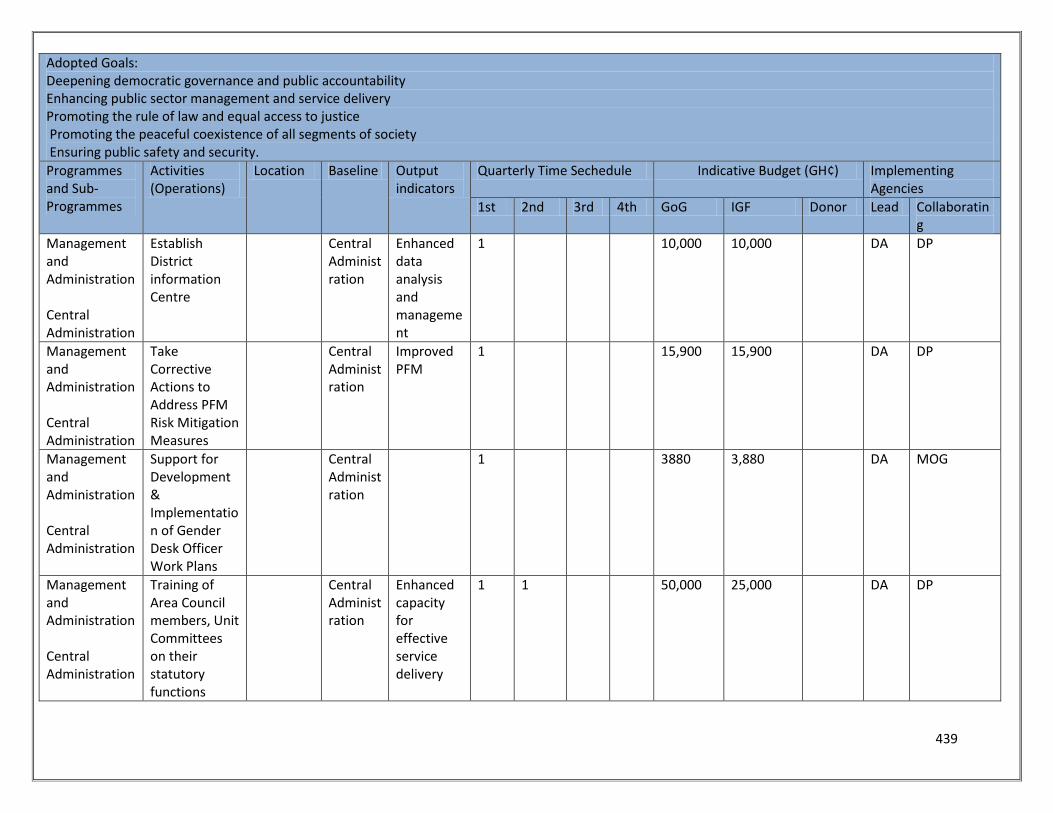
439
Adopted Goals: Deepening democratic governance and public accountability Enhancing public sector management and service delivery Promoting the rule of law and equal access to justice Promoting the peaceful coexistence of all segments of society Ensuring public safety and security.
Programmes and Sub-Programmes
Activities (Operations)
Location Baseline Output indicators
Quarterly Time Sechedule Indicative Budget (GH¢) Implementing Agencies
1st 2nd 3rd 4th GoG IGF Donor Lead Collaborating
Management and Administration Central Administration
Establish District information Centre
Central Administration
Enhanced data analysis and management
1 10,000 10,000 DA DP
Management and Administration Central Administration
Take Corrective Actions to Address PFM Risk Mitigation Measures
Central Administration
Improved PFM
1 15,900 15,900 DA DP
Management and Administration Central Administration
Support for Development & Implementation of Gender Desk Officer Work Plans
Central Administration
1 3880 3,880 DA MOG
Management and Administration Central Administration
Training of Area Council members, Unit Committees on their statutory functions
Central Administration
Enhanced capacity for effective service delivery
1 1 50,000 25,000 DA DP
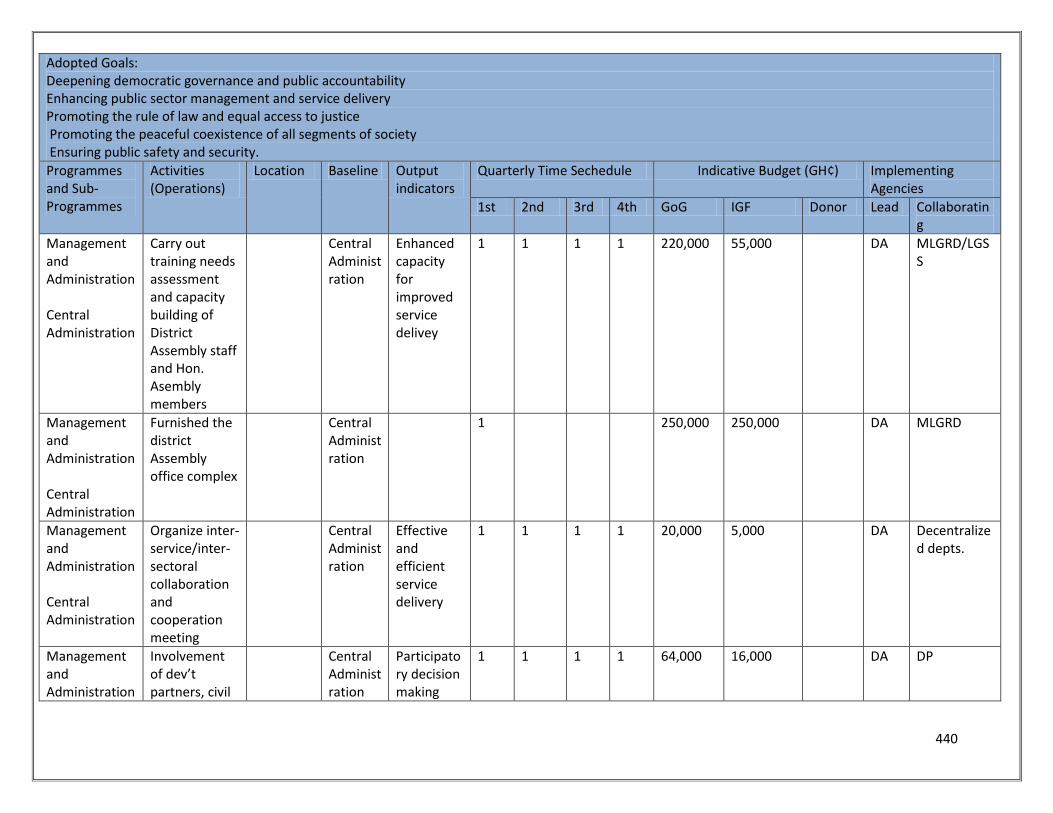
440
Adopted Goals: Deepening democratic governance and public accountability Enhancing public sector management and service delivery Promoting the rule of law and equal access to justice Promoting the peaceful coexistence of all segments of society Ensuring public safety and security.
Programmes and Sub-Programmes
Activities (Operations)
Location Baseline Output indicators
Quarterly Time Sechedule Indicative Budget (GH¢) Implementing Agencies
1st 2nd 3rd 4th GoG IGF Donor Lead Collaborating
Management and Administration Central Administration
Carry out training needs assessment and capacity building of District Assembly staff and Hon. Asembly members
Central Administration
Enhanced capacity for improved service delivey
1 1 1 1 220,000 55,000 DA MLGRD/LGSS
Management and Administration Central Administration
Furnished the district Assembly office complex
Central Administration
1 250,000 250,000 DA MLGRD
Management and Administration Central Administration
Organize inter-service/inter-sectoral collaboration and cooperation meeting
Central Administration
Effective and efficient service delivery
1 1 1 1 20,000 5,000 DA Decentralized depts.
Management and Administration
Involvement of dev’t partners, civil
Central Administration
Participatory decision making
1 1 1 1 64,000 16,000 DA DP
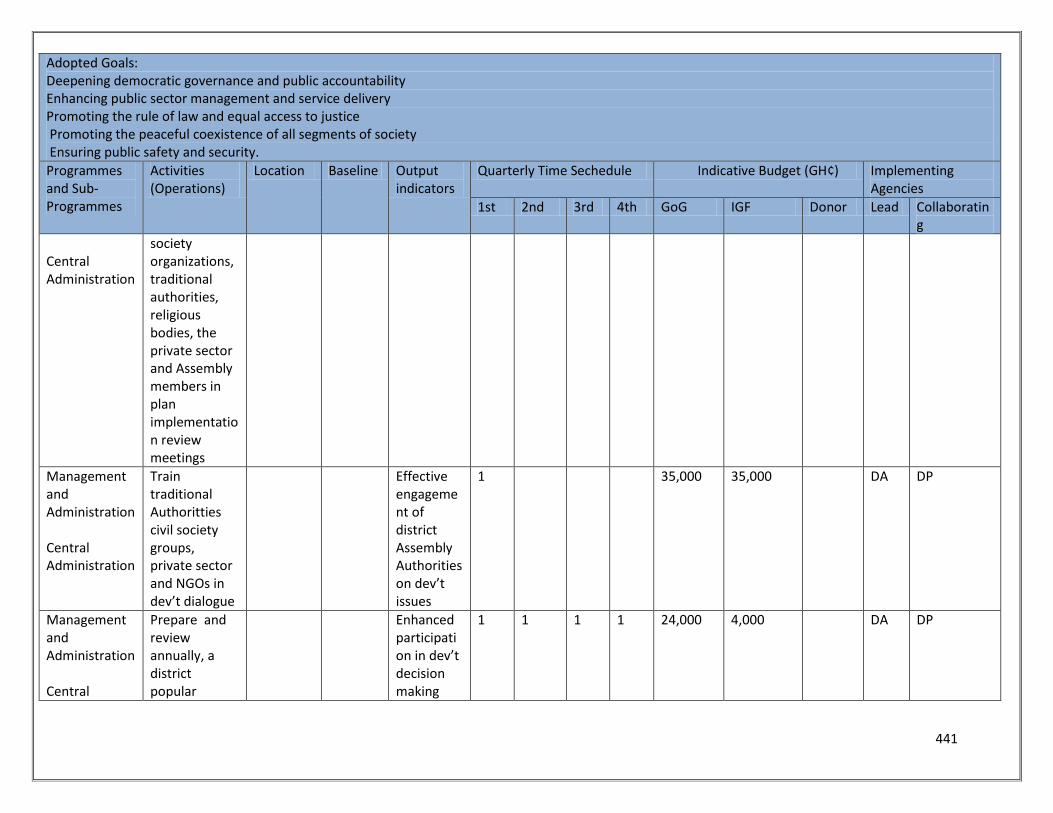
441
Adopted Goals: Deepening democratic governance and public accountability Enhancing public sector management and service delivery Promoting the rule of law and equal access to justice Promoting the peaceful coexistence of all segments of society Ensuring public safety and security.
Programmes and Sub-Programmes
Activities (Operations)
Location Baseline Output indicators
Quarterly Time Sechedule Indicative Budget (GH¢) Implementing Agencies
1st 2nd 3rd 4th GoG IGF Donor Lead Collaborating
Central Administration
society organizations, traditional authorities, religious bodies, the private sector and Assembly members in plan implementation review meetings
Management and Administration Central Administration
Train traditional Authoritties civil society groups, private sector and NGOs in dev’t dialogue
Effective engagement of district Assembly Authorities on dev’t issues
1 35,000 35,000 DA DP
Management and Administration Central
Prepare and review annually, a district popular
Enhanced participation in dev’t decision making
1 1 1 1 24,000 4,000 DA DP
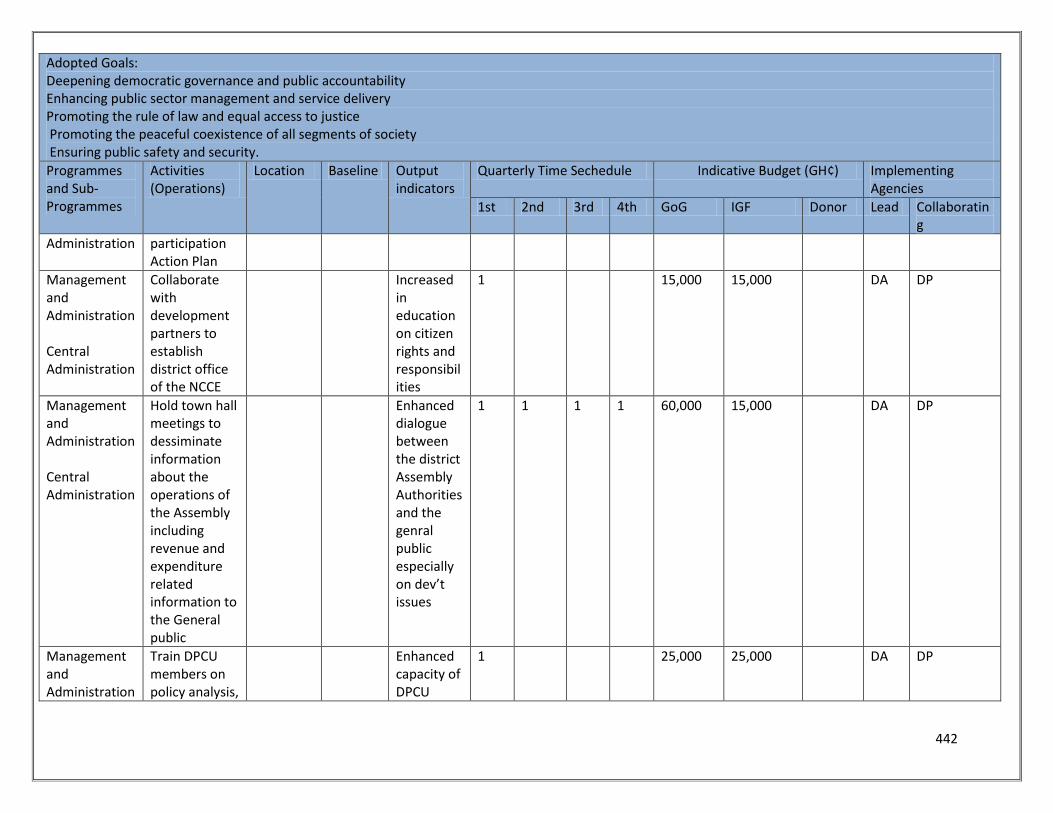
442
Adopted Goals: Deepening democratic governance and public accountability Enhancing public sector management and service delivery Promoting the rule of law and equal access to justice Promoting the peaceful coexistence of all segments of society Ensuring public safety and security.
Programmes and Sub-Programmes
Activities (Operations)
Location Baseline Output indicators
Quarterly Time Sechedule Indicative Budget (GH¢) Implementing Agencies
1st 2nd 3rd 4th GoG IGF Donor Lead Collaborating
Administration participation Action Plan
Management and Administration Central Administration
Collaborate with development partners to establish district office of the NCCE
Increased in education on citizen rights and responsibilities
1 15,000 15,000 DA DP
Management and Administration Central Administration
Hold town hall meetings to dessiminate information about the operations of the Assembly including revenue and expenditure related information to the General public
Enhanced dialogue between the district Assembly Authorities and the genral public especially on dev’t issues
1 1 1 1 60,000 15,000 DA DP
Management and Administration
Train DPCU members on policy analysis,
Enhanced capacity of DPCU
1 25,000 25,000 DA DP
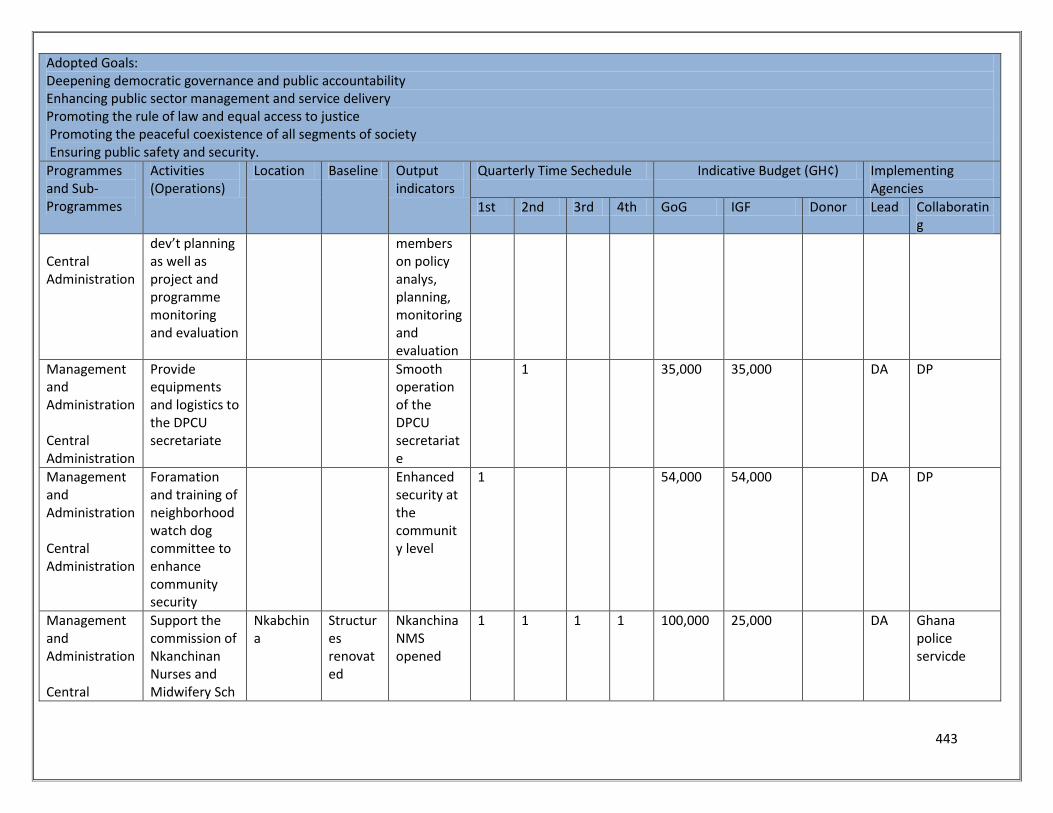
443
Adopted Goals: Deepening democratic governance and public accountability Enhancing public sector management and service delivery Promoting the rule of law and equal access to justice Promoting the peaceful coexistence of all segments of society Ensuring public safety and security.
Programmes and Sub-Programmes
Activities (Operations)
Location Baseline Output indicators
Quarterly Time Sechedule Indicative Budget (GH¢) Implementing Agencies
1st 2nd 3rd 4th GoG IGF Donor Lead Collaborating
Central Administration
dev’t planning as well as project and programme monitoring and evaluation
members on policy analys, planning, monitoring and evaluation
Management and Administration Central Administration
Provide equipments and logistics to the DPCU secretariate
Smooth operation of the DPCU secretariate
1 35,000 35,000 DA DP
Management and Administration Central Administration
Foramation and training of neighborhood watch dog committee to enhance community security
Enhanced security at the community level
1 54,000 54,000 DA DP
Management and Administration Central
Support the commission of Nkanchinan Nurses and Midwifery Sch
Nkabchina
Structures renovated
Nkanchina NMS opened
1 1 1 1 100,000 25,000 DA Ghana police servicde
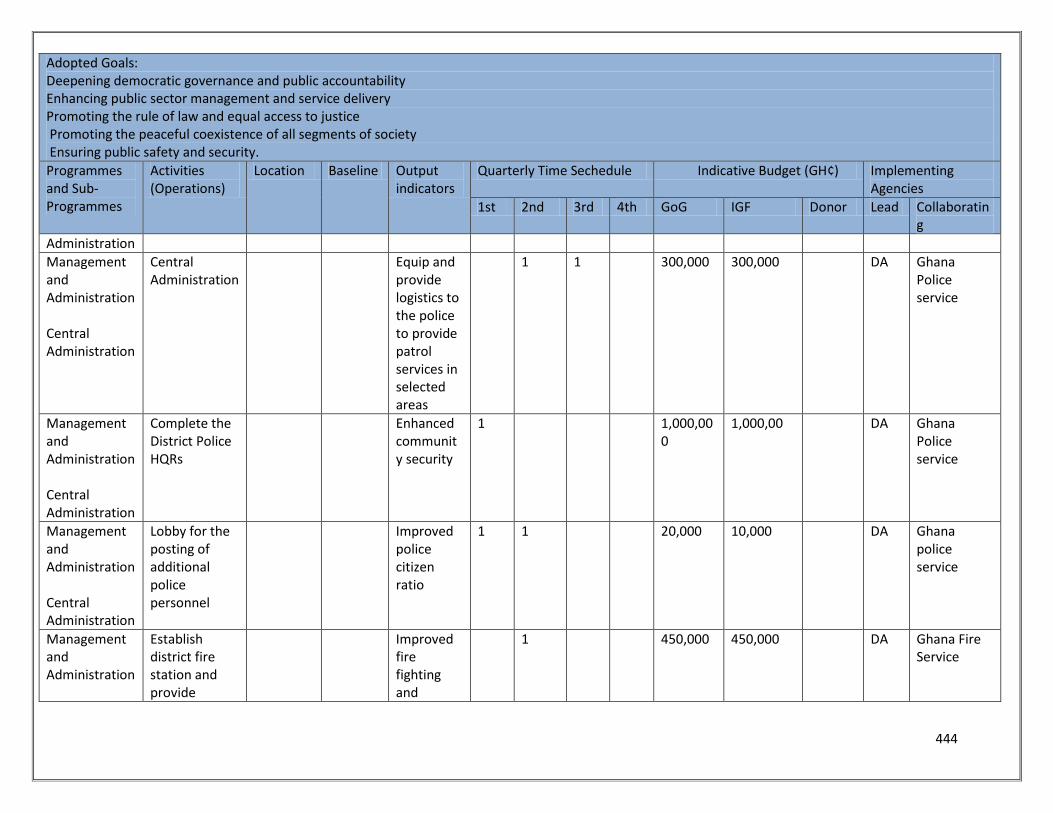
444
Adopted Goals: Deepening democratic governance and public accountability Enhancing public sector management and service delivery Promoting the rule of law and equal access to justice Promoting the peaceful coexistence of all segments of society Ensuring public safety and security.
Programmes and Sub-Programmes
Activities (Operations)
Location Baseline Output indicators
Quarterly Time Sechedule Indicative Budget (GH¢) Implementing Agencies
1st 2nd 3rd 4th GoG IGF Donor Lead Collaborating
Administration
Management and Administration Central Administration
Central Administration
Equip and provide logistics to the police to provide patrol services in selected areas
1 1 300,000 300,000 DA Ghana Police service
Management and Administration Central Administration
Complete the District Police HQRs
Enhanced community security
1 1,000,000
1,000,00 DA Ghana Police service
Management and Administration Central Administration
Lobby for the posting of additional police personnel
Improved police citizen ratio
1 1 20,000 10,000 DA Ghana police service
Management and Administration
Establish district fire station and provide
Improved fire fighting and
1 450,000 450,000 DA Ghana Fire Service
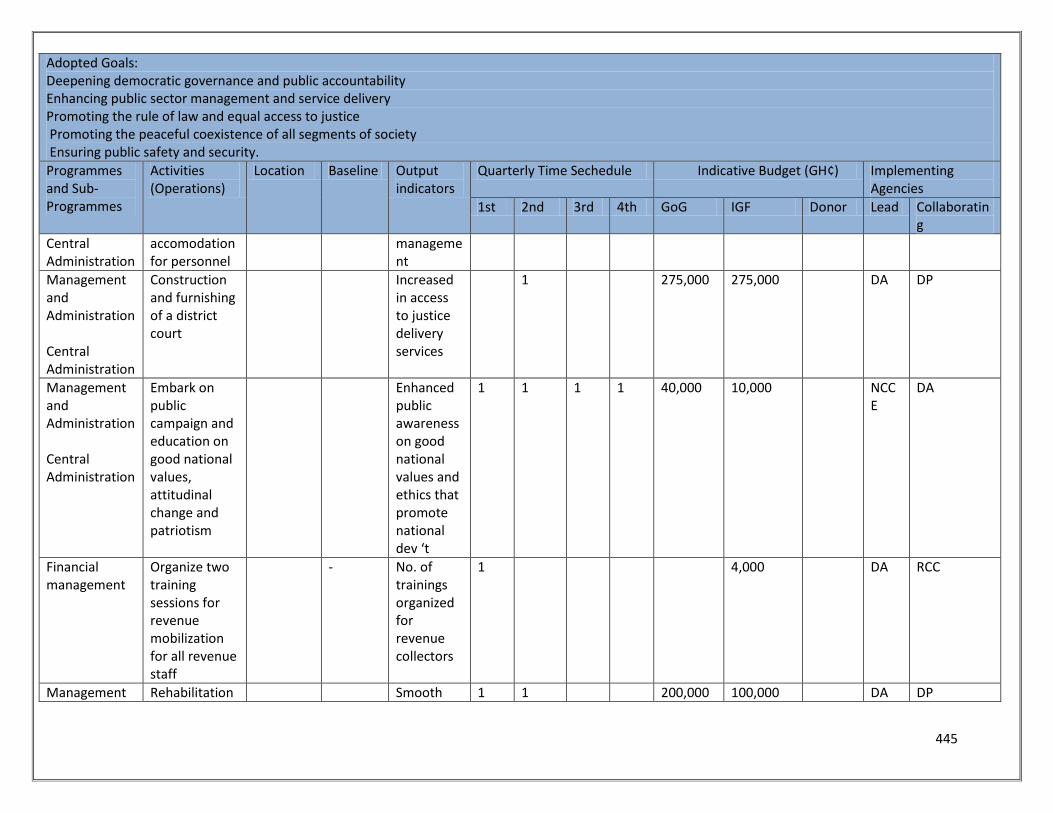
445
Adopted Goals: Deepening democratic governance and public accountability Enhancing public sector management and service delivery Promoting the rule of law and equal access to justice Promoting the peaceful coexistence of all segments of society Ensuring public safety and security.
Programmes and Sub-Programmes
Activities (Operations)
Location Baseline Output indicators
Quarterly Time Sechedule Indicative Budget (GH¢) Implementing Agencies
1st 2nd 3rd 4th GoG IGF Donor Lead Collaborating
Central Administration
accomodation for personnel
management
Management and Administration Central Administration
Construction and furnishing of a district court
Increased in access to justice delivery services
1 275,000 275,000 DA DP
Management and Administration Central Administration
Embark on public campaign and education on good national values, attitudinal change and patriotism
Enhanced public awareness on good national values and ethics that promote national dev ‘t
1 1 1 1 40,000 10,000 NCCE
DA
Financial management
Organize two training sessions for revenue mobilization for all revenue staff
- No. of trainings organized for revenue collectors
1 4,000 DA RCC
Management Rehabilitation Smooth 1 1 200,000 100,000 DA DP
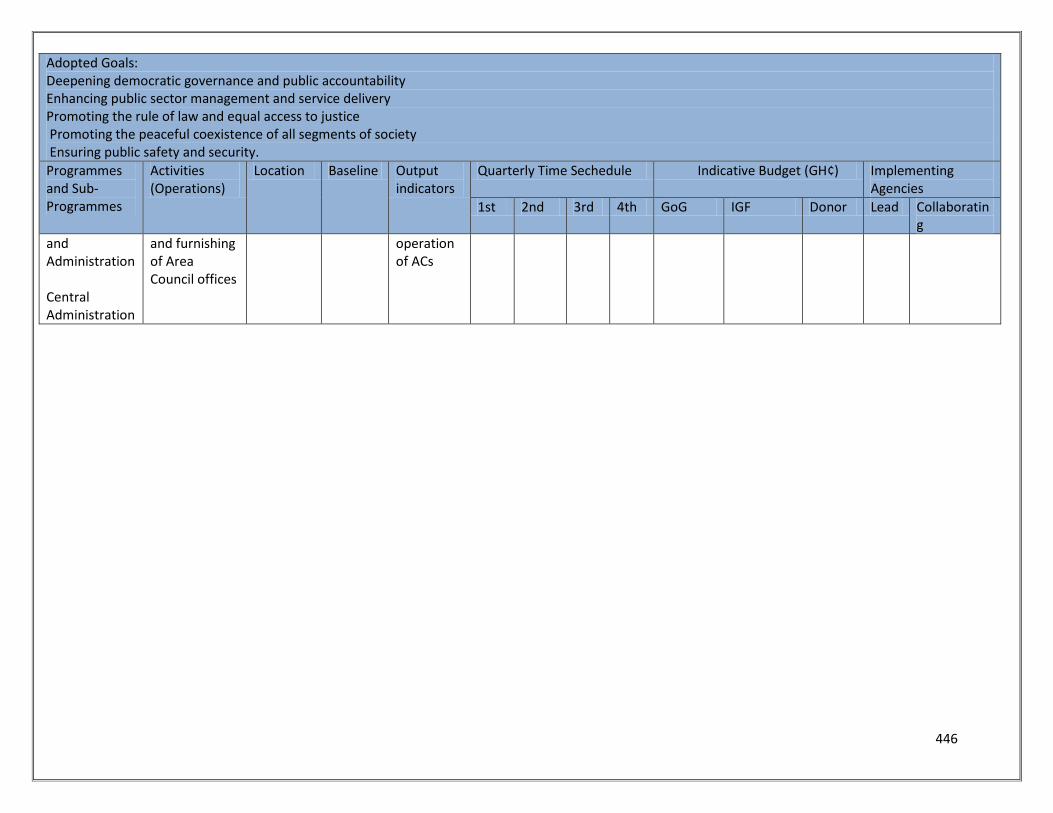
446
Adopted Goals: Deepening democratic governance and public accountability Enhancing public sector management and service delivery Promoting the rule of law and equal access to justice Promoting the peaceful coexistence of all segments of society Ensuring public safety and security.
Programmes and Sub-Programmes
Activities (Operations)
Location Baseline Output indicators
Quarterly Time Sechedule Indicative Budget (GH¢) Implementing Agencies
1st 2nd 3rd 4th GoG IGF Donor Lead Collaborating
and Administration Central Administration
and furnishing of Area Council offices
operation of ACs
447
CHAPTER SIX
6.0: Implementation, Monitoring and Evaluation This chapter outlines the stakeholder’s analysis of the Kpandai District Assembly Planning and
Coordinating Unit, the Monitoring and Evaluation conditions and capacities of the DPCU members in
addition to indicators and targets.
Again, this chapter indicates Monitoring and Evaluation Matrix, calendar, budget, data collection,
collation and analysis in the District. It also provides information on M&E report and findings,
dissemination, participatory monitoring and evaluation processes among others.
6.1.1 Stakeholders Analysis The initial task in the Monitoring and Evaluation plan was the identification of various stakeholders in
the Kpandai District Assembly. These are individuals, institutions and groups of people who have
interest in the implementation, monitoring and evaluation of the KPDA Plan.
This is relevant in the sense that, the identification and participation of these stakeholders will lead to
sustained capacity building, dissemination and demand for Monitoring and Evaluation results. In doing
this, all stakeholders were identified and analysed with critical look at their background information and
their various roles, responsibilities and needs.
The Table below outlines a list of key stakeholders who have interest in the implementation of the M&E
Plan at the District levels. It is expected that all the stakeholders identified, will contribute to the
successful implementation of this plan
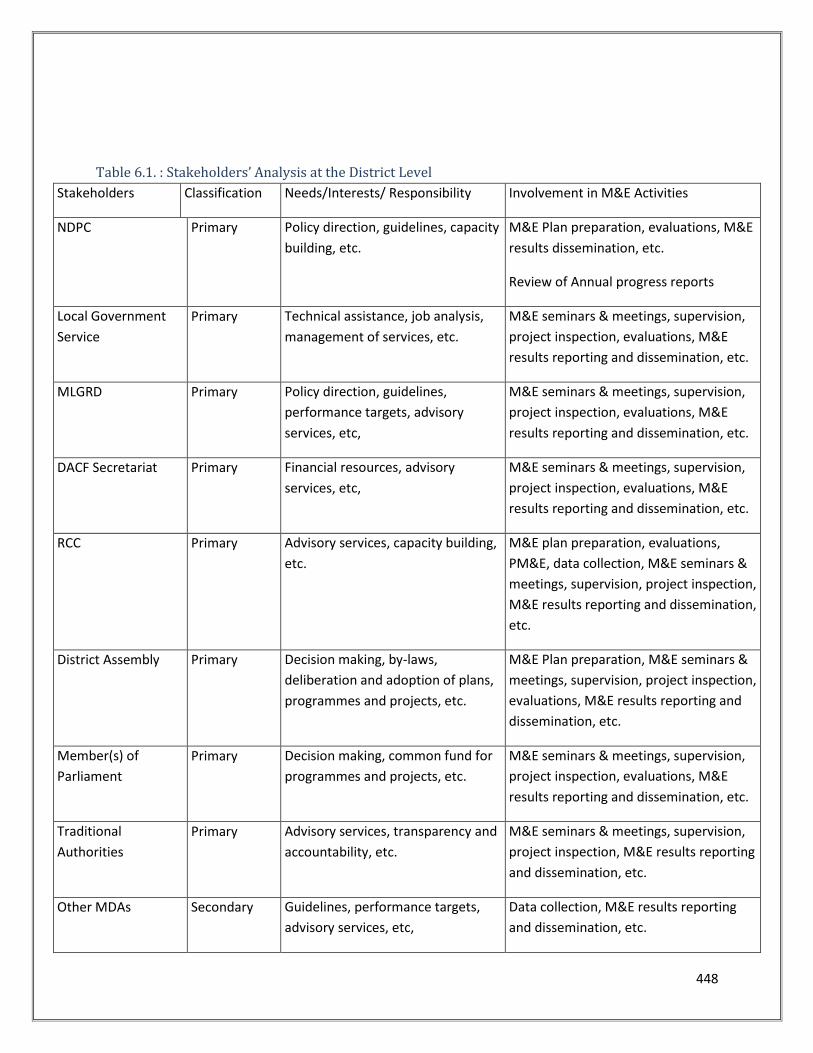
448
Table 6.1. : Stakeholders’ Analysis at the District Level
Stakeholders Classification Needs/Interests/ Responsibility Involvement in M&E Activities
NDPC Primary Policy direction, guidelines, capacity
building, etc.
M&E Plan preparation, evaluations, M&E
results dissemination, etc.
Review of Annual progress reports
Local Government
Service
Primary Technical assistance, job analysis,
management of services, etc.
M&E seminars & meetings, supervision,
project inspection, evaluations, M&E
results reporting and dissemination, etc.
MLGRD Primary Policy direction, guidelines,
performance targets, advisory
services, etc,
M&E seminars & meetings, supervision,
project inspection, evaluations, M&E
results reporting and dissemination, etc.
DACF Secretariat Primary Financial resources, advisory
services, etc,
M&E seminars & meetings, supervision,
project inspection, evaluations, M&E
results reporting and dissemination, etc.
RCC Primary Advisory services, capacity building,
etc.
M&E plan preparation, evaluations,
PM&E, data collection, M&E seminars &
meetings, supervision, project inspection,
M&E results reporting and dissemination,
etc.
District Assembly Primary Decision making, by-laws,
deliberation and adoption of plans,
programmes and projects, etc.
M&E Plan preparation, M&E seminars &
meetings, supervision, project inspection,
evaluations, M&E results reporting and
dissemination, etc.
Member(s) of
Parliament
Primary Decision making, common fund for
programmes and projects, etc.
M&E seminars & meetings, supervision,
project inspection, evaluations, M&E
results reporting and dissemination, etc.
Traditional
Authorities
Primary Advisory services, transparency and
accountability, etc.
M&E seminars & meetings, supervision,
project inspection, M&E results reporting
and dissemination, etc.
Other MDAs Secondary Guidelines, performance targets,
advisory services, etc,
Data collection, M&E results reporting
and dissemination, etc.
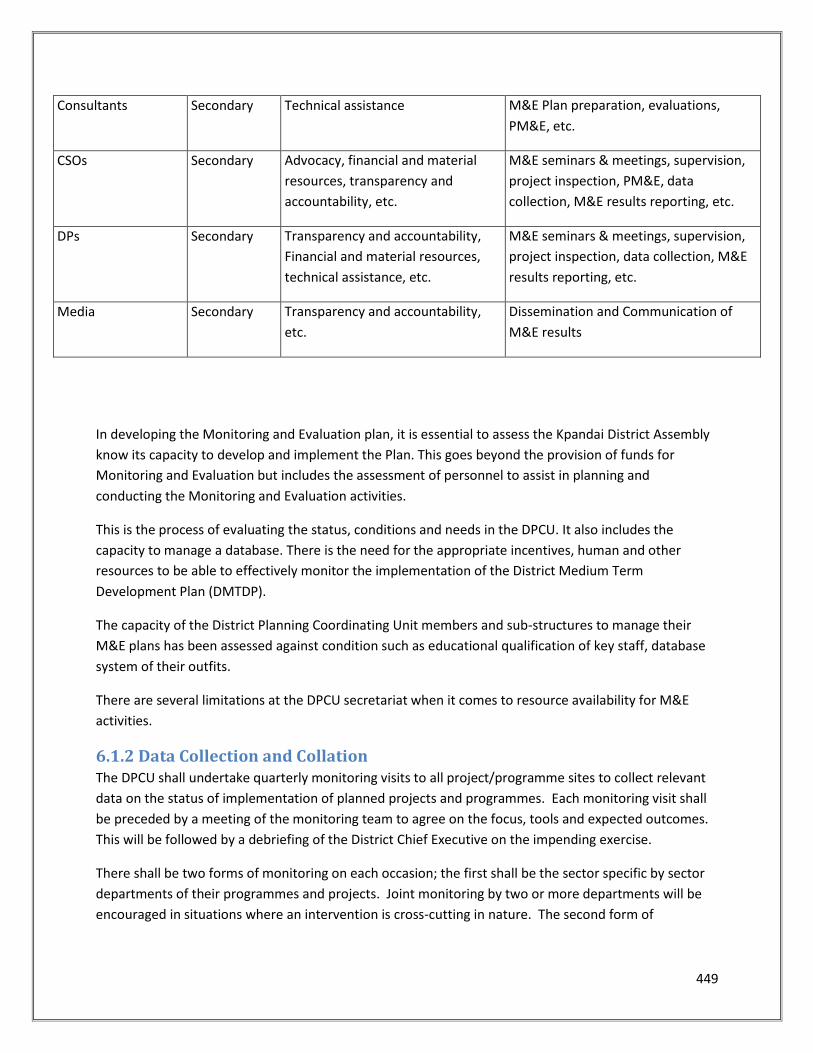
449
Consultants Secondary Technical assistance M&E Plan preparation, evaluations,
PM&E, etc.
CSOs Secondary Advocacy, financial and material
resources, transparency and
accountability, etc.
M&E seminars & meetings, supervision,
project inspection, PM&E, data
collection, M&E results reporting, etc.
DPs Secondary Transparency and accountability,
Financial and material resources,
technical assistance, etc.
M&E seminars & meetings, supervision,
project inspection, data collection, M&E
results reporting, etc.
Media Secondary Transparency and accountability,
etc.
Dissemination and Communication of
M&E results
In developing the Monitoring and Evaluation plan, it is essential to assess the Kpandai District Assembly
know its capacity to develop and implement the Plan. This goes beyond the provision of funds for
Monitoring and Evaluation but includes the assessment of personnel to assist in planning and
conducting the Monitoring and Evaluation activities.
This is the process of evaluating the status, conditions and needs in the DPCU. It also includes the
capacity to manage a database. There is the need for the appropriate incentives, human and other
resources to be able to effectively monitor the implementation of the District Medium Term
Development Plan (DMTDP).
The capacity of the District Planning Coordinating Unit members and sub-structures to manage their
M&E plans has been assessed against condition such as educational qualification of key staff, database
system of their outfits.
There are several limitations at the DPCU secretariat when it comes to resource availability for M&E
activities.
6.1.2 Data Collection and Collation The DPCU shall undertake quarterly monitoring visits to all project/programme sites to collect relevant
data on the status of implementation of planned projects and programmes. Each monitoring visit shall
be preceded by a meeting of the monitoring team to agree on the focus, tools and expected outcomes.
This will be followed by a debriefing of the District Chief Executive on the impending exercise.
There shall be two forms of monitoring on each occasion; the first shall be the sector specific by sector
departments of their programmes and projects. Joint monitoring by two or more departments will be
encouraged in situations where an intervention is cross-cutting in nature. The second form of
450
monitoring will be undertaken by the DPCU on the overall district development programmes, projects
and activities.
In executing the monitoring task, there shall an assessment of the extent to which indicators of
programmes, projects and activities have been achieved. To ensure effective work and use of available
human resources the DPCU shall form monitoring teams depending on the focus of the monitoring
event.
The DPCU shall compile a register of all on-going programmes and projects in the District which will be
regularly up-dated on quarterly basis with details of each activity such as start-time, costs, location,
sources of funding, expected completion date etc.
6.1.3 Data Analysis and Use The DPCU shall use appropriate data analysis software such as MS Excel, SPSS Ghana Info. Etc to analyze
and interpret both primary and secondary data collected from the field and the relevant data sources to
highlight key areas of concern and identify interventions for development and poverty reduction. The
analysis will also show the district’s performance against all the indicators. Each indicator will be
examined and the appropriate action taken to address the findings. The DPUC however have no access
to and knowledge in any of the softwares mentioned above but will make frantic efforts to procure,
install and be trained on the software
6.1.4 Reporting & Dissemination of M&E Reports Monitoring reports shall be compiled after each monitoring exercise. These will highlight key
observations and findings. The report shall be disseminated among various project actors, community
members and sector departments. Copies of the reports shall be forwarded to the RPCU, NDPC and
other MDAs and stakeholders.
6.2 Monitoring Indicators In order to assess the status of implementation of planned programmes and projects, specific indicators
and targets were set under each of the adopted objectives and activities. Based on the time frame, the
indicators were classified into output, outcome and impact types. Specific targets were set with
reference to agreed base lines. This is to enable the Assembly assess its progress under each of the
adopted objectives and activities. In support of the preparation of the Annual Progress Report (APR), the
indicators were derived for the period 2018-2021 MTDP.
The tables below depict the indicators for each year.
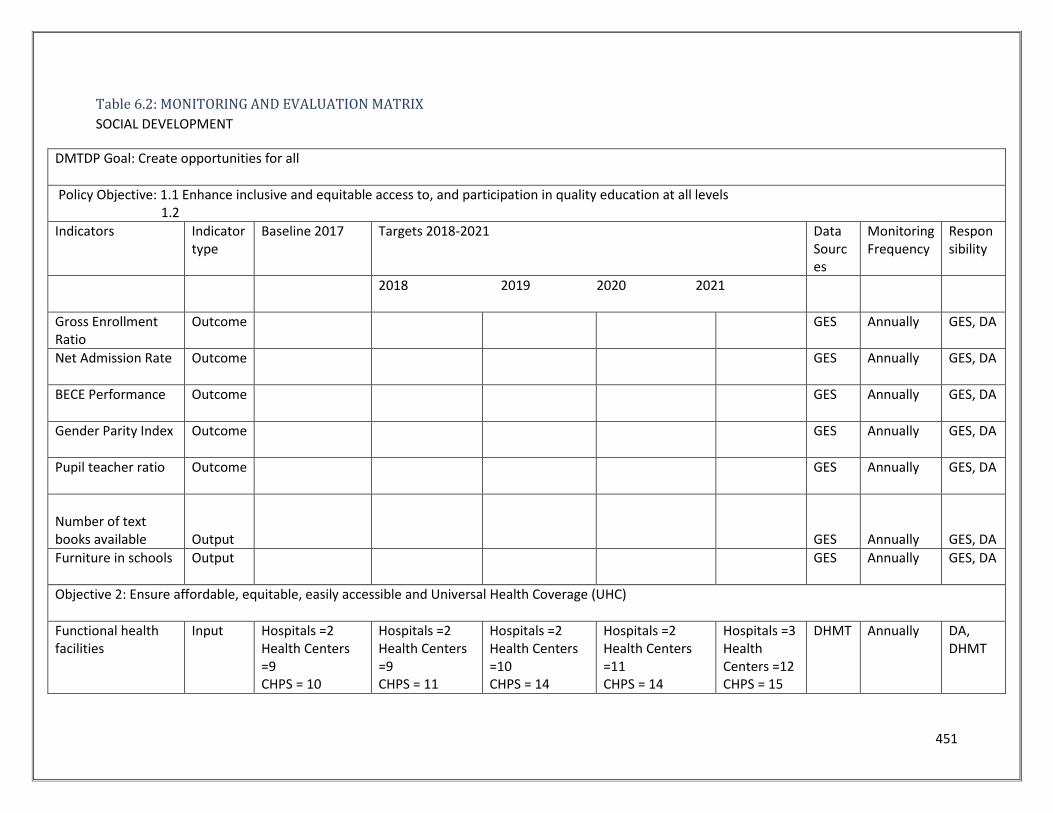
451
Table 6.2: MONITORING AND EVALUATION MATRIX
SOCIAL DEVELOPMENT
DMTDP Goal: Create opportunities for all
Policy Objective: 1.1 Enhance inclusive and equitable access to, and participation in quality education at all levels 1.2
Indicators Indicator type
Baseline 2017 Targets 2018-2021 Data Sources
Monitoring Frequency
Responsibility
2018 2019 2020 2021
Gross Enrollment Ratio
Outcome GES Annually GES, DA
Net Admission Rate Outcome GES Annually GES, DA
BECE Performance Outcome GES Annually GES, DA
Gender Parity Index Outcome GES Annually GES, DA
Pupil teacher ratio Outcome GES Annually GES, DA
Number of text books available
Output
GES
Annually
GES, DA
Furniture in schools Output GES Annually GES, DA
Objective 2: Ensure affordable, equitable, easily accessible and Universal Health Coverage (UHC)
Functional health facilities
Input Hospitals =2 Health Centers =9 CHPS = 10
Hospitals =2 Health Centers =9 CHPS = 11
Hospitals =2 Health Centers =10 CHPS = 14
Hospitals =2 Health Centers =11 CHPS = 14
Hospitals =3 Health Centers =12 CHPS = 15
DHMT Annually DA, DHMT
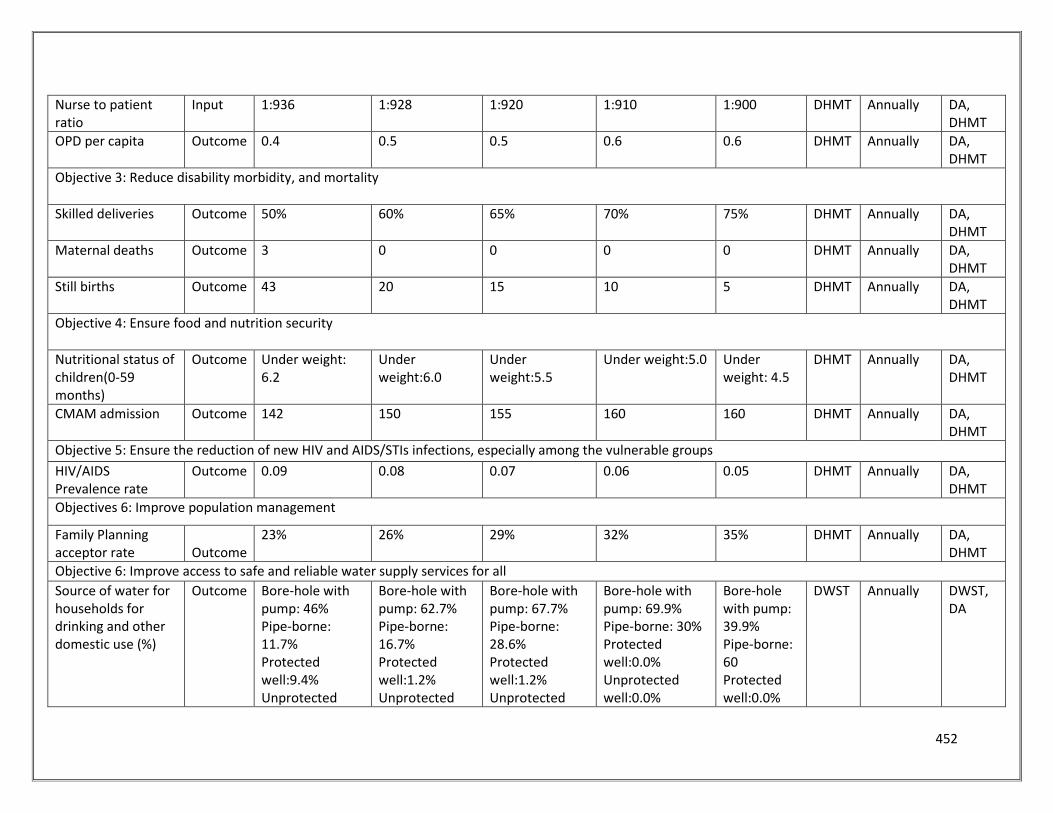
452
Nurse to patient ratio
Input 1:936 1:928 1:920 1:910 1:900 DHMT Annually DA, DHMT
OPD per capita Outcome 0.4 0.5 0.5 0.6 0.6 DHMT Annually DA, DHMT
Objective 3: Reduce disability morbidity, and mortality
Skilled deliveries Outcome 50% 60% 65% 70% 75% DHMT Annually DA, DHMT
Maternal deaths Outcome 3 0 0 0 0 DHMT Annually DA, DHMT
Still births Outcome 43 20 15 10 5 DHMT Annually DA, DHMT
Objective 4: Ensure food and nutrition security
Nutritional status of children(0-59 months)
Outcome Under weight: 6.2
Under weight:6.0
Under weight:5.5
Under weight:5.0 Under weight: 4.5
DHMT Annually DA, DHMT
CMAM admission Outcome 142 150 155 160 160 DHMT Annually DA, DHMT
Objective 5: Ensure the reduction of new HIV and AIDS/STIs infections, especially among the vulnerable groups
HIV/AIDS Prevalence rate
Outcome 0.09 0.08 0.07 0.06 0.05 DHMT Annually DA, DHMT
Objectives 6: Improve population management
Family Planning acceptor rate
Outcome
23% 26% 29% 32% 35% DHMT Annually DA, DHMT
Objective 6: Improve access to safe and reliable water supply services for all
Source of water for households for drinking and other domestic use (%)
Outcome Bore-hole with pump: 46% Pipe-borne: 11.7% Protected well:9.4% Unprotected
Bore-hole with pump: 62.7% Pipe-borne: 16.7% Protected well:1.2% Unprotected
Bore-hole with pump: 67.7% Pipe-borne: 28.6% Protected well:1.2% Unprotected
Bore-hole with pump: 69.9% Pipe-borne: 30% Protected well:0.0% Unprotected well:0.0%
Bore-hole with pump: 39.9% Pipe-borne: 60 Protected well:0.0%
DWST Annually DWST, DA
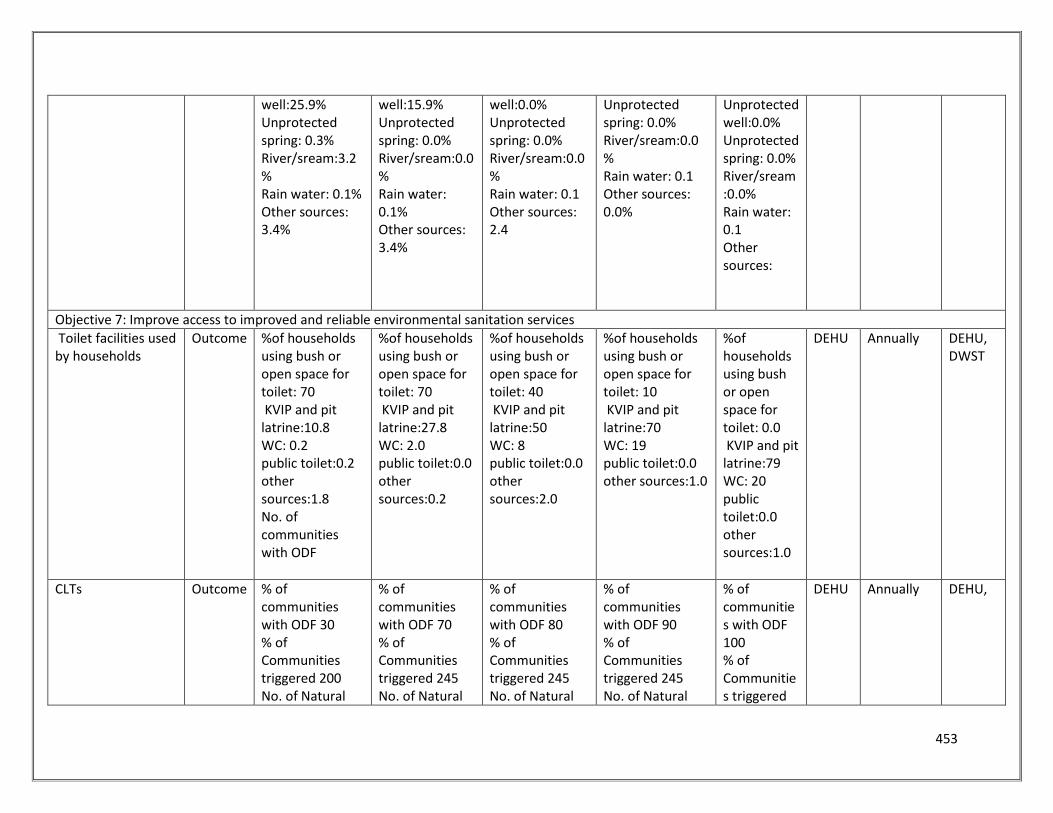
453
well:25.9% Unprotected spring: 0.3% River/sream:3.2% Rain water: 0.1% Other sources: 3.4%
well:15.9% Unprotected spring: 0.0% River/sream:0.0% Rain water: 0.1% Other sources: 3.4%
well:0.0% Unprotected spring: 0.0% River/sream:0.0% Rain water: 0.1 Other sources: 2.4
Unprotected spring: 0.0% River/sream:0.0% Rain water: 0.1 Other sources: 0.0%
Unprotected well:0.0% Unprotected spring: 0.0% River/sream:0.0% Rain water: 0.1 Other sources:
Objective 7: Improve access to improved and reliable environmental sanitation services
Toilet facilities used by households
Outcome %of households using bush or open space for toilet: 70 KVIP and pit latrine:10.8 WC: 0.2 public toilet:0.2 other sources:1.8 No. of communities with ODF
%of households using bush or open space for toilet: 70 KVIP and pit latrine:27.8 WC: 2.0 public toilet:0.0 other sources:0.2
%of households using bush or open space for toilet: 40 KVIP and pit latrine:50 WC: 8 public toilet:0.0 other sources:2.0
%of households using bush or open space for toilet: 10 KVIP and pit latrine:70 WC: 19 public toilet:0.0 other sources:1.0
%of households using bush or open space for toilet: 0.0 KVIP and pit latrine:79 WC: 20 public toilet:0.0 other sources:1.0
DEHU Annually DEHU, DWST
CLTs Outcome % of communities with ODF 30 % of Communities triggered 200 No. of Natural
% of communities with ODF 70 % of Communities triggered 245 No. of Natural
% of communities with ODF 80 % of Communities triggered 245 No. of Natural
% of communities with ODF 90 % of Communities triggered 245 No. of Natural
% of communities with ODF 100 % of Communities triggered
DEHU Annually DEHU,
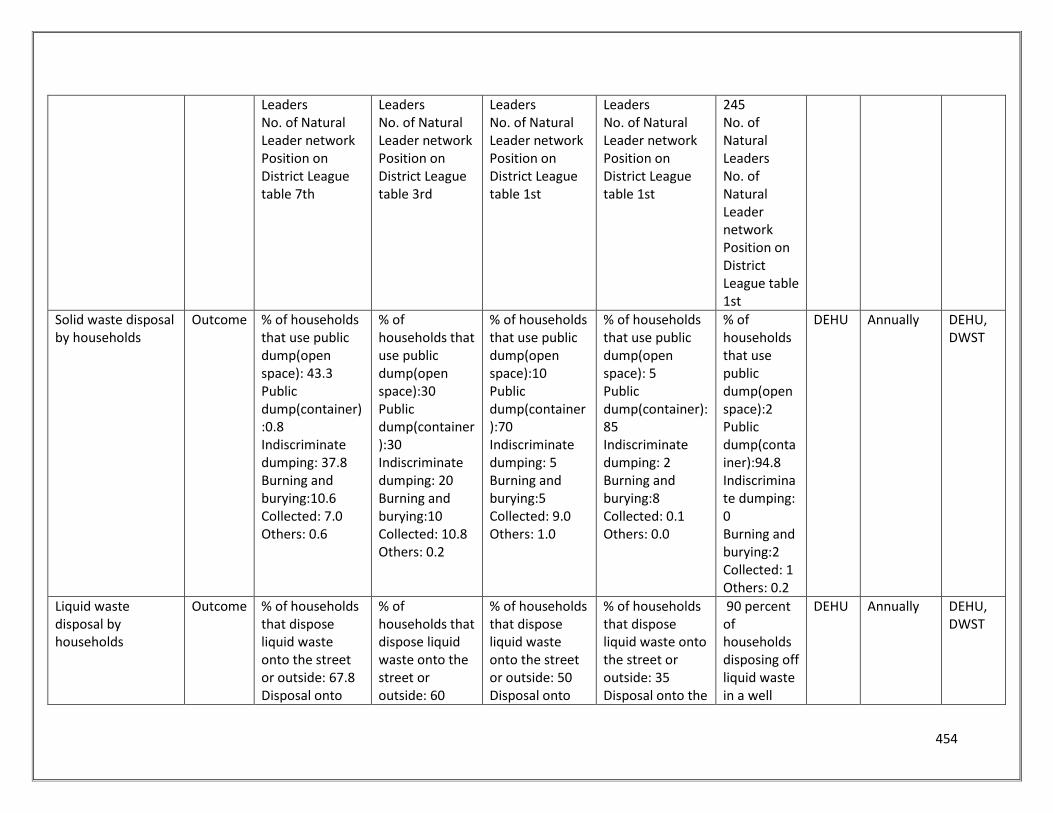
454
Leaders No. of Natural Leader network Position on District League table 7th
Leaders No. of Natural Leader network Position on District League table 3rd
Leaders No. of Natural Leader network Position on District League table 1st
Leaders No. of Natural Leader network Position on District League table 1st
245 No. of Natural Leaders No. of Natural Leader network Position on District League table 1st
Solid waste disposal by households
Outcome % of households that use public dump(open space): 43.3 Public dump(container):0.8 Indiscriminate dumping: 37.8 Burning and burying:10.6 Collected: 7.0 Others: 0.6
% of households that use public dump(open space):30 Public dump(container):30 Indiscriminate dumping: 20 Burning and burying:10 Collected: 10.8 Others: 0.2
% of households that use public dump(open space):10 Public dump(container):70 Indiscriminate dumping: 5 Burning and burying:5 Collected: 9.0 Others: 1.0
% of households that use public dump(open space): 5 Public dump(container):85 Indiscriminate dumping: 2 Burning and burying:8 Collected: 0.1 Others: 0.0
% of households that use public dump(open space):2 Public dump(container):94.8 Indiscriminate dumping: 0 Burning and burying:2 Collected: 1 Others: 0.2
DEHU Annually DEHU, DWST
Liquid waste disposal by households
Outcome % of households that dispose liquid waste onto the street or outside: 67.8 Disposal onto
% of households that dispose liquid waste onto the street or outside: 60
% of households that dispose liquid waste onto the street or outside: 50 Disposal onto
% of households that dispose liquid waste onto the street or outside: 35 Disposal onto the
90 percent of households disposing off liquid waste in a well
DEHU Annually DEHU, DWST
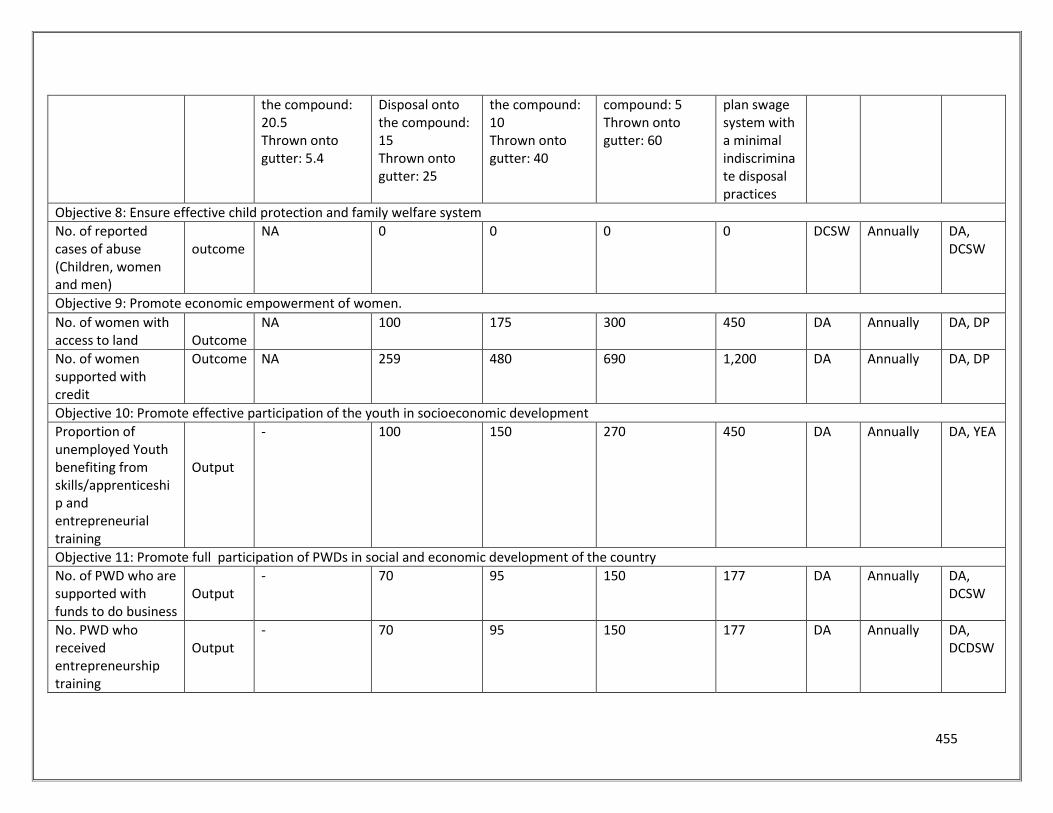
455
the compound: 20.5 Thrown onto gutter: 5.4
Disposal onto the compound: 15 Thrown onto gutter: 25
the compound: 10 Thrown onto gutter: 40
compound: 5 Thrown onto gutter: 60
plan swage system with a minimal indiscriminate disposal practices
Objective 8: Ensure effective child protection and family welfare system
No. of reported cases of abuse (Children, women and men)
outcome
NA 0 0 0 0 DCSW Annually DA, DCSW
Objective 9: Promote economic empowerment of women.
No. of women with access to land
Outcome
NA 100 175 300 450 DA Annually DA, DP
No. of women supported with credit
Outcome NA 259 480 690 1,200 DA Annually DA, DP
Objective 10: Promote effective participation of the youth in socioeconomic development
Proportion of unemployed Youth benefiting from skills/apprenticeship and entrepreneurial training
Output
- 100 150 270 450 DA Annually DA, YEA
Objective 11: Promote full participation of PWDs in social and economic development of the country
No. of PWD who are supported with funds to do business
Output
- 70 95 150 177 DA Annually DA, DCSW
No. PWD who received entrepreneurship training
Output
- 70 95 150 177 DA Annually DA, DCDSW
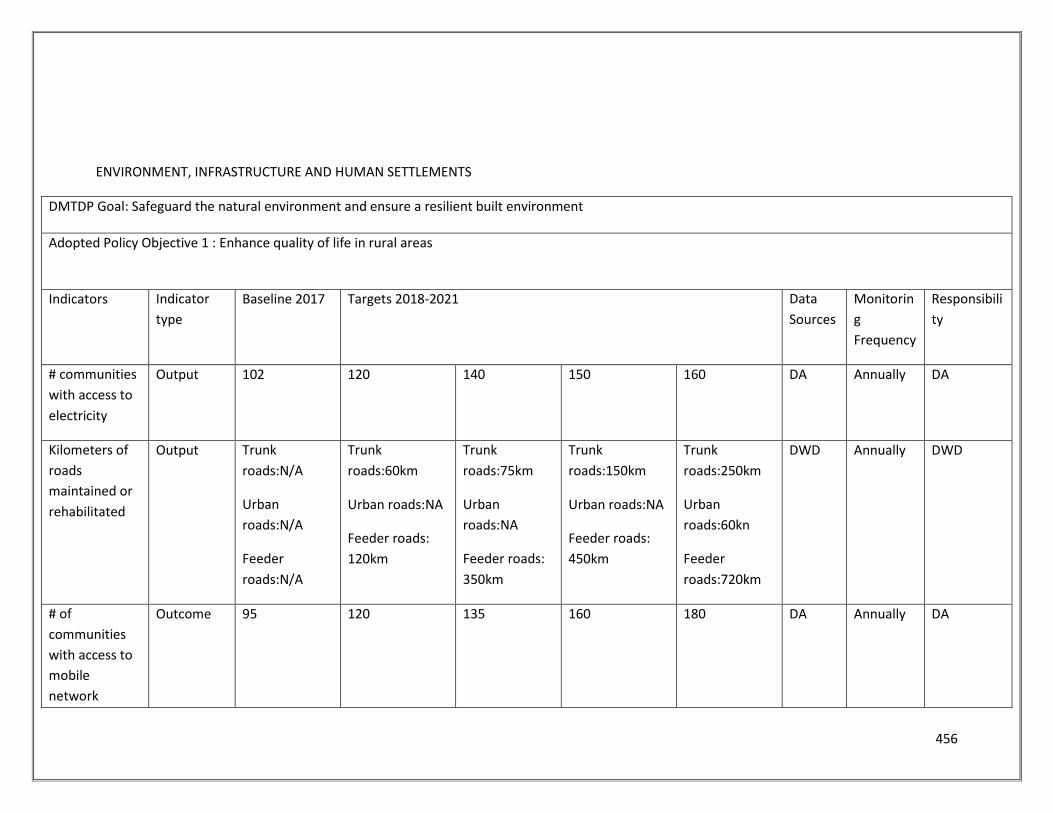
456
ENVIRONMENT, INFRASTRUCTURE AND HUMAN SETTLEMENTS
DMTDP Goal: Safeguard the natural environment and ensure a resilient built environment
Adopted Policy Objective 1 : Enhance quality of life in rural areas
Indicators Indicator
type
Baseline 2017 Targets 2018-2021 Data
Sources
Monitorin
g
Frequency
Responsibili
ty
# communities
with access to
electricity
Output 102 120 140 150 160 DA Annually DA
Kilometers of
roads
maintained or
rehabilitated
Output Trunk
roads:N/A
Urban
roads:N/A
Feeder
roads:N/A
Trunk
roads:60km
Urban roads:NA
Feeder roads:
120km
Trunk
roads:75km
Urban
roads:NA
Feeder roads:
350km
Trunk
roads:150km
Urban roads:NA
Feeder roads:
450km
Trunk
roads:250km
Urban
roads:60kn
Feeder
roads:720km
DWD Annually DWD
# of
communities
with access to
mobile
network
Outcome 95 120 135 160 180 DA Annually DA
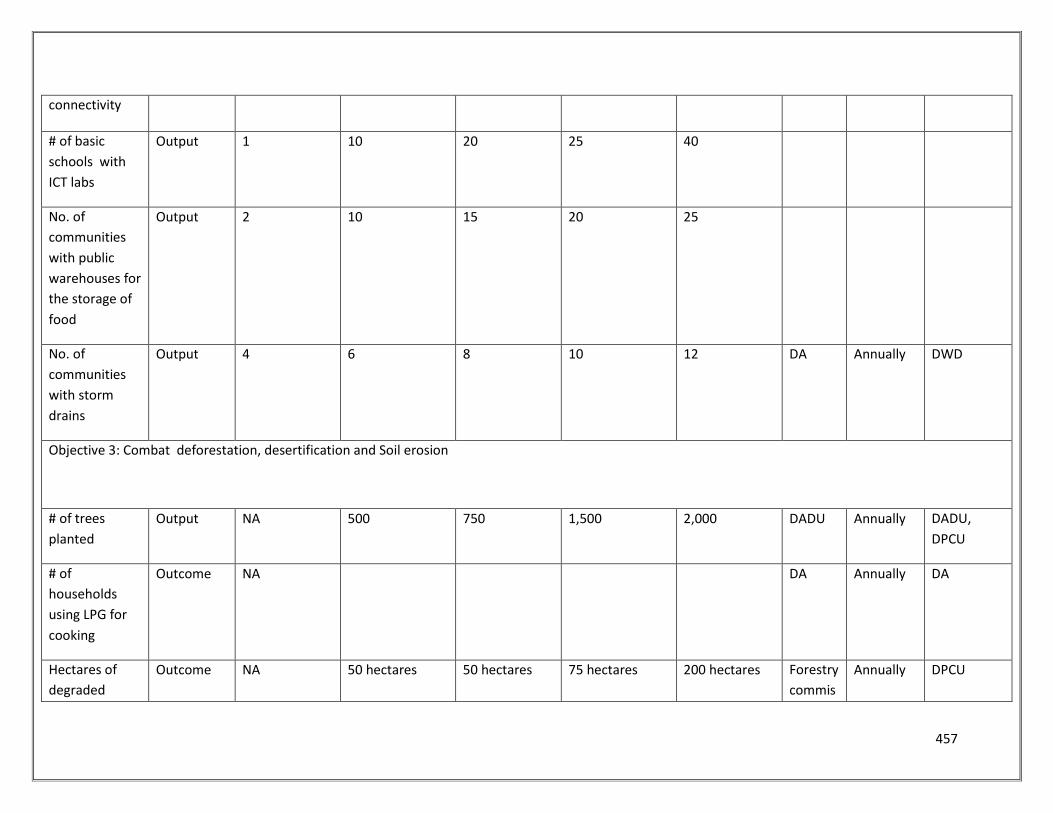
457
connectivity
# of basic
schools with
ICT labs
Output 1 10 20 25 40
No. of
communities
with public
warehouses for
the storage of
food
Output 2 10 15 20 25
No. of
communities
with storm
drains
Output 4 6 8 10 12 DA Annually DWD
Objective 3: Combat deforestation, desertification and Soil erosion
# of trees
planted
Output NA 500 750 1,500 2,000 DADU Annually DADU,
DPCU
# of
households
using LPG for
cooking
Outcome NA DA Annually DA
Hectares of
degraded
Outcome NA 50 hectares 50 hectares 75 hectares 200 hectares Forestry
commis
Annually DPCU
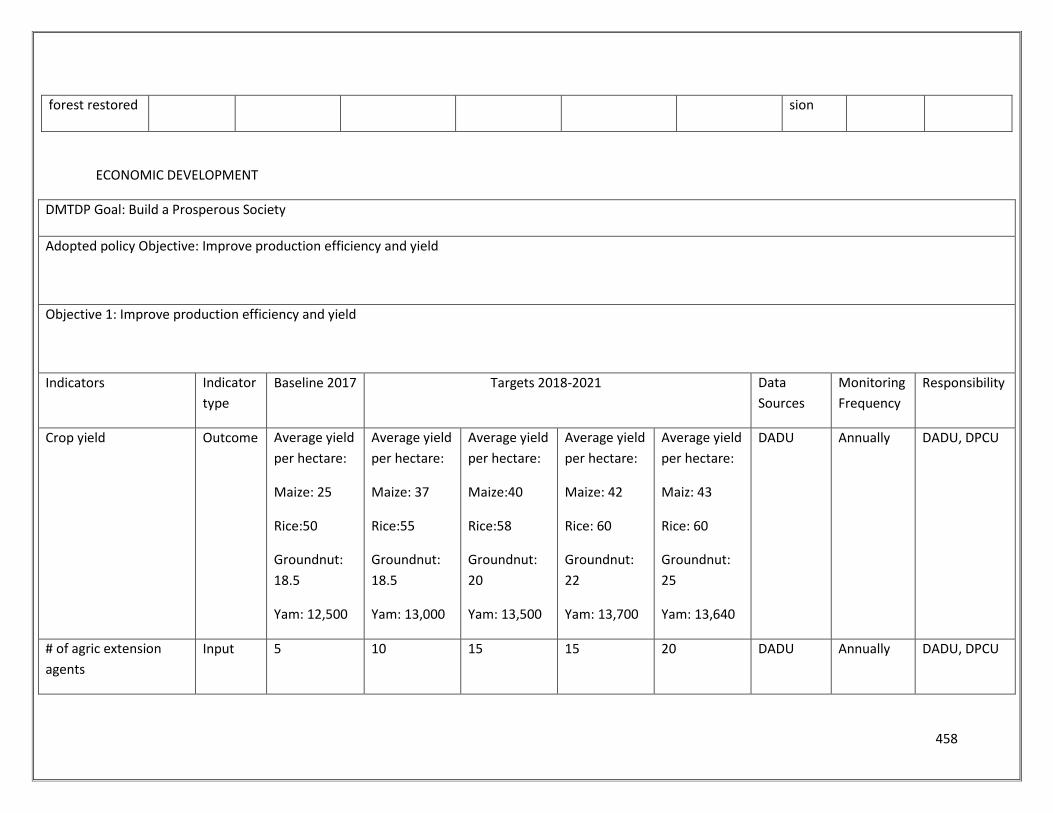
458
forest restored sion
ECONOMIC DEVELOPMENT
DMTDP Goal: Build a Prosperous Society
Adopted policy Objective: Improve production efficiency and yield
Objective 1: Improve production efficiency and yield
Indicators Indicator
type
Baseline 2017 Targets 2018-2021 Data
Sources
Monitoring
Frequency
Responsibility
Crop yield Outcome Average yield
per hectare:
Maize: 25
Rice:50
Groundnut:
18.5
Yam: 12,500
Average yield
per hectare:
Maize: 37
Rice:55
Groundnut:
18.5
Yam: 13,000
Average yield
per hectare:
Maize:40
Rice:58
Groundnut:
20
Yam: 13,500
Average yield
per hectare:
Maize: 42
Rice: 60
Groundnut:
22
Yam: 13,700
Average yield
per hectare:
Maiz: 43
Rice: 60
Groundnut:
25
Yam: 13,640
DADU Annually DADU, DPCU
# of agric extension
agents
Input 5 10 15 15 20 DADU Annually DADU, DPCU
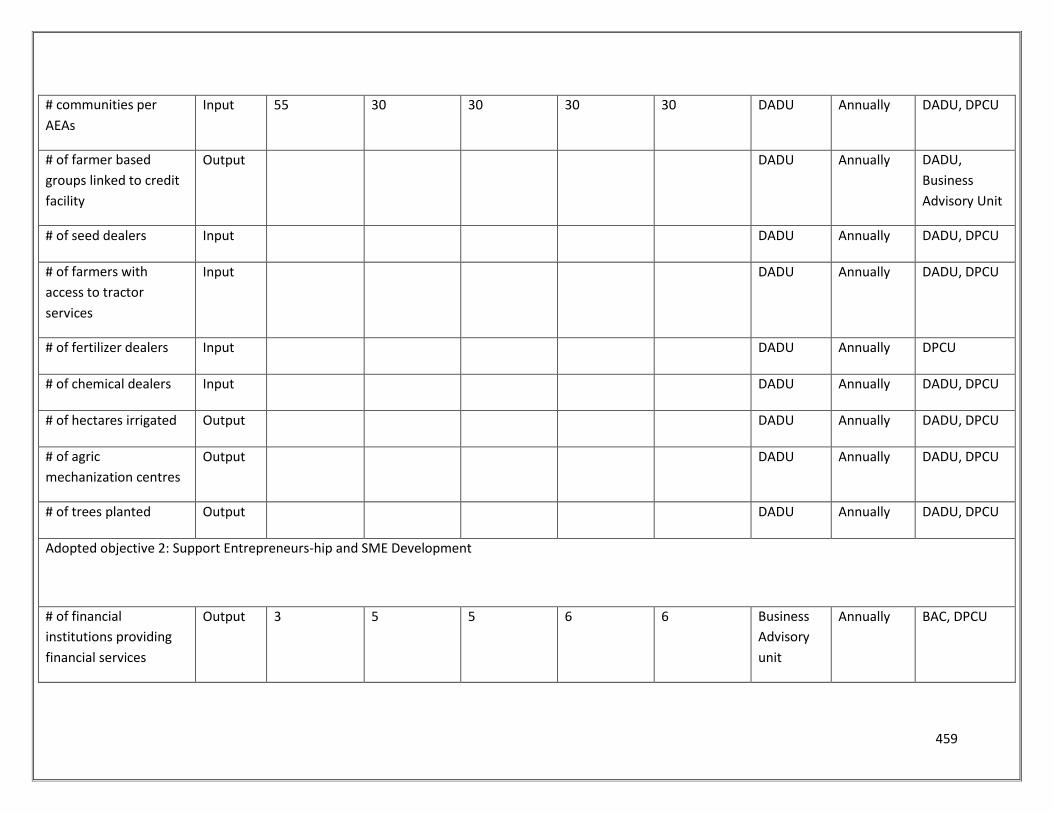
459
# communities per
AEAs
Input 55 30 30 30 30 DADU Annually DADU, DPCU
# of farmer based
groups linked to credit
facility
Output DADU Annually DADU,
Business
Advisory Unit
# of seed dealers Input DADU Annually DADU, DPCU
# of farmers with
access to tractor
services
Input DADU Annually DADU, DPCU
# of fertilizer dealers Input DADU Annually DPCU
# of chemical dealers Input DADU Annually DADU, DPCU
# of hectares irrigated Output DADU Annually DADU, DPCU
# of agric
mechanization centres
Output DADU Annually DADU, DPCU
# of trees planted Output DADU Annually DADU, DPCU
Adopted objective 2: Support Entrepreneurs-hip and SME Development
# of financial
institutions providing
financial services
Output 3 5 5 6 6 Business
Advisory
unit
Annually BAC, DPCU
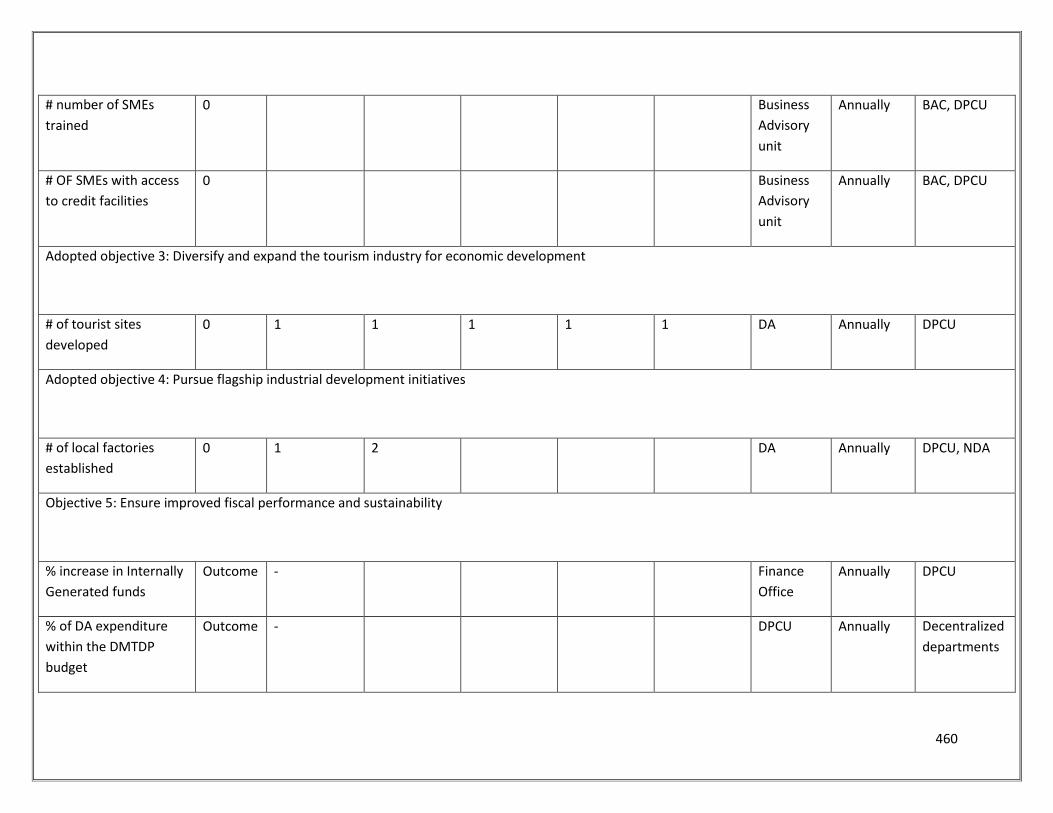
460
# number of SMEs
trained
0 Business
Advisory
unit
Annually BAC, DPCU
# OF SMEs with access
to credit facilities
0 Business
Advisory
unit
Annually BAC, DPCU
Adopted objective 3: Diversify and expand the tourism industry for economic development
# of tourist sites
developed
0 1 1 1 1 1 DA Annually DPCU
Adopted objective 4: Pursue flagship industrial development initiatives
# of local factories
established
0 1 2 DA Annually DPCU, NDA
Objective 5: Ensure improved fiscal performance and sustainability
% increase in Internally
Generated funds
Outcome - Finance
Office
Annually DPCU
% of DA expenditure
within the DMTDP
budget
Outcome - DPCU Annually Decentralized
departments
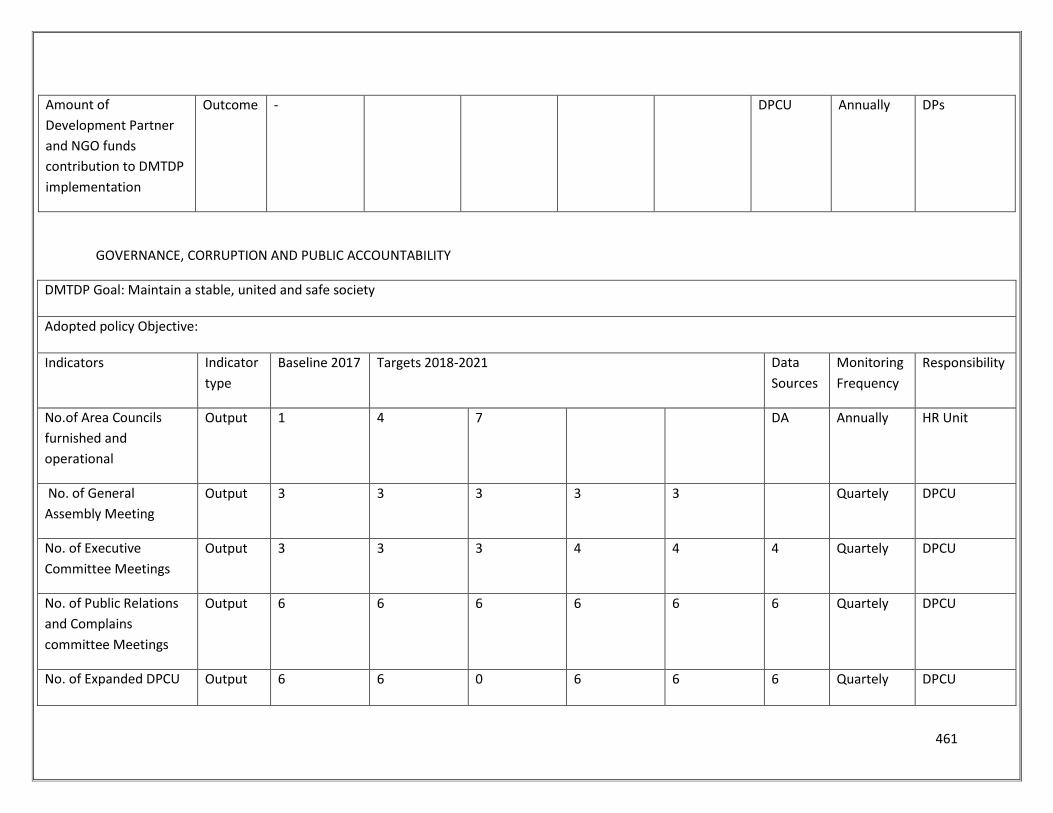
461
Amount of
Development Partner
and NGO funds
contribution to DMTDP
implementation
Outcome - DPCU Annually DPs
GOVERNANCE, CORRUPTION AND PUBLIC ACCOUNTABILITY
DMTDP Goal: Maintain a stable, united and safe society
Adopted policy Objective:
Indicators Indicator
type
Baseline 2017 Targets 2018-2021 Data
Sources
Monitoring
Frequency
Responsibility
No.of Area Councils
furnished and
operational
Output 1 4 7 DA Annually HR Unit
No. of General
Assembly Meeting
Output 3 3 3 3 3 Quartely DPCU
No. of Executive
Committee Meetings
Output 3 3 3 4 4 4 Quartely DPCU
No. of Public Relations
and Complains
committee Meetings
Output 6 6 6 6 6 6 Quartely DPCU
No. of Expanded DPCU Output 6 6 0 6 6 6 Quartely DPCU
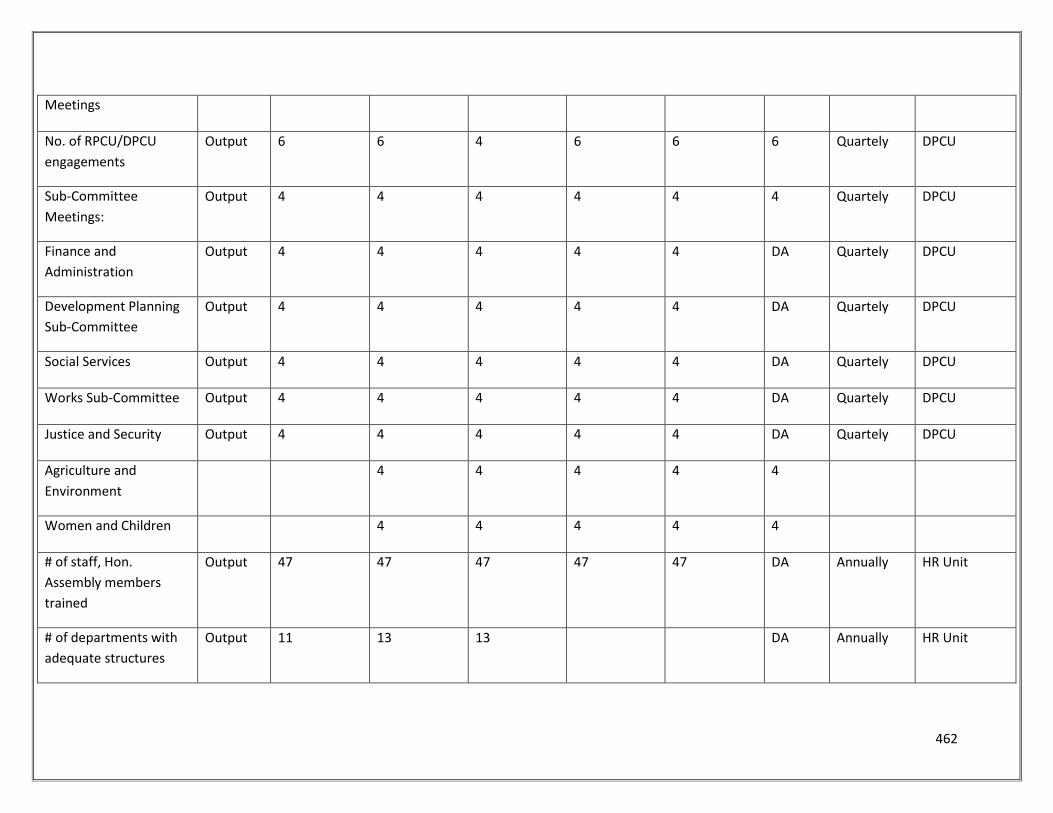
462
Meetings
No. of RPCU/DPCU
engagements
Output 6 6 4 6 6 6 Quartely DPCU
Sub-Committee
Meetings:
Output 4 4 4 4 4 4 Quartely DPCU
Finance and
Administration
Output 4 4 4 4 4 DA Quartely DPCU
Development Planning
Sub-Committee
Output 4 4 4 4 4 DA Quartely DPCU
Social Services Output 4 4 4 4 4 DA Quartely DPCU
Works Sub-Committee Output 4 4 4 4 4 DA Quartely DPCU
Justice and Security Output 4 4 4 4 4 DA Quartely DPCU
Agriculture and
Environment
4 4 4 4 4
Women and Children 4 4 4 4 4
# of staff, Hon.
Assembly members
trained
Output 47 47 47 47 47 DA Annually HR Unit
# of departments with
adequate structures
Output 11 13 13 DA Annually HR Unit
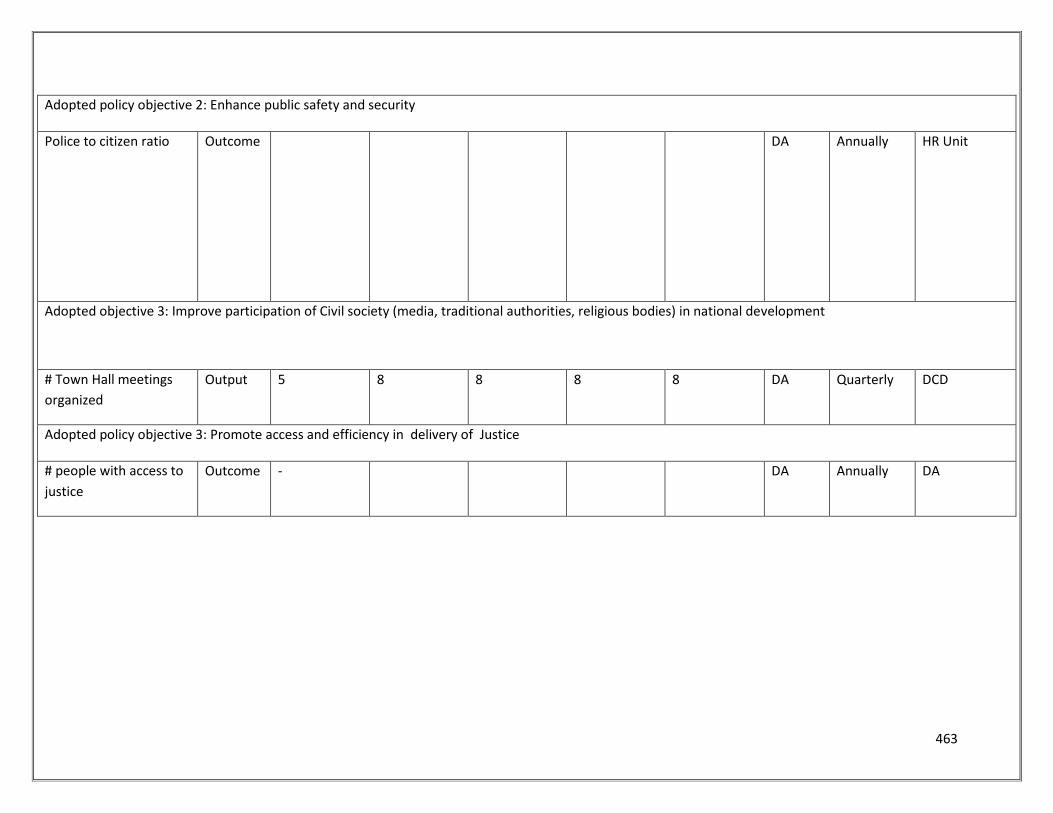
463
Adopted policy objective 2: Enhance public safety and security
Police to citizen ratio
Outcome DA Annually HR Unit
Adopted objective 3: Improve participation of Civil society (media, traditional authorities, religious bodies) in national development
# Town Hall meetings
organized
Output 5 8 8 8 8 DA Quarterly DCD
Adopted policy objective 3: Promote access and efficiency in delivery of Justice
# people with access to
justice
Outcome - DA Annually DA
464
6.3 MONITORIG AND EVALUATION CALENDER The Monitoring and Evaluation calendar captured in table 6.3 below has been developed to guide the
implementation of various activities to be carried out by the specified responsible agencies and
departments.
Major activities include review meetings, quarterly monitoring visits by the DPCU and other
stakeholders, quarterly field visits, mid-term evaluation of programmes, preparation of monthly and
quarterly reports and information dissemination.
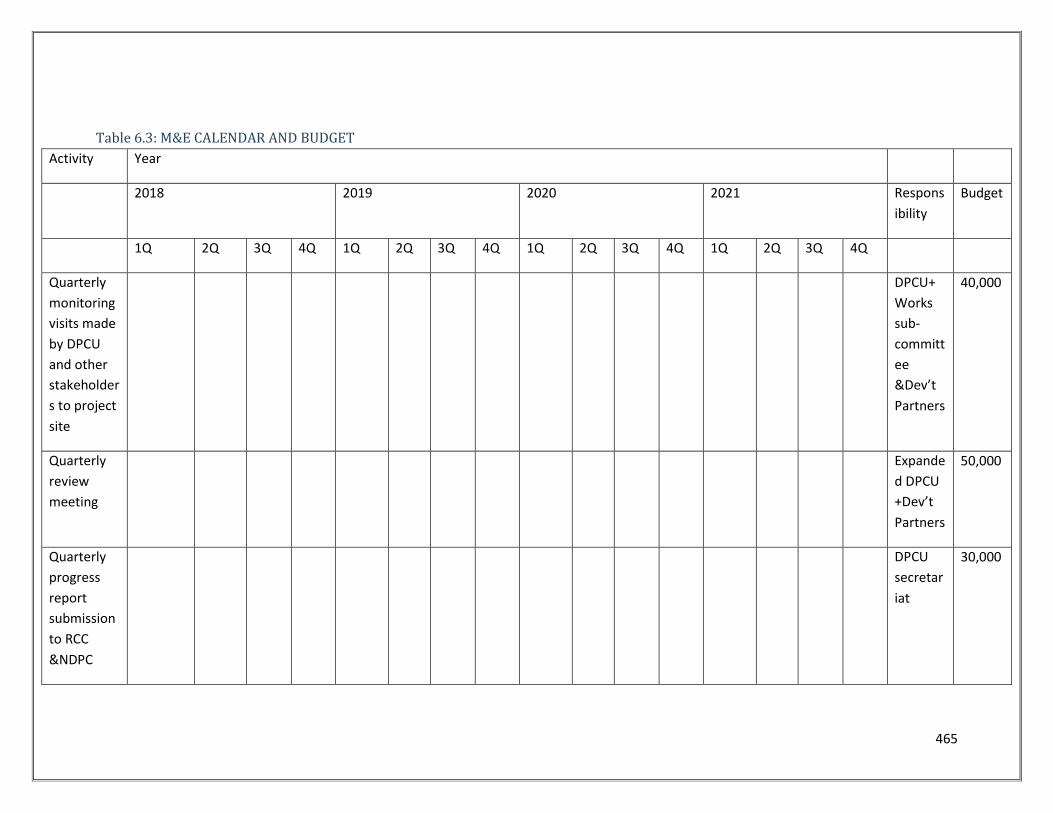
465
Table 6.3: M&E CALENDAR AND BUDGET
Activity Year
2018 2019 2020 2021 Respons
ibility
Budget
1Q 2Q 3Q 4Q 1Q 2Q 3Q 4Q 1Q 2Q 3Q 4Q 1Q 2Q 3Q 4Q
Quarterly
monitoring
visits made
by DPCU
and other
stakeholder
s to project
site
DPCU+
Works
sub-
committ
ee
&Dev’t
Partners
40,000
Quarterly
review
meeting
Expande
d DPCU
+Dev’t
Partners
50,000
Quarterly
progress
report
submission
to RCC
&NDPC
DPCU
secretar
iat
30,000
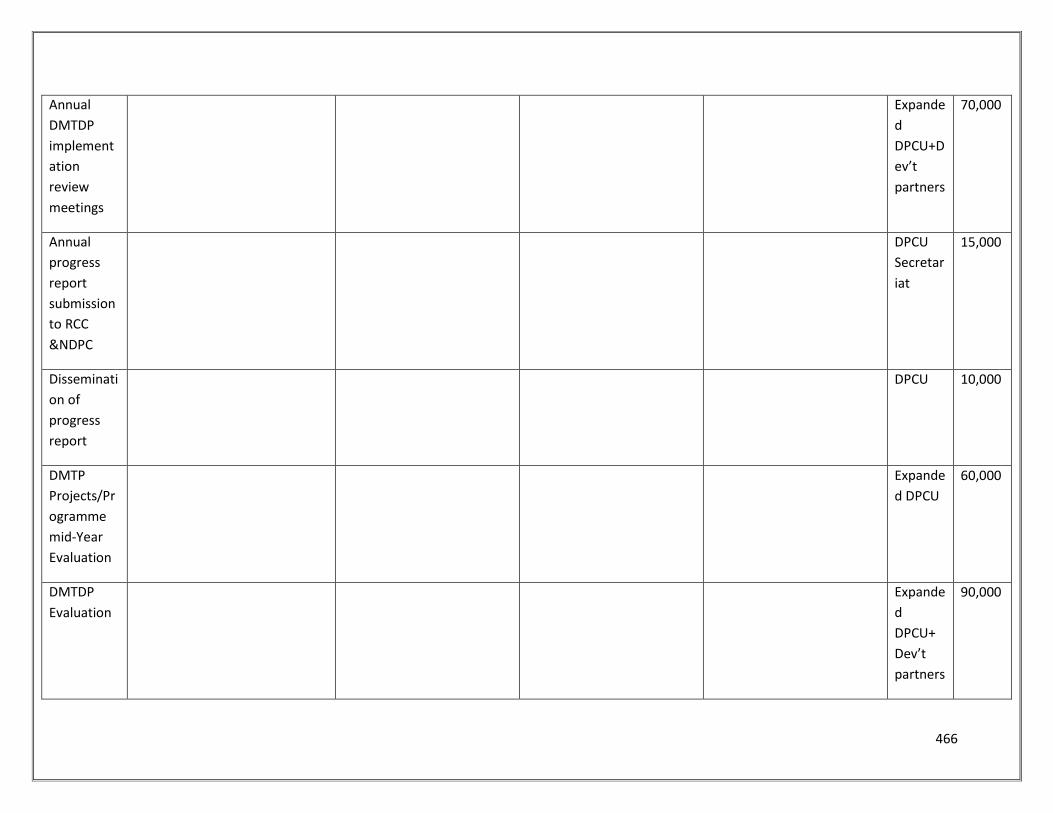
466
Annual
DMTDP
implement
ation
review
meetings
Expande
d
DPCU+D
ev’t
partners
70,000
Annual
progress
report
submission
to RCC
&NDPC
DPCU
Secretar
iat
15,000
Disseminati
on of
progress
report
DPCU 10,000
DMTP
Projects/Pr
ogramme
mid-Year
Evaluation
Expande
d DPCU
60,000
DMTDP
Evaluation
Expande
d
DPCU+
Dev’t
partners
90,000

467
TOTAL 365,00
0
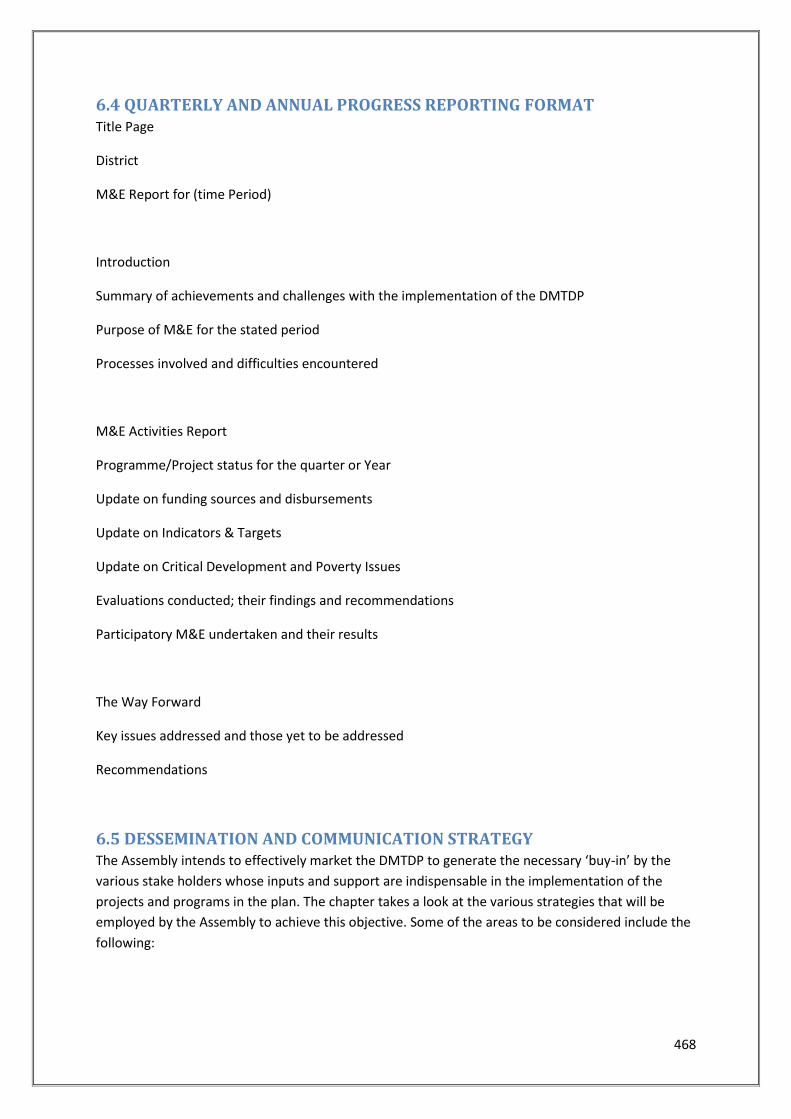
468
6.4 QUARTERLY AND ANNUAL PROGRESS REPORTING FORMAT Title Page
District
M&E Report for (time Period)
Introduction
Summary of achievements and challenges with the implementation of the DMTDP
Purpose of M&E for the stated period
Processes involved and difficulties encountered
M&E Activities Report
Programme/Project status for the quarter or Year
Update on funding sources and disbursements
Update on Indicators & Targets
Update on Critical Development and Poverty Issues
Evaluations conducted; their findings and recommendations
Participatory M&E undertaken and their results
The Way Forward
Key issues addressed and those yet to be addressed
Recommendations
6.5 DESSEMINATION AND COMMUNICATION STRATEGY The Assembly intends to effectively market the DMTDP to generate the necessary ‘buy-in’ by the
various stake holders whose inputs and support are indispensable in the implementation of the
projects and programs in the plan. The chapter takes a look at the various strategies that will be
employed by the Assembly to achieve this objective. Some of the areas to be considered include the
following:
469
Coppice of the DMTDP will be submitted to the Regional Coordination Council, Ministry of Local
Government and Rural Development, the National Development Planning Commission, the
Development Partners, Non-Governmental Organizations and other stakeholders whose
contributions are necessary for the successful implementation of the plan.
Publicity programs will be rolled out to effectively market the plan. For success in this area, the
Assembly intends to train members of the District Planning and Coordinating Unit (DPCU) and other
implementing agencies on the techniques of plan marketing to enable them deliver. With the Eagle
FM station in Kpandai, an opportunity is created for the Assembly to reach out to the wider public
on the content of the plan.
Annual progress reports on the implementation of the DMTDP will also be prepared and
disseminated like that of the DMTDP. The Assembly persons and other stake holders will be given
the opportunity to review and make inputs into these reports through the Annual Review
Workshops that would be rolled out during the implementation process.
6.5.1 Awareness Creation on Roles of Stakeholders
Conscious efforts will be made by the Assembly to create awareness among stakeholders on their
expected roles in the implementation of the programs, projects and activities within the plan.
Stakeholder and public hearing workshops have already been held during the preparation of the
plan. Assembly persons will be sensitized during Assembly meetings, workshops and seminars will be
held at the Area Council Level to help the people appreciate their roles and responsibilities in the
implementation of the plan. The speeches of the District Chief Executive will have components that
look at the role of citizens in the execution of the district plan so as to reach out to the people in the
numerous engagements he will have with public.
6.5.2 Promotion of Dialogue and Generation of Feedback
The Assembly will promote dialogue between the office and all stakeholders to generate the
necessary feedback on the implementation of the policies, programs and projects through constant
interactions with the public. Effective use would be made with the general Assembly meetings, the
meetings of the Area Councilors and other key stakeholders at the area level and other fora that will
be facilitated by the Assembly. Particular attention would be paid to the private sector to offer the
opportunity to identify and timely respond to the concerns of the sector to illicit the necessary
impetus for growth.
Some kind of partnership would be fashioned out with radio stations in the district and beyond to
run programs that will enable the public to contribute to issues the implementation of the DMTDP
and the development in the district.
6.5.3 Conclusion
The purpose of this plan is to provide an overall framework for development in the District. It has
been prepared taking cognizance of the development aspirations of the people in the district and in
line with the tenets of the ‘’Agenda for job: creating Prosperity and equal opportunity for All’ It
therefore supports national development agenda.
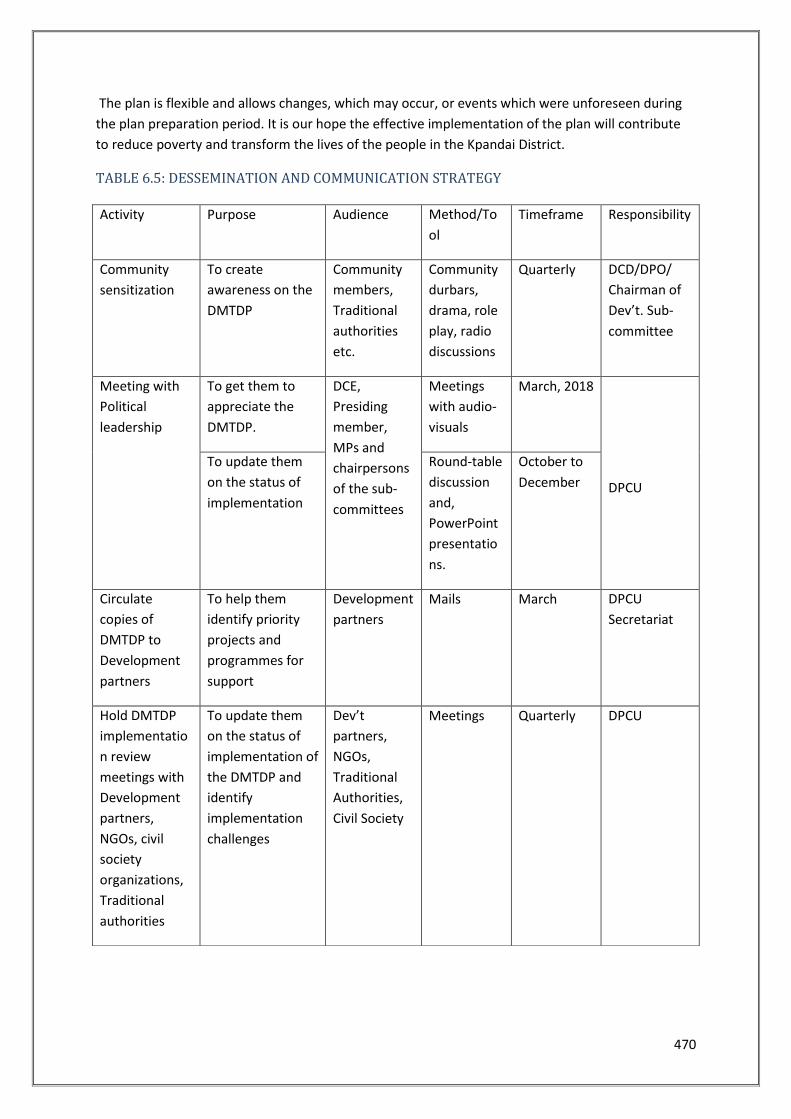
470
The plan is flexible and allows changes, which may occur, or events which were unforeseen during
the plan preparation period. It is our hope the effective implementation of the plan will contribute
to reduce poverty and transform the lives of the people in the Kpandai District.
TABLE 6.5: DESSEMINATION AND COMMUNICATION STRATEGY
Activity Purpose Audience Method/To
ol
Timeframe Responsibility
Community
sensitization
To create
awareness on the
DMTDP
Community
members,
Traditional
authorities
etc.
Community
durbars,
drama, role
play, radio
discussions
Quarterly DCD/DPO/
Chairman of
Dev’t. Sub-
committee
Meeting with
Political
leadership
To get them to
appreciate the
DMTDP.
DCE,
Presiding
member,
MPs and
chairpersons
of the sub-
committees
Meetings
with audio-
visuals
March, 2018
DPCU
To update them
on the status of
implementation
Round-table
discussion
and,
PowerPoint
presentatio
ns.
October to
December
Circulate
copies of
DMTDP to
Development
partners
To help them
identify priority
projects and
programmes for
support
Development
partners
Mails March DPCU
Secretariat
Hold DMTDP
implementatio
n review
meetings with
Development
partners,
NGOs, civil
society
organizations,
Traditional
authorities
To update them
on the status of
implementation of
the DMTDP and
identify
implementation
challenges
Dev’t
partners,
NGOs,
Traditional
Authorities,
Civil Society
Meetings Quarterly DPCU
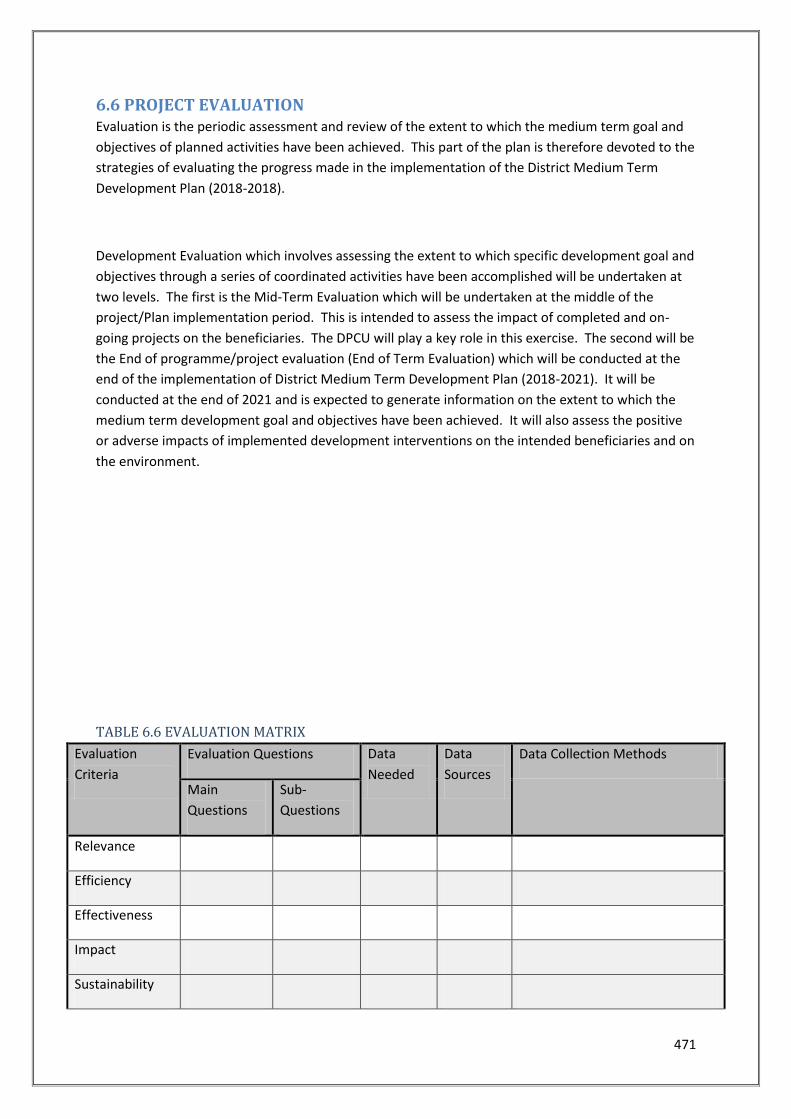
471
6.6 PROJECT EVALUATION Evaluation is the periodic assessment and review of the extent to which the medium term goal and
objectives of planned activities have been achieved. This part of the plan is therefore devoted to the
strategies of evaluating the progress made in the implementation of the District Medium Term
Development Plan (2018-2018).
Development Evaluation which involves assessing the extent to which specific development goal and
objectives through a series of coordinated activities have been accomplished will be undertaken at
two levels. The first is the Mid-Term Evaluation which will be undertaken at the middle of the
project/Plan implementation period. This is intended to assess the impact of completed and on-
going projects on the beneficiaries. The DPCU will play a key role in this exercise. The second will be
the End of programme/project evaluation (End of Term Evaluation) which will be conducted at the
end of the implementation of District Medium Term Development Plan (2018-2021). It will be
conducted at the end of 2021 and is expected to generate information on the extent to which the
medium term development goal and objectives have been achieved. It will also assess the positive
or adverse impacts of implemented development interventions on the intended beneficiaries and on
the environment.
TABLE 6.6 EVALUATION MATRIX
Evaluation
Criteria
Evaluation Questions Data
Needed
Data
Sources
Data Collection Methods
Main
Questions
Sub-
Questions
Relevance
Efficiency
Effectiveness
Impact
Sustainability

472
Others
6.6.1 EVALUATION GUIDE
A. PROGRAMME/ PROJECT IDENTIFICATION
A1: Project Title…………………………………………………………………………………….
A2: Project Code……………………………………………………………………………………
A3: Location………………………………………………………………………………………….
A4: Implementing Agency……………………………………………………………………..
A5: Collaborating Agency (ies)……………………………………………………………….
A6: Evaluation Agency (ies)…………………………………………………………………...
A7: Date of Evaluation………………………………………………………………………….
EVALUATION QUESTIONS
The following evaluation Questions will guide the evaluation:
B1: QUESTIONS RELATING TO PROJECT/PROGRAMME EFFECTIVENESS
B1.1 Project/Programme objectives
Have the programme/project objectives been achieved?
Are the programme/project objectives still relevant?
Has the programme/project supported the Policy (ies) as planned?
If programme/project objectives have not been achieved, what are the reasons responsible?
State any policies which need adjustment and give reasons for those objectives which are shown to
be no longer relevant as a result of the evaluation.
B1.2: Beneficiaries and Benefits
Are the benefits reaching the targeted beneficiaries? If not state beneficiaries not being reached.
Are the benefits reaching the number of beneficiaries planned? If not, state shortfalls.
Are the benefits at the planned quantitative and qualitative level? If not state shortfall.
473
Are revenues at the planned level? If not state shortfall, (For programmes/projects designed to be
revenue earning only.)
Where planned targets, in terms of benefits and beneficiaries, have not been achieved give reasons
in full and state how the situation will be avoided in future.
B1.3: Operations
Is the project operating at the planned level? If not, state deficiency.
Are the programme/project assets being properly maintained? If not, state areas of failure.
Where appropriate state reasons for failure.
B2: QUESTIONS RELATING TO PROJECT/PROGRAMME EFFICIENCY
B2.1: Time and Finance
Was the project completed in the time planned? If not state length of over run.
Was the project cost within the amount estimated? If not state amount of over (or under)
expenditure.
Did funds come on-stream as planned and anticipated? If no what short falls occurred.
Are recurrent costs within the planned level? If not state over expenditure.
Where over-runs, over expenditure and funding short-falls have occurred, give reasons in full and
state how these events can be avoided in the future.
6.7: PARTICIPATORY MONITORING AND EVALUATION ARRANGEMENT Participatory Monitoring and Evaluation is the process of involving all stakeholders connected with
an intervention in the monitoring and evaluating the project outcomes. In this regard, efforts would
be made towards the inclusion of community members who are the direct beneficiaries of the
project/programme outcomes in the monitoring and evaluation assignment. Also to be involved
include key development partners, donor agencies, Civil Society Organizations among others. The
following PM&E methods shall be adopted:
Community Score card
Participatory Rural Appraisal
Participatory Expenditure Tracking survey.
474
6.8: ENVIRONMENTAL SUSTAINABILITY About 90% of the population in District depends on wood and charcoal as the main source of energy
for both domestic and commercial purposes. The collection of wood and the production of charcoal
lead to environmental degradation in all the settlements in the district. The developmental
constraints associated with the use of charcoal and wood as the main sources of energy includes.
• Deforestation
• Soil erosion
• Loss of soil fertility
• Ecological imbalance
The practice of clearing and burning the vegetation for farming in the district also cause erosion and
deforestation in the district. Since about 90% of the population are farmers, these have adverse
impact on the food security in the District.
The main problems of the district environment and sanitation are caused by household activities.
About 80% of the population in the district disposes off both solid and liquid waste within the
vicinity of their houses and these are carried into the various water bodies by run-offs thereby
polluting them. The logical consequence of this is the wide spread incidence of sanitation related
diseases such as diarrhoea, bilharzias, dysentery and other water borne diseases etc.
.
This therefore calls for subjecting the District Medium Term Development Plan to Strategic
Environmental Assessment (SEA) test in order to realize a development that is sustainable.
6.8.1 Purpose of the SEA
The SEA exercise is to mainstreaming environmental issues into the DMTDP. This has been achieved
with the support from EPA with the following objectives:
• Refine the PPPs to incorporate environmental considerations into the DMTDP
• Institute appropriate interventions to mitigate negative impacts on the environment
• Training of District Staff DPCU in the application of SEA
6.8.2 Scope of the SEA
The SEA exercise in the District involved issues such as water, forests, agriculture ecosystems,
deforestation, land degradation, erosion, air pollution, noise pollution, waste management among
others.

475
6.8.3 Methodology
A number of meetings were held during the preparation and after the draft report. The District Team
was responsible for ensuring that all major stakeholders took part in the exercise. The major
stakeholders that took part in the SEA were the Expanded DPCU, Assembly members, CBOs,
Traditional Authority and other Communities Members.
6.8.4 Institutional and Regulatory Requirements
The DMTDP was subjected to SEA test in order to comply with the following institutional regulatory
requirements.
The Environmental Assessment Regulations 1999, Legislative Instrument 1652 (Regulation 30 (1)
Definitions) require all undertakings including plans and programmes which are likely to have
significant environmental impacts to be subjected to environmental assessment in their planning
and execution. This is intended to ensure that environmental issues are considered at par with
socio-economic issues at the early stages of plan preparation and implementation
The Strategic Environmental Assessment (SEA) of the District Medium Term Development Plan was
conducted in compliance with the requirements of Medium-Term National Development Policy
Framework (2018-2021).
The National Development Planning Commission (NDPC) guidelines for the development of district
and sector medium plans include the use of Strategic Environmental Assessment to mainstream
environment at all levels of planning

476