Korea - Republic of Grain and Feed Update January 2014 · PDF fileGrain and Feed Update Korea...
17
THIS REPORT CONTAINS ASSESSMENTS OF COMMODITY AND TRADE ISSUES MADE BY USDA STAFF AND NOT NECESSARILY STATEMENTS OF OFFICIAL U.S. GOVERNMENT POLICY Date: GAIN Report Number: Approved By: Prepared By: Report Highlights: MY 2013/14 wheat consumption is revised to 4.3 million tons from the previous forecast, down 400,000 MT due to decreased use in compound animal feed. Conversely, MY 2013/14 corn consumption forecast is revised to 9.6 million MT, up 500,000 MT, replacing feed grade wheat. MY 2013/14 corn import forecast is revised to 9.5 million MT, up 500,000 tons, of which U.S. exports are estimated at 3 million tons, up one million tons from Post’s previous forecast due to competitive prices. Rice consumption and imports remain unchanged for the previous report. Sunchul Choi\\Mark A. Myers Kevin N. Smith January 2014 Grain and Feed Update Korea - Republic of KS1406 1/28/2014 Required Report - public distribution
Transcript of Korea - Republic of Grain and Feed Update January 2014 · PDF fileGrain and Feed Update Korea...

THIS REPORT CONTAINS ASSESSMENTS OF COMMODITY AND TRADE ISSUES MADE BY
USDA STAFF AND NOT NECESSARILY STATEMENTS OF OFFICIAL U.S. GOVERNMENT
POLICY
Date:
GAIN Report Number:
Approved By:
Prepared By:
Report Highlights: MY 2013/14 wheat consumption is revised to 4.3 million tons from the previous forecast, down 400,000 MT due to
decreased use in compound animal feed. Conversely, MY 2013/14 corn consumption forecast is revised to 9.6 million MT,
up 500,000 MT, replacing feed grade wheat. MY 2013/14 corn import forecast is revised to 9.5 million MT, up 500,000
tons, of which U.S. exports are estimated at 3 million tons, up one million tons from Post’s previous forecast due to
competitive prices. Rice consumption and imports remain unchanged for the previous report.
Sunchul Choi\\Mark A.
Myers
Kevin N. Smith
January 2014
Grain and Feed Update
Korea - Republic of
KS1406
1/28/2014
Required Report - public distribution

Post:
Commodities:
Author Defined: WHEAT
Consumption: MY 2013/14 wheat consumption is revised to 4.3 million tons from the previous forecast, down 400,000 MT due to
anticipated slow feed wheat use for compound animal feed for the second half of MY 2013 as feed grade wheat contracts
sharply declined after December 2013 arrival. Competitively priced feed corn replaced the decreased portion of feed wheat.
Milling wheat consumption is unchanged from the previous forecast.
Korea: Post Estimates of Domestic Wheat Use (1,000 MT, July/June)
Year 2010/11 2011/12 2012/13 2013/14c/
Imported Milling Wheat 1/
2,312 2,153 2,139 2,255
Imported Milling Wheat 2/ na 130 167 180
Flour Imports a/ 63 42 39 40
Flour Exports a/ 64 60 62 65
Pasta Imports a/ 123 122 135 140
Pasta Exports a/ 111 120 130 135
Local Wheat 39 44 37 29
FSI Consumption b/ 2,362 2,311 2,379 2,444
Feed Wheat 1,965 2,870 2,818 1,900
Total Consumption b/ 4,327 5,181 5,197 4,344
Source: Korea Feed Association (KFA), Korea Flour Millers Industry Association (KOFMIA) and Korea Customs Service (KCS) a/ Wheat basis b/ include local wheat, flour imports and pasta imports but exclude flour exports and pasta exports c/ FAS/Seoul forecast 1/ KOFMIA members 2/ non- KOFMIA member
Korea: Monthly Wheat Use
(1,000 MT)
Month Feed Wheat Milling Wheat a/
MY 2012/13 MY 2013/14 MY 2012/13 MY 2013/14
July 260 235 178 168
August 261 219 190 168
September 268 226 187 168
October 277 245 197 182
November 268 205 200 182
December 244 159 200 182
Sub Total 1,578 1,289 1,152 1,050
January 199 Na 175 Na
Rice, Milled
Corn
Wheat Seoul

February 176 Na 175 Na
March 199 Na 175 Na
April 215 Na 154 Na
May 228 Na 154 Na
June 222 Na 154 Na
Total 2,817 Na 2,139 Na
Source: KFA and KOFMIA
a/ includes wheat flour exports, but excludes the portion used in soy-sauce production
Wheat Trade: MY 2013/14 wheat imports are expected to decrease to 4.1 million tons, down 400,000 tons from the previous forecast due
to decreased contracts of feed grade wheat which are less competitive than feed corn since November 2013 arrival in Korea.
According to trade and sales contract data of optional origin, around 1.4 million tons were contracted with delivery for
MY2013/14. Feed millers expect to make small amounts of feed wheat contracts possible under the current price structure
between feed corn and wheat. Latest contracts showed that feed wheat price was US$ 50-60 per ton higher than feed corn
price.
Korea: Wheat Imports (1,000 MT, Customs Cleared Basis)
Marketing Year (July/June)
Feed Wheat Milling Wheat Flour Imports 1/
Pasta Import 1/
Total
05/06 1,536 2,220 41 101 3,898
06/07 976 2,298 69 108 3,451
07/08 565 2,317 105 117 3,104
08/09 1,151 2,058 69 105 3,383
09/10 2,164 2,071 127 119 4,481
10/11 2,075 2,520 63 123 4,781
11/12 2,868 2,169 42 122 5,201
12/13 2,820 2,461 39 135 5,455
13/142/ 1,700 2,200 40 140 4,080
Source: Korea Customs Service 1/ Wheat basis 2/ FAS/Seoul forecast
Korea: MY 20013/14 Monthly Wheat Imports by Origin
(1,000 MT, based on Customs Clearance)
Country U. S. Australia Canada India Other Total
Milling Wheat
2013 July 56 21 0 0 0 77
August 165 88 6 0 0 259
September 70 17 4 0 0 91
October 97 96 41 0 0 234
November 45 84 0 0 0 129
December 119 119 28 0 0 267
Total(Jul-Sep) 2013 552 425 79 0 0 1,057
Total(Jul-Sep) 2012 618 540 102 0 0 1,261
Feed Wheat
2013 July 0 0 44 158 46a/ 249
August 0 0 12 37 114b/ 163

September 0 0 0 1 197 c/ 198
October 0 0 0 0 316 d/ 316
November 0 0 0 0 161 e/ 161
December 0 0 0 0 120 f/ 120
Total(Jul-Sep) 2013 0 0 56 196 954 1,207
Total(Jul-Sep) 2012 200 719 68 505 102 1,594
Total Wheat
2013 July 56 21 44 158 46 326
August 165 88 18 37 114 422
September 70 17 4 1 197 289
October 97 96 41 0 316 550
November 45 84 0 0 161 290
December 119 119 28 0 120 387
Total(Jul-Sep) 2013 552 425 135 196 954 2,264
Total(Jul-Sep) 2012 818 1,259 170 504 102 2,855 Source: Korea Customs Service a/ Turkey (46,107 MT) b/ Turkey (2,974 MT); Romania (110,762 MT) c/ Bulgaria (10,700 MT); Romania (186,801 MT) d/ Ukraine (59,361); Romania (195,281); Bulgaria (61,739) e/ Ukraine (15,589); Russia (60,248); Romania (50,312); Bulgaria (34,947) f/ Ukraine (23,315); Russia (11,812); Romania (25,020); Bulgaria (59,958)
Korea: MY 2013/14 Feed Wheat Contracts by
Estimated Time of Arrival (ETA) (Unit: 1,000 MT, as of Jan. 2014)
ETA Quantity Price (US$/MT)1/
Jul. 2013 110 303
Aug. 285 291
Sep. 234 282
Oct. 165 272
Nov. 235 264
Dec 55 284
Jan. 2014 55 301
Feb. 65 301
Mar. 65 295
Apr. 0 0
May 0 0
Jun 110 304
Total 1,379
Source: Local Grain Traders
1/ CNF on Weighted Average
Production, Supply and Demand Data Statistics:
Wheat PS&D
Wheat
Korea, Republic 2011/2012 2012/2013 2013/2014
of
Market Year
Begin: Jul 2011 Market Year
Begin: Jul 2012 Market Year
Begin: May 2013
USDA
Official New
Post USDA
Official New
Post USDA
Official New
Post
Area Harvested 13 13 9 9 7 7 (1000 HA)
Beginning Stocks 1,473 1,473 1,393 1,357 1,529 1,460 (1000
MT)
Production 44 44 37 37 30 30 (1000
MT)
MY Imports 5,188 5,201 5,439 5,455 4,500 4,100 (1000
MT)
TY Imports 5,188 5,201 5,439 5,455 4,500 4,100 (1000
MT)
TY Imp. from U.S. 2,134 2,047 1,312 1,407 0 1,300 (1000
MT)
Total Supply 6,705 6,718 6,869 6,849 6,059 5,590 (1000
MT)
MY Exports 131 180 144 192 125 200 (1000
MT)
TY Exports 131 180 144 192 125 200 (1000
MT)
Feed and Residual 2,870 2,870 2,817 2,818 2,300 1,900 (1000
MT)
FSI Consumption 2,311 2,311 2,379 2,379 2,444 2,444 (1000
MT)
Total Consumption 5,181 5,181 5,196 5,197 4,744 4,344 (1000
MT)
Ending Stocks 1,393 1,357 1,529 1,460 1,190 1,046 (1000
MT)
Total Distribution 6,705 6,718 6,869 6,849 6,059 5,590 (1000
MT)
Yield 3. 3.3846 4. 4.1111 4. 4.2857 (MT/HA)
TS=TD 0 0 0
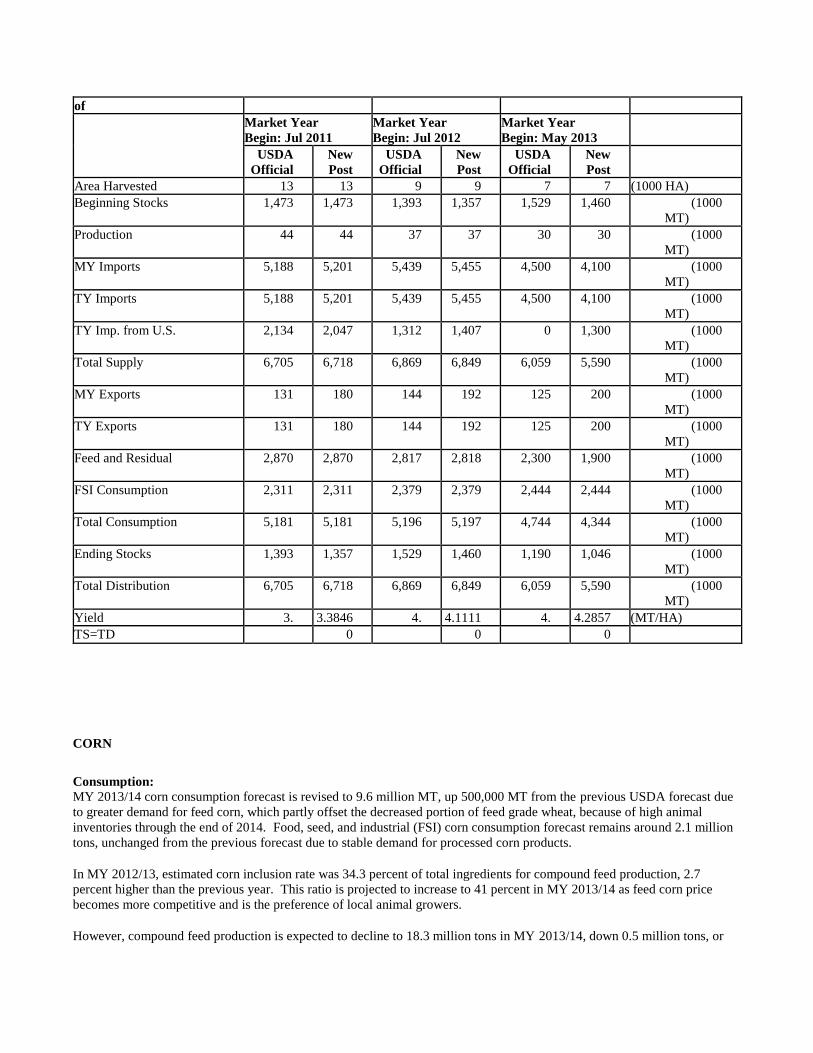
CORN Consumption: MY 2013/14 corn consumption forecast is revised to 9.6 million MT, up 500,000 MT from the previous USDA forecast due
to greater demand for feed corn, which partly offset the decreased portion of feed grade wheat, because of high animal
inventories through the end of 2014. Food, seed, and industrial (FSI) corn consumption forecast remains around 2.1 million
tons, unchanged from the previous forecast due to stable demand for processed corn products.
In MY 2012/13, estimated corn inclusion rate was 34.3 percent of total ingredients for compound feed production, 2.7
percent higher than the previous year. This ratio is projected to increase to 41 percent in MY 2013/14 as feed corn price
becomes more competitive and is the preference of local animal growers.
However, compound feed production is expected to decline to 18.3 million tons in MY 2013/14, down 0.5 million tons, or

declining three percent from the previous year due to animal growers’ continued efforts to reduce animal inventories to
combat bearish trends in domestic meat prices resulting from strong animal inventories in CY 2013. However, Korean
animal growers are expected to slow the pace of reduction in animal inventories amid a downtrend in compound feed prices
caused by raw ingredients.
Major corn processors have continued using non-GM corn imported from Serbia, Hungary and Brazil for food. For
industrial purposes, GM corn imported from the United States is primarily used. Many food processing companies are
reluctant to use ingredients sourced from biotech corn.
Korea: Total Corn Utilization (Oct./Sept., 1,000 MT)
Marketing Year
Feed Processing a/
Food b/
Total
2008/09 6,368 1,418 108 7,894
2009/10 6,362 1,928 92 8,382
2010/11 6,074 2,051 89 8,214
2011/12 5,690 2,036 89 7,815
2012/13 6,483 1,836 98 8,417
2013/14 c/ 7,500 2,000 100 9,600
Source: Korea Feed Association (KFA), Korea Corn Processing Industry Association (KOCPIA) a/ Used for wet and dry milling process based on imported corn. b/ For on-farm human consumption (on-the-cob) or snack food consumed on-the-cob, as puffed kernels or as corn tea. Imported white corn for popping has been
included since MY 2004. c/ FAS Seoul forecast
Korea: Monthly Corn Use (1,000 MT)
Month Feed Corn Processing Corn
MY 2012/13 MY 2013/14 MY 2012/13 MY 20133/14
October 508 558 168 169
November 512 596 162 158
December 559 687 154 157
S. Total (Oct-Dec) 1,579 1,841 484 484
January 580 na 152 na
February 513 na 137 na
March 533 na 134 na
April 572 na 152 na
May 574 na 155 na
June 522 na 148 na
July 553 na 167 na
August 528 na 158 na
September 529 na 150 na
Total 6,483 na 1,836 na Source: Korea Feed Association (KFA), Korea Corn Processing Industry Association (KOCPIA)
Korea: Feed Ingredient Use for Compound Feed Production (October/September, 1,000 MT)
Items MY 2010/11 MY 2011/12 MY 2012/13a/ MY 2013/14
a/
Sub. Total Grains and Grain Substitutes 10,935 11,569 12,115 12,000
- Wheat 2,100 3,065 2,710 2,200
- Corn 6,073 5,690 6,483 7,000

- Other Grains and Grain Substitute b/ 2,762 2,814 2,992 2,800
Others c/ 6,052 6,431 6,698 6,300
Grand Total 16,987 18,000 18,883 18,300 Source: Korea Feed Association (KFA) a/ FAS Seoul forecast b/ includes Tapioca, bran and gluten feed. c/ includes vegetable protein meal, animal protein, minerals/additives, tallow, DDGS and molasses.
Korea: Compound Feed Production by Species (October/September, 1,000 MT)
Species MY 2010/11 MY 2011/12 MY 2012/13a/ MY 2013/14
b/
Poultry 4,744 4,821 4,726 4,800
Swine 4,738 5,322 6,100 5,800
Cattle 6,116 6,321 6,572 6,300
Others d/ 1,367 1,477 1,483 1,400
Total 16,965 17,940 18,881 18,300
Source: Ministry for Agriculture, Food, and Rural Affairs (MAFRA) a/ Preliminary b/ FAS/Seoul forecast based on the first eleven months data d/ include ducks, pet food, rabbit, horse, sheep, deer, quail etc
Korea: Feed Ingredients Use for MY2011-MY2012 (1,000 MT, October/September)
INGREDIENT MY2011/2012 MY2012/2013
TOTAL DOM 1/ % TOTAL DOM
1/ %
GRAINS:
CORN 5,690 - 31.6 6,483 - 34.3
SORGHUM - - - - - -
WHEAT 3,065 - 17.0 2,710 - 14.4
BARLEY 27 2 0.2 31 3 0.2
RYE 1 1 0.0 1 1 -
OATS 3 2 0.0 2 1 -
GSP/BROKEN GRAIN 73 73 0.4 88 85 0.5
TAPIOCA 353 - 2.0 383 - 2.0
LUPIN SEED 165 20 0.9 143 13 0.8
OTHERS 184 173 1.0 182 177 1.0
SUB TOTAL 9,561 271 53.1 10,023 280 53.1
GRAIN BY-PRODUCTS:
WHEAT BRAN 658 412 3.7 611 392 3.2
RICE BRAN 186 186 1.0 205 205 1.1
BARLEY BRAN - - - - - -
CORN BRAN - - - 1 1 -
GLUTEN FEED 825 400 4.6 972 428 5.1
OTHERS 339 296 1.9 373 277 2.0
SUB TOTAL 2,008 1,294 11.2 2,162 1,303 11.4
ANIMAL PROTEIN:
FISH MEAL 20 15 0.1 22 16 0.1
MEAT & BONE MEAL 17 17 0.1 20 20 0.1
OTHERS 113 111 0.6 140 137 0.7
SUB TOTAL 150 143 0.8 182 173 1.0
VEGETABLE PROTEIN:

SOYBEAN MEAL 2,053 518 11.4 1,986 445 10.5
RAPESEED MEAL 419 2 2.3 412 7 2.2
SESAMESEED MEAL 22 22 0.1 23 23 0.1
PERILLA SEED MEAL 4 4 0.0 3 3 -
CORN GLUTEN MEAL 87 69 0.5 83 78 0.4
DDGS 484 127 2.7 457 135 2.4
COTTONSEED MEAL 6 - 0.0 7 1 -
PARM KERNEL MEAL 734 34 4.1 782 18 4.1
COPRA MEAL 427 9 2.4 602 5 3.2
OTHERS 215 192 1.2 268 191 1.4
SUB TOTAL 4,451 977 24.7 4,623 906 24.5
ADDITIVES/MINERALS:
CALCIUM PHOSPHATE 68 50 0.4 69 53 0.4
LIMESTONE 464 464 2.6 471 471 2.5
SALT 66 65 0.4 69 68 0.4
OTHER 260 258 1.4 282 281 1.5
SUB TOTAL 858 837 4.8 891 873 4.7
OTHER INGREDIENTS:
TALLOW 328 305 1.8 320 305 1.7
MOLASSES 451 380 2.5 476 390 2.5
UREA 0 0 0.0 1 1 -
OTHER 193 173 1.1 205 181 1.1
SUB TOTAL 972 858 5.4 1,002 877 5.3
GRAND TOTAL 18,000 4,380 100.0 18,883 4,412 100.0 Source: Korea Feed Association (KFA) 1/ Domestic Products Trade: MY 2013/14 corn import forecast is revised to 9.5 million MT, up 500,000 tons from the previous forecast due to increased
feed corn imports that may offset the limited feed grade wheat supply as feed corn prices become more attractive than feed
wheat. Feed wheat imports are expected to slow in the first half of CY 2014.
As of the end of November 2013, importers contracted 5.8 million tons of corn for October 2013 through May 2014
deliveries. Most of the contracted purchases for feed corn to date are optional origin at seller’s option from South American
countries, Eastern Europe and the United States with a price range of $237-273 per metric ton CNF, while corn processors
have contracted for No. 2 GM/non-GM yellow corn from South America and conventional corn from Eastern Europe with a
price range of $237-280 per metric ton CNF. Most recent buying contracts were stabilized in a range of $236-246 per ton
CNF for feed corn and $ 255-270 for processing corn.
In MY 2013/14, U.S. corn exports to Korea are revised to increase to 3 million tons, up one million tons from post’s previous
forecast due to greater supply of competitively priced U.S. corn. As of late November 2013, Korean buyers completed corn
contracts delivering in the first seven months of the current marketing year, about 5.8 million tons. Most of the contracted
purchases to date were for worldwide origins including South America, Eastern Europe and the United States at seller’s
option. Grain traders predicted that most of the contracts would be shipped from the United States for March 2014 arrival in
Korea at earliest. However, favorable prices resulted in shipments arriving in December 2013.
Korea: Corn Imports (1,000MT, Customs Cleared Basis)
Marketing Year From World From the U. S. U. S. Share
Feed Processing Total Feed Processing Total %
07/08 7,680 1,629 9,309 7,259 1,077 8,336 90
08/09 5,781 1,431 7,212 4,883 921 5,804 80

09/10 6,457 2,003 8,460 6,097 1,407 7,504 89
10/11 6,060 2,047 8,107 5,183 1,133 6,316 78
11/12 5,600 2,035 7,635 3,450 307 3,757 49
12/13 6,230 1,944 8,174 341 115 456 6
13/14a/ 7,500 2,000 9,500 2,500 500 3,000 32
Source: Korea Customs Service a/ FAS/Seoul forecast
Korea: Monthly Corn Import (1,000 MT, Customs Cleared Basis)
Month Feed Corn Processing Corn
MY 2012/13 MY 2013/14 MY 2012/13 MY 2013/14
October 460 620 103 130
November 470 631 235 178
December 706 975 242 222
S. Total (Oct-Dec) 1,636 2,226 580 530
January 689 na 149 na
February 492 na 111 na
March 489 na 185 na
April 528 na 119 na
May 533 na 175 na
June 407 na 285 na
July 674 na 85 na
August 287 na 127 na
September 495 na 127 na
Total 6,230 na 1,944 na Source: Korea Customs Service Korea: MY 2013/14 Corn Contracts by Estimated Time of Arrival (ETA)
(Unit: 1,000 MT, as of January 2014)
ETA U.S. Europe SOAM Others 1/ Total Price
2/
Oct. 2013 0 0 55 468 523 273
Nov. 0 110 55 728 893 266
Dec. 0 0 129 664 793 245
Jan. 2014 125 0 134 829 1,088 242
Feb. 55 0 0 642 697 237
Mar. 567 168 0 243 978 245
Apr. 312 60 0 231 603 241
May 176 0 0 70 246 243
Total 1,235 338 373 3,875 5,821 Source: Local Grain Traders 1/ optional origins at seller’s option out of USA, SOAM, Europe or South Africa 2/ US$/MT, CNF on Weighted Average
Production, Supply and Demand Data Statistics:
Corn PS&D
Corn
Korea, Republic
of 2011/2012 2012/2013 2013/2014
Market Year
Begin: Oct 2011 Market Year
Begin: Oct 2012 Market Year
Begin: Oct 2012

USDA
Official New
Post USDA
Official New
Post USDA
Official New
Post
Area Harvested 16 16 17 17 17 17 (1000 HA)
Beginning Stocks 1,589 1,589 1,484 1,483 1,357 1,323 (1000 MT)
Production 74 74 83 83 83 83 (1000 MT)
MY Imports 7,636 7,635 8,174 8,174 9,000 9,500 (1000 MT)
TY Imports 7,636 7,635 8,174 8,174 9,000 9,500 (1000 MT)
TY Imp. from U.S. 3,190 3,757 296 456 0 3,000 (1000 MT)
Total Supply 9,299 9,298 9,741 9,740 10,440 10,906 (1000 MT)
MY Exports 0 0 0 0 0 0 (1000 MT)
TY Exports 0 0 0 0 0 0 (1000 MT)
Feed and Residual 5,690 5,690 6,450 6,483 7,000 7,500 (1000 MT)
FSI Consumption 2,125 2,125 1,934 1,934 2,100 2,100 (1000 MT)
Total Consumption 7,815 7,815 8,384 8,417 9,100 9,600 (1000 MT)
Ending Stocks 1,484 1,483 1,357 1,323 1,340 1,306 (1000 MT)
Total Distribution 9,299 9,298 9,741 9,740 10,440 10,906 (1000 MT)
Yield 5. 4.625 5. 4.8824 5. 4.8824 (MT/HA)
TS=TD 0 0 0
Korea: Animal Inventory
(1,000 Head, 1,000 Birds, as of Jan. 2014)
Animal Year March June September December
Beef Cattle 2010 2,706 2,889 2,949 2,915
2011 2,881 3,053 3,044 2,950
2012 2,940 3,109 3,143 3,059
2013 2,966 3,064 3,043 2,883d/
2014 2,772 na na na
Dairy Cattle 2010 449 432 429 430
2011 396 403 404 404
2012 404 410 417 420
2013 420 419 422 423-425d/
2014 423-425d/ na na na
Swine a/ 2010 9,768 9,728 9,901 9,881
2011 7,036 7,330 7,783 8,171
2012 8,852 9,432 9,937 9,916
2013 10,107 10,181 10,188 9,700-9800d/
2014 9,100-9,300d/ 9,200-9,400d/ na na
Layer b/ 2009 60,240 61,140 61,998 62,967
2010 62,524 61,586 60,095 61,700
2011 61,025 60,723 61,212 62,425
2012 63,200 61,953 61,326 61,344
2013 62,340 60,610 62,674 64,090d/
Broiler c/ 2009 68,690 99,983 68,123 67,194

2010 72,692 101,690 71,271 77,871
2011 69,932 110,122 71,038 76,435
2012 69,387 97,750 68,540 76,130
2013 71,130 94,660 64,505 78,550d/ Source: Korea Statistics (KOSTAT) and Korea Rural Economic Institute (KREI) a/ includes 864,000 heads of statistical difference between FAS/Seoul and Korean government until CY 2010. b/ Excluding breeders. c/ Excluding multi-use broilers. d/ KREI forecast
RICE
PRODUCTION
No change from the previous report.
CONSUMPTION Korea’s rice consumption pattern remains unchanged from the previous forecast.
TRADE In MY 2013/14, rice imports remain unchanged from the previous forecast at 410,000 metric tons as the Korean government
will try to deliver the 2014 Minimum Market Access (MMA) commitment within the corresponding calendar year prior to
graduating the regime of Minimum Market Access (MMA) under WTO. U.S. rice exports are expected to stay around
140,000 MT forecast by the 2014 MMA purchasing plan released by Korean government.
In MY 2012/13, Korea’s rice imports reached 510,106 MT, consisting of 243,751 MT imported under 2012 MMA quota and
266,355 MT imported under 2013 MMA quota, respectively. U.S. exports to Korea were at 175,507 MT, which are
composed of 71,677 MT imported under 2012 MMA quota and 103,830 MT imported under 2013 MMA quota,
respectively.
2014 MMA Purchasing plan: Under the 2014 Minimum Market Access (MMA) purchasing plan, Korea will purchase 408,700 MT of rice (milled basis),
up 20,347 MT or about 5 percent up from last year, comprised of 203,472 MT under the global quota (GQ) and several
country specific quotas (CSQ) totaling 205,228 MT.
The United States is expected to command 120,000 to 130,000 MT, or roughly 29- 32 percent of the total MMA volume.
The anticipated U.S. share is calculated by adding the 43,270 MT allocated to medium grain and some portion of optional
varieties allocated under GQ to the 50,076 MT of U.S. CSQ. Please refer to GAIN report KS1404 (2014 MMA Rice Purchasing Plan) for more details.
The 2014 U.S. CSQ, totaling 50,076 MT, consists of 44,507 MT of table rice and 5,569 MT for processing. The U.S. table
rice allocation of 44,507 MT compares to 42,291 MT in 2013, a 5 percent increase from the previous year in response to a
greater demand for U.S. medium grain in the Korean consumer market.
The Korean government allocated 21,090 MT of optional variety between medium and short grain milled rice for table
purpose under the 2014 global quota, which offset the decrease in table rice under the Chinese CSQ. This creates an
opportunity for U.S. bidders to sell additional table rice to Korean consumer markets.
Korea: Rice Quota Allocation for Buying Tenders under 2014 MMA
(Unit : M/T, milled rice basis)
Item Type
Allocation by Grade
Non Table rice
Table rice
USDA No.1 USDA No.3 Total
CSQ China (116,159) Short 67,851 28,985 19,323 48,308

(205,228) US (50,076) Medium 5,569 40,056 4,451 44,507
Thailand (29,963) Long 26,653 3,310 0 3,310
Australia (9,030) Medium 3,635 2,697 2,698 5,395
Total 103,708 75,048 26,472 101,520
MFN (203,472)
(Short) 46,612; (Medium) 43,270; (Long) 20,000; (Short/Medium) 61,090a/; (Broken Rice) 32,500
a/ Optional Variety between medium and short grain consisting of 40,000 MT for processing purpose and 21,090 MT for table purpose, which
consists of 18,980 MT of USDA No. 1 and 2,110 MT of USDA No. 3. Source: Ministry for Agriculture, Food, and Rural Affairs (MAFRA) and Korea Agro-Fisheries and Food Trade Corporation (aT) 2013 MMA Tendering Results: Korea's contracts for rice imports under the 2013 WTO Minimum Market Access (MMA) system expanded market access
opportunity for U.S. rice suppliers. Korea purchased a total of 388,353 metric tons (MT) of rice from the United States,
China, Thailand, Australia, Vietnam and India. The U.S. share was 30 percent, with contracts totaling 114,600 MT (milled)
worth US$89 million. In addition to the U.S Country Specific Quota of 50,076 MT, the United States successfully
contracted 64,524 or 34.3 percent of the total Global Quota (GQ) of 188,251 MT. Please refer to GAIN report KS1401 for
more details.
Korea: Rice Contracts by Country under 2013 MMA (Unit: MT, Milled Basis, as of October 18, 2013)
Country
Global Quota CSQ
Total (%) Processing Table Processing Table
USA 39,398 25,126b/ 7,785 42,291 114,600 (29.5)
China 35,280 0 70,217 45,942 151,439 (39.0)
Thailand 25,20 0 0 26,817 3,146a/ 55,163 (14.2)
Australia 19,447 0 3,904 0 23,351 (6.0)
Vietnam 13,800 0 0 0 13,800 (3.6)
India 30,000 0 0 0 30,000 (7.7)
S.Total 163,125 25,126 108,723 91,379 388,353(100)
G. Total 188,251 200,102 388,353(100) Source: Korea Agro-Fisheries and Food Trade Corporation (aT) a/ include 90 MT of aroma rice (Hom Mali variety) b/ include 5,126 MT of Australian CSQ that were converted to global quota after getting through three times of unsuccessful trials in biddings
Korea: U.S. Rice Sales to Korea under 2013 MMA
Contracts Quota Milled rice(MT)
for Table Brown rice(MT)
for Processing Arrival unit price Amount ETA
USDA #1 USDA #3 ($/MT) ($) 2013
1 CSQ 7,000 736.00 5,152,000 March-May
2 CSQ 7,000 711.76 4,982,320 March-May
3 CSQ 6,000 750.45 4,502,700 March-May
4 CSQ 4,229a/ 739.53 3,127,472 July
5 GQ 6,000 762.40 4,574,400 May-July
6 CSQ 9,062 791.68 7,174,204 July
7 GQ 6,000 787.28 4,723,680 July
8 CSQ 8,650 703.99 6,089,514 August
9 GQ 8,664 712.63 6,174,226 August
10 GQ 6,000 795.24 4,771,440 September
11 CSQ 9,000 797.24 7,175,160 September
12 GQ 11,111 711.98 7,910,810 August
13 GQ 9,000 686.21 6,175,890 October
14 GQ 2,000a/ 760.43 1,520,860 October
15 GQ 15,000 731.12 10,966,800 December

16 GQ 5,126 734.70 3,766,072 December
total 67,417 52,425b/ 88,787,548
Source: Korea Agro-Fisheries and Food Trade Corporation (aT), totaling 114,600 MT in milled basis or 29.5 percent of total 2013 MMA. a/ USDA #3 b/ equivalent to 47,183 MT, milled basis
Korea: U.S. Table Rice Delivery Schedule Based on Contracts under 2013 MMA (Non-Glutinous Milled Rice Medium Grain, Metric Ton)
Supplier Contractual Quantity Grade Shipment ETA Busan Port
ADM 7,000 U.S. No. 1 3,000 March 2013
2,000 April 2013
2,000 May 2013
FRC 7,000 3,000 March 2013
2,000 April 2013
2,000 May 2013
ACC 6,000 2,000 March 2013
2,000 April 2013
2,000 May 2013
Sun Valley 4,229 U.S. No. 3 4,229 July 2013
ACC 6,000 U.S. No. 1 2,000 May 2013
2,000 June 2013
2,000 July 2013
FRC 9,062 9,062 by July 2013
ADM 6,000 6,000 by July 2013
ADM 6,000 6,000 by September 2013
ADM 9,000 9,000 by September 2013
ACC 2,000 U.S. No. 3 2,000 by October 2013
ACC 5,126 U.S. No. 1 5,126 by December 2013
Total 67,417 Source: Korea Agro-Fishery Trade Corporation (aT)
Auctions for Imported Table Rice: Korea Agro-Fisheries & Food Trade Corporation (aT) sells table rice shipments through a public auction system, while the
Ministry of Agriculture, Food and Rural Affairs (MAFRA) distributes processing rice to end-users such as food processors
and alcoholic beverage producers at a set price throughout the year.
In response to favorable consumer confidence in U.S. medium grain milled rice, aT has continued selling U.S. medium grain
rice for both USDA No. 1 and No. 3 grades under the 2013 CSQ contracted to deliver from March through December 2013.
The progress of auctioning for other origins has been comparably slow. Auctions for Chinese milled rice under 2013 CSQ
started off in the middle of December 2013 after completing 2012 CSQ in November 2013. Auctions for Thai milled rice are
still pending under the 2012 MMA.
Korea: Status of Rice Auction for Table Rice under 2013 CSQ (Unit: metric tons, milled basis, as of January 17, 2014)
Commodity USDA Grade Total Table Rice CSQ
Auctioned Off Balance Percentage
Auctioned Off (%)
U.S. Medium Grain #1 61,188 24,745 36,443 40
#3 6,229 1,968 4,261 32
Chinese Short Grain #1 27,565 389 27,176 1
#3 18,377 3,299 15,075 18
Thai Long Grain #1 3,146 0 3,146 na
Total 116,505 30,401 86,101 26 Source: Korea Agro-Fisheries and Food Trade Corporation (aT)

Korea: Status of Rice Auction for Table Rice under 2012 CSQ (Unit: metric tons, milled basis, as of October 11, 2013)
Commodity USDA
Grade Total Table Rice CSQ Auctioned Off Balance
Percentage
Auctioned Off (%)
U.S. Medium Grain #1 36,050 36,050 0 100 (as of May 3, 2013)
#3 4,006 3,997 9 100 (as of Jan. 9, 2013)
Chinese Short Grain #1 37,492 37,492 0 100 (as of Sep. 25, 2013)
#3 24,995 24,897 98 100(as of Nov. 18, 2013)
Thai Long Grain #1 3,000 921 2,079 31
Australian Medium Grain #1 2,429 2,429 0 100(as of Dec. 6, 2013)
#3 2,429 2,429 0 100( as of Dec. 6, 2013)
Total 110,401 108,215 2,186 98 Source: Korea Agro-Fisheries and Food Trade Corporation (aT)
Korea: Auctioned-Off Prices of Imported Table Rice (Unit: Korean Won per Kg on Average)
Auctioning-off Period
U.S. Medium
Grain Chinese Short Grain
(Medium Grain) Thai Long
Grain Australian Medium
Grain
#1 #3 #1 #3 #1 #1 #3
April-September 2006 (2005 MMA) 1,138 991 1,274 1,133 555
none none
March-August 2007 (2006 MMA) 1,363 1,211 1,357 1,303 953
none none
February-August 2008 (2007 MMA) 1,542 1,510 1,487 1,558 1,132
none none
February2009 -May 2010 (2008 MMA) 1,160 994
1,125 (1,100) none 1,329
none none
February 2010-March 2011 (2009 MMA) 970 881
914 (850) 893 672
none none
April 2011-January 2012 (2010 MMA) 913 1,074
a/ 707 612 518 none none
December 2011- October 8,
2013 (2011MMA) 1,258 1,452 1,297 1,501 (802c/) 944
none none
August 2012- January 17,
2013 (2012 MMA) 1,677 1,634 1,378 1,374 902
b/ 1,299 1,128
July 2013- January 17, 2014 (2013 MMA) 1,612
b/ 1,472b/ 1,567
b/ 1,494b/ na none none
Source: Korea Agro-Fisheries and Food Trade Corporation (aT) a/ Auctioned-off during October-December 2011 b/ ongoing c/ #3 Production, Supply and Demand Data Statistics:
Rice PS&D
Rice, Milled
Korea, Republic
of 2011/2012 2012/2013 2013/2014
Market Year
Begin: Nov 2011 Market Year
Begin: Nov 2012 Market Year
Begin: May 2013
USDA New USDA New USDA New

Official Post Official Post Official Post
Area Harvested 854 854 849 849 833 833 (1000 HA)
Beginning Stocks 1,034 1,034 730 730 722 632 (1000
MT)
Milled Production 4,224 4,224 4,006 4,006 4,230 4,230 (1000
MT)
Rough Production 5,616 5,616 5,405 5,405 5,632 5,632 (1000
MT)
Milling Rate (.9999) 7,522 7,522 7,412 7,412 7,511 7,511 (1000
MT)
MY Imports 380 380 510 510 410 410 (1000
MT)
TY Imports 238 238 600 553 410 445 (1000
MT)
TY Imp. from U.S. 70 63 0 175 0 140 (1000
MT)
Total Supply 5,638 5,638 5,246 5,246 5,362 5,272 (1000
MT)
MY Exports 3 3 2 2 2 2 (1000
MT)
TY Exports 2 2 2 2 2 2 (1000
MT)
Consumption and
Residual 4,905 4,905 4,522 4,612 4,497 4,497 (1000
MT)
Ending Stocks 730 730 722 632 863 773 (1000
MT)
Total Distribution 5,638 5,638 5,246 5,246 5,362 5,272 (1000
MT)
Yield (Rough) 7. 6.5761 6. 6.3663 7. 6.7611 (MT/HA)
TS=TD 0 0 0
Appendix
Korea: MMA Rice Allocations by Bidding Results
(MT, Milled rice)
Calendar Year Total Global Quota Country Specific Quota (CSQs)
Total USA China Thailand Australia
2005 225,575 20,347 205,228 50,076 116,159 29,963 9,030
2006 245,922 49,724 196,198 50,076 116,159 29,963 a/
2007 266,270 70,072 196,198 50,076 116,159 29,963 a/
2008 286,617 90,419 196,198 50,076 116,159 29,963 a/
2009 306,964 110,766 196,198 50,076 116,159 29,963 a/
2010 327,311 135,613 191,698 45,576b/ 116,159 29,963 a/
2011 347,658 151,460 196,198 50,076 116,159 29,963 a/
2012 368,006 216,450 151,556 50,076 62,487c/ 29,963 9,030
2013 388,353 188,251 200,102 50,076 116,159 29,963 3,904d/
2014 e/ 408,700 203,472 205,228 50,076 116,159 29,963 9,030
Source: MAFRA and Korea Agro-Fisheries and Food Trade Corporation (aT) a/ Australia CSQ allocation converted to MFN due inability to fulfill quota. b/ 4,500 MT were converted to global quota from CSQ that got through three times of unsuccessful trials in biddings.

c/ 53,672 MT were converted to global quota from CSQ that got through three times of unsuccessful trials in biddings. d/ 5,126 MT were converted to global quota from CSQ that got through three times of unsuccessful trials in biddings e/ plan
Korea: Global Quota Allocation per Country on the Buying Tender (Milled basis, MT, as of December 13, 2013)
Calendar Year MMA Quota U.S.A. China Thailand Australia Others
2005 20,347 6,104 11,191 3,052 0 0
2006 49,724 13,025 23,080 13,619 0 0
2007 70,072 21,643 32,352 16,077 0 0
2008 90,419 19,534 35,126 35,759 0 0
2009 110,766 31,270 43,629 30,347 0 5,520a/
2010 135,613 48,143 42,411 40,347 0 4,712a/
2011 151,460 51,414 44,911 20,694 0 34,441b/
2012 216,450 50,825 103,583 0 0 62,042c/
2013 188,251 64,524 35,280 25,200 19,447 43,800d/
Total 1,033,102 306,482 371,563 185,095 19,447 150,515 Source: FAS/Seoul a/ Pakistan b/ Vietnam (19,441 MT) and Myanmar (15,000 MT) c/ Vietnam (45,400 MT),India (11,642 MT) and Myanmar (5,000MT) d/ Vietnam (13,800MT) and India (30,000MT)
Korea: Import Schedule of Table Rice (MT, Milled Rice)
Calendar Year Total Table Purpose Rate of Table Rice (%)
2005 225,575 22,557 10
2006 245,922 34,429 14
2007 266,270 47,928 18
2008 286,617 63,055a/ 22
2009 306,964 79,810b/ 26
2010 327,311 98,193c/ 30
2011 347,658 104,297 30
2012 368,006 110,401 30
2013 388,353 116,505 30
2014 408,700 122,610 30 Source: Ministry of Food, Agriculture, Forestry & Fisheries (MIFAFF) a/ Of them, 24,934MT of Chinese rice was diverted to alcohol processing purpose in CY2010 b/ Of them, 33,303 MT of Chinese rice and 1,500 MT of Thai rice were diverted to alcohol processing purpose in CY2011 c/ Of them, 5,671MT of Chinese rice were diverted to alcohol processing purpose in CY2012.
Korea: Monthly Wholesale Price of Milled Rice (High Quality)
Month\Year CY 2011 CY 2012 CY 2013
Won/Kg US$/Kg Won/Kg US$/Kg Won/Kg US$/Kg
January 1,764 1.58 2,090 1.83 2,200 2.07
February 1,794 1.60 2,099 1.87 2,200 2.03
March 1,873 1.67 2,100 1.87 2,204 2.00
April 1,938 1.79 2,100 1.85 2,210 1.97
May 1,950 1.80 2,100 1.82 2,213 2.00
June 1,950 1.81 2,100 1.80 2,220 1.96
July 1,950 1.84 2,100 1.84 2,220 1.97
August 1,950 1.82 2,098 1.85 2,220 1.99
September 1,950 1.74 2,090 1.86 2,220 2.05

October 2,022 1.74 2,113 1.91 2,222 2.09
November 2,051 1.76 2,195 2.02 2,183 2.15
December 2,076 1.81 2,200 2.04 2,180 2.06
Average 1,939 1.75 2,115 1.88 2,208 2.02 Source: Korea Agricultural Marketing Information Service (KAMIS) Note: Monthly Average Exchange Rate is applied.
Korea: Monthly Retail Price of Milled Rice (High Quality)
Month\Year CY 2011 CY 2012 CY 2013
Won/Kg US$/Kg Won/Kg US$/Kg Won/Kg US$/Kg
January 2,064 1.84 2,194 1.92 2,311 2.17
February 2,098 1.87 2,202 1.96 2,325 2.14
March 2,138 1.91 2,195 1.95 2,329 2.12
April 2,217 2.04 2,200 1.94 2,341 2.09
May 2,235 2.06 2,203 1.91 2,331 2.10
June 2,254 2.09 2,188 1.88 2,340 2.06
July 2,234 2.11 2,172 1.90 2,334 2.07
August 2,203 2.05 2,173 1.92 2,341 2.10
September 2,201 1.97 2,179 1.94 2,340 2.16
October 2,234 1.94 2,242 2.03 2,343 2.20
November 2,214 1.96 2,316 2.13 2,346 2.31
December 2,190 1.91 2,311 2.15 2,336 2.21
Average 2,190 1.98 2,214 1.96 2,335 2.13 Source: Korea Agricultural Marketing Information Service (KAMIS) Note: Monthly Average Exchange Rate is applied.
Korea: Foreign Exchange Rate (Korean Won against US$)
Month CY 2011 CY 2012 CY 2013
January 1,119 1,144 1,065
February 1,119 1,123 1,086
March 1,120 1,126 1,102
April 1,085 1,135 1,121
May 1,083 1,154 1,109
June 1,080 1,164 1,135
July 1,058 1,143 1,126
August 1,073 1,131 1,116
September 1,120 1,124 1,084
October 1,152 1,106 1,065
November 1,131 1,087 1,016
December 1,147 1,076 1,056
Average 1,107 1,127 1,094 Source: Global Financial Service