Knuckle-Walking Signal in the Manual Phalanges and ...
145
University of Massachuses Amherst ScholarWorks@UMass Amherst Open Access Dissertations 5-2013 Knuckle-Walking Signal in the Manual Phalanges and Metacarpals of the Great Apes (Pan and Gorilla) Stacey Ann Matarazzo University of Massachuses Amherst, [email protected] Follow this and additional works at: hps://scholarworks.umass.edu/open_access_dissertations Part of the Anthropology Commons is Open Access Dissertation is brought to you for free and open access by ScholarWorks@UMass Amherst. It has been accepted for inclusion in Open Access Dissertations by an authorized administrator of ScholarWorks@UMass Amherst. For more information, please contact [email protected]. Recommended Citation Matarazzo, Stacey Ann, "Knuckle-Walking Signal in the Manual Phalanges and Metacarpals of the Great Apes (Pan and Gorilla)" (2013). Open Access Dissertations. 755. hps://doi.org/10.7275/gcet-0n48 hps://scholarworks.umass.edu/open_access_dissertations/755
Transcript of Knuckle-Walking Signal in the Manual Phalanges and ...

University of Massachusetts AmherstScholarWorks@UMass Amherst
Open Access Dissertations
5-2013
Knuckle-Walking Signal in the Manual Phalangesand Metacarpals of the Great Apes (Pan andGorilla)Stacey Ann MatarazzoUniversity of Massachusetts Amherst, [email protected]
Follow this and additional works at: https://scholarworks.umass.edu/open_access_dissertations
Part of the Anthropology Commons
This Open Access Dissertation is brought to you for free and open access by ScholarWorks@UMass Amherst. It has been accepted for inclusion inOpen Access Dissertations by an authorized administrator of ScholarWorks@UMass Amherst. For more information, please [email protected].
Recommended CitationMatarazzo, Stacey Ann, "Knuckle-Walking Signal in the Manual Phalanges and Metacarpals of the Great Apes (Pan and Gorilla)"(2013). Open Access Dissertations. 755.https://doi.org/10.7275/gcet-0n48 https://scholarworks.umass.edu/open_access_dissertations/755

KNUCKLE-WALKING SIGNAL IN THE MANUAL PHALANGES AND
METACARPALS OF THE GREAT APES (PAN AND GORILLA)
A Dissertation Presented
By
STACEY ANN MATARAZZO
Submitted to the Graduate School of the University of Massachusetts Amherst in partial fulfillment
of the requirements for the degree of
DOCTOR OF PHILOSOPHY
May 2013
Anthropology

© Copyright by Stacey A. Matarazzo 2013
All Rights Reserved

KNUCKLE-WALKING SIGNAL IN THE MANUAL PHALANGES AND
METACARPALS OF THE GREAT APES (PAN AND GORILLA)
A Dissertation Presented
By
Stacey Ann Matarazzo
Approved as to style and content by: ______________________________________________ Laurie R. Godfrey, Chair ______________________________________________ Margery C. Coombs, Member ______________________________________________ Joseph Hamill, Member ______________________________________________ Brigitte Holt, Member _____________________________________________ Thomas Leatherman, Department Head Anthropology

iv
ACKNOWLEDGEMENTS
There are several people I must thank for their support over the many years that I
have been delving into the world of knuckle walking. At the University of
Massachusetts, Amherst, I must first and foremost thank my advisor Dr. Laurie Godfrey
for her support during my graduate studies and the many hours of guidance throughout
the analyses and writing of this manuscript. I also thank Drs. Margery Coombs, Brigitte
Holt, and Joseph Hamill, my wonderful PhD committee members for their guidance,
useful suggestions, and much needed words of encouragement. I am very grateful to
Michael Sutherland for his invaluable help with several statistical analyses, and to Drs.
Steven King and Marina Blanco for their assistance and moral support. I also thank
Kristen Alldredge, Cortni Borgerson, Gina Agostini and Sarah Reedy who provided
much needed sounding posts throughout the writing process.
I am also very much appreciative of the many people who have helped me at
museums and zoos throughout the data collection process. I owe thanks to Judith
Chupasko of the Museum of Comparative Zoology at Harvard University, Cambridge,
MA, Lawrence Heaney of the Field Museum, Chicago, IL (Department of Mammalogy),
Yohannes Haile-Selassie of the Cleveland Museum of Natural History, Cleveland, IL,
Nancy Simmons of American Museum of Natural History, New York (Department of
Mammalogy), and Linda Gordon of the National Museum of Natural History,
Washington DC (Department of Mammalogy) for access to their skeletal collections.
Special thanks to Fettah Kosar of the Harvard Center for Nanoscan Systems for his help

v
and training with the Micro CT scanner. I thank Dr. Daniel Povinelli and the staff of the
Cognitive Evolution Group (University of Louisiana, Lafayette) for access to and help
with the chimpanzee pressure data collection. And for the assistance with the gorilla
pressure data collection, I thank Fred Beall, Jeannine Jackle and the great trainers and
staff of the Franklin Park Zoo, Boston, MA, and Drs. Sue Margulis, Elizabeth Lonsdorf
and Stephen Ross, and Maureen Leahy, Dominic Calderisi and the wonderful keepers at
the Lincoln Park Zoo, Chicago, IL. I owe much thanks to the people at the LSB Leakey
and Wenner-Gren foundations who believed in and financially supported this research.
Lastly, I am much indebted to my family and friends whose infinite patience
during my graduate career did not go unnoticed or unappreciated. I thank my parents
Steven and Mary, my sister Caroline, and sister-in-law Donna for their loving support. I
thank my nieces and friends for keeping my happy and sane and reminding me that there
is more to life than hypothetical knuckle-walking hominins. I give a very special thanks
to my brother Steven for helping with the pressure data collection in Boston despite
having to deal with the noisy antics of two silverbacks who were rather perturbed at his
presence.

vi
ABSTRACT
KNUCKLE-WALKING SIGNAL IN THE MANUAL PHALANGES AND
METACARPALS OF THE GREAT APES (PAN AND GORILLA)
MAY 2013
STACEY ANN MATARAZZO, B.A., BOSTON UNIVERSITY
M.A., UNIVERSITY OF MASSACHUSETTS AMHERST
Ph.D., UNIVERSITY OF MASSACHUSETTS AMHERST
Directed by: Professor Laurie R. Godfrey
The “Knuckle-walking Hominin Hypothesis” postulates that there was a knuckle-
walking phase during the transition from quadrupedalism to bipedalism. To address this
question, previous research has focused on the search for a “signal” within the wrist, and
metacarpals of extant knuckle walkers that can be used to infer this locomotor pattern in
extinct hominins. To date, the examined features have not yielded a clear, non-contested
signal. I explore the Knuckle-walking Hominin Hypothesis in two ways: 1. by
examining the hand postures and the manual pressure application of Pan and Gorilla
during knuckle walking to determine whether there are species specific differences and 2.
by examining the internal and external morphology of the manual phalanges in an
attempt to isolate a clear “knuckle-walking signal”. Chimpanzees are more variable in
their preferred contact digits, and use both hand positions with equal frequency (“palm-
in” - palm facing toward the body and “palm-back” - palm facing posteriorly). In
contrast, gorillas consistently make contact with all four digits 2-5, maintain a pronated
arm, and use the palm-back hand position. In both taxa, hand position affects which digit
acts as the final touch-off element and therefore receives maximum pressure in a given

vii
step, and digit 5 receives significantly less pressure than the other rays. Gorillas are, in
effect, practicing a refined subset of the variety of knuckle-walking postures used by the
more arboreal chimpanzees.
A clear knuckle-walking signal is seen in both the external and internal
morphology of the phalanges. Chimpanzees and gorillas have the same middle
phalangeal curvature profile with the greatest curvature found in digit 5 (5 > 2 > 3 > 4),
the element that receives the least amount of pressure. This phalangeal curvature profile
is a feature not shared with any of the included taxa practicing different modes of
locomotion. They also have similar Indices of Relative Curvature (IRC-middle
phalangeal curvature/proximal phalangeal curvature) for digits 2-5 that clearly delineate
them with “flatter” middle phalanges and more curved proximal phalanges (IRCs =
~0.85), from quadrupeds with more curved middle than proximal phalanges (IRCs > 1),
and suspensory primates with higher and more equal curvature values for both elements
(IRCs = ~1). This ability to differentiate between locomotor groups holds if the IRCs
are composed of elements from different rays of the same manus and from elements of
different individuals. Within the trabecular bone structure, knuckle walkers are
differentiated from quadrupeds and suspsensory primates in 3 locations: the metacarpal
head, and the proximal ends of the middle and proximal phalanges. In particular, the
metacarpal head shows distinct differences between the groups: knuckle walkers have a
palmar-dorsal alignment of trabeculae and disc-like shape, suspensory taxa have a
proximodistal alignment and rod-like shape and quadrupeds have a proximodistal
alignment and disc-like shape. The ability to differentiate between locomotor categories

viii
using isolated zones increases the applicability of these signals to a fragmentary and
limited fossil record. The morphological similarities, specifically the shared curvature
profile, and the similar knuckle-walking kinematics employed by chimpanzees and
gorillas point to a shared origin of knuckle walking.

ix
PREFACE
The main body of this dissertation consists of three chapters (2-4) each
constructed in a publishable paper format bordered by introductory and conclusion
chapters. Each chapter contains its own introduction, methods, results, discussion, and
conclusion segments. The introduction for chapter three “Manual Phalangeal Curvature
and Knuckle walking in African Apes” was largely borrowed from my earlier work on
phalangeal curvature published in 2008 which is cited throughout.
Chapter 2 presents research involving animal participants. Pressure application to
the manus was collected when chimpanzees and gorillas knuckle walked across a
pressure mat installed within their respective enclosures. This work was approved by
Animal Care and Use Committees at the University of Massachusetts, Amherst (IACUC
# 2010-0006), the Lincoln Park Zoo, Chicago, IL, the Franklin Park Zoo, Boston, MA,
and the Cognitive Evolution Group, University of Louisiana at Lafayette, LA. The
project was designed with the input of the animals’ primary handlers to inflict minimal
interruption to the daily routines of the animals and their keepers. Animals were able to
cross the pressure mat at will and avoid it if they chose to, thereby minimizing stress to
individual animals.

x
TABLE OF CONTENTS
Page ACKNOWLEDGEMENTS……………………………………………………………... iv ABSTRACT……………………………………………………………………………... vi PREFACE……………………………………………………………………………….. ix LIST OF TABLES………………………………………………………………….….. xiii LIST OF FIGURES…………………………………………………………………..…. xv CHAPTER
1. INTRODUCTION: THE KNUCKLE-WALKING HOMININ HYPOTHESIS…………………………………………………………………… 1 History of the “Knuckle-walking Hypothesis”…………………………………... 1 Chapter Overviews………………………………………..……………………… 4
2. MANUAL PRESSURE DISTRIBUTION PATTERNS IN THE AFRICAN APES (PAN AND GORILLA)…………………………………………………… 9
Abstract…………………………………………………………………………... 9 Introduction……………………………………………………………………... 10 Methods……………………………………………………………………….… 13
Results………………………………………………………………………....... 18
The Influence of Body Size, Sex, Walking Speed, and Age on Touch-off Pressure and Peak Pressures for Digits 2-5…………………. 18
Behavioral Similarities between Gorillas and Chimpanzees…………… 21
Behavioral Differences between Gorillas and Chimpanzees…………… 22 Discussion………………………………………………………………………. 26 Conclusions…………………………………………………………………...… 29 Acknowledgements…………………………………………………………....... 30

xi
3. MANUAL PHALANGEAL CURVATURE AND KNUCKLE WALKING IN AFRICAN APES………………………………………………………………. 40
Abstract…………………………………………………………………………. 40 Introduction…………………………………………………………………....... 41 Samples and Methods…………………………………………………………... 46
Results………………………………………………………………………....... 48 Basic Curvature and Index Values……………………………………… 48 Sex Differences…………………………………………………………. 48 Differences among Taxa for Individual Elements…………………….... 49 Within-manus Differences…………………………………………….... 50 Locomotor and Taxon Differences…………………………………....... 51 Discussion………………………………………………………………………. 53 Conclusions...………………………………………………………………….... 58 Acknowledgements…………………………………………………………....... 60
4. TRABECULAR ARCHITECTURE OF THE MANUAL ELEMENTS……… 77
Abstract…………………………………………………………………………. 77 Introduction………………………………………………………………….......78 Methods………………………………………………………………………..... 85
Results…………………………………………………………………………... 87 Differences between the Sexes………………………………………..... 88 Differences across Taxa and Locomotor Categories………………….... 89 Discriminant Function Analyses……………………………………....... 91 Discussion………………………………………………………………………. 95

xii
Conclusions...………………………………………………………………….... 97 Acknowledgements…………………………………………………………....... 98
5. CONCLUSIONS: KNUCKLE-WALKING SIGNAL IN THE AFRICAN
APES AND THE KNUCKLE-WALKING HOMININ HYPOTHESIS………107 Chapter Summaries……………………………………………………………. 107 Knuckle-walking Ancestor……………………………………………………. 111
APPENDICES A. MANUAL PRESSURE PRINTS OF KNUCKLE WALKING APES……….. 115 B. INDICES OF RELATIVE CURVATURE BOOTSTRAPPING RESULTS.... 118 BIBLIOGRAPHY…………………………………………………………………….. 122
xiii
LIST OF TABLES
Table Page 2.1 Highest digit pressure values for each scored contact step……………………... 32 2.2 Average pressure (N/cm2) placed on digits 2-5……………………………….... 33 2.3 Results of paired T-test examining peak pressures of digit 2-5. Analysis
included adults only…………………………………………………………...... 34 3.1 Sample sizes by sex……………………………………………….……………. 61 3.2 Middle and phalangeal curvature means (in degrees) for included genera…...... 62 3.3 Index of Relative Curvature means for taxa……………………………………. 63 3.4 Average “Index of Relative Curvature” scores for each taxon for non corresponding digital elements…………………………………………………. 64 3.5 Significant differences between proximal phalangeal curvature (Px)
across taxa………………………………………………………………………. 65 3.6 Significant differences between middle phalangeal curvature (Md)
across taxa………………………………………………………………………. 66 3.7 Middle phalangeal curvature homogenous subsets for hominoids..…………….... 67 3.8 Chimpanzee homogenous subsets for middle phalangeal curvature values
and IRC scores………………………………………………………………...... 68 3.9 Gorilla Homogenous Subsets for proximal and middle phalangeal
curvature values and IRC scores………………………………………………... 69 3.10 Euclidean Distance (or Dissimilarity) Matrix based on scores generated by
a genus-level discriminant function analysis…………………………….……... 70 3.11 Tukey’s Honestly Significant Differences (HSD) between knuckle walkers and
other locomotor categories for IRC scores……………………………………... 71 3.12 Tukey’s Honestly Significant Differences between quadrumanous climbers
and other locomotor categories for IRC scores………………………………… 72 3.13 Tukey’s Honestly Significant Differences between qaudrupeds and
brachiators for IRC scores……………………………………………………… 73
xiv
3.14 Percentage of significantly different IRC scores for Tukey’s Honestly Significant Differences between locomotor groups……………………………. 74
3.15 Summary table of expected and observed manual phalangeal curvature values for locomotor categories………………………………………………… 75
4.1 Included samples in trabecular bone analyses …………………………...…...... 99 4.2 Percentage of individuals for trabecular orientation in examined regions by genus…………………………………………………………………………... 100 4.3 Hypothesized (expected) and observed primary trabecular orientation for
taxa...................................................................................................................... 101 4.4 Mann-Whitney U test results for taxa comparisons. Significance values in
parentheses…………………………………………………………………….. 102 4.5 Mann-Whitney U test results for locomotor category comparisons.
Significance values in parenthesis…………………………………………….. 103 5.1 Similarities and Differences between Pan and Gorilla……………………….. 114

xv
LIST OF FIGURES
Figure Page
2.1 Pressure distribution output of the right hand of a female chimpanzee. Hand is oriented in the palm-in position. Initial contact is made with digit 5 and the center of pressure (black line) moves towards 2. Final touch-off and maximum pressure occurs at digit 2……………………………………....... 35
2.2 Pressure distribution outputs of the right hand of a male chimpanzee.
Touch-off and maximum pressure is at digit 2 in the palm-in position (a.) and digit 3 in the palm-back position (b). …………………………………………... 36
2.3 Pressure distribution outputs of the right hand of a female gorilla.
Touch-off and maximum pressure occurs at digit 2 in both hand positions. (a) palm-in (b) palm-back………………………………………………………. 37
2.4 Pressure distribution output of the right hand of an adult male gorilla in the
palm back position. Touch-off and maximum pressure occurs at digit 2. No prints of adult male silverbacks were in the palm-in position……………… 38
2.5 Mean values of metacarpal plus proximal phalangeal lengths for chimpanzee
and gorilla males and females. Gorillas show a “flatter” pattern indicating less variability between digits 2-5…………………………………………………... 39
3.1 Curvature measurements: D depth, H height, L length, R radius of curvature
(Image adapted from Jungers et al., 1997).……………………………………...76 4.1 SVD Rose diagrams displaying the trabecular orientation for the proximal
end of the middle phalanx……………………………………………………... 104 4.2 SVD Rose diagrams displaying the trabecular orientation for the metacarpal
head……………………………………………………………………………. 105 4.3 Discriminant Function Plot for all included regions (proximal and distal
ends of the middle and proximal phalanges and the metacarpal head). Along Function 1, knuckle walkers have high BV/TV in the proximal and distal ends of the proximal phalanges and proximal end of the middle phalanges and more palmar-dorsal alignment in the metacarpal head and distal end of the proximal phalanges. Quadrupeds and suspensory primates have more proximo-distal alignment in those regions…………………………………………………….. 106

1
CHAPTER 1
INTRODUCTION: THE KNUCKLE-WALKING HOMININ HYPOTHESIS
History of the “Knuckle-walking Hypothesis”
The nature of the hominin transition to bipedalism has been widely debated. Did
our pre-hominin ancestors have a knuckle-walking phase, or was another form of
quadrupedalism or suspension the primary mode of locomotion? Within the subfamily
Homininae (Pan, Gorilla, and Homo), Pan and Homo form a lineage that diverged from
Gorilla approximately 8.3million years ago (Perelman et al., 2011). If knuckle walking
is deemed to be ancestral to the Homininae lineage, then it implies that hominin ancestors
went through a knuckle-walking transitional period. The knuckle-walking hypothesis
which reconstructs the ancestor as being adapted to knuckle walking and arboreal
climbing, is widely supported (Begun, 1993; Corruccini, 1978; Inouye and Shea, 2004;
Kelly, 2001; Richmond and Strait, 2000; 2001a; 2001b; Richmond et al., 2001; Shea and
Inouye, 1993; Washburn, 1967; 1968), but it is just one of several hypothesis posited to
explain the origin of bipedalism. The others hypothesize that the ancestral condition was
a more “monkey-like” arboreal or terrestrial quadrupedalism, a more “orangutan-like” or
“gibbon-like” climbing and suspension, or a more generalized arboreal ape condition not
seen in extant primates (Gebo, 1996; Morton, 1926; Richmond et al., 2001a; Sarmiento,
1985; 1998; Stern, 1975; Straus, 1949; Tuttle, 1967; 1969; 1974; 1975).
To explore the issue of knuckle walking in human evolution, much attention has
been paid to the morphology of the metacarpals and wrists of hominins and extant

2
primates in attempt to isolate a “knuckle-walking signal” (Dainton and Macho, 1999;
Inouye and Shea, 2004; Kivell and Schmitt, 2009; Matarazzo, 2008; Richmond and
Strait, 2000; Richmond et al., 2001; Tuttle, 1967; 1969). This “signal” would be a
morphological feature (particularly within the manus) that can be linked to knuckle
walking to the exclusion of other locomotor patterns, specifically those hypothesized to
be alternative ancestral conditions (quadrupedalism, suspension, or climbing). The
presence or absence of a “knuckle-walking signal” in the distal radius and metacarpals
has been hotly contested (Dainton, 2001; Inouye and Shea, 2004; Kivell and Schmitt,
2009). Richmond and Strait (2000) interpreted aspects of the morphology of the distal
radius of African apes, Australopithecus anamensis and A. afarensis as evidence that
bipedal hominins evolved from a knuckle-walking ancestor, while Dainton and Macho
(1999), Dainton (2001), and Kivell and Schmitt (2009) defended the opposite view on the
basis of other aspects of wrist morphology and developmental data. Williams’s (2010)
analysis of morphological integration of aspects of wrist and ray morphology supported
Richmond and Strait’s (2000) interpretation.
In addition to this search for a morphological feature, kinematic and behavioral
studies of the extant hominoids have also been undertaken. These studies were designed
to characterize the mechanics of knuckle walking and to determine whether knuckle
walking differences exist between Pan and Gorilla. The studies have revealed one main
difference between the African apes: chimpanzees are more variable in hand and arm
position and digit use than gorillas. Tuttle (1967) observed that with chimpanzees, weight
is primarily focused on digits 3 and 4, and the hands are placed at various angles to the
3
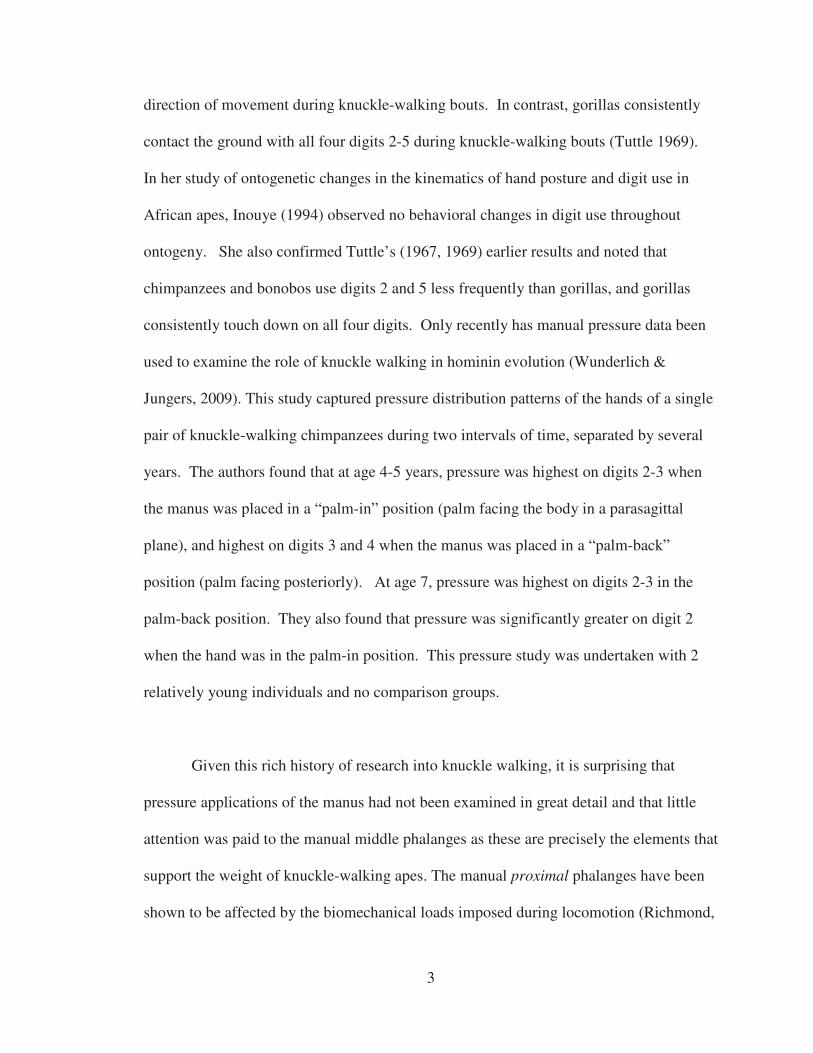
direction of movement during knuckle-walking bouts. In contrast, gorillas consistently
contact the ground with all four digits 2-5 during knuckle-walking bouts (Tuttle 1969).
In her study of ontogenetic changes in the kinematics of hand posture and digit use in
African apes, Inouye (1994) observed no behavioral changes in digit use throughout
ontogeny. She also confirmed Tuttle’s (1967, 1969) earlier results and noted that
chimpanzees and bonobos use digits 2 and 5 less frequently than gorillas, and gorillas
consistently touch down on all four digits. Only recently has manual pressure data been
used to examine the role of knuckle walking in hominin evolution (Wunderlich &
Jungers, 2009). This study captured pressure distribution patterns of the hands of a single
pair of knuckle-walking chimpanzees during two intervals of time, separated by several
years. The authors found that at age 4-5 years, pressure was highest on digits 2-3 when
the manus was placed in a “palm-in” position (palm facing the body in a parasagittal
plane), and highest on digits 3 and 4 when the manus was placed in a “palm-back”
position (palm facing posteriorly). At age 7, pressure was highest on digits 2-3 in the
palm-back position. They also found that pressure was significantly greater on digit 2
when the hand was in the palm-in position. This pressure study was undertaken with 2
relatively young individuals and no comparison groups.
Given this rich history of research into knuckle walking, it is surprising that
pressure applications of the manus had not been examined in great detail and that little
attention was paid to the manual middle phalanges as these are precisely the elements that
support the weight of knuckle-walking apes. The manual proximal phalanges have been
shown to be affected by the biomechanical loads imposed during locomotion (Richmond,
4
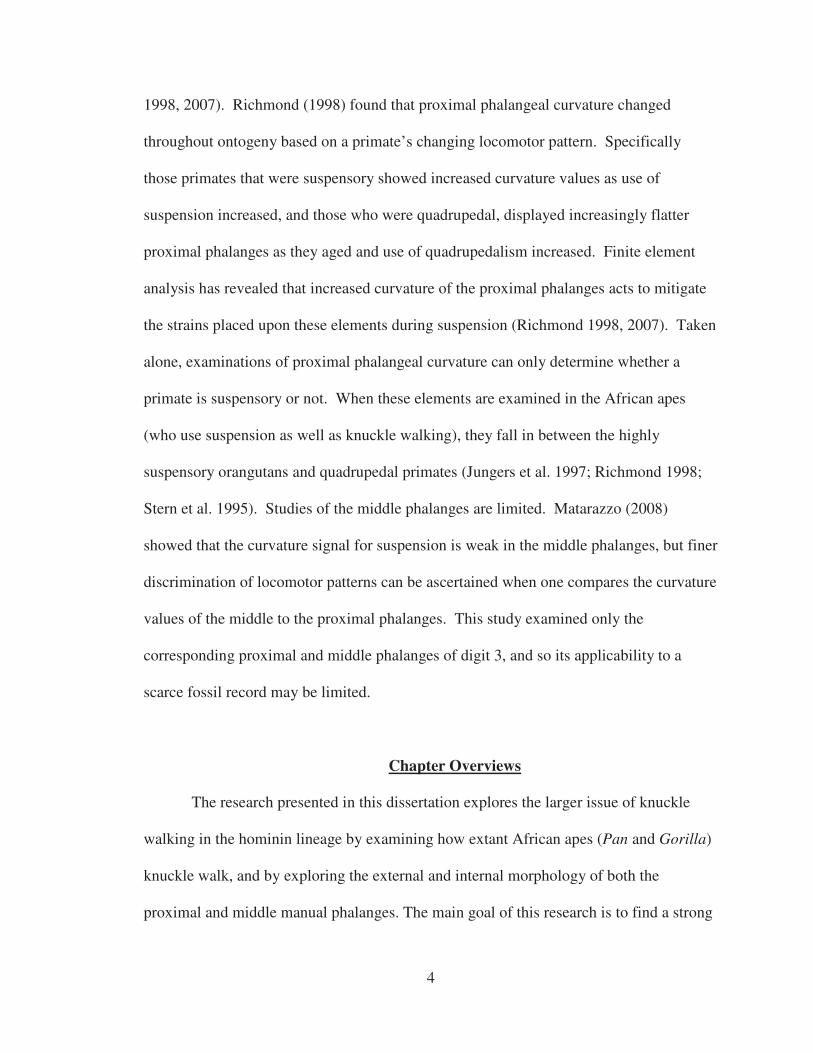
1998, 2007). Richmond (1998) found that proximal phalangeal curvature changed
throughout ontogeny based on a primate’s changing locomotor pattern. Specifically
those primates that were suspensory showed increased curvature values as use of
suspension increased, and those who were quadrupedal, displayed increasingly flatter
proximal phalanges as they aged and use of quadrupedalism increased. Finite element
analysis has revealed that increased curvature of the proximal phalanges acts to mitigate
the strains placed upon these elements during suspension (Richmond 1998, 2007). Taken
alone, examinations of proximal phalangeal curvature can only determine whether a
primate is suspensory or not. When these elements are examined in the African apes
(who use suspension as well as knuckle walking), they fall in between the highly
suspensory orangutans and quadrupedal primates (Jungers et al. 1997; Richmond 1998;
Stern et al. 1995). Studies of the middle phalanges are limited. Matarazzo (2008)
showed that the curvature signal for suspension is weak in the middle phalanges, but finer
discrimination of locomotor patterns can be ascertained when one compares the curvature
values of the middle to the proximal phalanges. This study examined only the
corresponding proximal and middle phalanges of digit 3, and so its applicability to a
scarce fossil record may be limited.
Chapter Overviews
The research presented in this dissertation explores the larger issue of knuckle
walking in the hominin lineage by examining how extant African apes (Pan and Gorilla)
knuckle walk, and by exploring the external and internal morphology of both the
proximal and middle manual phalanges. The main goal of this research is to find a strong

5
knuckle-walking feature, or “signal”, within the manus that could be easily applicable to
limited and possibly fragmentary fossil material. This signal would help contribute to the
knuckle-walking hominin debate by providing better insight into the locomotor
repertoires of extinct hominins.
Chapter 2 examines how Pan and Gorilla apply pressure to their manual middle
phalanges during knuckle walking. Very little research has been done on how pressure is
applied to the primate manus. Prior to the research conducted here, there existed only
one study of manual phalangeal pressure during knuckle walking (Wunderlich and
Jungers, 2009), and one study of palmar pressure for the terrestrial quadrupedal primate,
the Olive Baboon (Patel and Wunderlich, 2010). As described above, Wunderlich and
Jungers’ (2009) knuckle-walking pressure study involved only two relatively young
individuals and offered no comparative sample of the only other extant knuckle-walking
primate, the gorilla. Chapter 2 provides pressure data from a wider sample of adult and
juvenile chimpanzees, and includes the first pressure data (manual or pedal) on gorillas.
This inclusion of both gorillas and chimpanzees allows for an examination of potential
differences within the two lineages of hominoids. In addition to exploring differences in
pressure application, this chapter also quantifies variation in hand placement and
preferred digit use by each individual. Kinematic studies have shown that gorillas are
much more consistent in their use of a pronated arm posture than chimpanzees and
contact the ground with digits 2-5 but how these differences affect the stress placed upon
the phalanges has yet to be quantified.
6
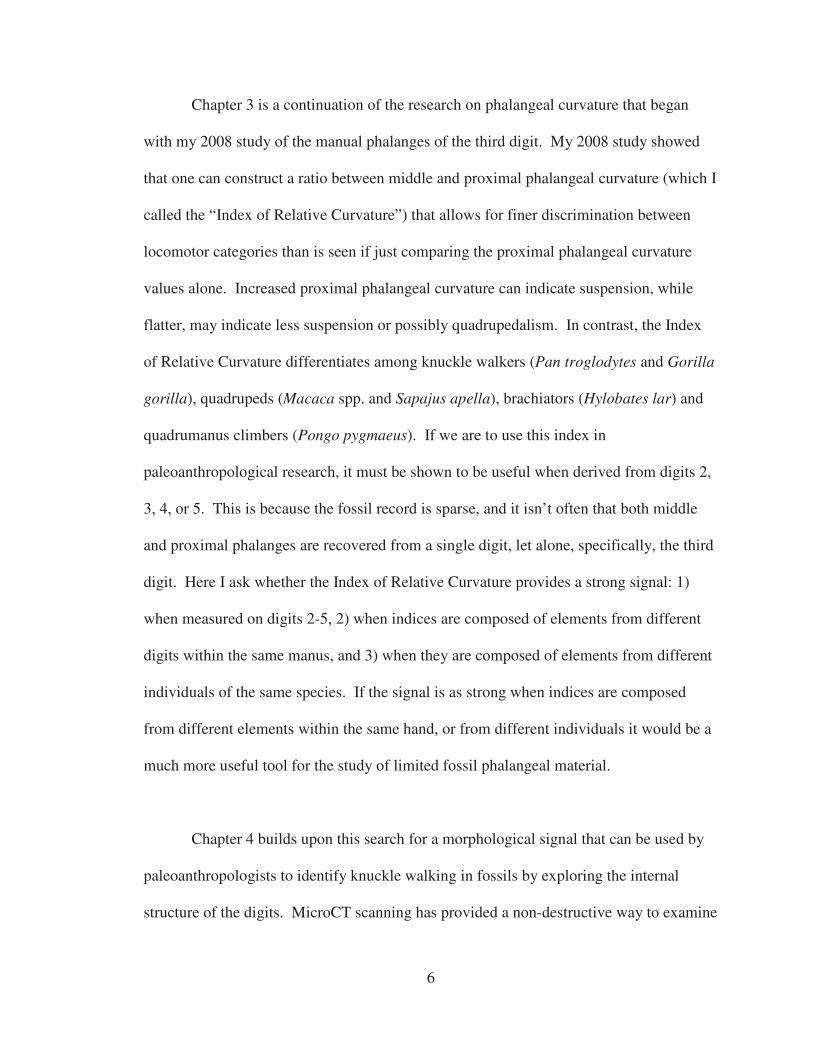
Chapter 3 is a continuation of the research on phalangeal curvature that began
with my 2008 study of the manual phalanges of the third digit. My 2008 study showed
that one can construct a ratio between middle and proximal phalangeal curvature (which I
called the “Index of Relative Curvature”) that allows for finer discrimination between
locomotor categories than is seen if just comparing the proximal phalangeal curvature
values alone. Increased proximal phalangeal curvature can indicate suspension, while
flatter, may indicate less suspension or possibly quadrupedalism. In contrast, the Index
of Relative Curvature differentiates among knuckle walkers (Pan troglodytes and Gorilla
gorilla), quadrupeds (Macaca spp. and Sapajus apella), brachiators (Hylobates lar) and
quadrumanus climbers (Pongo pygmaeus). If we are to use this index in
paleoanthropological research, it must be shown to be useful when derived from digits 2,
3, 4, or 5. This is because the fossil record is sparse, and it isn’t often that both middle
and proximal phalanges are recovered from a single digit, let alone, specifically, the third
digit. Here I ask whether the Index of Relative Curvature provides a strong signal: 1)
when measured on digits 2-5, 2) when indices are composed of elements from different
digits within the same manus, and 3) when they are composed of elements from different
individuals of the same species. If the signal is as strong when indices are composed
from different elements within the same hand, or from different individuals it would be a
much more useful tool for the study of limited fossil phalangeal material.
Chapter 4 builds upon this search for a morphological signal that can be used by
paleoanthropologists to identify knuckle walking in fossils by exploring the internal
structure of the digits. MicroCT scanning has provided a non-destructive way to examine

7
trabecular bone in fine detail, so it is an attractive tool to examine rare manual elements
of extant and extinct animals. Trabecular bone has been shown to align along an axis of
primary function (Barak et. al., 2011; Fox and Keaveny, 2001; Jacobs, 2000; Keaveny et.
al., 2001; Mittra et. al. 2005; Polk et. al., 2008; Pontzer et. al, 2006). Within primates,
the femoral and humeral head trabecular structure has been examined in a number of taxa
and locomotor differences within these elements have been observed (DeSilva and
Devlin, 2012; MacLatchy and Muller, 2002; Ryan and Ketchum, 2002; Ryan and Shaw,
2012; Ryan and Walker, 2010; Shaw and Ryan, 2012). This chapter examines the
trabecular bone structure of the manual phalanges and metacarpals of a subset of the
individuals included in the curvature analysis to determine whether an internal
biomechanical signal is present within these elements. Building on the external
morphology findings (curvature differences), we can predict internal structural difference
across locomotor groups and within a single digit, particularly with knucklewalkers who
have “flattened” middle phalanges coupled with curved proximal phalanges. The
flattened middle phalanges experience compression during knuckle walking, but both
proximal and middle phalanges experience tensile forces during suspension. A suite of
trabecular bone features are explored in five locations on the third manual ray: the
proximal and distal ends of the proximal and middle phalanges and the metacarpal head.
Trabecular bone alignment differences located in particular anatomical zones would
greatly add to the ability to discern locomotor patterns in fragmentary fossil elements for
which the external structure cannot be reconstructed.

8
The final chapter summarizes the results of the pressure, phalangeal curvature and
trabecular bone studies and interprets them in the broader context of the ancestral
knuckle-walking hominin hypothesis. Differences in pressure application between two
knuckle-walking taxa not only act to clarify differences seen in the morphology of the
manus, but can be explored to elucidate issues of homology or homoplasy of knuckle
walking, within African apes. Although there is no outgroup comparison for this
analysis, as both Homo and Pongo practice widely different methods of locomotion thus
making manual pressure comparisons impossible, we can still broadly explore the overall
pattern of knuckle walking within the great apes and determine whether similarities or
glaring differences can inform us of the possibility of convergence within the lineages.
This chapter details how the pressure distribution data relates to the curvature differences
noted across the manus of individual knuckle walkers, and how the patterns of curvature
relate to what we see in the trabecular structure. We also see how differential pressure
application within middle phalanges accounts for differences in proximal and distal
trabecular bone alignment in these elements. Is there a definitive knuckle-walking signal
within the structure of the manual elements? What inferences can we make about fossil
hominins from these locomotor signals that may provide greater insight into the origins
of bipedalism? These questions and others are explored in the final chapter.

9
CHAPTER 2
MANUAL PRESSURE DISTRIBUTION PATTERNS IN
THE AFRICAN APES (PAN AND GORILLA)
Abstract
To understand the role of knuckle walking in hominin evolution, we need to better
understand behavioral variation in knuckle walking, and specifically whether behavioral
similarities between chimpanzees and gorillas are likely homologous. Differences in how
the hands of gorillas and chimpanzees contact the ground while knuckle walking have
been noted but not quantified: it is widely believed that gorillas maintain a pronated arm
and contact the ground with digits 2-5 consistently, while chimpanzees have variable arm
position and digit contact. Distribution of pressure across the manus, peak digital
pressures, and hand position were quantified to further test these generalizations.
Chimpanzees and gorillas make initial ground contact with the ulnar aspect of the hand,
and pressure then moves radially. They differ in which digit usually makes final contact
and receives maximum pressure, and in hand position during contact. Gorillas regularly
use a palm-back hand position and touch-off with digit 2. They show less variation in
pressure application across the digits. Chimpanzees are more variable in hand position
and pressure application. These differences may relate to aspects of locomotor behavior
that are unrelated to knuckle walking; chimpanzees are more suspensory than gorillas.
Nevertheless there are some commonalities that appear to be synapomorphic, and that
would in any case require explanation if they do not signal knuckle walking in the
common ancestor of chimpanzees and gorillas (and by implication, humans). In both,
hand position plays a key role in determining which digit acts as the final touch-off
element.

10
Introduction
Previous studies addressing the role knuckle walking played in human evolution
have focused primarily on morphological analyses of the wrists, metacarpals, and to a
lesser extent the phalanges of extant primates and fossil hominins (Dainton and Macho,
1999; Inouye and Shea, 2004; Kivell and Schmitt, 2009; Matarazzo, 2008; Richmond and
Strait, 2000; Richmond et al., 2001; Tuttle, 1967; 1969). The presence or absence of a
“knuckle-walking signal” in the wrist and metacarpals has been hotly contested (Dainton,
2001; Inouye and Shea, 2004; Kivell and Schmitt, 2009). Richmond and Strait (2000)
interpreted aspects of the morphology of the distal radius of African apes,
Australopithecus anamensis and A. afarensis as evidence that bipedal hominins evolved
from a knuckle-walking ancestor, while Dainton and Macho (1999), Dainton (2001), and
Kivell and Schmitt (2009) defended the opposite view on the basis of other aspects of
wrist morphology and developmental data. Williams’s (2010) analysis of morphological
integration of aspects of wrist and ray morphology supported Richmond and Strait’s
(2000) interpretation.
Little research has focused on the morphology of the middle phalanges in knuckle
walkers, despite the fact that it is precisely these skeletal elements that should be affected
most directly by knuckle walking. Curvature of the manual proximal phalanges of
primates varies with levels of suspension (Jungers et al, 1997; 2002; Richmond, 1998).
The middle phalanges of knuckle walkers are the primary load bearers during knuckle
walking bouts. Therefore one could predict that these elements should be relatively

11
straighter than the proximal phalanges (Richmond et al., 2001). This would allow for
greater digit-to-surface contact area and increased dissipation of the compressive forces
generated during knuckle walking. Examining the third ray, Matarazzo (2008) showed
that chimpanzees and gorillas do in fact share relatively low middle phalanx curvature – a
trait that distinguishes these species from orangutans. However, other aspects of manual
morphology of chimpanzees and gorillas show strong differences. Gorillas have
relatively shorter metacarpals and proximal phalanges and less inter-ray length variation
than chimpanzees (Inouye, 1992). New data (Matarazzo, in prep.) on middle phalanx
curvature for digits 2, 4, and 5 (as well as 3) show that, whereas chimpanzees and gorillas
share the same pattern of variation in middle phalanx curvature across the manus, with
greatest flattening in rays 3 and 4, chimpanzees have greater dispersion around their
mean (with a coefficient of variation of 11.8 cf. 10.4 in gorillas), and higher curvature
values for digit 5. Lower variation in middle phalanx length and curvature in gorillas
may relate to lower variation in pressure distribution during knuckle walking, a
phenomenon that can be elucidated by studying how pressure is applied to the middle
phalanges.
Pressure distribution analysis has gained popularity within the anthropological
literature as a means to quantify footfall patterns in a variety of primate taxa. Most of
this research focuses on plantar pressure as its relates to the origin of bipedalism in the
hominin lineage (Barden et al., 2010; Berillon et al., 2010; Bertsch et al., 2004; D’Aout et
al., 2004; Vereecke et al., 2003; Vereecke et al., 2005; Vereecke & Aerts, 2008;
Wunderlich, 1999). Only recently has manual pressure data been used to examine the

12
role of knuckle walking in hominin evolution (Wunderlich & Jungers, 2009). Much of
the prior data on hand use in knuckle walking were behavioral observations. Tuttle
(1967) observed that chimpanzees concentrated weight on digits 3 and 4 and placed their
hands at various angles to the direction of movement during knuckle-walking bouts.
Inouye (1994) studied ontogenetic changes in the kinematics of hand posture and digit
use in gorillas, chimpanzees, and bonobos. She observed no behavioral changes in digit
use throughout ontogeny; chimpanzees and bonobos use digits 2 and 5 less frequently
than gorillas, and gorillas consistently touch down on all four digits.
Patel and Wunderlich (2010) examined the palmar pressure distribution as
measured in two adult olive baboons at different walking speeds. They demonstrated
that, as speed increases, palmar contact increases. They hypothesized that greater palmar
contact might mitigate the increased strain that may be placed on the metacarpals at
higher speeds. Knuckle walkers transmit force through the digits only so palmar contact
cannot be used to mitigate strain.
Only one study of pressure variation describes the manus of knuckle walkers
(Wunderlich and Jungers, 2009). This study captured pressure signals of the manus of a
single pair of knuckle-walking chimpanzees during two intervals of time, separated by
several years. The authors found that at age 4-5 years, pressure was highest on digits 2-3
when the manus was placed in a “palm-in” position (palm facing the body in a
parasagittal plane), and highest on digits 3 and 4 when the manus was placed in a “palm-
back” position (palm facing posteriorly). At age 7, pressure was highest on digits 2-3 in

13
the palm-back position. They also found that pressure was significantly greater on digit 2
when the hand was in the palm-in position.
To determine whether proto-hominins were knuckle walkers, it is vital that the
biomechanics of knuckle walking, the forces being applied to the rays, and the resulting
skeletal correlates be better understood. This paper examines manual pressure patterns of
extant knuckle walkers (chimpanzees and gorillas). I have two main goals; the first is to
verify the generality of prior observations. Is it true that gorillas distribute pressure more
evenly across all digits than do chimpanzees? Can differences in pressure be related to
differences in manual morphology? Are changes in hand position correlated with how
pressure is applied? If Wunderlich and Jungers’ (2009) observations hold for a broader
sample of chimpanzees, pressure should be higher on digit 2 in the palm-in position than
in the palm-back position. The second goal is to determine whether there are common
aspects in the execution of knuckle walking that distinguish knuckle walkers from other
animals. Was knuckle walking independently derived in the chimpanzee and gorilla
lineages, or was some form of knuckle walking shared by their common ancestor (and by
implication, the common ancestor of chimpanzees, gorillas, and humans)? If the latter,
can that form of knuckle walking be characterized?
Methods
This study included six adult (18 year-old, 1 male, 5 females) and two juvenile (3
year-old, 1 male, 1 female) Pan troglodytes. These chimpanzees were part of the
Cognitive Evolution Group (University of Louisiana at Lafayette) and were trained to

14
perform in tasks related to cognition studies. They were fully habituated to human
presence, trained to self-transfer from their housing to testing unit, perform in cognitive
testing on a regular basis, and worked with the same trainers for several years. The
chimpanzees had access to outside, open-air enclosures and arboreal supports in testing
and housing units. They were housed together in one area and individuals or pairs of
chimpanzees were separated from the communal group to a cognitive testing room (11’ x
8’ x 7’) where the pressure mat was secured to concrete flooring. Individuals participated
in a daily “trial” that lasted no more than 30 minutes each for 11 days. The pressure mat
was set flush within a larger frame (4’ x 31” x 1”) and covered with a non-slip vinyl to
prevent the chimpanzees from targeting the equipment during a pass. The frame was
placed in front of a path the chimpanzees regularly used to reach a “marker” situated on a
wall. As the chimpanzees entered, they crossed the mat to touch their marker. They
repeated this movement several times in a given trial. The chimpanzees were given food
rewards at the end of each trial.
The gorilla groups were housed at two separate zoo facilities: the Lincoln Park
Zoo, Chicago, IL (LPZ) and the Franklin Park Zoo, Boston, MA (FPZ). The LPZ group
consisted of a silverback (19 years old), one male infant (2 years old), and two adult
females (18 and 12 years old). The FPZ group consisted of two silverbacks (both 18
years old), two adult females (39 and 30 years old) and one infant female (weight ~5lbs)
carried continually by her mother Kiki. Both gorilla groups were habituated to the
presence of their keepers, but not to performing specific tasks. At both zoos, the pressure
mat was placed in an off-exhibit corridor with concrete flooring. The corridors were

15
sufficiently long to ensure a full pass across the mat, but sufficiently short to prevent fast
running. Data were collected opportunistically when the gorillas entered and exited the
off-exhibit housing twice daily. At the FPZ, the frame encasing the mat filled the entire
corridor from the off-exhibit housing to the main exhibit area (56” x 34” x 1”). At the
LPZ, the frame (6’ x 38” x 1”) was set within a long transfer chute (33’ x 40” x 40”).
The chute consisted of a ceiling and one wall made of reinforced steel caging, one wall of
concrete blocks and a concrete floor. At both zoos, the frame was covered in non-slip
vinyl to disguise the location of the pressure mat, and the mat was set off-center within
the frame to better capture a hand print. Gorillas at both institutions had access to
arboreal supports and softer (non-concrete) flooring in exhibit housing. Due to
differences in enclosure structures and training, chimpanzees made contact with the
pressure mat more frequently than did gorillas (Table 2.1).
Pressure distribution data were collected using an RS Scan footscan pressure mat
(0.5 x 0.4 x 0.008 m; 4096 sensors; 150 Hz Max. Freq.) and RS Scan footscan software.
Individual digital pressure for rays 2-5, center of pressure movement across the hand,
location of peak pressure (N/cm2) on the manus for each step, bout time (in milliseconds),
initial contact digit (2-5), and “touch-off” digit (2-5) were determined for each recorded
pressure imprint (Figure 2.1). Bout time was used to assess speed of each knuckle-
walking step and was calculated from the time the initial contact was made to the final
touch-off point. The initial contact digit is the digit that makes first contact with the
ground. The “touch-off” digit is defined as the digit that is used to push off to the
subsequent step. It is the last digit in contact with the pressure mat as the hand lifts up to

16
a subsequent step. Only complete contact “steps” in which the entire hand had the
ability to contact the pressure mat during a walking bout were scored and analyzed.
Steps in which an animal was reversing or stopping were excluded from analysis. The
RS Scan software is designed for a human foot, thus knuckle walking prints are originally
color-coded to represent the foot segments (i.e. forefoot, heel, metatarsals, digits). In this
manner, a single digit may be subdivided into heel, mid foot, etc. Knuckle-walking
prints were manually color coded to accurately represent digits; individual digits were
each given their own color code so resulting pressure outputs were correctly representing
a middle phalanx print. These color coded prints are “scored contacts” (Table 2.1). To
measure touch-off digit preference, digits were assigned numerical values corresponding
to their ray number, and these values were averaged for specified groups. A mean of 2.5
signals equal preference for digits 2 and 3. A mean of 2.8 indicates greater preference for
digit 3 or other, more ulnarly placed, digits. This is not a measure of the movement of
the center of pressure.
All statistical analyses were conducted using SPSS version 20. Before
considering similarities and differences between chimpanzees and gorillas, the influence
on manual pressure of confounding variables such as body mass (in kiligrams), sex, age
(juveniles vs. adults), and walking speed (which is inversely correlated with bout time)
was tested using correlation and multiple regression analysis. A Discriminant Function
Analysis was used to capture the primary differences in hand use between gorillas and
chimpanzees; it examined peak pressure on digits 2-5, hand position, touch-off digit,
touch-off pressure, initial contact digit, initial contact pressure, and digit with the highest

17
pressure per step. ANOVAs with Tukey’s test of Honestly Significant Differences
(HSD) were used to assess differences in the amount of pressure applied to the touch-off
digit within and between taxa, and to assess differences in bout time. Pearson’s
correlation coefficients were used to examine the relationships between touch-off or
initial contact digit and the digit with the highest pressure per step. Chi-square analyses
were conducted to assess differences in placement of peak pressure in the palm-back and
palm-in positions, frequency of use of palm-back and palm-in hand positions, and
preferred touch-off digit both within and between taxa. Fisher’s exact tests were used to
assess differences between chimpanzees and gorillas in peak pressure distribution across
the manus. Paired t-tests were used to examine pairwise differences in peak pressure
values between digits.
Skeletal elements were also measured to assess morphological differences within
and across taxa. Total length measurements (mm) of the metacarpals and proximal
phalanges of digits 2-5 were taken from specimens housed at the American Museum of
Natural History, New York, NY; Cleveland Natural History Museum, Cleveland, OH;
Field Museum, Chicago, IL; Museum of Comparative Zoology, Cambridge, MA; and
National Museum of Natural History, Washington DC. Samples included 87 adult
gorillas (Gorilla gorilla: 59 males and 28 females) and 53 adult chimpanzees (Pan
troglodytes: 35 males and 18 females). The length of the metacarpal plus proximal
phalanx for each ray (2-5) was measured and then compared across the manus for each
species using ANOVA with Tukey’s HSD to assess the structure of the knuckle-walking
“platform” for the load-supporting middle phalanges.

18
Results
The Influence of Body Size, Sex, Walking Speed, and Age on Touch-off Pressure
and Peak Pressures for Digits 2-5
Touch-off pressure and average peak pressure values (digits 2-5) for each
individual are displayed in Table 2.2. When we consider the effect of body mass on
touch-off pressure, there is a negative relationship (smaller individuals have increased
peak pressures on their digits). This relationship is seen when we consider chimpanzees
and gorillas together in a pooled sample and when they are examined separately.
Although the correlation for adult chimpanzees is not significant, it still reflects a
negative relationship.
A significant correlation between body mass and touch-off pressure is seen when
adult chimpanzees and adult gorillas are pooled (r = -0.203, N = 146, P = 0.014).
However, this is a negative correlation, indicating that pressure per unit area is actually
greater in the lighter individuals. The influence of body mass on touch-off pressure
remains negative when other potentially explanatory variables are added to the mix. A
multiple regression of touch-off pressure on body mass, bout time and sex in adult
chimpanzees and gorillas pooled reveals little influence of any of these potentially
confounding variables. The total variance explained (R2) is low (0.09), and only body
mass is significant (t = -2.85, P = 0.005).

19
Similar results hold when digits are considered independently and peak pressure
is evaluated for each. The total variance explained averages 0.13 and never exceeds 0.18.
None of our explanatory variables contributes significantly to explaining variation in
peak pressure for digit 2. Body mass is significant for digits 3-5, but the t value is
negative in each case. Sex is significant for digits 3 and 5, with males showing higher
peak pressures per unit area than females, but this relationship does not hold for digit 4.
Bout time is insignificant except for digit 5 (P = 0.02), with slower speed (longer bout
time) correlated with higher pressure values.
When chimpanzees and gorillas are considered separately, the negative
relationship between touch-off pressure and body mass holds. For adult chimpanzees,
none of our explanatory variables explains touch-off pressure (R2 = 0.05). Body mass
and touch-off pressure are not significantly correlated in adult chimpanzees (r = 0.095, N
= 110, P = 0.33) or adult gorillas (r = -0.256, N = 38, P = 0.13). Body mass does not
explain peak pressure for any single digit, and neither does bout time. Sex is significant
for digits 3 and 5, but the direction of the significance is reversed, with females showing
greater peak pressures on digit 5, and the reverse for digit 3. However, once again, the
total variance explained is low for all relationships, even when some of the variables
explain significant portions of that variance (R2 = 0.11 for digit 3 and 0.23 for digit 5).
For adult gorillas, body mass has a significant (P = 0.01) but negative relationship with
touch-off pressure. None of the other explanatory variables is significant. Body mass
explains peak pressure for only two digits (in this case, digits 3 and 4), but the

20
relationship is negative. Bout time has no impact on peak pressure for any single digit.
Sex is significant for digit 4 only, with males showing higher peak values than females.
Given the rarity of juveniles in our gorilla samples, the effects of age can be tested
only on chimpanzees. T-tests comparing juvenile and adult chimpanzees show
significant differences in touch-off pressure (t = 9.61, df = 154, P < 0.001) and peak
pressures on all digits with the exception of digit 5 (with adults experiencing higher
pressures in digits 2 through 4). The t-values for digits 2 through 4 range from 6.64 to
9.11, which, with 154 degrees of freedom, yield P values < 0.001 in all cases. In
juveniles, initial contact is made with the ulnar aspect of the hand and the center of
pressure moves radially, as in adults, but then rolls back towards the ulnar aspect of the
hand. This pattern gives juveniles an unstable, “wobbly” appearance as they knuckle
walk, causing increased pressure on digit 5.
Chi Square analyses show that adult chimpanzees differ from juveniles for hand
position (X2 = 8.8, df = 1, P = 0.003): juveniles use the palm-back position more than
expected (68% of steps) while adults use palm-in more than expected (58% of steps).
Touch-off digit is also significantly different between adults and juveniles (X2 = 15.63,
df= 2, P < 0.001). Juveniles touch-off with digit 3 89.4% of the time while adults show
less preference for digit 3, using digit 2 37% of the time and digit 3 57% of the time.

21
Behavioral Similarities between Gorillas and Chimpanzees
All knuckle walkers contact the ground with the ulnar aspect of the hand and then
the center of pressure moves radially. Among gorillas, the fifth digit is universally the
initial contact digit; in contrast, chimpanzees sometimes curl digit 5 under and contact the
ground initially with digit 4 (19.7% of all steps). The position of the hand (palm-back or
palm-in) affects whether digit 2, 3, or 4 is used for touch-off in adults. Hand position
affects the placement of the digits, which in turn affects which digit is used for touch-off.
The main differences between taxa are thus brought about by differences in digit length,
which affects digit placement differently (depending on hand position) in the two taxa.
Gorillas display less variability than chimpanzees; in effect, their manual behaviors can
be viewed as a subset of those seen in chimpanzees. For each species, the touch-off digit
is significantly correlated with the digit with the highest pressure per step (for
chimpanzees, r = 0.41, N = 156, P < 0.001; for gorillas, r = 0.38, N = 38, P = 0.02). For
each species, also, the act of pushing off to the next step places considerable pressure on
the digits and that pressure is consistently significantly greater than that of the initial
ground contact digit, as shown using paired t tests. (For adult chimpanzees, touch-off
mean pressure = 2.84N/cm2 SD =1.2, initial contact mean pressure = 1.38N/cm2, SD =
0.99, t = 11.62, df = 109, P < 0.001. For adult gorillas, touch-off mean pressure = 2.25
N/cm2, SD = 1.4, initial contact mean pressure = 1.46N/cm2, SD = 0.90, t = 3.72, df = 35,
P = 0.001.) There is also no correlation in either species between the initial contact digit
and the digit with the highest pressure (for chimpanzees, r = 0.02, N = 110, P = 0.87; for
gorillas, r = 0.09, N = 36, P = 0.59.)

22
Behavioral Differences between Gorillas and Chimpanzees
Chimpanzees and gorillas differ in several important ways. A discriminant
function analysis of adults only was successful at differentiating chimpanzees from
gorillas. Function 1 has a strong canonical correlation of 0.57, and is highly significant
(X2 = 78.35, df = 10, P < 0.001). Gorillas differ from chimpanzees in their consistent use
of the palm-back hand position and greater use of digit 2 in touch-off. In contrast,
chimpanzees use both hand positions regularly and touch-off with greater frequency on
digits 3 and 4. This analysis was successful in classifying individuals as either gorillas or
chimpanzees with 88.9% accuracy (87.9% of cross-validated grouped cases correctly
classified).
Chimpanzees exhibit considerably more individual variation than do gorillas.
Chi-square analyses of adult chimpanzees reveal significant individual differences in
touch-off digit preference (X2 = 30.68, df = 10, P =0.001) and favored hand position
(palm-in or palm-back; X2 = 10.82, df = 5, P = 0.05). Individual chimpanzees use both
hand positions in different proportions. Individual adult gorillas show no significant
differences in favored hand position or touch-off digit. All gorillas used palm-back hand
positions more than expected (100% for 5 individuals, 60% and 75% for the remaining
two) and touched-off with either digit 2 or 3.
Touch-off pressure and touch-off digit are significantly correlated in both
chimpanzees (r = -0.319, N = 110, P < 0.001), and gorillas (r = 0.367, N = 36, P = 0.028).

23
However, the chimpanzee correlation is negative revealing a shift in touch-off location
towards the radial aspect of the hand as pressure increases. Gorillas have a positive
correlation; touch-off location shifts ulnarly as pressure increases. Gorillas have a touch-
off digit mean of 2.37. The center of pressure moves radially in a given step and touch-
off occurs more frequently on digit 2. The mean for chimpanzees (2.77) signals an
average closer to digit 3. These means are significantly different (t = 3.41, df = 144, P =
0.001).
As stated above, chimpanzees and gorillas differ significantly in their use of hand
position (�2 = 16.93, df = 1, P < 0.001). Chimpanzees use both hand positions at
approximately equal rates: palm-back (42% of steps) and palm-in (58% of steps).
Gorillas favor palm-back (86%), and only 5 out of 36 steps were palm-in (14%). Touch-
off digit also differs significantly between the taxa (�2 = 10.76, df = 2, P = 0.005).
Chimpanzees touch-off frequently on digits 2, 3, and 4. Gorillas use digits 2 and 3 only,
with most steps touching off on digit 2 (67%).
When hand position is taken into account, preferred touch-off digit also differs
between the species (�2 = 42.92, df = 2, P < 0.001). In the palm-back position, touch-off
occurs 86% of the time on digit 3 for chimpanzees. In gorillas, it occurs mainly on digits
2 (61% of steps), and 3 (39% of steps). When chimpanzees knuckle walk using the palm-
back position, digit 3 is regularly positioned in front of the other rays making it the final
contact element (Figure 2.2). Gorillas show a greater alignment of the digits in the palm-
back position shifting touch-off either to digit 2 or 3 (Figures 2.3 and 2.4). In the palm-in

24
position, there is no significant difference in touch-off digit between species; both favor
digit 2, although gorillas do so more consistently than chimpanzees.
Fisher’s exact tests comparing the distribution of touch-off digit “counts” (how
many times either digit 2, 3, 4, or 5 was used as a touch-off digit) showed no significant
differences between taxa when both palm-in and palm-back steps were included (P =
0.71) or when only palm-in contacts were compared (P = 0.40). However, highly
significant differences were seen in the palm-back hand position (P < 0.001).
Hand position also affects the amount of pressure applied to digits in chimpanzees
but not gorillas. In the palm-in hand position, significantly greater pressure is applied to
digits 2 and 5 than in the palm-back position for chimpanzees (digit 2: t = 3.9, df = 107, P
< 0.001; digit 5 t = 2.99, df = 108, P = 0.003). Digit 3 is not significantly different but
greater pressure is seen in the palm-in position (t = 1.74, df= 108, P = 0.08). Digit 4
received significantly greater pressure in the palm-back position (digit 4 t = -1.9, df = 74,
P = 0.05). No significant differences in pressure application to the digits were seen in
gorillas in the palm-back versus palm-in hand positions. However, this result could be
affected by the lower frequency of palm-in steps used by this taxon.
T-tests comparing pairwise differences between the maximum pressures (N/cm2)
for digits 2-5 for each walking bout were conducted for adult chimpanzees and gorillas.
Within chimpanzees, only pairings with digit 5 show a significant difference. Digit 5
receives significantly less pressure than digit 2 (t = 8.58, df = 109, P < 0.001), digit 3 (t =

25
11.96, df = 109, P <0.001), and digit 4 (t = 9.69, df = 109, P <0.001). The amount of
pressure placed on digits 2, 3, and 4 is not significantly different for this species when
individuals are pooled. For gorillas, only pressure values for digits 2 and 4 do not differ
significantly in the pooled adult samples. Digit 3 is significantly greater than digit 2 (t = -
2.05, df = 35, P = 0.048), digit 4 (t = 3.2, df = 34, P = 0.003), and digit 5 (t = 5.22, df =
31, P < 0.001). Digit 5 is significantly lower than digit 2 (t = 3.51, df = 31, P = 0.005),
and digit 4 (t = 3.3, df = 31, P = 0.002). When paired t-tests are run for individual
chimpanzees and gorillas, results are quite different for the gorillas. Only one gorilla
shows significant differences in pressure application across her digits (Table 2.3); the
others distribute pressure evenly across digits 2-5.
Manual morphology in gorillas and chimpanzees.
Chimpanzees and gorillas possess different digit length patterns within the manus.
ANOVA tests showed significant differences between the metacarpal plus proximal
phalanx lengths of digits 2-5 within chimpanzees (F = 83.61, df = 3, P <0.001) and
gorillas (F = 34.22, df = 2, P < 0.001). In chimpanzees, only digits 2 and 4 do not differ
significantly in length (mean difference = 4.29 mm, SE = 2.05, P = 0.136). Digit 3 is
significantly longer than digit 2 (mean difference = 6.96 mm, SE = 2.05, P < 0.005), digit
4 (mean difference = 11.17, SE = 2.07, P < 0.001) and digit 5 (mean difference = 30.87,
SE = 2.07, P <0.001), and digit 5 is significantly shorter than 2 (mean difference = -
23.99, SE = 2.05, P < 0.005), 3 (mean difference = -30.87, P < 0.001), and 4 (mean
difference = -19.69, SE = 2.06, P < 0.001). For gorillas, digit 5 is significantly shorter
than digit 2 (mean difference = -16.2, SE = 2.2, P < 0.001), digit 3 (mean difference = -
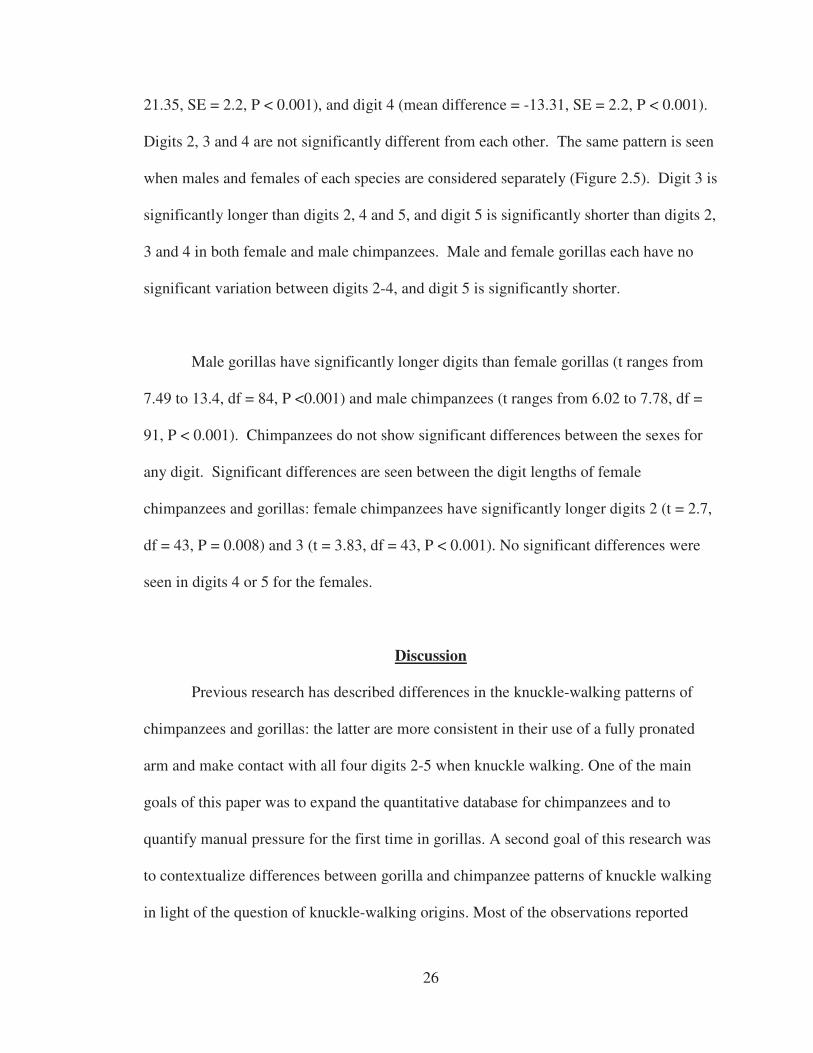
26
21.35, SE = 2.2, P < 0.001), and digit 4 (mean difference = -13.31, SE = 2.2, P < 0.001).
Digits 2, 3 and 4 are not significantly different from each other. The same pattern is seen
when males and females of each species are considered separately (Figure 2.5). Digit 3 is
significantly longer than digits 2, 4 and 5, and digit 5 is significantly shorter than digits 2,
3 and 4 in both female and male chimpanzees. Male and female gorillas each have no
significant variation between digits 2-4, and digit 5 is significantly shorter.
Male gorillas have significantly longer digits than female gorillas (t ranges from
7.49 to 13.4, df = 84, P <0.001) and male chimpanzees (t ranges from 6.02 to 7.78, df =
91, P < 0.001). Chimpanzees do not show significant differences between the sexes for
any digit. Significant differences are seen between the digit lengths of female
chimpanzees and gorillas: female chimpanzees have significantly longer digits 2 (t = 2.7,
df = 43, P = 0.008) and 3 (t = 3.83, df = 43, P < 0.001). No significant differences were
seen in digits 4 or 5 for the females.
Discussion
Previous research has described differences in the knuckle-walking patterns of
chimpanzees and gorillas: the latter are more consistent in their use of a fully pronated
arm and make contact with all four digits 2-5 when knuckle walking. One of the main
goals of this paper was to expand the quantitative database for chimpanzees and to
quantify manual pressure for the first time in gorillas. A second goal of this research was
to contextualize differences between gorilla and chimpanzee patterns of knuckle walking
in light of the question of knuckle-walking origins. Most of the observations reported

27
here are consistent with earlier accounts of dynamic pressure patterns in chimpanzees
(Wunderlich and Jungers 2009) and with observational and kinematic accounts of
chimpanzees and gorillas (Inouye 1994; Tuttle 1967). Chimpanzees do indeed display
greater variation than gorillas in their touch-off digit preference and in hand position.
However, this paper also shows that hand position is a major factor influencing touch-off
and maximum pressure in both chimpanzees and gorillas. In the palm-back position,
chimpanzees touch off mainly with digit 3, because of the position of digit 3 with the
palm facing backwards. In the palm-in position, digit 2 is most forward and touch-off
occurs more frequently on digit 2. Gorillas differ from chimpanzees because their digits
are more evenly aligned. Gorillas show no differences in pressure application based on
hand position and show more even distribution of pressure across the manus in any given
step. Both taxa place significantly less pressure on digit 5 than the other elements.
Inouye (1994) showed that gorillas have relatively shorter metacarpals and less
variable phalangeal lengths than chimpanzees. Skeletal data presented here confirm these
observations. This difference between gorillas and chimpanzees in manual morphology
and the knuckle-walking platform affects which digit is placed farthest forward in a given
hand position. It therefore affects which digit is most likely to receive maximum
pressure and thus serve as touch-off digit. Given the forward placement of digit 3 in
chimpanzees when the manus is in the palm-back position, the shift in function of digit 3
in these animals is unsurprising. A similar shift does not occur in gorillas, precisely
because of the more even alignment of the digits.

28
More research is needed to determine the adaptive value to chimpanzees of digit length
variability. Although both species travel terrestrially via knuckle walking, chimpanzees
spend more time in suspensory postures than gorillas (Doran 1993; 1997; Inouye 1994;
Tuttle 1967). The more even ray lengths within the manus of gorillas may create a more
stable, even platform across which the heavier gorillas can distribute their weight when
knuckle walking. While it is unclear if the variation in digit lengths of chimpanzees is
functionally adaptive to suspension, it is has been shown that the relatively longer manual
digits of chimpanzees are biomechanically more efficient for an enhanced grip during
climbing and suspension (Cartmill, 1985; Susman, 1979). Chimpanzee and gorilla
pressure pattern differences while knuckle walking may thus reflect differences in
manual morphology, in turn related to variation in positional behavior – i.e., the relative
amount of time spent climbing, in forelimb suspension or knuckle walking.
They may therefore provide little support for a convergent origin of knuckle walking.
To be sure, this research documents behavioral differences that can be marshaled
in support of convergence. However, the pattern of manual pressure distribution observed
when gorillas knuckle walk also occurs in chimpanzees; gorillas exhibit, in effect, a
subset of the individual variability of chimpanzees. Chimpanzees use the palm-back
hand position preferred by gorillas in approximately half the walking bouts recorded.
They also, like gorillas, use either digit 2 or 3 as the final contact for the step in this hand
position. The main factor affecting touch-off digit for both species is the placement of
the individual rays in each hand position. Touch off is most likely to occur on those
digits that are farthest forward in the direction of movement. To be certain, there are

29
some morphological features of the gorilla manus that do not characterize chimpanzees,
specifically the relatively shorter metacarpals and phalanges and decreased variability in
digit length across the manus. These differences do not preclude knuckle walking from
being ancestral for gorillas and chimpanzees (and by implication, humans). Extant
gorillas have a hand morphology that reflects their greater reliance on knuckle walking.
The greater variation in both manual morphology and knuckle-walking patterns of
chimpanzees may reflect an ancestral condition of greater suspension coupled with
limited terrestrial knuckle walking.
Conclusions
Chimpanzees use a great variety of hand positions during knuckle walking which
affects how pressure is distributed and which digit receives maximum pressure. In
contrast, gorillas are less variable in their hand placement. They use a palm-back hand
orientation and use digits 2 and 3 as the touch-off digit. Hand position is an important
factor influencing which digit propels the hand into the subsequent step. Thus, the touch-
off digit is significantly correlated with the digit that has maximum pressure in a given
walking bout. The variability of hand orientation of chimpanzees alters which digit is the
touch-off and which receives maximum pressure. Chimpanzees touch-off frequently
using digit 3 in the palm-back position; however pressure shifts radially and is highest on
2 or 3 in the palm-in position. Gorillas show less variation in pressure application across
the digits and spread weight more evenly across the manus.
30
The similarities of chimpanzees and gorillas support a common origin for knuckle
walking. The primary difference between the two (i.e., chimpanzees’ greater reliance on
digit 3 in the palm-back position) can be related to morphological differences in the
structure of the hand. Chimpanzees have greater variation in digit length within their
hands, while gorillas have relatively shorter rays and less length variation. Proportionally
longer digits with greater length variation provides for an “uneven” platform for weight
distribution during knuckle walking. The more even platform for weight distribution in
gorillas may have evolved with their decreased reliance on forelimb suspension and
climbing, coupled with an increased reliance on terrestrial knuckle walking.
Acknowledgements
I thank Dr. Daniel Povinelli, Ambre Brewster, Tobyn Lavergne, Leo Loston,
James Reaux, Anthony Rideaux, and John Sharp of the Cognitive Evolution Group
(University of Louisiana, Lafayette) for access to and help with the chimpanzee
participants of the pressure study. I also thank Drs. Sue Margulis, Elizabeth Lonsdorf,
and Stephen Ross, and Maureen Leahy, Dominic Calderisi, Jill Moyse and other keepers
and staff of the Lincoln Park Zoo (Chicago, Illinois); and Fred Beall, Jeannine Jackle,
Daniel Mclaughlin, Rachel Jakosalem, Brandi Baitchman, Paul Luther and Shannon Finn
of the Franklin Park Zoo (Boston, Ma) for access to and assistance with the gorilla
participants. Special thanks to Drs. Laurie Godfrey, Joseph Hamill, Brigitte Holt,
Margery Coombs, Stephen King, and Marina Blanco for their guidance during the
completion of this project, as well as Kristen Alldredge, Cortni Borgerson, and Steven
Matarazzo Jr. who provided support and assistance throughout the project. This project

31
was approved by University of Massachusetts, Amherst IACUC and the animal care
institutions/advisors where animals were housed. The project was supported by The LSB
Leakey Foundation (#129980) and the Wenner-Gren Foundation (Gr. 7628).

32
Table 2.1: Highest digit pressure values for each scored contact step.
Genus Sex/Age (yrs)/
Weight (kg)
Name Scored
Contacts
Number of times
digit experienced
peak pressure for
scored contacts
II III IV V
Pan M/ 18/ 68 Apollo 18 4 9 4 1
F/ 18/ 54 Mindy 10 6 4
F/ 18/ 59 Jadine 11 3 4 3 1
F/ 18/ 49 Candy 10 4 1 3 2
F/ 18/ 43 Brandy 25 10 1 14
F/ 18/ 75 Kira 36 17 11 8
F/ 3/ 9.5 Manetta* 15 6 4 3 2
M/ 3/ 12 Zack* 31 2 7 9 13
Gorilla M/19/195 Kwan 5 2 1 2
F/ 18/63 Bulera 5 3 1 1
F/ 12/54 Madini 12 2 7 3
M/ 2/18 Amare* 2 2
M/ 18/168 Okie 4 2 1 1
M/ 18/184 Little Joe 2 1 1
F/ 39/111 Gigi 6 3 1 1 1
F/ 30/103 Kiki 2 2
*juvenile

33
Table 2.2: Average pressure (N/cm2) placed on digits 2-5.
Genus Individual Digit 2 Digit 3 Digit 4 Digit 5 Touch-off Pressure
Pan Kira 3.15 2.42 2.41 1.1 3.18
Brandy 2.64 2.4 2.94 0.62 3.09
Mindy ** 2.33 2.16 1.25 2.46
Jadine 1.61 1.69 1.52 0.87 1.76
Candy 2.64 2.39 2.03 1.49 2.63
Apollo 2.51 3.06 2.34 1.94 3.0
Manetta* 0.79 1.05 0.98 0.3 1.21
Zack* 0.65 1.16 1.49 1.28 1.13
Gorilla Bulera 2.36 2.92 2.16 1.48 3.38
Medini 1.65 2.63 1.93 0.93 2.41
Kwan 1.98 2.16 1.12 0.86 2.2
Gigi 1.1 2.17 1.07 0.87 2.18
Okie 1.45 1.4 1.63 1.13 1.6
Joe 1.15 0.65 1.2 0.6 1.15
Kiki 1.15 0.9 0.6 0.35 1.15
Amare* 1.3 1.2 0.55 0.0 1.2
*Juvenile **Mindy’s values for digit 2 excluded from analyses. Middle phalanx does not make contact with ground surface.

34
Table 2.3: Results of paired T-test examining peak pressures of digit 2-5. Analysis included adults only.
Genus Individual D2-D3 D2-D4 D2-D5 D3-D4 D3-D5 D4-D5
Pan Kira ** ** ** NS ** **
Brandy NS NS ** NS ** **
Mindy NS * **
Jadine NS NS * NS ** **
Candy NS NS NS NS NS NS
Apollo * NS NS * ** NS
Gorilla Bulera NS NS NS NS * NS
Medini * NS * * ** *
Kwan NS NS NS NS NS NS
Gigi NS NS NS NS NS NS
Okie NS NS NS NS NS NS
Joe NS NS NS NS NS NS
Kiki NS NS NS NS NS NS
*P<0.05 **P<0.001 NS=Not significant D# = Digit #

35
Figure 2.1: Pressure distribution output of the right hand of a female chimpanzee. Hand is oriented in the palm-in position. Initial contact is made with digit 5 and the center of pressure (black line) moves towards 2. Final touch-off and maximum pressure occurs at digit 2.

36
Figure 2.2: Pressure distribution outputs of the right hand of a male chimpanzee. Touch-off and maximum pressure is at digit 2 in the palm-in position (a.) and digit 3 in the palm-back position (b).

37
Figure 2.3: Pressure distribution outputs of the right hand of a female gorilla. Touch-off and maximum pressure occurs at digit 2 in both hand positions. (a) palm-in (b) palm-back
38
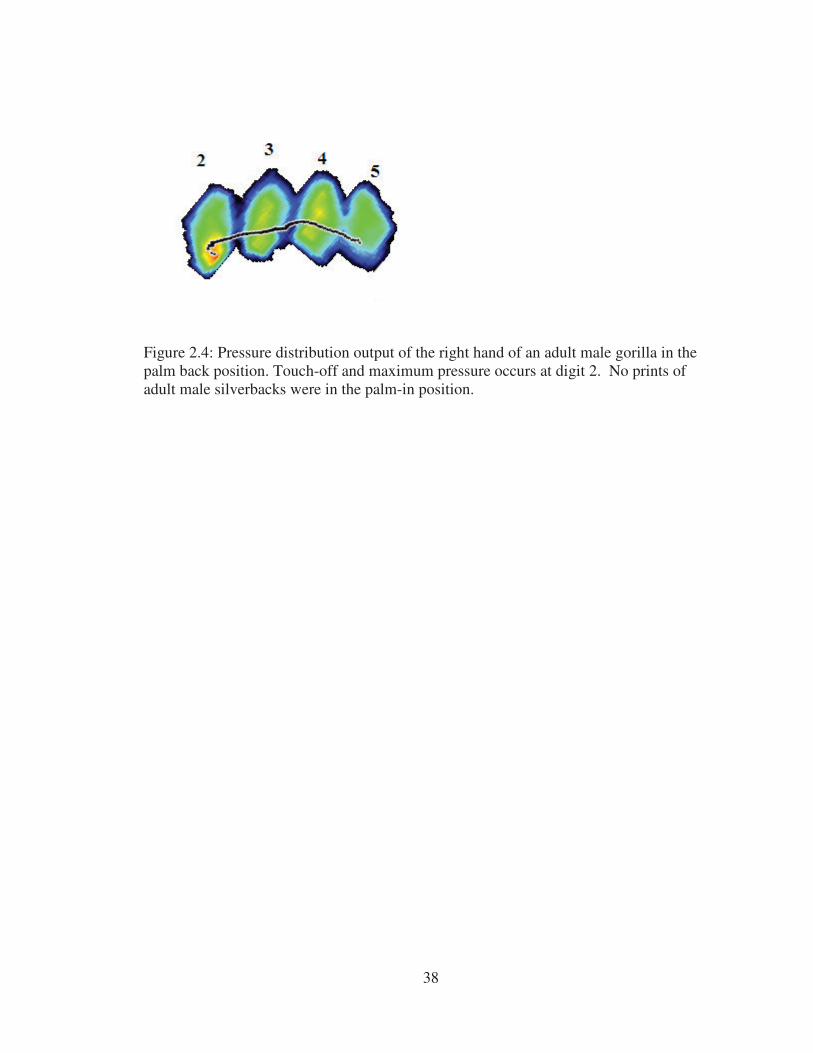
Figure 2.4: Pressure distribution output of the right hand of an adult male gorilla in the palm back position. Touch-off and maximum pressure occurs at digit 2. No prints of adult male silverbacks were in the palm-in position.

39
Figure 2.5: Mean values of metacarpal plus proximal phalangeal lengths for chimpanzee and gorilla males and females. Gorillas show a “flatter” pattern indicating less variability between digits 2-5.
40
CHAPTER 3
MANUAL PHALANGEAL CURVATURE AND
KNUCKLE WALKING IN AFRICAN APES
Abstract
The morphology of primate manual phalanges is directly affected by the loads
inflicted during locomotion. The degree to which these elements are curved has been
used to infer the use of suspensory or non-suspensory locomotion in primates. Matarazzo
(2008) constructed an index comparing the curvature values of the middle and proximal
phalanges of digit 3 (the Index of Relative Curvature) to differentiate knuckle walkers
from quadrupeds and brachiators. This index worked well for extant species, but its
applicability to the fossil record remained untested. Given the infrequency with which
phalanges are recovered in the fossil record and the difficulty of assigning such elements
to the proper digits or individuals, it must be determined if the locomotor signal seen
within digit 3 also exists: (1). in other rays, (2). when elements belonging to different rays
of the same hand are used in the comparison, and (3). when elements belonging to
different individuals of the same species are compared. The present study extends
previous analysis by examining the relative curvature of the proximal and middle
phalanges of digits 2, 4 and 5, in addition to 3. The study includes knuckle-walking (Pan
troglodytes and Gorilla gorilla), quadrupedal (Macaca fascicularis, M. nemestrina and
Sapajus apella), and suspensory (Pongo pygmaeus, Hylobates lar, and Ateles spp.)
primates. The Indices of Relative Curvature composed of elements from a single ray, and
those indices derived from curvature values of middle and proximal phalanges of

41
different rays (2-5) are both successful in discriminating between locomotor categories.
Indices comprised of elements from different individuals have means similar to those
indices derived from proximal and middle phalanges of the same individual’s ray. This
suggests that Indices of Relative Curvature can be applied successfully to fossils and
other cases for which digit identity cannot be ascertained, and for which isolated
proximal and middle phalanges may not belong to a single digit.
Introduction
The transition from quadrupedalism to bipedalism in the hominin lineage has
been the subject of considerable debate (Begun, 1993; Shea and Inouye, 1993; Dainton
and Macho, 1999; Corruccini and McHenry, 2001; Dainton, 2001; Kelly, 2001; Lovejoy
et al., 2001; Richmond and Strait, 2000, 2001a, b; Richmond et al., 2001; Inouye and
Shea 2004; Kivell and Schmitt 2009; Williams 2010). Did this transition involve a
knuckle-walking phase, or was the pre-bipedal ancestor of modern humans more
suspensory? Past research on the morphology of the manual phalanges and wrists of
extant primates and early hominins has not provided a resolution to this debate. This
paper examines the curvature of both the proximal and middle manual phalanges of digits
2-5 in an attempt to provide an alternative source of information. While proximal
phalangeal curvature has been linked biomechanically to suspensory behaviors in
primates, middle phalangeal curvature has yet to receive significant scrutiny. Phalangeal
curvature has been shown to be epigenetically sensitive to variation in locomotor
behavior (Richmond, 1998) and thus to confer evidence of lifetime activity patterns
making it an effective tool for paleontological inference. The curvature of the proximal
42
phalanges of the manus of primates varies in conjunction with levels of suspension
(Susman, 1979; Richmond, 1998; 2007; Jungers et al., 1994; 1997; 2002). Using finite
element analysis, Richmond (1998; 2007) showed that strain magnitudes are lower in the
highly curved manual proximal phalanges of siamangs under suspension than they would
be, under similar loading conditions, if those same phalanges were straight. This implies
that the high stresses generated during gripping and manual flexing in arboreal settings
are resisted by some measure of phalangeal curvature (Jungers et al., 2002). Ontogenetic
studies of the proximal phalanges of extant primates reveal that phalangeal curvature
changes as the positional behavior of individuals change, most probably via bone
modeling and remodeling in response to mechanical stresses (Richmond, 1998; 2007).
Although the extent of curvature may be genetically limited, it is clear that a
biomechanical signal is preserved within the proximal phalanges. However, ontogenetic
and finite element studies of the manual middle phalanges have not been conducted.
Thus, we do not know the extent to which manual middle phalanges are affected by a
locomotor stresses. Matarazzo (2008) showed that taken alone, the middle phalanges of
digit 3 are not successful at discriminating between locomotor categories.
During knuckle walking, the metacarpophalangeal (MCP) joints are in a
hyperextended position and weight is borne primarily on the dorsal aspects of the middle
phalanges of digits 2-4 (Tuttle, 1969; Marzke & Wullstein, 1996; Wunderlich & Jungers,
1998). Tuttle (1969) noted that the tensile forces placed on the digits during knuckle
walking are largely ameliorated by ligaments and tendons which are “strengthened” when
the hand is in the knuckle-walking position. This would leave compression as the main

43
force acting upon the middle phalanges. Thus, one would predict that the middle
phalanges should be relatively straighter than the proximal phalanges to allow for
increased ground-to-digit surface contact and greater dissipation of the compressive force
along these elements (Richmond et al., 2001).
In the case of non-knuckle-walking digitigrade quadrupeds such as macaques,
flattened middle phalanges are expected for entirely different reasons. Typically in
digitigrade quadrupedalism, the MCP joints of digits 2-5 are hyperextended with the
metacarpals held in a vertical position (Hayama et al, 1994). The palmar aspects of the
distal phalanges are the primary contact with the substrate and the manual rays are held at
an acute angle to the ground surface. Using finite element analyses of the proximal
phalanges of patas monkeys and macaques, Richmond (1998) showed that, in terrestrial
walking, straighter phalanges withstand high compressive joint reaction forces better than
do curved phalanges. He also postulated that patas-like manual postures would be nearly
impossible with highly curved phalanges, as they would require “an improbable degree of
hyperextension” at the MCP joint (Richmond, 1998, p. 208).
Most primate species’ middle phalanges are subject to forces similar to those
experienced by the proximal phalanges and thus would be expected to show similar
degrees of curvature. This is true for non-knuckle-walking quadrupeds for which lower
degrees of curvature are expected for both proximal and middle phalanges and for more
suspensory primates where one might expect high phalangeal curvature for both
elements. Knuckle walkers, however, experience markedly different force regimes on the
proximal and middle phalanges. Thus, different degrees of curvature should characterize

44
the proximal and middle phalanges. Matarazzo (2008) has shown, that the middle
phalanges of digit 3 are flatter than the corresponding proximal phalanges. It is unclear
however, if this pattern can be seen within the other digits due to noted differences in
pressure application. Digits 2-5 experience different degrees of pressure applications
during knuckle walking: digit 5 receives less pressure, and presumably less mechanical
stress, than the other rays. Chimpanzees and gorillas apply pressure in a fairly similar
manner across digits 2, 3, and 4 when knuckle walking (although minor differences exist
between taxa) (Matarazzo, this dissertation, Ch. 2). Chimpanzees alter hand position
more frequently from palm-back (hand facing posteriorly) to palm-in (hand facing toward
body) which causes a shift in highest pressure point from digit 3 (palm-back) to digit 2
(palm-in). Individual chimpanzees are also more likely to apply no pressure to digits 2 or
5 in a given knuckle-walking bout (those digits are held in a flexed position and do not
make any ground contact). In contrast, gorillas utilize the palm-back hand posture
consistently and make contact with all four digits 2-5 with greater frequency than
chimpanzees. Terrestrial, quadrupedal olive baboons show an entirely different pressure
pattern, one that varies in a consistent manner with speed (Patel and Wunderlich, 2010).
Patel and Wunderlich (2010) showed that baboons make initial ground contact with the
distal phalanges and only occasionally involved the middle and proximal phalanges
during terrestrial locomotion. Ground contact shifts from the distal phalanges directly to
the metacarpal heads. Increased palmar contact is made at higher velocities, and pressure
is consistently highest in the palmar region near the metacarpal heads of digits 3 and 4.
Both pressure studies show that the least amount of pressure is placed upon digit 5.
45
In general, the pollex (digit1) is easily discernable in the fossil record and not
consistently used by different taxa during terrestrial locomotion so it is not considered in
the following analyses. The elements of digit 5, however, can be more difficult to
distinguish and do experience pressure (albeit lightly) and thus will be included in all
examinations.
A prior study (Matarazzo, 2008) of the relative curvature of the proximal and
middle phalanges of the third digit of chimpanzees, gorillas, capuchins, spider monkeys,
orangutans, gibbons and macaques succeeded in identifying differences between knuckle
walkers, brachiators, and non-knuckle walking quadrupeds using an “Index of Relative
Curvature” (middle phalangeal curvature/proximal phalangeal curvature). Brachiators
have relatively equal proximal and middle curvature values and thus index values
approximating 1.0; quadrupeds have greater curvature in the middle phalanges than
proximal, and thus indices greater than 1.0, and knuckle walkers possess flatter middle
phalanges and curved proximal, and thus indices considerably lower than 1.0 (~0.85).
This study focused solely on the third manual ray.
The following dissertation chapter examines the proximal and middle phalanges
of digits 2-5 to see if the locomotor signal displayed by digit 3 also holds for the other
manual rays. Given the sparse nature of the fossil record in which discovery of
corresponding phalanges from a single digit is rare, an examination of indices composed
of elements from different rays is also conducted.

46
Samples and Methods
Phalangeal curvature of digits 2-5 was assessed for 234 individuals representing
four locomotor categories: knuckle walkers (Pan and Gorilla), quadrumanous climbers
(Pongo), brachiators (Ateles and Hylobates), and quadrupeds (Sapajus and Macaca)
(Table 3.1). Individuals were included in the sample if epiphyses on all manual skeletal
elements were fused and if both the proximal and middle phalanges for each digit were
present. Phalangeal curvature was measured using the procedure outlined in Jungers et
al. (1997); this method was used previously to assess curvature in the third ray
(Matarazzo, 2008). Curvature values are calculated based on three measures: projected
height (H), dorso-palmar midshaft diameter (D), and interarticular length (L) (Figure
3.1). These measures are used to calculate the radius of curvature (R) using the following
equation:
R = [(H – D/2)2 + (L/2)2]/[2(H – D/2)]. The angle of curvature (theta �) is calculated with the following equation: � = 2 * arcsin(L/2R). The resulting angle is converted from radians to degrees by multiplying by 57.295. To
capture the relationship between curvatures of the proximal (Px) and middle (Md)
phalanges of each manual digit, an Index of Relative Curvature (Md curvature/Px
curvature) was calculated.
Degrees of curvature for both the proximal and middle phalanges and Indices of
Relative Curvature (IRC) were analyzed using SPSS statistical software Version 20.0.

47
Given the size disparity between male and female gorillas and the individual variation in
pressure output noted in chimpanzees (Matarazzo, this dissertation, Chapter 2), t-tests
were used to assess differences between sexes for proximal and middle phalangeal
curvature, as well as the Indices of Relative Curvature for corresponding digital elements.
ANOVAs with Tukey’s HSD were also used to check for significant differences between
genera for proximal and middle phalangeal curvature values and Indices of Relative
Curvature. Within-manus comparisons were also analyzed using a general linear model
with Tukey’s post hoc tests of honestly significant differences.
Curvature profiles, i.e. the pattern of highest to lowest phalangeal curvature (md
and px) within a manus, was determined for each taxon. This is a description of variation
across the manus. These profiles were qualitatively compared between taxa to determine
if there were similarities between taxa assigned to the same locomotor category.
Indices of Relative Curvature were also calculated using non-corresponding
elements of rays 2-5; for example, the middle phalanx of digit 2 (md2) might be divided
by proximal phalanx of digit 3 (px3). This would be designated “IRC md2/px3”.
Differences between locomotor categories for these indices were assessed using Tukey’s
HSD.
A discriminant function analysis (DFA) was run to determine whether genera that
differ most from each other also belong to different locomotor groups. Locomotion was
not included as a variable; rather the IRC scores of corresponding and non-corresponding
48
digits were used to discriminate among taxa and the DFA function scores were saved.
Euclidean distances between genus centroids for those function scores were subsequently
also generated to test the hypothesis that IRC scores really do distinguish among species
belonging to different locomotor “groups”. Anova with Tukey’s HSD was run to assess
differences in IRC scores of corresponding and non-corresponding elements between
locomotor categories.
Bootstrapping analysis (in which IRC values were constructed by combining
middle and proximal curvature values taken from any two individuals, male, female, or
both, was conducted for each taxon. One thousand iterations of each index were
produced. Resulting distributions were compared with the distributions created from
corresponding elements and to those created from non-corresponding elements within
individual hands for each taxon.
Results
Basic Curvature and Index Values
Mean curvature values (degrees) for the middle and proximal phalanges are
presented in Table 3.2. Indices of relative curvature were calculated for phalanges within
the same ray (digits 2-5) (Table 3.3) and for middle and proximal phalanges of different
rays from within the same manus for each taxon (Table 3.4).
Sex Differences
T-tests comparing the middle and proximal phalangeal curvature values and IRC
scores of corresponding digital elements between the sexes revealed no significant

49
differences in Ateles spp, Hylobates lar, or Macaca spp. Only the larger bodied species,
and occasionally Sapajus, show some significant differences between the sexes, but not
in any consistent manner. Pan troglodytes males and females had significantly different
values for IRC5 (t = -2.92, df = 50, P = 0.006); Gorilla gorilla males and females for IRC
2 (t = -2.03, df = 83, P = 0.047); and Sapajus apella males and females for IRC 4 (t = -
2.54, df = 9, P = 0.03). Pongo pygmaeus males and females had no significant
differences in IRC values but were significantly different for proximal phalangeal
curvature of digit 3 (t = 2.2, df = 35, P = 0.04), middle phalangeal curvature of digits 2-5
(Md2: t = 2.5, df = 34, P = 0.02; Md3: t = 2.8, df = 35, P = 0.008; MD4: t = 3.38, df = 35,
P = 0.002; MD5: t = 2.9, df = 33, P = 0.007).
Differences among Taxa for Individual Elements
Between taxon differences in the middle and proximal phalangeal curvature
values do not show a pattern that can be correlated in a simple fashion with between-
taxon differences in locomotion. ANOVAs with a Tukey’s HSD reveal a number of
significant differences between elements for included taxa (Tables 3.5 and 3.6).
Orangutans have significantly higher proximal phalangeal curvature values for digit 2-5
than all other taxa, and significantly higher middle phalangeal values for digits 2-5 than
chimpanzees and gorillas and digits 2-4 for macaques, capuchins, and gibbons.
Chimpanzees have significantly greater proximal phalangeal curvature than capuchins
and macaques, but are not significantly different from these taxa for middle phalangeal
curvature values. Gorillas have significantly greater proximal phalangeal curvature than

50
chimpanzees for digits 2-5 but do not differ from them in middle phalangeal curvature
values.
The curvature profiles differ by taxon, except for chimpanzees and gorillas, which
exhibit identical patterns. In addition, the most suspensory taxa have similar although not
identical digit curvature profiles. For chimpanzees and gorillas, proximal and middle
phalangeal curvature is greatest in digit 5 and decreases in the following pattern for the
proximal phalanges: Px5> Px2> Px4> Px3; and for middle phalanges: Md5> Md2>
Md3> Md4. The middle phalanges of digits 3 and 4, which bear substantial weight
during knuckle walking, are the least curved (Matarazzo, this dissertation, Chapter 2).
The most suspensory apes, gibbons and orangutans, have different phalangeal patterns
but both have greatest middle phalangeal curvature on digits 3 and 4 and least on digits 2
and 5 (gibbons Md4 > Md3 > Md5 > Md2; orangutans Md3 > Md4 > Md2 > Md5). The
knuckle walkers have significantly flatter middle phalanges than the more suspensory
apes (Table 3.7).
Within-manus Differences
The curvature and IRCs for digits 2-5 for non-knuckle-walking taxa are similar
across the manus. Knuckle-walking taxa show a similar pattern of curvature that is not
seen in other taxa. A Tukey’s test of Honestly Significant Differences comparing the
phalangeal curvature values and IRC values of digits 2-5 revealed no significant
differences between the rays for Pongo, Sapajus, and Hylobates. The digits of Pan did
not differ significantly in their proximal phalangeal curvature values. Significant

51
differences among digits were seen in the middle phalangeal values and IRC scores,
specifically, homogeneous subsets for chimpanzee group digits 3 and 4 (subset 1) and
digits 2 and 5 (subset 2) for both middle phalangeal and IRC values respectively (Table
3.8). Gorilla shows a similar pattern for middle phalangeal curvature values: digits 2 and
5 (subset 2) have significantly greater curvature than digits 3 and 4 (subset 1) (Table 3.9).
However, there is considerable overlap in proximal phalangeal curvature values and IRC
scores for these taxa: digits 3 and 4 comprise subset 1, and digits 3, 2, and 5 are within
subset 2. Digit 5 has significantly greater proximal phalangeal curvature than digit 3 (P =
0.027, SE = 0.70), and digit 4 of Gorilla has a significantly lower IRC score than those of
2 and 5 (P < 0.001, SE = 0. 01). Both Macaca and Ateles show no significant difference
between the rays for proximal and middle curvature values. However, in Macaca digit 4
has a significantly lower IRC score than digit 5 (P = 0.024, SE = 0.04), and for Ateles;
digit 3 has a significantly lower IRC score than digit 5 (P = 0.029, SE = 0.04).
Locomotor and Taxon Differences
Functions 1 and 2 of the discriminant function analysis run to distinguish among
taxa using IRC scores comprised from corresponding and non-corresponding elements
were statistically significant (P < 0.001). All raw variables were highly positively
correlated with Function 1. Several indices showed a negative correlation with Function
2 (md4/px5, md3/px5, md4/px2, and IRC4). Function 1 accounts for 81.7% of total
variance and Function 2 for 9.5%. The DFA correctly classified 66.2% of the original
grouped cases. Function 1 polarizes, on the one hand, macaques and capuchins (with
positive scores) and chimpanzees, gorillas, and orangutans (with negative scores).

52
Gibbons and spider monkeys lie between these groups along Function 1. The Euclidean
distances between group centroids for Functions 1 and 2 show that taxa attributed to the
same locomotor categories based on behavioral research are indeed closer to one another
than to taxa belonging to different locomotor groups (Table 3.10). The centroids of Pan,
Gorilla, and Pongo are closer to each other than to any of the other taxa; with Pan and
Gorilla closer to one another than either is to Pongo. The placement of Pongo near the
knucklewalkers is a function of them having similar values for the indices but as shown
above, they have significantly greater phalangeal curvature values than Pan and Gorilla.
The centroids of quadrupeds Macaca and Sapajus are relatively close to one another;
however, they are also not far from Hylobates. The centroids of Hylobates and Ateles are
closer to one another than to any other included taxon. The close proximity of the
centroids of Hylobates and Ateles, and also the close proximity of the centroids of
Sapajus and Macaca is a strong indication of a functional signal given the phylogenetic
distance between the two genera in each pairing.
An ANOVA with Tukey’s test of HSD was also run to compare the IRC scores of
assigned locomotor categories. The IRC scores from corresponding and non-
corresponding elements revealed significant differences between locomotor groups (F
values range from 42.4 to 97.3; P < 0.001) (Tables 3.11-3.13). All locomotor groups
differed significantly in their IRC scores for digit 3. The IRC scores for digits 2 and 5
were significantly different for all locomotor categories except knuckle walkers and
quadrumanous climbers. IRC 4 did not differ significantly for quadrupeds vs.
brachiators. Knuckle walkers and quadrumanous climbers do have significantly different

53
IRC values for 56% of the indices derived from corresponding and non corresponding
elements (Tables 3.11 and 3.14). Quadrupeds are distinguished from all other locomotor
categories in all IRC scores with the exception of brachiators. Quadrupeds and
brachiators have similar values for IRC4, Md4/Px2, Md3/Px5, and Md4/Px5. Although
not every index is capable of discriminating between all locomotor categories, we see
significant differences in a number of them. Knucklewalkers are successfully
differentiated from quadrupeds and brachiators with every included index (Table 3.14).
Bootstrapping conducted for each IRC score (of corresponding and non-
corresponding elements) for each taxon resulted in means that did not differ significantly
from those index values created from within an individual’s own manus (see Appendix
2).
Discussion
The analyses reported here reveal that the knuckle walkers do indeed possess
relatively straight middle phalanges as compared to their corresponding proximal
phalanges for digits 2-5. The knuckle walkers included in this study (Pan troglodytes,
Gorilla gorilla gorilla and G. g. beringei) frequently travel terrestrially via knuckle
walking, but also spend varying amounts of time using suspensory postures (Tuttle, 1969;
Inouye, 1994; Doran, 1997). During knuckle walking, the ground surface is contacted by
the dorsal surfaces of the middle phalanges placing a considerable amount of
compressive force onto the middle phalanges. Thus it was expected that these elements

54
will be relatively straight allowing weight to be distributed across the middle phalanges
during locomotion.
Gorillas display a different pattern of weight distribution than chimpanzees when
knuckle walking. Digits 2-5 all contact the surface when gorillas knuckle walk.
However, weight appears to be placed primarily on the dorsal surfaces of the 2 and 3
middle phalanges (Tuttle, 1969; Inouye, 1994, Matarazzo, 2008, this dissertation, Chapter
2). In contrast, common chimpanzees emphasize digits 3 and 4, and occasionally keep
digit 2 flexed so that it may only lightly contact a substrate (Tuttle, 1969; Inouye, 1994).
Chimpanzees vary considerably in hand and digit posture when knuckle walking,
whereas gorillas consistently contact the ground surface with digits 2-5 and maintain their
hands in a fully pronated position while knuckle walking (Tuttle, 1969, Matarazzo, this
dissertation, Chapter 2).
Chimpanzees possess an interesting profile of curvature across the manus; Digit 2
has a similar IRC value to digit 5, and 3 to digit 4. This same pattern has been noted with
the absolute lengths of these digits (metacarpals plus proximal phalanges). Digits 3 and 4
are longer than 2 and 5 creating an “uneven platform” for knuckle walking (Matarazzo,
this dissertation, Chapter 2). During knuckle walking, weight is preferentially placed on
these digits and individuals may not even make contact with digits 2 or 5 (Matarazzo, this
dissertation, Chapter 2). Gorillas display a different pattern whereby there is a greater
similarity in IRC scores with digit 3 grouping with 4 and digit 3 with digits 2 and 5. This
pattern is also seen with the lengths of the rays giving gorillas a more even knuckle-

55
walking platform. Other included taxa (gibbons, spider monkeys, macaques, capuchins,
and orangutans) display similar IRC values for digits 2-5 alluding to more even
distribution of locomotor forces across the manus in these primates as well. When the
middle phalangeal curvature values are examined across the manus, chimpanzees and
gorillas are the only two taxa that have the same pattern of curvature. Digits 5 and 2 are
most curved and digits 3 and 4 are least curved. Digits 3 and 4 are frequently used as
“touch-off” digits during a knuckle-walking stride and receive greater amounts of
pressure than the lateral rays (Matarazzo, this dissertation, Chapter 2). The other apes,
orangutans and gibbons do not share a curvature pattern across the hand but both have
greater curvature on digits 3 and 4. These two digits (3 and 4) form the midline of the
hand and may experience greater forces during suspensory postures.
The discriminant function and Tukey’s analyses revealed similarities in the IRC
values of knuckle walkers and quadrumanous climbers. Similar results were also noted
in the original comparison of the IRC values for digit three (Matarazzo 2008). Whereas
the great apes do have similar IRC values, the structure of the rays are actually quite
different. The lower (~0.85) IRC scores of the knuckle walkers reflect their “flattened”
middle phalanges (curvature of ~48˚) coupled with more curved proximal phalanges
(~55˚). In contrast, orangutans have significantly higher curvature values in both
elements but the proximal (~64˚) exceeds the middle (~58˚). The flattened state of the
middle phalanges of the knuckle walkers is hypothesized to allow for greater contact of
the knuckle-walking surface and therefore enhanced dissipation of force along the manus.
High curvature values like those noted in the orangutan and brachiators have been shown

56
to be biomechanically more efficient during suspension by reducing stress along these
elements (Richmond, 1998). Several of the IRC values composed of non-corresponding
digital elements were capable of discriminating between all locomotor categories
including knuckle walkers and quadrumanous climbers.
Like the knuckle walkers, capuchins and macaques do not display comparable
proximal and middle curvature values. They possess relatively straight proximal
phalanges and moderately curved middle phalanges, and therefore Indices of Relative
Curvature greater than 1.0. This phalangeal pattern was not initially expected for these
quadrupedal primates. It was predicted that their middle and proximal phalanges would
experience similar forces during locomotion and thus show similarly low curvature
values. As these taxa use arboreal substrates at least some of the time (Rodman, 1979;
Cant, 1988; Burr et al., 1989; Garber and Rehg, 1999) their relatively high middle
phalangeal curvature values may reflect the biomechanical constraints of gripping
substrates, or more likely, climbing and infrequent use of suspension. Analyses also
reveal that the relatively small-bodied, highly suspensory taxa (Ateles spp. and Hylobates
lar) share a suite of phalangeal characteristics, including similar values for proximal
phalangeal curvature, middle phalangeal curvature, and the Index of Relative Curvature.
Both groups display relatively high values for proximal (second only to those of Pongo
pygmaeus) and middle phalangeal curvature, giving them Relative Curvature values that
approximate 1. Both practice a form of fluid brachiation and possess long curved digits 2-
5 and a reduced pollex (Garber and Rehg, 1999; Chang et al., 2000; Cant et al., 2001;
2003; Tague, 2002; Youlatos, 2002; Usherwood et al., 2003). Both inhabit tropical rain

57
forests with diverse vegetation, and in any given brachiation bout they may be required to
adjust to different superstrate diameters, shapes, slopes, and heights (Bertram, 2004).
Differences in forest structure may explain a wide range of observed variation in the
phalangeal curvature values within this group, but more research is needed to test such
hypotheses.
Pongo pygmaeus displays high degrees of both proximal and middle phalangeal
curvature in all four digits 2-5 which are significantly greater than those seen in the
knuckle walkers. Due to the extremely high curvature of their proximal phalanges
relative to the marked curvature of their middle phalanges, their values for the Index of
Relative Curvature are comparable to those of knuckle walkers, and significantly
different from the small-bodied agile brachiators (Ateles spp. and Hylobates lar) with
whom they were expected to group on the basis of their high degree of suspension.
However, although they are highly suspensory, Pongo pygmaeus does not practice
locomotor patterns similar to those of the agile brachiators. Their primary mode of
locomotion has been described as quadrumanous climbing which is characterized by use
of both hands and feet to grip branches as they move deliberately through the canopy
(Tuttle and Cortright, 1988). What must be emphasized here is that Pongo pygmaeus can
be distinguished from knuckle walkers when the Indices of Relative Curvature and
absolute proximal phalangeal curvature values are taken into consideration (Matarazzo,
2008). They also display a pattern of curvature across the manus that differs from the
African apes. Both chimpanzees and gorillas have relatively greater curvature on the
58
middle phalanges of digits 2 and 5 and less on digits 3 and 4, while orangutans show an
opposite pattern whereby the central digits (3 and 4) have increased curvature.
The existence of a clear knuckle-walking “signal” in the skeletal anatomy of the
hand may prove to be useful given the ongoing debate concerning knuckle walking in
hominin evolution (Begun, 1993; Shea and Inouye, 1993; Dainton and Macho, 1999;
Corruccini and McHenry, 2001; Dainton, 2001; Kelly, 2001; Lovejoy et al., 2001;
Richmond and Strait, 2000, 2001a, b; Richmond et al., 2001). This might open a new
venue for understanding the evolution of hominoid locomotion – one that centers
appropriately on those very elements of the hand that can be expected to have supported
body mass during ground locomotion in knuckle walkers.
Most notably, those indices composed of non-corresponding elements were as
successful at differentiating between locomotor groups as those composed of
corresponding elements of the same digit. Also bootstrapped data in which indices were
composed of elements from any individual within a species were not significantly
different from indices composed of elements from within a single manus. For fossils,
recovering a complete digit is rare. The ability to use non-corresponding middle and
proximal phalanges (even from different individuals) and still sort reliably between
categories is an invaluable tool.
Conclusions
Past studies of the manual proximal phalanges have revealed a relationship
between degree of suspension and phalangeal curvature, with highly suspensory animals

59
possessing the most curved proximal phalanges. This study supports this relationship for
the proximal phalanges of digits 2-5 and confirms the existence of the same tendency in
the middle phalanges (Table 3. 15).
Highly suspensory Hylobates lar, Ateles spp., and Pongo pygmaeus show
considerable curvature of both proximal and middle phalanges, knuckle walkers possess
relatively straight middle phalanges and curved corresponding proximal phalanges, and
non-knuckle-walking quadrupeds have relatively curved middle phalanges and straighter
proximal phalanges. These differences are consistent with expectations based on the
locomotor repertoires of these primates. Knuckle walkers, in particular, place a
considerable amount of compressive force onto their middle phalanges while
knucklewalking, and straighter middle phalanges allow for greater phalangeal surface
contact with the ground and more even distribution of weight throughout these elements.
In addition I show that the Indices of Relative Curvature for corresponding
elements of the same ray, from non-corresponding phalanges within the manus, and from
elements of different individuals provide a functional signal not accessible from either the
proximal or middle phalanges alone, that distinguishes knuckle walkers from other
quadrupeds as well as from highly suspensory species. Knuckle walkers (Pan
troglodytes, Gorilla gorilla) have relatively little curvature of the middle phalanges
coupled with marked curvature of the proximal phalanges (but not as marked as in Pongo
pygmaeus). The successful discrimination of locomotor groups with indices derived from

60
different individuals of the same species is particularly useful in the examination of fossil
elements where attribution of a phalanx to a particular individual or ray can be difficult.
Acknowledgements
I thank to Judith Chupasko of the Museum of Comparative Zoology at Harvard
University, Cambridge, MA, Lawrence Heaney of the Field Museum, Chicago, IL
(Department of Mammalogy), Yohannes Haile-Selassie of the Cleveland Museum of
Natural History, Cleveland, IL, Nancy Simmons of American Museum of Natural
History, New York (Department of Mammalogy), and Linda Gordon of the Smithsonian
Institution, Washington DC (Department of Mammalogy) for access to their skeletal
collections. I also thank Drs. Laurie Godfrey, Margery Coombs, Brigitte Holt, Joseph
Hamill, Steven King, and Marina Blanco for their helpful suggestions and guidance
during the completion of this research.

61
Table 3.1. Sample sizes by sex
Genus and species # Males # Females Total Locomotion
Gorilla gorilla 59 28 87 Knuckle walker
Pan troglodytes 35 18 53 Knuckle walker
Pongo pygmaeus 15 22 37 Quadrumanus climber
Hylobates lar 9 6 15 Brachiator
Ateles spp. 3 9 12 Brachiator
Macaca spp. 8 11 19 Quadruped
Sapajus apella 5 6 11 Quadruped

62
Table 3.2. Middle and phalangeal curvature means (in degrees) for included genera.
Genus and species
Px2 Px3 Px4 Px5 Md2 Md3 Md4 Md5
Gorilla gorilla 56.5 55.5 55.9 57.3 48.7 46.4 44.9 49.4
Pan troglodytes 52.7 52.1 52.7 54.1 48.6 45.2 45.1 50.4
Pongo pygmaeus 62.4 64.3 65.4 62.8 56.6 58.0 57.3 55.3
Hylobates lar 51.5 55.5 53.8 54.9 55.1 56.4 59.4 55.8
Ateles spp. 49.3 55.5 50.8 47.7 49.8 49.5 50.4 51.6
Macaca spp. 44.9 44.2 46.2 44.6 50.2 48.0 47.6 52.0
Sapajus apella 39.5 40.0 38.6 41.9 49.8 48.5 50.6 53.5
Px = Proximal phalanx, Md = Middle phalanx

63
Table 3.3. Index of Relative Curvature means for taxa.
Taxa IRC 2 IRC 3 IRC 4 IRC 5
Gorilla g. gorilla 0.86 0.84 0.8 0.87
G. g. beringei 0.9 0.85 0.84 0.85
Pooled Gorilla gorilla 0.86 0.84 0.81 0.86
Pan troglodytes 0.93 0.87 0.86 0.94
Pongo pygmaeus 0.91 0.91 0.9 0.89
Hylobates lar 1.07 1.02 1.11 1.02
Ateles spp. 1.02 .98 1.0 1.11
Macaca fascicularis 1.16 1.07 1.04 1.2
Sapajus apella 1.27 1.22 1.32 1.29

64
Tab
le 3
.4. A
ver
age
“Index
of
Rel
ativ
e C
urv
ature
” sc
ore
s fo
r ea
ch t
axon f
or
non c
orr
espondin
g d
igit
al e
lem
ents
.
Tax
a M
d2
/Px
3
Md2
/Px
4
Md2
/Px
5
Md3
/Px
2
Md3
/Px
4
Md3
/Px
5
Md4
/Px
2
Md4
/Px
3
Md4
/Px
5
Md5
/Px
2
Md5
/Px
3
Md5
/Px
4
Gori
lla
gori
lla
0.8
8
0.8
7
0.8
5
0.8
2
0.8
3
0.8
1
0.8
0
0.8
1
0.7
9
0.8
8
0.8
9
0.8
9
Pan
troglo
dyt
es
0.9
4
0.9
3
0.9
1
0.8
7
0.8
6
0.8
4
0.8
6
0.8
7
0.8
4
0.9
7
0.9
8
0.9
6
Pongo
pyg
maeu
s
0.8
8
0.8
8
0.9
1
0.9
4
0.9
1
0.9
3
0.9
2
0.8
9
0.9
2
0.8
9
0.8
6
0.8
7
Hyl
obate
s
lar
0.9
9
1.0
2
1.0
1
1.1
1.0
5
1.0
3
1.1
6
1.0
7
1.0
9
1.0
7
.99
1.0
3
Ate
les
spp.
0.9
9
1.0
1.0
8
1.0
.9
8
1.0
4
1.0
3
1.0
1.0
7
1.0
5
1.0
3
1.0
2
Maca
ca
fasc
icula
ris
1.1
6
1.0
7
1.1
3
1.0
8
1.0
5
1.0
8
1.0
8
1.0
9
1.0
8
1.1
7
1.1
8
1.1
4
Sapaju
s
apel
la
1.2
2
1.2
9
1.2
2
1.2
4
1.2
6
1.1
5
1.3
1.2
8
1.2
1.3
7
1.3
5
1.4
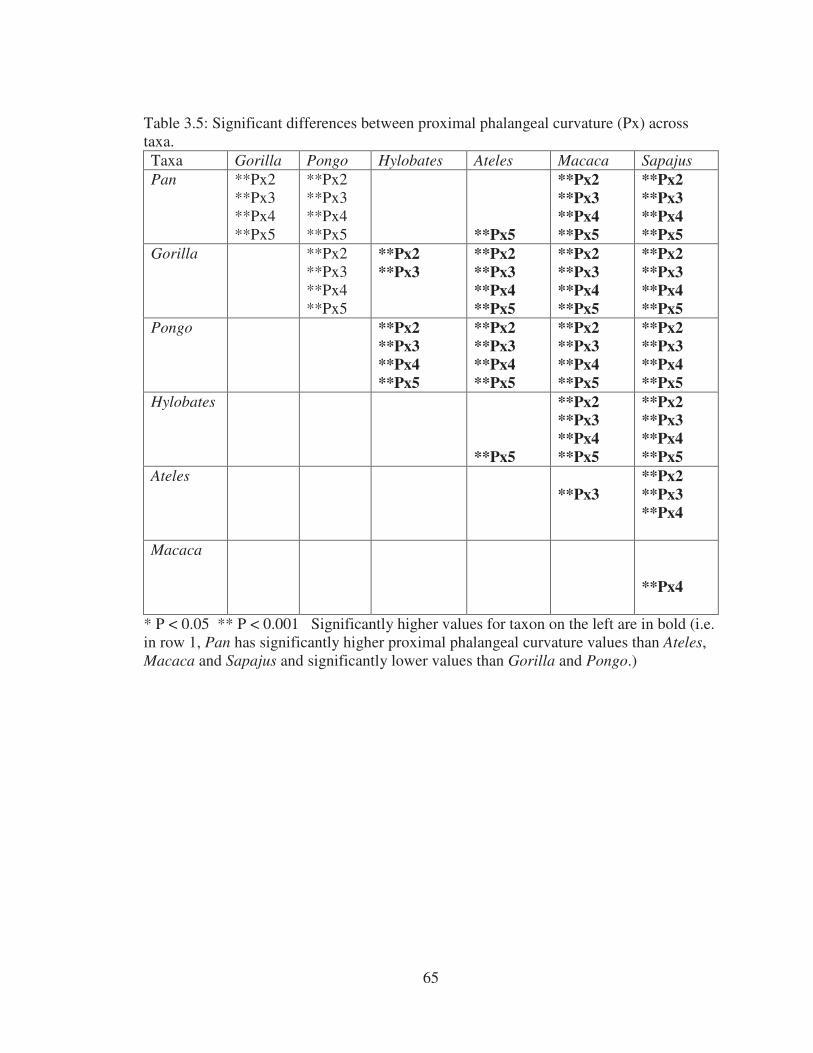
65
Table 3.5: Significant differences between proximal phalangeal curvature (Px) across taxa.
Taxa Gorilla Pongo Hylobates Ateles Macaca Sapajus
Pan **Px2 **Px3 **Px4 **Px5
**Px2 **Px3 **Px4 **Px5
**Px5
**Px2
**Px3
**Px4
**Px5
**Px2
**Px3
**Px4
**Px5
Gorilla **Px2 **Px3 **Px4 **Px5
**Px2
**Px3
**Px2
**Px3
**Px4
**Px5
**Px2
**Px3
**Px4
**Px5
**Px2
**Px3
**Px4
**Px5
Pongo **Px2
**Px3
**Px4
**Px5
**Px2
**Px3
**Px4
**Px5
**Px2
**Px3
**Px4
**Px5
**Px2
**Px3
**Px4
**Px5
Hylobates
**Px5
**Px2
**Px3
**Px4
**Px5
**Px2
**Px3
**Px4
**Px5
Ateles
**Px3
**Px2
**Px3
**Px4
Macaca
**Px4
* P < 0.05 ** P < 0.001 Significantly higher values for taxon on the left are in bold (i.e. in row 1, Pan has significantly higher proximal phalangeal curvature values than Ateles, Macaca and Sapajus and significantly lower values than Gorilla and Pongo.)

66
Table 3.6: Significant differences between middle phalangeal curvature (Md) across taxa.
Taxa Gorilla Pongo Hylobates Ateles Macaca Sapajus
Pan **Md2 **Md3 **Md4 **Md5
**Md2 **Md3 **Md4 **Md5
*Md4
*Md4
Gorilla **Md2 **Md3 **Md4 **Md5
**Md2 **Md3 **Md4 **Md5
**Md4
**Md4
Pongo **Md2
**Md3
**Md4
**Md2
**Md3
**Md4
**Md2
**Md3
**Md4
Hylobates
*Md3
**Md4
**Md3
**Md4
*Md3
**Md4
Ateles
**Md3
Macaca
* P < 0.05 ** P < 0.001 Significantly greater values are bolded. Unbolded values are significantly lower. (i.e. in row 1, Pan has significantly lower middle phalangeal curvature values than Pongo, Hylobates, Ateles, and Sapajus.)

67
Table 3.7. Middle phalangeal curvature homogenous subsets for hominoids.
Md2 Md3 Md4 Md5 Subset for alpha
= 0.05 Subset for alpha
= 0.05 Subset for
alpha = 0.05 Subset for
alpha = 0.05 Genus N
1 2 1 2 1 2 1 2
Pan 52 48.6 45.2 45.1 50.4
Gorilla 85 48.7 46.4 44.9 49.4
Hylobates 15 55.1 56.4 59.4 55.8
Pongo 36 56.6 58.0 57.3 55.3
Sig. 1.0 0.74 0.79 0.57 1.0 0.37 0.88 0.98

68
Table 3.8: Chimpanzee homogenous subsets for middle phalangeal curvature values and IRC scores.
Middle Phalangeal Index of Relative
Curvature Curvature
Subset for alpha = 0.05
Subset for alpha = 0.05
Digit N
1 2 1 2
Digit 4 52 45.1 0.86
Digit 3 51 45.2 0.87
Digit 2 52 48.6 0.93
Digit 5 51 50.5 0.94
Sig. 0.999 0.235 0.937 0.962
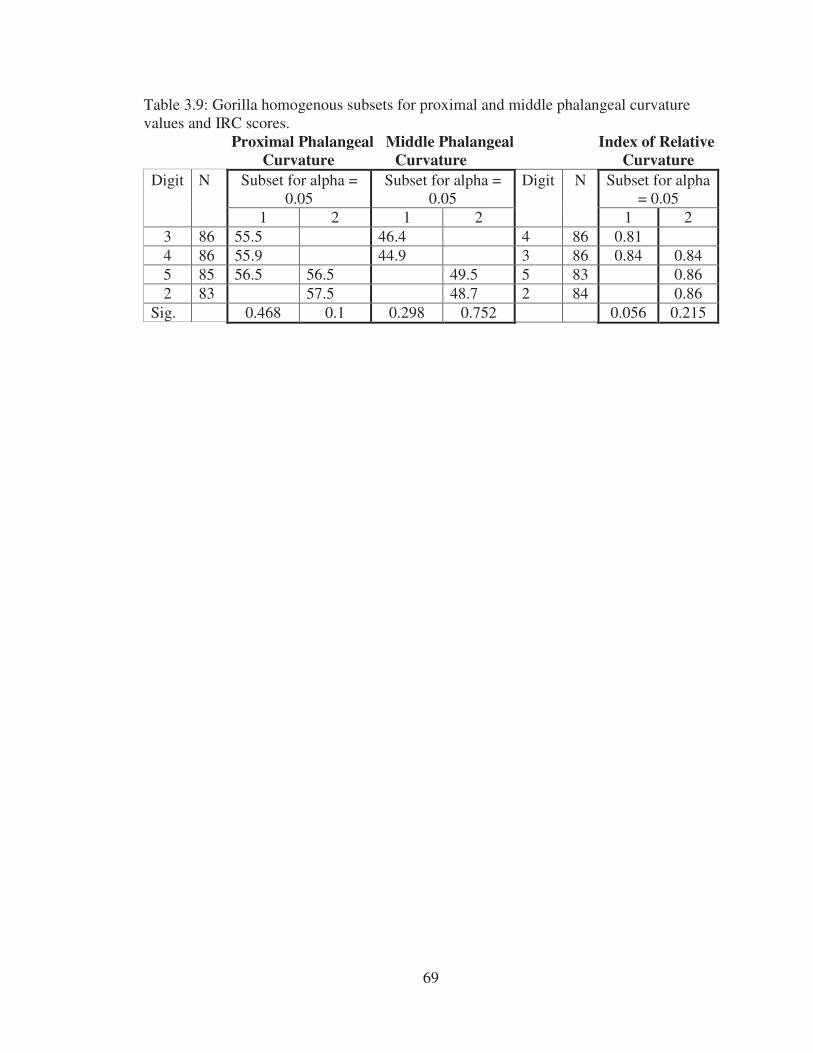
69
Table 3.9: Gorilla homogenous subsets for proximal and middle phalangeal curvature values and IRC scores.
Proximal Phalangeal Middle Phalangeal Index of Relative
Curvature Curvature Curvature
Subset for alpha = 0.05
Subset for alpha = 0.05
Subset for alpha = 0.05
Digit N
1 2 1 2
Digit
N
1 2
3 86 55.5 46.4 4 86 0.81
4 86 55.9 44.9 3 86 0.84 0.84
5 85 56.5 56.5 49.5 5 83 0.86
2 83 57.5 48.7 2 84 0.86
Sig. 0.468 0.1 0.298 0.752 0.056 0.215
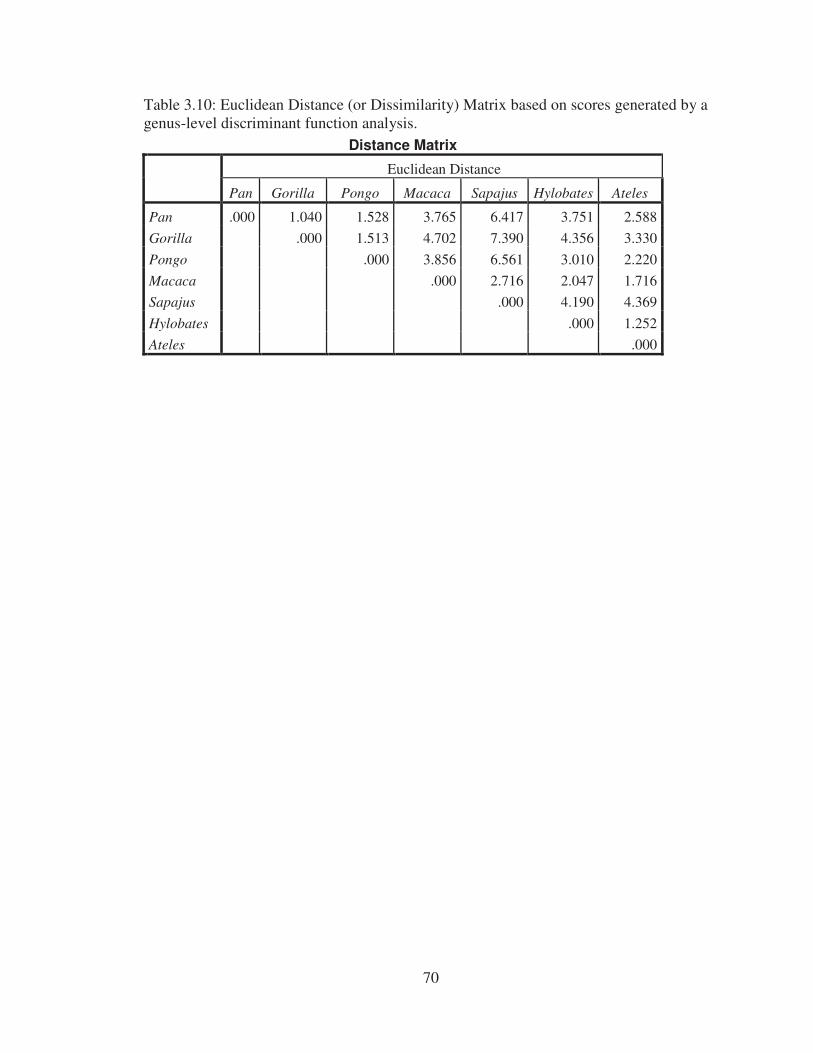
70
Table 3.10: Euclidean Distance (or Dissimilarity) Matrix based on scores generated by a genus-level discriminant function analysis.
Distance Matrix
Euclidean Distance
Pan Gorilla Pongo Macaca Sapajus Hylobates Ateles
Pan .000 1.040 1.528 3.765 6.417 3.751 2.588
Gorilla .000 1.513 4.702 7.390 4.356 3.330
Pongo .000 3.856 6.561 3.010 2.220
Macaca .000 2.716 2.047 1.716
Sapajus .000 4.190 4.369
Hylobates .000 1.252
Ateles .000
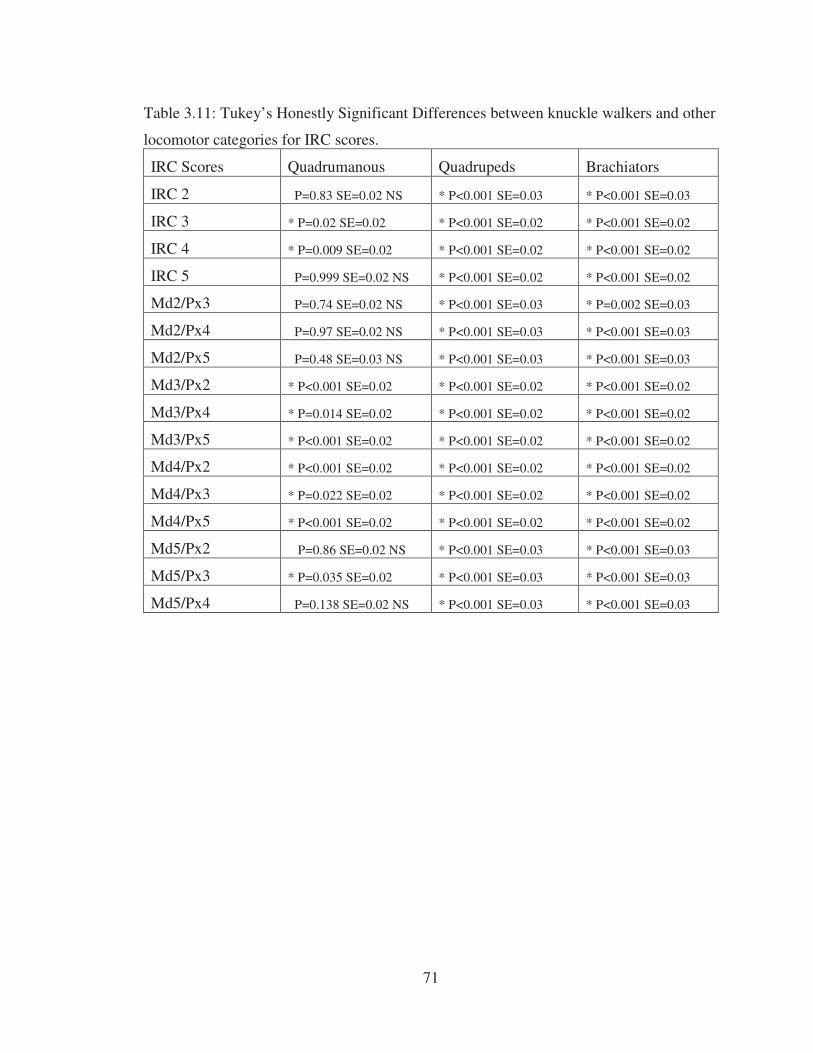
71
Table 3.11: Tukey’s Honestly Significant Differences between knuckle walkers and other
locomotor categories for IRC scores.
IRC Scores Quadrumanous Quadrupeds Brachiators
IRC 2 P=0.83 SE=0.02 NS * P<0.001 SE=0.03 * P<0.001 SE=0.03
IRC 3 * P=0.02 SE=0.02 * P<0.001 SE=0.02 * P<0.001 SE=0.02
IRC 4 * P=0.009 SE=0.02 * P<0.001 SE=0.02 * P<0.001 SE=0.02
IRC 5 P=0.999 SE=0.02 NS * P<0.001 SE=0.02 * P<0.001 SE=0.02
Md2/Px3 P=0.74 SE=0.02 NS * P<0.001 SE=0.03 * P=0.002 SE=0.03
Md2/Px4 P=0.97 SE=0.02 NS * P<0.001 SE=0.03 * P<0.001 SE=0.03
Md2/Px5 P=0.48 SE=0.03 NS * P<0.001 SE=0.03 * P<0.001 SE=0.03
Md3/Px2 * P<0.001 SE=0.02 * P<0.001 SE=0.02 * P<0.001 SE=0.02
Md3/Px4 * P=0.014 SE=0.02 * P<0.001 SE=0.02 * P<0.001 SE=0.02
Md3/Px5 * P<0.001 SE=0.02 * P<0.001 SE=0.02 * P<0.001 SE=0.02
Md4/Px2 * P<0.001 SE=0.02 * P<0.001 SE=0.02 * P<0.001 SE=0.02
Md4/Px3 * P=0.022 SE=0.02 * P<0.001 SE=0.02 * P<0.001 SE=0.02
Md4/Px5 * P<0.001 SE=0.02 * P<0.001 SE=0.02 * P<0.001 SE=0.02
Md5/Px2 P=0.86 SE=0.02 NS * P<0.001 SE=0.03 * P<0.001 SE=0.03
Md5/Px3 * P=0.035 SE=0.02 * P<0.001 SE=0.03 * P<0.001 SE=0.03
Md5/Px4 P=0.138 SE=0.02 NS * P<0.001 SE=0.03 * P<0.001 SE=0.03

72
Table 3.12: Tukey’s Honestly Significant Differences between quadrumanous climbers
and other locomotor categories for IRC scores.
IRC Scores Quadrupeds Brachiators
IRC 2 * P<0.001 SE=0.03 * P<0.001 SE=0.03
IRC 3 * P<0.001 SE=0.02 * P<0.001 SE=0.02
IRC 4 * P<0.001 SE=0.03 * P<0.001 SE=0.03
IRC 5 * P<0.001 SE=0.03 * P<0.001 SE=0.03
Md2/Px3 * P<0.001 SE=0.03 * P=0.001 SE=0.03
Md2/Px4 * P<0.001 SE=0.03 * P<0.001 SE=0.03
Md2/Px5 * P<0.001 SE=0.03 * P<0.001 SE=0.03
Md3/Px2 * P<0.001 SE=0.03 * P<0.001 SE=0.03
Md3/Px4 * P<0.001 SE=0.03 * P=0.001 SE=0.03
Md3/Px5 * P<0.001 SE=0.03 * P<0.001 SE=0.03
Md4/Px2 * P<0.001 SE=0.03 * P<0.001 SE=0.03
Md4/Px3 * P<0.001 SE=0.03 * P<0.001 SE=0.03
Md4/Px5 * P<0.001 SE=0.03 * P<0.001 SE=0.03
Md5/Px2 * P<0.001 SE=0.03 * P<0.001 SE=0.03
Md5/Px3 * P<0.001 SE=0.03 * P<0.001 SE=0.03
Md5/Px4 * P<0.001 SE=0.03 * P<0.001 SE=0.03

73
Table 3.13: Tukey’s Honestly Significant Differences between qaudrupeds and
brachiators for IRC scores.
IRC Scores Brachiators
IRC 2 * P<0.001 SE=0.03
IRC 3 * P<0.001 SE=0.03
IRC 4 P=0.118 SE=0.03 NS
IRC 5 * P<0.001 SE=0.03
Md2/Px3 * P=0.001 SE=0.03
Md2/Px4 * P=0.001 SE=0.03
Md2/Px5 * P=0.005 SE=0.04
Md3/Px2 P=0.063 SE=0.03 NS
Md3/Px4 * P=0.035 SE=0.03
Md3/Px5 P=0.096 SE=0.03 NS
Md4/Px2 P<0.178 SE=0.03 NS
Md4/Px3 * P<0.001 SE=0.03
Md4/Px5 P=0.631 SE=0.03 NS
Md5/Px2 * P<0.001 SE=0.03
Md5/Px3 * P<0.001 SE=0.03
Md5/Px4 * P<0.001 SE=0.03

74
Table 3.14: Percentage of significantly different IRC scores for Tukey’s Honestly
Significant Differences between locomotor groups.
Quadrumanous
Climbers
Quadrupeds Brachiators
Knuckle
walkers
56% 100% 100%
Quadrumanous
climbers
100% 100%
Quadrupeds 75%

75
Table 3.15 Summary table of expected and observed manual phalangeal curvature values
for locomotor categories
Locomotor Categories Expected Observed
Knuckle walkers Flatter Middle Phalanges to
allow for greater digit to
ground contact.
Curved Proximal Phalanges
reflective of suspensory
behavior.
Flatter middle phalanges
and curved proximal
palanges. Indices of
Relative Curvature are less
than one.
Quadrupeds Relatively flatter middle
and proximal phalanges.
Flatter proximal phalanges
and relatively curved
middle phalanges. Indices
of Relative Curvature are
greater than one.
Quadrumanous Climbers Highly curved middle and
proximal phalanges needed
to mitigate strain during
suspension.
Both phalanges are highly
curved (greatest curvature
values of any extant
primate). Indices of
Relative Curvature are less
than one.
Brachiators Highly curved middle and
proximal phalanges needed
to mitigate strain during
suspension.
Both phalanges are highly
curved. Proximal and
middle phalangeal
curvature values are
approximately equal.
Indices of Relative
Curvature are
approximately equal to
one.
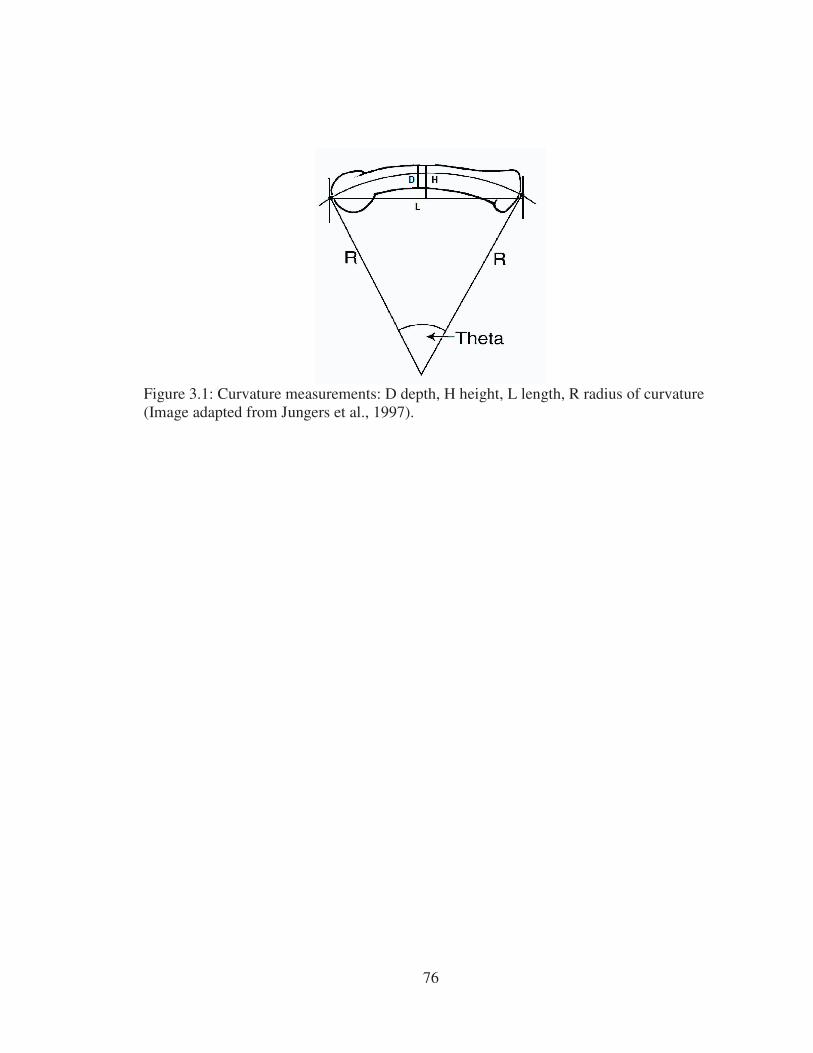
76
Figure 3.1: Curvature measurements: D depth, H height, L length, R radius of curvature (Image adapted from Jungers et al., 1997).

77
CHAPTER 4
TRABECULAR ARCHITECTURE OF THE MANUAL ELEMENTS
Abstract
Trabecular bone orientation has proven sensitive to loading patterns in the
humerus and femur of primates. Because manual elements provide support during
locomotion, differences in trabecular bone within the phalanges should be capable of
discriminating between primates practicing different modes of locomotion. Micro CT
scans of the middle phalanx, proximal phalanx and the metacarpal head of the third ray
were used to examine the pattern of trabecular orientation in Pan, Gorilla, Pongo,
Hylobates and Macaca. Several zones, i.e., the proximal ends of both phalanges and the
metacarpal heads, were capable of distinguishing between knuckle-walking, quadrupedal
and suspensory primates. Orientation and shape seem to be the primary distinguishing
factors but differences in bone volume, isotropy index and degree of anisotropy were
seen across included taxa. Suspensory primates show primarily proximodistal alignment
of trabeculae in all zones, and quadrupeds more palmar-dorsal orientation in several
zones. Knuckle walkers are characterized by having proximodistal alignment in the
proximal ends of the phalanges and a palmar-dorsal alignment in the distal ends and
metacarpal heads. Differences in orientation correlate with differences in strains placed
upon the digits during locomotion: primarily compression in the middle phalanges and
extension at the metacarpophalangeal joints during knuckle walking, and tensile forces
during suspension.

78
Introduction
Living bone is a dynamic tissue that functionally adapts in response to mechanical
loading. In addition to easily visible changes noted on the surface of bone, (i.e. bony
deposits built up along heavily used muscle insertions and atrophy in areas of tissue
damage and minimal use), it is widely accepted that changes in the internal structure of
bone can be related to function. This adaptability of bone is commonly referred to as
“Wolff’s Law”. Although the initial mathematical tenets of Wolff’s law have been
discredited (for an excellent review see Ruff et al., 2006), the ability of trabecular bone to
align along a functional axis has been shown in several studies (Barak et al., 2011; Fox
and Keaveny, 2001; Jacobs, 200; Keaveny et al., 2001; Mittra et al. 2205; Polk et al.,
2008; Pontzer et. al, 2006). Pontzer et al. (2006) and Barak et al. (2011) empirically
tested via animal studies the ability of trabecular bone to align along an axis of greater
use. In the Pontzer et al. (2006) study, guinea fowl that were made to run on a treadmill
at an incline had changes in the trabecular bone alignment of their distal femora that
corresponded with the altered direction of load. These changes were not seen in control
fowl running without an incline. Similar results were seen in the distal tibia of sheep that
were made to run at an incline versus a control group (Barak et al., 2011). In addition to
alignment alterations seen in the study sheep, they also noted significant increases in
bone volume fraction (BV/TV), trabecular number (Tb.N), trabecular thickness (Tb.Th),
and changes in trabecular shape (less rod-shaped) between the “inclined” group and
control sheep.
With the advancement of technology, namely micro Computed Tomography
(µCT) (employed in the above studies), it is now possible to examine the internal

79
structure of bone in finer detail and in three dimensions (Fajardo and Muller, 2001;
Fajardo et al. 2002; Ketcham, 2005; Ketcham and Ryan, 2004; Ryan and van Rietbergen,
2005; Scherf and Tilgner, 2009; Waarsing et al., 2005). Micro CT scans have been used
to examine changes in cortical bone thickness and shape, trabecular structure, and
subchondral bone thickness mainly in primate long bones as a means to explore possible
locomotor differences (DeSilva and Devlin, 2012; MacLatchy and Muller, 2002; Polk et
al., 2010; Ryan and Ketcham, 2002; Ryan and Shaw, 2012; Ryan and Walker, 2010;
Shaw and Ryan, 2012). The results of these analyses vary. While MacLatchy and Muller
(2002) and Ryan and Ketcham (2002) revealed a relationship between femoral head
trabecular orientation and locomotor patterns in several strepsirrhine species, this
relationship does not seem to hold true for anthropoids. Trabecular structure alone (of
the humeral and femoral heads) appears similar across a wide range of anthropoid
primates and does not discriminate between locomotor groups (Ryan and Walker, 2010;
Shaw and Ryan, 2012). Ryan and Walker (2010) did show that within the included
anthropoids (Alouatta, Pan, Papio, Presbytis, and Symphalangus), the humeral head
trabecular bone is more isotropic and has significantly lower bone volume than does
femoral head trabecular bone. A stronger locomotor signal is manifest in the mid-
diaphysis cortical bone of the femur and humerus across several anthropoids (Shaw and
Ryan, 2012). This locomotor signal is also present when a suite of trabecular features are
considered (Ryan and Shaw, 2012). Once body size is controlled, a suite of trabecular
bone features of the femoral head (trabecular number, connectivity density, degree of
anisotropy, and structure model index) discriminates well among locomotor categories.

80
The humeral head suite of features shows a similar but weaker locomotor signal (Ryan
and Shaw 2012).
Micro CT analyses along with traditional histological preparations,
morphometrics and CT osteoabsorptiometry (OAM) have also been employed to examine
possible locomotor differences in the morphological structure of elements of the wrist
and metacarpals of primates. Studies of the distal radius using CT-OAM revealed greater
density in the subchondral bone of the ventral region in knuckle walkers that
distinguishes them from humans, quadrupeds and orangutans (Carlson and Patel, 2006;
Patel and Carlson, 2007). Greater density in this region is expected given the enhanced
loading placed upon the area while the hand is in the knuckle-walking posture (with
extension at the wrist and metacarpals). In contrast, digitigrade primates who keep the
metacarpals in line with the wrist during the stance phase of walking exhibit the greatest
density in the central region of the distal radius (Patel and Carlson, 2007). Zeininger et
al. (2011) sectioned and imaged (using backscattered electron microscopy) the third
metacarpal heads of Pan, Pongo, and Homo and revealed differences in weighted mean
grey level patterns reflective of different digit use among the species: Pan has lighter
grey levels in the dorsal and palmar regions indicating greater remodeling rates and
loading at these zones. In his examination of cercopithecoid metacarpal shape (using
morphometric measures), Patel (2010) showed a weak signal for hand posture and
metacarpal morphology in cercopithecoids. Marchi (2005) however found differences in
the cross-sectional properties of metacarpals 3 and 4 of hominoids that he related to
locomotor function: namely, knuckle walkers had greater robusticity and strength of
those digits than did orangutans and humans.
81
Micro CT studies of extant primate metacarpals have shown some inter- and
intraspecific differences within hominoids. Chirchir et al. (2010) found that Pan had
greater bone density in the dorsal region of third metacarpal head than Pongo and
suggests this is due to greater loading of this region in chimpanzees during knuckle
walking. Lazenby et al. (2011) examined the metacarpals (digits 1, 2, and 5) of Pan and
noted differences in overall robusticity between Cameroon chimpanzees and those of the
Tai forest. They attributed the greater robusticity of the Cameroon chimpanzee
metacarpals to more frequent knuckle walking and/or greater tool use.
To date, nobody has studied the trabecular structure of the manual phalanges.
Whereas it has been shown that the overall shape of phalanges is responsive to loads
imposed during use, the internal structure of these elements has not been examined in this
light. Increased manual proximal phalangeal curvature is a marker of suspensory
behaviors in primates (Jungers et al., 1994; 1997; 2002; Richmond, 1998; 2007).
Richmond (1998) has demonstrated how curvature increases throughout ontogeny with
increased use of suspensory postures, and conversely how digits of infants (typically
curved as they are used to grasp onto their mothers’ fur) become increasingly flatter in
quadrupedal primates as they age. Finite element analysis reveals how this curvature
mitigates strain on the digits when they are loaded as if in suspension (Richmond 1998;
2007). A comparison of the curvature value of proximal and middle phalanges of the
manus (Index of Relative Curvature) is successful at differentiating between quadrupedal,
brachiating, quadrumanous, and knuckle-walking primates (Matarazzo, 2008; Chapter 3).
This locomotor signal holds true even when the indices are comprised from middle and

82
proximal phalanges from different rays within the same manus, or with elements from
different individuals of the same species. The Index of Relative Curvature reflects
differences in how elements are loaded within a digit and across the locomotor spectrum.
Knuckle walkers (Pan and Gorilla) have index values that approximate 0.85: the middle
phalanges are “flatter” than the proximal and the inference can be made that these
elements experience different angles of compression than the proximal phalanges when
knuckle walking. In addition, when used in suspension, proximal phalanges experience
tension in the palmar direction and compressive strain dorsally acting to “bend” the
element (Richmond, 2007). Quadrupeds (Macaca and Cebus) may also experience
different loads acting on the proximal and middle phalanges. They have index values
greater than 1: the middle phalanges are more curved than the proximal. In contrast, the
brachiators (Hylobates and Ateles) experience similar loads upon both the middle and
proximal phalanges and possess index values approximately equal to 1. Both elements
are highly curved and no significant differences in curvature values occur across the
manus of individual brachiators indicating relatively even distribution of weight during
locomotion. Quadrumanous climbers (orangutans) have indices that (like those of
knuckle walkers) approximate 0.85. However, their middle phalanges are not flattened.
They simply are not as curved as the proximal. Orangutans possess significantly higher
middle and proximal curvature values than the other included taxa. Like brachiators,
they have long, hook-like hands which may act to mitigate the considerable amount of
tensile strain that may be placed upon the digits during suspension.

83
Given the markedly different forces applied to the manual digits in suspension,
quadrupedalism and knuckle walking, one might expect to see distinct differences in
trabecular bone alignment among species engaging in these types of locomotion. One
caveat is that the proximal and middle phalanges may experience different loads
depending on the position of the manus during movement. Also primates have broad
locomotor repertories. Both Pan and Gorilla, frequently travel via knuckle walking but
can spend considerable amounts of time climbing and in suspension. In addition, their
hands are used for number of other tasks including grooming, tool making, and tool use.
These require fine motor manipulation of the digits and may contribute to differences in
manual morphology (Lazenby et al. 2011). Bearing this in mind, the positional behaviors
of taxa included in this study (Pan, Gorilla, Pongo, Hylobates, and Macaca) differ in
phalangeal curvature indices in a manner correlating with locomotion, and therefore it is
expected that locomotor-related differences in trabecular orientation should also occur.
This paper examines the trabecular structure of the proximal and distal ends of
manual middle and proximal phalanges and the metacarpal heads. The main goal is to
determine whether there are features of the trabecular bone that can be related to
locomotor function. The middle phalanges of knuckle walkers (Pan and Gorilla)
experience considerable compressive forces as they support the body during knuckle
walking, with pressure focused on the 2nd and 3rd digits (Matarazzo submitted; Chapter
2). Given this, I hypothesize that the middle phalanges will have a dorsal-palmar
alignment of the trabecular bone. In contrast, the proximal phalanges of knuckle walkers
experience downward compressive strain in the knuckle-walking position, but also tensile

84
force when the body is in a suspensory posture. These elements are expected to show a
more proximodistal orientation of trabecular bone than the middle phalanges. The
suspensory primates (Pongo and Hylobates) have substantial tensile and compressive
forces acting on both the middle and proximal phalanges as they hang below branches
and should display greater proximodistal trabecular orientation in both elements.
Gibbons also experience torsional forces during their fluid and fast brachiation which can
be altered within a give bout by branch diameter, distance, and height (Bertram and
Chang, 2001; Chang et al., 2000; Usherwood et al., 2003), but it is unclear what affect
this may have on trabecular structure. The quadrupeds (Macaca) may experience similar
compressive forces on both elements if the hand is maintained in a fully palmigrade
posture. It is expected that the main trabecular orientation for proximal phalanges will be
palmar-dorsal and for the middle (more curved elements) proximodistal.
The metacarpal heads are loaded quite differently depending upon hand posture.
Both knuckle walkers and arboreal quadrupeds can experience both tensile and
compressive forces on these elements, while brachiators and quadrumanous climbers
would be subjected primarily to tensile and possibly torsional forces during suspension.
Previous studies (Chirchir et al., 2010; Zeininger et al., 2011) indicate greater loading in
the dorsal and palmar regions of the metacarpal heads of knuckle walkers and it is
expected that the trabecular bone will be aligned along this axis. In contrast, a
proximodistal alignment is expected for the suspensory and quadrupedal primates. This
is the first examination of trabecular bone in manual phalanges and greatly expands upon
the previous examinations of the metacarpal head structure.

85
Methods
Taxa included in this study represent several locomotor categories: knuckle
walkers (Pan troglodytes and Gorilla gorilla), quadrumanous climbers (Pongo
pygmaeus), quadrupeds (Macaca fascicularis) and brachiators (Hylobates lar). Only
adults were included in the study (Table 4.1). The third manual digit was chosen as it
acts as the midline axis of the hand in all taxa and receives relatively greater pressure
than the other digits during knuckle walking (Matarazzo Chapter 2).
The 3rd proximal phalanges, 3rd middle phalanges, and 3rd metacarpals were
scanned using the HMXST Micro-CT imaging system, Harvard University. The apes
were adult, wild-caught specimens (Museum of Comparative Zoology at Harvard) and
the macaques were adult male captive animals (UMASS collection). The phalanges were
scanned at 70kv 80ua (apes) and 50kv 80ua (macaques). Images were reconstructed with
CT Pro software and exported as TIFF files from the VG Studiomax program.
Trabecular “cubes” were extracted using Irfanview and analyzed with SVD (star-
volume distribution) method in QUANT3D (Ryan & Ketcham, 2002). Because volume
of interest (VOI) size and location can affect trabecular variables (Kivell et al. 2011;
Lazenby et al., 2011), the maximum amount of trabecular bone in the distal and proximal
locations of the phalanges and metacarpal heads was examined. The maximum VOI was
limited by the number of image slices that can be obtained for the proximodistal depth
without encompassing cortical bone at the articular surfaces and empty space in the shaft.
This area encompassed a large portion of trabecular bone in all selected areas for all taxa

86
except for the middle phalanges of some male gorillas. Because these elements are very
wide and flat, three smaller trabecular cubes could be extracted. No significant
differences in trabecular features were seen in the lateral, medial and centered cube so
values for the centered cube were selected for analysis. A best fit sphere VOI for each
cube was fitted using Quant 3D and the orientation parameters set to a uniform setting
with 513 orientations, random rotation, and dense vectors as recommended by Ketcham
and Ryan (2004).
Quant3D generates the following SVD variables: DA (degree of anisotropy), I
(isotropy index), E (elongation index), and BV/TV (volume of trabecular bone to total
volume). DA, I, and E are calculated from three eigenvalues (ev1-3) generated by
Quant3D: DA = ev1 / ev3; I = ev3 / ev1; E = 1 – (ev1 / ev3)). The program also produces
three eigenvectors which determine trabecular orientation. The elongation and Isotropy
indices when considered together characterize the fabric structure in a given VOI. The
three eigenvalues derived from a fabric tensor are used to determine fabric shape. There
is a range of fabric shapes between the three end forms: spheres, discs, and rods.
Spherical trabeculae are isotropic fabrics with approximately equal eigenvalues (ev1 � ev2
� ev3). Disc-like trabeculae are flattened and plate-like and have approximately equal
first and second eigenvalues (ev1 � ev2 > ev3). Rod-like trabeculae are more linear in
form and the second and third eigenvalues are approximately equal (ev1 > ev2 � ev3)
(Ryan and Ketcham, 2002). Trabecular orientation and fabric shape were numerically
coded for each location (orientation: 1 = medial-lateral or towards digits 2 and 4; 2 =
palmar-dorsal; 3 = proximodistal; fabric shape: 1 = spherical; 2 = disc-like; 3 = rod-like).

87
For trabecular orientation the “main” direction of alignment was chosen (i.e. in some
cases trabecular bone was aligned in an angular direction along a proximodistal and
palmar-dorsal direction and in these cases the “stronger” directionality was chosen and
coded). These coded variables, along with DA, I, E, and BV/TV were compared
between sexes for each genus using t-tests, and across taxa using the Mann-Whitney U
test in SPSS v20. Trabecular orientation and shape for each anatomical location were
compared across locomotor categories using chi-square analyses. Paired t-tests were also
used to compare orientation and shape of the proximal to the distal locations of the
phalanges for each taxon to assess “within element” structural differences.
To assess the discriminating power of a single area of bone, a particular element,
and a combination of manual locations, I used several Discriminant Function Analyses
(DFA). All DFAs compared locomotor categories for the following variables: DA, I, E,
BV/TV, orientation, and shape. Five DFAs were run comparing variables of each
anatomical location (i.e. all the variables of the proximal end of the proximal phalanges
were included in one DFA). Two DFAs included variables of a single element: one for
the proximal and distal ends of the proximal phalanges and one for the proximal and
distal ends of the middle phalanges. Finally, I used DFA to compare all variables at all
locations across taxa.
Results
The main direction of orientation was determined for each location based on the
first SVD eigenvector values. Results are presented in Table 4.2, and compared with

88
expected orientations in Table 4.3. Orangutans are characterized by more proximodistal
alignment in all locations. Macaques have more palmar-dorsal alignment in the proximal
ends of the phalanges and more proximodistal alignment in the distal ends and
metacarpal heads. In contrast, knuckle walkers and gibbons have more proximodistal
alignment in the proximal ends of the phalanges and more palmar-dorsal in the distal
ends. Knuckle walkers and gibbons differ in the orientation of the metacarpal trabecular
bone: knuckle walkers are more palmar-dorsally aligned and gibbons more
proximodistally aligned.
Differences between the Sexes
T-tests reveal no significant differences in the trabecular orientation and
trabecular fabric shape between the sexes at any location (proximal and distal ends of the
phalanges and the metacarpal head) for any taxon. There were also no differences
between the sexes for DA, I, E and BV/TV in the gibbon or orangutan samples.
Significant differences were seen between male and female chimpanzees in the trabecular
variables of the middle phalanges: males have a greater degree of anisotropy in the
proximal (t = 3.93, df = 6; P = 0.01) and distal ends (t = 3.13, df = 6, P = 0.04) of the
middle phalanges and females have significantly greater I values at both locations
(proximal end t = -3.5, df = 6, P =0.03; distal end t = -3.2, df = 6, P = 0.02). Female
chimpanzees also show increased BV/TV in the proximal ends of the middle phalanges (t
= -5.5, df = 6, P = 0.008) and proximal phalanges (t = -5.8, df = 6, P = 0.001). Gorilla
males and females differ only in BV/TV for the proximal end of the middle and proximal
phalanges: females have increased BV/TV at both locations (middle phalanges t = -2.5,

89
df = 8, P = 0.046; proximal phalanges t = -2.96, df = 8, P =0.018). Subsequent analyses
were conducted on pooled male and female samples.
Differences across Taxa and Locomotor Categories
Taken alone, variables (DA, I, E, and BV/TV) show no discernable pattern of
differences across taxa that can be related to function or phylogenetic relationships (Table
4). Orientation does show significant differences among taxa attributed to different
locomotor categories in several regions. Chimpanzees and gorillas differ significantly
from orangutans, and gibbons in trabecular bone orientation of the metacarpal head.
Macaques differ significantly in trabecular orientation from the apes in regions of the
phalanges. A similar result is seen when the taxa are lumped into locomotor categories
(Table 4.5). As there were no significant differences in DA, I, trabecular orientation or
shape for orangutans (quadrumanous climbers) and gibbons (brachiators), they were both
included in a broader “suspensory” category for this comparison. Quadrupeds differ
from suspensory primates in the orientation of trabecular bone in the proximal ends of
both phalanges. Knuckle walkers show significant differences from quadrupeds in
trabecular orientation at the distal end of the middle phalanges and proximal end of the
proximal phalanges, and they are highly significantly different from suspensory primates
in trabecular orientation of the metacarpal head.
Chi-square analyses comparing trabecular orientation between the locomotor
categories revealed significant differences in several locations. Trabecular orientation
was significantly different in the proximal end of the middle phalanges (X2 = 0.009), the

90
proximal end of the proximal phalanges (X2 = 0.001), and the metacarpal head (X2 =
0.002). In the proximal end of the middle and proximal phalanges, knuckle walkers and
suspensory primates have a greater proportion of individuals with a proximodistal
alignment (knuckle walkers - 89% in both locations; Suspensory – 92% of middle and
83% of proximal phalanges). Quadrupeds have a greater proportion of palmar-dorsal
alignments in both areas (67% in both locations) (Figure 4.1). In contrast to the structure
of the phalanges, knuckle walkers have a greater proportion of palmar-dorsal orientation
(73%) in the metacarpal head. Suspensory primates have 100% of individuals with a
proximodistal alignment in this area, and quadrupeds display nearly equal amounts of
proximodistal (60%) and palmar-dorsal (40%) orientations (Figure 4.2).
Theses same areas (proximal ends of the middle and proximal phalanges and
metacarpal head) also show significant differences in trabecular bone shape. In the
proximal end of the middle phalanges (X2 = 0.028), knuckle walkers have a greater
proportion of individuals with “rod-like” trabeculae (72%) and lesser number with more
disc-like (28%). Suspensory primates also have a greater proportion of individuals with
rod-like trabeculae (93%) and quadrupeds have an equal percentage of “spherical”, rod-
like, and disc-like trabeculae. A similar pattern is seen in the proximal end of the
proximal phalanges (X2 = 0.019) for the knuckle walkers and suspensory primates: both
have a greater proportion of individuals with rod-like trabeculae (knuckle walkers = 72%;
suspensory = 83%). Quadrupeds have 83% of individuals with disc-like trabeculae.
Differences in the metacarpal head approach significance (X2 = 0.059). In this region
knuckle walkers and quadrupeds have disc-like trabeculae (knuckle walkers = 73%;

91
quadrupeds = 100%), and suspensory primates show nearly even proportions of
“spherical” (31%), rod-like (38%), and disc-like (31%) trabeculae.
Paired t-tests revealed significant differences between the proximal and distal
ends of the phalanges for two taxa. Gorillas have significantly different trabecular
orientation at the proximal and distal ends of both phalanges (middle phalanges: t = 4.6,
df = 9, P < 0.001; proximal phalanges: t = 9, df = 9, P < 0.001). Gibbons showed
significant differences in both shape and orientation. They differ significantly in
orientation between the proximal and distal ends of both phalanges (middle phalanges: t
= 3.3, df = 6, P = 0.017; proximal phalanges: t = 3.9, df = 6, P = 0.008) and in shape in
the proximal and distal ends of the proximal phalanges (t = 6, df = 6, P = 0.001). Both
gorillas and gibbons are characterized by a proximodistal alignment at the proximal ends
of the phalanges and a more palmar-dorsal alignment at the distal ends.
Discriminant Function Analyses
Middle Phalanges
The Discriminant function analyses for specific locations were successful at
discriminating between locomotor categories. The functions for the proximal end of the
middle phalanges were significant (X2 = 30.5, df = 12, P = 0.002). This DFA
successfully classified 74.3% of original grouped cases. Function 1 accounts for 81% of
the variance and polarizes macaques with lower orientation and shape values (more
palmar-dorsal, medial-lateral orientation and more spherical and disc-shaped trabeculae)
from knuckle walkers and suspensory primates (more proximodistal orientation).
Function 2 polarizes knuckle walkers who have higher DA, and less BV/TV than

92
suspensory primates. The functions for the DFA of the distal end of the middle
phalanges were not significant. However this analysis correctly classified 71.4% of the
original groups. Quadrupeds and suspensory primates with higher E and orientation
values are distinguished from knuckle walkers along function 1 (which accounts for
51.8% of variance). Function 2 (48.2% of the variance) differentiates between the three
groups with quadrupeds having the highest BV/TV and orientation values and suspensory
primates (with the lowest values for BV/TV and orientation). Knuckle walkers fall in the
middle. The DFA using variables for both the proximal and distal ends of the middle
phalanges was successful at classifying 85.7% of original grouped cases. The functions
were highly significant (X2 = 42.2, df = 24, P = 0.012) and functions 1 and 2 accounted
for 62.9% and 37.1% of the variance respectively. All three categories are separated
along Function 1 with suspensory primates having the greatest proximal end shape and
orientation values (more rod-like and proximodistal alignment), knuckle walkers in the
middle and quadrupeds the lowest values. Function 2 separates the knuckle walkers with
more proximodistal alignment of the distal region and less BV/TV from both the
quadrupeds and suspensory primates.
Proximal Phalanges
The DFA functions for the proximal end of the proximal phalanges is highly
significant (X2 = 56.3, df = 12, P < 0.001) and correctly classified 82.9% of the originally
grouped cases. Function 1 accounts for 81.9% of the variance and separates the
quadrupeds with lower BV/TV and orientation values (more palmar-dorsal alignment)
from the knuckle walkers and suspensory primates (proximodistal alignment). Function
2 separates the suspensory primates with higher I values and lower DA from both

93
knuckle walkers and quadrupeds. The DFA functions for the distal end of the proximal
phalanges were not significant. The DFA correctly classified 62.9% of original groups.
Most of the variance is accounted for by function 1 (87.3%) and delineates between all
three groups: knuckle walkers have greater I, BV/TV, and orientation values (more
proximo-distal alignment) than quadrupeds with the lowest and suspensory primates in
the middle. Function 2 weakly separates knuckle walkers and quadrupeds (with higher
DA) from suspensory primates. The classification success increases to 85.7% when the
DFA is run with variables from both the proximal and distal ends. The functions were
highly significant (X2 = 58.4, df = 24, P < 0.001), and most of the variance is accounted
for by function 1 (80.7%). This function delineates between all three groups with
knuckle walkers having the greatest BV/TV and orientation values (more proximo-distal
alignment) in the proximal end, macaques the lowest and suspensory primates in the
middle. Function 2 separates out the suspensory primates with higher proximal end I
values and lower proximal end DA from the knuckle walkers and quadrupeds.
Metacarpal head
The DFA for the metacarpal head variables correctly classified 93.5% of the
original grouped cases. The functions were highly significant (X2 = 53.9, df = 12, P <
0.001), and Function 1 accounts for 70.2% of the variance and function 2 for 29.8%.
Function 1 differentiates between all three categories with knuckle walkers having the
highest BV/TV and lowest orientation values (more palmar-dorsal alignment),
quadrupeds the lowest BV/TV and higher orientation values and suspensory primates in
the middle (both have more proximodistal alignment). Function 2 separates the

94
suspensory primates from the knuckle walkers and quadrupeds. The suspensory primates
have higher E and shape values (more rod- and disc-like), and higher orientation values
(proximodistal alignment).
All Locations
The last DFA was run with the variables (DA, I, E, BV/TV, shape and
orientation) for all 5 locations (proximal and distal ends of both phalanges and the
metacarpal head). The functions were highly significant (X2 = 145.1, df = 56, P > 0.001)
and 100% of original cases were correctly classified. Cross validation results show only
a correct classification of 48.5% of cases. Function 1 accounts for 91.1% of the variance
and delineates between all three locomotor categories: knuckle walkers are characterized
by high BV/TV in the proximal and distal ends of the proximal phalanges and proximal
end of the middle phalanges and lower orientation values in the metacarpal head and
distal end of the proximal phalanges (more palmar-dorsal alignment). Quadrupeds have
the lowest BV/TV values and higher orientation values in the aforementioned areas, and
suspensory primates fall in between quadrupeds and knuckle walkers (closer to the
quadrupeds) (Figure 3). Function 2 differentiates between suspensory primates and the
other locomotor categories. Suspensory primates have the higher metacarpal shape and
orientation values (“rod-like” in a proximo-distal alignment) and higher orientation
values for the proximal end of the middle phalanges.
When the analysis is run with I and E removed to eliminate some variable
redundancy (I = inverse of DA, E = 1- DA) the functions remain highly significant (X2 =
82.7, df = 40, P < 0.001), 100% of the original cases are correctly classified, and cross
validation increases to 64.5% correct classification. The discriminatory factors remain

95
the same on functions 1 and 2 as in the above analysis (function 1 - 82.4% of variance;
function 2 – 17.6%).
Discussion
Trabecular orientation within the manus is sensitive to locomotor function. Taxa
assigned to the same locomotor categories have similar trabecular orientation. The latter
can be related to the stresses placed on the digits during locomotion. Macaques show a
pattern of curvature within the phalanges that somewhat fits the predicted expectation of
greater proximodistal alignment in the curved middle phalanges and more palmar-dorsal
alignment in the “flatter” proximal phalanges. They do possess increased proximodistal
alignment in the distal end of the middle phalanges but all other areas show a greater
percentage of palmar-dorsal alignment.
The highly suspensory orangutans, as predicted, had more proximodistal
alignment of the trabecular bone at all locations examined. In addition to the extremely
high curvature values of these animals, a more proximodistal alignment of the trabecular
bone may help to buffer against tensile forces during suspension. The gibbons, although
not significantly different from orangutans in orientation at any location, do show some
differences from them in distal ends of the phalanges. It was predicted that these agile,
brachiators would also have a more proximodistal alignment of trabecular bone in all
examined areas to mitigate against tensile strain. In the proximal ends of the phalanges
and in the metacarpal head, this prediction holds true, but in the distal ends of the
proximal and middle phalanges, there is a greater percentage of individuals with a more

96
palmar-dorsal alignment. Richmond (2007) has demonstrated using FEA that there is
compressive strain dorsally on the proximal phalanges when loaded as in suspension. It
is possible that more compressive forces are acting on these areas due to gravitational
pull during suspension.
Knuckle walkers show a similar pattern to gibbons in the orientation of trabecular
bone in the phalanges. It was predicted that palmar-dorsal alignment would be present in
both the proximal and distal ends of the middle phalanges due to the high compressive
forces that knuckle walking places upon these elements. However, like the gibbons,
knuckle walkers have a more palmar-dorsal alignment in the distal ends of both
phalanges and a more proximodistal alignment in the proximal ends. Pressure outputs
show increased pressure application in the proximal and distal regions of the middle
phalanges (Matarazzo, chapter 2) so it is unclear why a more proximodistal alignment is
shown in the proximal end of this element. Strain gage analyses of the phalanges have
not been conducted so it cannot be determined for sure what level and direction of strain
is being placed upon the phalanges during knuckle walking and suspension. It may be
that the proximal ends of the phalanges are experiencing increased tensile forces during
suspension. Both chimpanzees and gorillas have a palmar-dorsal orientation of trabecular
bone in the metacarpal head. Results obtained for this region coincide with earlier
studies (Zeininger et al. 2011) that show more activity in the palmar and dorsal regions of
the metacarpal head. This orientation could mitigate strain caused via hyperextension at
the metacarpophalangeal joint during knuckle walking.

97
Although several of the trabecular variables (DA, I, E, BV/TV) taken alone show
no pattern that can be related to locomotor function, orientation and shape have proven to
differentiate successfully at several locations in the manus. Shape and orientation of the
metacarpal heads and the proximal ends of the phalanges discriminate between
locomotor categories. Knuckle walkers and suspensory primates are characterized by
having greater proximodistal alignment and rod-like trabeculae in the proximal ends of
the phalanges, whereas quadrupeds have a more palmar-dorsal alignment and a variety of
trabecular forms. The metacarpal head shows distinct differences between the groups:
knuckle walkers have a palmar-dorsal alignment and disc-like trabecular shape,
suspensory taxa have a proximodistal alignment and rod-like shape and quadrupeds have
a proximodistal alignment and disc-like shape. Again, these two variables, taken alone
are successful differentiating among primates practicing different methods of locomotion.
The additional variables (DA, I, E, and BV/TV) discriminate among taxa if
coupled with shape and orientation. Using DFA, each location within the manus had
greater than 60% accuracy in classifying individuals into three locomotor groups
(knuckle walking, quadrupedal, or suspensory). Accuracy increased when regions of the
same element were examined together, and reached 100% when variables of all five
regions were examined. This is an extremely attractive tool to discern possible locomotor
functions within extinct primates as it can be used on a fragmentary element.
Conclusions
Trabecular orientation and fabric shape show distinct differences among primates
practicing different modes of locomotion in three areas of the manus (metacarpal head
98
and proximal ends of both the proximal and middle phalanges). In addition, when a suite
of trabecular variables (DA, I, E, BV/TV, shape and orientation) are considered as a unit,
the correct classification of a primate into their locomotor category is successful at all
examined zones. Knuckle walkers have a distinct pattern of alignment and trabecular
fabric shape in the metacarpal head that distinguish them from suspensory and
quadrupedal primates. Being able to use isolated zones to predict locomotor propensity is
an attractive tool given the fragmentary nature of the fossil record. These manual
differences in trabecular structure can be related to locomotor use. Micro CT scans of the
manus can help to determine patterns of locomotion in extinct hominoids in a non-
destructive manner and may provide insight into the origins of knuckle walking in the
hominin lineage.
Acknowledgements
Many thanks to Judith Chupasko of the Museum of Comparative Zoology at
Harvard University, Cambridge, MA, Lawrence Heaney of the Field Museum, Chicago,
IL (Department of Mammalogy), Yohannes Haile-Selassie of the Cleveland Museum of
Natural History, Cleveland, IL, Nancy Simmons of American Museum of Natural
History, New York (Department of Mammalogy), and Linda Gordon of the Smithsonian
Institution, Washington DC (Department of Mammalogy) for access to their skeletal
collections. I thank Fettah Kosar of the Harvard Center for Nanoscan Systems for his
help and training with the Micro CT scanner. And for their helpful suggestions and
guidance during the completion of this research, I also thank Drs. Laurie Godfrey,
Margery Coombs, Brigitte Holt, Joseph Hamill, Steven King, and Marina Blanco.

99
Table 4.1: Included samples in trabecular bone analyses.
Taxa Males Females Locomotor category
Pan troglodytes 4 4 Knuckle walking
Gorilla gorilla 5 5 Knuckle walking
Hylobates lar 5 2 Brachiator/Suspensory
Pongo pygmaeus 1 4 Quadrumanus/suspensory
Macaca fascicularis 5 Quadruped

100
Table 4.2: Percentage of individuals for trabecular orientation in examined regions by genus.
Genus MDprox MDdis PXprox PXdis MC head
Pan 75% prox-
dis
12.5% palm-dor 12.5% med-lat
12% prox-dis
88% palm-
dor
75% prox-
dis
12.5% palm-dor 12.5% med-lat
25% prox-dis
50% palm-
dor
25% med-lat
17% prox-dis
66% palm-
dor
17% med-lat
Gorilla 100% prox-
dis
30% prox-dis
70% palm-
dor
100% prox-
dis
80% palm-
dor
20% med-lat
22% prox-dis
78% palm-
dor
Pongo 100% prox-
dis
80% prox-
dis
20% palm-dor
100% prox-
dis
80% prox-
dis
20% med-lat
100%
prox-dis
Hylobates 86% prox-
dis
14% palm-dor
14% prox-dis
72% palm-
dor
14% med-lat
72% prox-
dis
28% palm-dor
14% prox-dis
72% palm-
dor
14% med-lat
100%
prox-dis
Macaca 33% prox-dis
67% palm-
dor
83% prox-
dis
17% palm-dor
80% palm-
dor
20% med-lat
40% prox-
dis
40% palm-
dor
20% med-lat
60% prox-
dis
40% palm-dor
MD = middle phalanx, PX = proximal phalanx, MC = Metacarpal, “dis” = distal end, “prox” = proximal end, prox-dis = proximodistal orientation, palm-dor = palmar-dorsal orientation, med-lat = medial lateral orientation. Greater percentages in bold.

101
Table 4.3: Hypothesized (expected) and observed primary trabecular orientation for taxa.
Locomotor
Category
Include
Genus/Genera
Expected Trabecular
Orientation
Primary Observed
Orientation
Knuckle walking
Pan and Gorilla
MD - palmar-dor PX- prox-dis MC - palmar-dor
MDprox – prox-dist MDdis – palmar-dor PXprox – prox-dist PXdis – palmar-dor MC – palmar-dor
Quadrupedal Macaca MD- Prox-dis PX- Palm-dor MC Palm-dor
MDprox – palmar-dor MDdis – prox-dis PXprox – palmar-dor PXdis – prox-dis & palmar-dor MC – prox-dis
Suspensory Hylobates and Pongo
MD- Prox-dis PX- Palm-dor MC- Palm-dor
MDprox - prox-dis MDdis – prox-dis & palmar-dor PXprox- prox-dis PXdis – prox-dis & palmar-dor MC – prox-dis
MD = middle phalanx, PX = proximal phalanx, MC = Metacarpal, “dis” = distal end, “prox” = proximal end, prox-dis = proximodistal orientation, palm-dor = palmar-dorsal orientation, med-lat = medial lateral orientation.

102
Table 4.4: Mann-Whitney U test results for taxa comparisons. Significance values in parentheses.
Genus Gorilla Pongo Hylobates Macaca
Pan MDdis: BV/TV(0.03)
PXprox: DA(0.02), I(0.02), BV/TV(0.03)
MC: DA(0.01), I(0.01)
MDdis:
orientation (0.045)
PXprox: BV/TV(0.01) MC: orientation (0.02)
MDdis: BV/TV(0.01) MC: orientation (0.015)
MDprox: shape(0.02)
MDdis: orientation (0.045)
PXprox: BV/TV(0.01), orientation(0.045)
MC: BV/TV(0.004)
Gorilla MDprox: E(0.01), BV/TV(0.04) MC: DA(0.01), I(0.01), orientation(0.019)
PXprox: orientation(0.01), DA(0.01), I(0.01) MC: DA(0.05), orientation(0.012)
MDprox: orientation (0.013) PXprox: E(0.03), BV/TV(0.01), orientation(0.001) MC: DA(0.03), I(0.03), BV/TV(0.02)
Pongo MDprox: E(0.03) PXdis: BV/TV (0.05)
MDprox: E(0.02), shape(0.03), orientation(0.03)
PXprox: orientation(0.008) MC: DA(0.01), I(0.01), BV/TV(0.01)
Hylobates MDprox: shape(0.05)
MDdis: BV/TV(0.05), orientation(0.048) PXprox: DA(0.03), I(0.03), BV/TV(0.01), orientation(0.03)
MC:
BV/TV(0.004)
MD = middle phalanx, PX = proximal phalanx, MC = Metacarpal, “dis” = distal end, “prox” = proximal end

103
Table 4.5: Mann-Whitney U test results for locomotor category comparisons. Significance values in parenthesis.
Locomotor Categories
Suspensory primates Quadrupeds
Knuckle walkers MDprox: BV/TV(0.04)
PXprox: BV/TV(0.05) MC: E(0.03), orientation(0.001)
MDdist: E(0.03), orientation(0.027) PXprox: E(0.01), BV/TV(0.001), orientation(0.002) PXdist: DA(0.02), I(0.02) MC: BV/TV(0.01)
Suspensory primates MDprox: shape(0.04), orientation(0.05) PXprox: shape(0.04), BV/TV(0.01), orientation(0.002) MC: BV/TV(0.002)
MD = middle phalanx, PX = proximal phalanx, MC = Metacarpal, “dis” = distal end, “prox” = proximal end

104
A) Knuckle walker B) Suspensory Primate
C) Quadruped Figure 4.1: SVD Rose diagrams displaying the trabecular orientation for the proximal end of the middle phalanx. A) Knuckle walker (female gorilla) and B) suspensory primate (female orangutan) main direction of trabecular orientation is towards reader (red area) in a proximo-distal alignment. C) Quadruped (male macaque) has a palmar-dorsal orientation. (Posterior-anterior = palmar-dorsal; proximal-distal runs towards-away from viewer)

105
A) Knuckle walker B) Suspensory Primate
C) Quadruped Figure 4.2: SVD Rose diagrams displaying the trabecular orientation for the metacarpal head. A) Knuckle walker (female chimpanzee) has a palmar-dorsal trabecular orientation. B) Suspensory primate (male gibbon) and C) quadruped (male macaque) have a proximal-dorsal orientation.

106
Figure 4.3: Discriminant Function Plot for all included regions (proximal and distal ends of the middle and proximal phalanges and the metacarpal head). Along Function 1, knuckle walkers have high BV/TV in the proximal and distal ends of the proximal phalanges and proximal end of the middle phalanges and more palmar-dorsal alignment in the metacarpal head and distal end of the proximal phalanges. Quadrupeds and suspensory primates have more proximo-distal alignment in those regions.

107
CHAPTER 5
CONCLUSIONS: KNUCKLE-WALKING SIGNAL IN THE AFRICAN
APES AND THE KNUCKLE-WALKING HOMININ HYPOTHESIS
Chapter Summaries
The main goal of this research was to determine whether there is a knuckle-
walking signal within manual elements that can be used in paleontological investigations
of fossils. To interpret skeletal signals of knuckle walking, it is important to understand
how chimpanzees and gorillas actually use their hands in knuckle walking. Therefore, I
began with an examination of the pressures applied to the primary weight bearing
elements of extant knuckle walkers: the manual middle phalanges. This research resulted
in a significant expansion of knuckle walking pressure data collected for chimpanzees
and the first pressure data collected for gorillas. I found support for inferences drawn
from previous behavioral and kinematic research (Inouye 1994; Tuttle 1967): namely,
knuckle-walking chimpanzees use more variable hand positions than do knuckle-walking
gorillas. Chimpanzees use both the palm-back and palm-in hand position with
approximately equal frequency and touch-off occurs with digits 2 or 3 in the palm-in
position and mainly digit 3 in the palm-back position. In contrast, gorillas use the palm-
back position almost exclusively and touch-off occurs at either digit 2 or 3. Touch-off
digit preference appears related to digit placement in relation to the direction of
movement. The third digit of chimpanzees is markedly longer than the other rays and
this element is placed forward when the hand is in the palm-back position, making it the
final touch-off element. Pressure is highest on the touch-off digit for both taxa. Gorillas
have a more even alignment of the knuckle-walking platform and they distribute weight

108
more evenly across the manus. While these differences may superficially appear to imply
different knuckle-walking mechanisms in the two species, it is more accurate to describe
gorillas as practicing a smaller subset of the variety of knuckle-walking positions used by
chimpanzees.
I documented a number of behavioral and morphological similarities between
chimpanzees and gorillas (Table 5.1) – features that distinguish these taxa from other
primates. For both chimpanzees and gorillas, pressure application is lightest on the fifth
digit. When phalangeal curvature is examined across the manus in knuckle walkers, it is
the middle phalanges of digit 5 that have greatest curvature values. The other digits
receive relatively greater compressive forces which are reflected in their “flatter” middle
phalangeal morphology. The knuckle walkers also have the same profile of middle
phalangeal curvature across the manus: digit 5 > digit 2 > digit 3 > digit 4. None of the
other taxa (orangutans, gibbons, spider monkeys, capuchins, macaques) whose
phalangeal curvature was measured for all four digits exhibit the same curvature profile.
The other apes included in the analyses (orangutans and gibbons) are both highly
suspensory, but each differs in curvature profile from each other and from the closely
related knuckle walkers (orangutans: digit 3 > digit 4 > digit 2 > digit 5; gibbons: digit 4
> digit 3 > digit 5 > digit 2).
Knuckle walkers also share similar Indices of Relative Curvature (middle
phalangeal curvature/proximal phalangeal curvature) in digits 2-5. Their middle
phalanges are relatively flatter than their proximal phalanges giving them indices that are

109
less than one (~.85) for each digit 2-5. This distinguishes them from taxa practicing other
modes of locomotion. Capuchins and macaques are separated by phylogenetic distance
but both practice similar forms of quadrupedalism and share indices of relative curvature
that are greater than one on all digits 2-5. These indices reflect greater curvature in the
middle phalanges than in the proximal. The gibbons and spider monkeys, separated by
the same phylogenetic distance, both practice a fast, fluid brachiation and share similar
indices of relative curvature that approximately equal one in each digit 2-5. Only
orangutans fail to differentiate from knuckle walkers based on indices alone. In this case
the quadrumanous climbers also have indices that are less than one, but this is not
reflective of middle phalanges that are “flat”. Orangutans have extremely high proximal
phalangeal curvature values and high middle phalangeal curvature values that are greater
than any other extant primate (Matarazzo, 2008). The locomotor signal originally seen in
digit 3 (Matarazzo, 2008) is also seen in digits 2 and 4, and 5, and each of these rays can
be used to discriminate among knuckle walkers, brachiators, quadrupeds, and
quadrumanous climbers. When indices are derived from measurements of phalanges
from different rays within the same manus, they still are able to differentiate between
locomotor categories. Bootstrapping analysis also shows that the locomotor signal is
present even if indices are derived from measurements of middle and proximal phalanges
from different individuals of the same species. This increases the applicability of this
locomotor signal to the fossil record, given that elements of the same ray are rarely
recovered.

110
The trabecular bone structure of the phalanges and metacarpal head also show
differences among locomotor categories. Trabecular bone orientation in the proximal
ends of both the middle and proximal phalanges and in the metacarpal head showed
significant differences among knuckle walkers, quadrupeds, and suspensory primates
(brachiators and quadrumanous climbers). The proximal ends of the proximal and
middle phalanges have trabecular bone aligned in a proximodistal direction in knuckle
walkers and suspensory taxa, and palmar-dorsal in the quadrupeds. In the metacarpal
head, all knuckle walkers have a palmar-dorsal alignment, most suspensory primates are
more proximodistally aligned, and quadrupeds show approximately equal numbers of
individuals with either proximodistal or palmar-dorsal orientations. Knuckle-walking
taxa are characterized by a pattern of orientation (proximodistal alignment in the
proximal ends of the phalanges and palmar-dorsal in the distal ends) that was not
predicted based on the known pressure applications. It was originally expected that the
middle phalanges would have a palmar-dorsal orientation at both proximal and distal
ends due to the compressive forces applied during knuckle walking, and that the curved
proximal phalanges would have a proximodistal orientation at both locations. It is
possible that the proximal ends of the phalanges are experiencing increased tensile and
torsional forces during suspension and this is affecting the trabecular bone orientation in
these locations. Quadrupedal primates show an “opposite” pattern of palmar-dorsal
alignment in the proximal ends and proximodistal alignment in the distal regions.
Suspensory taxa have primarily a proximodistal alignment at all examined locations as
predicted based on the high tensile forces that these joints are subjected to during
suspension. The ability to differentiate between locomotor categories in all examined

111
locations was enhanced when a suite of trabecular features were included in analyses
(orientation, shape, degree of anisotropy (DA), isotropy index (I), elongation index (E),
bone volume (BV/TV)). All individuals were correctly classified in their locomotor
groups when all variables for all manual locations were used in discriminant function
analysis. The ability to use even one location to derive a possible locomotor pattern is
useful if a fossil is too fragmentary to reconstruct to estimate a curvature value (possibly
via Deane and Begun’s (2008) method of high resolution polynomial curve fitting).
Knuckle-walking Ancestor
Earlier attempts to locate a knuckle-walking signal focused on the wrist and
metacarpals of hominins and extant primates (Corruccini and McHenry, 2001; Dainton,
2001; Dainton and Macho, 1999; Inouye and Shea 2004; Kelly, 2001; Richmond and
Strait, 2000; Richmond et al., 2001; Shea and Inouye, 1993; Williams 2010). The results
of these analyses have been controversial. Although the wrist and metacarpals are held in
a distinct manner during knuckle walking (extension at the wrist and
metacarpophalangeal joint), no morphological feature has been described for these areas
that differentiates knuckle walkers clearly from taxa using other types of locomotion.
The primary focus of the wrist has been the examination of possible extension limiting
mechanisms of the distal radius (for a review see Richmond et al., 2001). Within the
African apes, extension is limited to a relatively large scaphoid notch on the distal radius.
Richmond and Strait (2000) argued that this feature can be linked to knuckle walking and
is seen in Australopithecus anamensis and A. afarensis. This claim was contested based
on the presence of other “soft-tissue” mechanisms to limit extension and similar

112
extension limiting factors noted in terrestrial quadrupeds (Lovejoy et al., 2001; Richmond
et al., 2001; Tuttle, 1967). A similar problem is noted with the morphology of the
metacarpals: many features are not specific to Pan and Gorilla but rather are often
present in terrestrial digitigrade taxa (McCrossin and Benefit, 1997; Richmond et al.,
2001; Sarmiento, 1988).
The manual phalanges were largely ignored in this debate. Although it was
predicted that the dorsal surface of the middle phalanges of knuckle walkers should be
straighter to allow for greater dissipation of weight, examinations of these elements was
not undertaken in previous research (Richmond et al., 2001). In fact, Richmond and
colleagues (2001) noted their “surprise” that given the role that the proximal and middle
phalanges played in knuckle walking “that no clear knuckle-walking adaptations are
known in these bones” (p.95). If analysis is limited to the external morphology of either
the proximal or middle phalanges, then this statement is somewhat true. However, when
curvature values of the elements are compared, or internal trabecular features are
examined, a much different outcome applies. There is, indeed, a clear knuckle-walking
signal. The indices of relative curvature and trabecular bone features show definitive
differences among taxa that are related to locomotor function and not phylogeny. These
features can be measured without destruction. Thus they provide excellent tools for
determining locomotor patterns from the manual elements of rare fossil hominins to
determine a possible locomotor pattern.
As mentioned earlier, chimpanzees are much more variable than gorillas in their
hand placement during knuckle walking. They use both palm-in and palm-back hand

113
positions about equally and individual chimpanzees show more variation with preferred
hand position than gorillas. Gorillas are more consistent in their posture, hand use (palm-
back) and digit use (2-5). In fact, gorillas are practicing a subset of the various knuckle-
walking positions used by chimpanzees. This consistency may be related to the greater
reliance on knuckle walking by gorillas, and it is reflected in the digit lengths of these
two taxa. Gorillas have relatively even digit lengths providing for a more “stable”
knuckle-walking platform, while chimpanzees have proportionally longer digits 3 and 4.
These longer rays are related to increased suspensory behaviors in this taxon. Because of
the disproportionate lengths, digit 3 is frequently pushed forward of the other rays when
chimpanzees use the palm-back hand position. This implies that the difference in touch-
off digit by chimpanzees and gorillas is not one of preference but rather it is related to
structural differences.
Despite the length pattern differences, chimpanzees and gorillas are the only two
taxa to share a phalangeal curvature profile. They have similar indices of relative
curvature, and similar trabecular bone features. These morphological features coupled
with the similarities noted in their knuckle-walking behavior support a shared origin of
knuckle walking (and by implication, a knuckle-walking human ancestor).

114
Table 5.1: Similarities and Differences between Pan and Gorilla.
Similarities Differences
Pan & Gorilla
Pressure Both use palm-in and Palm-back hand positions.
Pan has more variation in hand position use. Gorilla use palm-back almost exclusively
Both touch-down with ulnar aspect of hand.
Gorilla has more even pressure distribution across the hand.
Least amount of pressure on digit 5.
Most often touch-off with either digit 2 or 3.
Morphology (External)
Gorilla has more even digit lengths and more “stable” knuckle-walking platform. Pan has disproportionate digit lengths (digits 3 and 4 longer).
Same pattern of phalangeal curvature across the manus: Px5> Px2> Px4> Px3; and Md5> Md2> Md3> Md4.
Similar Indices of Relative Curvature
Morphology (Internal)
Palmar-dorsal trabecular bone orientation in the metacarpal head, and distal ends of phalanges.
Proximodistal trabecular bone orientation in proximal ends of phalanges.

115
APPENDIX A
MANUAL PRESSURE PRINTS OF KNUCKLE-WALKING APES
Knuckle-walking pressure print samples from chimpanzees and gorillas. Red color denotes increased pressure point. Black line shows center of pressure movement throughout the step. Images are not to scale. (PI = Palm-in; PB = Palm back; CC# = step code; TO# = Touch-off digit #)
Chimpanzees
“Apollo” Adult Male
PB Right hand (CC6) TO3 PB Right hand (CC3) TO3 PI Right hand (CC5) TO2 “Brandy” Adult Female
PB Right hand (CC29) PB Left hand (CC38) TO3 PI Right hand (CC106) TO2 TO3 “Candy” Adult Female
PB Right hand (CC71) TO3 PI Right hand (CC17) TO3

116
Appendix A continued: Chimpanzees
“Zack” Juvenile Male
PB Left hand (CC50) TO3 PB Right hand (CC6) TO3 PI Right hand (CC9) TO3 “Manetta” Juvenile Female
PB Left hand (CC15) TO3 PI Left hand (CC36) TO3

117
Appendix A continued: Gorillas
Gorillas
“Kwan” Adult Male:
PB Right hand (CC9) TO2 “Gigi” Adult Female
PB Right hand (CC G1) TO2 “Medini” Adult Female
PB Right hand (CC21) TO2 PI Right hand (CC19) TO2
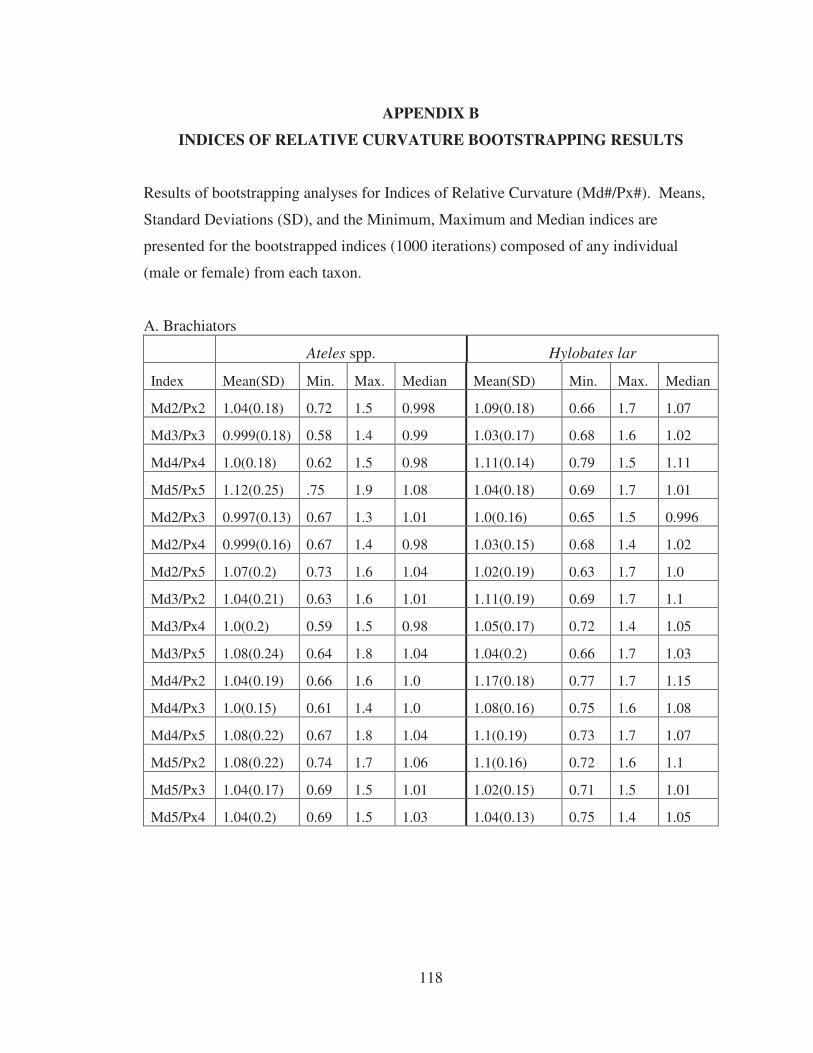
118
APPENDIX B
INDICES OF RELATIVE CURVATURE BOOTSTRAPPING RESULTS
Results of bootstrapping analyses for Indices of Relative Curvature (Md#/Px#). Means,
Standard Deviations (SD), and the Minimum, Maximum and Median indices are
presented for the bootstrapped indices (1000 iterations) composed of any individual
(male or female) from each taxon.
A. Brachiators
Ateles spp. Hylobates lar
Index Mean(SD) Min. Max. Median Mean(SD) Min. Max. Median
Md2/Px2 1.04(0.18) 0.72 1.5 0.998 1.09(0.18) 0.66 1.7 1.07
Md3/Px3 0.999(0.18) 0.58 1.4 0.99 1.03(0.17) 0.68 1.6 1.02
Md4/Px4 1.0(0.18) 0.62 1.5 0.98 1.11(0.14) 0.79 1.5 1.11
Md5/Px5 1.12(0.25) .75 1.9 1.08 1.04(0.18) 0.69 1.7 1.01
Md2/Px3 0.997(0.13) 0.67 1.3 1.01 1.0(0.16) 0.65 1.5 0.996
Md2/Px4 0.999(0.16) 0.67 1.4 0.98 1.03(0.15) 0.68 1.4 1.02
Md2/Px5 1.07(0.2) 0.73 1.6 1.04 1.02(0.19) 0.63 1.7 1.0
Md3/Px2 1.04(0.21) 0.63 1.6 1.01 1.11(0.19) 0.69 1.7 1.1
Md3/Px4 1.0(0.2) 0.59 1.5 0.98 1.05(0.17) 0.72 1.4 1.05
Md3/Px5 1.08(0.24) 0.64 1.8 1.04 1.04(0.2) 0.66 1.7 1.03
Md4/Px2 1.04(0.19) 0.66 1.6 1.0 1.17(0.18) 0.77 1.7 1.15
Md4/Px3 1.0(0.15) 0.61 1.4 1.0 1.08(0.16) 0.75 1.6 1.08
Md4/Px5 1.08(0.22) 0.67 1.8 1.04 1.1(0.19) 0.73 1.7 1.07
Md5/Px2 1.08(0.22) 0.74 1.7 1.06 1.1(0.16) 0.72 1.6 1.1
Md5/Px3 1.04(0.17) 0.69 1.5 1.01 1.02(0.15) 0.71 1.5 1.01
Md5/Px4 1.04(0.2) 0.69 1.5 1.03 1.04(0.13) 0.75 1.4 1.05

119
B. Quadrupeds
Sapajus apella Macaca spp.
Index Mean (SD) Min. Max. Median Mean (SD) Min. Max. Median
Md2/Px2 1.28(0.2) 0.8 1.9 1.29 1.13(0.2) 0.73 1.8 1.12
Md3/Px3 1.24(0.21) 0.84 1.9 1.23 1.11(0.19) 0.7 1.8 1.1
Md4/Px4 1.33(0.19) 0.93 1.9 1.32 1.05(0.16) 0.59 1.7 1.05
Md5/Px5 1.28(0.13) 0.96 1.6 1.3 1.18(0.17) 0.76 1.7 1.17
Md2/Px3 1.27(0.21) 0.79 1.8 1.3 1.16(0.2) 0.72 1.8 1.13
Md2/Px4 1.31(0.19) 0.87 1.9 1.31 1.1(0.21) 0.66 2.0 1.08
Md2/Px5 1.2(0.17) 0.76 1.5 1.24 1.14(0.19) 0.73 1.7 1.12
Md3/Px2 1.25(0.21) 0.85 1.9 1.23 1.09(0.2) 0.7 1.7 1.08
Md3/Px4 1.28(0.2) 0.93 1.9 1.26 1.06(0.2) 0.64 1.9 1.05
Md3/Px5 1.17(0.17) 0.81 1.6 1.15 1.1(0.18) 0.71 1.7 1.09
Md4/Px2 1.3(0.21) 0.86 2.0 1.29 1.08(0.16) 0.65 1.5 1.08
Md4/Px3 1.29(0.21) 0.84 1.9 1.28 1.11(0.16) 0.64 1.5 1.09
Md4/Px5 1.22(0.17) 0.81 1.6 1.23 1.09(0.14) 0.66 1.4 1.08
Md5/Px2 1.37(0.18) 1.02 1.9 1.36 1.17(0.19) 0.76 1.8 1.15
Md5/Px3 1.36(0.19) 0.99 1.9 1.36 1.2(0.19) 0.75 1.8 1.18
Md5/Px4 1.4(0.17) 1.1 1.9 1.38 1.14(0.2) 0.69 2.0 1.13

120
C. Knuckle walkers
Pan troglodytes Gorilla gorilla
Index Mean (SD) Min. Max. Median Mean (SD) Min. Max. Median
Md2/Px2 0.93(0.15) 0.6 1.6 0.92 0.87(0.13) 0.44 1.5 0.87
Md3/Px3 0.88(0.13) 0.55 1.4 0.86 0.84(0.12) 0.48 1.4 0.83
Md4/Px4 0.86(0.12) 0.57 1.4 0.85 0.81(0.11) 0.5 1.2 0.8
Md5/Px5 0.94(0.13) 0.6 1.4 0.93 0.87(0.12) 0.58 1.5 0.86
Md2/Px3 0.94(0.15) 0.55 1.5 0.93 0.88(0.13) 0.46 1.5 0.88
Md2/Px4 0.93(0.14) 0.58 1.5 0.91 0.88(0.13) 0.47 1.4 0.87
Md2/Px5 0.91(0.14) 0.58 1.4 0.89 0.86(0.13) 0.46 1.5 0.85
Md3/Px2 0.87(0.13) 0.6 1.4 0.86 0.83(0.11) 0.44 1.3 0.82
Md3/Px4 0.87(0.12) 0.58 1.3 0.85 0.83(0.11) 0.49 1.3 0.83
Md3/Px5 0.84(0.12) 0.58 1.3 0.83 0.81(0.11) 0.47 1.4 0.8
Md4/Px2 0.87(0.13) 0.59 1.5 0.85 0.8(0.11) 0.46 1.2 0.79
Md4/Px3 0.87(0.13) 0.54 1.4 0.86 0.81(0.12) 0.48 1.3 0.81
Md4/Px5 0.84(0.12) 0.57 1.4 0.83 0.79(0.11) 0.47 1.2 0.78
Md5/Px2 0.97(0.14) 0.63 1.5 0.96 0.88(0.13) 0.56 1.5 0.87
Md5/Px3 0.98(0.13) 0.58 1.5 0.97 0.9(0.13) 0.58 1.5 0.89
Md5/Px4 0.97(0.13) 0.61 1.4 0.96 0.89(0.12) 0.6 1.4 0.88

121
D. Quadrumanous climbers
Pongo pygmaeus
Index Mean (SD) Min. Max Median
Md2/Px2 0.91(0.11) 0.63 1.3 0.92
Md3/Px3 0.91(0.1) 0.66 1.2 0.89
Md4/Px4 0.89(0.1) 0.64 1.4 0.89
Md5/Px5 0.88(0.11) 0.56 1.3 0.88
Md2/Px3 0.88(0.1) 0.64 1.2 0.88
Md2/Px4 0.88(0.1) 0.63 1.4 0.88
Md2/Px5 0.91(0.12) 0.6 1.4 0.89
Md3/Px2 0.94(0.11) 0.65 1.3 0.93
Md3/Px4 0.91(0.11) 0.67 1.3 0.9
Md3/Px5 0.93(0.12) 0.64 1.5 0.92
Md4/Px2 0.93(0.11) 0.6 1.3 0.93
Md4/Px3 0.9(0.09) 0.64 1.2 0.89
Md4/Px5 0.92(0.12) 0.61 1.4 0.91
Md5/Px2 0.89(0.1) 0.59 1.2 0.89
Md5/Px3 0.86(0.1) 0.6 1.2 0.86
Md5/Px4 0.86(0.1) 0.57 1.2 0.86
122
BIBLIOGRAPHY
Barak MM, Lieberman DE, and Hublin JJ. 2011. A Wolff in sheep’s clothing: Trabecular bone adaptation in response to changes in joint loading orientation. Bone
49(6):1141-1151. Barden MB, Wunderlich RE, Demes, B. 2010. Plantar pressure during bipedalism and
quadrupedalism in Cebus. Am J Phys Anthropol Suppl. 50:61. Begun DR. 1993. Response to ‘Knuckle-walking ancestors’ (Shea and Inouye). Science
259:294. Berillon G, Daver G, D’Aout K, Nicolas G, de la Villetanet B, Multon F, Digrandi G,
Dubreuil G. 2010. Bipedal versus quadrupedal hind limb and foot kinematics in a captive sample of Papio anubis: setup and preliminary results. Int J Primatol 31:159-180.
Bertram JEA. 2004. New perspectives on brachiation mechanics. Yrbk Phys Anthropol
47:100-117. Bertram JEA and Chang Y. 2001. Mechanical energy oscillations of two brachiation
gaits: Measurement and Simulation. Am J Phys Anthropol 115:319-326. Bertsch C, Unger H, Winkelmann W, Rosenbaum D. 2004. Evaluation of early walking
patterns from plantar pressure distribution measurements. First year results of 42 children. Gait and Posture 19:235-242.
Burr DB, Ruff CB and Johnson C.1989. Structural adaptations of the femur and humerus
toarboreal and terrestrial environments in three species of macaque. Am J Phys
Anthropol 79:357-367. Cant JGH.1988. Positional behavior of long-tailed macaques (Macaca fascicularis) in
Northern Sumatra. Am J Phys Anthropol 76:29-37. Cant JGH, Youlatos D and Rose MD. 2001. Locomotor behavior of Lagothrix
lagothricha and Ateles belzebuth in Yasuni National Park, Ecuador: general patterns and nonsuspensory modes. J Hum Evol 41:141-166.
Cant JGH, Youlatos D, and Rose MD. 2003. Suspensory locomotion of Lagothrix
lagothricha and Ateles belzebuth in Yasuni National Park, Ecuador. J Hum Evol 44:685-699.
Carlson KJ and Patel BA. 2006 Habitual use of the primate forelimb is reflected in the
material properties of subchondral bone in the distal radius. J Anat 208:659-670.

123
Cartmill, M. 1985. Climbing. In Functional Vertebrate Morphology. (Eds. M Hildebrand,
DM Bramble, KF Kiem, & DB Wake) Harvard Univ. Press: Cambridge, MA, pp. 73–88.
Chang Y, Bertram JEA and Lee DV. 2000. External forces and torques generated by the
brachiating white-handed gibbon (Hylobates lar). Am J Phys Anthropol 113:201-216.
Chirchir H, Richmond BG, Griffon NL, Nakatsukasa M, Zeininger A, and Ketcham RA.
2010. Hand biomechanics and trabecular architecture in hominoid metacarpals. Am J Phys Anthropol 141(S50):81.
Corruccini RS. 1978. Comparative osteometrics of the hominoid wrist joint, with special
reference to knuckle-walking. J Hum Evol 7:307–321. Corruccini RS and McHenry HM. 2001. Knuckle-walking hominid ancestors. J Hum
Evol 40:507-511. D’Aout K, Vereecke E, Schoonaert K, De Clercq D, Van Elsacker L, Aerts P. 2004.
Locomotion in bonobos (Pan paniscus): differences and similarities between bipedal and quadrupedal terrestrial walking, and a comparison with other locomotor modes. J Anat 204:353-361.
Dainton M. 2001. Did our ancestors knuckle-walk? Nature 410:324-325. Dainton M and Macho GA. 1999. Did knuckle walking evolve twice? J Hum Evol
36:171-194. Deane AS and Begun DR. 2008. Broken fingers: retesting locomotor hypotheses for
fossil hominoids using fragmentary proximal phalanges and high-resolution polynomial curve fitting (HR-PCF). J Hum Evol 55:691-701.
DeSilva JM and Devlin MJ. 2012 A comparative study of the trabecular bony
architecture of the talus in humans, non-human primates, and Australopithecus. J
Hum Evol 63:536-551. Doran DM. 1993. Sex differences in adult chimpanzee positional behavior: The
influenceof body size on locomotion and posture. Am J Phys Anthropol 91:99-115.
Doran DM.1997. Ontogeny of locomotion in mountain gorillas and chimpanzees. J Hum
Evol 32:323-344.

124
Fajardo RJ and Muller R. 2001. Three-dimensional analysis of nonhuman primate trabecular architecture using micro-computed tomography. Am J Phys Anthropol 115:327-336.
Fajardo RJ, Ryan TM, and Kappelman J. 2002. Accessing the accuracy of high resolution
X-ray computed tomography of primate trabecular bone by comparisons with histological sections. Am J Phys Anthropol 118:1-10.
Fox JC and Keaveny TM. 2001. Trabecular Eccentricity and Bone Adaptation. J Theor
Biol 212:211-221. Garber PA and Rehg JA. 1999. The ecological role of the prehensile tail in white-faced
capuchins (Cebus capucinus). Am J Phys Anthropol 110:325-339. Gebo DL. 1996. Climbing, brachiation, and terrestrial quadrupedalism: historical
precursors of hominid bipedalism. Am J Phys Anthropol 101:55-92. Hayama S, Chatani K and Nakatsukasa M. 1994. The digitigrade hand and terrestrial
adaptation in Japanese macaques. Anthropol Sci 102:115-125. Inouye SE. 1992. Ontogeny and allometry of African ape manual rays. J Hum Evol
23:107-138. Inouye SE. 1994. Ontogeny of knuckle-walking hand postures in African apes. J Hum
Evol 26:459-485. Inouye SE and Shea BT. 2004. The implications of variation in knuckle-walking features
for models of African hominoid locomotor evolution. J Anthropol Sci 82:67-88. Jacobs CR. 2000. The mechanobiology of cancellous bone structural adaptation. J Rehab
Research Devel 37(1):209-216. Jungers WL, Godfrey LR, Simons EL and Chatrath PS. 1997. Phalangeal curvature and
positional behavior in extinct sloth lemurs (Primates, Palaeopropithecidae). Proc
Natl Acad Sci 94:11998-12001. Jungers WL, Godfrey LR, Simons EL, Wunderlich RE, Richmond BG and Chatrath PS.
2002. Ecomorphology and behavior of giant extinct lemurs from Madagascar. In Reconstructing behavior in the primate fossil record. (Eds. JM Plavcan, RF Kay, WL Jungers, & CP van Schaik) Kluwer Academic Press/Plenum Publishers: New York. pp 371-411.
Jungers WL, Simons EL and Godfrey LR. 1994. Phalangeal curvature and locomotor
adaptations in subfossil lemurs. Am J Phys Anthropol 18:117-118.

125
Keaveny TM, Morgan EF, Niebur GL, and Yeh OC. 2001. Biomechanics of trabecular bone. Annu Rev Biomed Eng 3:307-333.
Kelly RE. 2001. Tripedal knuckle-walking: A proposal for the evolution of human
locomotion and handedness. J Theor Biol 213:333-358. Ketcham RA. 2005. Three-dimensional grain fabric measurements using high-resolution
X-ray computed tomography. J Struct Geol 27:1217-1228. Ketcham RA and Ryan TM. 2004. Quantification and visualization of anisotropy in
trabecular bone. J Microscopy 213(2):158-171. Kivell TL and Schmitt D. 2009. Independent evolution of knuckle-walking in African
apes shows that humans did not evolve from a knuckle-walking ancestor. Proc
Nat Acad Sci 106(34):14241-14246. Kivell TL, Skinner MM, Lazenby R, and Hublin JJ. 2011. Methodological considerations
for analyzing trabecular architecture: an example from the primate hand. J Anat 218:209-225.
Lazenby RA, Skinner MM, Hublin J, and Boesch C. 2011. Metacarpal Trabecular
Architecture Variation in the Chimpanzee (Pan troglodytes): Evidence for locomotion and tool-use? Am J Phys Anthropol 144:215-225.
Lazenby RA, Skinner, Kivell TL, and Hublin JJ. 2011. Scaling VOI size in 3D µCT
studies of trabecular bone: A test of the over-sampling hypothesis. Am J Phys
Anthropol 144:196-203. Lovejoy CO, Heiple KG and Meindl RS. 2001. Reply to “Did our ancestors knuckle-
walk?” Nature 410:325-326. MacLatchy L and Muller R. 2002. A comparison of the femoral head and neck trabecular
architecture of Galago and Perodicticus using micro-computed tomography (µCT). J Hum Evol 43:89-105.
Marchi D. 2005. The cross-sectional geometry of the hand and foot bones of the
Hominoidea and its relationship to locomotor behavior. J Hum Evol 49:743-761. Matarazzo SA. 2008 Knuckle walking signal in the manual digits of Pan and Gorilla. Am
J Phys Anthropol. 135:27-33. McCrossin ML and Benefit BR. 1997. On the relationships and adaptations of
Kenyapithecus, a large-bodied hominoid from the Middle Miocen of Eastern
Africa. In Primate Locomotion: recent advances. (Eds. D Begun, C Ward, & M Rose) Plenum Press: New York. pp 353-396.

126
Mittra E, Rubin C, and Qin Y. 2005. Interrelationship of trabecular mechanical and microstructural properties in sheep trabecular bone. J Biomech 38:1229-1237.
Morton DJ. 1926. Evolution of man’s erect posture (preliminary report). J Morphol
43(1):147-179. Patel BA. 2010. Functional morphology of cercopithecoid primate metacarpals. J Hum
Evol 58:320-337. Patel BA and Carlson KJ. 2007. Bone density spatial patterns in the distal radius reflect
habitual hand postures adopted by quadrupedal primates. J Hum Evol 52:130-141. Patel BA and Wunderlich RE. 2010. Dynamic pressure patterns in the hands of olive
baboons (Papio anubis) during terrestrial locomotion: implications for cercopithecoid primate hand morphology. Anatom Record 293:710-718.
Perelman P, Johnson WE, Roos C, Seuanez HN, Horvath JE, Moreira MA, Kessing B, Pontius J, Scheinder MP, Silva A, O’Brien SJ, and Pecon-Slattery J. 2011. A molecular phylogeny of living primates. PLOS Genetics 7(3):e1001342.
Polk JD, Williams SA, Peterson JV, Roseman CC, and Godfrey LR. 2010. Subchondral bone apparent density and locomotor behavior in extant primates and subfossil lemurs Hadropithecus and Pachylemur. Int J Primatol 31:275-299.
Polk JD, Blumenfeld J, and Ahlumwalia D. 2008. Knee posture predicted subchondral
apparent density in the distal femur: An experimental validation. Anatom Record
291:293-302. Pontzer H, Lieberman DE, Momin E, Devlin MJ, Polk JD, Hallgrimsson B, and Cooper
DM. 2006. Trabecular bone in the bird knee responds with high sensitivity to changes in load orientation. J Exp Biol 209:57-65.
Remis MJ. 1998. The gorilla paradox: the effects of body size and habitat on the
positional behavior of lowland and mountain gorillas. In Primate Locomotion: recent advances. (Eds. D Begun, C Ward, & M Rose) Plenum Press: New York. pp. 353-396.
Richmond BG. 1998. Ontogeny and biomechanics of phalangeal form in primates. Ph.D
dissertation, State University of New York at Stony Brook, Stony Brook. Richmond BG. 2007. Biomechanics of phalangeal curvature. J Hum Evol 53:678-690. Richmond BG, Begun DR and Strait DS. 2001. Origin of human bipedalism: The
knucklewalking hypothesis revisited. Yrbk Phys Anthropol 44:70-105. Richmond BG and Strait DS. 2000. Evidence that humans evolved from a knuckle-
walking ancestor. Nature 404:382-385.

127
Richmond BG and Strait DS. 2001a. Knuckle-walking hominid ancestor: a reply to
Corruccini and McHenry. J Hum Evol 40:513-520. Richmond BG and Strait DS. 2001b. Reply to “Did our ancestors knuckle-walk?” Nature
410:326. Rodman PS. 1979. Skeletal differentiation of Macaca fascicularis and Macaca
nemestrina in relation to arboreal and terrestrial quadrupedalism. Am J Phys
Anthropol 51:51-62. Ruff C, Holt B, and Trinkaus E. 2006. Who’s Afraid of the Big Bad Wolff?: “Wolff’s
Law” and Bone Functional Adaptation. Am J Phys Anthropol 129:484-498. Ryan TM and Ketchum RA. 2002. The three-dimensional structure of trabecular bone in
the femoral head of strepsirrhine primates. J Hum Evol 43:1-26. Ryan TM and Shaw CN. 2012. Unique suites of trabecular bone features characterize
locomotor behavior in human and non-human Anthropoid primates. PLoS ONE 7(7):e41037.
Ryan TM and van Rietbergen B. 2005. Mechanical significance of femoral head
trabecular bone structure in Loris and Galago evaluated using micromechanical finite element models. Am J Phys Anthropol 126:82-96.
Ryan TM and Walker A. 2010. Trabecular bone structure in the humeral and femoral
heads of Anthropoid primates. Anatom Record 293:719-729. Sarmiento EE. 1985. The evidence for terrestrial quadrupedalism in the hominid lineage.
Am J Phys Anthropol 66(2)-224-225. Sarmiento EE. 1998. Generalized quadrupeds, committed bipeds, and the shift to open
habitats: an evolutionary model of hominid divergence. American Museum
Novitates 3520:1-78. Scherf H and Tilgner R. 2009. A New High-Resolution Computed Tomography (CT)
Segmentation Method for Trabecular Bone Architectural Analysis. Am J Phys
Anthropol 140:39-51. Shea BT and Inouye SE. 1993. Knuckle-walking ancestors. Science 259:293-294. Shaw CN and Ryan TM. 2012. Does skeletal anatomy reflect adaptation to locomotor
patterns? Cortical and trabecular Architecture in human and non-human Anthropoids. Am J Phys Anthropol 147:187-200.

128
Smith RJ and Jungers WL. 2007. Body mass in comparative primatology. J Hum Evo 32:523-559.
Stern JT. 1975. Before bipedality. Yrbk Phys Anthropol 19:59–68. Stern JT, Jungers WL, and Susman RL. 1995. Quantifying phalangeal curvature: an
empirical comparison of alternative methods. Am J Phys Anthropol 97:1-10. Straus WL. 1949. Riddle of man’s ancestry. Quarterly Rev Bio 24:200-223. Susman RL. 1979. The comparative and functional morphology of hominoid fingers. Am
J Phys Anthropol 50:215-236. Tague RG. 2002. Variability of metapodials in primates with rudimentary digits: Ateles
geoffroyie, Colobus guereza, and Peridicticus potto. Am J Phys Anthropol 117:195-208.
Tuttle RH. 1967. Knuckle-walking and the Evolution of Hominoid Hands. Am J Phys
Anthropol 26(2):171-206. Tuttle RH. 1969. Knuckle-walking and the problem of human origins. Science
166(3908):953-961. Tuttle RH. 1974. Darwin’s apes, dental apes, and the descent of man: Normal science in
evolutionary anthropology. Current Anthropol 15:389-398. Tuttle RH. 1975. Parallelism, brachiation, and hominid phylogeny. In Phylogeny of the
Primates: A Multidisciplinary Approach. (Eds. WP Luckett & FS Szalay) Plenum Press: New York. pp. 447-480.
Tuttle RH and Cortright GW. 1988. Positional behavior, adaptive complexes and
evolution. In Orang-utan biology. (Ed. J Schwartz) Oxford Univ. Press: New York and Oxford. pp. 311-330.
Usherwood JR, Larson SG and Bertram JEA. 2003. Mechanisms of force and power
production in unsteady ricochetal brachiation. Am J Phys Anthropol 120:364-372. Vereecke E, Aerts P. 2008. The mechanics of the gibbon foot and its potential for elastic
energy storage during bipedalism. J Exp Bio 211:3661-3670. Vereecke E, D’Aout K, De Clercq D, Van Elsacker L, Aerts P. 2003. Dynamic plantar
pressure distribution during terrestrial locomotion of bonobos (Pan paniscus). Am
J Phys Anthropol 120:373-383.

129
Vereecke E, D’Aout K, Van Elsacker L, De Clercq D, Aerts P. 2005. Functional analysis of the gibbon foot during terrestrial bipedal walking: Plantar pressure distributions and three-dimensional ground reaction forces. Am J Phys Anthropol 128:659-669.
Waarsing JH, Day JS, and Weinans H. 2005. Longitudinal micro-CT scans to evaluate
bone architecture. J Muscoskeletal Neuro Inter 5(4):310-312. Washburn SL. 1967. Behavior and the origin of man. Proc Royal Anthropological
Institute of Great Britain and Ireland 3:21–27. Washburn SL. 1968. Speculations on the problem of man’s coming to the ground. In
Changing Perspectives on Man. (Ed. B Rothblatt) Univ. of Chicago Press; Chicago. pp. 193–206.
Williams SA. 2010. Morphological integration and the evolution of knuckle-walking. J
Hum Evol. 58:432-440. Wunderlich RE. 1999. Pedal form and plantar pressure distribution in anthropoid
primates. Doctoral Dissertation, SUNY Stony Brook: New York. Wunderlich RE & Jungers WL. 1998. Force distribution on the digits during knuckle-
walking. Am J Phys Anthropol 26:236. Wunderlich RE and Jungers WL. 2009. Manual digital pressures during knuckle-walking
in chimpanzees (Pan troglodytes). Am J Phys Anthropol 139(3):394-403. Youlatos D. 2002. Positional behavior of black spider monkeys (Ateles paniscus) in
French Guiana. Int J Primatol 23(5):1071-1093. Zeininger A, Richmond BG, and Gideon H. 2011. Metacarpal head biomechanics : A
comparative backscattered electron image analysis of trabecular bone mineral density in Pan troglodytes, Pongo pygmaeus, and Homo sapiens. J Hum Evol 60:703-710.