Knowledge Deepening and Industrial Change in Malaysia Shahid Yusuf and Kaoru Nabeshima DRG February...
49
Knowledge Deepening and Industrial Change in Malaysia Shahid Yusuf and Kaoru Nabeshima DRG February 26, 2008
-
Upload
eustace-everett-leonard -
Category
Documents
-
view
240 -
download
0
Transcript of Knowledge Deepening and Industrial Change in Malaysia Shahid Yusuf and Kaoru Nabeshima DRG February...
Knowledge Deepening and Industrial Change in Malaysia
Shahid Yusuf and Kaoru Nabeshima
DRG
February 26, 2008
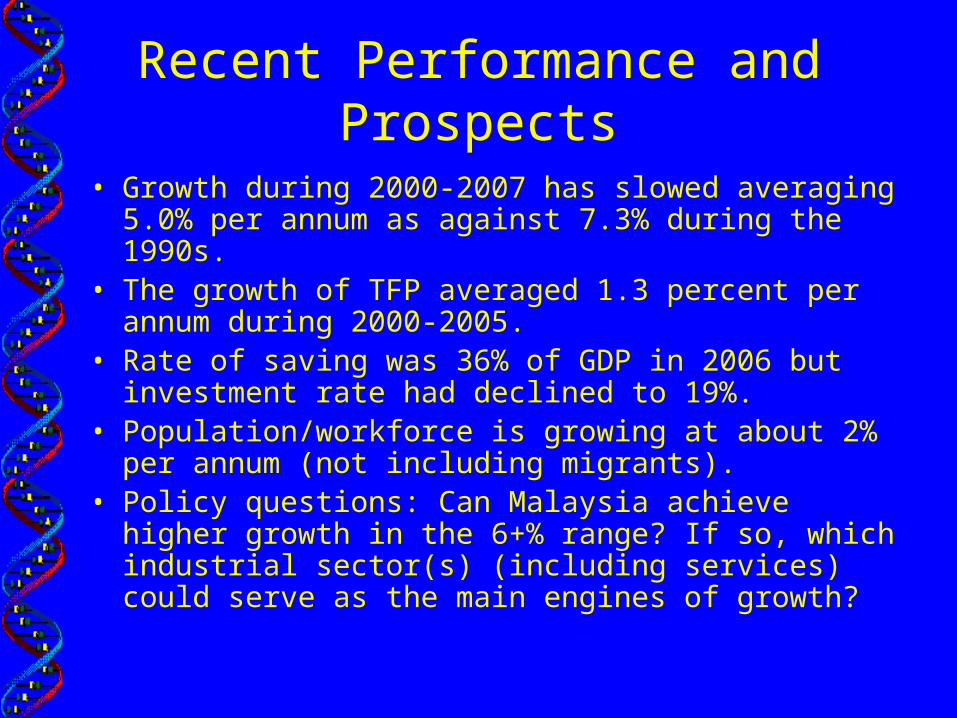
Recent Performance and Prospects
• Growth during 2000-2007 has slowed averaging 5.0% per annum as against 7.3% during the 1990s.
• The growth of TFP averaged 1.3 percent per annum during 2000-2005.
• Rate of saving was 36% of GDP in 2006 but investment rate had declined to 19%.
• Population/workforce is growing at about 2% per annum (not including migrants).
• Policy questions: Can Malaysia achieve higher growth in the 6+% range? If so, which industrial sector(s) (including services) could serve as the main engines of growth?
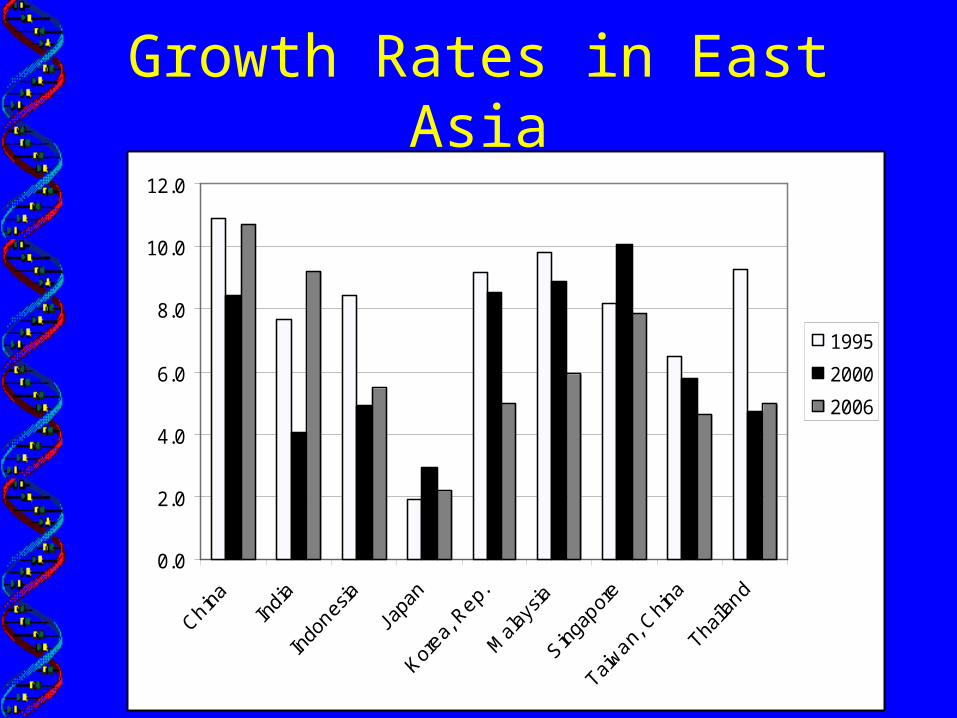
Growth Rates in East Asia
0.0
2.0
4.0
6.0
8.0
10.0
12.0
1995
2000
2006
Sources of Growth
• In early 1990s, investment was mainly responsible for growth.
• Since mid 1990s, the contribution of investment to growth declined considerably, the slack taken up by exports (latter half of 1990s) and by consumption (early 2000s).
• Growth of services has replaced manufacturing as the main source of growth since 2000.
Long-run GDP Growth: Historical Cross-Country Experience
• Using Maddison’s data, the long-run growth rate of per capita GDP in Malaysia is 4.0% since 1960 (2.9% if the series is extended back to 1911). Adding the population growth rate of 1%-2% could yield average aggregate future GDP growth rates of 5-6%.
“Catch-Up” Model
• A “catch-up” model in which developing countries’ growth rates are a function of the difference in income relative to the United States, predicts average growth rates for Malaysia ranging from 4.5% to 6.7% depending on the sample of countries included.
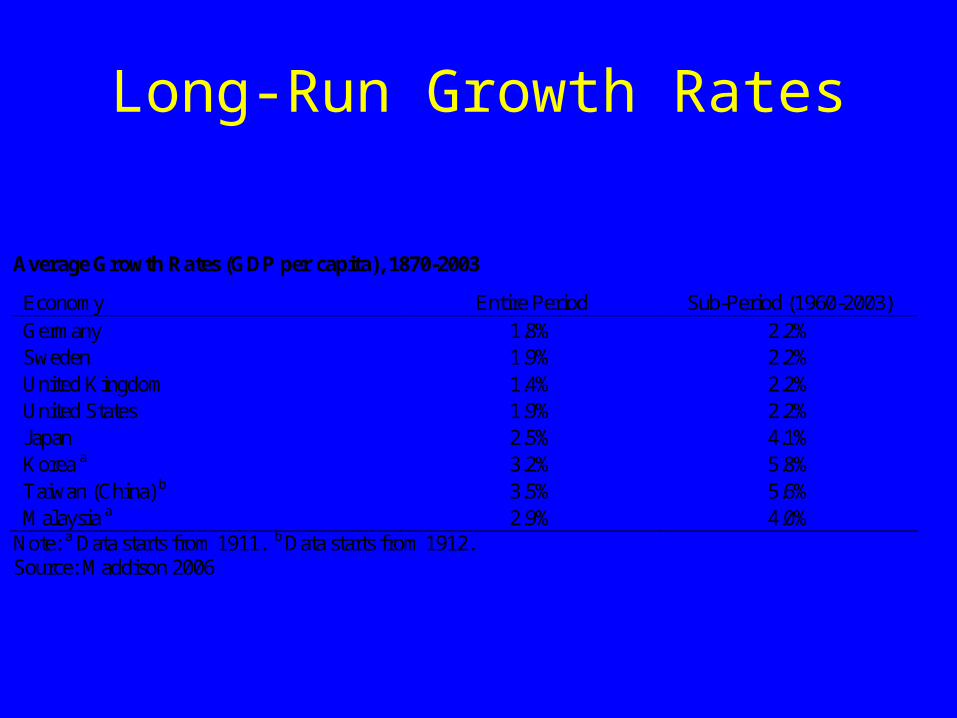
Long-Run Growth Rates
Average Growth Rates (GDP per capita), 1870-2003
Economy Entire Period Sub-Period (1960-2003) Germany 1.8% 2.2% Sweden 1.9% 2.2% United Kingdom 1.4% 2.2% United States 1.9% 2.2% Japan 2.5% 4.1% Korea a 3.2% 5.8% Taiwan (China) b 3.5% 5.6% Malaysia a 2.9% 4.0%
Note: a Data starts from 1911. b Data starts from 1912. Source: Maddison 2006

Potential and Long-Run Growth
• For Malaysia, 6% per annum seems to be an attainable growth rate.
• Faster growth can be achieved, but requires improvements in productivity, increased R&D and higher levels of investment by private sector which will promote embodied technical progress.
Is Malaysian Industry shifting towards higher tech, higher value adding
activities?
• Trends in Exports• Trends in Imports• Foreign Direct Investment• Domestic Investments• New Starts and Growth of Existing Firms• Industrial Location• Finance• Innovation Capabilities
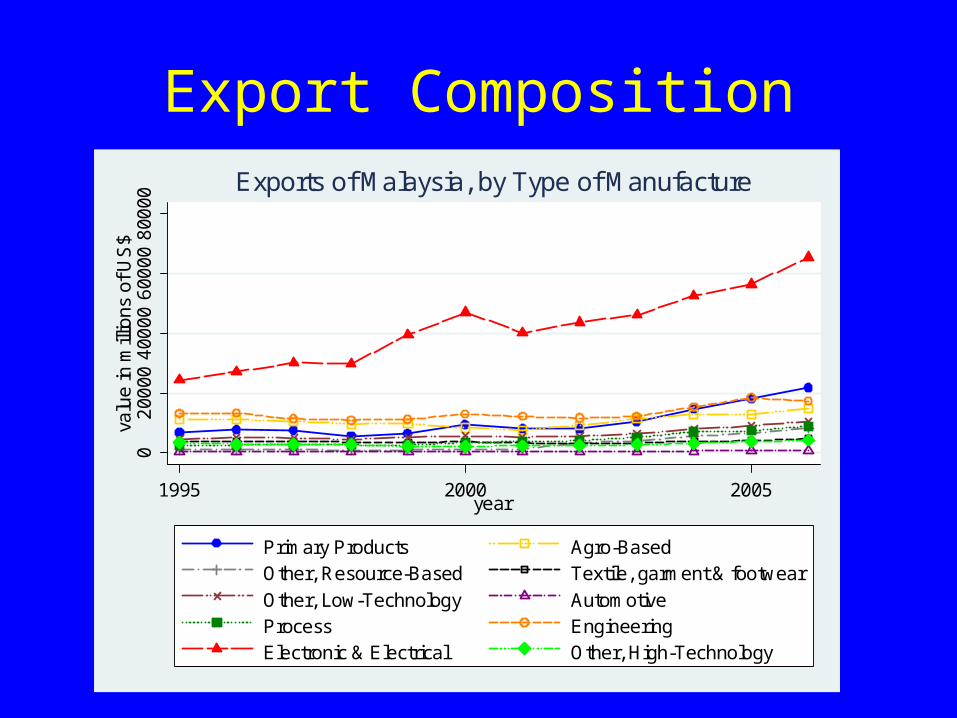
Export Composition0
200
004
0000
600
008
0000
valu
e in
mill
ions
of U
S$
1995 2000 2005year
Primary Products Agro-BasedOther, Resource-Based Textile, garment & footwear
Other, Low-Technology AutomotiveProcess EngineeringElectronic & Electrical Other, High-Technology
Exports of Malaysia, by Type of Manufacture
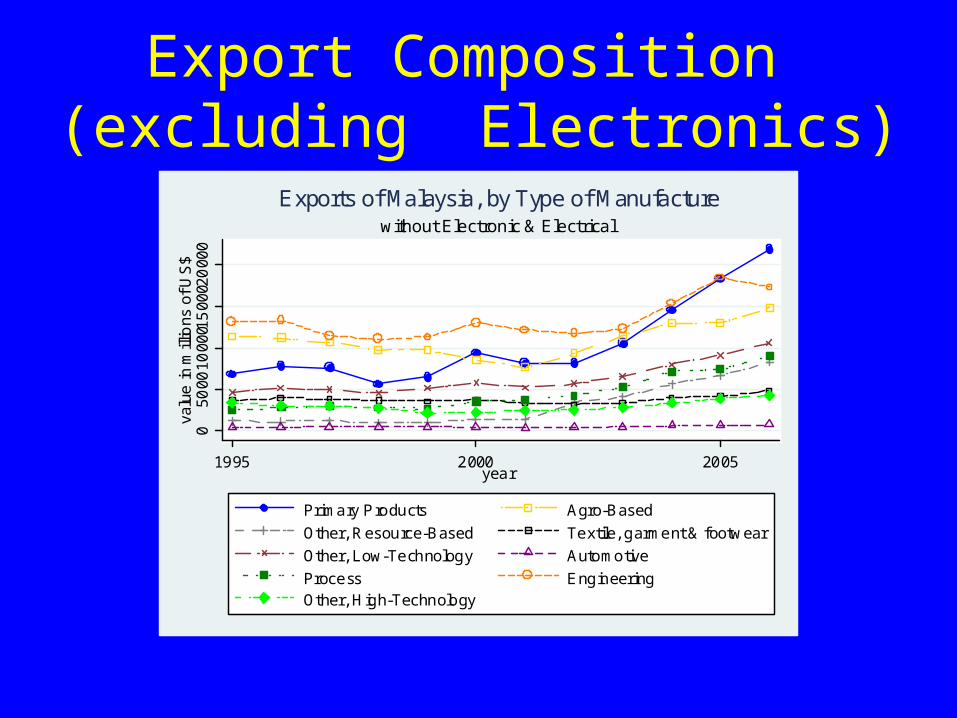
Export Composition (excluding Electronics)
050
0010
0001
500
020
000
valu
e in
mill
ions
of U
S$
1995 2000 2005year
Primary Products Agro-Based
Other, Resource-Based Textile, garment & footwear
Other, Low-Technology Automotive
Process EngineeringOther, High-Technology
without Electronic & Electrical
Exports of Malaysia, by Type of Manufacture
Revealed Comparative Advantage
• Malaysia’s strength is in medium-tech resource-based products .
• By comparison, products with highest RCA for Korea shifted from resource-based products in 1995 to medium-tech products including ships, chemicals and electronic products in 2005.
• The highest RCA for Singapore is more solidly in high-tech electronic products and chemical compounds .
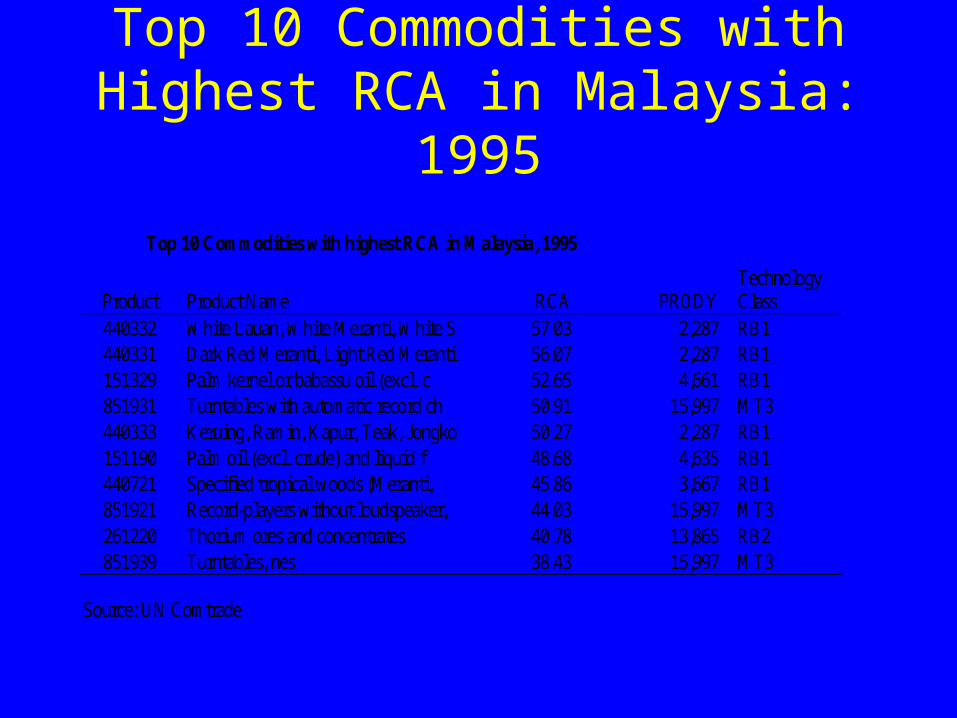
Top 10 Commodities with Highest RCA in Malaysia: 1995
Top 10 Commodities with highest RCA in Malaysia, 1995
Product Product Name RCA PRODY Technology Class
440332 White Lauan, White Meranti, White S 57.03 2,287 RB1 440331 Dark Red Meranti, Light Red Meranti 56.07 2,287 RB1 151329 Palm kernel or babassu oil (excl. c 52.65 4,661 RB1 851931 Turntables with automatic record ch 50.91 15,997 MT3 440333 Keruing, Ramin, Kapur, Teak, Jongko 50.27 2,287 RB1 151190 Palm oil (excl. crude) and liquid f 48.68 4,635 RB1 440721 Specified tropical woods (Meranti, 45.86 3,667 RB1 851921 Record-players without loudspeaker, 44.03 15,997 MT3 261220 Thorium ores and concentrates 40.78 13,865 RB2 851939 Turntables, nes 38.43 15,997 MT3
Source: UN Comtrade

Top 10 Commodities with Highest RCA in Malaysia: 2005
Top 10 Commodities with highest RCA in Malaysia, 2005
Product Product Name RCA PRODY Technology Class
440331 Dark Red Meranti, Light Red Meranti 63.5 2,287 RB1 851931 Turntables with automatic record ch 55.9 15,997 MT3 440721 Specified tropical woods (Meranti, 52.5 3,667 RB1 900620 Cameras of a kind used for recordin 51.6 4,723 HT2 851991 Sound reproducing apparatus,cassett 41.6 15,330 MT3 151329 Palm kernel or babassu oil (excl. c 40.9 4,661 RB1 261220 Thorium ores and concentrates 40.7 13,865 RB2 151190 Palm oil (excl. crude) and liquid f 36.5 4,635 RB1 240290 Cigars, cigarillos, cigarettes, etc 33.5 12,204 RB1 401519 Gloves of vulcanized rubber (excl. 32.1 8,173 LT1
Source: UN Comtrade
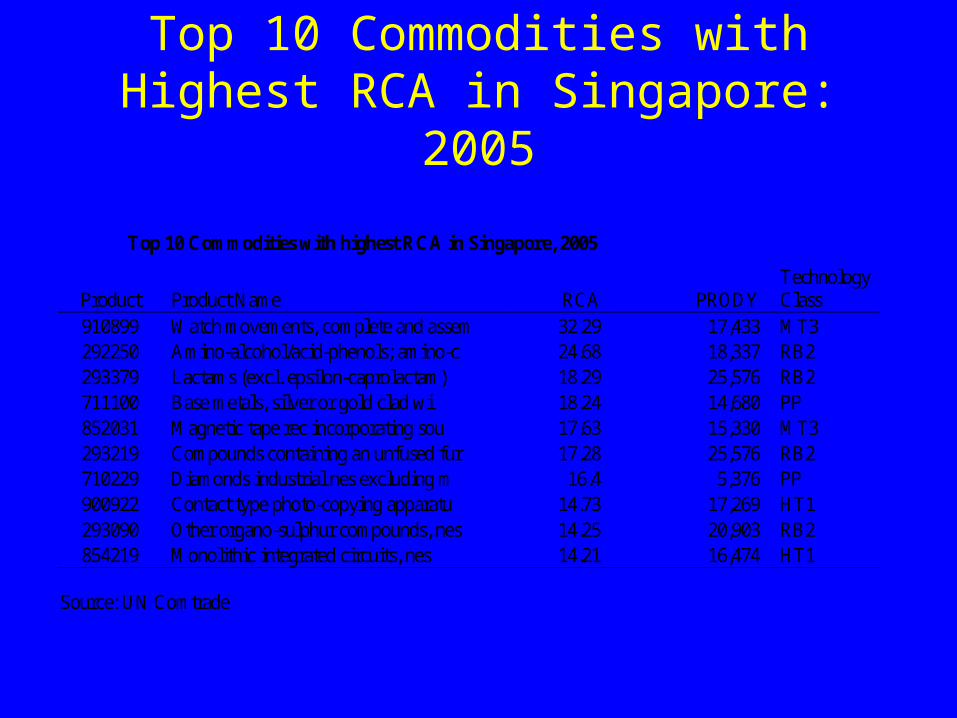
Top 10 Commodities with Highest RCA in Singapore: 2005
Top 10 Commodities with highest RCA in Singapore, 2005
Product Product Name RCA PRODY Technology Class
910899 Watch movements, complete and assem 32.29 17,433 MT3 292250 Amino-alcohol/acid-phenols; amino-c 24.68 18,337 RB2 293379 Lactams (excl. epsilon-caprolactam) 18.29 25,576 RB2 711100 Base metals, silver or gold clad wi 18.24 14,680 PP 852031 Magnetic tape rec incorporating sou 17.63 15,330 MT3 293219 Compounds containing an unfused fur 17.28 25,576 RB2 710229 Diamonds industrial nes excluding m 16.4 5,376 PP 900922 Contact type photo-copying apparatu 14.73 17,269 HT1 293090 Other organo-sulphur compounds, nes 14.25 20,903 RB2 854219 Monolithic integrated circuits, nes 14.21 16,474 HT1
Source: UN Comtrade

Top 10 Commodities with Highest RCA in Korea: 2005
Top 10 Commodities with highest RCA in Korea, 2005
Product Product Name RCA PRODY Technology Class 854030 Cathode-ray tubes, nes 17.26 17,667 HT1 890120 Tankers 15.58 14,263 MT3 890590 Floating docks and vessels which pe 13.99 10,562 MT3 845020 Household or laundry-type washing m 13.75 15,565 MT3 401310 Inner tubes, of rubber of a kind us 13.46 10,500 RB1 901390 Parts and accessories of optical ap 12.64 20,604 HT2 480990 Copying or transfer papers, nes, in 12.63 22,143 RB1 283719 Cyanides, cyanide oxides (excl. sod 12.37 9,141 RB2 590220 Tyre cord fabric of high tenacity y 11.92 16,731 LT1 721913 Flat rlld prod, stainless steel, hr 11.35 10,086 MT2
Source: UN Comtrade
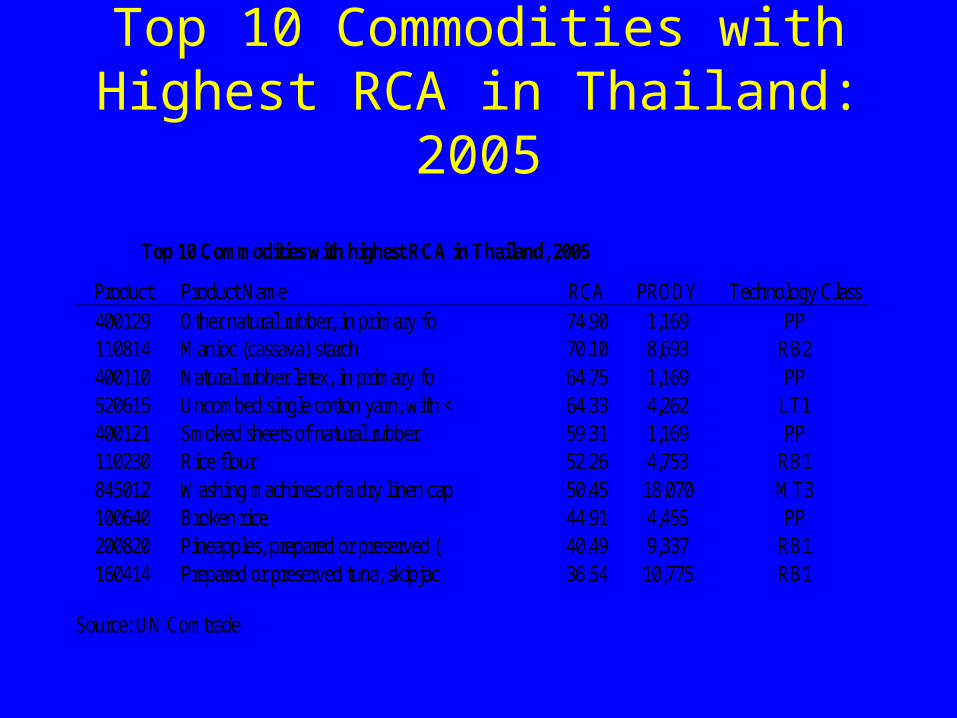
Top 10 Commodities with Highest RCA in Thailand: 2005
Top 10 Commodities with highest RCA in Thailand, 2005
Product Product Name RCA PRODY Technology Class 400129 Other natural rubber, in primary fo 74.90 1,169 PP 110814 Manioc (cassava) starch 70.10 8,693 RB2 400110 Natural rubber latex, in primary fo 64.75 1,169 PP 520615 Uncombed single cotton yarn, with < 64.33 4,262 LT1 400121 Smoked sheets of natural rubber 59.31 1,169 PP 110230 Rice flour 52.26 4,753 RB1 845012 Washing machines of a dry linen cap 50.45 18,070 MT3 100640 Broken rice 44.91 4,455 PP 200820 Pineapples, prepared or preserved ( 40.49 9,337 RB1 160414 Prepared or preserved tuna, skipjac 36.54 10,775 RB1
Source: UN Comtrade

Export Competition with Neighboring Economies
• Increasing concentration on electronics and rapidly intensifying competition from China (whose own production and trade in electronics has risen dramatically) is evident from the table below:
Share of Overlapping Trade Values
Country 1995 2000 2005
Japan 51.4% 68.3% 55.5% Thailand 28.1% 33.6% 34.0% Taiwan (China) - 52.6% 49.2% Korea 36.3% 49.1% 49.7% China 38.3% 61.2% 60.9% India 6.8% 7.3% 14.4% Indonesia 21.3% 26.0% 29.5% Singapore 55.7% 58.3% 54.9%
Source: UN COMTRADE
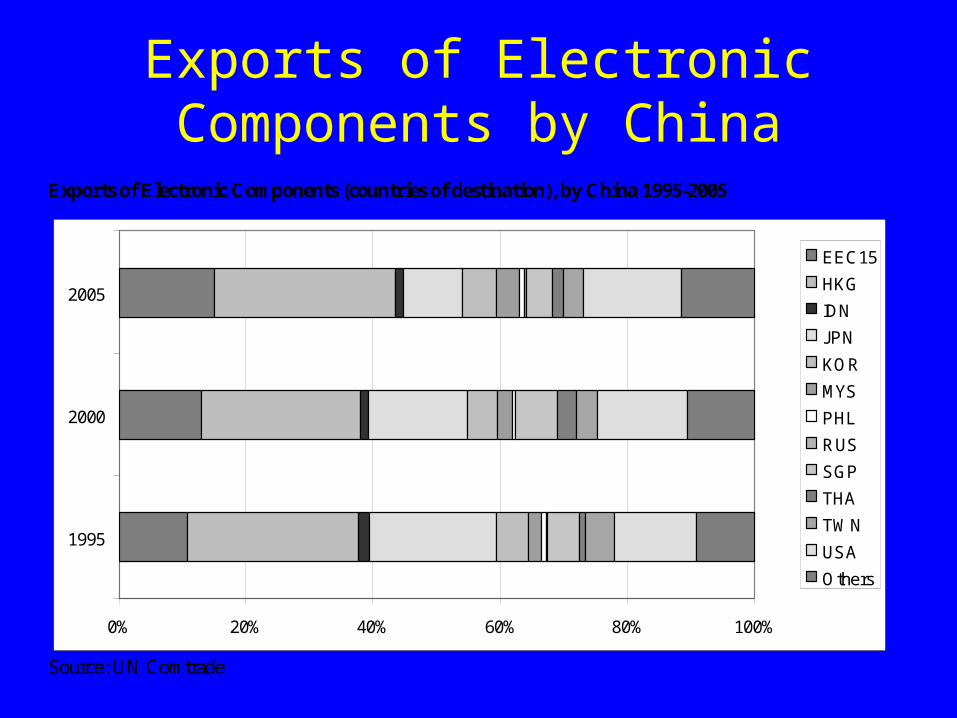
Exports of Electronic Components by China
Exports of Electronic Components (countries of destination), by China 1995-2005
0% 20% 40% 60% 80% 100%
1995
2000
2005
EEC15
HKG
IDN
JPN
KOR
MYS
PHL
RUS
SGP
THA
TWN
USA
Others
Source: UN Comtrade
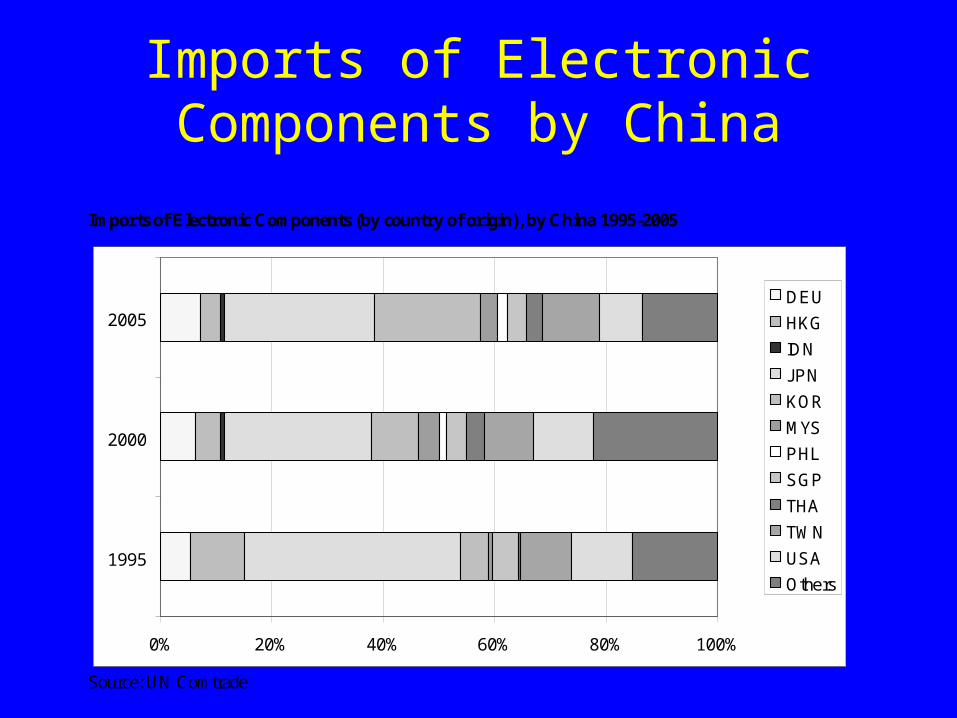
Imports of Electronic Components by China
Imports of Electronic Components (by country of origin), by China 1995-2005
0% 20% 40% 60% 80% 100%
1995
2000
2005DEU
HKG
IDN
JPN
KOR
MYS
PHL
SGP
THA
TWN
USA
Others
Source: UN Comtrade
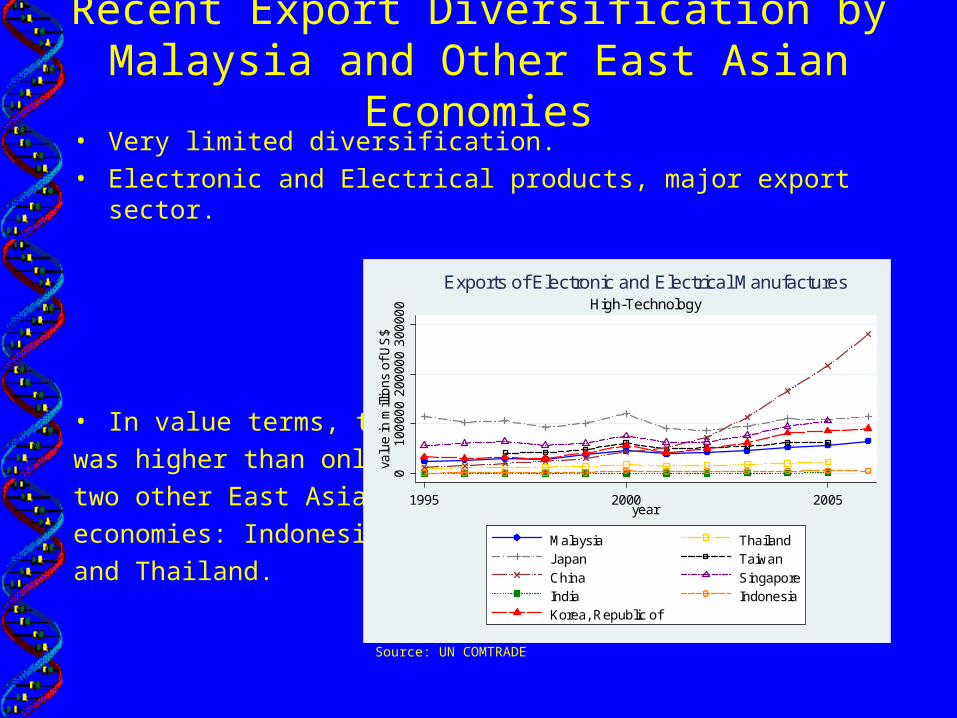
Recent Export Diversification by Malaysia and Other East Asian Economies
• Very limited diversification.• Electronic and Electrical products, major export sector.
• In value terms, this
was higher than only
two other East Asian
economies: Indonesia
and Thailand.
01
0000
02
0000
03
0000
0va
lue
in m
illio
ns o
f US
$
1995 2000 2005year
Malaysia ThailandJapan Taiwan
China SingaporeIndia IndonesiaKorea, Republic of
High-TechnologyExports of Electronic and Electrical Manufactures
Source: UN COMTRADE
New Exports
• Malaysia had 132 commodities that it started to export in any year after 1995 (beginning year for this study) and continued to export positive amounts till 2006.
• Indonesia and India on the other hand, had 309 and 219 “new” products in their export markets.

New Exports of Malaysia (Top 10 by Trade Value)
Product Year Discovered Product Name Trade Value 2006 271000 2002 Petroleum oils, etc, (excl. crude); 5233042545 271119 1996 Petroleum gases and other gaseous h 266536600 440722 1997 Specified tropical woods (OKoume... 206958080 290220 1997 Benzene 141035612 291736 1996 Terephthalic acid and its salts 130830762 271600 2000 Electrical energy 122121205 271114 1998 Ethylene, propylene, butylene and b 90471723 290250 1996 Styrene 46615116 370242 1998 Film, in rolls, non-perforated, wid 42007278 283324 1997 Sulphates of nickel 29066139
Source: UN Comtrade
Fastest Growing New Exports from Malaysia
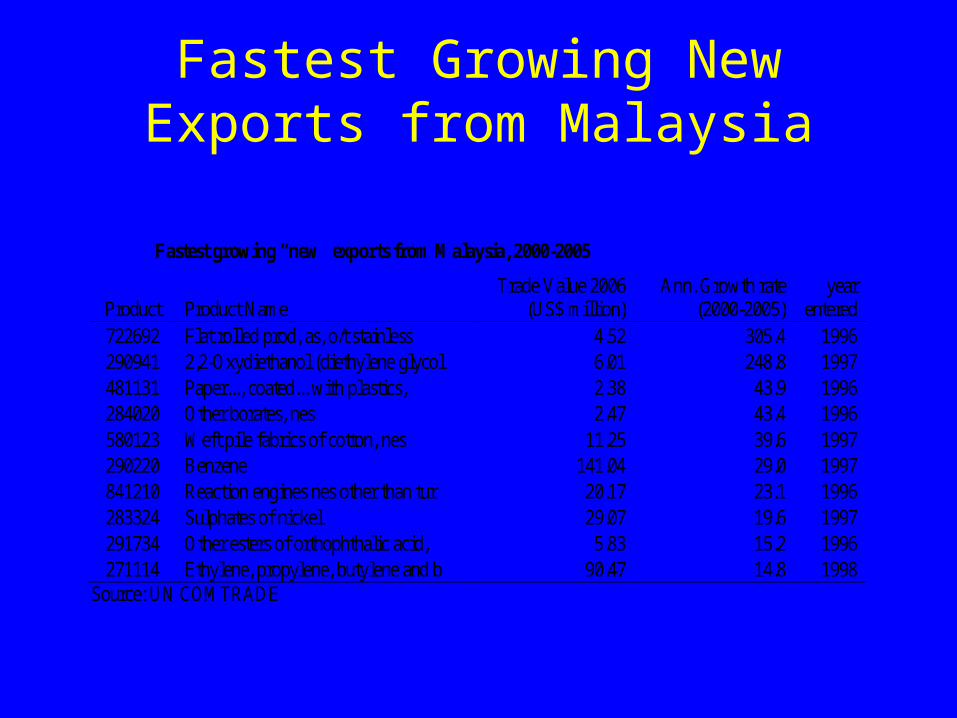
Fastest growing “new” exports from Malaysia, 2000-2005
Product Product Name Trade Value 2006
(US$ million) Ann. Growth rate
(2000-2005) year
entered 722692 Flat rolled prod, as, o/t stainless 4.52 305.4 1996 290941 2,2-Oxydiethanol (diethylene glycol 6.01 248.8 1997 481131 Paper..., coated... with plastics, 2.38 43.9 1996 284020 Other borates, nes 2.47 43.4 1996 580123 Weft pile fabrics of cotton, nes 11.25 39.6 1997 290220 Benzene 141.04 29.0 1997 841210 Reaction engines nes other than tur 20.17 23.1 1996 283324 Sulphates of nickel 29.07 19.6 1997 291734 Other esters of orthophthalic acid, 5.83 15.2 1996 271114 Ethylene, propylene, butylene and b 90.47 14.8 1998
Source: UN COMTRADE
New Electronics Exports from Indonesia, India, and Malaysia
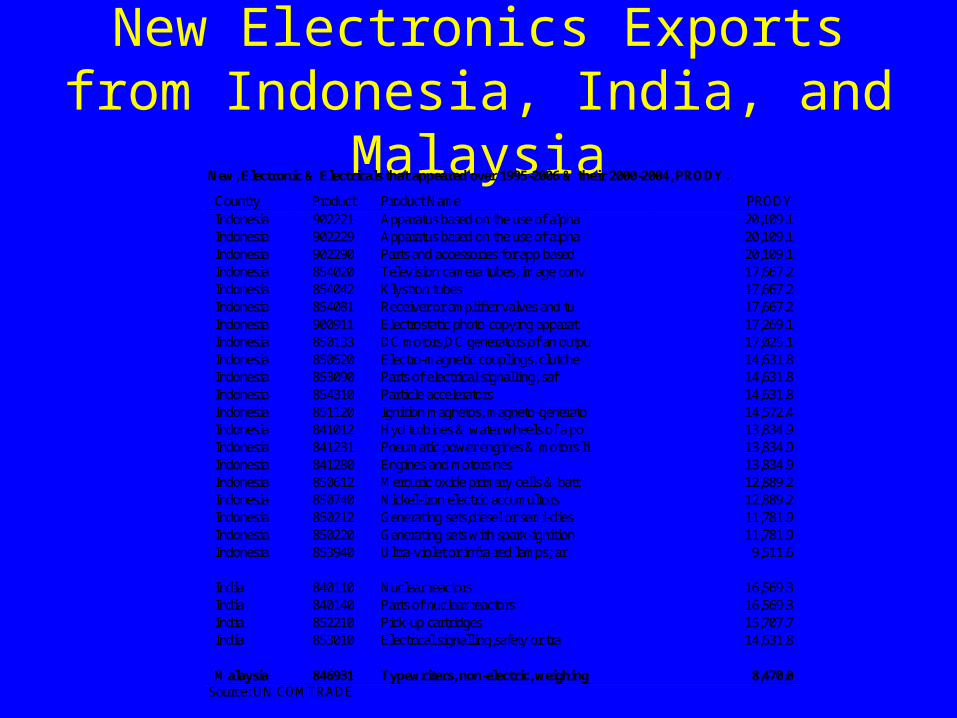
New, Electronic & Electricals that appeared over 1995-2006 & their 2000-2004, PRODY.
Country Product Product Name PRODY Indonesia 902221 Apparatus based on the use of alpha 20,109.1 Indonesia 902229 Apparatus based on the use of alpha 20,109.1 Indonesia 902290 Parts and accessories for app based 20,109.1 Indonesia 854020 Television camera tubes, image conv 17,667.2 Indonesia 854042 Klystron tubes 17,667.2 Indonesia 854081 Receiver or amplifier valves and tu 17,667.2 Indonesia 900911 Electrostatic photo-copying apparat 17,269.1 Indonesia 850133 DC motors,DC generators,of an outpu 17,025.1 Indonesia 850520 Electro-magnetic couplings, clutche 14,631.8 Indonesia 853090 Parts of electrical signalling, saf 14,631.8 Indonesia 854310 Particle accelerators 14,631.8 Indonesia 851120 Ignition magnetos, magneto-generato 14,572.4 Indonesia 841012 Hyd turbines & water wheels of a po 13,834.9 Indonesia 841231 Pneumatic power engines & motors li 13,834.9 Indonesia 841280 Engines and motors nes 13,834.9 Indonesia 850612 Mercuric oxide primary cells & batt 12,889.2 Indonesia 850740 Nickel-iron electric accumultors 12,889.2 Indonesia 850212 Generating sets,diesel or semi-dies 11,781.9 Indonesia 850220 Generating sets with spark-ignition 11,781.9 Indonesia 853940 Ultra-violet or infra-red lamps; ar 9,511.6 India 840110 Nuclear reactors 16,569.3 India 840140 Parts of nuclear reactors 16,569.3 India 852210 Pick-up cartridges 15,707.7 India 853010 Electrical signalling,safety or tra 14,631.8 Malaysia 846931 Typewriters, non-electric, weighing 8,470.0
Source: UN COMTRADE
Scope for Export Diversification
• “Product space” identifies whether future export diversification is “easier” for a country.
• X-axis measures the distance to new export opportunities. Closer to the origin, “easier” it is to start exporting this commodity.
• Y-axis measures the difference in PRODY of a commodity and the average PRODY of the current export basket. Positive number means moving up the value chain.
• China has more opportunities for upgrading into higher value-added items than Malaysia.

Product Space: Malaysia
-100
00
010
00
020
00
0
0 5 10
MYS
Electronics and Electricals Other, High-TechnologyAutomotive Process
Engineering Textile, garment & footwear
Other, Low-Technology Agro-Based
Other, Resource-Based Primary Products
invdensity
Graphs by country
Source: Authors’ calculations
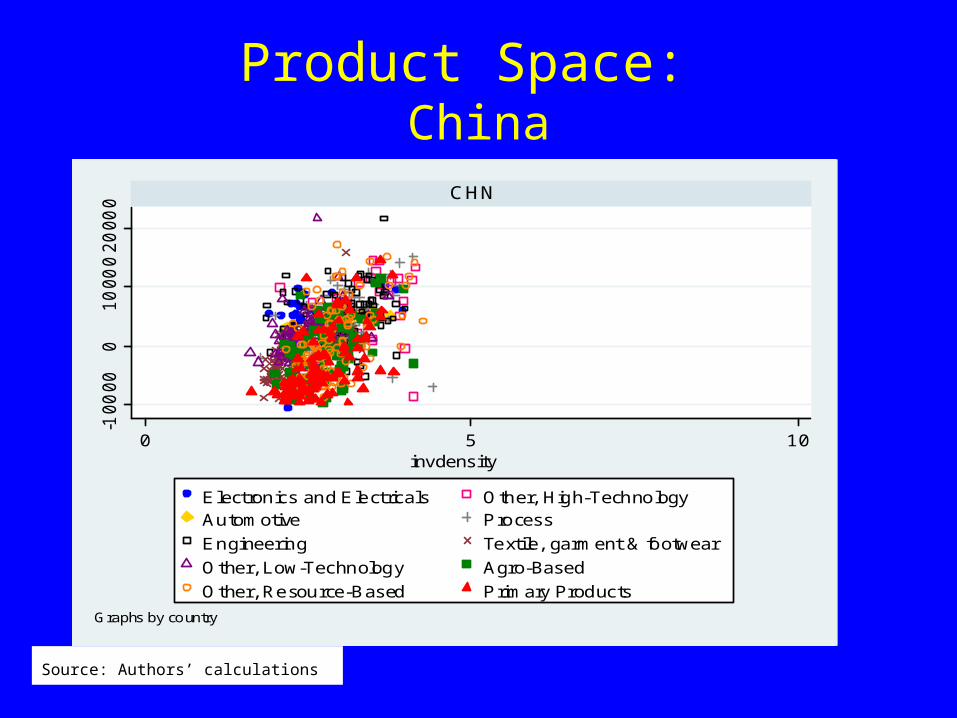
Product Space: China
-100
00
010
00
020
00
0
0 5 10
CHN
Electronics and Electricals Other, High-TechnologyAutomotive Process
Engineering Textile, garment & footwear
Other, Low-Technology Agro-Based
Other, Resource-Based Primary Products
invdensity
Graphs by country
Source: Authors’ calculations

Product Space:Thailand
-100
00
010
00
020
00
0
0 5 10
THA
Electronics and Electricals Other, High-TechnologyAutomotive Process
Engineering Textile, garment & footwear
Other, Low-Technology Agro-Based
Other, Resource-Based Primary Products
invdensity
Graphs by country
Source: Authors’ calculations
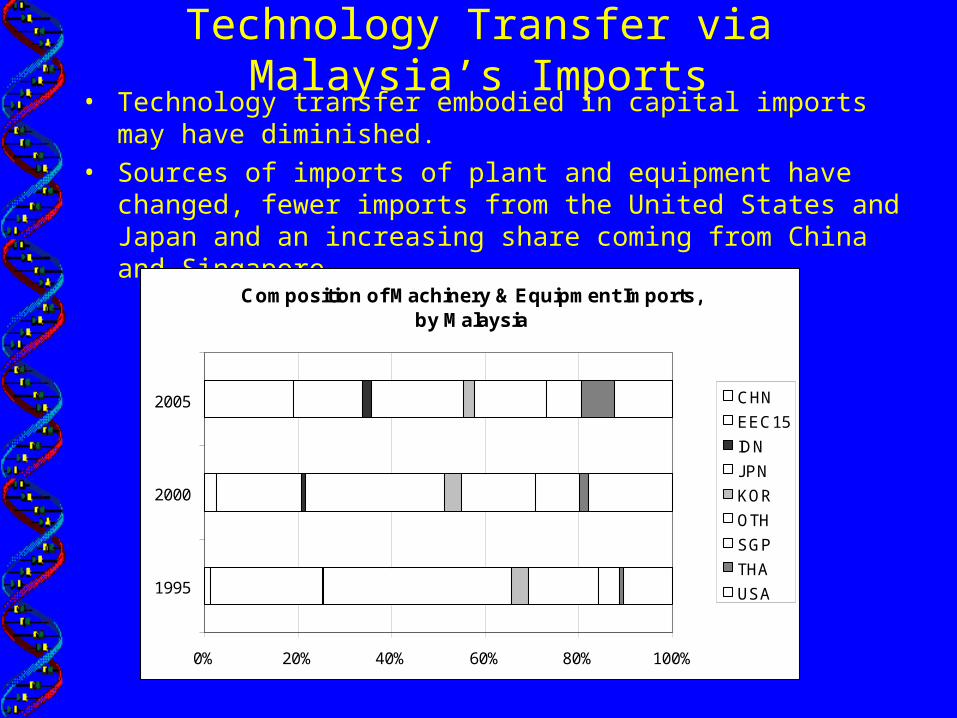
Technology Transfer via Malaysia’s Imports• Technology transfer embodied in capital imports may have
diminished.• Sources of imports of plant and equipment have changed, fewer
imports from the United States and Japan and an increasing share coming from China and Singapore.
Composition of Machinery & Equipment Imports, by Malaysia
0% 20% 40% 60% 80% 100%
1995
2000
2005 CHN
EEC15
IDN
JPN
KOR
OTH
SGP
THA
USA
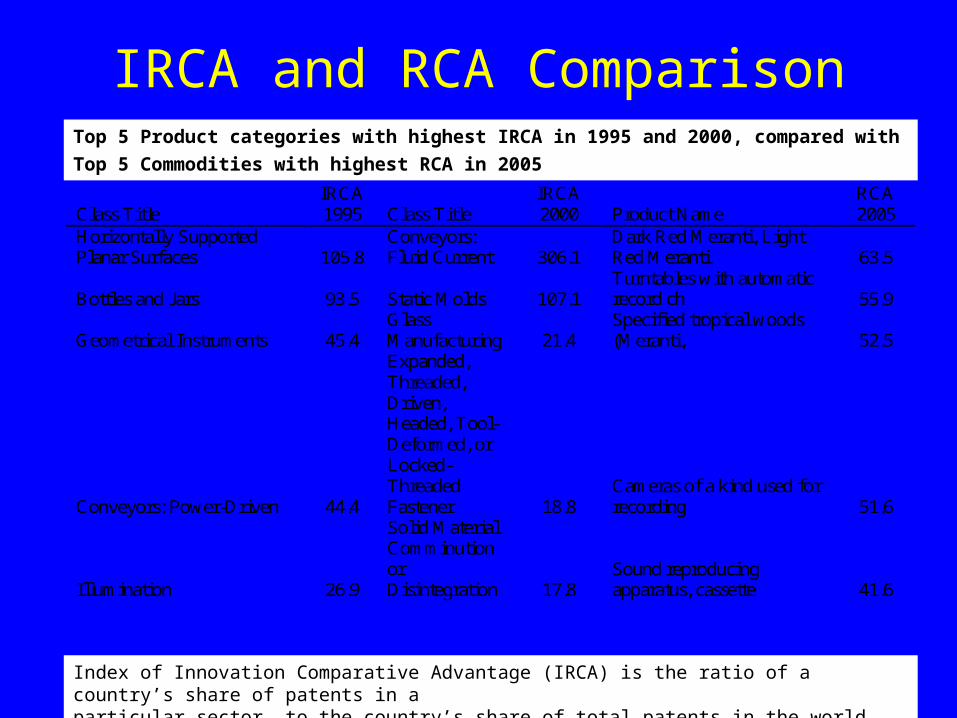
IRCA and RCA Comparison
Class Title IRCA 1995 Class Title
IRCA 2000 Product Name
RCA 2005
Horizontally Supported Planar Surfaces 105.8
Conveyors: Fluid Current 306.1
Dark Red Meranti, Light Red Meranti 63.5
Bottles and Jars 93.5 Static Molds 107.1 Turntables with automatic record ch 55.9
Geometrical Instruments 45.4 Glass Manufacturing 21.4
Specified tropical woods (Meranti, 52.5
Conveyors: Power-Driven 44.4
Expanded, Threaded, Driven, Headed, Tool-Deformed, or Locked-Threaded Fastener 18.8
Cameras of a kind used for recording 51.6
Illumination 26.9
Solid Material Comminution or Disintegration 17.8
Sound reproducing apparatus, cassette 41.6
Top 5 Product categories with highest IRCA in 1995 and 2000, compared with Top 5
Commodities with highest RCA in 2005
Index of Innovation Comparative Advantage (IRCA) is the ratio of a country’s share of patents in a particular sector, to the country’s share of total patents in the world.
Foreign Direct Investment
• Overall FDI inflow peaked in 2000.
• Electronic components and telecommunication equipment receive the lion’s share of FDI.
• Other sectors receive FDI in bursts. But no apparent trends pointing to sustained diversification.

Sectoral Flow of FDI0
100
02
000
1999 2000 2001 2002 2003year
Basic Metals Chems & Chems PrdtsCoke, Ref. Petro. Prdts & Nucl. Elec. Machinery & App.Fabri. Met. Prdts, Excpt Mach. & Equip. Food Prdts & Bev.s
Radio, Tele. & Comm. Equip. & App. Oth. Transport Equip.Paper & Paper Prdts Oth. Non-Metallic Mineral PrdtsRubber & Plastics Prdts Others
value in millions of US$Top 12 FDI sectors in Malaysia
New Starts and Growth of Firms
• New firm formation is most active in Kuala Lumpur/Klang Valley with 1,123 firms, followed by Johor, Penang, and Malacca.
• Main industries favored : publishing and printing, food manufacturing, plastics, and apparel. New starts in electronics and machinery most often seen in Penang.
New Entry of Firms in Kuala Lumpur
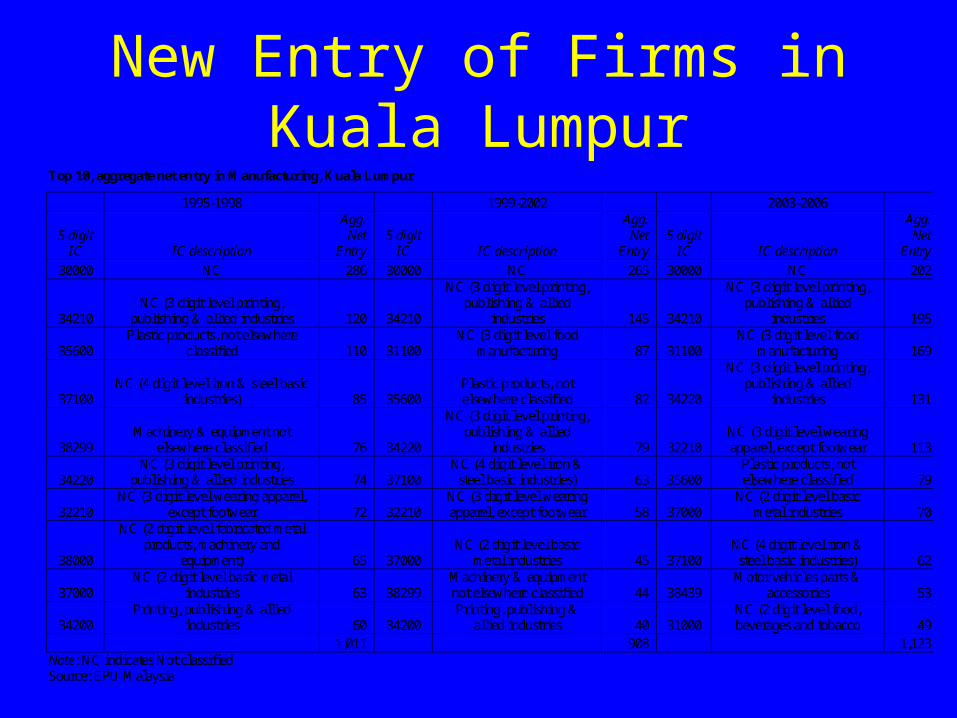
Top 10, aggregate net entry in Manufacturing, Kuala Lumpur
1995-1998 1999-2002 2003-2006
5 digit IC IC description
Agg. Net
Entry 5 digit
IC IC description
Agg. Net
Entry 5 digit
IC IC description
Agg. Net
Entry
30000 NC 286 30000 NC 265 30000 NC 202
34210 NC (3 digit level printing,
publishing & allied industries 120 34210
NC (3 digit level printing, publishing & allied
industries 145 34210
NC (3 digit level printing, publishing & allied
industries 195
35600 Plastic products, not elsewhere
classified 110 31100 NC (3 digit level food
manufacturing 87 31100 NC (3 digit level food
manufacturing 169
37100 NC (4 digit level iron & steel basic
industries) 85 35600 Plastic products, not elsewhere classified 82 34220
NC (3 digit level printing, publishing & allied
industries 131
38299 Machinery & equipment not
elsewhere classified 76 34220
NC (3 digit level printing, publishing & allied
industries 79 32210 NC (3 digit level wearing apparel, except footwear 113
34220 NC (3 digit level printing,
publishing & allied industries 74 37100 NC (4 digit level iron &
steel basic industries) 63 35600 Plastic products, not elsewhere classified 79
32210 NC (3 digit level wearing apparel,
except footwear 72 32210 NC (3 digit level wearing apparel, except footwear 58 37000
NC (2 digit level basic metal industries 70
38000
NC (2 digit level fabricated metal products, machinery and
equipment) 65 37000 NC (2 digit level basic
metal industries 45 37100 NC (4 digit level iron &
steel basic industries) 62
37000 NC (2 digit level basic metal
industries 63 38299 Machinery & equipment not elsewhere classified 44 38439
Motor vehicles parts & accessories 53
34200 Printing, publishing & allied
industries 60 34200 Printing, publishing &
allied industries 40 31000 NC (2 digit level food, beverages and tobacco 49
1,011 908 1,123 Note: NC indicates Not classified Source: EPU Malaysia

Exploiting Urban Agglomeration Economies
• Kuala Lumpur is the principal urban center in Malaysia, judging by the population, economic size, and growth, followed by Johor, Penang, and Malacca.
• FDI is highest in Johor because of its proximity to Singapore, followed by Penang.
• From the perspective of the knowledge economy, Kuala Lumpur has the edge in terms of size, the diversity of services it offers, the presence of research institutions, the headquarters of firms, and the quality of the IT infrastructure.
GDP of Four Cities in Malaysia
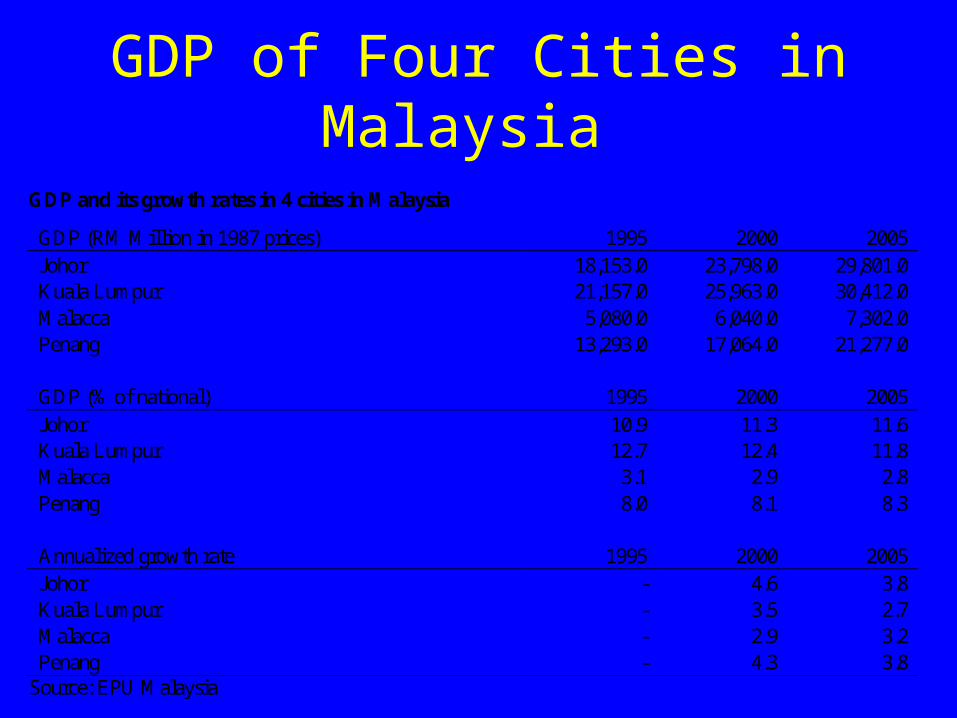
GDP and its growth rates in 4 cities in Malaysia
GDP (RM Million in 1987 prices) 1995 2000 2005 Johor 18,153.0 23,798.0 29,801.0 Kuala Lumpur 21,157.0 25,963.0 30,412.0 Malacca 5,080.0 6,040.0 7,302.0 Penang 13,293.0 17,064.0 21,277.0 GDP (% of national) 1995 2000 2005 Johor 10.9 11.3 11.6 Kuala Lumpur 12.7 12.4 11.8 Malacca 3.1 2.9 2.8 Penang 8.0 8.1 8.3 Annualized growth rate 1995 2000 2005 Johor - 4.6 3.8 Kuala Lumpur - 3.5 2.7 Malacca - 2.9 3.2 Penang - 4.3 3.8
Source: EPU Malaysia
Knowledge Economy Potential
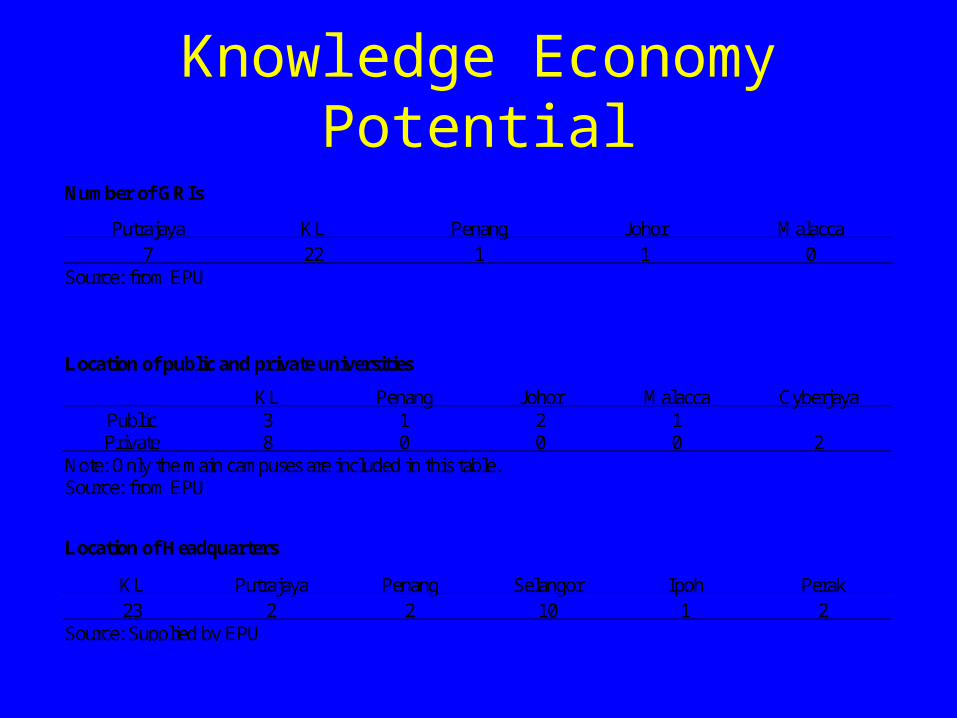
Number of GRIs
Putrajaya KL Penang Johor Malacca 7 22 1 1 0
Source: from EPU
Location of public and private universities
KL Penang Johor Malacca Cyberjaya Public 3 1 2 1 Private 8 0 0 0 2
Note: Only the main campuses are included in this table. Source: from EPU
Location of Headquarters
KL Putrajaya Penang Selangor Ipoh Perak 23 2 2 10 1 2
Source: Supplied by EPU
Logistics Capabilities
• Kuala Lumpur/Port Klang leads followed by IDR/Tanjung Pelepas/Senai Airport with Penang in third place.
• Port Klang has lowest logistics costs to Chennai, Dubai, and Munich, relative to Singapore, Hong Kong, and Shanghai.
• However, Kuala Lumpur/Port Klang trails far behind other logistics hub in the region with respect to Internet connectivity, air transport (passenger and freight), and container shipping capacity.
• In terms of network connectivity, Tokyo, Hong Kong, and Singapore lead with Malaysia ranked 18th, making it a regional node.
Availability of Capital
• Malaysian firms do not have undue difficulties accessing credit.
• Risk capital is relatively abundant (US$900 million, 3% of total investment). Providers are mainly public bodies (41%).
• The number of deals peaked in 2000 at 20. For seed and start-up stage, the peak was only 5 deals in 2000 and 2001.
• Demand more a constraint than supply and technology focused VCs have few attractive deals to fund.

Availability of Credit0
50
100
150
200
250
% o
f GD
P
1995 2000 2005year
Malaysia ThailandJapan Taiwan
China SingaporeIndia IndonesiaKorea, Republic of
Domestic credit to private sector
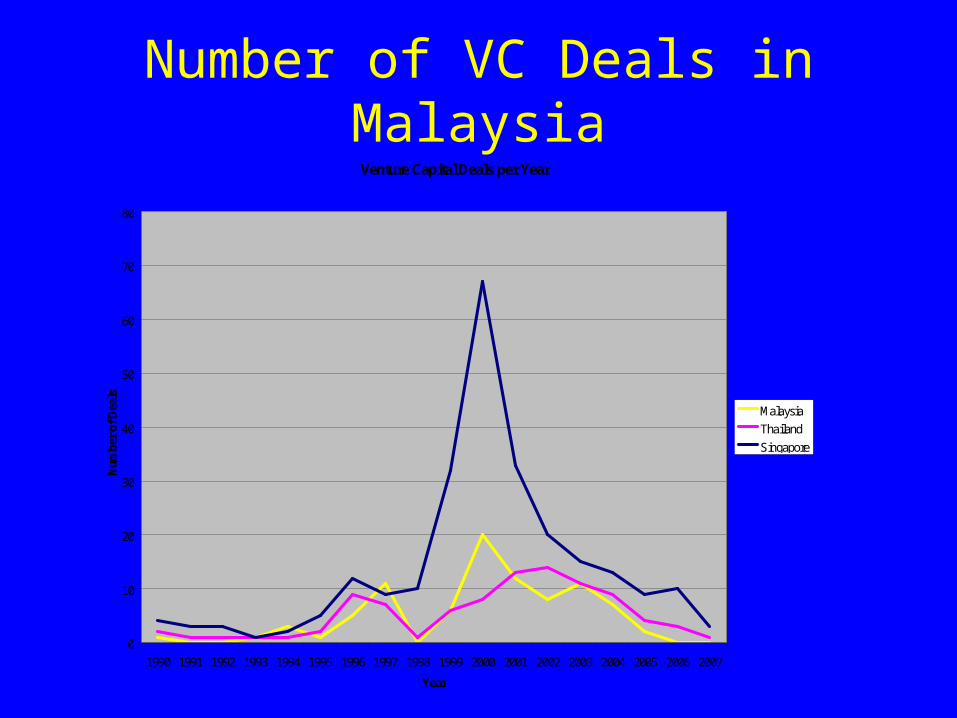
Number of VC Deals in Malaysia
Venture Capital Deals per Year
0
10
20
30
40
50
60
70
80
1990 1991 1992 1993 1994 1995 1996 1997 1998 1999 2000 2001 2002 2003 2004 2005 2006 2007
Year
Num
ber
of D
eals
Malaysia
Thailand
Singapore
Innovation Capabilities• Innovation capability in Malaysia is weak.
– Low R&D spending (0.71% of GDP) among East Asian economies, even accounting for the level of development.
– Number of people engaged in research was small (12,800 in 2004), even after accounting for population size and per capita GDP.
– Sectors of focus by private firms (auto and electronics), GRIs (agro-based and metallurgy), and universities (biochemistry and engineering) are all different.
– Domestic patent grants dominated by foreign residents (98%).– USPTO patents: 131 in 2006, bulk of them assigned to foreign
affiliates.– Licensing and royalty fees: 1% of GDP in 2006, compared to 7% in
Singapore and 10% in Ireland.– Quality of education is middling and there is no improving trend.– IT capabilities lag those of Singapore, Korea, and Japan (e.g.
international bandwidth is 3Gbps).
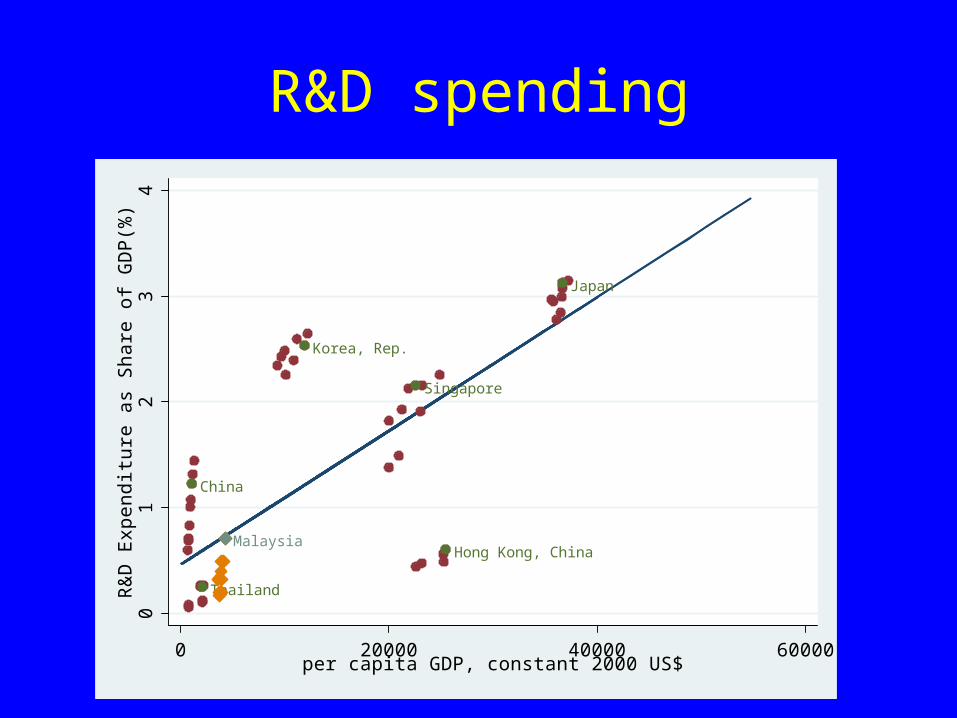
R&D spending
China
Hong Kong, China
Japan
Korea, Rep.
Singapore
Thailand
Malaysia
01
23
4R
&D
Exp
endi
ture
as
Sha
re o
f GD
P(%
)
0 20000 40000 60000per capita GDP, constant 2000 US$

Research in GRIs and UniversitiesTop 10 Fields of Emphasis by GRIs, 2004
Description R&D (million ringgit) Share of Total
Crop Production 23.7 8.0% Pest and Disease Management 23.2 7.8% ICT Applications 18.2 6.1% Agricultural Engineering 15.1 5.1% Civil Engineering 12.4 4.2% Horticulture 10.9 3.7% Radiation Chemistry 10.5 3.5% Environmental Management and Bioremediation 9.3 3.1% Resource-Based Technology 8.0 2.7% Communication 7.4 2.5%
Top 10 Fields of Emphasis by Universities, 2004
Description R&D Spending
(million Ringgit) Share Biochemistry 37.1 7.2% Manufacturing and Production Engineering 29.7 5.8% Communication 18.4 3.6% Education 16.5 3.2% Energy Technology 13.9 2.7% Mechanical Engineering 13.7 2.7% Automotive Engineering 12.2 2.4% Information Systems 11.6 2.3% Process Technology and Engineering 11.5 2.2% Electronic Materials 11.0 2.1%
Source: EPU

Policies and Business Environment
• Incentive policies for the knowledge economy have been introduced since early 1990s; Are broad ranging and comparable to other economies in East Asia. Sweetening tax incentives not a priority.
• Infrastructure superior to that of neighboring economies, except Singapore.
• “Doing Business” indicators relatively good and stable.• But among policymakers, a sense that Malaysia is
underachieving. It is not upgrading fast enough and risks losing momentum in the face of competition from China, India, and Vietnam.
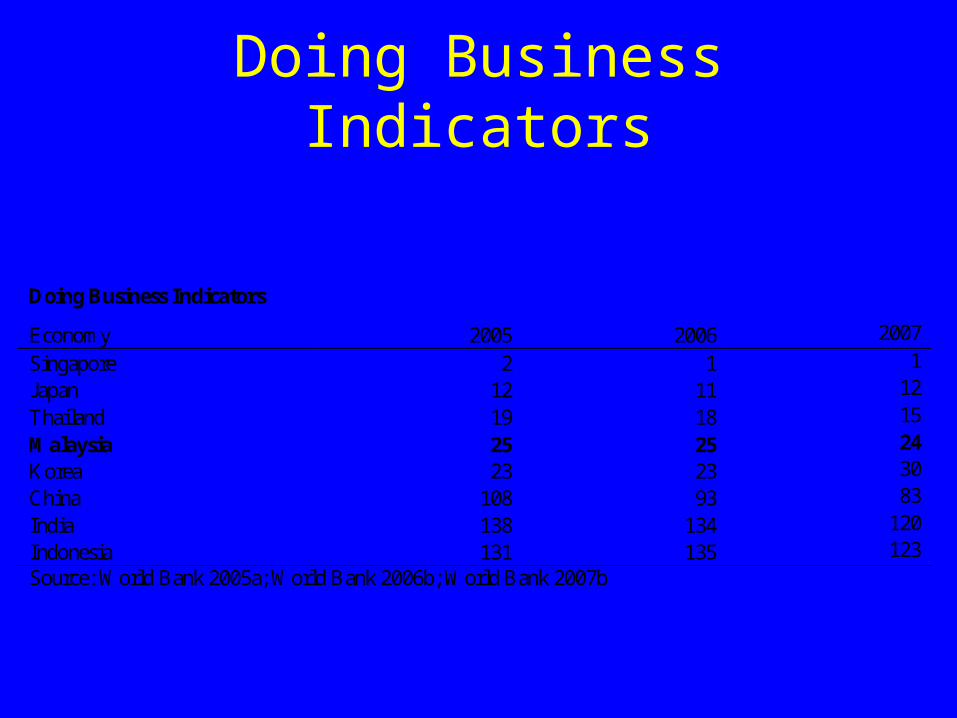
Doing Business Indicators
Doing Business Indicators
Economy 2005 2006 2007
Singapore 2 1 1
Japan 12 11 12
Thailand 19 18 15
Malaysia 25 25 24 Korea 23 23 30
China 108 93 83
India 138 134 120
Indonesia 131 135 123 Source: World Bank 2005a; World Bank 2006b; World Bank 2007b

Growth in “Alice in Wonderland”
`Well, in our country,' said Alice, still panting a little, `you'd generally get to somewhere else -- if you ran very fast for a long time, as we've been doing.'
`A slow sort of country!' said the Queen. `Now, here, you see, it takes all the running you can do, to keep in the same place.
If you want to get somewhere else, you must run at least twice as fast as that!'
- from “Through the Looking Glass” by Lewis Carroll

Policy Suggestions: A Summing Up
• Malaysia should aim to double R&D spending from public and private sources over the next ten years. This must be supported by higher education policies and incentives that raise quality and volume of STEM training.
• The larger firms, public and private, need to take the lead role in industrial deepening through backward and forward integration and by stimulating knowledge assimilation as well as domestic innovation.
• Measures to strengthen the knowledge economy must be concentrated on at the most one or two urban areas where the main universities and corporate headquarters are located.
• Urban centers must create the environment and culture which will attract and retain talented people from Malaysia and overseas. This calls for a mix of policies including policies affecting urban design.
• A dynamic urban knowledge environment which is conducive to the exchange of ideas, to both research and business related networking, and to innovation, demands an IT infrastructure that is comparable to the best in Asia.
• Polices that enhance openness and market competition can reinforce technological upgrading.
• Better, more detailed and current data to monitor changes in innovativeness and productivity across subsectors and increasing access to public data to encourage research on socio-economic issues, would assist in policy formulation.