Knowing where you fit
15
Your Organisation: Gaining a positive edge Comparing your organisation’s reporting data with those similar to you
Transcript of Knowing where you fit
Your Organisation: Gaining a positive edge
Comparing your organisation’s reporting data with those similar to you

Terms and conditions The data and charts contained in this presentation are copyright protected. All rights are reserved.
By accessing any data or charts in this presentation, you (the “user”) are agreeing to abide by the Terms and Conditions of data and chart use.
1. It is accepted by the user that the data and conclusions are based solely on information submitted to Charities Services by Registered Charities. The author of this presentation is to be held harmless by any actual or perceived inaccuracies
2. Users will accept that the data and chart information is based on raw source material that applies only to those Registered Charities that have submitted their annual return information at the time that the raw source data was extracted
3. Users will accept that there is data included in the raw source material that is known or suspected to be inaccurate but beyond the power of the author to correct. Users will also accept that where incorrect data has skewed the results, the author will identify this where known but otherwise not attempt to change the reported data.
4. Users accept and agree that this information is for the sole purpose of the named organisation and not for sharing outside of the named organisation
5. Users agree to acknowledge the author at any time that the charts in this presentation are quoted or used in any way by the named organisation
6. The author shall not be held responsible for decisions made as a result of the information contained in this presentation and users shall indemnify the author against any actual or implied misrepresentation.
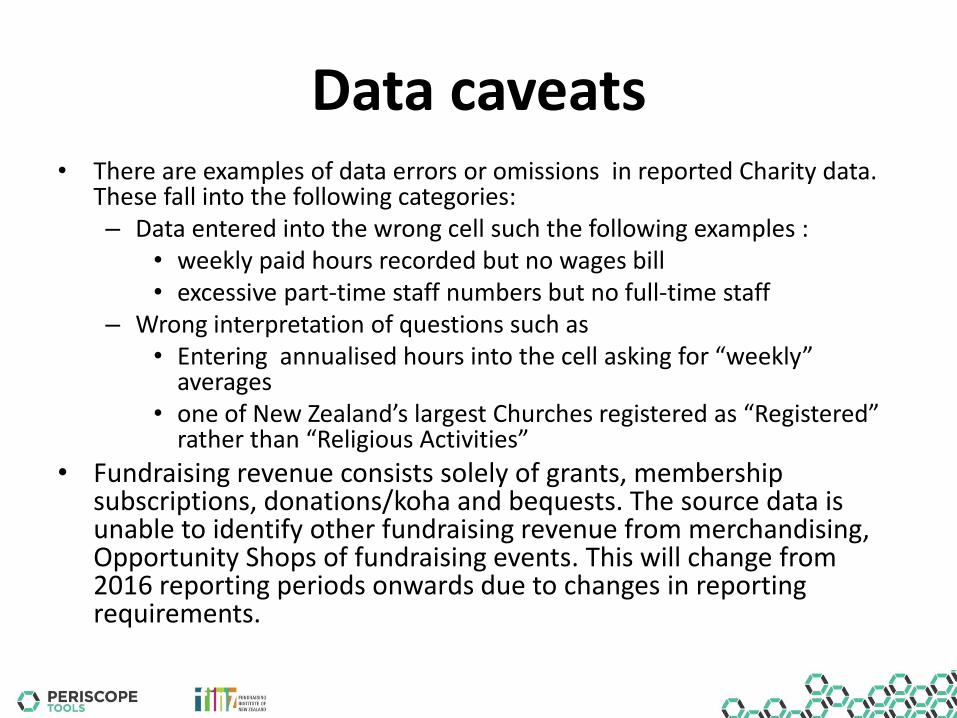
Data caveats • There are examples of data errors or omissions in reported Charity data.
These fall into the following categories: – Data entered into the wrong cell such the following examples :
• weekly paid hours recorded but no wages bill • excessive part-time staff numbers but no full-time staff
– Wrong interpretation of questions such as • Entering annualised hours into the cell asking for “weekly”
averages • one of New Zealand’s largest Churches registered as “Registered”
rather than “Religious Activities”
• Fundraising revenue consists solely of grants, membership subscriptions, donations/koha and bequests. The source data is unable to identify other fundraising revenue from merchandising, Opportunity Shops of fundraising events. This will change from 2016 reporting periods onwards due to changes in reporting requirements.

The Charity Sector in New Zealand
• There are over 27,500 registered Charities in New Zealand
• Approximately 200,000 New Zealanders govern Registered Charity Boards, Committees and Trusts
• Non-Charity Community organisations swell the whole sector to include around 113,000 voluntary organisations

The data pool
• The data for this presentation is sourced from the Charities Services database.
• It compares the latest data submitted by your Registered Charity against the latest data submitted by other Registered Charities within your chosen activity group
• The data in this p[resentation compares your Registered Charity against the data from – XX organisations operating within your organisation’s
City/District (YY% of the Region’s group) – XX organisations operating within your organisation’s
Region (YY% of this group Charities operating nationally) – XXXX organisations operating nationally
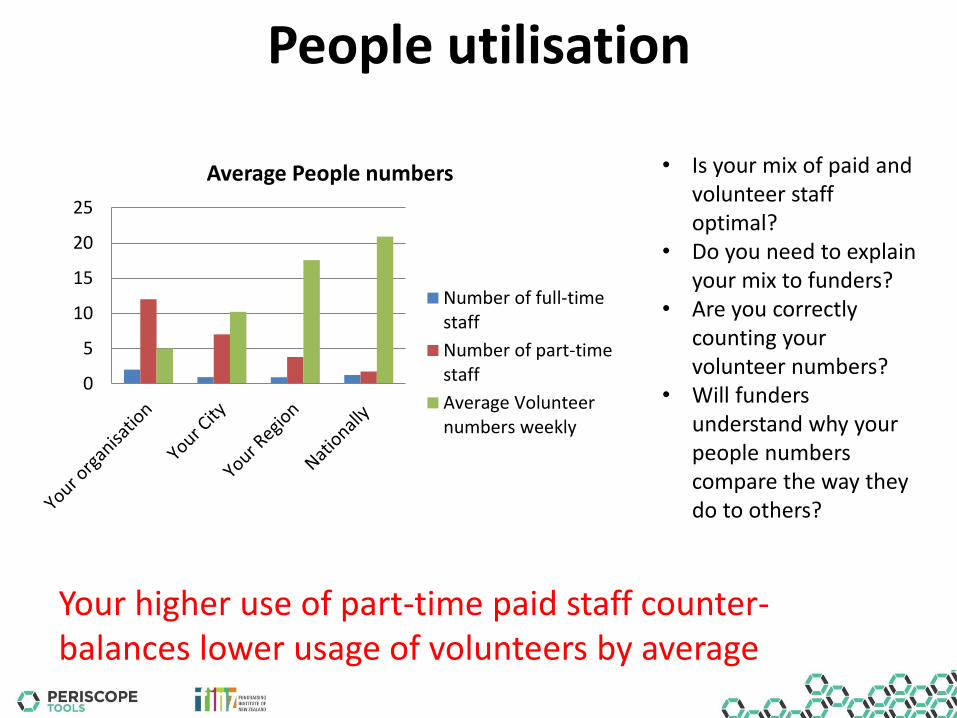
People utilisation
Your higher use of part-time paid staff counter-balances lower usage of volunteers by average
• Is your mix of paid and volunteer staff optimal?
• Do you need to explain your mix to funders?
• Are you correctly counting your volunteer numbers?
• Will funders understand why your people numbers compare the way they do to others?
0
5
10
15
20
25
Average People numbers
Number of full-timestaff
Number of part-timestaff
Average Volunteernumbers weekly
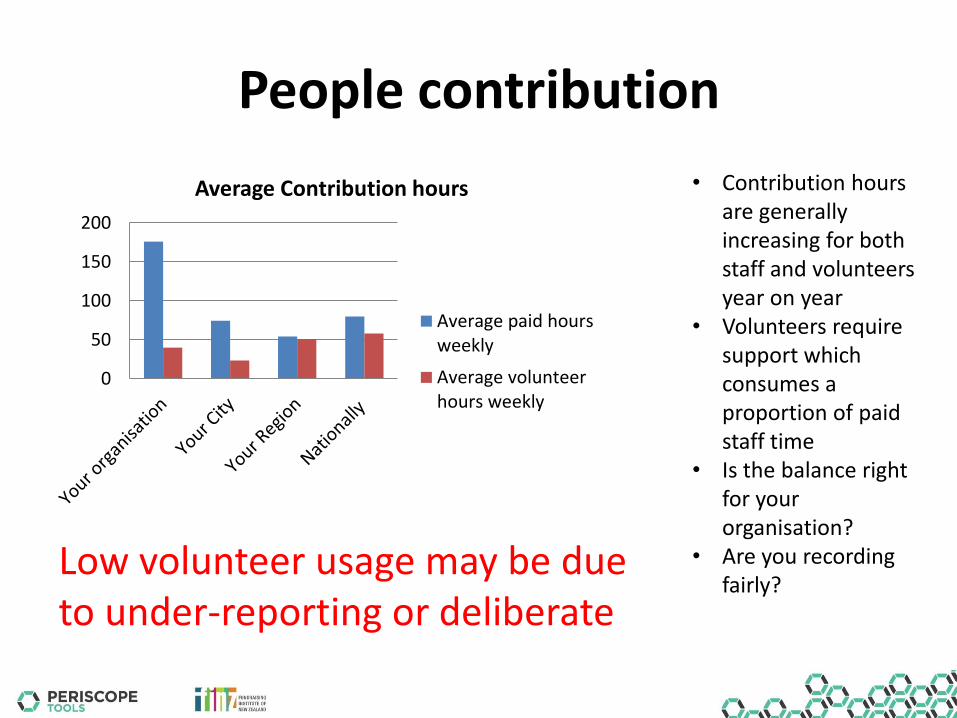
People contribution
Low volunteer usage may be due to under-reporting or deliberate
• Contribution hours are generally increasing for both staff and volunteers year on year
• Volunteers require support which consumes a proportion of paid staff time
• Is the balance right for your organisation?
• Are you recording fairly?
0
50
100
150
200
Average Contribution hours
Average paid hoursweekly
Average volunteerhours weekly

Revenue Mix
Your organisation had a lower proportion of fundraising revenue by comparison
• Over-reliance on one source of revenue can be a risk
• Is your revenue mix out of kilter?
• Are you correctly reporting your revenue?
• Can this picture assist with acquiring funding?
0%
20%
40%
60%
80%
100%
120%
Average Revenue proportions
Trading and otherrevenue
FundraisingProportion
Government IncomeProportion
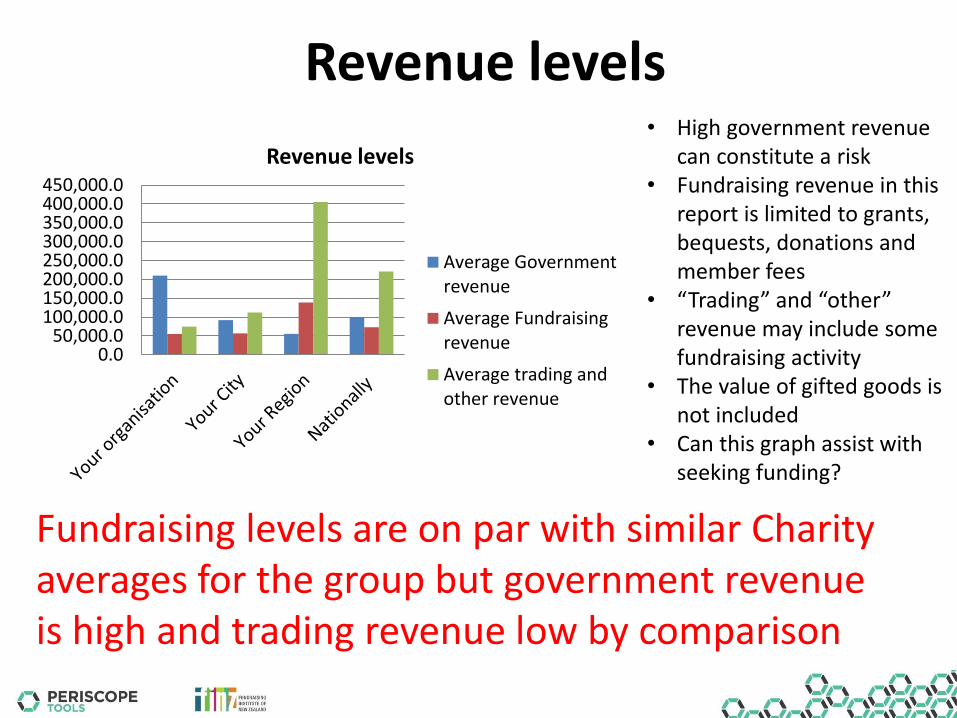
Revenue levels
Fundraising levels are on par with similar Charity averages for the group but government revenue is high and trading revenue low by comparison
• High government revenue can constitute a risk
• Fundraising revenue in this report is limited to grants, bequests, donations and member fees
• “Trading” and “other” revenue may include some fundraising activity
• The value of gifted goods is not included
• Can this graph assist with seeking funding?
0.050,000.0
100,000.0150,000.0200,000.0250,000.0300,000.0350,000.0400,000.0450,000.0
Revenue levels
Average Governmentrevenue
Average Fundraisingrevenue
Average trading andother revenue

Fundraising mix
Your organisation competes favourably against kindred Charities across the district and region
• Do you have bequest funds being held off-line in a Foundation?
• What’s your risk from relying on a narrow range of income?
• Where are your fundraising revenue opportunities?
• Is this graph able to help tell a story to assist with fundraising?
020,00040,00060,00080,000
100,000120,000140,000160,000
Fundraising mix
Bequests income
Donations and Kohaincome
Membership fees
All other grants andsponsorship income

Expenditure
Cost of trading levels are under-reported and service delivery costs at the high end of the scale
• Is your size as you expected or is your Charity larger or smaller by comparison than expected?
• Are you adequately reporting your ‘trading’ expenditure - reflecting the cost of running your Charity?
• Is your ‘other’ expenses a correct reflection of your activity?
050,000
100,000150,000200,000250,000300,000350,000400,000
Breakdown of expenses
Other Expenses
Depreciation
Cost of organisationtrading
Cost of servicesdelivery
Salaries and Wages

Organisational Assets
A high cash reserve proportion is not necessarily inappropriate but is likely to warrant explanation
• This is a snap-shot of your organisation on your balance date
• Cash in particular can vary considerably during the year
• If you are in rented accommodation then the value of buildings will be low
• Is your balance right?
0%
20%
40%
60%
80%
100%
120%
Average Asset proportions
Other assets (Inclland)
Buildings
Investments
Cash

Trading safety
Working capital ratio is a little on the low side for operating comfort
• Working capital = cash/bank balances plus investments
• Is the level of working capital right for your organisation?
• The red figures show how many month’s cash you have on hand to survive if revenue suddenly stops
• These figures include endowment and restricted funds, so trading safety margins may be less than shown
186,837 266,196
1,450,187
820,582
7 14 94 33
Yourorganisation
Your City Your Region Nationally
Working Capital

Conclusions
• Conclusions from this presentation are for you to derive as you know your organisation best.
• However, the data suggests the following – People usage is high compared by district and region but
not nationally – Government funding received is above the
district/regional average and fundraising much on par – By comparison, your organisation is cash-rich – However, working capital is only just at the level of being
safe for operating purposes
Interpretation
This presentation provides your Organisation’s Board with ability to
• determine the accuracy of self reporting
• consider performance against reported industry averages
• utilise the information to assist with planning your Organisation’s future.