Klink Kassidy One Year Embargo - UF/IFAS · If one was to calibrate his/her ... the environmental...
47
1. Title Study on Groundwater Quality Parameter Variation Due to Temperature Change in Calibration Solution and Instrumentation 2. Author Kassidy Klink 3. Affiliation of the author Project Manager, Peak Environmental, Woodbridge, NJ Master’s Candidate, Soil and Water Science Department, University of Florida, Gainesville, FL 4. Abstract Measurement of groundwater quality parameters is essential for environmental professionals to evaluate subsurface geochemical conditions. These parameters may be used to determine the direction of site remediation approach, thus they must be accurately measured. It has been shown that there is some variation in measured groundwater quality parameters when the temperature of the calibration fluids do not correspond to the temperature of the groundwater to be collected. However, the amount of the variance is not reflected in current regulations or field operation manuals. Regulatory agencies (such as the New Jersey Department of Environmental Protection (NJDEP)) have taken a conservative stance on these differences, requiring that groundwater quality instruments must be calibrated in the field with fluids at the same temperature as the groundwater to be analyzed. This study was attempted to quantify
Transcript of Klink Kassidy One Year Embargo - UF/IFAS · If one was to calibrate his/her ... the environmental...
1. Title
Study on Groundwater Quality Parameter Variation Due to Temperature Change in Calibration
Solution and Instrumentation
2. Author
Kassidy Klink
3. Affiliation of the author
Project Manager, Peak Environmental, Woodbridge, NJ
Master’s Candidate, Soil and Water Science Department, University of Florida, Gainesville, FL
4. Abstract
Measurement of groundwater quality parameters is essential for environmental professionals
to evaluate subsurface geochemical conditions. These parameters may be used to determine
the direction of site remediation approach, thus they must be accurately measured. It has been
shown that there is some variation in measured groundwater quality parameters when the
temperature of the calibration fluids do not correspond to the temperature of the groundwater
to be collected. However, the amount of the variance is not reflected in current regulations or
field operation manuals. Regulatory agencies (such as the New Jersey Department of
Environmental Protection (NJDEP)) have taken a conservative stance on these differences,
requiring that groundwater quality instruments must be calibrated in the field with fluids at the
same temperature as the groundwater to be analyzed. This study was attempted to quantify
these variations, and to determine if the time and effort required by regulatory agencies in
instrumentation calibration are necessary for effectively making site decisions and determine a
remediation strategy.
This study found that there was little difference in a subset of the control groundwater
parameters measured by the laboratory (pH, specific conductivity, and redox potential), and
those measured by groundwater quality instruments calibrated at different temperatures.
Dissolved oxygen and turbidity were measured by the laboratory and groundwater quality
instruments during the study, but the results were such that they were used in conclusion
analysis. Based upon these results, it may be possible to forgo both the field calibration of
groundwater quality equipment (office calibration may be acceptable) and the keeping of
calibration fluids at the same temperature as the groundwater to be sampled.
5. Introduction
In New Jersey, groundwater sampling procedures have been carefully described and regulated
by the NJDEP. The NJDEP’s (NJDEP, Field Sampling Procedures Manual, 2005) designates which
type of equipment may be used, what order samples should be collected in, and how/when to
properly calibrate groundwater quality instrumentation. The Field Sampling Procedures Manual
(FSPM) states that a groundwater quality instrument must be calibrated “in the field prior to
the day’s events.” (NJDEP104). The NJDEP FSPM goes on to state that calibration solutions must
be kept to the same temperature as the groundwater to be sampled, the flow‐through cell
must also be kept at the same temperature as the groundwater to be sampled, and that
conductivity, dissolved oxygen, and pH are temperature‐dependent.

Due to the duality of the environmental industry (between science and business), following
these directions to the letter is all but impossible for field personnel to accomplish.
Groundwater sampling events are frequently one‐day or budget‐limited events that must be
completed within the time allotted. If one was to calibrate his/her instrumentation in the
manner prescribed by the NJDEP, the work would not be done. Setting aside the business
aspect, unless there had been sampling events completed at that same site at the same time of
year and conditions how an individual would know what temperature the groundwater will be
upon sampling. Also, the equipment used to sample monitoring wells has the likelihood of
changing groundwater temperature (sometimes drastically depending on the type of pump
used). If this temperature is difficult to predict, how a field technician can pre‐chill (or heat) the
calibration solutions and flow‐through cell. Lastly, the NJDEP assumes that all personnel within
the environmental industry are technically proficient and have had the same level of training to
recognize the need to calibrate their equipment in the prescribed fashion. In direct contrast,
there is a wide range of training and capabilities in personnel even from within the same
company. While there are commercially available training courses in groundwater sampling, it
is much more likely that an individual learns the techniques from a colleague. This colleague
must be technically proficient and there must be enough training time available to satisfy the
needs of the trainee (for which there frequently is not).
There has been some specific scientific information obtained on the subject by research. In this
case, it has mostly been completed by the manufacturers of groundwater quality instruments

and probes. There have also been inquiries into this subject by the United States Environmental
Protection Agency, and the NJDEP. In order to better understand the data involved with the
research, it will be necessary to understand the specific groundwater quality parameters being
measured. From there it will be necessary to understand how the instrumentation measures
these parameters (ex. direct measurement versus calculated). The research being proposed is a
temperature condition and groundwater quality instrumentation study in real‐world conditions.
This research will help environmental professionals to better understand the importance of
proper instrument calibration, if any variance from the prescribed calibration method is
scientifically acceptable, and to develop a connection between the data being obtained and the
business being conducted.
The questions being addressed with this research are the following: does the temperature of a
calibration solution and/or of a groundwater quality instrument affect measured groundwater
quality parameters. If such an effect exists, then how it can be quantified. Given a set of
temperature conditions what confidence level may an environmental professional have in the
measured parameters?
This research will advance groundwater quality science in a practical way. If the hypotheses are
confirmed, there may be a wider range of temperatures in which groundwater instruments may
be calibrated and then confidently used. The amount of time and labor costs saved by
calibrating prior to sampling (possibly at room temperature) would be noteworthy. While there

have been many studies regarding the accuracy of ground water quality probes, there have not
been practical experiments conducted regarding these probes and temperature changes.
6. Materials and Methods
Groundwater Samples
A single groundwater sample was used in this study. Groundwater was collected from an
uncontaminated monitoring well at an environmental site located in Somerville, NJ. The
groundwater sample was collected via NJDEP‐approved groundwater sampling methodology
(NJDEP, Field Sampling Procedures Manual, 2005), and stored at 4°C. Prior to the study, the
sample was sent to Integrated Analytical Laboratories, Inc. (IAL) for baseline laboratory analysis.
IAL was given a representative portion of the groundwater sample, having well mixed the
sampled groundwater due to the amount collected. IAL analyzed the sample for: specific
conductance, pH, total dissolved oxygen (DO), turbidity, and oxidation‐reduction potential
(ORP). These results were used as the controlled results of the groundwater quality parameters
for the collected groundwater, as IAL used properly calibrated laboratory grade equipment in a
controlled environment to analyze the samples. Standard laboratory methods were used in the
analysis of the above parameters.
Groundwater Quality Instrumentation
Three groundwater quality instruments were used in this study. Each instrument was cleaned,
fitted with similar groundwater parameter probes (pH, turbidity, conductivity, temperature,
ORP, and DO), and properly calibrated (NJDEP, Field Sampling Procedures Manual, 2005) prior

to use. The three instruments included in this study were: YSI 6820, Horiba U‐52, and In‐Situ
TROLL 9500. The instruments were clean and calibrated prior to parameter measurements on
every sample. Instruments were deployed in a single location throughout the study.
The groundwater quality instruments used in this study properly calibrated according to
manufacturer recommendations and NJDEP standards prior to usage. Calibration fluids were
dedicated to each instrument. The calibration fluids were placed into each of the three
temperature study zones (basement, bedroom, and garage) along with collected groundwater
samples. Prior to sample readings, each instrument was calibrated with fluids from one
temperature zone. Documentation of the calibration of each instrument using fluids from each
temperature zone is included with this study as Appendix 1.
Temperature Experiments
The collected groundwater sample was split into three 500 mL plastic sample containers. Each
sample container and calibration fluids were placed in different temperature zones of the
testing area (Garage, Basement, and Bedroom) to simulate different work environments. By
placing the calibration fluids and samples in different temperatures, one may evaluate the
effect each temperature has on instrument calibration and groundwater parameter readings.
Three rounds of testing were completed on the groundwater samples according to the
temperature zone of the corresponding calibration fluids. Groundwater quality instruments
were calibrated with solutions from one of the three temperature zones for each testing round.
The temperature of the samples and the calibration fluids were verified with a calibration‐

certified thermometer. Following calibration, groundwater samples from each of the three
temperature zones were tested in each instrument. Samples were shaken nominally prior to
testing to simulate sampling turbidity conditions. Initial groundwater quality readings were
collected at time zero, followed by three additional sampling points at five minute intervals.
The parameters collected included: pH, specific conductivity, turbidity, ORP, temperature, and
DO. Following their usage for each temperature zone, groundwater quality instruments, their
probes, and sampling vessels were cleaned with DI water. All samples were analyzed over a 15
minute time period.
Data Analysis
Data from the individual temperature zones and different temperature calibration fluids were
compared against one another on a per instrument basis. The data from each instrument for
each testing round was then compared against one another. The data from each testing round
and instrument was compared to the results provided by IAL. All data analysis was completed
using Microsoft Excel 2013 for Windows. All data provided below is listed as the initial
groundwater quality reading followed by the last reading for the indicated sample.
7. Results
The results discussed below indicate the initial reading measured by the instrument and the last
reading in the sample cycle. Full data tables for all collected parameters are included as Tables
1 through 3. Charts of each instrument and certain groundwater quality parameters as
compared to time are included as Figures 1 through 9.

Basement calibration
The initial basement sample temperature was 18.4 degree Celsius (°C). The pH (standard units)
of the basement sample was found to be: 5.75 to 7.03 (Horiba), 7.07 to 7.17 (YSI), and 7.29 (In‐
Situ). The specific conductivity (µS/cm) of the basement sample was found to be: 3,430
(Horiba), 3,430 to 3,402 (YSI), and 3,347 to 3,348 (In‐Situ). The redox potential (millivolts (mV))
of the basement sample was found to be: 311 to 239 (Horiba), 218 to 249 (YSI), and 279 (In‐
Situ). The dissolved oxygen (milligrams per Liter (mg/L)) of the basement sample was found to
be: 7.38 to 5.55 (Horiba), 9.64 to 9.52 (YSI), and 8.63 (In‐Situ). The turbidity (nephelometric
turbidity units (NTU)) of the basement sample was found to be: 183.0 to 140.0 (Horiba), 241.5
to 193.5 (YSI), and 56.6 to 49.1 (In‐Situ). The temperature (°C) of the basement sample was
found to be: 17.09 to 17.13 (Horiba), 17.46 to 17.25 (YSI), and 17.20 to 17.27 (In‐Situ).
The initial bedroom sample temperature was 17.8°C. The pH (standard units) of the bedroom
sample was found to be: 6.88 to 7.34 (Horiba), 7.19 to 7.32 (YSI), and 7.36 to 7.43 (In‐Situ). The
specific conductivity (µS/cm) of the bedroom sample was found to be: 3,450 to 3,480 (Horiba),
3,358 to 3,427 (YSI), and 3300 to 3,377 (In‐Situ). The redox potential (mV) of the bedroom
sample was found to be: 271 to 238 (Horiba), 230 to 236 (YSI), and 280 to 274 (In‐Situ). The
dissolved oxygen (mg/L) of the bedroom sample was found to be: 10.04 to 6.01 (Horiba), 10.35
to 10.07 (YSI), and 10.83 to 9.75 (In‐Situ). The turbidity (NTU) of the bedroom sample was
found to be: 512 to 251 (Horiba), 552 to 447 (YSI), and 231 to 195 (In‐Situ). The temperature

(°C) of the bedroom sample was found to be: 16.64 to 16.67 (Horiba), 17.39 (YSI), and 17.48 to
17.35 (In‐Situ).
The initial garage sample temperature was 7.4°C. The pH (standard units) of the garage sample
was found to be: 7.45 to 7.30 (Horiba), 7.34 to 7.30 (YSI), and 7.43 to 7.46 (In‐Situ). The specific
conductivity (µS/cm) of the garage sample was found to be: 3,260 to 3,440 (Horiba), 3,395 to
3,398 (YSI), and 3,359 to 3,342 (In‐Situ). The redox potential (mV) of the garage sample was
found to be: 241 to 239 (Horiba), 232 to 255 (YSI), and 265 to 269 (In‐Situ). The dissolved
oxygen (mg/L) of the garage sample was found to be: 14.04 to 7.36 (Horiba), 12.20 to 11.43
(YSI), and 14.24 to 11.64 (In‐Situ). The turbidity (NTU) of the garage sample was found to be:
0.0 to 800.0 (Horiba), 557.0 to 533.7 (YSI), and 840.6 to 630.8 (In‐Situ). The temperature (°C) of
the garage sample was found to be: 9.90 to 10.41 (Horiba), 12.35 to 13.47 (YSI), and 10.61 to
13.50 (In‐Situ).

Table 1. Basement calibration ‐ groundwater quality monitoring results
SAMPLE TEMPERATURE ZONE EQUIPMENT NAME TIME (minutes)
pH (standard units) SPECIFIC CONDUCTIVITY (µS/cm) REDOX POTENTIAL (mV) DISSOLVED OXYGEN (mg/L) TURBIDITY (NTU) TEMPERATURE (degrees C)
READING CHANGE READING CHANGE READING CHANGE READING CHANGE READING CHANGE READING CHANGE
Basement Horiba 0 5.75 NA 3,430 NA 311 NA 7.38 NA 183 NA 17.09 NA
5 6.76 1.01 3,420 ‐10 260 ‐51 5.91 ‐1.47 166 ‐17 17.31 0.22
10 6.94 0.18 3,430 10 247 ‐13 5.54 ‐0.37 147 ‐19 17.21 ‐0.10
15 7.03 0.09 3,430 0.00 239 ‐8 5.55 0.01 140 ‐7 17.13 ‐0.08
Basement YSI 0 7.07 NA 3,430 NA 218.4 NA 9.64 NA 241.5 NA 17.46 NA
5 7.04 ‐0.03 3,421 ‐9 231.0 12.6 9.56 ‐0.08 214.1 ‐27.4 17.25 ‐0.21
10 7.12 0.08 3,407 ‐14 242.7 11.7 9.51 ‐0.05 243.1 29.0 17.28 0.03
15 7.17 0.05 3,402 ‐5 249.3 6.6 9.52 0.01 193.5 ‐49.6 17.25 ‐0.03
Basement In‐Situ 0 7.29 NA 3,347.07 NA 279 NA 8.63 NA 56.6 NA 17.20 NA
5 7.29 0.00 3,348.40 1.33 279 0.00 8.67 0.04 52.8 ‐3.8 17.22 0.02
10 7.29 0.00 3,348.12 ‐0.28 279 0.00 8.64 ‐0.03 49.6 ‐3.2 17.27 0.05
15 7.29 0.00 3,348.08 ‐0.04 279 0.00 8.63 ‐0.01 49.1 ‐0.5 17.27 0.00
Bedroom Horiba 0 6.88 NA 3,450 NA 271 NA 10.04 NA 512 NA 16.64 NA
5 7.26 0.38 3,480 30 249 ‐22 6.52 ‐3.52 332 ‐180 16.65 0.01
10 7.33 0.07 3,480 0 293 44 6.20 ‐0.32 296 ‐36 16.65 0.00
15 7.34 0.01 3,480 0 238 ‐55 6.01 ‐0.19 251 ‐45 16.67 0.02
Bedroom YSI 0 7.19 NA 3,358 NA 229.5 NA 10.35 NA 552.0 NA 17.39 NA
5 7.27 0.08 3,429 71 231.3 1.8 10.10 ‐0.25 502.3 ‐49.7 17.41 0.02
10 7.30 0.03 3,431 2 233.6 2.3 10.09 ‐0.01 501.0 ‐1.3 17.40 ‐0.01
15 7.32 0.02 3,427 ‐4 235.9 2.3 10.07 ‐0.02 447.3 ‐53.7 17.39 ‐0.01
Bedroom In‐Situ 0 7.36 NA 3,299.80 NA 280 NA 10.83 NA 230.8 NA 17.48 NA
5 7.42 0.06 3,378.94 79.14 277 ‐3 10.25 ‐0.58 212.8 ‐18 17.34 ‐0.14
10 7.43 0.01 3,376.11 ‐2.83 276 ‐1 9.98 ‐0.27 201.8 ‐11 17.35 0.01
15 7.43 0.00 3,376.70 0.59 274 ‐2 9.75 ‐0.23 194.6 ‐7.2 17.35 0.00
Garage Horiba 0 7.45 NA 3,260 NA 241 NA 14.04 NA 0 NA 9.90 NA
5 7.82 0.37 3,340 80 240 ‐1 7.81 ‐6.23 800 800 10.04 0.14
10 7.31 ‐0.51 3,420 80 240 0 7.51 ‐0.30 800 0 10.22 0.18
15 7.30 ‐0.01 3,440 20 239 ‐1 7.36 ‐0.15 800 0 10.41 0.19
Garage YSI 0 7.34 NA 3,395 NA 232.0 NA 12.20 NA 557 NA 12.35 NA
5 7.26 ‐0.08 3,394 ‐1 247.5 15.5 11.48 ‐0.72 569.5 12.5 12.91 0.56
10 7.27 0.01 3,393 ‐1 252.7 5.2 11.43 ‐0.05 564.3 ‐5.2 13.22 0.31
15 7.30 0.03 3,398 5 254.8 2.1 11.43 0.00 533.7 ‐30.6 13.47 0.25
Garage In‐Situ 0 7.43 NA 3,359.35 NA 265 NA 14.24 NA 840.6 NA 10.61 NA
5 7.46 0.03 3,331.86 ‐27.49 267 2 11.60 ‐2.64 685.6 ‐155.0 12.47 1.86
10 7.46 0.00 3,335.95 4.09 268 1 11.56 ‐0.04 697.5 11.9 13.14 0.67
15 7.46 0.00 3,341.61 5.66 269 1 11.64 0.08 630.8 ‐66.7 13.50 0.36
Notes: C ‐ celsius, mg/L ‐ milligrams per Liter, mV ‐ milliVolt, NA ‐ not applicable, NTU ‐ nephelometric turbidity units, µS/cm ‐microSiemens per centimeter

Bedroom calibration
The initial basement sample temperature was 18.8°C. The pH (standard units) of the basement
sample was found to be: 5.75 to 7.05 (Horiba), 7.11 (YSI), and 7.17 to 7.27 (In‐Situ). The specific
conductivity (µS/cm) of the basement sample was found to be: 3,470 to 3,480 (Horiba), 3,470
to 3,450 (YSI), and 3,388 to 3,389 (In‐Situ). The redox potential (mV) of the basement sample
was found to be: 350 to 274 (Horiba), 219 to 248 (YSI), and 268 to 289 (In‐Situ). The dissolved
oxygen (mg/L) of the basement sample was found to be: 8.22 to 5.64 (Horiba), 9.70 to 9.41
(YSI), and 8.58 to 8.12 (In‐Situ). The turbidity (NTU) of the basement sample was found to be:
237.0 to 199.0 (Horiba), 231.1 to 197.1 (YSI), and 311.1 to 211.4 (In‐Situ). The temperature (°C)
of the basement sample was found to be: 18.11 to 17.51 (Horiba), 17.74 to 17.71 (YSI), and
18.67 to 18.21 (In‐Situ).
The initial bedroom sample temperature was 17.9°C. The pH (standard units) of the bedroom
sample was found to be: 6.97 to 7.37 (Horiba), 7.19 to 7.37 (YSI), and 7.35 to 7.42 (In‐Situ). The
specific conductivity (µS/cm) of the bedroom sample was found to be: 3,460 to 3,480 (Horiba),
3,345 to 3,498 (YSI), and 3,357 to 3,399 (In‐Situ). The redox potential (mV) of the bedroom
sample was found to be: 265 to 238 (Horiba), 238 to 245 (YSI), and 289 to 279 (In‐Situ). The
dissolved oxygen (mg/L) of the bedroom sample was found to be: 9.54 to 7.22 (Horiba), 10.21
to 9.87 (YSI), and 10.56 to 8.23 (In‐Situ). The turbidity (NTU) of the bedroom sample was found
to be: 676.0 to 267.0 (Horiba), 578.9 to 512.1 (YSI), and 239.3 to 178.2 (In‐Situ). The
temperature (°C) of the bedroom sample was found to be: 16.79 (Horiba), 17.41 to 17.42 (YSI),
and 17.87 to 17.53 (In‐Situ).

The initial garage sample temperature was 8.1°C. The pH (standard units) of the garage sample
was found to be: 7.41 to 7.31 (Horiba), 7.38 to 7.34 (YSI), and 7.37 to 7.45 (In‐Situ). The specific
conductivity (µS/cm) of the garage sample was found to be: 3,229 to 3,430 (Horiba), 3,458 to
3,461 (YSI), and 3,349 to 3,359 (In‐Situ). The redox potential (mV) of the garage sample was
found to be: 248 to 239 (Horiba), 235 to 297 (YSI), and 289 to 275 (In‐Situ). The dissolved
oxygen (mg/L) of the garage sample was found to be: 14.31 to 7.12 (Horiba), 12.12 to 11.66
(YSI), and 13.12 to 10.31 (In‐Situ). The turbidity (NTU) of the garage sample was found to be:
800.0 (Horiba), 783.5 to 589.3 (YSI), and 931.9 to 790.1 (In‐Situ). The temperature (°C) of the
garage sample was found to be: 10.83 to 11.73 (Horiba), 11.21 to 12.78 (YSI), and 11.32 to
13.52 (In‐Situ).

Table 2. Bedroom calibration ‐ groundwater quality monitoring results
SAMPLE TEMPERATURE ZONE EQUIPMENT NAME TIME (minutes)
pH (standard units) SPECIFIC CONDUCTIVITY (µS/cm) REDOX POTENTIAL (mV) DISSOLVED OXYGEN (mg/L) TURBIDITY (NTU) TEMPERATURE (degrees C)
READING CHANGE READING CHANGE READING CHANGE READING CHANGE READING CHANGE READING CHANGE
Basement Horiba 0 5.75 NA 3,470 NA 350 NA 8.22 NA 237 NA 18.11 NA
5 6.95 1.20 3,480 10 280 ‐70 5.66 ‐2.56 223 ‐14 17.54 ‐0.57
10 7.01 0.06 3,480 0 275 ‐5 5.67 0.01 201 ‐22 17.54 0.00
15 7.05 0.04 3,480 0 274 ‐1 5.64 ‐0.03 199 ‐2 17.51 ‐0.03
Basement YSI 0 7.11 NA 3,470 NA 218.7 NA 9.70 NA 231.1 NA 17.74 NA
5 7.10 ‐0.01 3,440 ‐30 235.6 16.9 9.65 ‐0.05 210.5 ‐20.6 17.71 ‐0.03
10 7.09 ‐0.01 3,450 10 241.1 5.5 9.44 ‐0.21 199.9 ‐10.6 17.71 0.00
15 7.11 0.02 3,450 0 247.6 6.5 9.41 ‐0.03 197.1 ‐2.8 17.71 0.00
Basement In‐Situ 0 7.11 NA 3,387.50 NA 268 NA 8.58 NA 311.1 NA 18.67 NA
5 7.24 0.13 3,401.40 13.90 278 10 8.42 ‐0.16 297.2 ‐13.9 18.23 ‐0.44
10 7.25 0.01 3,378.30 ‐23.10 285 7 8.31 ‐0.11 267.5 ‐29.7 18.21 ‐0.02
15 7.27 0.02 3,389.45 11.15 289 4 8.12 ‐0.19 211.4 ‐56.1 18.21 0.00
Bedroom Horiba 0 6.97 NA 3,460 NA 265 NA 9.54 NA 676 NA 16.79 NA
5 7.31 0.34 3,470 10 249 ‐16 7.34 ‐2.20 432 ‐244 16.87 0.08
10 7.34 0.03 3,480 10 278 29 7.23 ‐0.11 346 ‐86 16.85 ‐0.02
15 7.37 0.03 3,480 0 238 ‐40 7.22 ‐0.01 267 ‐79 16.79 ‐0.06
Bedroom YSI 0 7.19 NA 3,345 NA 238.1 NA 10.21 NA 578.9 NA 17.41 NA
5 7.32 0.13 3,478 133 238.9 0.8 10.00 ‐0.21 567.3 ‐11.6 17.47 0.06
10 7.32 0.00 3,489 11 241.1 2.2 9.93 ‐0.07 543.2 ‐24.1 17.45 ‐0.02
15 7.37 0.05 3,498 9 245.2 4.1 9.87 ‐0.06 512.1 ‐31.1 17.42 ‐0.03
Bedroom In‐Situ 0 7.35 NA 3,357.10 NA 289 NA 10.56 NA 239.3 NA 17.87 NA
5 7.41 0.06 3,414.23 57.13 284 ‐5 9.75 ‐0.81 211.2 ‐28.1 17.69 ‐0.18
10 7.42 0.01 3,445.34 31.11 281 ‐3 8.42 ‐1.33 192.6 ‐18.6 17.63 ‐0.06
15 7.42 0.00 3,398.93 ‐46.41 279 ‐2 8.23 ‐0.19 178.2 ‐14.4 17.53 ‐0.10
Garage Horiba 0 7.41 NA 3,229 NA 248 NA 14.31 NA 800 NA 10.83 NA
5 7.64 0.23 3,370 141 243 ‐5 7.51 ‐6.80 800 0 11.35 0.52
10 7.31 ‐0.33 3,415 45 240 ‐3 7.23 ‐0.28 800 0 11.70 0.35
15 7.31 0.00 3,430 15 239 ‐1 7.12 ‐0.11 800 0 11.73 0.03
Garage YSI 0 7.38 NA 3,458 NA 235.2 NA 12.12 NA 783.5 NA 11.21 NA
5 7.27 ‐0.11 3,465 7 248.5 13.3 11.58 ‐0.54 642.4 ‐141.1 12.67 1.46
10 7.31 0.04 3,463 ‐2 269.8 21.3 11.48 ‐0.10 612.9 ‐29.5 12.89 0.22
15 7.34 0.03 3,461 ‐2 296.5 26.7 11.66 0.18 589.3 ‐23.6 12.78 ‐0.11
Garage In‐Situ 0 7.37 NA 3,349.12 NA 289 NA 13.12 NA 931.9 NA 11.32 NA
5 7.44 0.07 3,345.30 ‐3.82 272 ‐17 10.15 ‐2.97 765.2 ‐166.7 12.49 1.17
10 7.45 0.01 3,354.80 9.50 272 0 10.12 ‐0.03 789.1 23.9 13.13 0.64
15 7.45 0.00 3,359.40 4.60 275 3 10.31 0.19 790.1 1.0 13.52 0.39
Notes: C ‐ celsius, mg/L ‐ milligrams per Liter, mV ‐ milliVolt, NA ‐ not applicable, NTU ‐ nephelometric turbidity units, µS/cm ‐microSiemens per centimeter

Garage calibration
The initial basement sample temperature was 20.9°C. The pH (standard units) of the basement
sample was found to be: 5.76 to 7.16 (Horiba), 7.71 to 7.32 (YSI), and 6.76 to 7.26 (In‐Situ). The
specific conductivity (µS/cm) of the basement sample was found to be: 3,490 to 3,510 (Horiba),
3,431 to 3,479 (YSI), and 3,407 to 3,431 (In‐Situ). The redox potential (mV) of the basement
sample was found to be: 416 to 265 (Horiba), 219 to 250 (YSI), and 260 to 297 (In‐Situ). The
dissolved oxygen (mg/L) of the basement sample was found to be: 9.20 to 5.35 (Horiba), 9.72 to
9.25 (YSI), and 8.47 to 7.88 (In‐Situ). The turbidity (NTU) of the basement sample was found to
be: 427.0 to 205.0 (Horiba), 193.9 to 183.2 (YSI), and 913.6 to 585.0 (In‐Situ). The temperature
(°C) of the basement sample was found to be: 19.06 to 18.29 (Horiba), 18.24 to 17.80 (YSI), and
19.89 to 19.29 (In‐Situ).
The initial bedroom sample temperature was 17.6°C. The pH (standard units) of the bedroom
sample was found to be: 7.16 to 7.38 (Horiba), 7.29 to 7.45 (YSI), and 7.34 to 7.31 (In‐Situ). The
specific conductivity (µS/cm) of the bedroom sample was found to be: 3,470 (Horiba), 3,317 to
3,521 (YSI), and 3,385 to 3,453 (In‐Situ). The redox potential (mV) of the bedroom sample was
found to be: 260 to 234 (Horiba), 243 to 252 (YSI), and 291 to 281 (In‐Situ). The dissolved
oxygen (mg/L) of the bedroom sample was found to be: 8.74 to 8.53 (Horiba), 10.02 to 9.75
(YSI), and 9.09 to 7.78 (In‐Situ). The turbidity (NTU) of the bedroom sample was found to be:
800.0 to 275.0 (Horiba), 631.5 to 492.5 (YSI), and 176.5 to 165.5 (In‐Situ). The temperature (°C)
of the bedroom sample was found to be: 17.04 to 16.86 (Horiba), 17.46 to 17.47 (YSI), and
18.00 to 18.14 (In‐Situ).

The initial garage sample temperature was 9.32°C. The pH (standard units) of the garage
sample was found to be: 7.33 (Horiba), 7.41 to 7.36 (YSI), and 7.27 to 7.43 (In‐Situ). The specific
conductivity (µS/cm) of the garage sample was found to be: 3,320 to 3,440 (Horiba), 3,505 to
3,535 (YSI), and 3,338 to 3,367 (In‐Situ). The redox potential (mV) of the garage sample was
found to be: 254 to 239 (Horiba), 238 to 276 (YSI), and 290 to 289 (In‐Situ). The dissolved
oxygen (mg/L) of the garage sample was found to be: 14.71 to 6.33 (Horiba), 11.99 to 11.81
(YSI), and 11.33 to 9.31 (In‐Situ). The turbidity (NTU) of the garage sample was found to be:
16.9 to 791.0 (Horiba), 978.4 to 694.3 (YSI), and 1,309.7 to 941.5 (In‐Situ). The temperature (°C)
of the garage sample was found to be: 11.73 to 12.45 (Horiba), 10.56 to 11.82 (YSI), and 11.65
to 13.62 (In‐Situ).

Table 3. Garage calibration ‐ groundwater quality monitoring results
SAMPLE TEMPERATURE ZONE EQUIPMENT NAME TIME (minutes)
pH (standard units) SPECIFIC CONDUCTIVITY (µS/cm) REDOX POTENTIAL (mV) DISSOLVED OXYGEN (mg/L) TURBIDITY (NTU) TEMPERATURE (degrees C)
READING CHANGE READING CHANGE READING CHANGE READING CHANGE READING CHANGE READING CHANGE
Basement Horiba 0 5.76 NA 3,490 NA 416 NA 9.20 NA 427 NA 19.06 NA
5 7.12 1.36 3,510 20 265 ‐151 5.13 ‐4.07 426 ‐1 18.87 ‐0.19
10 7.10 ‐0.02 3,500 ‐10 264 ‐1 5.24 0.11 302 ‐124 18.53 ‐0.34
15 7.16 0.06 3,510 10 265 1 5.35 0.11 205 ‐97 18.29 ‐0.24
Basement YSI 0 7.71 NA 3,431 NA 219.3 NA 9.72 NA 193.9 NA 18.24 NA
5 7.34 ‐0.37 3,470 39 238.8 19.5 9.23 ‐0.49 191.5 ‐2.4 17.92 ‐0.32
10 7.32 ‐0.02 3,477 7 244.9 6.1 9.25 0.02 187.0 ‐4.5 17.85 ‐0.07
15 7.32 0.00 3,479 2 249.9 5 9.25 0 183.2 ‐3.8 17.8 ‐0.05
Basement In‐Situ 0 6.76 NA 3,406.95 NA 260 NA 8.47 NA 913.6 NA 19.89 NA
5 7.21 0.45 3,413.54 6.59 282 22 8.05 ‐0.42 768.7 ‐144.9 19.63 ‐0.26
10 7.24 0.03 3,395.62 ‐17.92 292 10 8.01 ‐0.04 676.5 ‐92.2 19.43 ‐0.20
15 7.26 0.02 3,430.58 34.96 297 5 7.88 ‐0.13 585 ‐91.5 19.29 ‐0.14
Bedroom Horiba 0 7.16 NA 3,470 NA 260 NA 8.74 NA 800 NA 17.04 NA
5 7.32 0.16 3,470 0 248 ‐12 8.62 ‐0.12 688 ‐112 16.97 ‐0.07
10 7.35 0.03 3,470 0 243 ‐5 8.56 ‐0.06 525 ‐163 16.93 ‐0.04
15 7.38 0.03 3,470 0 234 ‐9 8.53 ‐0.03 275 ‐250 16.86 ‐0.07
Bedroom YSI 0 7.29 NA 3,317 NA 243 NA 10.02 NA 631.5 NA 17.46 NA
5 7.4 0.11 3,517 200 243.7 0.7 9.77 ‐0.25 596 ‐35.5 17.48 0.02
10 7.44 0.04 3,520 3 247.5 3.8 9.76 ‐0.01 560.1 ‐35.9 17.47 ‐0.01
15 7.45 0.01 3,521 1 251.6 4.1 9.75 ‐0.01 492.5 ‐67.6 17.47 0.00
Bedroom In‐Situ 0 7.34 NA 3,385.40 NA 291 NA 9.09 NA 176.5 NA 18 NA
5 7.4 0.06 3,449.32 63.92 286 ‐5 8.26 ‐0.83 174.2 ‐2.3 18.1 0.10
10 7.41 0.01 3,452.28 2.96 283 ‐3 7.91 ‐0.35 169.2 ‐5.0 18.11 0.01
15 7.41 0.00 3,453.30 1.02 281 ‐2 7.78 ‐0.13 165.5 ‐3.7 18.14 0.03
Garage Horiba 0 7.33 NA 3,320 NA 254 NA 14.71 NA 16.9 NA 11.73 NA
5 7.21 ‐0.12 3,380 60 244 ‐10 7.15 ‐7.56 800 783.1 12.03 0.30
10 7.32 0.11 3,410 30 241 ‐3 6.53 ‐0.62 800 0 12.26 0.23
15 7.33 0.01 3,440 30 239 ‐2 6.33 ‐0.2 791 ‐9 12.45 0.19
Garage YSI 0 7.41 NA 3,505 NA 237.9 NA 11.99 NA 978.4 NA 10.56 NA
5 7.32 ‐0.09 3,523 18 266.8 28.9 11.66 ‐0.33 878.1 ‐100.3 11.18 0.62
10 7.34 0.02 3,529 6 272.9 6.1 11.53 ‐0.13 773.4 ‐104.7 11.54 0.36
15 7.36 0.02 3,535 6 275.5 2.6 11.81 0.28 694.3 ‐79.1 11.82 0.28
Garage In‐Situ 0 7.27 NA 3,338.15 NA 290 NA 11.33 NA 1309.7 NA 11.65 NA
5 7.42 0.15 3,354.20 16.05 287 ‐3 9.65 ‐1.68 1221 ‐88.7 12.56 0.91
10 7.42 0.00 3,364.51 10.31 288 1 9.45 ‐0.2 1072.9 ‐148.1 13.12 0.56
15 7.43 0.01 3,367.20 2.69 289 1 9.31 ‐0.14 941.5 ‐131.4 13.62 0.50
Notes: C ‐ celsius, mg/L ‐ milligrams per Liter, mV ‐ milliVolt, NA ‐ not applicable, NTU ‐ nephelometric turbidity units, µS/cm ‐microSiemens per centimeter
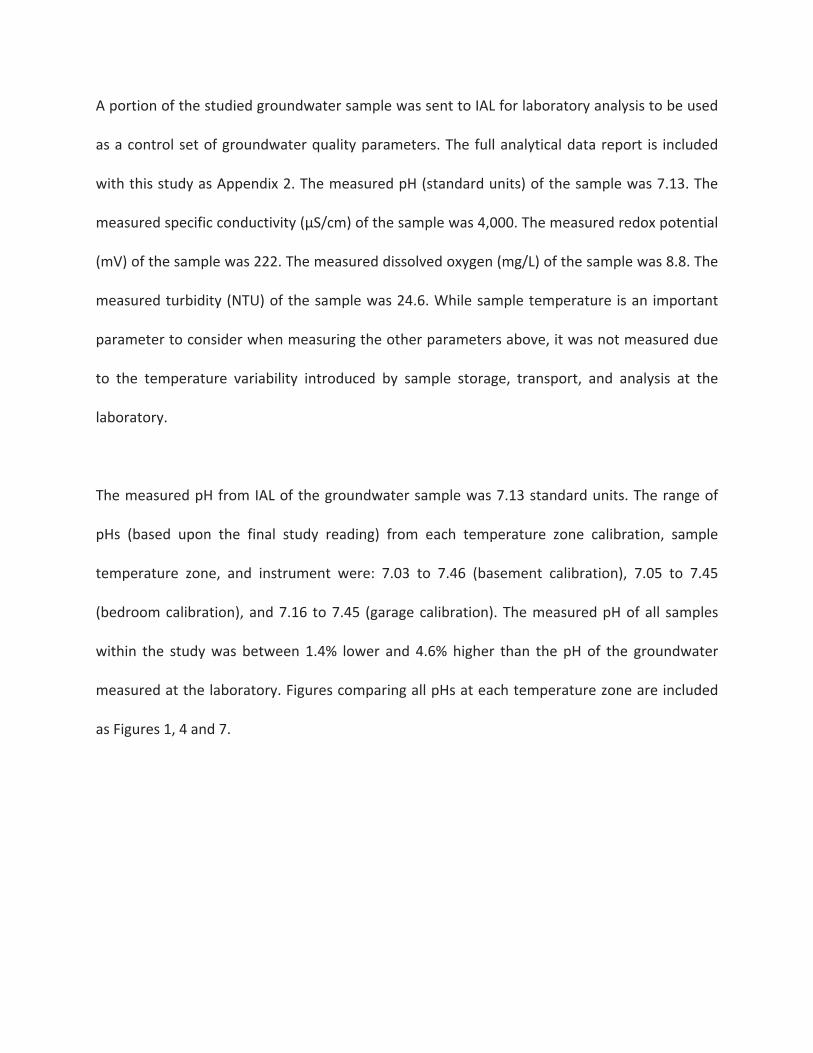
A portion of the studied groundwater sample was sent to IAL for laboratory analysis to be used
as a control set of groundwater quality parameters. The full analytical data report is included
with this study as Appendix 2. The measured pH (standard units) of the sample was 7.13. The
measured specific conductivity (µS/cm) of the sample was 4,000. The measured redox potential
(mV) of the sample was 222. The measured dissolved oxygen (mg/L) of the sample was 8.8. The
measured turbidity (NTU) of the sample was 24.6. While sample temperature is an important
parameter to consider when measuring the other parameters above, it was not measured due
to the temperature variability introduced by sample storage, transport, and analysis at the
laboratory.
The measured pH from IAL of the groundwater sample was 7.13 standard units. The range of
pHs (based upon the final study reading) from each temperature zone calibration, sample
temperature zone, and instrument were: 7.03 to 7.46 (basement calibration), 7.05 to 7.45
(bedroom calibration), and 7.16 to 7.45 (garage calibration). The measured pH of all samples
within the study was between 1.4% lower and 4.6% higher than the pH of the groundwater
measured at the laboratory. Figures comparing all pHs at each temperature zone are included
as Figures 1, 4 and 7.
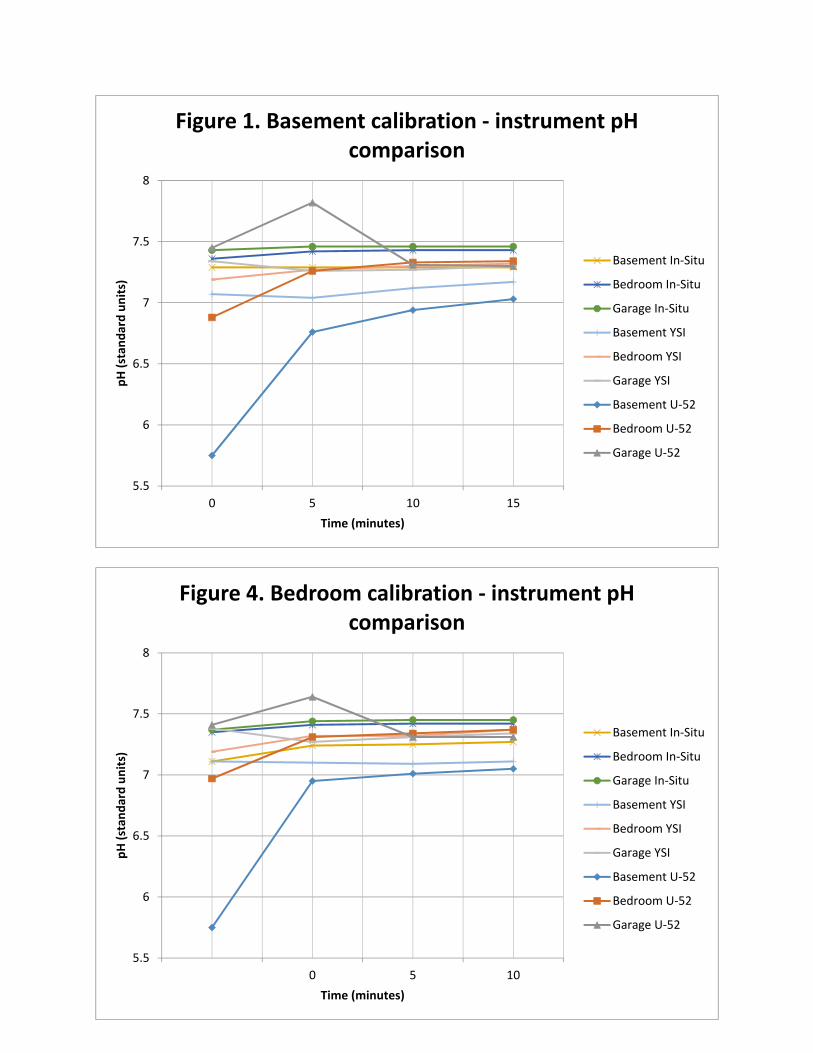
When the instruments were calibrated by the basement temperature zone calibration fluids
and they measured the basement temperature zone sample, the final pH results were 7.03,
7.13, and 7.29. When these instruments measured the pH of samples from the other two
temperature zones the final results were between 7.30 and 7.46.
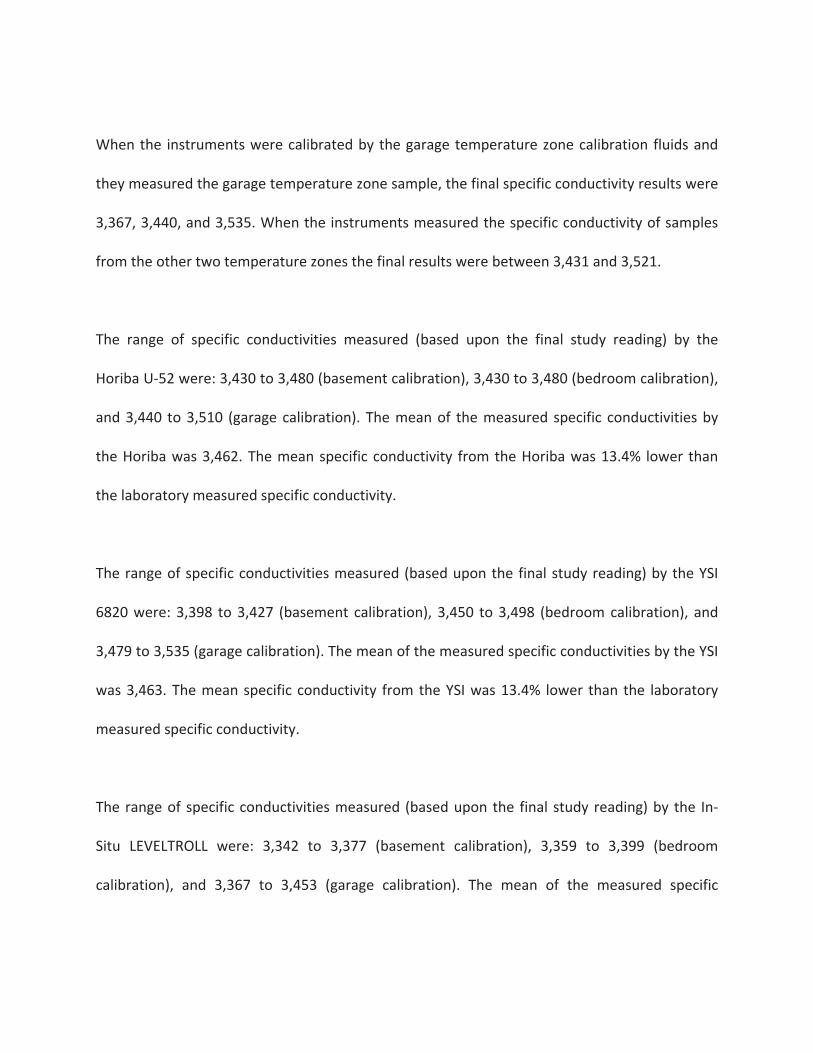
When the instruments were calibrated by the bedroom temperature zone calibration fluids and
they measured the bedroom temperature zone sample, the final pH results were 7.37, 7.37,
and 7.42. When these instruments measured the pH of samples from the other two
temperature zones the final results were between 7.05 and 7.45.
5.5
6
6.5
7
7.5
8
0 5 10 15
pH (stan
dard units)
Time (minutes)
Figure 1. Basement calibration ‐ instrument pH comparison
Basement In‐Situ
Bedroom In‐Situ
Garage In‐Situ
Basement YSI
Bedroom YSI
Garage YSI
Basement U‐52
Bedroom U‐52
Garage U‐52
5.5
6
6.5
7
7.5
8
0 5 10
pH (stan
dard units)
Time (minutes)
Figure 4. Bedroom calibration ‐ instrument pH comparison
Basement In‐Situ
Bedroom In‐Situ
Garage In‐Situ
Basement YSI
Bedroom YSI
Garage YSI
Basement U‐52
Bedroom U‐52
Garage U‐52

When the instruments were calibrated by the garage temperature zone calibration fluids and
they measured the garage temperature zone sample, the final pH results were 7.33, 7.38, and
7.43. When the instruments measured the pH of samples from the other two temperature
zones the final results were between 7.16 and 7.45.
The range of pHs measured (based upon the final study reading) by the Horiba U‐52 were: 7.03
to 7.34 (basement calibration), 7.05 to 7.37 (bedroom calibration), and 7.16 to 7.38 (garage
calibration). The mean of the measured pHs by the Horiba was 7.25. The mean pH from the
Horiba was 1.7% higher than the laboratory measured pH.
5.5
6
6.5
7
7.5
8
0 5 10
pH (stan
dard units)
Time (minutes)
Figure 7. Garage calibration ‐ instrument pH comparison
Basement In‐Situ
Bedroom In‐Situ
Garage In‐Situ
Basement YSI
Bedroom YSI
Garage YSI
Basement U‐52
Bedroom U‐52
Garage U‐52

The range of pHs measured (based upon the final study reading) by the YSI 6820 were: 7.17 to
7.32 (basement calibration), 7.11 to 7.37 (bedroom calibration), and 7.32 to 7.45 (garage
calibration). The mean of the measured pHs by the YSI was 7.30. The mean pH from the YSI was
2.45% higher than the laboratory measured pH.
The range of pHs measured (based upon the final study reading) by the In‐Situ LEVELTROLL
were: 7.29 to 7.46 (basement calibration), 7.11 to 7.37 (bedroom calibration), and 7.26 to 7.43
(garage calibration). The mean of the measured pHs by the In‐Situ was 7.34. The mean pH from
the In‐Situ was 3.0% higher than the laboratory measured pH.
The measured specific conductivity from IAL of the groundwater sample was 4,000 µS/cm. The
range of specific conductivities (based upon the final study reading) from each temperature
zone calibration, sample temperature zone, and instrument were: 3,342 to 3,480 (basement
calibration), 3,359 to 3,498 (bedroom calibration), and 3,367 to 3,535 (garage calibration). The
measured specific conductivity of all samples within the study was between 11.6% and 16.5%
lower than the specific conductivity of the groundwater measured at the laboratory. Figures
comparing all specific conductivities at each temperature zone are included as Figures 2, 5, and
8.

3,225.00
3,275.00
3,325.00
3,375.00
3,425.00
3,475.00
3,525.00
0 5 10 15
Specific conductivity (µS/cm
)
Time (minutes)
Figure 2. Basement calibration ‐ instrument specific conductivity comparison
Basement In‐Situ
Bedroom In‐Situ
Garage In‐Situ
Basement YSI
Bedroom YSI
Garage YSI
Basement U‐52
Bedroom U‐52
Garage U‐52
3,200.00
3,250.00
3,300.00
3,350.00
3,400.00
3,450.00
3,500.00
3,550.00
0 5 10
Specific conductivity (µS/cm
)
Time (minutes)
Figure 5. Bedroom calibration ‐ instrument specific conductivity comparison
Basement In‐Situ
Bedroom In‐Situ
Garage In‐Situ
Basement YSI
Bedroom YSI
Garage YSI
Basement U‐52
Bedroom U‐52
Garage U‐52

When the instruments were calibrated by the basement temperature zone calibration fluids
and they measured the basement temperature zone sample, the final specific conductivity
results were 3,348, 3,402, and 3,430. When these instruments measured the specific
conductivity of samples from the other two temperature zones the final results were between
3,342 and 3,480.
When the instruments were calibrated by the bedroom temperature zone calibration fluids and
they measured the bedroom temperature zone sample, the final specific conductivity results
were 3,399, 3,450, and 3,498. When these instruments measured the specific conductivity of
samples from the other two temperature zones the final results were between 3,359 and 3,480.
3,300.00
3,350.00
3,400.00
3,450.00
3,500.00
3,550.00
0 5 10
Specific conductivity (µS/cm
)
Time (minutes)
Figure 8. Garage calibration ‐ instrument specific conductivity comparison
Basement In‐Situ
Bedroom In‐Situ
Garage In‐Situ
Basement YSI
Bedroom YSI
Garage YSI
Basement U‐52
Bedroom U‐52
Garage U‐52
When the instruments were calibrated by the garage temperature zone calibration fluids and
they measured the garage temperature zone sample, the final specific conductivity results were
3,367, 3,440, and 3,535. When the instruments measured the specific conductivity of samples
from the other two temperature zones the final results were between 3,431 and 3,521.
The range of specific conductivities measured (based upon the final study reading) by the
Horiba U‐52 were: 3,430 to 3,480 (basement calibration), 3,430 to 3,480 (bedroom calibration),
and 3,440 to 3,510 (garage calibration). The mean of the measured specific conductivities by
the Horiba was 3,462. The mean specific conductivity from the Horiba was 13.4% lower than
the laboratory measured specific conductivity.
The range of specific conductivities measured (based upon the final study reading) by the YSI
6820 were: 3,398 to 3,427 (basement calibration), 3,450 to 3,498 (bedroom calibration), and
3,479 to 3,535 (garage calibration). The mean of the measured specific conductivities by the YSI
was 3,463. The mean specific conductivity from the YSI was 13.4% lower than the laboratory
measured specific conductivity.
The range of specific conductivities measured (based upon the final study reading) by the In‐
Situ LEVELTROLL were: 3,342 to 3,377 (basement calibration), 3,359 to 3,399 (bedroom
calibration), and 3,367 to 3,453 (garage calibration). The mean of the measured specific

conductivities by the In‐Situ was 3,385. The mean specific conductivity from the In‐Situ was
15.4% lower than the laboratory measured specific conductivity.
The measured redox potential from IAL of the groundwater sample was 222 mV. The range of
redox potentials (based upon the final study reading) from each temperature zone calibration,
sample temperature zone, and instrument were: 236 to 279 (basement calibration), 239 to 297
(bedroom calibration), and 234 to 297 (garage calibration). The measured redox potential of all
samples within the study was between 5.4% and 33.8% higher than the redox potential of the
groundwater measured at the laboratory. Figures comparing all redox potentials at each
temperature zone are included as Figures 3, 6, and 9.
210
230
250
270
290
310
330
0 5 10 15
Redox potential (mV)
Time (minutes)
Figure 3. Basement calibration ‐ instrument redox potential comparison
Basement In‐Situ
Bedroom In‐Situ
Garage In‐Situ
Basement U‐52
Bedroom U‐52
Garage U‐52
Basement YSI
Bedroom YSI
Garage YSI

210
230
250
270
290
310
330
350
370
0 5 10
Redox potential (mV)
Time (minutes)
Figure 6. Bedroom calibration ‐ instrument redox potential comparison
Basement In‐Situ
Bedroom In‐Situ
Garage In‐Situ
Basement U‐52
Bedroom U‐52
Garage U‐52
Basement YSI
Bedroom YSI
Garage YSI
210
260
310
360
410
460
0 5 10
Redox potential (mV)
Time (minutes)
Figure 9. Garage calibration ‐ instrument redox potential comparison
Basement In‐Situ
Bedroom In‐Situ
Garage In‐Situ
Basement U‐52
Bedroom U‐52
Garage U‐52
Basemen YSI
Bedroom YSI
Garage YSI

When the instruments were calibrated by the basement temperature zone calibration fluids
and they measured the basement temperature zone sample, the final redox potential results
were 239, 249, and 279. When these instruments measured the redox potential of samples
from the other two temperature zones the final results were between 236 and 274.
When the instruments were calibrated by the bedroom temperature zone calibration fluids and
they measured the bedroom temperature zone sample, the final redox potential results were
238, 245, and 279. When these instruments measured the redox potential of samples from the
other two temperature zones the final results were between 239 and 297.
When the instruments were calibrated by the garage temperature zone calibration fluids and
they measured the garage temperature zone sample, the final redox potential results were 239,
276, and 289. When the instruments measured the redox potential of samples from the other
two temperature zones the final results were between 234 and 297.
The range of redox potentials measured (based upon the final study reading) by the Horiba U‐
52 were: 238 to 239 (basement calibration), 239 to 274 (bedroom calibration), and 234 to 265
(garage calibration). The mean of the measured redox potentials by the Horiba was 245. The
mean redox potential from the Horiba was 10.4% higher than the laboratory measured redox
potential.

The range of redox potentials measured (based upon the final study reading) by the YSI 6820
were: 236 to 255 (basement calibration), 245 to 297 (bedroom calibration), and 250 to 276
(garage calibration). The mean of the measured redox potentials by the YSI was 256. The mean
redox potential from the YSI was 15.4% higher than the laboratory measured redox potential.
The range of redox potentials measured (based upon the final study reading) by the In‐Situ
LEVELTROLL were: 269 to 279 (basement calibration), 275 to 289 (bedroom calibration), 281 to
297 (garage calibration). The mean of the measured redox potentials by the In‐Situ was 281.
The mean redox potential from the In‐Situ was 26.7% higher than the laboratory measured
redox potential.
The measured dissolved oxygen from IAL of the groundwater sample was 8.80 mg/L. The range
of dissolved oxygen (based upon the final study reading) from each temperature zone
calibration, sample temperature zone, and instrument were: 5.55 to 11.64 (basement
calibration), 5.64 to 11.66 (bedroom calibration), and 5.55 to 11.64 (garage calibration). The
measured dissolved oxygen of all samples within the study was between 63% lower and 32.3%
higher than the dissolved oxygen of the groundwater measured at the laboratory.
When the instruments were calibrated by the basement temperature zone calibration fluids
and they measured the basement temperature zone sample, the final dissolved oxygen results
were 5.55, 8.63, and 9.52. When these instruments measured the dissolved oxygen of samples
from the other two temperature zones the final results were between 6.01 and 11.64.

When the instruments were calibrated by the bedroom temperature zone calibration fluids and
they measured the bedroom temperature zone sample, the final dissolved oxygen results were
7.22, 8.23, and 9.87. When these instruments measured the dissolved oxygen of samples from
the other two temperature zones the final results were between 5.64 and 11.66.
When the instruments were calibrated by the garage temperature zone calibration fluids and
they measured the garage temperature zone sample, the final dissolved oxygen results were
6.33, 9.31, and 11.81. When the instruments measured the dissolved oxygen of samples from
the other two temperature zones the final results were between 5.35 and 9.75.
The range of dissolved oxygen measured (based upon the final study reading) by the Horiba U‐
52 were: 5.55 to 7.36 (basement calibration), 5.64 to 7.22 (bedroom calibration), and 5.35 to
8.53 (garage calibration). The mean of the measured dissolved oxygen by the Horiba was 6.57.
The mean dissolved oxygen from the Horiba was 25.3% lower than the laboratory measured
dissolved oxygen.
The range of dissolved oxygen measured (based upon the final study reading) by the YSI 6820
were: 9.52 to 11.43 (basement calibration), 9.41 to 11.66 (bedroom calibration), and 9.25 to
11.81 (garage calibration). The mean of the measured dissolved oxygen by the YSI was 10.30.
The mean dissolved oxygen from the YSI was 17.13% higher than the laboratory measured
dissolved oxygen.

The range of dissolved oxygen measured (based upon the final study reading) by the In‐Situ
LEVELTROLL were: 8.63 to 11.64 (basement calibration), 8.13 to 10.31 (bedroom calibration),
7.78 to 9.31 (garage calibration). The mean of the measured dissolved oxygen by the In‐Situ
was 9.07. The mean dissolved oxygen from the In‐Situ was 3.09% higher than the laboratory
measured dissolved oxygen.
The measured turbidity from IAL of the groundwater sample was 24.6 NTU. The range of
turbidity (based upon the final study reading) from each temperature zone calibration, sample
temperature zone, and instrument were: 49.1 to 800.0 (basement calibration), 178.2 to 800.0
(bedroom calibration), and 165.5 to 941.5 (garage calibration). The measured turbidity of all
samples within the study was between 99.59% and 3,727.24% higher than the turbidity of the
groundwater measured at the laboratory.
When the instruments were calibrated by the basement temperature zone calibration fluids
and they measured the basement temperature zone sample, the final turbidity results were
49.1, 140.0, and 193.5. When these instruments measured the turbidity of samples from the
other two temperature zones the final results were between 194.6 and 800.0.
When the instruments were calibrated by the bedroom temperature zone calibration fluids and
they measured the bedroom temperature zone sample, the final turbidity results were 178.2,
267.0, and 512.1. When these instruments measured the turbidity of samples from the other
two temperature zones the final results were between 197.1 and 800.0.
When the instruments were calibrated by the garage temperature zone calibration fluids and
they measured the garage temperature zone sample, the final turbidity results were 694.3,
791.0, and 941.5. When the instruments measured the turbidity of samples from the other two
temperature zones the final results were between 165.5 and 585.0.
The range of turbidity measured (based upon the final study reading) by the Horiba U‐52 were:
140.0 to 800.0 (basement calibration), 199.0 to 800.0 (bedroom calibration), and 205.0 to 791.0
(garage calibration). The mean of the measured turbidity by the Horiba was 414.2. The mean
turbidity from the Horiba was 1,583.8% higher than the laboratory measured turbidity.
The range of turbidity measured (based upon the final study reading) by the YSI 6820 were:
193.5 to 533.7 (basement calibration), 197.1 to 589.3 (bedroom calibration), and 165.5 to 941.5
(garage calibration). The mean of the measured turbidity by the YSI was 427.0. The mean
turbidity from the YSI was 1,635.8% higher than the laboratory measured turbidity.
The range of turbidity measured (based upon the final study reading) by the In‐Situ LEVELTROLL
were: 194.6 to 630.8 (basement calibration), 178.2 to 790.1 (bedroom calibration), 165.5 to
941.5 (garage calibration). The mean of the measured turbidity by the In‐Situ was 416.2. The
mean turbidity from the In‐Situ was 26.7% higher than the laboratory measured turbidity.
8. Discussion
This study focused on temperature changes in relation to groundwater quality instrument
calibration fluids and the groundwater samples that are measured following calibration. While
six groundwater quality parameters (pH, specific conductivity, redox potential, dissolved
oxygen, turbidity, and temperature) were measured during instrument calibration and the
study itself, only three groundwater quality parameters (pH, specific conductivity, and redox
potential) may be used to evaluate if temperature conditions had an effect on the quality of the
data collected. These parameters are the most likely of the parameters measured to have
remained unchanged from the time of collection to the study time frame. The other three
groundwater quality parameters (dissolved oxygen, turbidity, and temperature) all may have
been compromised in various ways prior to their analysis for the study.
There were a wide range of measured values for all parameters during the study, but most of
these readings occurred at the zero minute sampling time. This initial sampling point may not
necessarily reflect the true reading for that groundwater sample as the groundwater quality
instruments have lag time in between when the probes enter the fluid and when the
measurements settle. Also, these initial reading were subject to the largest amount of turbidity
due to sample mixing. Turbidity measurements of 0 or 800 in certain instruments (such as the
Horiba) reflect a parameter value that exceeds the probe’s measurable concentration range.
The level of dissolved oxygen in the collected groundwater sample changed measurably from
the time of collection, to the time of laboratory analysis, to its eventual usage in the study.
Samples were stored in 500 mL plastic containers, which are not air‐tight storage vessels. Thus
oxygen levels within the containers likely equalized with storage environments and may not
correspond to the concentration measured by IAL.
While the total volume of groundwater collected was mixed and distributed to storage
containers evenly, the turbidity of the groundwater in each container may not have been equal.
This may be due to the amount of material in or not in solution in the original sample, or from
the material already in each container from the sampling event. Sampling containers were
thoroughly mixed prior to measurement with the groundwater quality instruments, but that
might not have been the procedure completed by the lab. Also, there was some lag time in
between when a sample was mixed and when it was placed into a sampling vessel for
measurement. A quantity of material in the sample may have come out of solution prior to
measurement, thus disrupting the results.
The temperature of the groundwater sample was not measured by IAL as the parameter may
have easily varied due to storage conditions, transport conditions, and analysis conditions. The
temperature of the calibration fluids and the groundwater samples at each temperature zone
were monitored using a properly calibrated temperature sensor, but this was completed to
ensure that each was at similar temperatures prior to usage. There may have been some
variation between the calibration fluids and groundwater samples due to inherent lag time that

occurred in between calibration and sampling. The fluids and/or samples may have cooled or
warmed (depending on their initial temperature) due to the temperature of the sampling area
(which was kept consistent for the entirety of the study).
In terms of measured pH, there was a little difference between the readings measured by IAL
and those measured at various temperatures by the groundwater quality instruments in the
study. The lowest temperature calibration fluids reflected neither the lowest or highest pH
values, but the highest temperature calibration fluids did exhibit the lowest pH values. The
measured pH values from samples at the same temperature as the calibration fluids used to
calibrate the groundwater quality instruments were not more accurate than those measured in
samples from other temperature zones. For this study, there did not seem to be a connection
between calibration fluid temperature and measured pH. In theory, there should be a direct
correlation between calibration fluid temperature and measured pH.
Out of the three groundwater quality instruments used in this study, the Horiba U‐52 measured
pH more consistent with the value obtained by IAL. The YSI and In‐Situ instruments had mean
pH values higher in percentage above the laboratory‐obtained value than the Horiba, but not
by more than a few percent. This result may be due to: differences in pH probe quality,
calibration fluid quality, slight pH variations between the 500 mL sample containers, turbidity
variations between containers, or the Horiba may better compensate for variations in
calibration fluid temperature.
In terms of measured specific conductivity, there was over a 10 percent difference between the
concentration measured by IAL and those measured at various temperatures by the
groundwater quality instruments in the study. Neither the lowest or highest temperature
calibration fluids reflected extreme specific conductivity values in the study. The measured
specific conductivity values from samples at the same temperature as the calibration fluids
used to calibrate the groundwater quality instruments were not more accurate than those
measured in samples from other temperature zones. For this study, there did not seem to be a
connection between calibration fluid temperature and measured specific conductivity. In
theory, there should be a direct correlation between calibration fluid temperature and
measured specific conductivity.
Out of the three groundwater quality instruments used in this study, the Horiba U‐52 and YSI
6820 measured specific conductivity more consistent with the value obtained by IAL. The In‐
Situ instrument had a mean specific conductivity value higher in percentage above the
laboratory‐obtained value than the other two groundwater quality instruments, but not by
more than a few percent. This result may be due to: differences in specific conductivity probe
quality, calibration fluid quality, slight specific conductivity variations between the 500 mL
sample containers, turbidity variations between containers, or the Horiba/YSI may better
compensate for variations in calibration fluid temperature.
In terms of measured redox potential, there was over between a 5.4 and 33.8 percent
difference between the concentration measured by IAL and those measured at various

temperatures by the groundwater quality instruments in the study. Neither the lowest or
highest temperature calibration fluids reflected extreme redox potential values in the study.
The measured redox potential values from samples at the same temperature as the calibration
fluids used to calibrate the groundwater quality instruments were not more accurate than
those measured in samples from other temperature zones. For this study, there did not seem
to be a connection between calibration fluid temperature and measured redox potential.
Out of the three groundwater quality instruments used in this study, the Horiba U‐52 measured
redox potential more consistent with the value obtained by IAL. The YSI and In‐Situ instruments
had mean redox potential values higher in percentage above the laboratory‐obtained value
than the other two groundwater quality instruments. The YSI had an approximate five percent
higher mean than the Horiba. The In‐Situ instrument had a mean 15 percent greater than the
Horiba value. This result may be due to: differences in redox potential probe quality, calibration
fluid quality, slight redox potential variations between the 500 mL sample containers, turbidity
variations between containers, or the Horiba may better compensate for variations in
calibration fluid temperature.
9. Conclusions
The results from this study show that there is some variation in measured groundwater quality
parameters when instrumentation is calibrated at different temperatures, but the differences
are not overwhelming (besides those variations addressed in the adobe section for the
dissolved oxygen, temperature, and turbidity parameters). It is possible that the quality of
groundwater quality instruments has improved to a point where their internal computers
effectively compensate for these temperature differences. While the NJDEP does specify that
groundwater quality instruments must be calibrated in the field with fluids of the same
temperature as the groundwater to be measured, this study shows that this requirement may
not be critical to project success. Accounting for differences in groundwater quality
instrumentation, differences in temperature between calibration fluids and sampled
groundwater, quality of field personnel training, variances in field calibration and/or sampling
procedures, etc. there might not be a need to maintain this requirement as stated. This
conclusion does not extend to the dissolved oxygen and turbidity parameters, as their varied
results within the study should not be used for interpretation.
The parameters measured in this study are essential in making remediation decisions for a
project, but the discrepancy between the true parameter values and those seemingly altered
due to the above may be negligible to the point of becoming a nonfactor. For example, if the
results of this study showed that the true pH of a groundwater sample to be acidic but the
measured value classified the sample as alkaline in nature then the temperature different
would be a quantified problem. Instead, this study displayed minimal differences between true
and measured groundwater quality parameter values. If there is little difference in values
obtained no matter the temperature of the calibration fluids (or groundwater temperature),
then it may be possible to save an effort by calibrating groundwater quality instruments in the
office prior to going out into the field. This would save time, money, and effort for both the
field personnel and the environmental company in general.

A secondary conclusion of this study is that the Horiba U‐52 handled the temperature changes
with its calibration fluid better than the other two instruments in the study. The Horiba
consistently measured each parameter at a value closer to the laboratory‐obtained values. In
comparison with the YSI, this result may be due to the Horiba only having one calibration fluid
(containing all parameters to be calibrated) varying temperature whereas the YSI has separate
calibration fluids for each parameter. In comparison with the In‐Situ, this result may be due to a
quality difference between the instrument probes. As YSI‐brand groundwater quality
instruments have a reputation in the environmental industry as being the most accurate and
reliable, the results of this study stand as a contradiction to that assumption.
10. Acknowledgment
This study was generously supported by Integrated Analytical Laboratories (Randolph, NJ), US
Environmental (Hamilton, NJ), colleagues at Peak Environmental and Shaw Environmental, and
the University of Florida Soil and Water Science Department.
11. References
References
Nielsen, D. M. (2005). Practical Handbook of Environmental Site Characterization and Ground‐
Water Monitoring. Boca Raton: CRC Press.

Nielsen, D. M., & Nielsen, G. (2007). The Essential Handbook of Ground‐Water Sampling. Boca
Raton: CRC Press.
NJDEP. (2005, August). Field Sampling Procedures Manual. Retrieved from New Jersey
Department of Environmental Protection: Site Remediation Program:
http://www.nj.gov/dep/srp/guidance/fspm/pdf/fsmp2005.pdf
NJDEP. (2006, November 22). N.J.A.C. 7:18 REGULATIONS GOVERNING THE CERTIFICATION OF
LABORATORIES AND ENVIRONMENTAL MEASUREMENTS. Retrieved from New Jersey
Department of Environmental Protection: Departmental Rules:
http://www.nj.gov/dep/rules/rules/njac7_18.pdf

Appendix 1
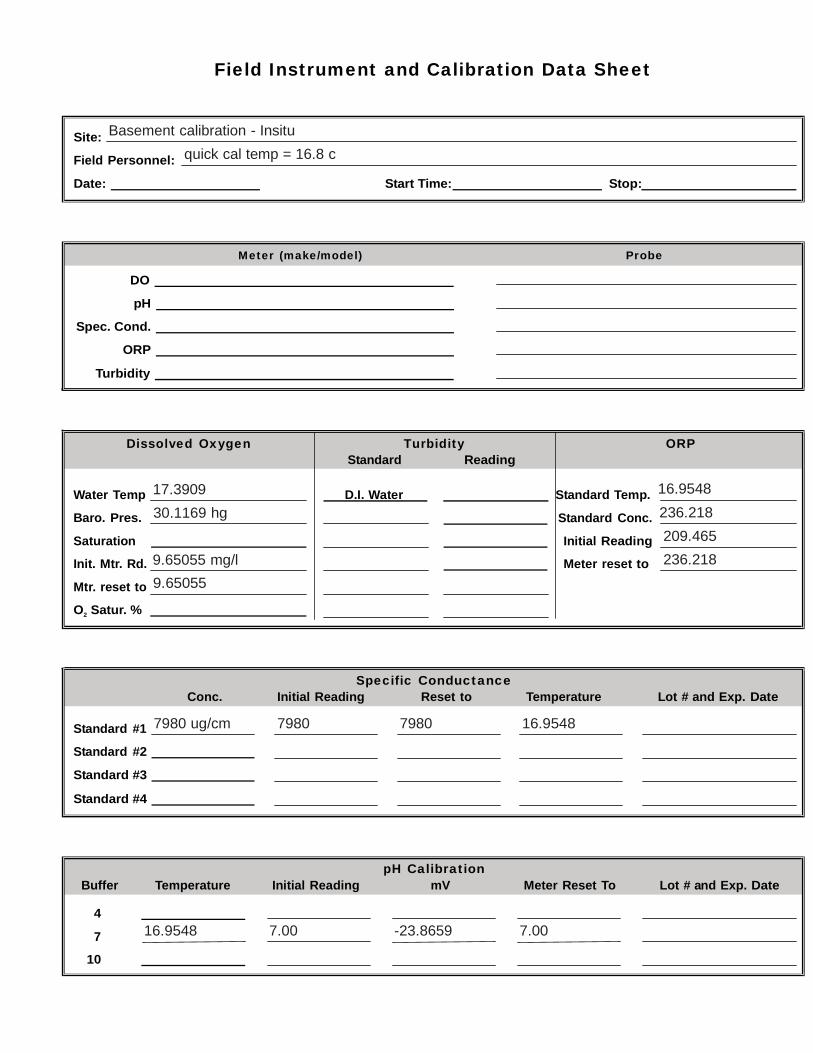
Field Sampling Procedures Manual Chapter 6E – Page 110 of 188
Field Instrument and Calibration Data Sheet
Site: Basement calibration - Insitu
Field Personnel: quick cal temp = 16.8 c
Date: Start Time: Stop:
Meter (make/model) Probe
DO
pH
Spec. Cond.
ORP
Turbidity
Dissolved Oxygen Turbidity ORP Standard Reading
Water Temp 17.3909 D.I. Water Standard Temp. 16.9548
Baro. Pres. 30.1169 hg Standard Conc. 236.218
Saturation Initial Reading 209.465
Init. Mtr. Rd. 9.65055 mg/l
Mtr. reset to 9.65055
O2 Satur. %
Meter reset to 236.218
Specific Conductance Conc. Initial Reading Reset to Temperature Lot # and Exp. Date
Standard #1 7980 ug/cm 7980 7980 16.9548
Standard #2
Standard #3
Standard #4
pH Calibration Buffer Temperature Initial Reading mV Meter Reset To Lot # and Exp. Date
4
7 16.9548 7.00 -23.8659 7.00
10

Field Sampling Procedures Manual Chapter 6E – Page 110 of 188
4
7
10
Field Instrument and Calibration Data Sheet
Site: Basement calibration - Horiba U-52
Field Personnel: autocal temp = 16.9 c
Date: Start Time: Stop:
Meter (make/model) Probe
DO
pH
Spec. Cond.
ORP
Turbidity
Dissolved Oxygen Turbidity ORP Standard Reading
Water Temp D.I. Water Standard Temp.
Baro. Pres. ac 0.0
Standard Conc.
Saturation Initial Reading
Init. Mtr. Rd. 10.52
Mtr. reset to
O2 Satur. %
Meter reset to
Specific Conductance Conc. Initial Reading Reset to Temperature Lot # and Exp. Date
Standard #1 4.49 4.49
Standard #2
Standard #3
Standard #4
pH Calibration Buffer Temperature Initial Reading mV Meter Reset To Lot # and Exp. Date
3.98

Field Sampling Procedures Manual Chapter 6E – Page 110 of 188
Field Instrument and Calibration Data Sheet
Site: Basement calibration - YSI 6820
Field Personnel:
Date: Start Time: Stop:
Meter (make/model) Probe
DO
pH
Spec. Cond.
ORP
Turbidity
Dissolved Oxygen Turbidity ORP Standard Reading
Water Temp 16.9 D.I. Water 1.9 Standard Temp. 13.48
Baro. Pres. 775.5 Standard Conc. 244
Saturation Initial Reading 247.7
Init. Mtr. Rd. 10.43
Mtr. reset to 10.12
Meter reset to 244.0
O2 Satur. % 105.1
Specific Conductance Conc. Initial Reading Reset to Temperature Lot # and Exp. Date
Standard #1 1000 ug/cm 990 1000 17.06
Standard #2
Standard #3
Standard #4
pH Calibration Buffer Temperature Initial Reading mV Meter Reset To Lot # and Exp. Date
4 16.87
7 16.88
10 16.89
3.99
6.97
10.02
228.9
161.3
131.7
4.00
7.00
10.0
Field Sampling Procedures Manual Chapter 6E – Page 110 of 188
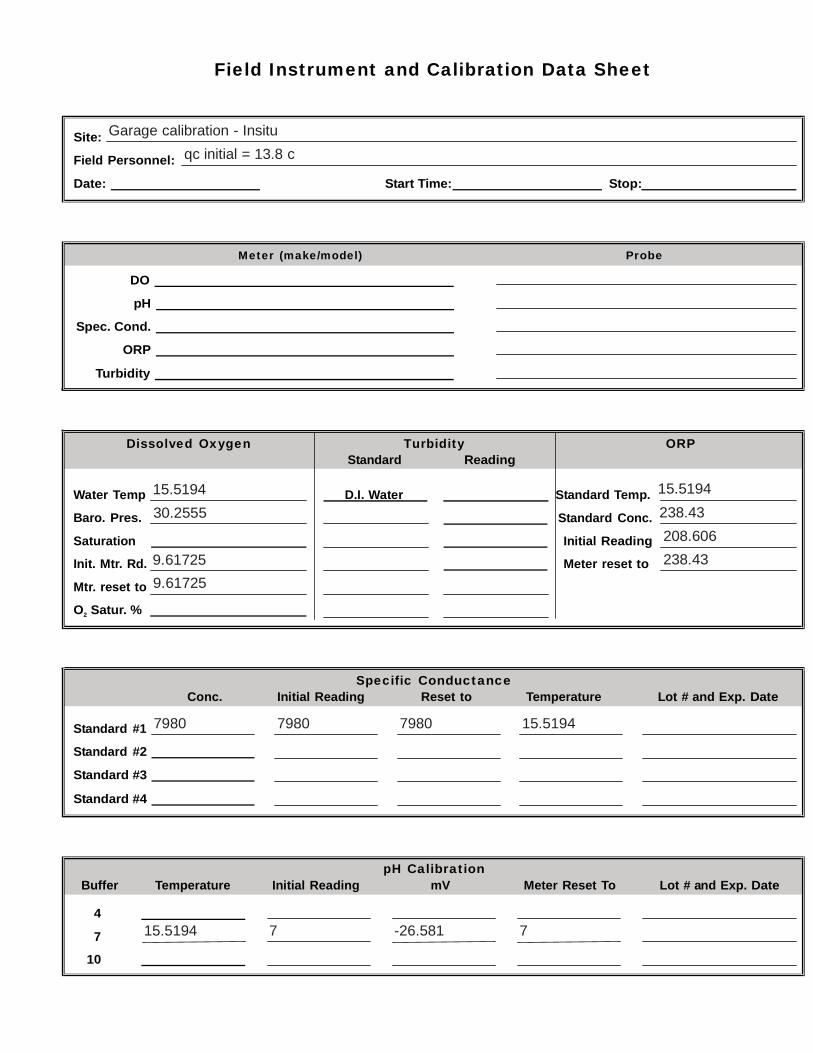
Field Instrument and Calibration Data Sheet
Site: Garage calibration - Insitu
Field Personnel: qc initial = 13.8 c
Date: Start Time: Stop:
Meter (make/model) Probe
DO
pH
Spec. Cond.
ORP
Turbidity
Dissolved Oxygen Turbidity ORP Standard Reading
Water Temp 15.5194 D.I. Water Standard Temp. 15.5194
Baro. Pres. 30.2555 Standard Conc. 238.43
Saturation Initial Reading 208.606
Init. Mtr. Rd. 9.61725
Mtr. reset to 9.61725
O2 Satur. %
Meter reset to 238.43
Specific Conductance Conc. Initial Reading Reset to Temperature Lot # and Exp. Date
Standard #1 7980 7980 7980 15.5194
Standard #2
Standard #3
Standard #4
pH Calibration Buffer Temperature Initial Reading mV Meter Reset To Lot # and Exp. Date
4
7 15.5194 7 -26.581 7
10

Field Sampling Procedures Manual Chapter 6E – Page 110 of 188
4
7
10
Field Instrument and Calibration Data Sheet
Site: Garage calibration - Horiba U-52
Field Personnel: ac initial temp = 14.3
Date: Start Time: Stop:
Meter (make/model) Probe
DO
pH
Spec. Cond.
ORP
Turbidity
Dissolved Oxygen Turbidity ORP Standard Reading
Water Temp D.I. Water Standard Temp.
Baro. Pres. 0.0
Standard Conc.
Saturation Initial Reading
Init. Mtr. Rd. 10.68
Mtr. reset to
O2 Satur. %
Meter reset to
Specific Conductance Conc. Initial Reading Reset to Temperature Lot # and Exp. Date
Standard #1
Standard #2
Standard #3
Standard #4
4.52
pH Calibration Buffer Temperature Initial Reading mV Meter Reset To Lot # and Exp. Date
3.96

Field Sampling Procedures Manual Chapter 6E – Page 110 of 188
Field Instrument and Calibration Data Sheet
Site: Garage calibration - YSI 6820
Field Personnel:
Date: Start Time: Stop:
Meter (make/model) Probe
DO
pH
Spec. Cond.
ORP
Turbidity
Dissolved Oxygen Turbidity ORP Standard Reading
Water Temp 14.71 D.I. Water 0.3 Standard Temp. 14.40
Baro. Pres. 776.7 Standard Conc. 244
Saturation Initial Reading 245.3
Init. Mtr. Rd. 10.19
Mtr. reset to 10.06
Meter reset to 244
O2 Satur. % 103.4
Specific Conductance Conc. Initial Reading Reset to Temperature Lot # and Exp. Date
Standard #1 1000 953 1000 15.06
Standard #2
Standard #3
Standard #4
pH Calibration Buffer Temperature Initial Reading mV Meter Reset To Lot # and Exp. Date
4 15.21
7 14.65
10 15.41
4.32
6.99
10.04
292.0
240.1
198.8
4.00
7.00
10.01

Appendix 2

RL = REPORTING L
Lab ID: 0176Client ID: KRPercent Moist
Parameter
Specific CondpH/CorrosivitTotal DissolvTurbidity Oxidation-Re
IMIT
9-001 RPS-1 ture: 100
ductance ty
ved Oxygen
eduction Potential
Result RL
4000 2.00 7.13 NA 8800 100 24.6 0.100 222 NA
ANALY
Peak
Wo
PrLab Ca
MDL = ME
G
MDL Mat
2.00 Aqueous-NA Aqu100 Aqu
0.080 AquNA Aqu
TICAL DATA REPOfor
k Environmental Inc.74 Main Street
2nd Floor oodbridge, NJ 07095
roject Name: KRPS ase Number: E13-0176
THOD DETECTION L
General Analytical
Date Time
trix-Units
-µS/cm @ 25°C ueous-SU
ueous-µg/L eous-NTU ueous-mV
T
RT
69
LIMIT
Sampled: 2/28/2013 Sampled: 12:00
hese data have been rev
_____________Michael H.
Laborator
Date Analy
3/4/2013 113/4/2013 113/1/2013 163/1/2013 173/4/2013 11
viewed and accepted by
______________ Leftin, Ph.D
ry Director
yzed
1:00 1:10 6:00 7:00 1:45
y: