Kirsten s ram 080219
84
LUNG EMPHYSEMA & CARDIAC FUNCTION KIRSTEN JÖRGENSEN 2008
Transcript of Kirsten s ram 080219

LUNG EMPHYSEMA
&
CARDIAC FUNCTION
KIRSTEN JÖRGENSEN
2008

LUNG EMPHYSEMA & CARDIAC FUNCTION
Kirsten Jörgensen Department of Anaesthesiology and Intensive Care Medicine Institute of Clinical Sciences, The Sahlgrenska Academy, Göteborg University, Sweden ISBN 978-91-628-7404-9 [email protected] Papers I to IV are reprinted with permission of the publishers Front cover: Australian Colours Printed by Intellecta Docusys AB Göteborg, Sweden 2008

To Søren, Anna and Niels

LUNG EMPHYSEMA & CARDIAC FUNCTION
Kirsten Jörgensen Department of Anaesthesiology and Intensive Care Medicine,
Institute of Clinical Sciences, The Sahlgrenska Academy, Göteborg University, Sweden ABSTRACT Patients with severe lung emphysema have poor quality of life because of impaired lung function and reduced exercise tolerance. Concomitant heart disease in severe emphysema is well recognised. The prevailing view is that mainly the right side of the heart is involved, while the issue of left ventricular (LV) involvement is less studied. The aim of this thesis was to evaluate cardiac performance and dimensions in patients with severe emphysema, using pulmonary artery thermodilution technique, transoesophageal echocardiography and magnetic resonance imaging.
The main findings were that patients with severe emphysema have impaired cardiac performance as reflected in subnormal values of stroke volume and cardiac output compared with patients/volunteers with normal lung function. This impaired cardiac performance is caused by inadequate diastolic filling (decreased preload) of the right and left ventricle. Myocardial contractility is not affected, but the left ventricle is hypovolemic and operates on a steeper portion of the LV function curve.
One possible explanation for the decreased biventricular preload is a low intrathoracic blood volume caused by the hyperinflated lungs. In patients with severe emphysema, lung volume reduction surgery improves LV end-diastolic dimensions and filling and thereby performance, which at least partly could explain the improved exercise tolerance seen after the operation. Levosimendan has combined inotropic and vasodilatory effects and is used in the treatment of severe heart failure. The effect on diastolic function in humans is not entirely understood. Therefore, the aim was to evaluate whether levosimendan has lusitropic effect in patients with diastolic dysfunction, using pulmonary artery thermodilution technique and transoesophageal echocardiography. The main finding was that levosimendan shortens isovolumic relaxation time and improves LV early filling.
In conclusion, patients with severe emphysema have compromised cardiac performance as reflected in impaired LV filling and low stroke volume. The decreased ventricular preload is explained by a low intrathoracic blood volume most likely caused by the hyperinflated lungs. Lung volume reduction surgery, improves LV function. Levosimendan exerts a direct positive lusitropic effect in patients with diastolic dysfunction.
Key words: Emphysema; hemodynamics; ventricular end-diastolic volumes; lung volume reduction; ventricular function; transoesophageal echocardiography; magnetic resonance imaging; diastole; simendan; hypertrophy. ISBN 978-91-628-7404-9 Göteborg 2008

V
LIST OF PAPERS
This thesis is based on the following papers, which will be referred to in the text by their
Roman numerals:
I. Kirsten Jörgensen, Erik Houltz, Ulla Westfelt, Folke Nilsson, Henrik Scherstén and
Sven-Erik Ricksten. Effects of Lung Volume Reduction Surgery on Left
Ventricular Diastolic Filling and Dimensions in Patients With Severe Emphysema.
Chest 2003; 124 (5): p 1883-70.
II. Kirsten Jörgensen, Erik Houltz, Ulla Westfelt, Sven-Erik Ricksten. Left
Ventricular Performance and Dimensions in Patients with Severe Emphysema.
Anesth Analg 2007; 104: 887-892.
III. Kirsten Jörgensen, Markus F Müller, Jacqueline Nel, Richard N Upton, Erik
Houltz, Sven-Erik Ricksten. Reduced Intrathoracic Blood Volume and Left and
Right Ventricular Dimensions in Patients With Severe Emphysema: An MRI
Study. Chest 2007; 131: 1050-1057.
IV. Kirsten Jörgensen, Odd Bech-Hanssen, Erik Houltz, and Sven-Erik Ricksten.
Effects of Levosimendan on Left Ventricular Relaxation and Early Filling at
Maintained Preload and Afterload Conditions After Aortic Valve Replacement for
Aortic Stenosis. Circulation. 2008; 117: 1075-1081.
VI
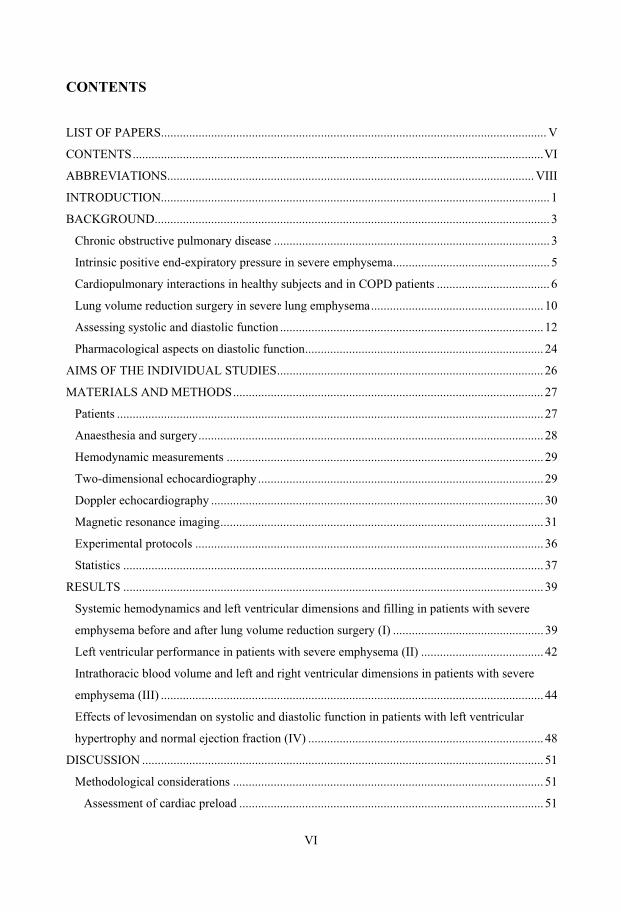
CONTENTS
LIST OF PAPERS........................................................................................................................... V
CONTENTS...................................................................................................................................VI
ABBREVIATIONS..................................................................................................................... VIII
INTRODUCTION............................................................................................................................ 1
BACKGROUND.............................................................................................................................. 3
Chronic obstructive pulmonary disease ........................................................................................ 3
Intrinsic positive end-expiratory pressure in severe emphysema.................................................. 5
Cardiopulmonary interactions in healthy subjects and in COPD patients .................................... 6
Lung volume reduction surgery in severe lung emphysema....................................................... 10
Assessing systolic and diastolic function .................................................................................... 12
Pharmacological aspects on diastolic function............................................................................ 24
AIMS OF THE INDIVIDUAL STUDIES..................................................................................... 26
MATERIALS AND METHODS................................................................................................... 27
Patients ........................................................................................................................................ 27
Anaesthesia and surgery.............................................................................................................. 28
Hemodynamic measurements ..................................................................................................... 29
Two-dimensional echocardiography ........................................................................................... 29
Doppler echocardiography .......................................................................................................... 30
Magnetic resonance imaging....................................................................................................... 31
Experimental protocols ............................................................................................................... 36
Statistics ...................................................................................................................................... 37
RESULTS ...................................................................................................................................... 39
Systemic hemodynamics and left ventricular dimensions and filling in patients with severe
emphysema before and after lung volume reduction surgery (I) ................................................ 39
Left ventricular performance in patients with severe emphysema (II) ....................................... 42
Intrathoracic blood volume and left and right ventricular dimensions in patients with severe
emphysema (III) .......................................................................................................................... 44
Effects of levosimendan on systolic and diastolic function in patients with left ventricular
hypertrophy and normal ejection fraction (IV) ........................................................................... 48
DISCUSSION ................................................................................................................................ 51
Methodological considerations ................................................................................................... 51
Assessment of cardiac preload ................................................................................................. 51

VII
Magnetic resonance imaging.................................................................................................... 52
Levosimendan and cardiac function......................................................................................... 53
Reduced ventricular end-diastolic dimensions in severe emphysema ........................................ 54
Impaired left ventricular performance in severe emphysema ..................................................... 54
Why are the ventricular end-diastolic dimensions decreased in emphysema? ........................... 56
Why is intrathoracic blood volume decreased in severe emphysema? ....................................... 56
Lung volume reduction surgery improves cardiac preload in severe emphysema ..................... 57
Cardiopulmonary transit time in severe emphysema .................................................................. 58
Increased sympathetic activity in severe emphysema................................................................. 58
The effects of levosimendan on left ventricular relaxation and early filling in diastolic
dysfunction .................................................................................................................................. 58
Increased contractility and intraventricular restoring forces....................................................... 59
Determinants of left ventricular relaxation ................................................................................. 59
Aortic stenosis and diastolic dysfunction.................................................................................... 60
Inotropic agents and diastolic dysfunction in aortic stenosis ...................................................... 61
CONCLUSIONS............................................................................................................................ 62
ACKNOWLEDGEMENT ............................................................................................................. 63
REFERENCES............................................................................................................................... 65
VIII
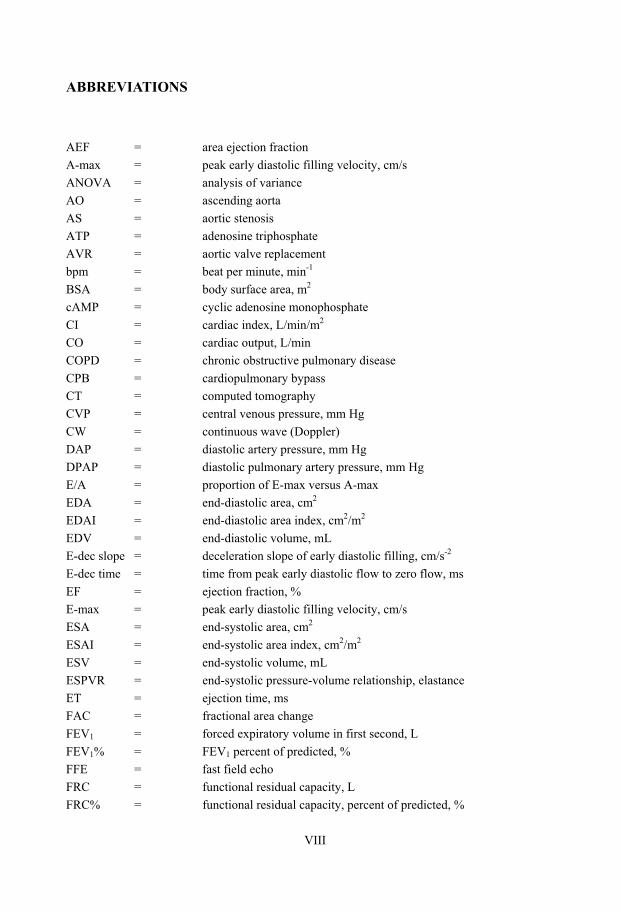
ABBREVIATIONS
AEF = area ejection fraction A-max = peak early diastolic filling velocity, cm/s ANOVA = analysis of variance AO = ascending aorta AS = aortic stenosis ATP = adenosine triphosphate AVR = aortic valve replacement bpm = beat per minute, min-1 BSA = body surface area, m2 cAMP = cyclic adenosine monophosphate CI = cardiac index, L/min/m2 CO = cardiac output, L/min COPD = chronic obstructive pulmonary disease CPB = cardiopulmonary bypass CT = computed tomography CVP = central venous pressure, mm Hg CW = continuous wave (Doppler) DAP = diastolic artery pressure, mm Hg DPAP = diastolic pulmonary artery pressure, mm Hg E/A = proportion of E-max versus A-max EDA = end-diastolic area, cm2 EDAI = end-diastolic area index, cm2/m2
EDV = end-diastolic volume, mL E-dec slope = deceleration slope of early diastolic filling, cm/s-2 E-dec time = time from peak early diastolic flow to zero flow, ms EF = ejection fraction, % E-max = peak early diastolic filling velocity, cm/s ESA = end-systolic area, cm2 ESAI = end-systolic area index, cm2/m2 ESV = end-systolic volume, mL ESPVR = end-systolic pressure-volume relationship, elastance ET = ejection time, ms FAC = fractional area change FEV1 = forced expiratory volume in first second, L FEV1% = FEV1 percent of predicted, % FFE = fast field echo FRC = functional residual capacity, L FRC% = functional residual capacity, percent of predicted, %
IX
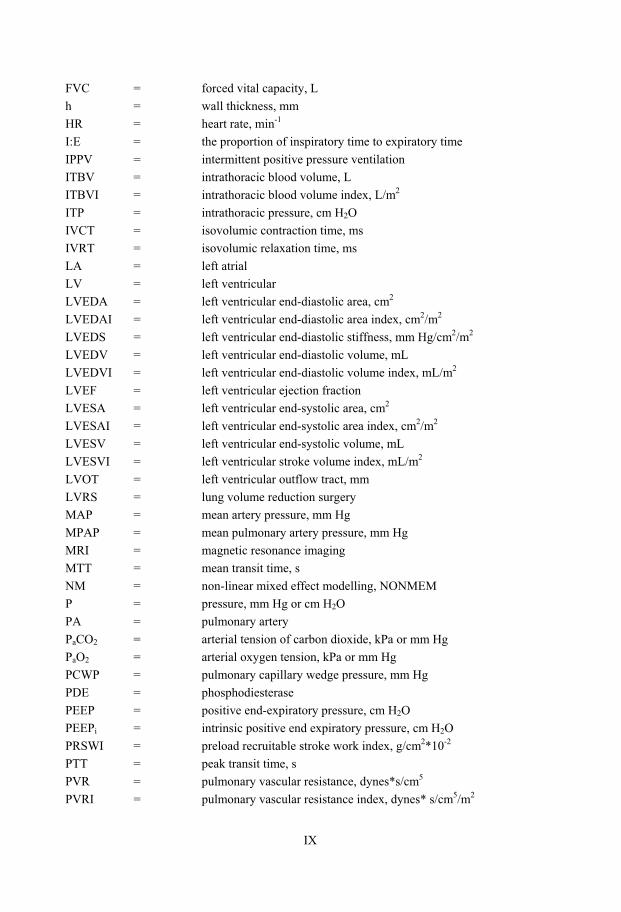
FVC = forced vital capacity, L h = wall thickness, mm HR = heart rate, min-1 I:E = the proportion of inspiratory time to expiratory time IPPV = intermittent positive pressure ventilation ITBV = intrathoracic blood volume, L ITBVI = intrathoracic blood volume index, L/m2 ITP = intrathoracic pressure, cm H2O IVCT = isovolumic contraction time, ms IVRT = isovolumic relaxation time, ms LA = left atrial LV = left ventricular LVEDA = left ventricular end-diastolic area, cm2 LVEDAI = left ventricular end-diastolic area index, cm2/m2 LVEDS = left ventricular end-diastolic stiffness, mm Hg/cm2/m2 LVEDV = left ventricular end-diastolic volume, mL LVEDVI = left ventricular end-diastolic volume index, mL/m2 LVEF = left ventricular ejection fraction LVESA = left ventricular end-systolic area, cm2 LVESAI = left ventricular end-systolic area index, cm2/m2 LVESV = left ventricular end-systolic volume, mL LVESVI = left ventricular stroke volume index, mL/m2 LVOT = left ventricular outflow tract, mm LVRS = lung volume reduction surgery MAP = mean artery pressure, mm Hg MPAP = mean pulmonary artery pressure, mm Hg MRI = magnetic resonance imaging MTT = mean transit time, s NM = non-linear mixed effect modelling, NONMEM P = pressure, mm Hg or cm H2O PA = pulmonary artery PaCO2 = arterial tension of carbon dioxide, kPa or mm Hg PaO2 = arterial oxygen tension, kPa or mm Hg PCWP = pulmonary capillary wedge pressure, mm Hg PDE = phosphodiesterase PEEP = positive end-expiratory pressure, cm H2O PEEPi = intrinsic positive end expiratory pressure, cm H2O PRSWI = preload recruitable stroke work index, g/cm2*10-2 PTT = peak transit time, s PVR = pulmonary vascular resistance, dynes*s/cm5 PVRI = pulmonary vascular resistance index, dynes* s/cm5/m2

X
PW = pulse wave (Doppler) qf = quantification of aortic flow r = radius, mm ResV = residual volume, L ResV% = residual volume, percent of predicted, % ROI = region of interest RR = respiratory rate, min-1 RV = right ventricular RVEDV = right ventricular end-diastolic volume, mL RVEDVI = right ventricular end-diastolic volume index, mL/m2 RVEF = right ventricular ejection fraction RVESV = right ventricular end-systolic volume, mL RVESVI = right ventricular end-systolic volume index, mL/m2 RVSVI = right ventricular stroke volume index, mL/m2
SAP = systolic artery pressure, mm Hg SD = standard deviation SEM = standard error of the mean SPAP = systolic pulmonary artery pressure, mm Hg SPV = spontaneous ventilation SV = stroke volume, mL SVI = stroke volume index, mL/m2
SVR = systemic vascular resistance, dynes*s/cm5 SVRI = systemic vascular resistance index, dynes* s/cm5/m2 SW = stroke work, g*m SWI = stroke work index, g*m/m2 TEE = transoesophageal echocardiography TLC = total lung capacity, L TLC% = total lung capacity, percent of predicted, % V = velocity, cm/s WM = wall mass, g �� �� sigma��wall stress, mm Hg � = tau, time constant, s

1
INTRODUCTION
Patients with severe lung emphysema have poor quality of life because of impaired lung
function and reduced exercise tolerance 86. The functional features consist of severe expiratory
airflow obstruction and considerable hyperinflation due to destruction of lung parenchyma and
loss of lung elasticity. Intrathoracic (intrapleural) pressure is increased (less negative) due to
generation of a high intrinsic positive end-expiratory pressure 111, 129.
To understand the hemodynamic consequences of these features, it is important to
realize that the respiratory and the cardiovascular systems are not separate but tightly
integrated. Ventilation can profoundly interact with cardiovascular function due to complex,
sometimes conflicting, sometimes coordinated processes. These interactions depend on
whether ventilation is spontaneous (SPV) or mechanically assisted (intermittent positive
pressure ventilation, IPPV) and may be further complicated by co-existing heart or lung
disease.
Heart function in emphysema
Concomitant heart disease during the course of chronic obstructive pulmonary disease
(COPD) is well recognized. The prevailing view is that mainly the right side of the heart is
involved 135, while the issue of left ventricular (LV) involvement is controversial and less
studied. The few existing studies on LV function in patients with severe emphysema have
exposed contradictory results. Two studies showed normal LV function 30, 143, whereas one
study 12 demonstrated abnormal LV function curves in the majority of patients with COPD.
Others have suggested that LV systolic dysfunction, assessed by LV area ejection fraction, is
unusual in patients with COPD without pulmonary hypertension 73, 109, 135. In patients with
emphysema and pulmonary hypertension, however, LV area ejection fraction may be
decreased due to ventricular interaction 137.
The present thesis is therefore focused on LV performance in patients with severe
emphysema. LV systolic and diastolic functions were evaluated in these patients using
transoesophageal echocardiography (TEE), magnetic resonance imaging (MRI) and the
pulmonary artery thermodilution technique. Patients were examined under general anaesthesia
before and after lung volume reduction surgery (LVRS) to assess LV diastolic filling pattern
and dimensions. A volume loading procedure was performed preoperatively to assess LV
preload responsiveness and load independent indices of systolic function. In awake and

2
spontaneously breathing patients with severe emphysema, eligible for single lung
transplantation, right ventricular (RV) and LV dimensions, wall mass and performance, as
well as intrathoracic blood volume (ITBV) were estimated. The clinical implications of the
results of these studies may provide a better understanding of heart-lung interaction present in
patients with COPD, contributing to an improved hemodynamic management of these patients
with respect to intravenous fluid therapy and to the hemodynamic response to positive
pressure ventilation in the perioperative setting.

3
BACKGROUND
Chronic obstructive pulmonary disease COPD is a major cause of morbidity and mortality. The defining characteristics of COPD are
the presence of expiratory airflow limitation that progresses slowly over a period of years and
the progressive and permanent destruction of airspace distal to the terminal bronchioli. COPD
encompasses chronic obstructive bronchitis with varying amounts of obstruction of small
airways and hypersecretion as well as emphysema with permanent enlargement of airspaces
and destruction of lung parenchyma, loss of lung elasticity and closure of small airways 10.
This leads to hyperinflation and impaired gas exchange by mechanisms explained below.
Aetiology
Cigarette smoking is the most common cause of emphysema. Longitudinal monitoring of lung
function reveals that substantial airflow obstruction due to an accelerated decline in lung
function (two to five times the normal annual decline of 15 to 30 mL in forced expiratory
volume in first second, (FEV1)) occurs in only a minority (10-20%) of cigarette smokers 11.
This strongly suggests that genetic factors may determine whether airflow limitation will
develop. In patients with �1-antitrypsin deficiency, emphysema develops that is exacerbated
by smoking, indicating a clear genetic predisposition to COPD 10. However, less than one
percent of patients with COPD have �1-antitrypsin deficiency.
Cigarette smoke is thought to activate macrophages and airway epithelial cells in
the respiratory tract, which release neutrophil chemotactic factors, including interleukin-8 and
leukotriene B4. Neutrophils and macrophages then release proteases that break down
connective tissue in the lung parenchyma, resulting in emphysema, and also stimulate mucus
hypersecretion. Proteases are normally counteracted by protease inhibitors, including �1-
antitrypsin, but in smokers in whom COPD develops, there seems to be an imbalance between
proteases – antiproteases 10. In patients with more advanced COPD, changes occur in the
pulmonary circulation (pulmonary hypertension) and in the right heart (right ventricular
dilatation and/or hypertrophy). Although the definition of emphysema is anatomic, biopsy
material is rarely available to confirm the diagnosis. The presence of emphysema is inferred
from a combination of history, pulmonary function data, and radiography.

4
Symptoms
Patients with emphysema present themselves with dyspnea, weakness and weight loss.
Dyspnea is caused by hypoxia due to hyperinflation of the alveoli and impaired gas exchange 10.
Clinical findings
Pulmonary function studies may show airflow obstruction (a decrease in FEV1, but forced
vital capacity (FVC) within normal range), a decrease in carbon monoxide diffusing capacity,
and an increase in total lung capacity (TLC), functional residual capacity (FRC), and residual
volume (ResV) 113. The FEV1 has been found to be a good predictor of mortality for COPD 8.
In severe COPD, with FEV1< 1L, 5 year survival is approximately 50%.
Figure 1. Lung Volumes. Reproduced with permission from Elsevier. Published in Miller’s Anesthesia 6th edition online.
Lung auscultation reveals a sparsity of breath sounds. The lung destruction and
air trapping, results in breathing pattern with small tidal volumes. The expiratory phase of
respiration is noticeably prolonged, i.e. I:E ratio is increased. Exercise testing like shuttlewalk
or 6 minutes walk can assess exercise performance. The radiographic features of emphysema
are hyperinflation represented as depression and flattening of the diaphragm on the
anteroposterior film and retrosternal air space on the lateral chest radiograph 113. Computed
tomography (CT) provides a means of measuring tissue density. Emphysema reduces lung
density, visualized as low attenuation areas on the CT scan 113. Lung perfusion scanning gives
information on ventilation/perfusion ratio. At all stages of COPD, ventilation/perfusion
inequality is the major mechanism impairing gas exchange leading to arterial hypoxemia.

5
Treatment
Smoking cessation is the only measure that will slow the progression of COPD and reduce the
rapid decline in FEV1 7. Medications used to improve breathing include bronchodilators
(salbutamolphosphate), anticholinergics (ipratropium), methylxanthines (theophylline),
corticosteroids and low-flow oxygen. Low-flow oxygen is the only treatment known to
improve the prognosis of COPD 1, 2, probably due to its elimination of hypoxic
vasoconstriction and diminution of pulmonary hypertension 113. Pulmonary rehabilitation can
improve exercise tolerance and quality of life in the short-term 4, 134, 141.
Intrinsic positive end-expiratory pressure in severe emphysema During spontaneous ventilation the inspiration of a tidal volume will “load” the elastic
“springs” of lung and chest wall, whereas the energy expenditure in overcoming airway
resistance will dissipate into heat. During expiration the emptying of the lungs is a passive
process dependent on the elastic and resistive properties of the airway. The emptying can be
shown to follow an exponential course according to:
-t/�0V(t)=V ×e ,
expressing that the decay in volume over time is an exponential curve dependent on a time
constant, �, equalling the elastic times the resistive properties of the lung, in other words:
2 2� = compliance×resistance = mL/cm H O×cm H O/mL/s = s
Thus, � has the unit of time. A general characteristic of exponential decay is that 63% of the
initial volume (V0) is delivered within 1 �, 86% within 2 �, and 95% within 3 �. Evidently, the
time constant may be prolonged if compliance is high, resistance is high or both. With a long
time constant the expiratory time may not allow for the exhalation of the tidal volume and part
of this volume remains in the lungs when the next inspiration starts. This remaining volume
causes hyperinflation and exerts a positive pressure at the end of expiration, which is termed
intrinsic positive end expiratory pressure, PEEPi, or auto-PEEP.
In spontaneous ventilation, auto-PEEP will increase if respiratory rate, expiratory
resistance (bronchoconstriction) is increased or abdominal musculature is recruited during
expiration. PEEPi may result from expiratory flow limitation as a result of dynamic
compression. In intermittent positive pressure ventilation, IPPV, auto-PEEP emerges from
high respiratory rate, shortened expiratory time interval (as in inversed I:E ratio), and

6
increased resistance. In terms of respiratory work this is not of importance during IPPV (as the
ventilator is the work horse), but auto-PEEP has implications for respiratory work in SPV and
for hemodynamics in both SPV and IPPV. In SPV the patient will have to generate a negative
pressure during inspiration overcoming the auto-PEEP before any volume is entering the
lungs. This is clinically observed as the flattening of the diaphragm on chest X-ray and the use
of auxiliary muscles during breathing in COPD patients.
Intrinsic PEEP is found in patients with COPD as a result of a defining
characteristic of the disease: expiratory airflow limitation and emphysema. These two
constitutive features may coexist in varying degrees. The airway flow limitation and the lung
tissue destruction entail a sequence of pathophysiological events: PEEPi, expiratory flow
limitation, pulmonary vascular hypertension, right heart hypertrophy, and cardiac
decompensation. The vascular and cardiac manifestations are late events in the natural history
of COPD.
Cardiopulmonary interactions in healthy subjects and in COPD patients Transmural, transpulmonary and intrathoracic pressures
Transmural pressure, i.e. the difference between the intravascular and extravascular pressures,
determines ventricular pre- and afterload. The vascular pressure recorded bedside is the
intravascular pressure; i.e. the pressure in the vessel lumen relative to atmospheric (zero)
pressure. The transpulmonary pressure is the pressure difference between alveolar pressure
and intrathoracic/pleural pressure (alveolar minus pleural pressure) 78.
In the thorax, the extravascular pressure (intrathoracic or pleural pressure)
normally is close to zero at the end of expiration and hence the intravascular pressure is
equivalent to the transmural pressure in healthy people. Likewise, the transpulmonary pressure
is close to zero at end-expiration. Changes in intrathoracic, transpulmonary and transmural
pressures during spontaneous tidal ventilation have hemodynamic implications for both the
RV and the LV. These implications differ for in- and expiration. This is summarised in figure
2 showing changes in airway pressure as mediated by pleural pressure during spontaneous
breathing in a healthy person.

7
-2.5
-2.0
-1.5
-1.0
-0.5
0.0
0.5
LV preloadLV afterload
expirationinspirationcm H2O
seconds
transmural pressure
RV preloadRV afterload
RV SV
transmural pressure
RV preloadRV afterload
RV SV
LV SVLV SV
airw
ay p
ress
ure
LV preloadLV afterload
Figure 2. The hemodynamic implications during spontaneous ventilation. During inspiration, pleural pressure decreases due to contraction of the respiratory muscles. During expiration pleural pressure increases and approached zero at end-expiration in healthy people. SV=stroke volume.
Cardiopulmonary interactions during spontaneous ventilation
Focusing on the LV, the hemodynamic implications during spontaneous ventilation, LV end-
diastolic volume (LV preload) can be altered by ventilation in four ways.
First, since the RV and LV outputs are in series, changes in RV preload (RV end-
diastolic volume) must eventually alter LV preload in the same direction. During inspiration,
increasing lung volume above FRC, decreased (negative) intrathoracic pressure (increased
transmural pressure) increases RV preload. Transpulmonary pressure decreases, thus lowering
RV afterload. This leads to an increase in RV stroke volume (SV) and eventually to an
increase in LV preload and LV SV 100, 101. This can be termed sequential interventricular
interdependency.
Second, the transient increase in RV end-diastolic volume during inspiration shifts
the interventricular septum into the LV by interventricular interdependence, reducing LV end-
diastolic volume, decreasing LV diastolic compliance and LV SV 100, 101, 123. This can be
termed simultaneous interventricular interdependency.
Differences in RV and LV pressures during systole and diastole thus manifest themselves in
displacement of the septum dependent on the septal tension (stress, �): rightward displacement

8
if LV wall stress exceeds RV wall stress, and leftward displacement if RV wall stress exceeds
LV wall stress (for a description of this relationship, please see 21). Sequential and
simultaneous interventricular interdependence are major factors in determining LV output
during spontaneous ventilation when RV end-diastolic volumes may vary widely from
expiration (small) to inspiration (large) 100.
Third, it has been hypothesized that increasing lung volume, whether by tidal
volume or PEEP, restricts absolute cardiac volume by direct compression of the heart in the
cardiac fossa 20. As the lungs expand the heart is compressed in the cardiac fossa and absolute
biventricular volume is limited in a fashion analogous to cardiac tamponade 100, 101.
Furthermore, it has been hypothesized that LV diastolic compliance is decreased 100, 101. Fluid
resuscitation, however, returns end-diastolic volume to normal, and so cardiac output (CO) is
returned to original levels 34, 57, 59, even in face of continued application of PEEP 16. Another
explanation to the reduced biventricular volume during lung inflation is that lung expansion by
PEEP reduces ITBV and thereby cardiac preload.
In patients with COPD and intrinsic PEEP (5-7.5 cm H2O = 3.7-5.5 mm Hg)
inspiration demands negative pressures in excess of PEEPi before lung volume increases.
Inspiration, however, will increase venous return and RV preload as the pressure gradient
between the systemic venous system and right atrium increases. RV afterload is increased
because of decreased area of capillary bed (compression due to hyperinflation and destruction
due to emphysema) resulting in a decrease in RV SV in spite of increased preload. At end-
expiration, the intrinsic PEEP and consequently the reduced transmural pressure results in a
decrease in RV preload and eventually in LV preload because of the sequential
interventricular interdependency 33. Translated into cardiac function, hyperinflation and PEEPi
increases intrathoracic pressure and opposes venous return during diastole resulting in a
reduction of the RV end-diastolic dimensions. Furthermore, increased transpulmonary
pressure inhibits RV outflow during systole. The end result is a decrease in cardiac
performance with low SV.
A fourth type of interaction is manifested in the late natural history of COPD
where the pulmonary vascular hypertension emerges as a result of hypoxic vasoconstriction,
progressive destruction of the pulmonary vascular bed as alveoli and alveolar septa are
destroyed and external compression of the pulmonary vessels due to auto-PEEP. In this setting
of pulmonary hypertension, the RV is ejecting its volume into a constricted vascular bed and
afterload is increased. This results in bowing of the interventricular septum because of
pressure excess of the RV relative to the LV during the diastolic phase. This has been

9
demonstrated by Roeleveld 106 who used MRI to evaluate septal bowing in patients with
pulmonary hypertension and is of relevance to III.
Gan et al 40 likewise found that the substantial RV dilation and hypertrophy seen in
patients with pulmonary hypertension, distorted the interventricular septum, compressed the
LV and impaired LV filling through direct interventricular interaction. The resulting
underfilling of the LV resulted in diminished SV.
Cardiopulmonary interactions during intermittent positive pressure ventilation
The hemodynamic implications during mechanical ventilation can be summarized as follows 78, 101 (figure 3):
transmural pressuretransmural pressure
LV preloadLV afterload
LV preloadLV afterload
LV SVLV SV
RV SVRV SV
RV preloadRV afterload
RV preloadRV afterload
ExpirationInspiration
seconds
cm H2O
5
10
20
15
25
Figure 3. The hemodynamic implications during positive pressure ventilation (IPPV plus PEEP). Intrathoracic (pleural) pressure affects RV preload and LV afterload. Lung inflation (increasing transpulmonary pressure) affects RV preload and afterload as well as LV preload and afterload.
Positive pressure ventilation increases intrathoracic pressure (ITP). Increase in ITP (pleural
pressure) decreases LV afterload and augments LV ejection. The diaphragmatic descent
increases intra-abdominal pressure, but the pressure gradient between the systemic venous
system and right atrium remains low, diminishing venous return and hence RV preload. The
LV SV is at a maximum at the end of the inspiratory period and at a minimum two to three

10
heart beats later (i.e. during the expiratory period). The cyclic changes in LV SV are mainly
related to the expiratory decrease in LV preload due to the inspiratory decrease in RV filling
and output.
Lung inflation alters pulmonary vascular resistance (PVR) independently of ITP as
a progressive increase in transpulmonary pressure results in an increase in RV afterload. High
levels of transpulmonary pressure induce pulmonary vascular collapse as transpulmonary
pressure approaches pulmonary artery pressure. Intermittent positive pressure ventilation in COPD patients
During IPPV, the basic rule is to avoid application of excessive pressure (at peak or plateau)
during the respiratory cycle, though exact limits are disputed and may vary individually.
Dynamic hyperinflation, or air trapping, occurs in COPD patients due to incomplete lung
emptying (expiratory flow limitation) during expiration. This leads to a degree of
hyperinflation of the lungs balancing the flow limitation (PEEPi). The risk of hyperinflation
can be reduced by applying a ventilatory pattern that allows deliberate hypoventilation and
permissive hypercarbia i.e. small tidal volumes (6-7 mL/kg), low respiratory rate (RR 10-12
/min) and prolonged I:E ratio 1:4 6. The application of PEEP in patients with PEEPi due to
flow limitation does not cause an increase in lung volume, alveolar and intrathoracic pressure
until a critical value of PEEP (Pcrit) exceeding the intrinsic PEEP is reached. Above this
critical limit further hyperinflation is observed 104 and the risk of hemodynamic and
barotraumatic complications becomes imminent 26.
Lung volume reduction surgery in severe lung emphysema Lung volume reduction surgery for the treatment of severe emphysema was described in the
late fifties by Brantigan et al 18. These investigators suggested that reducing the volume of
hyperinflated, functionless parts of a diseased lung allows improved function of more normal
parts of the lung. Because of high perioperative mortality, LVRS was later abandoned; it was
reintroduced in 1994 by Cooper and co-workers 28.
In LVRS the most emphysematous parts of the lung, targeted by chest CT-scanning
and ventilation/perfusion scan are excised by use of mechanical staplers via median
sternotomy. The excised amount of lung constitutes approximately 20-30% of the lung
volume. To minimize air leaks, the staple lines are reinforced with bovine pericardial tissue 27.
In randomized, controlled, prospective studies 29, 42, 102, 142, it has been demonstrated that

11
LVRS improves dyspnea, lung function, exercise tolerance, and quality of life in patients with
severe emphysema. This improvement seems to reach a maximum after 36 months, thereafter
declining as the disease progresses 38.
Although the effects of LVRS have been attributed to several possible
mechanisms, enhanced pulmonary elastic recoil, correction of ventilation/perfusion mismatch
and improved efficiency of respiratory musculature, the physiologic basis of reported
improvements is not fully understood 37, 74. It has also been difficult to link the improvement
in lung function tests to decreased dyspnea or increased quality of life after LVRS 69. Patients
with localized upper lobe emphysema appear to benefit most from LVRS. In 2001, The
National Emphysema Treatment Trial Research Group established that LVRS in patients who
have a low FEV1 (<20% of predicted value) and either homogeneous emphysema or a very
low carbon monoxide diffusing capacity (< 20% of predicted value), are at high risk for death
after surgery and also are unlikely to benefit from the surgery 3. These guidelines have
resulted in a complete cessation of referrals for LVRS from pulmonologists to the Department
of Cardiothoracic Surgery at Sahlgrenska University Hospital.
Changes in ventilatory mechanics after LVRS
Tschernko et al. 129-132 have described the effects of LVRS on emphysema lung mechanics in a
number of studies. Their findings before and after surgery may be summarised as follows:
preoperatively all patients had increased PEEPi, mean airway resistance (cm H2O/L/s), work
of breathing (j/L) and decreased dynamic compliance (mL/cm H2O) and these deviations were
accentuated by bicycle exercise. The minimal PEEPi levels were in the range of 5-7.5 cm H2O
at rest and increased up to on average 12 cm H2O during exercise. Preoperative PEEPi was
present in all patients, averaging 8.4 cm H2O (6.2 mm Hg) and decreased significantly to 1.1
cm H2O (0.8 mm Hg) 10-18 hours after surgery. Preoperative PEEPi correlated well with the
increase in FEV1 after surgery. LVRS tended to normalise (improve) values of lung mechanic
parameters and PEEPi remained so at least up to three months after operation.
Sciurba et al. 111 used oesophageal pressure at end-expiration as an index of pleural
pressure. They found that oesophageal pressure as well as TLC and ResV decreased after
LVRS whereas FEV1 increased. They ascribed the improvement in lung mechanics to
increased elastic recoil.

12
Changes in pulmonary and systemic hemodynamics after LVRS
Data on the effects of LVRS on late pulmonary and systemic hemodynamics are scarce and
the results of studies are controversial. Kubo et al. and Mineo et al. showed that cardiac index
(CI) is increased six months after LVRS both at rest and during exercise 64, 79. Kubo et al. 64
suggested that the increase in CI after LVRS was caused by capillary recruitment of the
previously compressed lung zones. Mineo et al. 79 demonstrated that RV end-diastolic volume
increased after LVRS and ascribed the increase in CI after LVRS to improved RV filling in
turn caused by a decrease in intrathoracic pressure. These findings have not been corroborated
by other investigators 51, 88, 138. Sciurba et al. 111 showed that LVRS increased RV area ejection
fraction, an indicator of systolic function. Although the authors did not measure RV outflow
impedance, this finding was interpreted as an indication of an LVRS-induced reduction in
pulmonary vascular resistance.
Indeed, improved cardiac function may contribute to the increased exercise
capacity seen after LVRS, but the potential effects of LVRS on LV performance have not
been discussed in detail. From the left ventricular point of view, diastolic LV function would
be affected if the emphysematous lungs were considered as “intrathoracic space occupying
processes“. Thus, if LV diastolic filling were abnormal in patients with severe emphysema,
the effect of LVRS could be expected to relieve this “pulmonary tamponade”. It is, however,
difficult to appreciate how a highly compliant structure can exert any kind of pressure on the
heart.
Assessing systolic and diastolic function Systolic function
Left ventricular systole is defined as the period between mitral and aortic valve closure. At the
mechanical level, systole can be divided into two phases: 1. Isovolumic contraction and 2.
Ejection (figure 4). In the isovolumic contraction phase, all four valves are closed, i.e. the
volume of blood in the ventricles remains constant, but pressure rises rapidly. The maximal
rate of pressure rise (dP/dt) during isovolumic contraction can be measured by positioning a
micromanometer catheter in the LV. Left ventricular dP/dt is a well established index of
systolic performance, and may be less load dependent compared with other indices of systolic
function. It is, however, an invasive measurement and as such not applicable in the routine
clinical setting.
Isovolumic contraction time (IVCT) and ejection time (ET) can be measured at the
level of the mitral valve (mid oesophageal four-chamber view) and aortic valve (mid-

13
oesophageal aortic valve short axis view) respectively by continuous wave (CW) Doppler
transoesophageal echocardiography. IVCT is defined as the time period between mitral valve
closure, corresponding to the end of atrial contraction, and the beginning of LV ejection,
corresponding to the aortic valve opening click or commencement of aortic flow. The ET is
the time period between the opening and closing clicks of the aortic valve. Alternatively, in
the deep transgastric long axis view, a CW Doppler signal can be positioned so that the aortic
systolic and mitral diastolic waveforms are visualized simultaneously. This gives a more
accurate value of IVCT. It is, however, frequently difficult to obtain a clear signal of both flow
patterns at the same time.
When the pressure in the left ventricle exceeds that in the aorta, the aortic valve opens. This
marks the beginning of the ejection phase, during which the pressure in the left ventricle and
the aorta briefly rises to a maximum of about 120 mm Hg. The ejection phase ends with the
closure of the aortic valve.
Figure 4. Left ventricular pressure-volume loop illustrating the changes in ventricular pressure with respect to volume in a counter clockwise fashion over time.
Determinants of systolic function
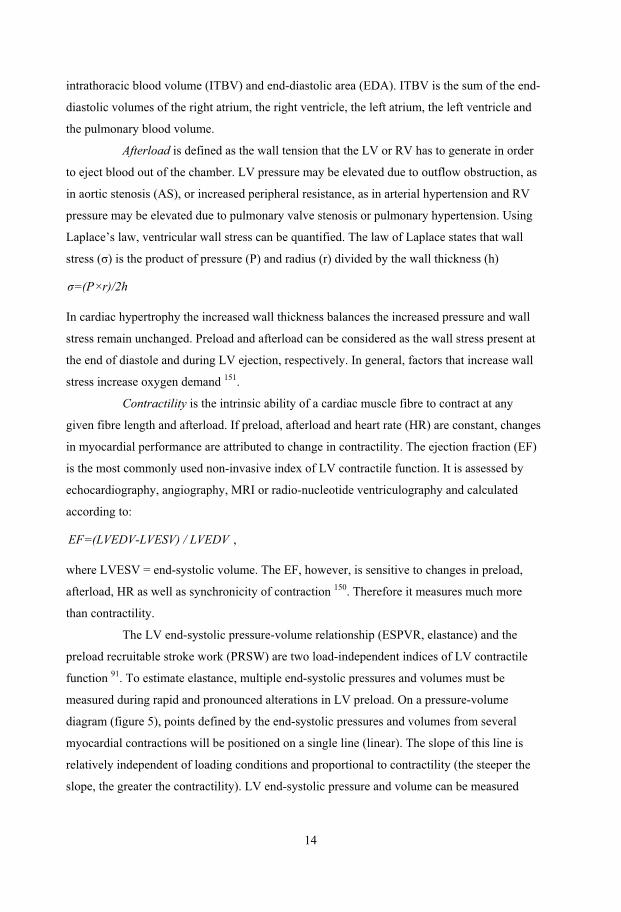
Systolic performance of the heart is dependent on preload, afterload and contractility. Cardiac
preload is defined as the ventricular fibre length at the end of diastole, described clinically as
the LV end-diastolic volume (LVEDV). A number of surrogate measures are used to estimate
preload: pulmonary capillary wedge pressure (PCWP), central venous pressure (CVP),
14
intrathoracic blood volume (ITBV) and end-diastolic area (EDA). ITBV is the sum of the end-
diastolic volumes of the right atrium, the right ventricle, the left atrium, the left ventricle and
the pulmonary blood volume.
Afterload is defined as the wall tension that the LV or RV has to generate in order
to eject blood out of the chamber. LV pressure may be elevated due to outflow obstruction, as
in aortic stenosis (AS), or increased peripheral resistance, as in arterial hypertension and RV
pressure may be elevated due to pulmonary valve stenosis or pulmonary hypertension. Using
Laplace’s law, ventricular wall stress can be quantified. The law of Laplace states that wall
stress (�) is the product of pressure (P) and radius (r) divided by the wall thickness (h)
�=(P×r)/2h
In cardiac hypertrophy the increased wall thickness balances the increased pressure and wall
stress remain unchanged. Preload and afterload can be considered as the wall stress present at
the end of diastole and during LV ejection, respectively. In general, factors that increase wall
stress increase oxygen demand 151.
Contractility is the intrinsic ability of a cardiac muscle fibre to contract at any
given fibre length and afterload. If preload, afterload and heart rate (HR) are constant, changes
in myocardial performance are attributed to change in contractility. The ejection fraction (EF)
is the most commonly used non-invasive index of LV contractile function. It is assessed by
echocardiography, angiography, MRI or radio-nucleotide ventriculography and calculated
according to:
EF=(LVEDV-LVESV) / LVEDV ,
where LVESV = end-systolic volume. The EF, however, is sensitive to changes in preload,
afterload, HR as well as synchronicity of contraction 150. Therefore it measures much more
than contractility.
The LV end-systolic pressure-volume relationship (ESPVR, elastance) and the
preload recruitable stroke work (PRSW) are two load-independent indices of LV contractile
function 91. To estimate elastance, multiple end-systolic pressures and volumes must be
measured during rapid and pronounced alterations in LV preload. On a pressure-volume
diagram (figure 5), points defined by the end-systolic pressures and volumes from several
myocardial contractions will be positioned on a single line (linear). The slope of this line is
relatively independent of loading conditions and proportional to contractility (the steeper the
slope, the greater the contractility). LV end-systolic pressure and volume can be measured

15
invasively, using micromanometer catheters during cardiac surgery. It is, however, possible to
estimate end-systolic pressure using the dicrotic notch on the radial artery tracing 60.
Figure 5. End-systolic elastance is the line connecting the end-systolic point of multiple pressure-volume loops obtained at varying preloads. An increased slope (steeper) represents increased contractility. ESPVR, end-systolic pressure-volume relationship.
PRSW, on the other hand, is a linear Frank-Starling analogue, describing the relation between
LV stroke work (SW) and LVEDV:
PRSW=�SW / �EDV .
SW is defined as the area under the LV pressure-volume loop (figure 6). SW can be estimated
from
SW=(EDV-ESV)×(SAP-PCWP) ,
where SAP = systolic artery pressure. To generate the PRSW, preload needs to be varied by
volume changes and accordingly, consecutive pressure-end-diastolic volume loops can be
constructed (figure 7). In the figure, the shaded area corresponds to the LV stroke work (SW).
Hence, SW can be plotted against end-diastolic volume for each loop (large black dots). The
relationship between SW and EDV is linear and thus, the slope of the curve describes PRSW,
an index of contractility which is considered to be independent of preload or afterload 43, 91.
PRSW can be assessed clinically at the bedside using thermodilution technique (PCWP) and
echocardiography (EDA and ESA).

16
Figure 6. Stroke work is defined as the area under the pressure-volume curve. Stroke work is approximated as the product of stroke volume (EDV-ESV) and pressure (SAP-PCWP) developed during ejection of the stroke volume. End-diastolic pressure is approximated to PCWP and systolic pressure to SAP.
Figure 7. Preload recruitable stroke work (PRSW) is the relation between EDV and SW. The large black dots are EDV. The steeper the slope the higher the contractility.
Evaluation of LV function by two-dimensional transoesophageal echocardiography
The transgastric midpapillary short axis view can be used for assessing LV systolic function as
well as preload 24, 25, 122 and LV wall thickness 96. The fractional area change (FAC) (or area

17
ejection fraction, AEF) is an index of systolic performance. FAC is the proportional change in
the area of the LV short axis during systole and is given by the formula:
FAC=(EDA-ESA) / EDA×100 ,
where EDA = end-diastolic area and ESA = end-systolic area. With the use of freeze frame
images, the largest (EDA) and smallest (ESA) frame of a representative cardiac cycle is
identified. The endocardial surfaces are then traced and the areas recorded. The papillary
muscles are excluded from the tracing. Normal values for FAC are between 50 and 75% 96, 114.
Preload can be assessed using EDA as a surrogate measure of LVEDV. Clements
et al. have shown close agreement between EDA, assessed by TEE and EDV assessed by
radionuclide angiography 25.
Ventricular wall thickness is assessed at end-diastole. Pressure overload (from AS
or hypertension) produces concentric hypertrophy (wall thickness increased out of proportion
to chamber size) and is associated with impaired relaxation (prolonged isovolumic relaxation
time and reduced early filling) and reduced chamber compliance. Concentric LV hypertrophy
can be assessed measuring infero-septal or antero-lateral wall thickness. A LV wall thickness
> 11 mm indicates LV hypertrophy 96, 116.
Diastolic function
Diastole is the period from aortic to mitral valve closure. At the mechanical level, diastole can
be divided into four phases: 1. isovolumic relaxation; 2. rapid early filling; 3. diastasis; and 4.
atrial contraction.
Isovolumic relaxation is the phase beginning with aortic valve closure
(simultaneous with the dicrotic notch on the aortic pressure wave) and extending to the
opening of the mitral valve. Ventricular volume remains unchanged and there is a rapid fall in
intracavitary pressure due to active relaxation. Isovolumic relaxation can be quantified by
measurements of LV pressure with a micromanometer catheter and thus the relaxation time
constant tau (���can be assessed. Active relaxation is characterized by constant fractional
decrease in pressure over time, �P(t)/t, the fraction being � times the pressure at the start of
the relaxation (P0):
0�P(t)- =�×P
�t. This may be differentiated into the exponential decay equation
-�/t0P(t)=P×e ,

18
With � termed time constant. When isovolumic relaxation is slowed, � is prolonged. The time
constant, �, may be derived as the inverse slope to the natural logarithm of LV diastolic
relaxation pressure plotted versus time. The normal range is 40 to 60 ms (figure 8).
0 20 40 60 80 1000
20
40
60
80
100
Pres
sure
(mm
Hg)
Time (ms)
delayed relaxation,prolonged �
Figure 8. Two LV pressure waveforms show a normal contour and a waveform with delayed relaxation producing a prolonged time constant, �. The isovolumic relaxation time (IVRT) is a commonly used non-invasive parameter of
ventricular relaxation. It is regarded as a reflective of � 84. Thus, a direct correlation between
IVRT and � has been described 82, 84, 145. IVRT, however, is affected by both aortic 68 and left
atrial pressures 82. IVRT is prolonged in conditions that impair active relaxation and relates
directly with � and aortic closing pressure; it is shortened by a raised left atrial (LA) pressure,
because this causes earlier opening of the mitral valve 82, 126. An analytic expression relating
IVRT to �� and to aortic and LA pressure is IVRT: -IVRT/�
LA 0p =p e ,
where p0 is ventricular pressure at the time of aortic closure at which time point t is 0, and pLA
the left atrial pressure at the time when ventricular pressure equals the left atrial pressure.
Viewed on a logarithmic plot, LV pressure decreases with a slope equal to -1/��Thus taking
the logarithm of equation above yields
LA 0log(p )=log(p )-IVRT/� ,
and hence
0 L AIVRT=�(log(p )-log(p ))

19
This equation demonstrates that IVRT varies predictably with �, LA pressure and aortic
closing pressure 95, 126, 147.
Early diastolic filling begins with opening of the mitral valve. The LV pressure
will continue to fall even after the opening of the mitral valve. In fact, the LV pressure falls
below the LA pressure as a result of elastic recoil, creating a suction effect. Rapid filling of the
LV occurs during this phase. Normally, LV relaxation ends in the first third of rapid filling so
that the rest of the LV filling is dependent on LV compliance, ventricular interaction, and
pericardial constraint. Although the rapid filling phase comprises only 30 % of diastole, it
accounts for up to 75 % of LV volume.
Ventricular filling slows during mid-diastole as the transmitral pressure gradient
declines. This phase is known as diastasis. During this phase, LA and LV pressures are nearly
equal. The filling comes from the pulmonary veins and contributes about 5% to the LV
volume. Atrial systole increases the transmitral pressure gradient and accounts for the
remaining 20% of ventricular filling. The contribution of atrial systole to ventricular filling
increases substantially in conditions that impair myocardial relaxation, such as severe LV
hypertrophy 44, 116.
Pathophysiology of diastolic dysfunction
Diastolic dysfunction is defined as a condition in which a higher than normal LV filling
pressure is needed for optimal stretch of the myocardial fibres 46, 147. Focusing on the four
determinants of diastolic function:
Myocardial relaxation (early diastole) is an energy-dependent process influencing
the isovolumic relaxation phase and part of the early filling phase. Intracellular Ca2+
overload, as seen in ischemia, can prolong myocardial relaxation so that the early filling phase
is affected. A proposed metabolic explanation is that generation of energy (adenosine
triphosphate, ATP) is impaired, leading to a slow rate of Ca2+ reuptake into the sarcoplasmatic
reticulum.
Ventricular compliance (mid-diastole) is a passive process that affects all three
filling phases of diastole. The intrinsic factors entail increased myocardial stiffness resulting
from fibrosis, muscular hypertrophy or a deposition of amyloid. The extrinsic factors that
reduce ventricular compliance include the structures that surround the heart: pericardium, RV
and lungs.
The pulmonary veins and left atrium are the source for LV filling, and influence all
three filling phases. An increase in the LA-LV pressure gradient (increase in preload)

20
enhances early diastolic filling whereas a decrease in preload (Valsalva manoeuvre or reverse
Trendelenburg) attenuates early LV filling.
Heart rate influences myocardial relaxation and all three filling phases. In
bradycardia most of the LV filling occurs before atrial contraction. In tachycardia early filling
is shortened, there is no diastasis, and LV filling depends mostly on atrial contraction. The
natural history of diastolic dysfunction is that, with time as the disease advances, abnormal
relaxation progresses to reduced chamber compliance.
Evaluation of diastolic function
The evaluation of diastolic function is made using TEE. In conjunction with the anatomic and
functional information provided by two-dimensional echocardiography (systolic function,
preload and wall thickness) and colour-flow Doppler imaging (valvular regurgitation),
diastolic function can be assessed using CW Doppler imaging of mitral and aortic flow
(measurements of IVRT) and pulsed Doppler (PW) imaging of mitral flow (LV filling pattern) 44.
Pulsed Doppler imaging of mitral flow: The mitral Doppler flow profile reflects
the transmitral pressure gradient and depends on the rate of LV relaxation, LV compliance and
LA pressure. Following isovolumic relaxation and mitral valve opening, diastolic filling
commences. The normal transmitral velocity profile consists of two peaks; a larger E wave
due to early diastolic filling and a smaller A wave due to atrial contraction. A number of
variables can be measured from the Doppler tracings. These include peak early diastolic and
peak late diastolic filling velocities (E-max and A-max), deceleration rate (E-dec slope) and
deceleration time (E-dec time) of early diastolic filling, and the ratio E-max/A-max (E/A)
(figure 9). The deceleration time is the interval between time E-max and time at the linear
extrapolation of E-dec slope to baseline. This interval reflects the mean LA pressure and LV
compliance. A short E-dec time is seen in patients with reduced compliance whereas a long E-
dec time is seen in patients with poor relaxation 95. IVRT generally parallels E-dec time, both
becoming prolonged with abnormal relaxation, and becoming shorter with rapid relaxation
and increasing filling pressures 85.
In young adults, LV relaxation is rapid resulting in nearly 95% filling during the
early diastolic filling phase (E/A>2). By middle age, LV relaxation is slowed, early filling
decreases and the contribution of atrial contraction increases to about 30% (E/A>1). In elderly
people, further impairment of relaxation has occurred and about 50% of flow may occur
during atrial systole (E/A=1) 110, 116.

21
0
20
40
60
80
100
V, cm/s
Time, msE-dec. time
E-max
A-max
Figure 9. Schematic mitral Doppler profile shows E-max, peak early diastolic filling velocity; A-max, peak late diastolic filling velocity; and E dec. time, deceleration time of early diastolic filling. V = linear velocity, cm/s.
Three patterns of abnormal transmitral flow are recognized: impaired relaxation, pseudo-
normalization and restrictive filling. Please refer to table 1.
Impaired relaxation: Impaired relaxation occurs in myocardial ischemia, LV
hypertrophy and ageing. The Doppler transmitral flow velocity profile is characterized by a
prolonged IVRT and a decreased initial transmitral pressure gradient. This results in a decrease
in early filling and an increase in filling during atrial systole. Consequently, the E-max
decreases relative to the A-max and the E/A ratio<1. In addition, the duration of LV relaxation
is prolonged and results in prolonged E-dec time because the LA-LV pressure gradient takes
longer to equilibrate. A subsequent compensatory increase in flow during atrial contraction
accounts for the increase in A-max because of the relatively high atrial preload. Alterations in
loading conditions (reduced preload or increased afterload) can also change a normal filling
pattern into an abnormal one (E/A<1).
Pseudo-normalization: Typically diastolic dysfunction progresses from impaired
relaxation to restrictive filling, but during this transition the Doppler transmitral flow velocity
profile may assume a pseudo-normal pattern, that resembles normal filling. The pseudo-
normalized filling pattern represents a moderate stage of diastolic dysfunction consisting of
impaired myocardial relaxation as well as elevated LV filling pressure. At this stage, most
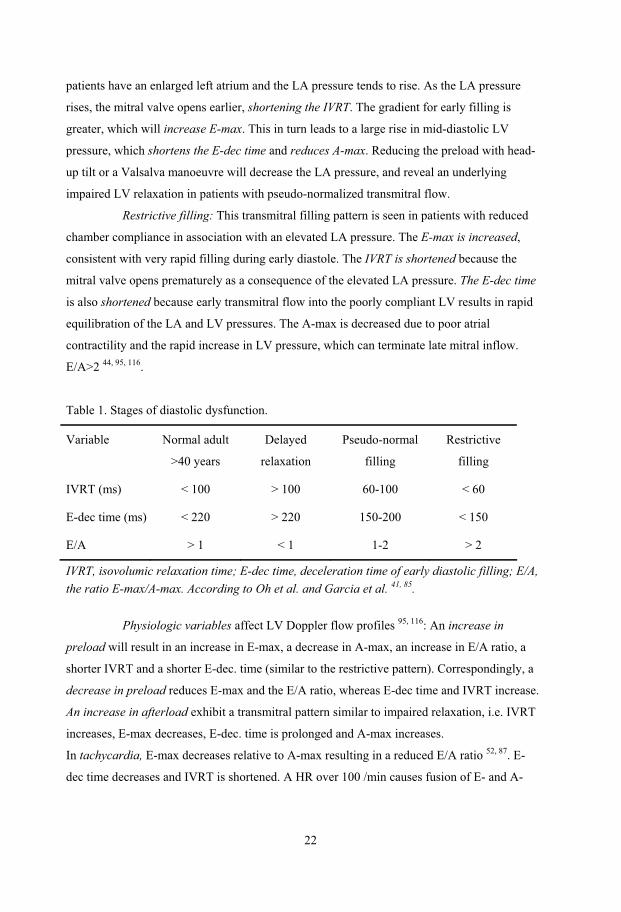
22
patients have an enlarged left atrium and the LA pressure tends to rise. As the LA pressure
rises, the mitral valve opens earlier, shortening the IVRT. The gradient for early filling is
greater, which will increase E-max. This in turn leads to a large rise in mid-diastolic LV
pressure, which shortens the E-dec time and reduces A-max. Reducing the preload with head-
up tilt or a Valsalva manoeuvre will decrease the LA pressure, and reveal an underlying
impaired LV relaxation in patients with pseudo-normalized transmitral flow.
Restrictive filling: This transmitral filling pattern is seen in patients with reduced
chamber compliance in association with an elevated LA pressure. The E-max is increased,
consistent with very rapid filling during early diastole. The IVRT is shortened because the
mitral valve opens prematurely as a consequence of the elevated LA pressure. The E-dec time
is also shortened because early transmitral flow into the poorly compliant LV results in rapid
equilibration of the LA and LV pressures. The A-max is decreased due to poor atrial
contractility and the rapid increase in LV pressure, which can terminate late mitral inflow.
E/A>2 44, 95, 116.
Table 1. Stages of diastolic dysfunction.
Variable Normal adult
>40 years
Delayed
relaxation
Pseudo-normal
filling
Restrictive
filling
IVRT (ms) < 100 > 100 60-100 < 60
E-dec time (ms) < 220 > 220 150-200 < 150
E/A > 1 < 1 1-2 > 2
IVRT, isovolumic relaxation time; E-dec time, deceleration time of early diastolic filling; E/A, the ratio E-max/A-max. According to Oh et al. and Garcia et al. 41, 85.
Physiologic variables affect LV Doppler flow profiles 95, 116: An increase in
preload will result in an increase in E-max, a decrease in A-max, an increase in E/A ratio, a
shorter IVRT and a shorter E-dec. time (similar to the restrictive pattern). Correspondingly, a
decrease in preload reduces E-max and the E/A ratio, whereas E-dec time and IVRT increase.
An increase in afterload exhibit a transmitral pattern similar to impaired relaxation, i.e. IVRT
increases, E-max decreases, E-dec. time is prolonged and A-max increases.
In tachycardia, E-max decreases relative to A-max resulting in a reduced E/A ratio 52, 87. E-
dec time decreases and IVRT is shortened. A HR over 100 /min causes fusion of E- and A-

23
wave velocities. In atrial fibrillation there is a loss of A-wave. Bradycardia increases the E/A
ratio. The location of the PW Doppler sample volume, the respiratory pattern, arrhythmia
and pacing as well as mitral and aortic regurgitation, can affect the transmitral blood flow
velocity profile and make interpretation of the profiles difficult 44, 95, 116.
Left ventricular end-diastolic stiffness
LV end-diastolic stiffness (LVEDS) is defined as the myocardial resistance to passive
stretching, i.e. change in pressure per volume change (dP/dV). Thus, LVEDS is reciprocal to
compliance (dV/dP). In other words, increased myocardial stiffness impedes myocardial
lengthening.
LVEDS is calculated using the end-diastolic pressure-area relation: The end-
diastolic pressure-area relation is known to be curvilinear in shape, and in vitro and in vivo
animal studies have shown that as long as the end-diastolic pressure remains greater than 3
mm Hg, it fits reasonably well to an exponential function 80. In other words, an increase in LV
volume is accompanied by an increase in pressure following an exponential function.
It can be described by the equation: S×EDAPCWP=B×e
PCWP denotes the pulmonary capillary wedge pressure, EDA the end-diastolic area and B and
S are constants. By transforming this equation to its logarithmic form:
lnPCWP=lnB+S×EDA ,
a linear relation is obtained. LVEDS is defined as the slope of the end-diastolic pressure-area
curve. This can be derived by solving the equation below with two connected values of PCWP
and EDAI; one set obtained with the patient in supine position and one with the legs elevated
(volume loading):
2 1 2 1LVEDS=(lnPCWP )-ln(PCWP ) / (EDAI -EDAI ) ,
where ln(PCWP1) and ln(PCWP2) are the natural logarithms of the pulmonary capillary wedge
pressures, and EDAI1 and EDAI2 are the indexed LV end-diastolic areas, before and after
volume loading, respectively.

24
Pharmacological aspects on diastolic function Cellular events
Both myocardial contraction and relaxation are energy consuming processes. During systole,
when cytosolic Ca2+ is high, Ca2+ binds to troponin-C allowing formation of cross bridges
between actin and myosin filaments and contraction starts. As long as Ca2+ is bound to
troponin-C this energy-dependent process is repeatedly performed (cross bridge cycling).
During diastole, when cytosolic Ca2+ is low, Ca2+ is removed from troponin-C and pumped
back into the sarcoplasmatic reticulum, allowing dissociation of the actin-myosin cross
bridges. The myofibrils relax and return to their original end-diastolic length 90.
Inotropic drugs
Patients with LV hypertrophy have limited coronary vasodilator reserve. Perfusion and tissue
viability balances on a swords edge. Many inotropic agents accentuate ischemia by increasing
myocardial oxygen demand 13. Positive inotropic drugs such as digoxin, �-adrenergic agonists,
catecholamines and phosphodiesterase (PDE) III inhibitors rarely have a place in the treatment
of diastolic dysfunction even though �-adrenergic agonists and PDE III inhibitors have
lusitropic effect (enhanced sarcoplasmatic reuptake of Ca2+ and decreased Ca2+ affinity to
troponin-C) 39, 148. Their predominant effect, though, is an increase in intracellular cAMP and
Ca2+ concentration in the myocytes, thus improving cardiac contractility 13. Oxygen
consumption, however, increases and likewise the risk of Ca2+ overload, leading to
tachycardia and ischemia, most pronounced in the groups of �-adrenergic agonists and
catecholamines 39, 45, 89. PDE III inhibitors do not seem to increase myocardial oxygen demand
to a great extent, which is probably explained by its substantial vasodilating capacity 45.
Levosimendan belongs to a class of drugs known as Ca2+ sensitizers. This drug
enhances myocardial contractility through myofilament Ca2+ sensitization by binding to troponin-
C in a Ca2+ concentration-dependent manner and induces peripheral and coronary vasodilation by
opening ATP-sensitive potassium channels without increasing oxygen consumption 66, 70, 76.
Additionally, with higher concentrations, levosimendan acts as a PDE III inhibitor 53.
LV systolic dysfunction is often accompanied by impaired LV relaxation 46 and
increased sensitivity to Ca2+ during diastole would further impede relaxation of the heart and
worsen diastolic dysfunction. The effects of Ca2+ sensitizers on myocardial relaxation and
diastolic function in man, however, are incompletely understood. In vitro studies have shown that
Ca2+ sensitizers (EMD 57033, ORG 30029) may impair myocardial relaxation and elevate
diastolic tension in failing human myocardium 50, whereas levosimendan, on the other hand, has

25
been shown to improve both systolic and diastolic function of cardiac muscle preparations from
end-stage failing human hearts 58.
Recent clinical studies on levosimendan, using Doppler echocardiographic variables
of LV diastolic function 31, 32, 92, have supported the experimental studies regarding lusitropy, but
should, however, be interpreted with caution because these Doppler echocardiographic indices
are preload-, afterload- and heart rate-dependent. Levosimendan has well known positive
chronotropic and vasodilatory effects 119 and thus affects the Doppler echocardiographic indices
used to evaluate early LV relaxation to a great extent. Therefore, clinical studies on the potential
lusitropic effect of levosimendan are warranted.

26
AIMS OF THE INDIVIDUAL STUDIES
� Paper �
To compare LV filling and dimensions in patients with severe emphysema with
non-emphysematous patients, and to evaluate the effect of lung volume reduction
surgery on left ventricular diastolic filling and dimensions.
� Paper ��
To compare LV systolic performance in patients with severe emphysema with non-
emphysematous patients.
� Paper ���
To investigate whether hyperinflated lungs in patients with severe emphysema
cause low intrathoracic blood volume (central hypovolemia) and hence small right
and left ventricular end-diastolic volumes resulting in compromised left ventricular
performance.
� Paper �V
To investigate whether levosimendan in addition to its positive inotropic effect
have positive lusitropic effect in patients with diastolic dysfunction.

27
MATERIALS AND METHODS
Patients
Paper � to ��� In I, II and III, inclusion criteria for all patients in the study group (termed emphysema group)
were a diagnosis of emphysema based on pulmonary function tests; FEV1 between 20 and
35% of expected value, ResV over 200%, TLC over 120% of expected value and age less than
75 years. Furthermore, patients should have a normal echocardiographic examination (LV EF
> 50% and systolic pulmonary artery pressure (SPAP) < 55 mmHg) and no history of cardiac
disease. All patients had a smoking history and received optimal medical treatment with
inhaled steroids and bronchodilators. The patients in � and �� (5 women and 5 men) were
scheduled for LVRS, while the patients in ��� (8 women and 5 men) were enrolled in the study
when admitted for evaluation for single lung transplantation at Sahlgrenska University
Hospital. The control group in � and �� (6 women and 4 men) had a diagnosis of malignancy
based on lung biopsy and a tumour location suitable for lobectomy. These patients were
included to exclude the surgical procedure per se as the source of potential effect on measured
variables. The control group in ��� consisted of healthy volunteers (6 women and 5 men). They
were matched for age, gender, and body size and had no complicating cardiac or systemic
disease. A total number of 44 patients were included. The majority of patients in � were also
included in ��.
Paper �V In �V, 23 consecutive symptomatic patients with severe aortic stenosis, scheduled for aortic
valve replacement (AVR) or AVR plus coronary artery bypass grafting were studied.
Inclusion criteria were: 1) aortic valve area <1 cm2, an aortic valve pressure gradient >50 mm
Hg; 2) preoperative ejection fraction of more than 50 %; 3) LV wall thickness > 11 mm; 4)
less than moderate aortic insufficiency; 5) coronary artery disease as a secondary finding on
routine cardiac catheterization; 6) sinus rhythm before and after cardiopulmonary bypass
(CPB); 7) uncomplicated weaning from CPB with no need for inotropic support. Patients with
previously documented coexisting valve disease such as moderate mitral or mild tricuspid
insufficiency or aortic subvalvular LV outflow tract obstruction were excluded from the study.
Inclusion and exclusion criteria were confirmed by initial intraoperative TEE evaluation.
28
Anaesthesia and surgery
Paper � and �� The patients were premedicated with flunitrazepam (1 mg) and the patients in the emphysema
group also received morphine (5-10mg) and scopolamine (0.2-0.4 mg). A thoracic epidural
catheter was inserted prior to induction of anaesthesia. After an epidural bolus injection with
sufentanil (10-25 μg) and bupivacaine (15-20 mg) a continuous infusion of sufentanil
(1μg/mL) and bupivacaine (1 mg/mL) was initiated at a rate of 3-4 mL/h. Anaesthesia was
induced with thiopental (3-5 mg/kg), fentanyl (1-2 μg/kg), and pancuronium (0.1mg/kg). The
patients were intubated with a left-angled double-lumen tube. Anaesthesia was maintained
with enflurane in oxygen/air with a FiO2 necessary to keep PaO2 > 20 kPa. Ventilation was
volume-controlled (6-7 mL/kg tidal volume) at a frequency of 15/min and an I:E ratio of 1:3,
to maintain PaCO2 between 5.0 and 7.0 kPa. PEEP was not applied. The patients were actively
warmed by the use of warm-air blankets. The patients did not receive intravenous fluids
during the induction or maintenance of anaesthesia. Bilateral LVRS was performed by median
sternotomy as described by Cooper and Patterson 27.
Paper �V The patients were premedicated with flunitrazepam (0.5-1 mg) orally and morphine (5-10 mg)
and scopolamine (0.2-0.4 mg) subcutaneously. �-adrenergic blockers were continued during
the perioperative period, including the morning of surgery, whereas angiotensin converting
enzyme inhibitors, Ca2+- channel blockers, and other cardiovascular medications were omitted
on the day of surgery. Anaesthesia was induced with thiopental (1-3 mg/kg) and fentanyl (5-
10 μg/kg). Tracheal intubation was facilitated with pancuronium (0.1 mg/kg). Before and after
CPB, anaesthesia was maintained with sevoflurane in oxygen/air with a FiO2 necessary to
keep PaO2 > 20 kPa. During CPB a continuous infusion of propofol was administered.
Ventilation was volume-controlled to maintain PaCO2 between 4.0 and 5.0 kPa during surgery.
Intraoperative hypotension was treated with fluids, phenylephrine infusion, or both, and
hypertension was treated with sodium nitroprusside infusion. Target mean artery pressure
(MAP) during CPB was 50-90 mm Hg. AVR was performed according to the Department’s
standard procedure. No inotropic drugs were administered during weaning from the CPB. The
type of prosthetic valve placed (biological or mechanical) was decided by the surgeon and the
patient preoperatively. The size of the valve was determined by the surgeon perioperatively.

29
Hemodynamic measurements
Paper �, �� and �V A cannula was placed in the left radial artery (� and ��) or right femoral artery (�V). A
pulmonary artery thermodilution catheter (131HF7, TD Baxter Healthcare Corporation, Irvine,
CA, 92614-5686, USA) was inserted through the right internal jugular vein into the pulmonary
artery. Continuous recordings of HR, SAP, diastolic artery pressure (DAP) and MAP together
with SPAP, diastolic pulmonary artery pressure (DPAP) and mean pulmonary artery pressure
(MPAP), and CVP were performed. The pressure transducers were zeroed against atmospheric
pressure and maintained at the mid-axillary level throughout the experimental procedure.
Thermodilution cardiac output in triplicate, and PCWP measurements were performed at each
measuring point. SV, SW, systemic vascular resistance (SVR) and PVR were calculated and
indexed to the patient’s body surface area (BSA) (SVI, SWI, SVRI and PVRI respectively).
Two-dimensional echocardiography
Paper �, �� and �V A multiplane transoesophageal echocardiographic transducer (ACUSONTM, ACUSON Corp.,
Mountain View, Calif., USA) was used together with an ACUSON 128XP echocardiography
system in � and �� and a Sequoia echocardiography system (Sequoia c256, ACUSON Corp.,
Mountain View, Calif., USA) in �V. Using the transgastric mid-papillary short axis image of
the left ventricle, the LV endocardial border was outlined in end-systole and end-diastole and
LV ESA and EDA were calculated together with AEF. ESA and EDA were indexed to the
patient’s BSA (ESAI and EDAI, respectively). In � and ��, images were stored on Super-VHS
videotape and later transferred to a computer system by means of a video frame grabber
(VISIONplus-AT TM, Imaging Technology Inc., Bedford, MA, USA). In �V, images were
stored on magneto-optical discs and later transferred to a computer system (EchoPac PC
Dimension version 4.0.x. GE Medical Systems. P.O. Box 414, Milwaukee, Wisconsin 53201
USA) for off-line analysis.
The indexed end-diastolic LV short axis area and the PCWP obtained in the supine
position with and without passive leg elevation were used to calculate LVEDS
( 2 1 2 1LVEDS=(lnPCWP )-ln(PCWP ) / (EDAI -EDAI ) )
in �, and preload-recruitable stroke work ( PRSW=�SW / �EDV ) in ��. Furthermore, the
increase in SVI to a certain increase in preload, assessed by the change in PCWP or change in

30
EDAI, was estimated as: �SVI / �PCWP (mL/mmHg) and �SVI / �EDAI (mL/cm2*m2),
respectively. LV EDAI was used as a surrogate variable for LV EDV.
Doppler echocardiography
Paper � and �V In � and �V mitral Doppler profiles were recorded. After completion of the LV short-axis
measurements, the transducer was withdrawn until a long-axis image was obtained in the
midesophageal four-chamber view. A PW Doppler line was positioned with the measuring
caliper at the tips of the open mitral leaflets and adjusted to be as parallel as possible to the
mitral flow. Optimal sweep speed was set at 50 to 100 mm/s 9. In �, the Doppler flow profiles
were recorded on Super-VHS video tape and in �V on magneto-optical disc. The flow profiles
were later transferred to a computer and evaluated with a digitizing tablet by means of a PC-
based analysis system, as previously described by Houltz 56 (�) or to a computer work station
(EchoPac PC Dimension (�V). Three consecutive beats were digitized and their mean values
were used for analysis. The following variables were derived from the mitral Doppler tracings:
E-max and A-max, E-dec slope and E-dec time. The ratio of E-max to A-max (E/A) was
calculated.
In �V, IVRT was measured by first positioning the CW Doppler sample volume at
the tips of the mitral leaflets (mid-oesophageal four chamber view) (figure 10). The mitral
flow profile was recorded, and the time from the R-wave in the ECG to the beginning of the
E-wave was measured, tE. Thereafter, the Doppler sample volume was positioned at the aortic
valve (midesophageal aortic valve short axis view). The aortic closing click was recorded and
the time from the R-wave to the appearance of the aortic closing click was measured, tA.
Optimal sweep speed was 100 mm/s. IVRT was calculated according to the formula
E AIVRT=t -t .
IVCT was measured as the time distance from the R wave to the aortic valve opening.
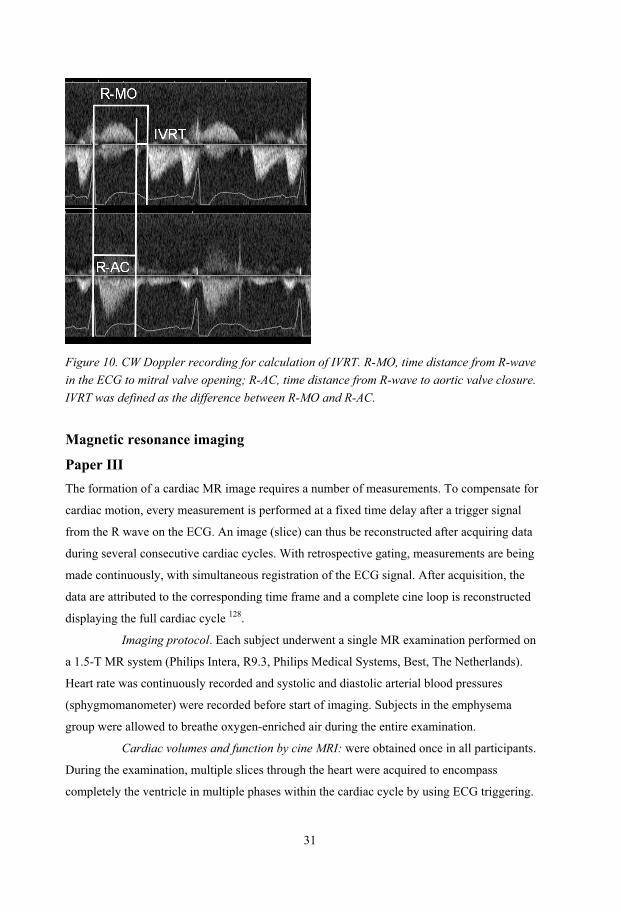
31
Figure 10. CW Doppler recording for calculation of IVRT. R-MO, time distance from R-wave in the ECG to mitral valve opening; R-AC, time distance from R-wave to aortic valve closure. IVRT was defined as the difference between R-MO and R-AC.
Magnetic resonance imaging
Paper ��� The formation of a cardiac MR image requires a number of measurements. To compensate for
cardiac motion, every measurement is performed at a fixed time delay after a trigger signal
from the R wave on the ECG. An image (slice) can thus be reconstructed after acquiring data
during several consecutive cardiac cycles. With retrospective gating, measurements are being
made continuously, with simultaneous registration of the ECG signal. After acquisition, the
data are attributed to the corresponding time frame and a complete cine loop is reconstructed
displaying the full cardiac cycle 128.
Imaging protocol. Each subject underwent a single MR examination performed on
a 1.5-T MR system (Philips Intera, R9.3, Philips Medical Systems, Best, The Netherlands).
Heart rate was continuously recorded and systolic and diastolic arterial blood pressures
(sphygmomanometer) were recorded before start of imaging. Subjects in the emphysema
group were allowed to breathe oxygen-enriched air during the entire examination.
Cardiac volumes and function by cine MRI: were obtained once in all participants.
During the examination, multiple slices through the heart were acquired to encompass
completely the ventricle in multiple phases within the cardiac cycle by using ECG triggering.

32
The images were acquired during breath hold in expiration with approximately 12 sections
through the left ventricle in short axis view. In the short-axis, the contours describing the
endocardial and epicardial border of the myocardium were delineated and the following
parameters for LV and RV were evaluated using commercially available software (Easy
Vision 5.1; Philips, Best, The Netherlands): EF (%), end-diastolic volume (EDV), end-systolic
volume (ESV) and stroke volume (cine-SV). Endocardial contours were traced on the diastolic
and systolic images and the ventricular volume (diastolic or systolic) equals the sum of all the
endocardial areas (of the diastolic or systolic images, respectively) multiplied by the slice
thickness (figure 11 and 12). The LV wall mass (WM) was calculated by tracing the epicardial
borders in diastole to obtain an epicardial volume. The volume of the myocardium was
defined as the epicardial volume minus LVEDV. Multiplication of this value by the specific
gravity for muscle (1.05 g/mL) yields the myocardial mass 93, 103. Papillary muscles were
included in the volume and excluded in the mass determination 117. EDV, ESV, and cine-SV
were indexed to BSA (EDVI, ESVI and cine-SVI respectively).
Figure 11. Cine MRI showing the RV and LV in short axis view. Multiple slices through the heart are acquired to encompass completely the ventricle in multiple phases within the cardiac cycle by ECG triggering. The inner circle describes the endocardial border and the outer circle describes the epicardial border of the myocardium.

33
Figure 12. The cardiac cycle is divided into multiple phases. Each phase consists of 9 to 12 slices. The phases corresponding to end-diastole (phase 1) and end-systole (phase 7) are shown. The entire LV volume can be analysed, but this is very time consuming.
The septal curvature was measured in the short-axis image plane at the most basal
level that showed the full myocardial walls around both ventricles and no outflow tracts or
valves. Within this level, the cine image with the most evident deformation of the septum was
used for quantification. Septal bowing was quantified by the curvature (defined as 1 divided
by the radius of curvature in centimetres), as calculated by entering midwall septal image
coordinates into an analytic fitting routine 106. The sign of the curvature was dependent on the
convexity of the septum. A rightward (physiologic) curvature was denoted as a positive value,
and a leftward curvature as a negative value.
Quantification of aortic flow using MR phase velocity mapping (qf) was performed
once during breath-holding using a phase-contrast ECG-triggered 2D fast field echo (FFE)
sequence at the level of the pulmonary artery, perpendicularly to the ascending aorta. Stroke
volume was evaluated using the Easy Vision 5.1. (See above). Circular regions of interest
(ROI) were placed over the ascending aorta. The contours of the ROI were delineated around
the internal border of the vessel of interest on all images by automated contour detection. SV
(qf-SV) was computed by integrating the flow over a complete cardiac cycle. Qf-SV was
indexed to BSA, qf-SVI.
In quantification of aortic flow using MR phase velocity mapping, the signal
intensity of the pixels is directly proportional to linear velocity (m/s). As the diameter of the

34
vessel (aorta) is measured, linear velocity (m/s) is converted to volume flow (L/s) by
multiplication of vessel area; qf, thus, is a measurement of flow. Using retrospective
triggering/gating the RR-interval can be filled with measuring points of the flow profile for the
entire cardiac cycle 128, 152 (figure 13).
Figure 13. The signal intensity of the pixels is directly proportional to linear velocity (m/s) in quantification of aortic flow using MR phase velocity mapping. As the diameter of the vessel (ascending aorta) is measured, linear flow (m/s) is converted to volume flow (L/s) by multiplication of vessel area. Quantification of aortic flow using MR phase velocity mapping has been validated in vivo and
in vitro and displays excellent accuracy and repeatability 22, 62.
Contrast-enhanced, time-resolved, two-dimensional MR angiography of the heart
and lungs for calculation of the peak transit time (PTT): was performed twice in each patient
for evaluation of repeatability. A 2D T1-weighted, flow-compensated FFE sequence was
applied at the level of the pulmonary trunk and ascending aorta during intravenous gadolinium
bolus injection (2 mL bolus of gadopentetate dimeglumine, Magnevist; Berlex Laboratories,
Wayne, NJ), followed by 20 mL of saline, injected at a rate of 5 mL/s by using an automated
power injector (Spectris Solaris Medrad, Indianola, Pa). Two-dimensional data sets were
acquired at 0.559-1.1 second intervals (approximately 2 Hz) for 25-30 seconds after contrast
material injection. Subjects were requested to hold their breath in expiration during the MR
angiographic examination for at least 30 seconds or as long as was tolerable.
Using the tracer (gadolinium), the transit of an intravascular marker across the lung can be
calculated. The tracer was injected into the antecubital vein and contrast intensity as a function of
0 200 400 600 800
0
100
200
300
400
500
600
700
time (ms)
Ao-flow (mL/s)

35
time was measured in the pulmonary artery and in the aorta. Time-intensity curves were
generated for bolus transit through the ROI (Intera R 9.3, Philips Medical Systems, NL): the
outflow part of the pulmonary artery (PA) and the ascending aorta (AO). The PA and AO curves
were fitted to functions describing peak/pulse curves (PA) and multi-compartment impulse
response exponential decay curves (AO) using the Origin software (Origin Version 7. Origin Lab
Corporation. One Roundhouse Plaza. Northampton, MA 01060 USA). The PA–to–AO PTT was
calculated by subtracting the time of peak signal intensity of the PA curve from that of the AO
curve. PTT was used as an approximate of mean transit time (MTT) 120 (figure 14).
0 2 4 6 8 10 12 14 16 18 20 220
500
1000
1500
2000
2500
3000
3500
sec
PTT 7.9 secintensity
Figure 14. Typical recording of contrast intensity vs. time for the calculation of peak transit
time (PTT). Full line square symbols indicate original values from pulmonary artery (PA)
(left) and aorta (AO) (right). Superimposed with full line/circles are fitted curves according to
pharmacokinetic models. PTT is calculated as the temporal distance between maximum values
of intensity in the PA and AO fitted curves.
Cardiac output was measured using quantification of aortic flow by phase velocity mapping
(qf-CO). The transit of the tracer through the lungs was used to estimate intrathoracic blood
volume according to Zierler 146:
ITBVI=MTT×CO/60×BSA .
Furthermore, ITBVI was estimated from the contrast intensity versus time curves using a non-
linear mixed effect modeling (NONMEM) approach. This uses the NONMEM program
(version V, level 1.1, GloboMax LLC, Hanover MD, USA) with the first-order conditional

36
estimation and interaction analysis procedure. The structural model of the lung used, was a
"tank in series" model. This type of model is suitable for describing intravascular peaks that
are delayed and right skewed, and has been used previously to describe the lung kinetics of the
intravascular marker indocyanine green in man 133.
SVRI was calculated as MAP/qf-CI. All hemodynamic data and data on cardiac dimensions
were normalized to BSA.
Experimental protocols
Paper � and Paper �� In these prospective, open, controlled studies, patients scheduled for LVRS and patients
scheduled for lung lobectomy because of carcinoma were included. After induction of
anaesthesia, systemic and pulmonary hemodynamics (pulmonary artery thermodilution
catheter) and echocardiographic measurements (transoesophageal two-dimensional Doppler
echocardiography) were performed before and immediately after end of surgery with the
patient in the supine position (I) and with passive leg elevation (60-90 degrees) to increase
ventricular preload (II).
Paper ��� In this prospective, open, controlled study, patients with severe emphysema and healthy
control subjects were included. Each patient/subject underwent a single MR examination,
consisting of three parts: 1. Evaluation of RV and LV dimensions and function and
interventricular septum curvature using cine MRI, 2. Quantification of aortic flow using MR
phase velocity mapping and 3. Calculation of the cardiopulmonary PTT from the pulmonary
artery to the ascending aorta, using contrast-enhanced, time-resolved, two-dimensional MR
angiography.
Paper �V In this blinded, placebo controlled study, the experimental procedure was performed in the
operating room after completion of surgery. The patient was positioned in the supine position
and sedated with sevoflurane at an end-tidal concentration of 1%. All patients had sinus
rhythm and were subjected to atrial pacing by external pacemaker wires to establish a constant
heart rate, 5-10 % over baseline, during the entire experimental procedure. Two baseline
measurements of hemodynamic and echocardiographic data were obtained and immediately

37
followed by infusion of placebo or levosimendan (0.05 mg/mL) at two infusion rates: 0.1
μg/kg/min (Dose 1) and 0.2 �g/kg/min (Dose 2) after initial loading doses of 12 �g/kg. The
loading doses of levosimendan were given over 10 minutes, followed by a continuous
intravenous infusion for 20 minutes. The placebo group received equivalent volumes of
isotonic saline as initial loading doses followed by a continuous infusion of isotonic saline at
rates equal to that of the study group. A nurse prepared the study drugs and the investigators
were blinded to the treatment (levosimendan/placebo) the patient was to receive. MAP was
kept constant by infusion of a vasopressor (phenylephrine) and CVP was kept constant by
infusion of hetastarch (Voluven, Fresenius Kabi, Bad Homburg, Germany). Measurements
were performed at the end of each 30-minute treatment period during brief periods of apnea.
One investigator obtained echocardiographic data while another performed hemodynamic
measurements from the pulmonary artery catheter.
Statistics The statistical methods used were analysis of variance for repeated measures (ANOVA),
Student’s t-test, Fisher’s exact test, Bland & Altman and linear regression analysis.
In I the differential effects of surgery between the two groups were evaluated by a
two-way ANOVA for repeated measurements. The effects of surgery within groups and
differences between groups at baseline (before surgery) were analyzed by an analysis of
interactions generated by a two-way hierarchical ANOVA followed by contrast analyses. In ��,
the differential effects of passive leg elevation between the two groups were evaluated by an
analysis of interactions generated by a two-way ANOVA for repeated measurements. In �V
the differential effects of the study drugs between the two groups were evaluated by a two-
way ANOVA for repeated measurements.
An unpaired twotailed Student’s t-test was used to compare groups in ��-�V. In �V,
the Fisher’s exact test was used to compare groups, when appropriate.
In ��� and �V, Bland & Altman analysis was used to compare two methods with
regard to repeatability and agreement 17. In ��� the repeatability of PTT measurements and the
agreement between the two methods for estimation of ITBVI were assessed. In �V, the
repeatability of the echocardiographic measurements (baseline 1 and baseline 2) was
determined.
In ��� linear regression analysis was performed to relate LVEDVI and cine-SVI to
qf-ITBVI. Furthermore cine-SVI was related to LVEDVI, LVSVI to RVSVI, LVEDVI to
RVEDVI and RVSVI to RVEDVI. A p <0.05 was considered statistically significant. The data

38
are presented as mean ± standard deviation (SD) in III and mean ± standard error of the mean
(SEM) in I, II and IV.
39
RESULTS
Systemic hemodynamics and left ventricular dimensions and filling in patients
with severe emphysema before and after lung volume reduction surgery (I) At baseline (before surgery) there were no differences between the LVRS group and the
controls regarding MAP, MPAP, CVP or PCWP. However, CI, SVI, and SWI were
significantly lower, whereas HR was significantly higher in the LVRS group compared with
controls. See table 2. Both PVRI as well as SVRI were significantly higher in the LVRS group
compared with controls at baseline. In the control group undergoing lobectomy, the surgical
procedure did not affect hemodynamic variables, whereas LVRS significantly improved CI,
SVI and SWI in the emphysema patients. Both PVRI and SVRI were significantly lower,
whereas HR was unchanged after LVRS.
Baseline EDAI and ESAI were significantly lower in the LVRS group compared
with controls, whereas the groups did not differ with respect to AEF. See table 3. Pulmonary
lobectomy did not affect LV dimensions or AEF in the control group, whereas LVRS
significantly increased EDAI in the emphysema patients. At baseline, the two groups did not
differ with regards to LV end-diastolic stiffness. Surgery did not affect LV end-diastolic
stiffness in either group (figure 15).
At baseline, the E-dec slope was significantly less pronounced and the E-dec time
was significantly longer in the LVRS group compared with the controls. E-max and the E/A
ratio were significantly lower in the LVRS group whereas the groups did not differ with
respect to A-max at baseline. Pulmonary lobectomy affected none of these variables in the
control group. LVRS significantly improved the E-dec slope and shortened the E-dec time,
and increased significantly transmitral flow velocities as well as the E/A ratio (figure 16).

40
Table 2. Effects of LVRS or Lobectomy on Central Hemodynamic Variables.
Lobectomy LVRS ANOVA
Preop Postop Preop Postop p-value*
MAP (mm Hg) 68.3 ± 3.9 72.7 ± 2.9 71.4 ± 5.7 71.0 ± 3.9 0.47
MPAP (mm Hg) 22.6 ± 2.1 24.0 ± 1.2 26.0 ± 1.6 27.3 ± 1.6 0.97
PCWP (mm Hg) 12.0 ± 1.3 13.8 ± 0.6 14.1 ± 1.7 14.7 ± 2.1 0.56
CVP (mm Hg) 11.3 ± 1.4 13.1 ± 0.7 12.2 ± 1.4 11.2 ± 0.9 0.16
CI (L/min/m2) 2.36 ± 0.17 2.34 ± 0.17 1.86 ± 0.16� 2.60 ± 0.18� 0.002
HR (bpm) 71.5 ± 4.6 73.3 ± 3.5 82.6 ± 3.9� 86.1 ± 2.7 0.67
SVI (mL/m2) 33.1 ± 1.34 31.9 ± 1.60 23.0 ± 2.14� 30.8 ± 2.72� 0.006
SWI (g*m/m2) 25.0 ± 2.05 25.8 ± 118 18.5 ± 2.34� 29.2 ± 3.33� 0.026
SVRI (dyn*s/cm5/m2)
1993 ± 152 2149 ± 211 2684 ± 286� 1887 ± 153� 0.010
PVRI (dyn*s/cm5/m2)
358 ± 47.5 347 ± 45.7 530 ± 39.5� 400 ± 62.9� 0.095
*= indicates p-values comparing differential effects of surgery between the two groups. � = p<0.001 between group comparisons at baseline (Preop). � = p<0.001, effects of surgery within groups. Values are presented as mean ± SEM

41
Table 3. Effects of LVRS and Lobectomy on LV Dimensions and Stiffness
Lobectomy LVRS ANOVA
Preop Postop Preop Postop p-value*
EDAI (cm2/m2) 6.57 ± 0.33 6.56 ± 0.27 5.62 ± 0.55� 6.61 ± 0.52� 0.009
ESAI (cm2/m2) 3.04 ± 0.27 2.94 ± 0.19 2.77 ± 0.38� 2.86 ± 0.30 0.557
AEF 0.54 ± 0.03 0.55 ± 0.02 0.51 ± 0.03 0.57 ± 0.02 0.28
LVEDS
(mm Hg/cm2/m2)
0.56 ± 0.18 0.39 ± 0.18 0.30 ± 0.06 0.28 ± 0.10 0.60
Values are presented as mean ± SEM. *= indicates p-values comparing differential effects of surgery between the two groups. � = p<0.001 between group comparisons at baseline (Preop). �=p< 0.05 between group comparisons at baseline (Preop). � = p<0.001, effects of surgery within groups.
2 3 4 5 6 7 8 9 10 11 125
10
15
20
25
Preoperative Postoperative
Supine
Leg elevation
PCWP, mmHg
EDAI, cm2/m2
Figure 15. PCWP as a function of EDA (= LV end-diastolic pressure-area curve) before and after LVRS. Preoperative: grey, postoperative: black. PCWP and EDA are measured in the supine position with and without passive leg elevation. The stiffness at any point along a given pressure-volume curve is equal to the slope of the tangent drawn to the curve at that point. Surgery did not affect end-diastolic stiffness in the emphysema group.

42
0
10
20
30
40
50
60
70
Time, ms
V, cm/sE-max A-max
Figure 16. Schematic mitral Doppler flow profile before (grey) and after (black) LVRS. Preoperative E-max < A-max indicating impaired diastolic early filling. This phenomenon is partly normalized by LVRS. V = velocity, cm/s.
Left ventricular performance in patients with severe emphysema (II) The patients participating in � were also included in ��. After induction of anaesthesia,
pulmonary and systemic hemodynamic and echocardiographic measurements were performed
before and after volume loading (leg elevation). Volume loading was used to assess LV
preload responsiveness, as the increase in SVI to a certain increase in preload (�PCWP or
�EDAI) was calculated. Likewise, preload recruitable stroke work was calculated to obtain a
load-independent index of systolic function.
Passive leg elevation induced a more pronounced increase in SVI in the emphysema group
and a decrease in SVRI when compared with the control group. See table 4. The
�SVI/�PCWP and the �SVI/�EDAI relationships were significantly higher in the emphysema
group compared with controls. Preload-recruitable stroke work (�SWI / �EDAI) did not differ
between the two groups (figure 17).
Baseline EDAI and ESAI were significantly lower in the emphysema group
compared with controls, whereas the groups did not differ with respect to LV AEF. Passive
leg elevation caused an increase in LV AEF in the emphysema group, which was not seen in
the control group. EDAI increased to a similar extent in the two groups, while ESAI increased
to lesser extent in the emphysema group, during passive leg elevation.

43
None of the patients in the emphysema group had obvious signs of RV hypertrophy
and/or dilatation and in none of the patients a permanent bowing of the septum towards the
LV was noted.
Table 4. Effects of Passive Leg Elevation on Central Hemodynamic Variables
Control Emphysema ANOVA
Baseline Leg elevation Baseline Leg elevation p-value *
MAP (mm Hg) 70.6 ± 4.0 81.1 ± 3.8 71.4 ± 5.7 77.5 ± 5.9 0.2731
MPAP (mm Hg) 21.7 ± 2.3 25.3 ± 2.1 26.0 ± 1.6 29.4 ± 1.5 0.8163
PCWP (mm Hg) 11.8 ± 1.3 15.4 ± 1.4 14.1 ± 1.7 17.2 ± 1.4 0.5316
CVP (mm Hg) 9.7 ± 1.6 12.1 ± 1.7 12.2 ± 1.4 14.5 ± 1.4 0.9248
CI (L/min/m2) 2.5 ± 0.2 2.7 ± 0.2 1.9 ± 0.12� 2.2 ± 0.2 0.0981
HR (bpm) 73.1 ± 4.6 73.3 ± 4.5 82.6 ± 3.9� 79.8 ± 3.6 0.0543
SVI (mL/m2) 34.0 ± 1.0 36.6±1.3 23.0 ± 2.1� 27.7 ± 2.4 0.0396
SWI (g*m/m2) 27.1 ± 1.95 32.5 ± 1.89 17.8 ± 2.2� 22.5 ± 2.50 0.7297
SVRI (dyn*s/cm5/m2)
2013 ± 155 2128 ± 161 2684 ± 286� 2428 ± 263 0.0214
PVRI (dyn*s/cm5/m2)
325 ± 45 295 ± 43 530 ± 40� 456 ± 32 0.2019
Values are given as mean ± SEM. * indicates p-values comparing differential effects of leg elevation between groups. � =p < 0.001 between group comparisons at baseline.

44
4 5 6 7 8 910
15
20
25
30
35
40
EDAI, cm2/m2
Supine
Leg elevation
Supine
Leg elevation
Control
Emphysema
SWI, g*m/m2
Figure 17. Preload recruitable stroke work (�SWI / �EDAI), which is supposed to be a relatively load-independent variable sensitive to changes in alterations in inotropic state, was not significantly different between the two groups, indicating no significant differences in contractile state between the two groups.
Intrathoracic blood volume and left and right ventricular dimensions in
patients with severe emphysema (III)
The finding in the previous studies that LV function is compromised in patients with severe
emphysema due to small end-diastolic dimensions spurred the third study in which
intrathoracic blood volume and cardiac dimensions were measured using MRI.
LVEDVI, LVSVI, RVEDVI, RVSVI, LVEF and RVEF were significantly lower in
the emphysema group. In contrast, LVESVI, RVESVI (table 5), LV wall mass index did not
differ between the two groups. RV wall thickness was <3 mm in all patients. qf-ITBVI and
NONMEM-ITBVI were both significantly lower in patients with emphysema compared with
healthy volunteers (figure 18). The relationships between LVEDVI and cine-SVI (figure 19)
and between RVEDVI and RVSVI were highly correlated. Both LVEDVI and cine-SVI
correlated closely to qf-ITBVI (figure 20). There was a close correlation between RVSVI and
LVSVI and between RVEDVI and LVEDVI (figure 21). Septal curvature did not differ
between the two groups.
SVI and CI were significantly lower in the emphysema group. HR and SVRI were
significantly higher in the emphysema group.

45
There was no difference in mean PTT between the two groups. There was a good
repeatability for estimation of PTT. The NONMEM calculated ITBVI (NONMEM-ITBVI)
showed good agreement with qf-ITBVI.
Table 5. Cardiac Function with Cine Image Acquisition.
Variables Emphysema Control p-value
Left ventricle
EDVI (mL/m2)
66 ±12
84 ± 15
0.0022
ESVI (mL/m2) 34 ± 9 34 ± 11 0.9550
EF (%) 48 ± 7 60 ± 8 0.0006
SVI (mL/m2) 31 ± 6 50 ± 7 0.0001
Right ventricle
EDVI (mL/m2) 73 ±12 91 ± 15 0.0042
ESVI (mL/m2) 41 ± 11 42 ± 11 0.7463
EF (%) 44 ± 9 54 ± 7 0.0067
SVI (mL/m2) 32 ± 7 48 ± 8 0.0001
Septal curvature (cm-1) 0.33 ± 0.05 0.37 ± 0.06 0.177
Values are given as mean ± SD

46
0.0
0.1
0.2
0.3
0.4
0.5
0.6
Controls Emphysema
qf-ITBVI (L/m2)
Figure 18. Individual data on calculated intrathoracic blood volume index (ITBVI) by MR phase
velocity mapping for quantitative aortic flow (qf) measurements (qf-ITBVI) in the control and
emphysema groups. Statistical bars show mean value (diamond), SD and SEM. Filled circles
represent emphysema patients and open circles represent controls.
40 50 60 70 80 90 100 110 12010
20
30
40
50
60
70
80cine-SVI (mL/m2)
LVEDVI (mL/m2)
R = 0.79p < 0.0001
Figure 19. Linear regression showing the close correlation between LVEDVI and LVSVI (cine-SVI). Filled circles represent emphysema patients and open circles represent controls.

47
0.15 0.20 0.25 0.30 0.35 0.40 0.45 0.50 0.5540
50
60
70
80
90
100
110
120
R = 0.83P < 0.0001
LVEDVI (mL/m2)
qf-ITBVI (L/m2)
Figure 20. Linear regression showing the close correlation between qf-ITBVI and LVEDVI. Filled circles represent emphysema patients and open circles represent controls.
40 50 60 70 80 90 100 110 12040
50
60
70
80
90
100
110
120
LVEDVI (mL/m2)
RVEDVI (mL/m2)
R = 0.83p < 0.001
Figure 21. There was a close correlation between RVEDVI and LVEDVI Filled circles represent emphysema patients, and open circles represent control subjects.

48
Effects of levosimendan on systolic and diastolic function in patients with left
ventricular hypertrophy and normal ejection fraction (IV) To establish whether levosimendan exhibits lusitropic effects, patients with diastolic
dysfunction were examined with central hemodynamics (pulmonary artery thermodilution
catheter) and transoesophageal two-dimensional Doppler echocardiography, during controlled
and maintained preload, afterload and heart rate conditions.
The patients in the levosimendan group consisted of 4 females and 8 males,
whereas 6 females and 5 males were included in the placebo group. There were no differences
between the groups regarding demographic variables (gender, age, height, weight and BSA),
preoperative echocardiographic variables (aortic valve area, aortic valve gradient and LV
ejection fraction) clinical presentation, preoperative medications, surgical variables (valve
type, valve size, concomitant coronary artery bypass grafting), duration of CPB time or aortic
cross clamp time. After separation from CPB, TEE revealed normal prosthetic valve function
and no evidence of abnormal flow velocities or LV outflow obstruction for all patients, with or
without the administration of levosimendan.
Baseline hemodynamic data were similar for both groups. In the levosimendan
group, a dose-dependent significant increase in MPAP, CI, SVI and SWI and a dose-
dependent significant decrease in SVRI were observed compared with placebo, whereas there
were no significant differences in SAP, DAP, PCWP, CVP, or PVRI between the two groups
(figure 22).
Baseline EDAI, ESAI and AEF were similar for both groups. There was a trend for
an increase in AEF in the levosimendan group compared with placebo (p = 0.058), whereas
there were no differences in EDAI or ESAI between the two groups.
At baseline, E-dec slope, E-dec time, E-max, A-max, E/A ratio, IVRT and IVCT
were similar for both groups. In the levosimendan group, dose-dependent increases in E-max,
A-max and E-dec slope were noted, whereas there was a trend for a decrease in E-dec time (p
= 0.06) compared with placebo. There was no difference in E/A between groups (figure 23).
IVRT decreased dose dependently with levosimendan compared with placebo (figure 24).
There was a trend (p = 0.015) for a decrease in IVCT with levosimendan.
The infusion rates of phenylephrine at baseline and at the two infusion rates were
0.052 ± 0.021, 0.26 ± 0.081 and 0.26 ± 0.076 μg/kg/min respectively for the levosimendan
group. Corresponding infusion rates for the placebo group were 0.017 ± 0.012, 0.101 ± 0.082
and 0.112 ± 0.091 μg/kg/min, respectively.

49
There was good reproducibility for repeated estimation of EDAI, ESAI, AEF, E-dec slope, E-
dec time, E-max, A-max, E/A and IVRT.
Baseline Dose 1 Dose 228
30
32
34
36
38
40
42
44SVI
mL/m2
Levosimendan
Placebo
Figure 22. The effect of levosimendan versus placebo on SVI. Filled circles represent levosimendan group and open circles represent placebo group. Data are represented as mean ± SEM.
0
20
40
60
80
100
V, cm/s
Time, ms
E-max
A-max
Figure 23. Schematic mitral Doppler flow profile before (grey) and after (black) levosimendan. V = velocity, cm/s.
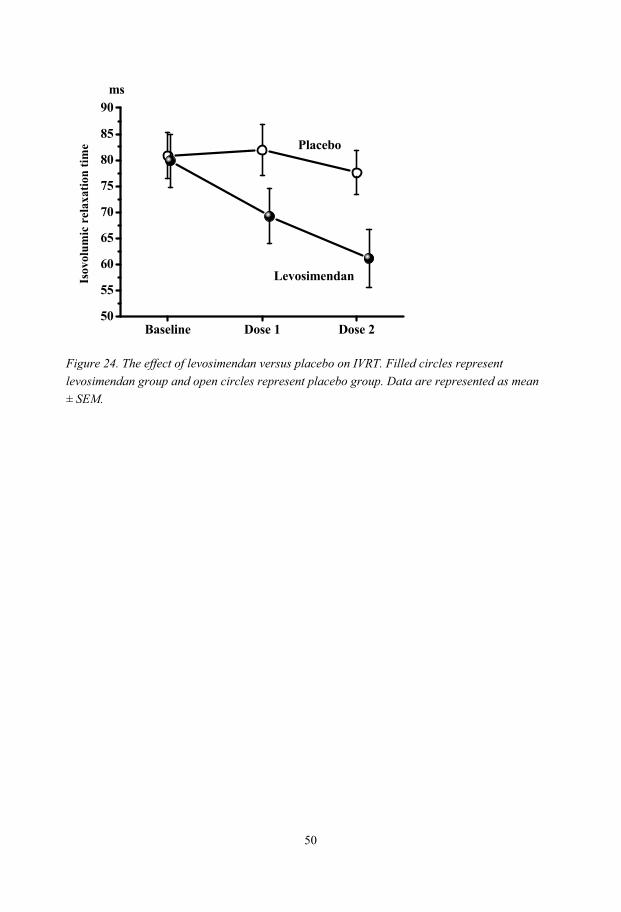
50
Baseline Dose 1 Dose 250
55
60
65
70
75
80
85
90
Placebo
Levosimendan
msIs
ovol
umic
rel
axat
ion
time
Figure 24. The effect of levosimendan versus placebo on IVRT. Filled circles represent levosimendan group and open circles represent placebo group. Data are represented as mean ± SEM.

51
DISCUSSION
Methodological considerations Assessment of cardiac preload
LV preload is routinely assessed by the CVP or the PCWP. However, it is increasingly evident
that CVP and PCWP are poor predictors of LV preload particularly in patients ventilated with
high intrathoracic pressures 23, 35, 72. This also seems to be likely for patients with severe
emphysema with high intrinsic PEEP, because CVP and PCWP in patients with emphysema
do not differ from that seen in patients undergoing lobectomy, as shown in � and �� and by
Haniuda et al. 51, despite the lower LV end-diastolic dimension in the former group.
Reviewing the literature regarding preload surrogates, Cheatham et al. 23 found that
CVP and PCWP were not reliable predictors of preload status in patients in treatment of acute
respiratory failure requiring PEEP. The application of PEEP at any level >5 cm H2O increased
CVP and PCWP by an amount that was completely unpredictable. Luecke et al. 72 assessed the
impact of high intrathoracic pressures on LV volume and function in sheep using computed
tomography. They also tested the hypothesis that RVEDV and ITBV represent cardiac preload
and are superior to CVP and PCWP. The validity of these parameters was tested by means of
correlation with LVEDV, the “true cardiac preload” 72. The authors concluded that unlike
cardiac filling pressures, RVEDV and ITBV provide valid estimates of cardiac preload even at
high intrathoracic pressures. Wiesenack et al. 140 measured ITBV using PiCCO (Photonic
integrated Circuits using Crystal Optics), which estimate ITBV from intermittent CO
assessment by transpulmonary thermodilution and global end-diastolic volume (GEDV) by
transpulmonary single indicator dilution. They found that increased cardiac preload was more
reliably reflected in ITBV than in CVP or PCWP.
LVEDA assessed by TEE as a predictor of preload has been studied by Cheung et
al. 24. They found that TEE was highly sensitive for detecting changes in LV function and
preload following controlled decreases in the blood volume. The changes in LVEDA
accurately reflected the decrement in conventional hemodynamic determinants of LV preload
(PCWP) and PA pressures 97. Swenson et al. 122 used LVEDA and FAC to guide optimal LV
filling in patients with well preserved LV function with and without LV hypertrophy. In
patients with normal wall thickness, LVEDA and FAC corresponded to a range of filling
pressures (PCWP 13-19 mm Hg) conventionally targeted to maximize LV performance. In
patients with LV hypertrophy, PCWP ranged from 20 to 25 mm Hg at the stage in volume

52
resuscitation when LVEDA and FAC showed appropriate preload for optimal ventricular
performance. These patients were managed correctly with supranormal PCWP but the
identification of hypertrophy would still have to be made by TEE. End-diastolic area versus end-diastolic volume: In �, �� and �V, LVEDA was used as a
substitute for LVEDV. Clements et al. 25 have shown that EDA closely reflects EDV, employing
TEE and radionuclide angiography respectively. Furthermore, in the present studies focus was
not on absolute volume measurements, but rather on the relative change in LV end-diastolic
dimension. Assessment of transmural filling pressure: One limitation of � and �� was that the
intrathoracic pressure was not assessed and therefore true LV transmural filling pressures could
not be established. To overcome this problem, LV preload was assessed by LVEDA. Because of
the low elastic recoil of the lungs in pulmonary emphysema, and less negative intrathoracic
pressure 129, 130, 135, transmural LV pressures were probably lower in the emphysema group
compared with controls.
Magnetic resonance imaging
Peak transit time versus mean transit time: In ���, PTT was measured by subtracting the times of
peak AO and PA signal intensities 112, rather than by subtracting the first moment of the curves to
achieve mean transit time, which, by definition, is used for calculation of ITBV 146. However, it
has been shown that PTT is an excellent approximate of mean transit time, PTT being less than
4% higher than mean transit time 120. The utility of the PTT approach for estimation of ITBV is
supported by the NONMEM modeling analysis, which gave identical results. Motion artifacts in magnetic resonance imaging: An impediment to MRI of the chest
is artifacts caused by respiratory motion. To compensate for this, breath-holding was
implemented. Many patients, however, have difficulty sustaining adequate breath-hold, and
furthermore, a sustained breath-hold may cause a cranial diaphragmatic drift, (which can be
substantial ~ 1 cm) resulting in registration errors 128. Thus, in ���, patients in the emphysema
group were less likely to hold their breath during expiration for 25-30 seconds. In spite of this,
contrast-enhanced time-resolved two-dimensional MR angiography provided PTT measurements
with a high repeatability. In addition, in our control group, PTT was 7.5 ± 1.6 seconds, which is
comparable to 7.2 ± 1.2 seconds as shown by Shors et al. in their control subjects 112.
Papillary muscles and the calculation of ventricular volumes: The issue whether
trabeculation and papillary muscles should be included in the calculation of ventricular volume or
mass has been a matter of controversy 36, 107, 108. The ventricular trabeculation and the papillary

53
muscles were included in the volume analysis in III, because this technique is less time
consuming. Magnetic resonance imaging versus echocardiography: Cine MRI is well validated
for quantifying the volumes and mass of the ventricles and it has become the clinical gold
standard against which other techniques are assessed, because of its three-dimensional nature,
which is not reliant on geometric assumptions 94. Accuracy 71, 105 and reproducibility is excellent,
which has lead to a significant reduction in sample sizes for drug trials with heart failure 15. The
accuracy of cine MRI for measurement of global LV volume has been achieved by comparing
LV stroke volume with the stroke volume of the right ventricle or with aortic flow measured
using velocity mapping, and showing their equivalence in normal human subjects 152.
Transthoracic echocardiography, on the other hand, is the most frequently used
technique for assessment of LV function. It is readily available and non-invasive. LV volumes
and mass can be measured using two-dimensional or M-mode echocardiography but
reproducibility is lower than that for cine MRI 14, 47, 61, 139. Furthermore echocardiography
relies on geometrical assumptions and in patients with COPD, it can be difficult to obtain an
adequate acoustic window because of the hyperinflated lungs, resulting in poor image quality.
Levosimendan and cardiac function
Two-dimensional versus three-dimensional measure of LV AEF: Levosimendan exerted a
positive inotropic effect as reflected by the 25% increase in SVI. There was a trend for an
increase in LV AEF in the levosimendan group compared with placebo by 12 % (p = 0.0575).
If we had used a volumetric method to measure LV EF, the increase in LV EF with
levosimendan would probably have been more obvious.
Estimation of isovolumic contraction time: IVCT is defined as the time period
between mitral valve closure and the aortic valve opening click. In IV, the time interval between
the R wave and the aortic valve opening was used as a surrogate for IVCT, because this time
period is more readily obtained by TEE. Phenylephrine and myocardial relaxation: Levosimendan has vasodilatory effects and
not surprisingly the study group required a higher dose of the pure �-agonist phenylephrine than
the placebo group. To our knowledge, there are no data suggesting that phenylephrine has �-
adrenergic properties, which could improve myocardial relaxation, or that myocardial �-receptor
stimulation may improve myocardial relaxation. Therefore, we consider it unlikely, that the
improved LV relaxation and diastolic filling seen in the levosimendan group was caused by the
higher dose of phenylephrine.

54
Reduced ventricular end-diastolic dimensions in severe emphysema In patients with severe emphysema it was shown that end-diastolic dimensions of both RV and
LV are reduced compared with those of control patients, indicating that emphysema patients
have a problem with cardiac filling (preload). Thus, LVEDAI was decreased in these patients
subjected to anaesthesia and positive pressure ventilation, as assessed by TEE. The mitral
Doppler findings from these patients, the decreased E-max, E/A ratio and E-dec slope and the
increase in E-dec time were also suggestive of a low preload in emphysema patients.
Furthermore, MRI investigations revealed low LV and RV end-diastolic volumes
in spontaneously breathing patients with severe emphysema compared with healthy controls.
The lower EDAI in emphysema patients was associated with apparently normal PCWP
compared with controls. However, PCWP estimates intracavitary left atrial pressure and LV
end-diastolic pressure whereas the true LV transmural pressures were not assessed.
Impaired left ventricular performance in severe emphysema Cardiac performance was compromised in patients with severe pulmonary emphysema, as
demonstrated by a lower SVI, SWI and CI when compared with controls matched for gender,
age and BSA. LV systolic function, as judged by the LV AEF did not appear to be different
from the control group and impaired contractility probably does not cause the lower SVI and
SWI in the LVRS group. Patients with normal contractility are not particularly sensitive to
changes in LV outflow impedance 121 and therefore the higher SVRI in the emphysema
patients (33%) is probably not the main mechanism behind the lower SVI and SWI in these
patients. A lower EDAI in combination with an apparently normal PCWP would suggest an
increased LVEDS in the emphysema patients, in turn caused by external compression
(pulmonary tamponade) from the hyperinflated lungs. However, LVEDS did not differ
significantly between the two groups.
The finding in �� that a certain increase in LV preload (PCWP or EDAI) caused a
more pronounced increase in SVI and LV AEF is indirect evidence that the LV of emphysema
patients seems to be hypovolemic in diastole. This indicates that the LV operates on a steeper
portion of the (normal) Frank-Starling relationship in these patients and thus has a less than
optimal diastolic stretch of the myocardial sarcomeres at baseline (figure 25). Furthermore,
because the ejection fraction is preload dependent 150, the lower LV and RV EF in the
emphysema patients in III, could probably be attributed to low end-diastolic volumes.

55
EDV (mL)
SV (m
L)
A B
Figure 25. The relationship between EDV and SV. Patient with emphysema (A) operates on a steeper portion of the normal Frank-Starling relationship compared with a healthy subject (B).
Alternatively, the vigorous hemodynamic response to this standardised increase in
preload in emphysema patients could be a sign of higher inotropic state of their LV, operating
on leftward-shifted and steeper LV function curves. However, the relationship between stroke
work (SWI) and LV end-diastolic dimensions (EDAI), the so-called preload recruitable stroke
work, which is a relatively load-independent variable, sensitive to changes in alterations in
inotropic state 43, was not significantly different between the two groups, indicating no
significant differences in LV contractile state between the two groups. This is further
supported by the fact that baseline LV AEF did not differ significantly between the two groups
in �. If anything, the two indices of LV systolic performance (PRSW and LV AEF) were
slightly lower in the emphysema group. As a formal power analysis was not performed prior
to the study, we cannot rule out the possibility that LV systolic function is slightly depressed
in patients with emphysema. If so, one would have expected that the LV of the emphysema
patients operates on a more flat LV function during a volume challenge and not a steeper one,
as suggested by the data from ��.

56
Why are the ventricular end-diastolic dimensions decreased in emphysema? The lower RV and LV end-diastolic dimensions in patients with emphysema could be caused
by external compression (pulmonary tamponade) from the hyperinflated lungs increasing end-
diastolic stiffness. In I, however, it was shown that the LV end-diastolic pressure-area
relationship is not different from that seen in non-emphysematous patients, indicating that the
hyperinflated lungs do not increase LV end-diastolic stiffness in patients with severe
emphysema (I).
Another mechanism for the impaired filling of the LV in patients with emphysema
could be LV diastolic dysfunction caused by LV hypertrophy. However, LV wall mass is not
increased in these patients with emphysema, as shown previously 136, 137 and in III. A third
explanation for the low LVEDV in these patients could be a leftward shift of the
interventricular septum, causing an underfilling of the LV, as has been shown in patients with
primary pulmonary hypertension 40 and also in some patients with emphysema 137. This
mechanism is less likely since the configuration of the interventricular septum did not differ
between the groups (III). Furthermore, none of the patients in the present studies had severe
pulmonary hypertension (SPAP > 55 mmHg), as evaluated by Doppler-echocardiography and
none had RV hypertrophy.
In III a close relationship between ITBVI and LVEDVI and between LVEDVI and
SVI was demonstrated, which strongly suggests that a low preload, caused by intrathoracic
hypovolemia, contributed to the impaired LV performance seen in patients with severe
emphysema. Data from III confirm the results from I: The anesthetized patients with severe
emphysema demonstrated a lower LVEDAI and mitral Doppler flow indices of impaired LV
filling when compared with anesthetized non-emphysematous patients. To our knowledge, a
decreased ITBV compromising cardiac performance has not previously been demonstrated in
patients with severe emphysema.
Why is intrathoracic blood volume decreased in severe emphysema? Intrathoracic hypovolemia in patients with severe emphysema could be explained by the well-
known dynamic hyperinflation and hence the generation of PEEPi seen in these patients 74, 129-
131. Tschernko et al. have shown that minimal PEEPi levels range between 5-7.5 cm H2O in
patients with severe emphysema 129, 130. In the present studies we did not measure PEEPi or
intrathoracic pressure, which is a major limitation of the studies. However, ‘our patients’
57
characteristics and lung function data were identical to those described by Tschernko et al. 129.
Therefore, it would seem reasonable that PEEPi levels were high also in the present studies.
In patients with normal lung function, positive pressure-respiration with PEEP
depletes the intrathoracic vascular bed and the heart, decreasing both pulmonary vascular and
RV and LV end-diastolic volumes 19, 57, 63, 81, 99, 124, 144. Furthermore, PEEP induces changes in
the mitral-Doppler derived indices indicative of impaired LV filling 57, 77, 144. One could
speculate that the PEEPi-induced decrease in ITBV is caused by a decreased capacitance of
the pulmonary vascular bed in emphysema due to the hyperinflated lungs, which may
redistribute blood to the periphery.
Lung volume reduction surgery improves cardiac preload in severe
emphysema The suggestion that high PEEPi levels are of importance to explain the decreased intrathoracic
blood volume in severe emphysema is supported by our findings that lung volume reduction
surgery improves LV performance in emphysematous patients (�). This improvement was
accompanied by an increase in LV end-diastolic area index and mitral Doppler flow indices of
improved LV filling (�). Lung volume reduction surgery is associated with a diminution of
PEEPi, 111, 129, 130, 132 which thus could normalize a low ITBV, as well as low RV and LV end-
diastolic blood volumes in these patients.
Likewise the improvement in LV diastolic filling pattern, seen after LVRS, does
not match a decrease in LV outflow impedance even though both PVRI and SVRI decrease
after LVRS. Houltz et al. 56 have previously shown that a selective dilation of systemic and
pulmonary resistance vessels, unloading RV and LV, usually increases both E-max as well as
A-max with no change in the E/A ratio, and no change in E-dec time. In �, however,
particularly E-max and E/A ratio increased and E-dec time decreased. There was a
comparably less pronounced increase in A-max. These LVRS-induced changes of the mitral
Doppler flow pattern are expected when LV preload is increased 125, 127.
A reduction in ITBV in severe emphysema could also be explained by a diminution
of the pulmonary vascular bed and a decreased pulmonary blood volume, as a consequence of
the disease, since all patients had severe emphysema. On the other hand, lung volume
reduction surgery, which causes a further pruning of the pulmonary vascular tree, improved
LV performance in emphysematous patients. This improvement was accompanied by an
increase in LVEDAI and mitral Doppler flow indices of improved LV filling.

58
Cardiopulmonary transit time in severe emphysema The cardiopulmonary transit time of an indicator is proportional to its volume of distribution
(ITBV) and inversely proportional to flow (CO), according to fundamental principles of tracer
kinetics 98. In III, PTT was measured by time-resolved MR angiography. It has previously
been shown that PTT is significantly higher in patients with LV systolic dysfunction compared
with healthy controls 112. In heart failure, PTT correlated positively with LV end-diastolic
volumes. In patients with severe emphysema, PTT was not significantly different from
controls, because the low CO, which would have increased PTT, was accompanied by a
decreased ITBV, which will decrease PTT. In other words, the time required for oxygen
uptake is maintained in emphysema patients, despite the low CO, because of the low ITBV.
Increased sympathetic activity in severe emphysema In patients with severe emphysema, the high SVR and HR, might be the adaptive
cardiovascular sympathetic reflex response to low LVEDV:s and stroke volumes as shown in
the present thesis and by Vonk Noordegraaf et al. 136, 137. Lower stroke volume and LVEDV
would unload arterial baroreceptors and cardiopulmonary volume receptors 153, respectively,
inducing a reflex increase in sympathetic nerve activity, which would explain the increase in
plasma catecholamines 55, 83, SVR and HR 136, 137 seen in these patients.
The effects of levosimendan on left ventricular relaxation and early filling in
diastolic dysfunction In �V, the effects of incremental infusion rates of levosimendan on LV relaxation and systolic
performance were studied immediately after aortic valve replacement for aortic stenosis during
controlled and maintained preload, afterload and heart rate conditions. The main findings were
that the beneficial effect of levosimendan on systolic performance was accompanied by an
improvement in LV relaxation; that is, levosimendan has a positive lusitropic effect in patients
with LV hypertrophy.
In light of the impaired relaxation seen in patients with LV hypertrophy, one would
have expected that an enhanced Ca2+ sensitivity might have negative effects because increased
sensitivity to Ca2+ would further hinder relaxation of the heart, worsening diastolic dysfunction.
Indeed, it has been shown that Ca2+ sensitizers prolong relaxation time and impair diastolic
function 50, 54. Levosimendan, on the other hand, does not prolong relaxation time 49. Unlike other

59
Ca2+ sensitizers, levosimendan acts through direct binding with troponin-C, selectively increasing
the affinity of troponin-C for Ca2+ in a concentration-dependent manner 48. It thus binds to
troponin-C at high systolic intracellular Ca2+ concentration and detaches from it at low diastolic
concentration. An absence of Ca2+ sensitization under low prevailing Ca2+ concentrations during
diastole would be of critical importance to prevent a worsening of heart failure. The mechanism
responsible for the improvement of diastolic function, previously described in experimental in
vitro studies 50, 58, and demonstrated in the present study, is less understood. It has been shown
that levosimendan also exerts a selective inhibition of PDE-��� activity, particularly in human
myocytes 5, 149, which could explain the positive lusitropic effect, especially at higher
concentrations 53.
Increased contractility and intraventricular restoring forces One could argue that the improved LV early filling seen with levosimendan could be caused
by the generation of LV intraventricular restoring forces resulting from the levosimendan-
induced increase in inotropy. It has been shown in animals with structurally normal hearts,
that when the LV contracts, the chamber may be compressed, generating restoring forces
during systole, which allows filling to occur at lower than normal pressures 67. Their
magnitude is inversely related to the end-systolic volume and occurs at low LV end-diastolic
pressures (5 mm Hg) 67. We cannot completely rule out the possibility that the levosimendan-
induced increase in LV filling is caused by the generation of restoring forces, particularly
because stroke volume and LV AEF increased with levosimendan. However, we consider this
mechanism less likely because LV filling pressures (PCWP) were within the range of 12-15
mm Hg in both groups in the present study and because neither PCWP nor ESAI differed
significantly between groups.
Determinants of left ventricular relaxation LV relaxation, an important element of diastolic function, is an energy-dependent process,
involving the removal of Ca2+ from troponin-C, followed by the dissociation of actin and
myosin cross bridges, thus allowing the myofibrils to relax and to return to their original end-
diastolic length 90. LV relaxation is classically evaluated by the exponential time constant of
isovolumic relaxation, tau, requiring cardiac catheterisation to measure LV pressure. IVRT, a
commonly used non-invasive variable of LV relaxation 68 is regarded as a reflection of tau.
Thus, a direct correlation between IVRT and tau has been described 82, 84, 145. IVRT, however,

60
is affected by both aortic 68 and left atrial pressures 82. In an experimental study, Thomas et al.
found that IVRT has a predictable quantitative relationship to � and to left atrial and aortic
pressures 126. IVRT was directly related to � and aortic pressure and inversely related to left
atrial pressure.
In the present study, our aim was to study the potential direct effects of
levosimendan on LV early relaxation, assessed by changes in IVRT. Therefore aortic and left
atrial pressures were maintained at a constant level during the experimental procedure by
colloid and vasopressor infusions. The evolution of arterial pressure and left atrial pressure
was not significantly different between the two groups, suggesting that the 23% reduction in
IVRT by the highest dose of levosimendan was caused by a more rapid isovolumic relaxation.
Thus, in addition to the positive inotropic effect, levosimendan exerts a positive lusitropic
effect in patients with LV hypertrophy and maintained systolic function.
IVRT is defined as the time interval between aortic valve closure (end-systole) and
mitral valve opening. One limitation of the present study was that aortic/LV end-systolic
pressure was not measured. Instead, mean aortic pressure was used as a surrogate for LV end-
systolic pressure and controlled by phenylephrine infusion. We therefore cannot completely
exclude the possibility that LV end-systolic pressure might have been decreased by
levosimendan, which to some extent could have contributed to the fall in IVRT.
Aortic stenosis and diastolic dysfunction Diastolic dysfunction with impaired LV relaxation and decreased LV chamber compliance is
commonly seen in patients with severe aortic stenosis 116. In addition, the ischemia-
reperfusion injury after cardiac surgery and CPB might have further impaired diastolic
function in the present study. Postoperatively and before drug administration, the transmitral
blood flow velocity profile, showed a ‘pseudo-normalized pattern’, with a E/A ratio > 1,
normal to moderately elevated E-dec time and IVRT 41, 85. This combined with higher-than-
normal filling pressures and LV concentric hypertrophy with reduced LV end-diastolic
dimensions 65, 118, indicates that a moderate stage of LV diastolic dysfunction with a decreased
LV chamber compliance was present in our patients.
Levosimendan, in contrast to placebo, shortened IVRT, decreased E-dec time and
E-dec slope (steeper), most likely through a more rapid and pronounced LV relaxation,
causing a shorter time for equilibration of left atrial and LV pressures and improved early
filling of the LV. Filling of the LV in late diastole caused by atrial contraction (A-max) was
also increased, which could be explained by a levosimendan-induced improved contractility of

61
the left atrium. Despite the improved LV relaxation caused by levosimendan with improved
LV filling, this positive lusitropic effect was not translated into an improvement in the LV
end-diastolic pressure-area relationship. The LV end-diastolic area index was not increased
with levosimendan compared with placebo at maintained LV filling pressures.
Inotropic agents and diastolic dysfunction in aortic stenosis In a recent randomized controlled trial, Maslow et al. assessed the effects of epinephrine and
milrinone on biventricular systolic and diastolic function after AVR for AS 75. According to
their Doppler findings, both epinephrine and milrinone improved right and left ventricular
systolic function whereas neither of the inotropic agents differed from placebo with respect to
IVRT or early filling of the LV. The interpretation of their findings could be that milrinone
and epinephrine have less obvious lusitropic effects in this situation, in contrast to the effects
of levosimendan described in IV, or that the potential beneficial effects of the epinephrine or
milrinone on Doppler echocardiographic variables of LV diastolic function were obscured by
the fact that no measures were taken to control heart rate or loading conditions in their study.
The use of inotropes or vasodilators to treat patients with AS after AVR is
controversial, because it may induce LV outflow (LVOT) obstruction. With septal
hypertrophy, a reduction in the diameter of the LVOT leads to an increased velocity of blood
and turbulent flow during systole. This creates a Venturi effect, which may entrain the anterior
mitral leaflet. The end result is a LVOT obstruction and a mitral coaptation defect 115.
Maslow et al. evaluated the risk of LV outflow obstruction caused by epinephrine
and milrinone stimulation and found no evidence of abnormal flow velocity profiles or LV
outflow obstruction in any of the patients 75. Their findings were confirmed by data from the
present study showing no signs of levosimendan-induced LV outflow obstruction.
62
CONCLUSIONS
In patients with severe emphysema, cardiac performance is impaired as reflected in subnormal
values of stroke volume and cardiac output.
This impaired cardiac performance is caused by inadequate diastolic filling (decreased
preload) of the right and left ventricle. Thus, the left ventricle is hypovolemic and operates on
a steeper portion of the normal left ventricular function curve.
The decreased biventricular preload is explained by a low intrathoracic blood volume most
likely caused by the hyperinflated lungs (high intrinsic PEEP).
In patients with severe emphysema, lung volume reduction surgery, a procedure known to
alleviate intrinsic PEEP, improves left ventricular end-diastolic dimensions and filling, which
at least partly could explain the improved exercise tolerance.
Levosimendan, in addition to its inotropic effects, exerts a direct positive lusitropic effect in
patients with left ventricular hypertrophy and diastolic dysfunction as it shortens isovolumic
relaxation time and improves early left ventricular filling.

63
ACKNOWLEDGEMENT
Numerous people from across the world have contributed with their knowledge and friendship
in the completion of this thesis. It has been a great experience to work with people from
different walks of academic life, and I appreciate the open-mindedness with which they have
embraced my project:
With great didactic skills, my tutor Professor Sven-Erik Ricksten introduced me to the
research process and transformed theoretical cardiac physiology into a practical experience.
Professors Björn Biber and Hengo Haljamäe, Heads of Department of Anaesthesiology and
Intensive Care Medicine, The Sahlgrenska Academy provided me the opportunity to perform
the studies.
Klaus Kirnø, MD, PhD. Former Head of Department of Cardiothoracic Anaesthesia and
Intensive Care, Sahlgrenska University Hospital for his support and positive attitude towards
research in the clinical arena.
Erik Houltz, MD, PhD. For teaching me transoesophageal echocardiography and helping me
find my way in the statistics.
Markus Müller, MD, PhD. For sharing his extensive knowledge of cardiac MRI and adding a
Swiss twist to the analysis of the MRI data.
Jacqueline Nel, Queen of the MRI tribe, for performing all the MRI examinations with
professionalism and a great sense of humour, and for extending her friendship beyond the dark
rooms of MRI to the colourful, vibrant and wine-flowing country of her native South Africa.
Richard Upton, B Sc, PhD, for introducing me to a mathematical approach to
pharmacokinetic modelling and reducing my dread for equations.
Odd Bech-Hanssen, MD, PhD, for sharing his extensive knowledge in echocardiography, and
for his great enthusiasm “in getting it right”.
Anders Thylén, MD, PhD and Katarina Karlsson, Transplantation Coordinator, for
generously identifying and recruiting patients for the MRI study.
Professor Guy Ludbrook, for inviting me to work at The Royal Adelaide Hospital, for
introducing us to “the Australian lifestyle” and for valuable advice on pharmacokinetic
models.
Colleagues and staff at the Departments of Cardiothoracic Anaesthesia and Intensive Care
and Cardiothoracic Surgery, for assistance and support during the clinical experiments.
All the volunteers who kindly participated in the MRI study.

64
Staff at the Departments of Radiology, and Clinical Physiology.
Inge and Ole Esbjerg Jørgensen, my parents, and Mette, my sister, for love and support
during all times. Bent Sørensen, my brother in law, for enthusiastically helping me design the
front cover.
Søren Søndergaard, MD, PhD. My husband and best friend. For love and support during
times of joy as well as times of trouble. For generously and ardently discussing all matters
between heaven and earth, and for sharing his extensive knowledge in science, computers,
mathematics and linguistics with me. For his readiness to embark on new adventures to satisfy
his family’s endless curiosity about the world outside home.
Anna and Niels, our wonderful children, the joy of my life.
These studies were supported by the LUA/ALF-project at Göteborg University, the Swedish
Research Council, and the Göteborg Medical Society.

65
REFERENCES
1. Long-term oral acetylcysteine in chronic bronchitis. a double-blind controlled study. Eur J Respir Dis Suppl 111: 93-108, 1980.
2. Long term domiciliary oxygen therapy in chronic hypoxic cor pulmonale complicating chronic bronchitis and emphysema. Report of the Medical Research Council Working Party. Lancet 1: 681-686, 1981.
3. Patients at high risk of death after lung-volume-reduction surgery. N Engl J Med 345: 1075-1083, 2001.
4. Pulmonary rehabilitation-1999. American Thoracic Society. Am J Respir Crit Care Med 159: 1666-1682, 1999.
5. Ajiro Y, Hagiwara N, Katsube Y, Sperelakis N, and Kasanuki H. Levosimendan increases L-type Ca(2+) current via phosphodiesterase-3 inhibition in human cardiac myocytes. Eur J Pharmacol 435: 27-33, 2002.
6. Allman K, and Wilson I. Oxford handbook of anaesthesia. In: Oxford handbooks. Oxford ; New York: Oxford University Press, 2006, p. Chapter 15.
7. Anthonisen NR, Connett JE, Kiley JP, Altose MD, Bailey WC, Buist AS, Conway WA, Jr., Enright PL, Kanner RE, O'Hara P, and et al. Effects of smoking intervention and the use of an inhaled anticholinergic bronchodilator on the rate of decline of FEV1. The Lung Health Study. Jama 272: 1497-1505, 1994.
8. Anthonisen NR, Wright EC, and Hodgkin JE. Prognosis in chronic obstructive pulmonary disease. Am Rev Respir Dis 133: 14-20, 1986.
9. Appleton CP, Jensen JL, Hatle LK, and Oh JK. Doppler evaluation of left and right ventricular diastolic function: a technical guide for obtaining optimal flow velocity recordings. J Am Soc Echocardiogr 10: 271-292, 1997.
10. Barnes PJ. Chronic obstructive pulmonary disease. N Engl J Med 343: 269-280, 2000. 11. Bates DV. The fate of the chronic bronchitic: a report of the ten-year follow-up in the
Canadian Department of Veteran's Affairs coordinated study of chronic bronchitis. The J. Burns Amberson Lecture of the American Thoracic Society. Am Rev Respir Dis 108: 1043-1065, 1973.
12. Baum GL, Schwartz A, Llamas R, and Castillo C. Left ventricular function in chronic obstructive lung disease. N Engl J Med 285: 361-365, 1971.
13. Bayram M, De Luca L, Massie MB, and Gheorghiade M. Reassessment of dobutamine, dopamine, and milrinone in the management of acute heart failure syndromes. Am J Cardiol 96: 47G-58G, 2005.
14. Bellenger NG, Burgess MI, Ray SG, Lahiri A, Coats AJ, Cleland JG, and Pennell DJ. Comparison of left ventricular ejection fraction and volumes in heart failure by echocardiography, radionuclide ventriculography and cardiovascular magnetic resonance; are they interchangeable? Eur Heart J 21: 1387-1396, 2000.
15. Bellenger NG, Davies LC, Francis JM, Coats AJ, and Pennell DJ. Reduction in sample size for studies of remodeling in heart failure by the use of cardiovascular magnetic resonance. J Cardiovasc Magn Reson 2: 271-278, 2000.
16. Berglund JE, Halden E, Jakobson S, and Landelius J. Echocardiographic analysis of cardiac function during high PEEP ventilation. Intensive Care Med 20: 174-180, 1994.
17. Bland JM, and Altman DG. Statistical methods for assessing agreement between two methods of clinical measurement. Lancet 1: 307-310, 1986.
18. Brantigan OC, Mueller E, and Kress MB. A surgical approach to pulmonary emphysema. Am Rev Respir Dis 80: 194-206, 1959.

66
19. Brienza N, Dambrosio M, Cinnella G, Conte M, Puntillo N, and Bruno F. [Effects of PEEP on intrathoracic and extrathoracic blood volumes evaluated with the COLD system in patients with acute respiratory failure. Preliminary study]. Minerva Anestesiol 62: 235-242, 1996.
20. Butler J. The heart is in good hands. Circulation 67: 1163-1168, 1983. 21. Casey J. Exploring curvature. Braunschweig: Vieweg, 1996, p. xv, 291 p. 22. Chatzimavroudis GP, Oshinski JN, Franch RH, Walker PG, Yoganathan AP, and
Pettigrew RI. Evaluation of the precision of magnetic resonance phase velocity mapping for blood flow measurements. J Cardiovasc Magn Reson 3: 11-19, 2001.
23. Cheatham ML, Nelson LD, Chang MC, and Safcsak K. Right ventricular end-diastolic volume index as a predictor of preload status in patients on positive end-expiratory pressure. Crit Care Med 26: 1801-1806, 1998.
24. Cheung AT, Savino JS, Weiss SJ, Aukburg SJ, and Berlin JA. Echocardiographic and hemodynamic indexes of left ventricular preload in patients with normal and abnormal ventricular function. Anesthesiology 81: 376-387, 1994.
25. Clements FM, Harpole DH, Quill T, Jones RH, and McCann RL. Estimation of left ventricular volume and ejection fraction by two-dimensional transoesophageal echocardiography: comparison of short axis imaging and simultaneous radionuclide angiography. Br J Anaesth 64: 331-336, 1990.
26. Conacher ID. Anaesthesia for the surgery of emphysema. Br J Anaesth 79: 530-538, 1997.
27. Cooper JD, and Patterson GA. Lung-volume reduction surgery for severe emphysema. Chest Surg Clin N Am 5: 815-831, 1995.
28. Cooper JD, Trulock EP, Triantafillou AN, Patterson GA, Pohl MS, Deloney PA, Sundaresan RS, and Roper CL. Bilateral pneumectomy (volume reduction) for chronic obstructive pulmonary disease. J Thorac Cardiovasc Surg 109: 106-116; discussion 116-109, 1995.
29. Criner GJ, Cordova FC, Furukawa S, Kuzma AM, Travaline JM, Leyenson V, and O'Brien GM. Prospective randomized trial comparing bilateral lung volume reduction surgery to pulmonary rehabilitation in severe chronic obstructive pulmonary disease. Am J Respir Crit Care Med 160: 2018-2027, 1999.
30. Davies H, and Overy HR. Left ventricular function in cor pulmonale. Chest 58: 8-14, 1970.
31. De Luca L, Sardella G, Proietti P, Battagliese A, Benedetti G, Di Roma A, and Fedele F. Effects of levosimendan on left ventricular diastolic function after primary angioplasty for acute anterior myocardial infarction: a Doppler echocardiographic study. J Am Soc Echocardiogr 19: 172-177, 2006.
32. Dernellis J, and Panaretou M. Effects of levosimendan on restrictive left ventricular filling in severe heart failure: a combined hemodynamic and Doppler echocardiographic study. Chest 128: 2633-2639, 2005.
33. Dhainaut JF, and Brunet F. Phasic changes of right ventricular ejection fraction in patients with acute exacerbations of chronic obstructive pulmonary disease. Intensive Care Med 13: 214-215, 1987.
34. Dhainaut JF, Devaux JY, Monsallier JF, Brunet F, Villemant D, and Huyghebaert MF. Mechanisms of decreased left ventricular preload during continuous positive pressure ventilation in ARDS. Chest 90: 74-80, 1986.
35. Diebel LN, Myers T, and Dulchavsky S. Effects of increasing airway pressure and PEEP on the assessment of cardiac preload. J Trauma 42: 585-590; discussion 590-581, 1997.

67
36. Dulce MC, Mostbeck GH, Friese KK, Caputo GR, and Higgins CB. Quantification of the left ventricular volumes and function with cine MR imaging: comparison of geometric models with three-dimensional data. Radiology 188: 371-376, 1993.
37. Fein AM. Lung volume reduction surgery: answering the crucial questions. Chest 113: 277S-282S, 1998.
38. Flaherty KR, Kazerooni EA, Curtis JL, Iannettoni M, Lange L, Schork MA, and Martinez FJ. Short-term and long-term outcomes after bilateral lung volume reduction surgery : prediction by quantitative CT. Chest 119: 1337-1346, 2001.
39. Gaasch WH, and Zile MR. Left ventricular diastolic dysfunction and diastolic heart failure. Annu Rev Med 55: 373-394, 2004.
40. Gan TJ, Lankhaar JW, Marcus JT, Westerhof N, Marques KM, Bronzwaer JG, Boonstra A, Postmus PE, and Vonk-Noordegraaf A. Impaired left ventricular filling due to right to left ventricular interaction in patients with pulmonary arterial hypertension. Am J Physiol Heart Circ Physiol 2005.
41. Garcia MJ, Thomas JD, and Klein AL. New Doppler echocardiographic applications for the study of diastolic function. J Am Coll Cardiol 32: 865-875, 1998.
42. Geddes D, Davies M, Koyama H, Hansell D, Pastorino U, Pepper J, Agent P, Cullinan P, MacNeill SJ, and Goldstraw P. Effect of lung-volume-reduction surgery in patients with severe emphysema. N Engl J Med 343: 239-245, 2000.
43. Glower DD, Spratt JA, Snow ND, Kabas JS, Davis JW, Olsen CO, Tyson GS, Sabiston DC, Jr., and Rankin JS. Linearity of the Frank-Starling relationship in the intact heart: the concept of preload recruitable stroke work. Circulation 71: 994-1009, 1985.
44. Groban L, and Dolinski SY. Transesophageal echocardiographic evaluation of diastolic function. Chest 128: 3652-3663, 2005.
45. Grose R, Strain J, Greenberg M, and LeJemtel TH. Systemic and coronary effects of intravenous milrinone and dobutamine in congestive heart failure. J Am Coll Cardiol 7: 1107-1113, 1986.
46. Grossman W. Diastolic function and heart failure: an overview. Eur Heart J 11 Suppl C: 2-7, 1990.
47. Grothues F, Smith GC, Moon JC, Bellenger NG, Collins P, Klein HU, and Pennell DJ. Comparison of interstudy reproducibility of cardiovascular magnetic resonance with two-dimensional echocardiography in normal subjects and in patients with heart failure or left ventricular hypertrophy. Am J Cardiol 90: 29-34, 2002.
48. Haikala H, and Linden IB. Mechanisms of action of calcium-sensitizing drugs. J Cardiovasc Pharmacol 26 Suppl 1: S10-19, 1995.
49. Haikala H, Nissinen E, Etemadzadeh E, Levijoki J, and Linden IB. Troponin C-mediated calcium sensitization induced by levosimendan does not impair relaxation. J Cardiovasc Pharmacol 25: 794-801, 1995.
50. Hajjar RJ, Schmidt U, Helm P, and Gwathmey JK. Ca++ sensitizers impair cardiac relaxation in failing human myocardium. J Pharmacol Exp Ther 280: 247-254, 1997.
51. Haniuda M, Kubo K, Fujimoto K, Aoki T, Yamanda T, and Amano J. Different effects of lung volume reduction surgery and lobectomy on pulmonary circulation. Ann Surg 231: 119-125, 2000.
52. Harrison MR, Clifton GD, Pennell AT, and DeMaria AN. Effect of heart rate on left ventricular diastolic transmitral flow velocity patterns assessed by Doppler echocardiography in normal subjects. Am J Cardiol 67: 622-627, 1991.
53. Hasenfuss G, Pieske B, Castell M, Kretschmann B, Maier LS, and Just H. Influence of the novel inotropic agent levosimendan on isometric tension and calcium cycling in failing human myocardium. Circulation 98: 2141-2147, 1998.

68
54. Hgashiyama A, Watkins MW, Chen Z, and LeWinter MM. Effects of EMD 57033 on contraction and relaxation in isolated rabbit hearts. Circulation 92: 3094-3104, 1995.
55. Hofford JM, Milakofsky L, Vogel WH, Sacher RS, Savage GJ, and Pell S. The nutritional status in advanced emphysema associated with chronic bronchitis. A study of amino acid and catecholamine levels. Am Rev Respir Dis 141: 902-908, 1990.
56. Houltz E, Ricksten SE, Milocco I, Gustavsson T, and Caidahl K. Effects of adenosine infusion on systolic and diastolic left ventricular function after coronary artery bypass surgery: evaluation by computer-assisted quantitative 2-D and Doppler echocardiography. Anesth Analg 80: 47-53, 1995.
57. Huemer G, Kolev N, Kurz A, and Zimpfer M. Influence of positive end-expiratory pressure on right and left ventricular performance assessed by Doppler two-dimensional echocardiography. Chest 106: 67-73, 1994.
58. Janssen PM, Datz N, Zeitz O, and Hasenfuss G. Levosimendan improves diastolic and systolic function in failing human myocardium. Eur J Pharmacol 404: 191-199, 2000.
59. Jardin F, Farcot JC, Boisante L, Curien N, Margairaz A, and Bourdarias JP. Influence of positive end-expiratory pressure on left ventricular performance. N Engl J Med 304: 387-392, 1981.
60. Kaplan JA. Cardiac anesthesia. Philadelphia: Saunders, 1993, p. Chapter 9. 61. Kerber RE, and Pesek-Bird C. Could cardiac magnetic resonance imaging replace
cardiac ultrasound? Challenges from the echocardiography laboratory. J Cardiovasc Magn Reson 4: 289-290, 2002.
62. Kondo C, Caputo GR, Semelka R, Foster E, Shimakawa A, and Higgins CB. Right and left ventricular stroke volume measurements with velocity-encoded cine MR imaging: in vitro and in vivo validation. AJR Am J Roentgenol 157: 9-16, 1991.
63. Koolen JJ, Visser CA, Wever E, van Wezel H, Meyne NG, and Dunning AJ. Transesophageal two-dimensional echocardiographic evaluation of biventricular dimension and function during positive end-expiratory pressure ventilation after coronary artery bypass grafting. Am J Cardiol 59: 1047-1051, 1987.
64. Kubo K, Koizumi T, Fujimoto K, Matsuzawa Y, Yamanda T, Haniuda M, and Takahashi S. Effects of lung volume reduction surgery on exercise pulmonary hemodynamics in severe emphysema. Chest 114: 1575-1582, 1998.
65. Lang RM, Bierig M, Devereux RB, Flachskampf FA, Foster E, Pellikka PA, Picard MH, Roman MJ, Seward J, Shanewise JS, Solomon SD, Spencer KT, Sutton MS, and Stewart WJ. Recommendations for chamber quantification: a report from the American Society of Echocardiography's Guidelines and Standards Committee and the Chamber Quantification Writing Group, developed in conjunction with the European Association of Echocardiography, a branch of the European Society of Cardiology. J Am Soc Echocardiogr 18: 1440-1463, 2005.
66. Lehmann A, Boldt J, and Kirchner J. The role of Ca++-sensitizers for the treatment of heart failure. Curr Opin Crit Care 9: 337-344, 2003.
67. LeWinter MM, Fabian J, and Bell SP. Left ventricular restoring forces: modulation by heart rate and contractility. Basic Res Cardiol 93 Suppl 1: 143-147, 1998.
68. Lewis BS, Lewis N, Sapoznikov D, and Gotsman MS. Isovolumic relaxation period in man. Am Heart J 100: 490-499, 1980.
69. Leyenson V, Furukawa S, Kuzma AM, Cordova F, Travaline J, and Criner GJ. Correlation of changes in quality of life after lung volume reduction surgery with changes in lung function, exercise, and gas exchange. Chest 118: 728-735, 2000.
70. Lilleberg J, Nieminen MS, Akkila J, Heikkila L, Kuitunen A, Lehtonen L, Verkkala K, Mattila S, and Salmenpera M. Effects of a new calcium sensitizer, levosimendan, on haemodynamics, coronary blood flow and myocardial substrate utilization early after coronary artery bypass grafting. Eur Heart J 19: 660-668, 1998.

69
71. Longmore DB, Klipstein RH, Underwood SR, Firmin DN, Hounsfield GN, Watanabe M, Bland C, Fox K, Poole-Wilson PA, Rees RS, and et al. Dimensional accuracy of magnetic resonance in studies of the heart. Lancet 1: 1360-1362, 1985.
72. Luecke T, Roth H, Herrmann P, Joachim A, Weisser G, Pelosi P, and Quintel M. Assessment of cardiac preload and left ventricular function under increasing levels of positive end-expiratory pressure. Intensive Care Med 30: 119-126, 2004.
73. MacNee W, Xue QF, Hannan WJ, Flenley DC, Adie CJ, and Muir AL. Assessment by radionuclide angiography of right and left ventricular function in chronic bronchitis and emphysema. Thorax 38: 494-500, 1983.
74. Marchand E, Gayan-Ramirez G, De Leyn P, and Decramer M. Physiological basis of improvement after lung volume reduction surgery for severe emphysema: where are we? Eur Respir J 13: 686-696, 1999.
75. Maslow AD, Regan MM, Schwartz C, Bert A, and Singh A. Inotropes improve right heart function in patients undergoing aortic valve replacement for aortic stenosis. Anesth Analg 98: 891-902, table of contents, 2004.
76. McBride BF, and White CM. Levosimendan: implications for clinicians. J Clin Pharmacol 43: 1071-1081, 2003.
77. Meijburg HW, Visser CA, Wesenhagen H, Westerhof PW, and Robles de Medina EO. Transesophageal pulsed-Doppler echocardiographic evaluation of transmitral and pulmonary venous flow during ventilation with positive end-expiratory pressure. J Cardiothorac Vasc Anesth 8: 386-391, 1994.
78. Michard F, and Teboul JL. Using heart-lung interactions to assess fluid responsiveness during mechanical ventilation. Crit Care 4: 282-289, 2000.
79. Mineo TC, Pompeo E, Rogliani P, Dauri M, Turani F, Bollero P, and Magliocchetti N. Effect of lung volume reduction surgery for severe emphysema on right ventricular function. Am J Respir Crit Care Med 165: 489-494, 2002.
80. Mirsky I, and Parmley WW. Assessment of passive elastic stiffness for isolated heart muscle and the intact heart. Circ Res 33: 233-243, 1973.
81. Mitaka C, Nagura T, Sakanishi N, Tsunoda Y, and Amaha K. Two-dimensional echocardiographic evaluation of inferior vena cava, right ventricle, and left ventricle during positive-pressure ventilation with varying levels of positive end-expiratory pressure. Crit Care Med 17: 205-210, 1989.
82. Myreng Y, and Smiseth OA. Assessment of left ventricular relaxation by Doppler echocardiography. Comparison of isovolumic relaxation time and transmitral flow velocities with time constant of isovolumic relaxation. Circulation 81: 260-266, 1990.
83. Nagaya N, Itoh T, Murakami S, Oya H, Uematsu M, Miyatake K, and Kangawa K. Treatment of cachexia with ghrelin in patients with COPD. Chest 128: 1187-1193, 2005.
84. Ochi H, Ikuma I, Toda H, Shimada T, Morioka S, and Moriyama K. Isovolumic relaxation period as an index of left ventricular relaxation under different afterload conditions--comparison with the time constant of left ventricular pressure decay in the dog. Jpn Circ J 53: 1521-1529, 1989.
85. Oh JK, Appleton CP, Hatle LK, Nishimura RA, Seward JB, and Tajik AJ. The noninvasive assessment of left ventricular diastolic function with two-dimensional and Doppler echocardiography. J Am Soc Echocardiogr 10: 246-270, 1997.
86. Okubadejo AA, Jones PW, and Wedzicha JA. Quality of life in patients with chronic obstructive pulmonary disease and severe hypoxaemia. Thorax 51: 44-47, 1996.
87. Oniki T, Hashimoto Y, Shimizu S, Kakuta T, Yajima M, and Numano F. Effect of increasing heart rate on Doppler indices of left ventricular performance in healthy men. Br Heart J 68: 425-429, 1992.
88. Oswald-Mammosser M, Kessler R, Massard G, Wihlm JM, Weitzenblum E, and Lonsdorfer J. Effect of lung volume reduction surgery on gas exchange and pulmonary
70
hemodynamics at rest and during exercise. Am J Respir Crit Care Med 158: 1020-1025, 1998.
89. Pagel PS. Levosimendan in cardiac surgery: a unique drug for the treatment of perioperative left ventricular dysfunction or just another inodilator searching for a clinical application? Anesth Analg 104: 759-761, 2007.
90. Pagel PS, Grossman W, Haering JM, and Warltier DC. Left ventricular diastolic function in the normal and diseased heart. Perspectives for the anesthesiologist (1). Anesthesiology 79: 836-854, 1993.
91. Pagel PS, Kampine JP, Schmeling WT, and Warltier DC. Comparison of end-systolic pressure-length relations and preload recruitable stroke work as indices of myocardial contractility in the conscious and anesthetized, chronically instrumented dog. Anesthesiology 73: 278-290, 1990.
92. Parissis JT, Panou F, Farmakis D, Adamopoulos S, Filippatos G, Paraskevaidis I, Venetsanou K, Lekakis J, and Kremastinos DT. Effects of levosimendan on markers of left ventricular diastolic function and neurohormonal activation in patients with advanced heart failure. Am J Cardiol 96: 423-426, 2005.
93. Pennell DJ. Ventricular volume and mass by CMR. J Cardiovasc Magn Reson 4: 507-513, 2002.
94. Pennell DJ, Sechtem UP, Higgins CB, Manning WJ, Pohost GM, Rademakers FE, van Rossum AC, Shaw LJ, and Yucel EK. Clinical indications for cardiovascular magnetic resonance (CMR): Consensus Panel report. Eur Heart J 25: 1940-1965, 2004.
95. Perrino AC, and Reeves ST. A practical approach to transesophageal echocardiography. Philadelphia: Lippincott Williams & Wilkins., 2003, p. Chapter 7.
96. Perrino AC, and Reeves ST. A practical approach to transesophageal echocardiography. Philadelphia: Lippincott Williams & Wilkins., 2003, p. Chapter 3.
97. Perrino AC, and Reeves ST. A practical approach to transesophageal echocardiography. Philadelphia: Lippincott Williams & Wilkins., 2003, p. Chapter 15.
98. Peters AM. Fundamentals of tracer kinetics for radiologists. Br J Radiol 71: 1116-1129, 1998.
99. Peters J, Hecker B, Neuser D, and Schaden W. Regional blood volume distribution during positive and negative airway pressure breathing in supine humans. J Appl Physiol 75: 1740-1747, 1993.
100. Pinsky M. Heart-Lung Interactions. In: Tenth Annual Refresher Course Cardiovascular and Respiratory physiology Free University of Brussels, Campus Erasme Brussels: 2004.
101. Pinsky MR. Cardiovascular issues in respiratory care. Chest 128: 592S-597S, 2005. 102. Pompeo E, Marino M, Nofroni I, Matteucci G, and Mineo TC. Reduction
pneumoplasty versus respiratory rehabilitation in severe emphysema: a randomized study. Pulmonary Emphysema Research Group. Ann Thorac Surg 70: 948-953; discussion 954, 2000.
103. Rajappan K, Bellenger NG, Anderson L, and Pennell DJ. The role of cardiovascular magnetic resonance in heart failure. Eur J Heart Fail 2: 241-252, 2000.
104. Ranieri VM, Dambrosio M, and Brienza N. Intrinsic PEEP and cardiopulmonary interaction in patients with COPD and acute ventilatory failure. Eur Respir J 9: 1283-1292, 1996.
105. Rehr RB, Malloy CR, Filipchuk NG, and Peshock RM. Left ventricular volumes measured by MR imaging. Radiology 156: 717-719, 1985.
106. Roeleveld RJ, Marcus JT, Faes TJ, Gan TJ, Boonstra A, Postmus PE, and Vonk-Noordegraaf A. Interventricular septal configuration at mr imaging and pulmonary arterial pressure in pulmonary hypertension. Radiology 234: 710-717, 2005.

71
107. Rominger MB, Bachmann GF, Geuer M, Puzik M, Boedeker RH, Ricken WW, and Rau WS. [Accuracy of right and left ventricular heart volume and left ventricular muscle mass determination with cine MRI in breath holding technique]. Rofo 170: 54-60, 1999.
108. Sandstede J, Lipke C, Beer M, Hofmann S, Pabst T, Kenn W, Neubauer S, and Hahn D. Age- and gender-specific differences in left and right ventricular cardiac function and mass determined by cine magnetic resonance imaging. Eur Radiol 10: 438-442, 2000.
109. Scharf SM, Iqbal M, Keller C, Criner G, Lee S, and Fessler HE. Hemodynamic characterization of patients with severe emphysema. Am J Respir Crit Care Med 166: 314-322, 2002.
110. Schulman SP, Lakatta EG, Fleg JL, Lakatta L, Becker LC, and Gerstenblith G. Age-related decline in left ventricular filling at rest and exercise. Am J Physiol 263: H1932-1938, 1992.
111. Sciurba FC, Rogers RM, Keenan RJ, Slivka WA, Gorcsan J, 3rd, Ferson PF, Holbert JM, Brown ML, and Landreneau RJ. Improvement in pulmonary function and elastic recoil after lung-reduction surgery for diffuse emphysema. N Engl J Med 334: 1095-1099, 1996.
112. Shors SM, Cotts WG, Pavlovic-Surjancev B, Francois CJ, Gheorghiade M, and Finn JP. Heart failure: evaluation of cardiopulmonary transit times with time-resolved MR angiography. Radiology 229: 743-748, 2003.
113. Siafakas NM, Vermeire P, Pride NB, Paoletti P, Gibson J, Howard P, Yernault JC, Decramer M, Higenbottam T, Postma DS, and et al. Optimal assessment and management of chronic obstructive pulmonary disease (COPD). The European Respiratory Society Task Force. Eur Respir J 8: 1398-1420, 1995.
114. Sidebotham D, and Merry A. Practical perioperative transesophageal echocardiography. Edinburgh ; New York: Butterworth-Heinemann, 2003, p. Chapter 7.
115. Sidebotham D, and Merry A. Practical perioperative transesophageal echocardiography. Edinburgh ; New York: Butterworth-Heinemann, 2003, p. Chapter 6.
116. Sidebotham D, and Merry A. Practical perioperative transesophageal echocardiography. Edinburgh ; New York: Butterworth-Heinemann, 2003, p. Chapter 8.
117. Sievers B, Kirchberg S, Bakan A, Franken U, and Trappe HJ. Impact of papillary muscles in ventricular volume and ejection fraction assessment by cardiovascular magnetic resonance. J Cardiovasc Magn Reson 6: 9-16, 2004.
118. Skarvan K, Lambert A, Filipovic M, and Seeberger M. Reference values for left ventricular function in subjects under general anaesthesia and controlled ventilation assessed by two-dimensional transoesophageal echocardiography. Eur J Anaesthesiol 18: 713-722, 2001.
119. Slawsky MT, Colucci WS, Gottlieb SS, Greenberg BH, Haeusslein E, Hare J, Hutchins S, Leier CV, LeJemtel TH, Loh E, Nicklas J, Ogilby D, Singh BN, and Smith W. Acute hemodynamic and clinical effects of levosimendan in patients with severe heart failure. Study Investigators. Circulation 102: 2222-2227, 2000.
120. Slutsky RA, Carey PH, Bhargava V, and Higgins CB. A comparison of peak-to-peak pulmonary transit time determined by digital intravenous angiography with standard dye-dilution techniques in anesthetized dogs. Invest Radiol 17: 362-366, 1982.
121. Sonnenblick EH, and Downing SE. Afterload as a primary determinat of ventricular performance. Am J Physiol 204: 604-610, 1963.
122. Swenson JD, Bull D, and Stringham J. Subjective assessment of left ventricular preload using transesophageal echocardiography: corresponding pulmonary artery occlusion pressures. J Cardiothorac Vasc Anesth 15: 580-583, 2001.
123. Taylor RR, Covell JW, Sonnenblick EH, and Ross J, Jr. Dependence of ventricular distensibility on filling of the opposite ventricle. Am J Physiol 213: 711-718, 1967.
72
124. Terai C, Uenishi M, Sugimoto H, Shimazu T, Yoshioka T, and Sugimoto T. Transesophageal echocardiographic dimensional analysis of four cardiac chambers during positive end-expiratory pressure. Anesthesiology 63: 640-646, 1985.
125. Thomas JD, Choong CY, Flachskampf FA, and Weyman AE. Analysis of the early transmitral Doppler velocity curve: effect of primary physiologic changes and compensatory preload adjustment. J Am Coll Cardiol 16: 644-655, 1990.
126. Thomas JD, Flachskampf FA, Chen C, Guererro JL, Picard MH, Levine RA, and Weyman AE. Isovolumic relaxation time varies predictably with its time constant and aortic and left atrial pressures: implications for the noninvasive evaluation of ventricular relaxation. Am Heart J 124: 1305-1313, 1992.
127. Thomas JD, and Weyman AE. Echocardiographic Doppler evaluation of left ventricular diastolic function. Physics and physiology. Circulation 84: 977-990, 1991.
128. Topol EJ, and Califf RM. Textbook of cardiovascular medicine. Philadelphia: Lippincott Williams & Wilkins, 2007, p. Chapter 54.
129. Tschernko EM, Gruber EM, Jaksch P, Jandrasits O, Jantsch U, Brack T, Lahrmann H, Klepetko W, and Wanke T. Ventilatory mechanics and gas exchange during exercise before and after lung volume reduction surgery. Am J Respir Crit Care Med 158: 1424-1431, 1998.
130. Tschernko EM, Kritzinger M, Gruber EM, Jantsch-Watzinger U, Jandrasits O, Mares P, Wisser W, Klepetko W, and Haider W. Lung volume reduction surgery: preoperative functional predictors for postoperative outcome. Anesth Analg 88: 28-33, 1999.
131. Tschernko EM, Wisser W, Hofer S, Kocher A, Watzinger U, Kritzinger M, Wislocki W, and Klepetko W. The influence of lung volume reduction surgery on ventilatory mechanics in patients suffering from severe chronic obstructive pulmonary disease. Anesth Analg 83: 996-1001, 1996.
132. Tschernko EM, Wisser W, Wanke T, Rajek MA, Kritzinger M, Lahrmann H, Kontrus M, Benditte H, and Klepetko W. Changes in ventilatory mechanics and diaphragmatic function after lung volume reduction surgery in patients with COPD. Thorax 52: 545-550, 1997.
133. Upton RN, and Ludbrook G. A physiologically based, recirculatory model of the kinetics and dynamics of propofol in man. Anesthesiology 103: 344-352, 2005.
134. Verrill D, Barton C, Beasley W, and Lippard WM. The effects of short-term and long-term pulmonary rehabilitation on functional capacity, perceived dyspnea, and quality of life. Chest 128: 673-683, 2005.
135. Vizza CD, Lynch JP, Ochoa LL, Richardson G, and Trulock EP. Right and left ventricular dysfunction in patients with severe pulmonary disease. Chest 113: 576-583, 1998.
136. Vonk-Noordegraaf A, Marcus JT, Holverda S, Roseboom B, and Postmus PE. Early changes of cardiac structure and function in COPD patients with mild hypoxemia. Chest 127: 1898-1903, 2005.
137. Vonk Noordegraaf A, Marcus JT, Roseboom B, Postmus PE, Faes TJ, and de Vries PM. The effect of right ventricular hypertrophy on left ventricular ejection fraction in pulmonary emphysema. Chest 112: 640-645, 1997.
138. Weg IL, Rossoff L, McKeon K, Michael Graver L, and Scharf SM. Development of pulmonary hypertension after lung volume reduction surgery. Am J Respir Crit Care Med 159: 552-556, 1999.
139. Wickline SA, Sahn DJ, Kerber R, Reichek N, and Pennell DJ. Report from the First International Conjoint Conference on Cardiovascular Magnetic Resonance and Echocardiography. J Cardiovasc Magn Reson 4: 515-520, 2002.

73
140. Wiesenack C, Prasser C, Keyl C, and Rodig G. Assessment of intrathoracic blood volume as an indicator of cardiac preload: single transpulmonary thermodilution technique versus assessment of pressure preload parameters derived from a pulmonary artery catheter. J Cardiothorac Vasc Anesth 15: 584-588, 2001.
141. Wijkstra PJ, Van Altena R, Kraan J, Otten V, Postma DS, and Koeter GH. Quality of life in patients with chronic obstructive pulmonary disease improves after rehabilitation at home. Eur Respir J 7: 269-273, 1994.
142. Wilkens H, Demertzis S, Konig J, Leitnaker CK, Schafers HJ, and Sybrecht GW. Lung volume reduction surgery versus conservative treatment in severe emphysema. Eur Respir J 16: 1043-1049, 2000.
143. Williams JF, Jr., Childress RH, Boyd DL, Higgs LM, and Behnke RH. Left ventricular function in patients with chronic obstructive pulmonary disease. J Clin Invest 47: 1143-1153, 1968.
144. Yamada T, Takeda J, Satoh M, Koyama K, Hashiguchi S, and Yokoi M. Effect of positive end-expiratory pressure on left and right ventricular diastolic filling assessed by transoesophageal Doppler echocardiography. Anaesth Intensive Care 27: 341-345, 1999.
145. Yellin EL, Hori M, Yoran C, Sonnenblick EH, Gabbay S, and Frater RW. Left ventricular relaxation in the filling and nonfilling intact canine heart. Am J Physiol 250: H620-629, 1986.
146. Zierler KL. Circulation times and the theory of indicator-dilution methods for determining blood flow and volume. In: Handbook of Physiology. Bethesda, Md. Baltimore: American Physiological Society; Distributed by Williams & Wilkins, 1962, p. 585-615.
147. Zile MR, and Brutsaert DL. New concepts in diastolic dysfunction and diastolic heart failure: Part I: diagnosis, prognosis, and measurements of diastolic function. Circulation 105: 1387-1393, 2002.
148. Zile MR, and Brutsaert DL. New concepts in diastolic dysfunction and diastolic heart failure: Part II: causal mechanisms and treatment. Circulation 105: 1503-1508, 2002.
149. Zimmermann N, Boknik P, Gams E, Herzig JW, Neumann J, and Scholz H. Calcium sensitization as new principle of inotropic therapy in end-stage heart failure? Eur J Cardiothorac Surg 14: 70-75, 1998.
150. Zipes DP, and Braunwald E. Braunwald's heart disease : a textbook of cardiovascular medicine. Philadelphia, Pa.: Elsevier Saunders, 2005, p. Chapter 20.
151. Zipes DP, and Braunwald E. Braunwald's heart disease: a textbook of cardiovascular medicine. Philadelphia, Pa.: Elsevier Saunders, 2005, p. Chapter 19.
152. Zipes DP, and Braunwald E. Braunwald's heart disease: a textbook of cardiovascular medicine. Philadelphia, Pa.: Elsevier Saunders, 2005, p. Chapter 14.
153. Zoller RP, Mark AL, Abboud FM, Schmid PG, and Heistad DD. The role of low pressure baroreceptors in reflex vasoconstrictor responses in man. J Clin Invest 51: 2967-2972, 1972.