KfW Research KfW SME Atlas 2018 · in the limelight of German and European economic policy for good...
19
KfW Research KfW SME Atlas 2018 ∆Regional faces of Germany's SMEs: a state-by-state comparison
Transcript of KfW Research KfW SME Atlas 2018 · in the limelight of German and European economic policy for good...

KfW Research
KfW SME Atlas 2018
∆Regional faces of Germany's SMEs: a state-by-state comparison

Imprint
Published by
KfW Group
Economics Department
Palmengartenstrasse 5-9
60325 Frankfurt/Main
Phone +49 69 7431-0, Fax +49 69 7431-2944
www.kfw.de
Authors
Dr Michael Schwartz
Phone +49 69 7431-8695
Dr Juliane Gerstenberger
Phone +49 69 7431-4420
Copyright cover image
Source: Getty Images / Photographer: Fuse
Frankfurt/Main, March 2018
Page 1
Regional faces of Germany’s SMEs: a state-by-state comparison
Germany’s Mittelstand has many faces and is continuously evolving. The wide range of small and medium-sized enterprises is a key pillar of the country’s competitiveness and sustainability as a business location. KfW Group has published the KfW SME Panel every year since 2002, reporting on the current situation, structure and relevant developments in the SME sector with all its facets.
KfW Research has deepened this analysis by presenting the first state-by-state study of SMEs. Beyond general structural differences, it reveals the different regional profiles of Germany’s small and medium-sized enterprises.
For example, SMEs in Rhineland-Palatinate had the highest employment growth between 2012 and 2016, companies in Hamburg have the strongest international presence, while SMEs in Berlin are much more locally oriented. SMEs in Brandenburg invest the most, those from Mecklenburg-Western Pomerania are most active in negotiating loans, while firms in the Saxony-Anhalt have the strongest equity base.
The differences are substantial, including in the companies’ top management. The youngest owner-managers are found in Saxony and the oldest in Schleswig-Holstein, where the succession problem is also more pronounced. Women in management positions are more common in the northern German states. SMEs managed by migrants are often located in city-states.
The KfW SME Atlas 2018 provides previously unknown insights into the structure of the German Mittelstand. It supplements the KfW SME Panel as a comprehensive information resource for interested members of the business and research community and for economic policymakers.
The Mittelstand – Germany’s backbone Small and medium-sized enterprises (SMEs) are the engines of economic growth and employment and are in the limelight of German and European economic policy for good reason. The vast number of SMEs – comprising small handicrafts firms as well as sole traders or long-established family businesses – are the key element of a country’s competitiveness.
The KfW SME Panel has been reporting regularly on the current situation, the structure and the relevant trends in the SME sector with all its facets for the last 15 years.1 The present report goes one step further by presenting facts on SMEs by individual state. It uses the data from the KfW SME Panel from the years 2012–2016 as a basis. One finding stands out clearly: the SME sector has many facets.
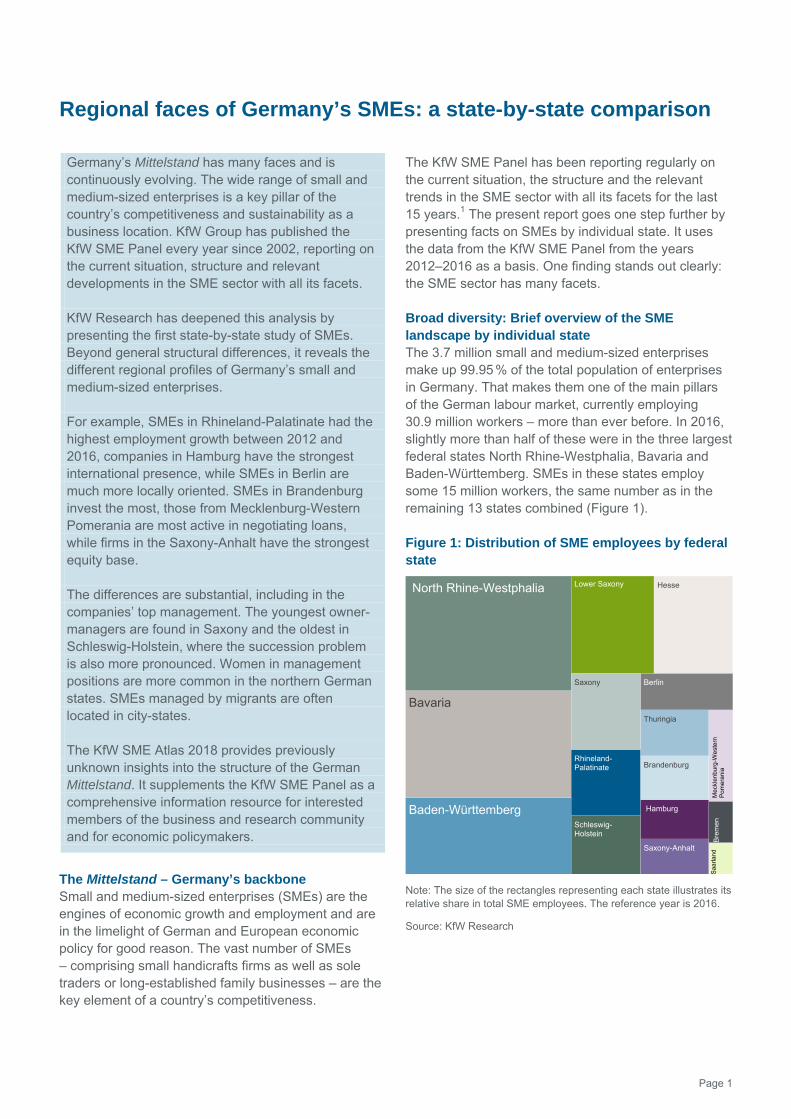
Broad diversity: Brief overview of the SME landscape by individual state The 3.7 million small and medium-sized enterprises make up 99.95 % of the total population of enterprises in Germany. That makes them one of the main pillars of the German labour market, currently employing 30.9 million workers – more than ever before. In 2016, slightly more than half of these were in the three largest federal states North Rhine-Westphalia, Bavaria and Baden-Württemberg. SMEs in these states employ some 15 million workers, the same number as in the remaining 13 states combined (Figure 1).
Figure 1: Distribution of SME employees by federal state
Note: The size of the rectangles representing each state illustrates its relative share in total SME employees. The reference year is 2016.
Source: KfW Research
Saa
rlan
dB
rem
enM
eckl
enb
urg
-We
ste
rn
Pom
era
nia
Saxony-Anhalt
Hamburg
Brandenburg
Thuringia
Berlin
Schleswig-Holstein
Rhineland-Palatinate
Saxony
HesseLower Saxony
Baden-Württemberg
Bavaria
North Rhine-Westphalia
KfW Research
Page 2
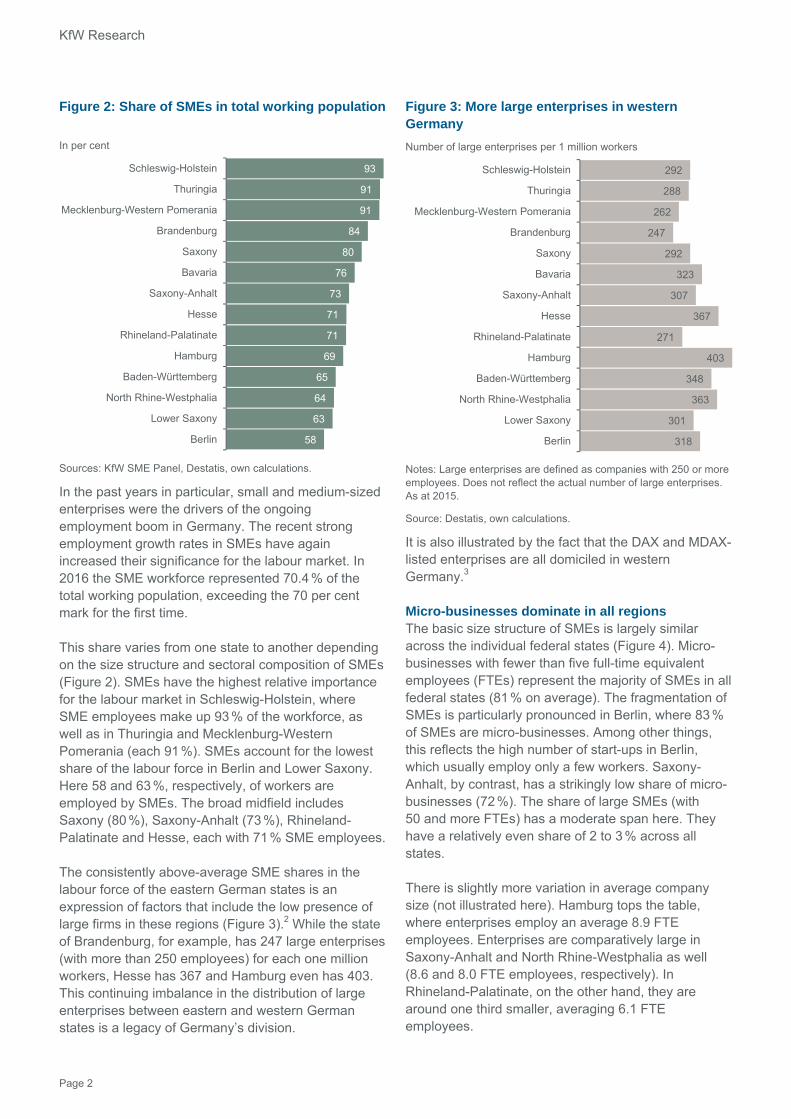
Figure 2: Share of SMEs in total working population
In per cent
Sources: KfW SME Panel, Destatis, own calculations.
In the past years in particular, small and medium-sized enterprises were the drivers of the ongoing employment boom in Germany. The recent strong employment growth rates in SMEs have again increased their significance for the labour market. In 2016 the SME workforce represented 70.4 % of the total working population, exceeding the 70 per cent mark for the first time.
This share varies from one state to another depending on the size structure and sectoral composition of SMEs (Figure 2). SMEs have the highest relative importance for the labour market in Schleswig-Holstein, where SME employees make up 93 % of the workforce, as well as in Thuringia and Mecklenburg-Western Pomerania (each 91 %). SMEs account for the lowest share of the labour force in Berlin and Lower Saxony. Here 58 and 63 %, respectively, of workers are employed by SMEs. The broad midfield includes Saxony (80 %), Saxony-Anhalt (73 %), Rhineland-Palatinate and Hesse, each with 71 % SME employees.
The consistently above-average SME shares in the labour force of the eastern German states is an expression of factors that include the low presence of large firms in these regions (Figure 3).2 While the state of Brandenburg, for example, has 247 large enterprises (with more than 250 employees) for each one million workers, Hesse has 367 and Hamburg even has 403. This continuing imbalance in the distribution of large enterprises between eastern and western German states is a legacy of Germany’s division.
Figure 3: More large enterprises in western Germany
Number of large enterprises per 1 million workers
Notes: Large enterprises are defined as companies with 250 or more employees. Does not reflect the actual number of large enterprises. As at 2015.
Source: Destatis, own calculations.
It is also illustrated by the fact that the DAX and MDAX-listed enterprises are all domiciled in western Germany.3
Micro-businesses dominate in all regions The basic size structure of SMEs is largely similar across the individual federal states (Figure 4). Micro-businesses with fewer than five full-time equivalent employees (FTEs) represent the majority of SMEs in all federal states (81 % on average). The fragmentation of SMEs is particularly pronounced in Berlin, where 83 % of SMEs are micro-businesses. Among other things, this reflects the high number of start-ups in Berlin, which usually employ only a few workers. Saxony-Anhalt, by contrast, has a strikingly low share of micro-businesses (72 %). The share of large SMEs (with 50 and more FTEs) has a moderate span here. They have a relatively even share of 2 to 3 % across all states.
There is slightly more variation in average company size (not illustrated here). Hamburg tops the table, where enterprises employ an average 8.9 FTE employees. Enterprises are comparatively large in Saxony-Anhalt and North Rhine-Westphalia as well (8.6 and 8.0 FTE employees, respectively). In Rhineland-Palatinate, on the other hand, they are around one third smaller, averaging 6.1 FTE employees.
58
63
64
65
69
71
71
73
76
80
84
91
91
93
Berlin
Lower Saxony
North Rhine-Westphalia
Baden-Württemberg
Hamburg
Rhineland-Palatinate
Hesse
Saxony-Anhalt
Bavaria
Saxony
Brandenburg
Mecklenburg-Western Pomerania
Thuringia
Schleswig-Holstein
318
301
363
348
403
271
367
307
323
292
247
262
288
292
Berlin
Lower Saxony
North Rhine-Westphalia
Baden-Württemberg
Hamburg
Rhineland-Palatinate
Hesse
Saxony-Anhalt
Bavaria
Saxony
Brandenburg
Mecklenburg-Western Pomerania
Thuringia
Schleswig-Holstein

KfW SME Atlas
Page 3
Berlin: the start-up capital lives up to its name With an average business age of 17 years, SMEs in Mecklenburg-Western Pomerania are the youngest. SMEs in the remaining eastern German federal states are also comparatively young, however (average age 19 to 21 years). Here, after German unification, small private-sector structures first had to emerge step-by-step from an economy that used to be largely organised in conglomerates. Therefore, company histories are naturally shorter. Nonetheless, noteworthy differences exist in the age structure of eastern German enterprises, too. Berlin, the start-up capital, has the highest share of SMEs that are less than five years old, at 21 %, while Saxony-Anhalt has the lowest share, at 6 %.
The highest share of SMEs that have been in business for more than 20 years can be found in Baden-Württemberg and Hesse (43 % each). The ‘most senior’ SMEs (averaging 26 years of age) are domiciled in Baden-Württemberg. This is the home of a large number of traditional, long-established SMEs. Schleswig-Holstein has the lowest share of older SMEs, 31 %, which also gives it a relatively young SME landscape overall (average age: 20 years).
Figure 4: The majority are small
Shares of FTE size classes in per cent
Source: KfW Research.
Figure 5: Age of SMEs by federal state
Share of SMEs per age group in per cent – average enterprise age in years (italics) / ascending order by average age
Source: KfW Research.
11
12
13
15
14
16
13
15
21
12
14
10
6
14
15
18
15
16
18
20
18
19
21
9
21
21
14
20
18
19
28
29
29
26
29
28
29
26
29
29
35
35
33
32
30
43
43
41
40
38
38
39
38
41
38
31
40
40
36
36
Baden-Württemberg
Hesse
Rhineland-Palatinate
Lower Saxony
Bavaria
Hamburg
Germany
North Rhine-Westphalia
Berlin
Saxony
Schleswig-Holstein
Thuringia
Saxony-Anhalt
Brandenburg
Mecklenburg-Western Pomerania
Up to 5 years 6–10 years 11–20 years Over 20 years
KfW Research
Page 4
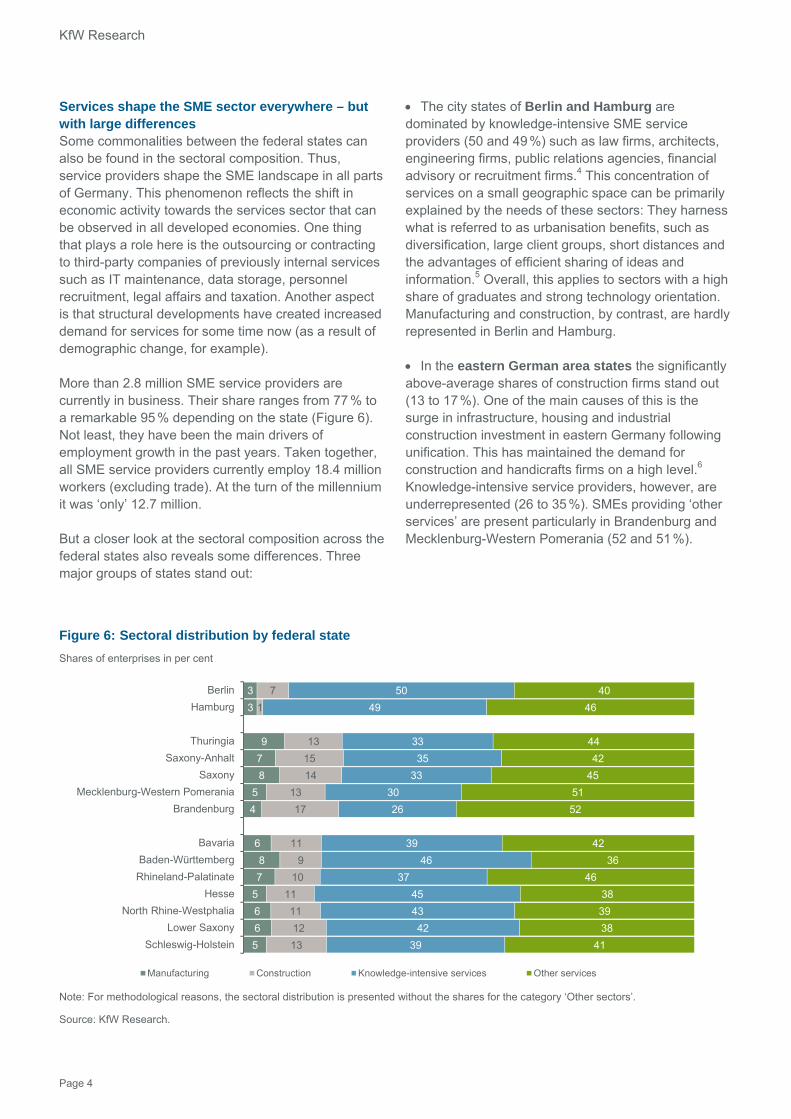
Services shape the SME sector everywhere – but with large differences Some commonalities between the federal states can also be found in the sectoral composition. Thus, service providers shape the SME landscape in all parts of Germany. This phenomenon reflects the shift in economic activity towards the services sector that can be observed in all developed economies. One thing that plays a role here is the outsourcing or contracting to third-party companies of previously internal services such as IT maintenance, data storage, personnel recruitment, legal affairs and taxation. Another aspect is that structural developments have created increased demand for services for some time now (as a result of demographic change, for example).
More than 2.8 million SME service providers are currently in business. Their share ranges from 77 % to a remarkable 95 % depending on the state (Figure 6). Not least, they have been the main drivers of employment growth in the past years. Taken together, all SME service providers currently employ 18.4 million workers (excluding trade). At the turn of the millennium it was ‘only’ 12.7 million.
But a closer look at the sectoral composition across the federal states also reveals some differences. Three major groups of states stand out:
The city states of Berlin and Hamburg are dominated by knowledge-intensive SME service providers (50 and 49 %) such as law firms, architects, engineering firms, public relations agencies, financial advisory or recruitment firms.4 This concentration of services on a small geographic space can be primarily explained by the needs of these sectors: They harness what is referred to as urbanisation benefits, such as diversification, large client groups, short distances and the advantages of efficient sharing of ideas and information.5 Overall, this applies to sectors with a high share of graduates and strong technology orientation. Manufacturing and construction, by contrast, are hardly represented in Berlin and Hamburg.
In the eastern German area states the significantly above-average shares of construction firms stand out (13 to 17 %). One of the main causes of this is the surge in infrastructure, housing and industrial construction investment in eastern Germany following unification. This has maintained the demand for construction and handicrafts firms on a high level.6 Knowledge-intensive service providers, however, are underrepresented (26 to 35 %). SMEs providing ‘other services’ are present particularly in Brandenburg and Mecklenburg-Western Pomerania (52 and 51 %).
Figure 6: Sectoral distribution by federal state
Shares of enterprises in per cent
Note: For methodological reasons, the sectoral distribution is presented without the shares for the category ‘Other sectors’.
Source: KfW Research.
5
6
6
5
7
8
6
4
5
8
7
9
3
3
13
12
11
11
10
9
11
17
13
14
15
13
1
7
39
42
43
45
37
46
39
26
30
33
35
33
49
50
41
38
39
38
46
36
42
52
51
45
42
44
46
40
Schleswig-Holstein
Lower Saxony
North Rhine-Westphalia
Hesse
Rhineland-Palatinate
Baden-Württemberg
Bavaria
Brandenburg
Mecklenburg-Western Pomerania
Saxony
Saxony-Anhalt
Thuringia
Hamburg
Berlin
Manufacturing Construction Knowledge-intensive services Other services

KfW SME Atlas
Page 5
They include, among others, enterprises in the health and social services sector, training and education, hospitality, and culture and sport.
The sectoral distribution in the western German area states is also quite even. What is striking is that the transformation of the western German economic structure towards more services – especially business services – is already more advanced than in eastern Germany. SMEs providing knowledge-based services have very high shares there, at 37 to 46 %.
Employment and turnover have grown in all regions of Germany In the past years domestic demand has been a reliable source of business for SMEs with their focus primarily on the German market. Recently in particular, private consumption and strong growth in residential construction provided a tailwind that benefited all regions of Germany. SMEs in all states generated higher turnover and hired more workers (Figure 7).
Across the country, SMEs recorded annual employment growth of around 2.4 % in the past years
(2012–2016 average). SMEs in Rhineland-Palatinate recorded the highest growth rates (3.2 %), with SMEs in Hesse, Schleswig-Holstein and Lower Saxony close behind. In these states the number of full-time equivalent employees rose by an average of around 3 %.7 SMEs in Saxony-Anhalt had the lowest average annual employment growth (1.1 %). But enterprises in Saxony, Thuringia and Mecklenburg-Western Pomerania also recorded below-average FTE employment growth.
Hamburg and Rhineland-Palatinate posted the highest turnover growth. Turnovers of enterprises domiciled there grew an average 4.1 % per year. Bavaria was close behind with 3.7 %. At the bottom of the list were SMEs from Saxony-Anhalt, Saxony, North Rhine-Westphalia and Schleswig-Holstein. Nevertheless, they achieved good annual turnover growth rates of around 2 %. The state-by-state evaluation generally reflects the overall robust growth momentum in the German SME sector. This momentum even increased slightly of late (3.7 % growth in 2016) – the highest increase in five years. Overall turnover recently totalled nearly EUR 4,500 billion (2016).
Figure 7: Employment (left) and turnover (right) growth rates by federal state
Source: KfW Research.
2.5%North
Rhine-Westphalia
2.4% Hamburg
2.9%Schleswig-
Holstein 2.2%Mecklenburg-
Western Pomerania
2.5%Brandenburg
1.2%Saxony
1.1%Saxony-Anhalt
1.8%Thuringia2.9%
Hesse
2.5%Baden-
Württemberg
2.4%Bavaria
2.5%Berlin
2.8%Lower Saxony
2.1%North
Rhine-Westpahlia
4.1% Hamburg
2.1%Schleswig-
Holstein 2.8%Mecklenburg-
Western Pomerania
3.4%Brandenburg
2.1%Saxony
2.0%Saxony-Anhalt
2.5%Thuringia3.0%
Hesse
2.8%Baden-
Württemberg
3.7%Bavaria
3.3%Berlin
4.1%Rhineland-Palatinate
2.5%Lower Saxony
At least 3.0 %2.5 to less than 3.0 %2.0 to less than 2.5 %
Less than 2.0 %
At least 4.0 %3.0 to less than 4.0 %2.5 to less than 3.0 %
Less than 2.5 %
3.2%Rhineland-Palatinate
KfW Research
Page 6
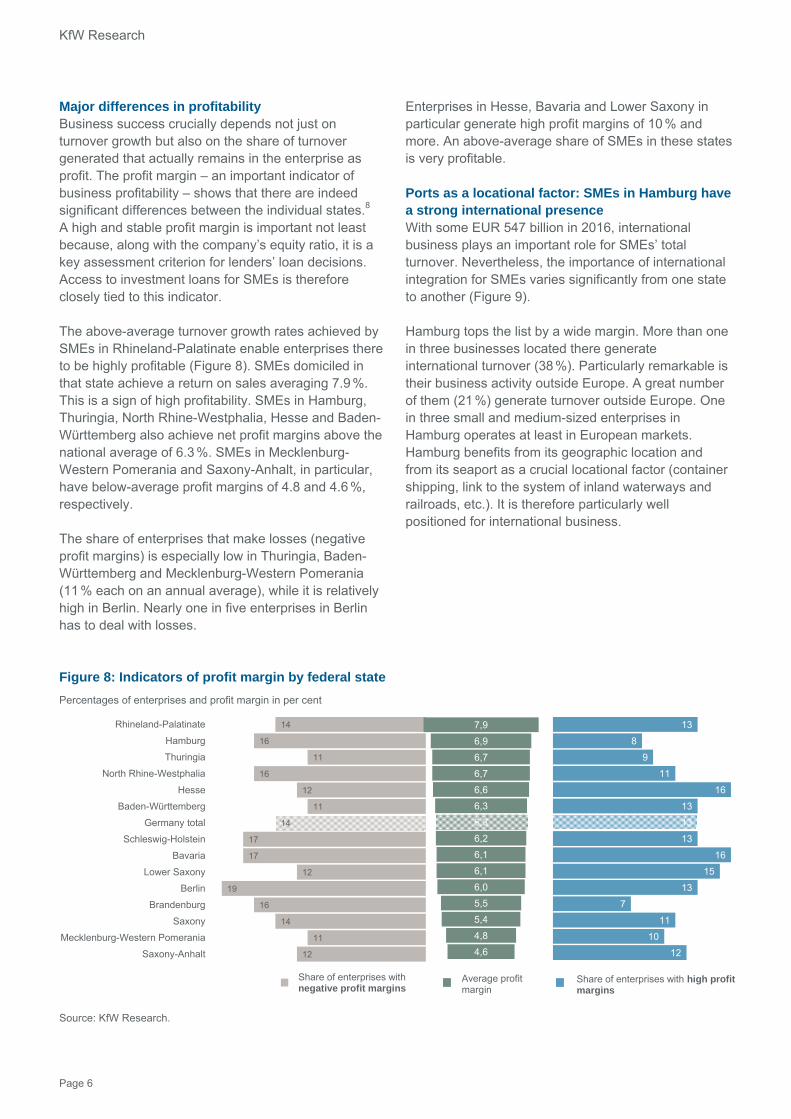
Major differences in profitability Business success crucially depends not just on turnover growth but also on the share of turnover generated that actually remains in the enterprise as profit. The profit margin – an important indicator of business profitability – shows that there are indeed significant differences between the individual states.8 A high and stable profit margin is important not least because, along with the company’s equity ratio, it is a key assessment criterion for lenders’ loan decisions. Access to investment loans for SMEs is therefore closely tied to this indicator.
The above-average turnover growth rates achieved by SMEs in Rhineland-Palatinate enable enterprises there to be highly profitable (Figure 8). SMEs domiciled in that state achieve a return on sales averaging 7.9 %. This is a sign of high profitability. SMEs in Hamburg, Thuringia, North Rhine-Westphalia, Hesse and Baden-Württemberg also achieve net profit margins above the national average of 6.3 %. SMEs in Mecklenburg-Western Pomerania and Saxony-Anhalt, in particular, have below-average profit margins of 4.8 and 4.6 %, respectively.
The share of enterprises that make losses (negative profit margins) is especially low in Thuringia, Baden-Württemberg and Mecklenburg-Western Pomerania (11 % each on an annual average), while it is relatively high in Berlin. Nearly one in five enterprises in Berlin has to deal with losses.
Enterprises in Hesse, Bavaria and Lower Saxony in particular generate high profit margins of 10 % and more. An above-average share of SMEs in these states is very profitable.
Ports as a locational factor: SMEs in Hamburg have a strong international presence With some EUR 547 billion in 2016, international business plays an important role for SMEs’ total turnover. Nevertheless, the importance of international integration for SMEs varies significantly from one state to another (Figure 9).
Hamburg tops the list by a wide margin. More than one in three businesses located there generate international turnover (38 %). Particularly remarkable is their business activity outside Europe. A great number of them (21 %) generate turnover outside Europe. One in three small and medium-sized enterprises in Hamburg operates at least in European markets. Hamburg benefits from its geographic location and from its seaport as a crucial locational factor (container shipping, link to the system of inland waterways and railroads, etc.). It is therefore particularly well positioned for international business.
Figure 8: Indicators of profit margin by federal state
Percentages of enterprises and profit margin in per cent
Source: KfW Research.
12
10
11
7
13
15
16
13
13
13
16
11
9
8
13
12
11
14
16
19
12
17
17
14
11
12
16
11
16
14
Saxony-Anhalt
Mecklenburg-Western Pomerania
Saxony
Brandenburg
Berlin
Lower Saxony
Bavaria
Schleswig-Holstein
Germany total
Baden-Württemberg
Hesse
North Rhine-Westphalia
Thuringia
Hamburg
Rhineland-Palatinate
Share of enterprises with negative profit margins
Average profit margin
Share of enterprises with high profitmargins
4,6
4,8
5,4
5,5
6,0
6,1
6,1
6,2
6,3
6,3
6,6
6,7
6,7
6,9
7,9

KfW SME Atlas
Page 7
Figure 9: Share of internationally active SMEs by federal state and region
Shares of enterprises in per cent
Source: KfW Research.
SMEs in Saxony-Anhalt have far below-average international business – fewer than one in ten enterprises achieve turnover outside Germany’s borders (9 %). Enterprises there are much more regionally and domestically oriented. SMEs in Saxony-Anhalt generate 53 % of their turnover in their more immediate regional vicinity (Figure 10). In states where
SMEs have a higher degree of internationalisation, that share is less than 50 %. Hardly surprisingly, Hamburg’s SMEs generate the lowest share of total turnover in the region, at 44 %, but the highest share in international markets, at 40 %. In Saxony-Anhalt the share of turn-over generated internationally is less than half (19 %).
Figure 10: Share of international turnover (left) and share of local turnover (right)
Each as a percentage of total turnover; Left: only enterprises with international turnover / Right: only enterprises with local turnover within a 50-km radius.
Source: KfW Research.
9
15
17
17
18
19
19
19
20
21
23
23
24
25
38
9
14
14
16
16
17
19
18
18
20
21
24
23
24
33
4
3
6
6
7
7
6
5
8
8
10
7
9
9
21
Saxony-Anhalt
Schleswig-Holstein
Saxony
Thuringia
Brandenburg
Rhineland-Palatinate
Lower Saxony
Mecklenburg-Western Pomerania
Hesse
Germany
North Rhine-Westphalia
Berlin
Bavaria
Baden-Württemberg
Hamburg
EuropeInternational total International excl. Europe
29%North
Rhine-Westphalia
27%Lower Saxony
40%Hamburg
29%Schleswig-
Holstein 37%Mecklenburg-
Western Pomerania
24%Brandenburg
26%Saxony
19%Saxony-Anhalt
27%Thuringia27%
Hesse
32%Rhineland-Palatinate
33%Baden-
Württemberg
26%Bavaria
38%Berlin
51%North
Rhine-Westphalia
53%Lower Saxony
44%Hamburg
45%Schleswig-
Holstein 53%Mecklenburg-
Western Pomerania
69%Brandenburg
54%Saxony
53%Saxony-Anhalt
53%Thuringia56%
Hesse
54%Rhineland-Palatinate
47%Baden-
Württemberg
49%Bavaria
69%Berlin
30% and above
Between 20 and 29%
Below 20%
60% and above
Between 50 and 59%
Below 50%

KfW Research
Page 8
SMEs in Berlin and Brandenburg have by far the strongest regional focus – each generating 69 % of turnover in the more immediate regional market. This can be attributed to the high and broad demand coming from the Berlin metropolitan area.
The investment leader? Brandenburg! Investment is the key to securing long-term business success as enterprises renew capital stock, expand capacities, save costs or develop new business fields and technologies. Furthermore, lively investment activity by SMEs contributes to economic development, increases aggregate economic production potential and makes a significant contribution to long-term economic growth.
Since the crisis years of 2008 and 2009, however, SMEs’ willingness to invest has stagnated and remains on a low level. Micro-businesses in particular are investing little. A glance at the individual federal states shows that SMEs’ willingness to invest is quite similar (Figure 11, left). Deviations from the 42 % value for all of Germany (average share of SMEs investing between 2012 and 2016) tend to be moderate. Only SMEs in Rhineland-Palatinate exhibit a more below-average investment propensity (6 percentage points below the value for all of Germany), while SMEs in Brandenburg and Saxony-Anhalt invest more often than the average
(48 and 49 %, respectively).
When investment by SMEs is measured against the respective workforce (investment intensity in euros per full-time equivalent employee), however, significantly more pronounced differences between states come to light (Figure 11, right). The ‘investment leaders’ are thus SMEs in Brandenburg, which invest around EUR 9,900 per FTE employee on average. SMEs in Lower Saxony invest significantly less (around EUR 9,200 per FTE employee) and those in Hamburg and Baden-Württemberg even less (some EUR 8,800). For comparison: Enterprises in Brandenburg invest roughly one third more per full-time worker in expanding and preserving their business structures than SMEs in Schleswig-Holstein or Berlin.
The distinction by type of investment (largely) shows the following pattern: Companies that invest more in capacity expansion (by acquiring an additional production line, expanding transport capacities or tapping into foreign markets, for example), usually invest more overall (measured by investment intensity). This is particularly clear in Brandenburg, where investments in capacity expansion make up 59 % – 17 percentage points more than SMEs in Schleswig-Holstein (42 %). Earlier studies revealed that investments in additional capacity tend to be
Figure 11: Investment activity by SMEs by federal state
Share of enterprises investing in per cent (left) – investment volume in euros per FTE employee (overall and by type of investment)
Guide: In Brandenburg 48 % of all SMEs invest. The average volume of investment per full-time equivalent employee here is EUR 9,920. Of this sum, EUR 5,853 is for expansion investments (around 59 %) and a further EUR 3,274 for replacement investments (some 33 %). The remainder is other investments.
Note: Weighted with the investment volume. Other investments include innovation, rationalisation, upgrades and repairs.
Source: KfW Research.
2,690
3,258
3,633
3,589
3,788
3,935
3,896
3,941
4,027
3,840
3,936
4,411
4,327
4,036
5,853
3,459
2,593
3,206
3,374
3,059
3,009
3,578
3,538
3,222
4,007
3,685
3,969
4,151
4,495
3,274
6,405
6,649
7,124
7,178
7,284
7,716
7,952
8,042
8,054
8,347
8,375
8,821
8,831
9,173
9,920
Schleswig-Holstein
Berlin
Saxony
North Rhine-Westphalia
Rhineland-Palatinate
Hesse
Germany total
Saxony-Anhalt
Mecklenburg-Western Pomerania
Thuringia
Bavaria
Baden-Württemberg
Hamburg
Lower Saxony
Brandenburg
Capacity expansion Replacement investments Other
39
41
43
43
36
43
42
49
38
40
44
42
41
40
48

KfW SME Atlas
Page 9
undertaken by SMEs that have positive business expectations. By contrast, cautious owner-managers tend to focus more on replacement investments.9
Investment finance: SMEs in city-states rely on own funds It is known that SMEs fund most of their investments from their own resources. In the past years, enterprises have retained most of their profit gains and built up financial buffers. They have drawn on these buffers particularly at the current margin, as their use of own resources has reached all-time high levels.10
SMEs in Berlin invest the highest share of own resources to fund investments (Figure 12). On average, enterprises domiciled there have funded 62 % of their annual investment volume from their own resources. SMEs in Hamburg and Brandenburg also use more own resources than average to fund their investments (61 and 60 %, respectively).
Conversely, SMEs in these states rely much less on borrowing to fund investments. In Hamburg the share of bank loans in annual investment volume is lower than in any other state, at 19 %. This is consistent with the fact that businesses in these states are also generally less inclined to negotiate investment loans with banks or savings banks (24–28 % of investing enterprises).
The low share of borrowed funds and the high propor-tion of own resources, specifically in the city-states, is
likely due, among other causes, to the high share of independent professional service providers at these locations. Their investment projects tend to be less capital-intensive and more easily paid for from their own funds. Investments that require higher amounts, on the other hand, often require access to external funding sources.
SMEs in eastern Germany are more likely to borrow SMEs in Mecklenburg-Western Pomerania, Saxony-Anhalt and Thuringia have the highest propensity to use debt capital. They financed around four tenths of their annual investment volume with bank loans – twice as much as enterprises in Hamburg. Accordingly, enterprises in these states have conducted more loan negotiations than average. While around one in three investing SMEs across Germany venture into a bank or savings bank to borrow money, in Mecklenburg-Western Pomerania and Saxony-Anhalt that share is more than 40 %. There, however, as well as in Saxony and Thuringia, SMEs use fewer funds of their own (less than 50 % in each case) to fund their investments.
Equity ratios of SMEs vary greatly Creditworthiness is crucial to an SME’s access to finance 11 and its equity ratio plays an important role.12 Enterprises from most eastern German area states do particularly well in this regard (Figure 13). SMEs in Saxony-Anhalt have the highest average equity ratio at 42 %. But SMEs in Thuringia and Saxony also have respectable equity ratios of 35 and 34 %, respectively.
Figure 12: Funding sources for investments and share of SMEs with loan negotiations
Share in investment volume in per cent (left) – share of SMEs with loan negotiations as percentage of investing enterprises (right)
Source: KfW Research.
44
46
46
48
52
53
53
54
52
56
56
58
60
61
62
10
9
12
11
11
10
13
11
8
7
9
10
9
8
5
6
5
10
4
6
7
6
9
4
2
5
6
4
12
4
40
40
32
37
31
30
28
26
36
35
30
26
27
19
29
43
41
37
36
34
34
33
32
32
32
31
30
28
25
24
Mecklenburg-Western Pomerania
Saxony-Anhalt
Saxony
Thuringia
North Rhine-Westphalia
Germany
Bavaria
Hesse
Lower Saxony
Schleswig-Holstein
Rhineland-Palatinate
Baden-Württemberg
Brandenburg
Hamburg
Berlin
Own resources Subsidies Other Bank loans
KfW Research
Page 10
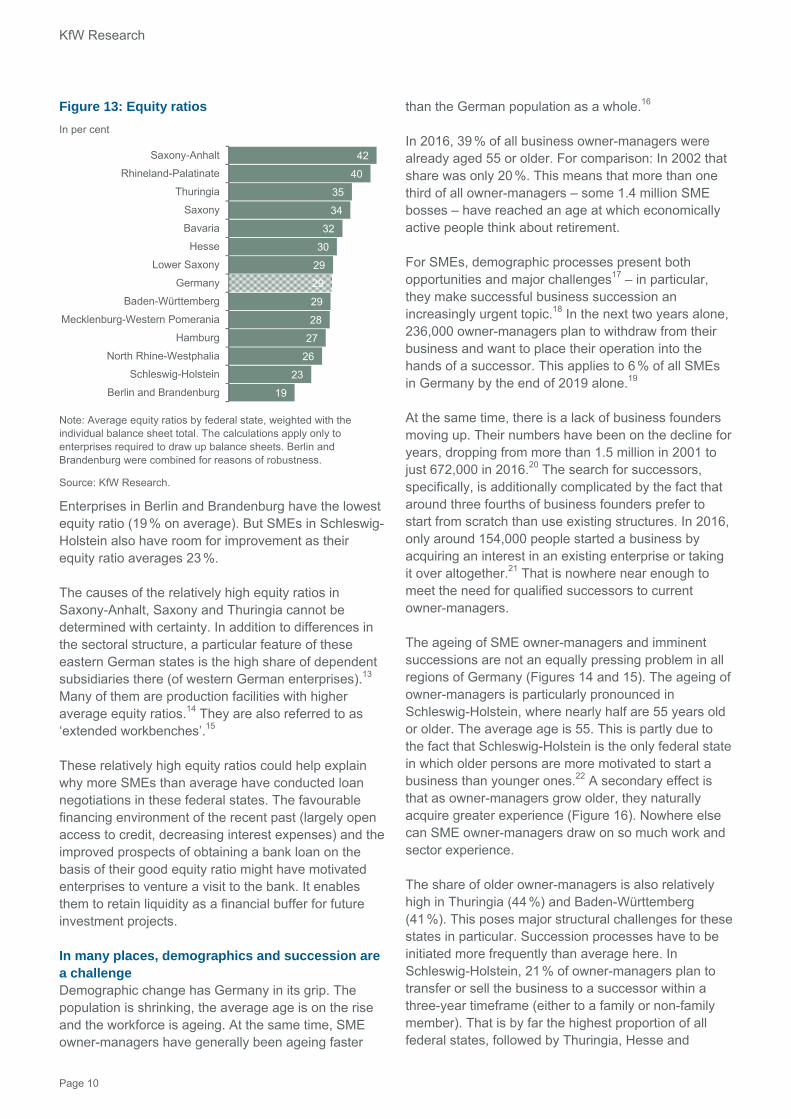
Figure 13: Equity ratios
In per cent
Note: Average equity ratios by federal state, weighted with the individual balance sheet total. The calculations apply only to enterprises required to draw up balance sheets. Berlin and Brandenburg were combined for reasons of robustness.
Source: KfW Research.
Enterprises in Berlin and Brandenburg have the lowest equity ratio (19 % on average). But SMEs in Schleswig-Holstein also have room for improvement as their equity ratio averages 23 %.
The causes of the relatively high equity ratios in Saxony-Anhalt, Saxony and Thuringia cannot be determined with certainty. In addition to differences in the sectoral structure, a particular feature of these eastern German states is the high share of dependent subsidiaries there (of western German enterprises).13 Many of them are production facilities with higher average equity ratios.14 They are also referred to as ‘extended workbenches’.15
These relatively high equity ratios could help explain why more SMEs than average have conducted loan negotiations in these federal states. The favourable financing environment of the recent past (largely open access to credit, decreasing interest expenses) and the improved prospects of obtaining a bank loan on the basis of their good equity ratio might have motivated enterprises to venture a visit to the bank. It enables them to retain liquidity as a financial buffer for future investment projects.
In many places, demographics and succession are a challenge Demographic change has Germany in its grip. The population is shrinking, the average age is on the rise and the workforce is ageing. At the same time, SME owner-managers have generally been ageing faster
than the German population as a whole.16
In 2016, 39 % of all business owner-managers were already aged 55 or older. For comparison: In 2002 that share was only 20 %. This means that more than one third of all owner-managers – some 1.4 million SME bosses – have reached an age at which economically active people think about retirement.
For SMEs, demographic processes present both opportunities and major challenges17 – in particular, they make successful business succession an increasingly urgent topic.18 In the next two years alone, 236,000 owner-managers plan to withdraw from their business and want to place their operation into the hands of a successor. This applies to 6 % of all SMEs in Germany by the end of 2019 alone.19
At the same time, there is a lack of business founders moving up. Their numbers have been on the decline for years, dropping from more than 1.5 million in 2001 to just 672,000 in 2016.20 The search for successors, specifically, is additionally complicated by the fact that around three fourths of business founders prefer to start from scratch than use existing structures. In 2016, only around 154,000 people started a business by acquiring an interest in an existing enterprise or taking it over altogether.21 That is nowhere near enough to meet the need for qualified successors to current owner-managers.
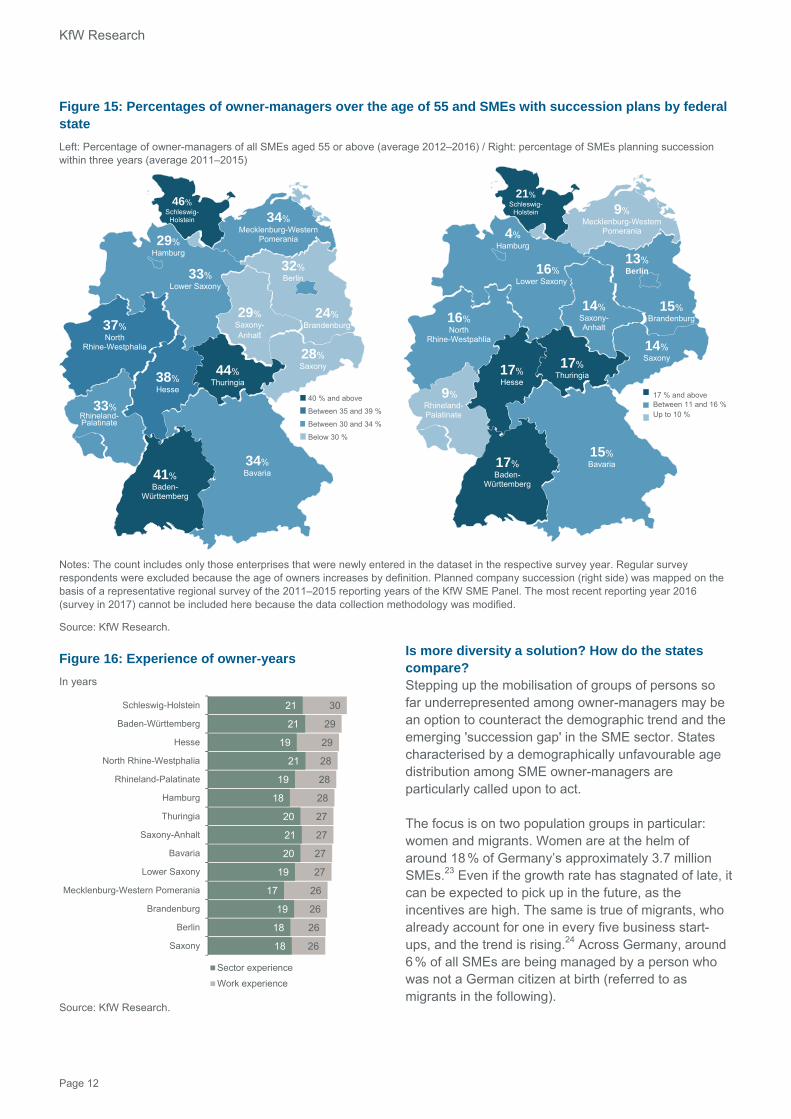
The ageing of SME owner-managers and imminent successions are not an equally pressing problem in all regions of Germany (Figures 14 and 15). The ageing of owner-managers is particularly pronounced in Schleswig-Holstein, where nearly half are 55 years old or older. The average age is 55. This is partly due to the fact that Schleswig-Holstein is the only federal state in which older persons are more motivated to start a business than younger ones.22 A secondary effect is that as owner-managers grow older, they naturally acquire greater experience (Figure 16). Nowhere else can SME owner-managers draw on so much work and sector experience.
The share of older owner-managers is also relatively high in Thuringia (44 %) and Baden-Württemberg (41 %). This poses major structural challenges for these states in particular. Succession processes have to be initiated more frequently than average here. In Schleswig-Holstein, 21 % of owner-managers plan to transfer or sell the business to a successor within a three-year timeframe (either to a family or non-family member). That is by far the highest proportion of all federal states, followed by Thuringia, Hesse and
19
23
26
27
28
29
29
29
30
32
34
35
40
42
Berlin and Brandenburg
Schleswig-Holstein
North Rhine-Westphalia
Hamburg
Mecklenburg-Western Pomerania
Baden-Württemberg
Germany
Lower Saxony
Hesse
Bavaria
Saxony
Thuringia
Rhineland-Palatinate
Saxony-Anhalt

KfW SME Atlas
Page 11
Baden-Württemberg (17 % each).
The situation is different in Hamburg, Rhineland-Palatinate and Mecklenburg-Western Pomerania. The share of SME owner-managers planning to hand over their business soon is below average in these states. Founders who are willing to take over a business will find Hamburg particularly challenging as only 4 % of
SMEs there are preparing for imminent succession.
Saxony is one of the states with the youngest average age of SME owner-managers: 48 years. And a relatively low share of 14 % of all SMEs is addressing the issue of succession. The age distribution is generally more favourable in the eastern German states. Owner-managers are relatively young on average.
Figure 14: Age of owner-managers by state
Proportions of SMEs per age group of owner-manager in per cent – average age in years (italics) / ascending order by average age
Note: The count includes only those enterprises that were newly entered in the dataset in the respective survey year. Regular survey participants are excluded because the owners’ age increased by definition.
Source: KfW Research.
23
21
21
24
21
22
18
14
20
13
13
12
17
10
11
11
13
13
13
14
5
16
9
10
11
5
10
8
18
21
12
17
16
15
19
21
13
17
21
23
16
15
16
23
21
18
17
16
29
19
15
22
19
31
16
22
11
10
20
12
16
17
13
14
28
17
15
16
13
20
21
14
14
16
17
16
16
17
16
20
21
13
27
26
Berlin
Brandenburg
Mecklenburg-Western Pomerania
Saxony
Bavaria
Rhineland-Palatinate
Hamburg
Lower Saxony
Thuringia
Hesse
North Rhine-Westphalia
Saxony-Anhalt
Baden-Württemberg
Schleswig-Holstein
Under 40 Between 40 and 44 Between 45 and 49 Between 50 and 54 Between 55 and 59 60 and above
48
48
48
48
49
49
50
50
50
51
51
51
52
54
KfW Research
Page 12
Figure 15: Percentages of owner-managers over the age of 55 and SMEs with succession plans by federal state
Left: Percentage of owner-managers of all SMEs aged 55 or above (average 2012–2016) / Right: percentage of SMEs planning succession within three years (average 2011–2015)
Notes: The count includes only those enterprises that were newly entered in the dataset in the respective survey year. Regular survey respondents were excluded because the age of owners increases by definition. Planned company succession (right side) was mapped on the basis of a representative regional survey of the 2011–2015 reporting years of the KfW SME Panel. The most recent reporting year 2016 (survey in 2017) cannot be included here because the data collection methodology was modified.
Source: KfW Research.
Figure 16: Experience of owner-years
In years
Source: KfW Research.
Is more diversity a solution? How do the states compare? Stepping up the mobilisation of groups of persons so far underrepresented among owner-managers may be an option to counteract the demographic trend and the emerging 'succession gap' in the SME sector. States characterised by a demographically unfavourable age distribution among SME owner-managers are particularly called upon to act.
The focus is on two population groups in particular: women and migrants. Women are at the helm of around 18 % of Germany’s approximately 3.7 million SMEs.23 Even if the growth rate has stagnated of late, it can be expected to pick up in the future, as the incentives are high. The same is true of migrants, who already account for one in every five business start-ups, and the trend is rising.24 Across Germany, around 6 % of all SMEs are being managed by a person who was not a German citizen at birth (referred to as migrants in the following).
37%North
Rhine-Westphalia
33%Lower Saxony
29%Hamburg
46%Schleswig-
Holstein 34%Mecklenburg-Western
Pomerania
24%Brandenburg
28%Saxony
29%Saxony-Anhalt
44%Thuringia38%
Hesse
33%Rhineland-Palatinate
41%Baden-
Württemberg
34%Bavaria
32%Berlin
16%North
Rhine-Westpahlia
16%Lower Saxony
4%Hamburg
21%Schleswig-
Holstein 9%Mecklenburg-Western
Pomerania
15%Brandenburg
14%Saxony
14%Saxony-Anhalt
17%Thuringia17%
Hesse
9%Rhineland-Palatinate
17%Baden-
Württemberg
15%Bavaria
13%Berlin
40 % and above
Between 35 and 39 %
Between 30 and 34 %
Below 30 %
17 % and aboveBetween 11 and 16 %Up to 10 %
26
26
26
26
27
27
27
27
28
28
28
29
29
30
18
18
19
17
19
20
21
20
18
19
21
19
21
21
Saxony
Berlin
Brandenburg
Mecklenburg-Western Pomerania
Lower Saxony
Bavaria
Saxony-Anhalt
Thuringia
Hamburg
Rhineland-Palatinate
North Rhine-Westphalia
Hesse
Baden-Württemberg
Schleswig-Holstein
Sector experience
Work experience

KfW SME Atlas
Page 13
The shares of SMEs managed by women differ significantly between the individual states (Figure 17, left). North Rhine-Westphalia (14 %), Berlin (13 %) and Thuringia (12 %) have a relatively low share of SMEs managed by women.
In the northern states of Schleswig-Holstein (28 %), Mecklenburg-Western Pomerania (27 %) and Hamburg (24 %), on the other hand, women manage roughly one fourth of SMEs. This distinction can be partly explained by the sectoral distribution of businesses (Figure 6). The share of SMEs providing ‘other services’ is highest in these three states. According to analyses by KfW Research, it is precisely this segment that has a very high share of female owner-managers.25 In the sub-segment education and teaching, for example, women manage nearly half of all SMEs or provide independent services (46 %). The share of women is also above-average in the hospitality and hotel industry, healthcare, veterinary and social services, as well as nursing, education and training (roughly one in three).
The differences between the states in the share of migrants among SME owner-managers is a reflection of general social structures (Figure 17, right). The share is particularly high in those states where migrants already represent a high share of the population. The shares are highest in the city-states Berlin and Hamburg, at 14 % each. These states generally also have the highest share of migrants in the population (Berlin ranks first with 16 % and Hamburg second with 15 %)26. The share of SMEs managed by migrants is also above average in the western German area states of Baden-Württemberg, North Rhine-Westphalia and Hesse.
The share of migrant-headed SMEs is a very low 1 to 2 % in all five eastern German area states. This, too, is an expression of general social structures. The share of migrants in the population of all these states is 4 %.
Figure 17: Shares of SMEs managed by women (left) and by migrants (right) by state
Notes: In the present context, the term migrant refers to an SME owner-manager who was not a German citizen at birth.
Source: KfW Research.
14%North Rhine-Westphalia
16%Lower Saxony
24%Hamburg
28%Schleswig-
Holstein 27%Mecklenburg-
Western Pomerania
19%Brandenburg
22%Saxony
16%Saxony-Anhalt
12%Thuringia15%
Hesse
16%Rhineland-Palatinate
16%Baden-
Württemberg
21%Bavaria
13%Berlin
8%North
Rhine-Westphalia
5%Lower Saxony
14%Hamburg
3%Schleswig-
Holstein 1%Mecklenburg-
Western Pomerania
1%Brandenburg
1%Saxony
2%Saxony-Anhalt
2%Thuringia7%
Hesse
4%Rhineland-Palatinate
11%Baden-
Württemberg
6%Bavaria
14%Berlin
20% and above
Between 15 and 19%
Below 15%
9% and above
Between 4 and 8%
Below 4%

KfW Research
Page 14
It is generally apparent that the share of migrants as owner-managers of SMEs is lower in all states than the percentage of migrants in the overall population. One explanation is the higher likelihood of migrant business founders discontinuing their business within the first three years of its foundation.27 The KfW Start-up Monitor points out that the start-up activity of migrants is more dependent on the labour market. They are more likely to be necessity entrepreneurs for lack of income alternatives and are quicker to abandon their business once an attractive job offer presents itself. This explains why a below-average number of SMEs managed by migrants reach a high age (for comparison: the average age of an SME is 23 years).
Northwestern Germany shows higher share of trainees and apprentices Some 90 % of all trainees and apprentices in Germany undergo their training in a small or medium-sized enterprise, representing around 1.2 million individuals in roughly 440,000 SMEs across Germany (11.7 % of all SMEs).
Figure 18: Share of SMEs that offer training
Source: KfW Research.
The training rates of SMEs differ from one state to another (Figure 18). The large northwestern states are in the lead, with 18.9 % of the enterprises domiciled in Rhineland-Palatinate providing training. The training rate of enterprises in Lower Saxony and North Rhine-Westphalia is also higher than average, at 16.8 and
15.9 %, respectively. Training rates are lowest in the eastern German area states of Saxony, Thuringia (10 % each) and Mecklenburg-Western Pomerania (11 %), as well as in the city-states Berlin (10 %) and Hamburg (11 %).
This is due to the different sectoral structures of SMEs. Service providers dominate in the city-states. Sectors that are traditionally heavily engaged in training (manufacturing, construction, handicrafts), where training rates are 20 to 30 %, are less common in large cities. Micro-businesses are particularly common in eastern Germany. But because of the declining population, demand for training, not just supply, is low in many places as well.
Different environments for SMEs, but similar challenges A regionally differentiated analysis of SMEs is important and can provide significant input for economic policy debate at state level. The present analysis shows that German SMEs do not follow a uniform pattern. Marked structural peculiarities exist in individual states (size and sectoral distribution, age structure), as well as noticeable differences on the executive floors of the SMEs. They can explain some of the differences we have identified in key SME indicators. These regional characteristics require differentiated economic-policy responses.
Nevertheless, similar trends and challenges exist across state boundaries. One of them is demographic change. Just like everyone else, SME bosses are not immune to ageing. In nearly all regions of Germany, unclear business succession is putting the substance of SMEs at risk.28 Securing the supply of skilled workers as the workforce decreases in the future will be a challenge for SMEs across Germany. Many are attempting to address the looming skills shortage by stepping up in-company training, for example.29 But regions with a high share of small businesses in particular, which cannot train workers on their own, are at a disadvantage in this respect.
If Germany wants to maintain its potential growth on a reasonable level in future as well, despite its shrinking labour force potential, more investment will be necessary. Despite some encouraging upward outliers, SMEs in many regions are still noticeably reluctant to invest. This must be changed on a broad front – by creating investment-friendly conditions and making suitable and adequate funding offers available. After all, more investment in capital stock can also help close the productivity gap between SMEs and the overall economy again, which has recently widened.30
15.9%North
Rhine-Westphalia
16.8%Lower Saxony
10.7%Hamburg
12.7%Schleswig-
Holstein 11.1%Mecklenburg-
Western Pomerania
12.3%Brandenburg
9.9%Saxony
14.8%Saxony-Anhalt
10.1%Thuringia14.4%
Hesse
18.9%Rhineland-Palatinate
12.3%Baden-
Württemberg
12.7%Bavaria
10.1%Berlin
More than15%
14 to15%
12 to 13%
Below 12%

KfW SME Atlas
Page 15
Digitalisation is another source of vast opportunities for future growth and competitiveness. SMEs are still making less use of the possibilities than average.31 Much potential exists that needs to be mobilised in this area. But the conditions must be favourable, and enterprises still see a variety of obstacles. These include lack of IT skills, unresolved issues relating to
data security and data protection, problems in adapting the corporate structure and workflow management, and the unsatisfactory quality of internet connections.32
Solutions to the challenges presented here require efforts at all political levels. ■
KfW SME Atlas: database and methodology The representative regional survey of the KfW SME Atlas 2018 is based on data of the KfW SME Panel. The data for it were collected as a postal tracking survey of small and medium-sized enterprises in Germany since 2003. With a database of up to 15,000 enterprises per year, the KfW SME Panel is the only representative survey of the German SME sector, making it the most important source of data on issues relevant to the SME sector.
The KfW SME Panel gives a representative picture of the current situation and the needs and plans of SMEs in Germany. It focuses on annually recurring information on companies’ performance, investment activity, financing structure and ownership. The basic population includes private-sector companies from all sectors of the economy with annual turnovers of no more than EUR 500 million. The population does not include the public sector, banks or non-profit organisations. The KfW SME Panel sample is designed in such a way that it can generate representative, reliable data that are as precise as possible. In order to draw conclusions on the basic population based on the sample, the results of the survey are weighted / extrapolated.
This regionally differentiated analysis, which has been conducted for the first time, draws on the five most recent annual survey waves of the KfW SME Panel (wave 11–15) – and thus comprises the reporting years 2012–2016 (survey years 2013–2017). Based on this summary, the analysis can cover up to around 50,000 observations. The regional disaggregation by federal state thus relies on a sufficiently high number of cases. In order for the report to provide exclusively robust findings, it had to omit results from the states of Bremen and Saarland. These two states will be included in future as well.
Further information can be obtained at www.kfw-mittelstandspanel.de.

KfW Research
Page 16
1 For the current edition see Schwartz, M. (2017), KfW SME Panel 2017, KfW Research. A supplementary detailed Volume of tables is published annually. The Volume of Tables relating to the KfW SME Panel (in German only) is available at: https://www.kfw.de/KfW-Konzern/KfW-Research/KfW-Mittelstandspanel.html All annual reports on the KfW SME Panel can be retrieved here as well.
2 See Destatis (http://www.statistik-portal.de/Statistik-Portal/de_inhalt23.asp) Here, large enterprises are defined as companies with taxable turnover from supplies and services and/or 250 or more employees subject to social security contributions in the reporting year 2014.
3 Cf. http://www.boerse.de/aktien/dax-konzerne-deutschland/grafik (retrieved on 19 May 2017).
4 Knowledge-intensive services comprise service sub-sectors with an above-average share of university graduates in overall employment and services strongly driven by technology. These include, for example, architecture and engineering firms, law firms, tax and management consultancies, data processing and telecommunication services. The definition is based on what is known as the NIW/ISI list of research-intensive industries and services, which in turn follows the Federal Statistical Office’s ‘Classification of Economic Activities (WZ 2008)’.
5 See also the fundamental works: Jacobs, J. (1969), The Economy of Cities. New York: Random House.- Isard, W. (1956), Location and Space-economy; a General Theory Relating to Industrial Location, Market Areas, Land Use, Trade, and Urban Structure. Cambridge, MA: MIT. A general overview of the academic debate is provided by Beaudry, C. and Schiffauerova, A. (2009), Who’s Right, Marshall or Jacobs? The Localisation Versus Urbanisation Debate. Research Policy 38, pp. 318–337.
6 Cf. IAB (2015), Wandel der Betriebslandschaft in West- und Ostdeutschland – Ergebnisse aus dem IAB-Betriebspanel 2014, IAB Forschungsbericht 9/2015 (Transformation of the business landscape in western and eastern Germany – findings of the IAB Business Panel 2014, IAB Research Report 9/2015), Nuremberg (in German).
7 The employment growth rate is calculated on the basis of full-time equivalents (FTEs). In difference to the concept of employee numbers, it depicts actual demand for labour. Full-time equivalent employees are calculated by adding the number of full-time employees (including business owners) to the number of part-time employees multiplied by the factor 0.5. Apprentices are not included.
8 Profit margin is defined as the ratio of pre-tax profit to turnover. The figure shows the mean values of profit margin weighted against turnover.
9 Gerstenberger, J. and Schwartz, M. (2014), Unsicherheit kostet mittelständische Investitionen: Sichere Rahmenbedingungen nötig (‘Uncertainty hampers SMEs’ investment, a secure framework is necessary’), Fokus Volkswirtschaft Nr. 66, KfW Economic Research (in German only). – Schwartz, M. (2015): KfW SME Panel 2015, KfW Research, p. 13.
10 Schwartz, M. (2017): KfW SME Panel 2017 ,KfW Research.
11 Cf. Gerstenberger, J. and Zimmermann, V. (2016), Unternehmensbonität – eine nicht zu vernachlässigende Größe (‘A company’s credit rating – a factor not to be neglected’ – our title translation, in German only), KfW Research.
12 The equity ratio is defined as the quotient of equity and the balance sheet total. The figure shows the mean values of the equity ratio weighted against the balance sheet total. The calculations apply only to enterprises required to draw up balance sheets.
13 Our data show that in 19 % of SMEs in large eastern German states, 25 % of the capital or more than 25 % of the voting shares is owned by other companies. In western Germany it is only 14 %.
14 Trautvetter, A.(2011), Bedeutung der Eigenkapitalausstattung für den Mittelstand (‘Importance of the equity base for SMEs’ – our title translation), HWWI Policy Paper 56, Hamburgisches WeltWirtschaftsInstitut (in German only).
15 Other sources have also determined that the equity base of enterprises in eastern Germany is above the national average and on the upper end of the scale, while enterprises in Berlin and Hamburg have a rather weak capital base. Creditreform Rating Agentur (2015), Eigenkapitalpolster im deutschen Unternehmenssektor (‘Capital buffer in the German business sector’ – our title translation) (https://www.creditreform-rating.de/fileadmin/user_upload/creditreform-rating.de/Dokumente/Fachpublikationen/15-11-26_Creditreform_Rating_EKpolster_deutscher_Unternehmen.pdf – in German)
16 Gerstenberger, J. and Schwartz, M. (2014), Mittelstand altert im Zeitraffer (‘SMEs are ageing fast’), Volkswirtschaft Kompakt Nr. 63, KfW Economic Research (in German).
17 Cf. Leifels, A. (2015), Recruitment of skilled workers in SMEs: Optimism must not distract from qualification problems, Focus on Economics No. 100, KfW Research. For details see Schwartz, M. and Gerstenberger, J. (2015), Ageing in SMEs is putting a damper on investments, Focus on Economics No. 85, KfW Research – Gerstenberger, J. and Schwartz, M. (2014), Mittelstand altert im Zeitraffer (‘SMEs are ageing fast’), Volkswirtschaft Kompakt Nr. 63, KfW Economic Research (in German only).
18 KfW Research has been accompanying this transformation process in the SME sector for quite some time. In order to account for the growing importance of this issue, the collection of relevant data was restructured and expanded significantly in the context of the KfW SME Panel in 2017. Therefore, not all results reported in this analysis are comparable with those of previous publications. On this topic, see also e.g. Leifels, A. (2016), Ageing boosts SMEs’ need for successors – 620,000 business transitions by 2018, Focus on Economics No. 132, KfW Research – Schwartz, M. and Gerstenberger, J. (2015), Succession planning in SME sector in full swing: Half a million hand-overs by 2017, Focus on Economics No. 91, KfW Research.
19 Cf. Schwartz, M. (2018), Wave of successions in German SMEs: 240,000 successors wanted by 2019, Focus on Economics No. 197, KfW Research
20 Metzger, G. (2017), KfW Start-up Monitor 2017, KfW Research.
21 For a detailed analysis of start-ups by acquisitions in Germany cf. Metzger, G. (2016), Transfer-planning entrepreneurs outnumber takeover entrepreneurs 3 to 1, Focus on Economics No. 133, KfW Research.
22 Cf. Metzger, G. (2015): Are start-ups the same throughout Germany? Hardly! A comparison of German states, Focus on Economics No. 111, KfW Research.
23 Cf. Schwartz, M. (2017), Chefinnen im Mittelstand: Zuwachs gerät ins Stocken (‘Increase in the number of female bosses in German SMEs is beginning to stall’ – in German only), Volkswirtschaft Kompakt Nr. 127, KfW Research.
24 Cf. Metzger, G. (2017), Migrants have more and larger start-ups, with more hours a week, more employees, Focus on Economics No. 165, KfW Research.
25 Cf. Schwartz, M. (2015), How female is the world of small business? Women as business leaders, Focus on Economics No. 101, KfW Research.
26 See Destatis (2016), Bevölkerung und Erwerbstätigkeit: Bevölkerungsfortschreibung auf Grundlage des Zensus 2011 (‚Population and gainful employment, population update on the basis of the 2011 Census‘ – our title translation, in German only), Fachserie 1 Reihe 1.3, Wiesbaden.
27 Cf. Leifels, A. (2017), Migrants have more and larger start-ups, with more hours a week, more employees, Focus on Economics No. 165, KfW Research.
28 Schwartz, M. (2018), Wave of successions in German SMEs: 240,000 successors wanted by 2019, Focus on Economics No. 197, KfW Research Leifels, A. (2016), Ageing boosts SMEs’ need for successors – 620,000 business transitions by 2018, Focus on Economics No. 132, KfW Research – Schwartz, M. and Gerstenberger, J. (2015), Succession planning in SME sector in full swing: Half a million hand-overs by 2017, Focus on Economics No. 91, KfW Research.

KfW SME Atlas
Page 17
29 Cf. Leifels, A. (2016), Mittelstand steht bei der Fachkräftesicherung in den Startlöchern (‘SMEs are preparing to secure skills’), Fokus Volkswirtschaft Nr. 119, KfW Research (in German only).
30 Cf. Gerstenberger, J. (2017), Productivity of German SMEs has flatlined – time to act, Focus on Economics No. 172, KfW Research. – Schwartz, M. (2016): KfW SME Panel 2016, KfW Research. – Sachverständigenrat zur Begutachtung der gesamtwirtschaftlichen Entwicklung (2015), Jahresgutachten 2015/2016: Zukunftsfähigkeit in den Mittelpunkt, (German Council of Economic Experts) (2015) (Focus on sustainability, annual report 2015/16 – our title translation, in German only), Wiesbaden.
31 Cf. Zimmermann, V. (2016): SMEs and digitalisation: The current position, recent developments and challenges, Focus on Economics No. 138, KfW Research. – Schwartz, M. (2017), SMEs are slow to adopt e-commerce, Focus on Economics No. 161, KfW Research. – Schwartz, M. (2015), Harnessing the potential of digitalisation – with data protection and IT security, Focus on Economics No. 117, KfW Research.
32 Cf. Zimmermann, V. (2017): Business Survey 2017: Digital transformation of industries: broad basis, multiple barriers, KfW Research, or Saam, M., Viete, S. and Schiel, S. (2016): SME Digitalisation Status Quo, aktuelle Entwicklungen und Herausforderungen (‘Digitisation in SMEs: status quo, current trends and challenges’ – our title translation, in German only). Research project on behalf of KfW Group.