Keystone XL Assessment Keystone XL Project and Status..... 9 2.2 Department of Energy Study Request...
124
EnSys Keystone XL Assessment - Final Report Dec 23 rd 2010 Keystone XL Assessment Prepared by Ensys Energy For the U.S. Department of Energy Office of Policy & International Affairs Final Report December 23 2010 EnSys Energy & Systems, Inc. 1775, Massachusetts Avenue Lexington, MA 02420, USA www.ensysenergy.com
Transcript of Keystone XL Assessment Keystone XL Project and Status..... 9 2.2 Department of Energy Study Request...
EnSys Keystone XL Assessment - Final Report Dec 23rd 2010
Keystone XL Assessment
Prepared by Ensys Energy
For the U.S. Department of Energy Office of Policy & International Affairs
Final Report
December 23 2010
EnSys Energy & Systems, Inc. 1775, Massachusetts Avenue
Lexington, MA 02420, USA www.ensysenergy.com

EnSys Keystone XL Assessment - Final Report Dec 23rd 2010
i
Table of Contents 1 Executive Summary ............................................................................................................................... 1
2 Introduction .......................................................................................................................................... 9
2.1 Keystone XL Project and Status..................................................................................................... 9
2.2 Department of Energy Study Request ........................................................................................ 10
2.3 EnSys’ Approach to Study ........................................................................................................... 11
2.4 Content of Report ....................................................................................................................... 11
3 Background to Study ........................................................................................................................... 12
3.1 Recent WCSB Production and Export History ............................................................................. 12
3.2 The WCSB Crude Oil Export System and Projects ....................................................................... 14
3.2.1 Current Flows ...................................................................................................................... 14
3.2.2 Current Export Routes ........................................................................................................ 15
3.2.3 Current and Proposed Export Projects ............................................................................... 17
3.2.3.1 West to British Columbia Coast and Asia ........................................................................ 17
3.2.3.1.1 TMX 2, 3 and Northern Leg ....................................................................................... 17
3.2.3.1.2 Northern Gateway .................................................................................................... 18
3.2.3.1.3 CN Rail / Altex ........................................................................................................... 18
3.2.3.1.4 The China Factor ....................................................................................................... 19
3.2.3.2 South to PADD4 & Bakken Exports ................................................................................. 19
3.2.3.3 East and South to PADD2, PADD3 ................................................................................... 23
3.2.3.3.1 Alberta Clipper .......................................................................................................... 23
3.2.3.3.2 Keystone Mainline & Keystone XL ............................................................................ 23
3.2.3.3.3 Other Gulf Coast Projects ......................................................................................... 28
3.2.3.4 Eastern Canada Line 9 Reversal ...................................................................................... 28
3.2.3.5 Summary of Export Projects ........................................................................................... 29
3.2.4 WCSB Production versus Export Capacity Outlook ............................................................. 30
4 Scope & Basis of Analysis .................................................................................................................... 34
4.1 Methodology/Approach ............................................................................................................. 34
4.2 Study Exclusions .......................................................................................................................... 36
EnSys Keystone XL Assessment - Final Report Dec 23rd 2010
ii
4.2.1 U.S. Climate Policy .............................................................................................................. 36
4.2.2 Oil Sands Upgrading Emissions and Life-Cycle Analysis ...................................................... 36
4.2.3 Alberta Oil Sands Vision ...................................................................................................... 37
4.2.4 Time Period After 2030 ....................................................................................................... 37
4.2.5 Corporate Strategy Effects .................................................................................................. 37
4.3 Study Basis and Outlooks ............................................................................................................ 38
4.3.1 Demand Outlooks ............................................................................................................... 38
4.3.2 Canadian Oil Production Outlook ....................................................................................... 41
4.4 Study Scenarios ........................................................................................................................... 42
4.4.1 KXL Scenario & Variants ...................................................................................................... 45
4.4.2 No KXL Scenario & Variants ................................................................................................ 46
4.4.3 No Expansion Scenario & Variants ...................................................................................... 47
4.4.4 Discussion of Scenarios ....................................................................................................... 47
4.5 Economics of Moving WCSB Crudes to U.S. Gulf Coast versus Asia ........................................... 48
5 Results & Key Findings ........................................................................................................................ 50
5.1 AEO Reference and Low Demand Global Results for Refinery Expansion .................................. 50
5.2 Scenario Results .......................................................................................................................... 52
5.2.1 Overview ............................................................................................................................. 52
5.2.2 Minor Scenario Impacts ...................................................................................................... 53
5.2.2.1 U.S. Refinery Investments and Expansions ..................................................................... 53
5.2.2.2 U.S. Refinery Crude Throughputs.................................................................................... 58
5.2.2.3 U.S. Total Crude Imports ................................................................................................. 62
5.2.2.4 U.S. Crude Slate Quality .................................................................................................. 63
5.2.2.5 U.S. Product Imports and Exports ................................................................................... 69
5.2.2.6 U.S. Product Supply and Oil Import Costs ....................................................................... 73
5.2.2.7 WCSB Delivered Crude Prices ......................................................................................... 74
5.2.2.8 U.S. Refining Margins ...................................................................................................... 74
5.2.2.9 Crude Production Value .................................................................................................. 78
5.2.2.10 Global GHG Emissions ................................................................................................. 80
5.2.2.10.1 Refinery CO2 Emissions ........................................................................................... 80
5.2.2.10.2 Life-cycle GHG Emissions ........................................................................................ 82
EnSys Keystone XL Assessment - Final Report Dec 23rd 2010
iii
5.2.3 Major Scenario Impacts ...................................................................................................... 85
5.2.3.1 Canadian Imports Growth ............................................................................................... 90
5.2.3.2 Effect of Low U.S. Demand ............................................................................................. 92
5.2.3.3 Effect of No Pipeline Expansion on Canadian Production and U.S. Processing .............. 93
5.2.3.4 Effect of No KXL on U.S. Imports of WCSB Crude ........................................................... 95
5.2.3.5 Effect of British Columbia Expansion Projects on U.S. Imports of WCSB Crude ............. 96
5.2.3.6 Effect of Pipeline Availability on U.S. Non-Canadian Crude Oil Imports......................... 98
5.2.3.7 Effect of Pipeline Availability on Destinations for U.S. Crude Oil Import Revenues ..... 105
5.2.3.8 U.S. & Canada Regional Potential to Absorb WCSB Crude Oils .................................... 108
5.2.3.9 Effect on PADD3 Crude Oil Sources .............................................................................. 113
6 Conclusions ....................................................................................................................................... 116

EnSys Keystone XL Assessment - Final Report Dec 23rd 2010
iv
Disclaimer
This report was prepared as an account of work sponsored by an agency of the United States
Government. Neither the United States Government nor any agency thereof, nor any of their
employees, makes any warranty, express or implied, or assumes any legal liability or responsibility for
the accuracy, completeness, or usefulness of any information, apparatus, product, or process disclosed,
or represents that its use would not infringe privately owned rights. Reference herein to any specific
commercial product, process, or service by trade name, trademark, manufacturer, or otherwise, does
not necessarily constitute or imply its endorsement, recommendation, or favoring by the United States
Government or any agency thereof. The views and opinions of authors expressed herein do not
necessarily state or reflect those of the United States Government or any agency thereof.
EnSys Keystone XL Assessment - Final Report Dec 23rd 2010
v
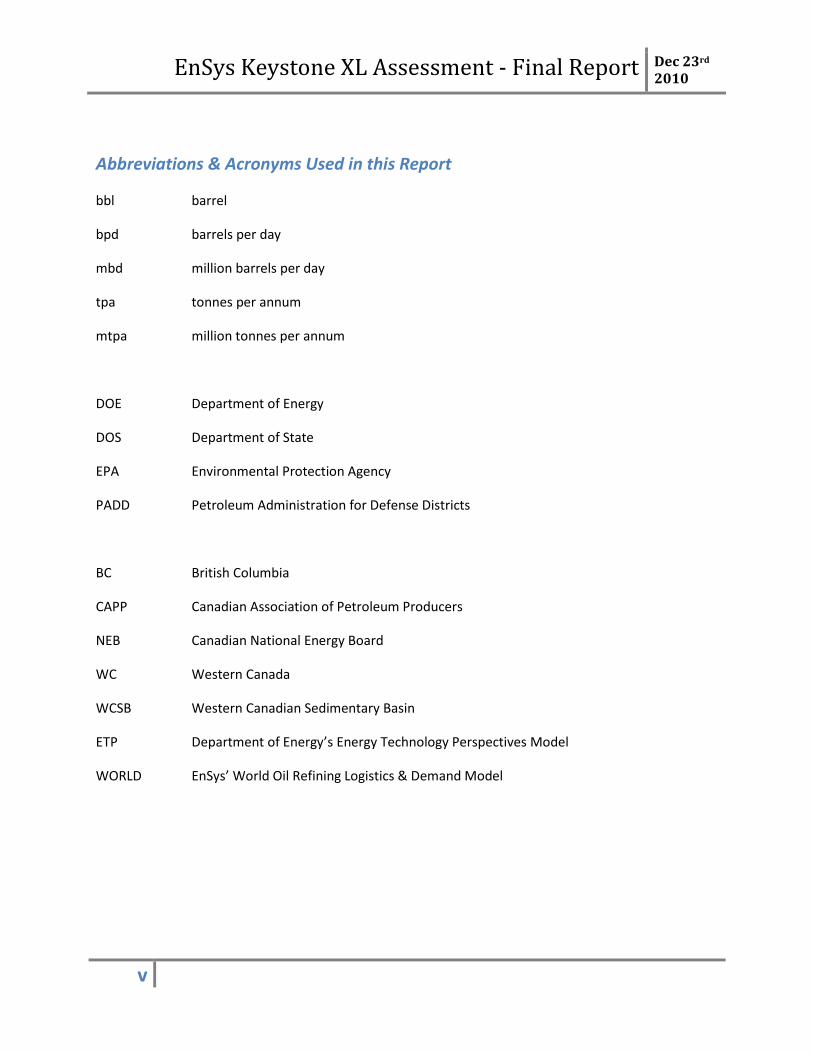
Abbreviations & Acronyms Used in this Report
bbl barrel
bpd barrels per day
mbd million barrels per day
tpa tonnes per annum
mtpa million tonnes per annum
DOE Department of Energy
DOS Department of State
EPA Environmental Protection Agency
PADD Petroleum Administration for Defense Districts
BC British Columbia
CAPP Canadian Association of Petroleum Producers
NEB Canadian National Energy Board
WC Western Canada
WCSB Western Canadian Sedimentary Basin
ETP Department of Energy’s Energy Technology Perspectives Model
WORLD EnSys’ World Oil Refining Logistics & Demand Model
EnSys Keystone XL Assessment - Final Report Dec 23rd 2010
1
1 Executive Summary
In June 2010, EnSys Energy was contracted by the Department of Energy Office of Policy & International
Affairs to conduct an evaluation of the impacts on U.S. and global refining, trade and oil markets of the
Keystone XL project to bring additional Canadian crudes, including oil sands, into the U.S. The study
was conducted in close collaboration with and also with significant inputs from the Department of
Energy. Those included assessments of global life-cycle GHG impacts of scenarios evaluated.
This report presents the assumptions used to perform the analyses and the findings developed via
integrated global modeling and under a range of potential scenarios. The central focus of the report is
the proposed project by the Canadian company TransCanada to build a pipeline known as Keystone XL
(or simply KXL) from Hardisty Alberta to Steele City Nebraska and then on to the U.S. Gulf Coast via
Cushing Oklahoma. The line would carry crude oil streams from the Western Canadian Sedimentary
Basin (WCSB) to U.S. Midwestern (PADD2) and Gulf Coast (PADD3) oil refineries. Transit of Bakken and
Cushing /West Texas area crudes on KXL may also be added. The project was approved by the Canadian
National Energy Board in March 2010, and TransCanada has applied for a Presidential Permit from the
U.S. Department of State. The Department of Energy commissioned this analysis in support of the
Department of State as a component of its environmental review of the KXL pipeline and its review of
the request for a Presidential Permit.
The first two phases of the Keystone pipeline system, intended to carry crude from Hardisty into central
PADD2 and then on down to Cushing Oklahoma, are under start-up or construction, with full operation
early 2011. Total system capacity after these phases is stated as 591,000 bpd. The Keystone XL
expansion comprises two new lines, one to run from Hardisty, cross-border via Montana and South
Dakota, to PADD2 and the other from Cushing to the U.S. Gulf Coast. TransCanada projects start-up
operations in the first quarter of 2013, subject to permits. Completion of KXL would increase total
Keystone pipeline capacity by 700,000 bpd to 1.29 mbd, with the ability to move 591,000 bpd of crude
from Hardisty to PADD2 refineries (Keystone Mainline) and another 700,000 bpd from Hardisty to the
Gulf Coast (Keystone XL). ). A potential tie-in TransCanada is considering would enable Bakken crudes
to feed into the Keystone XL line, taking up part of the 700,000 bpd capacity. Keystone XL would be
designed to support future capacity of 900,000 bpd by increasing pumping capability1. Maximum
capacity for the total Keystone system after expansion would be 1.5 mbd. Associated capacity to the
Gulf Coast has not been set but would likely be 900,000 bpd2. Current commitments on KXL, if built,
1 A permit waiver would be required for any future expansion of KXL but is not being requested by TransCanada at
this time. 2 Future capacity to the Gulf Coast could be lower than 900,000 bpd as the co-location of the Keystone XL and
Mainline pipelines at Steele City, Nebraska, allows for the possibility that crudes in future traveling on KXL to Steele City could be diverted there onto the Keystone Mainline running east to Wood River/Patoka, i.e. could stay in PADD2 rather than go south to PADD3.

EnSys Keystone XL Assessment - Final Report Dec 23rd 2010
2
are for 535,000 bpd of volume from Hardisty to Cushing and for 380,000 bpd on the segment from
Cushing to the Gulf coast (out of 700,000 bpd capacity)3.
EnSys employed its World Oil Refining Logistics & Demand (WORLD) model to address the potential
impacts on U.S. refining, crude and product import dependency and cost, and on Canadian crude oil
market destinations, of constructing or not constructing Keystone XL. The model provides integrated
analysis and projection of the global petroleum industry, combining top down scenarios for projected oil
price/supply and demand over the next twenty years with bottom up detail on crude oils, non-crudes,
(NGL’s, biofuels, etc.), refining, transportation, product demand and quality4.
3 These commitments are for WCSB crudes only. Additional volume commitments for (a) Bakken crude that would
be fed into KXL in Montana and/or (b) MidContinent crudes that would be fed in at Cushing could result should TransCanada determine to proceed with these options based on the results of two “open seasons” that closed in November. 4 Although a 50 year life for a pipeline is a common base for assessment of potential impacts, (thus to 2063 for
Keystone XL if it were to start up in 2013 as currently targeted by TransCanada), this WORLD model based study evaluated outlooks only through 2030. Firstly, the WORLD version available for the study extended only to 2030. Secondly, the horizons that could be modeled were constrained by those in available global outlooks. The projections available in the 2010 EIA Annual Energy Outlook went only to 2035, similarly those in the 2010 EIA International Energy Outlook . In general, high levels of uncertainty at very long term horizons tend to lead to studies modeling the detail of oil supply, refining and demand being limited to a maximum horizon 20 to 25 years out. In addition, the Keystone XL project is but one potential element in a complex, global petroleum supply system. The effects of such a project can be identified in a near to mid-term (10 to 20 years) assessment but are likely to be subsumed by assumptions concerning other changes in the global petroleum supply infrastructure over the longer term.
EnSys Keystone XL Assessment - Final Report Dec 23rd 2010
3
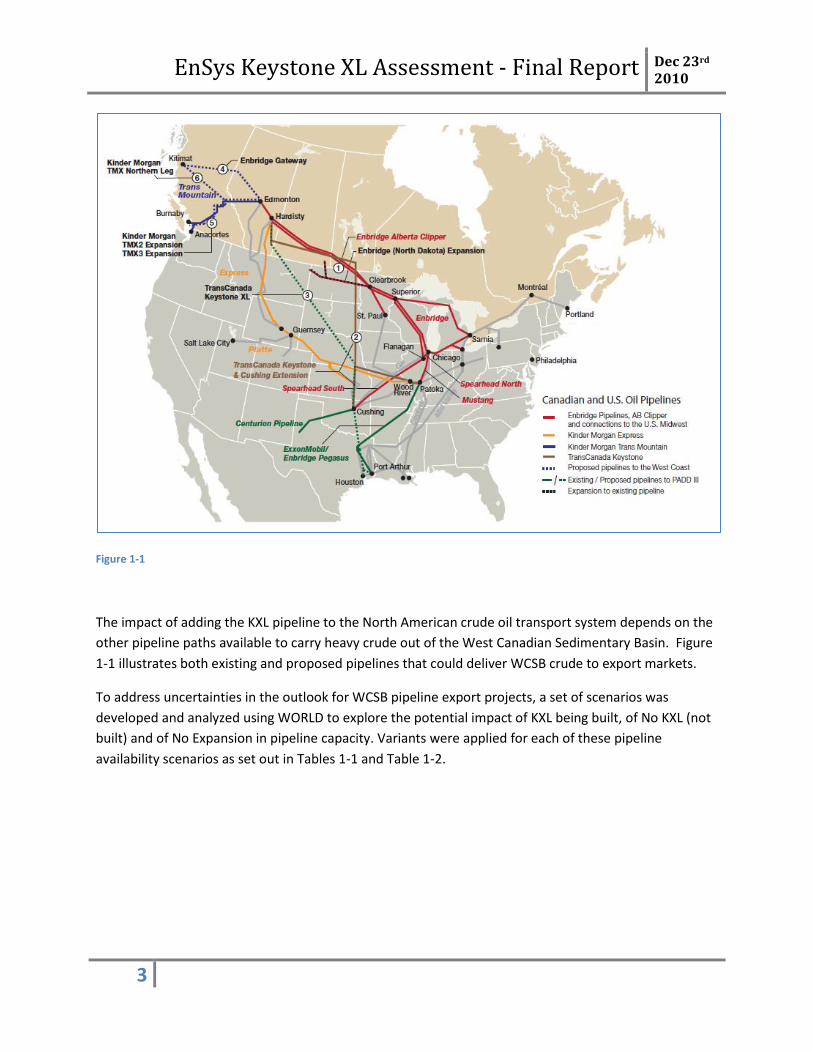
Figure 1-1
The impact of adding the KXL pipeline to the North American crude oil transport system depends on the
other pipeline paths available to carry heavy crude out of the West Canadian Sedimentary Basin. Figure
1-1 illustrates both existing and proposed pipelines that could deliver WCSB crude to export markets.
To address uncertainties in the outlook for WCSB pipeline export projects, a set of scenarios was
developed and analyzed using WORLD to explore the potential impact of KXL being built, of No KXL (not
built) and of No Expansion in pipeline capacity. Variants were applied for each of these pipeline
availability scenarios as set out in Tables 1-1 and Table 1-2.

EnSys Keystone XL Assessment - Final Report Dec 23rd 2010
4
Base Scenario Variant
KXL (is built)
KXL Transmountain TMX 2 and 3 expansions go ahead
KXL+Gateway TMX 2 and 3 and Northern Gateway go ahead
KXL No TMX
No TMX 2 and 3 or Northern Gateway i.e. no expansion to west coast of Canada
No KXL (not built)
No KXL Transmountain TMX 2 and 3 expansions go ahead
No KXL HiAsia
High level of expansion to Asia: TMX 2,3, Northern Gateway, Northern Leg
No Expansion
No Exp
No expansion of pipelines at all beyond current projects under construction
No Exp + P2P3
No expansion except TMX 2,3 and U.S. domestic PADD2 to U.S. Gulf Coast
Table 1-1
Table 1-2
Keystone XL Allow
ed
WCSB to PA
DD
2 EXP
PAD
D2 to PA
DD
3 EXP
TMX Expansion
Northern G
ateway
Nothern Leg
KXL KXL Y Y Y Y N N
KXL KXL+Gway Y Y Y Y Y N
KXL KXL No TMX Y Y Y N N N
No KXL No KXL N Y Y Y N N
No KXL No KXL Hi Asia N Y Y Y Y Y
No Expansion No Exp N N N N N N
No Expansion NoExp+P2P3 N N Y Y N N
USA
Pipelines
Asia
Pipelines
Basic Scenarios
Scenario
WORLD Model
Cases
Scenario Assumptions
EnSys Keystone XL Assessment - Final Report Dec 23rd 2010
5
All scenarios were assessed using two different demand outlooks: the EIA Annual Energy Outlook 2010
for reference global and U.S. petroleum supply and demand projections and a low-demand outlook5,
which leads to 4 mbd lower U.S. petroleum product demand by 2030. The study therefore presents 14
scenarios resulting from two different demand outlooks and 7 scenarios for different combinations of
pipeline availability. The study uses the 2010 Growth Outlook from the Canadian Association of
Petroleum Producers (CAPP) for crude oil supply to market from the WCSB. This projection, with
extrapolation from 2025 to 2030 by EnSys and DOE, leads to WCSB supply growing from 2.49 mbd in
2009 to 4.85 mbd in 2030, with the fraction of crude produced from oil sands rising from 65% to 91%
over the same time period.
Key findings and conclusions from the study covered U.S., Canadian and global refining and supply
impacts. General findings are summarized first to set a context for findings that are specific to KXL.
General Findings Not Specific to KXL
A. Inadequate WCSB export capacity from 2005 through 2008 led to production shut-ins, crude
revenue losses, and to a number of export pipeline projects, notably Enbridge Alberta Clipper
and TransCanada Keystone Mainline and Keystone Extension. These are now coming on-line,
adding over 1 mbd of export capability. Consequently, there is now surplus capacity for moving
WCSB crudes cross-border into the USA. However, capacity to move WCSB crudes via pipeline
to the U.S. Gulf Coast remains limited to less than 100,000 bpd.
B. Given the base projection for WCSB supply to nearly double by 2030, WCSB imports into the
USA rise over time under all scenarios evaluated, including those where WCSB crude oil
production growth rates are constrained by a total lack of pipeline expansion.
C. Refineries in western and eastern Canada, and U.S. PADDs I, IV and V (with California Law AB32
in place) are projected to have limited ability to process incremental volumes of WCSB crudes.
PADD2 is projected to be able to economically absorb approximately an additional 0.5 - 0.8 mbd.
PADD3 represents the major U.S. growth market, with the potential to process up to 2 mbd of
WCSB crudes by 2030 from less than 0.1 mbd today. The region’s large existing capacity geared
to processing heavy crudes (over 5 mbd) is a major factor.
D. WORLD model scenario results indicate a market opportunity exists short term (2010 – 2015) as
well as longer term for pipeline capacity to deliver heavy WCSB crudes to U.S. Gulf Coast
refiners6; this to fill a gap being created by declining supply from traditional heavy crude
5 This low-demand outlook was provided to staff of the Department of Energy by staff of the Environmental
Protection Agency. 6. Also, U.S. Gulf Coast refiners have committed to take 380,000 bpd of WCSB crude oils via KXL if the pipeline is
built.
EnSys Keystone XL Assessment - Final Report Dec 23rd 2010
6
suppliers, notably Mexico and Venezuela, a gap it is projected would otherwise be filled by
increases in other foreign supplies, notably from the Middle East.
E. Future level of U.S. refining activity is projected as relatively insensitive to the combination of
pipelines available to carry crude out of the Edmonton/Hardisty area.
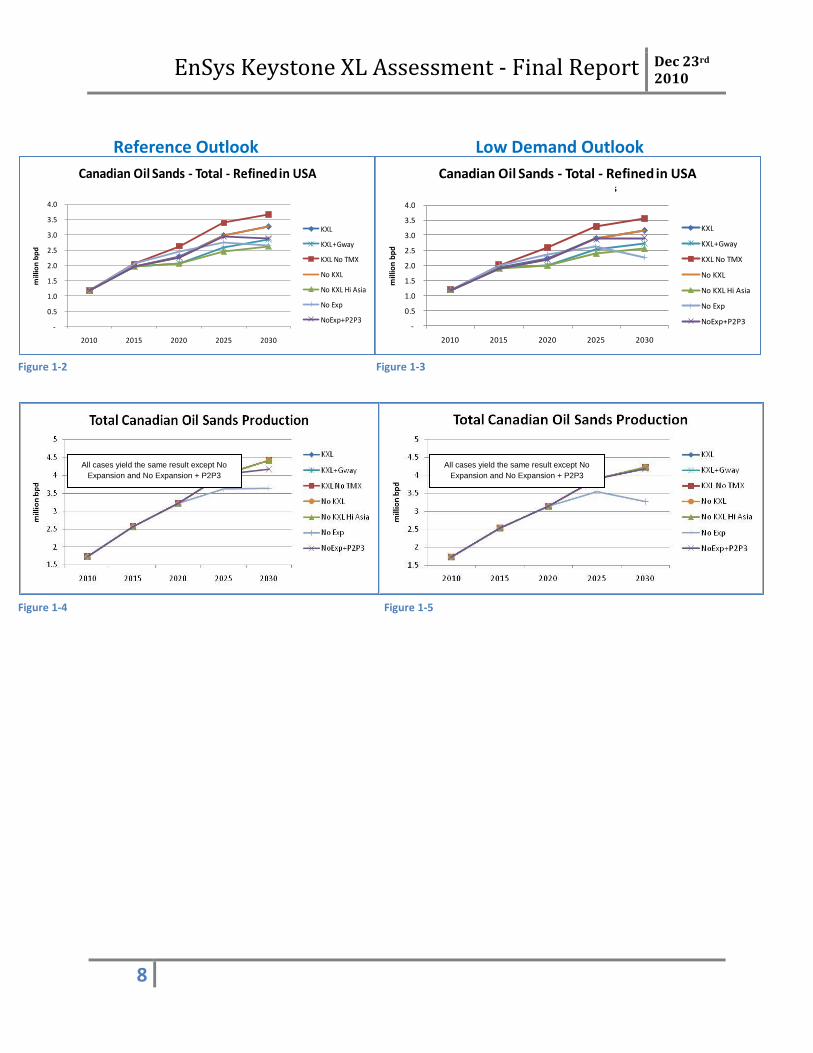
F. However, WCSB crude routings and future level of WCSB imports into the U.S. will be sensitive
to the combination of pipelines available to carry crude out of the Edmonton/Hardisty area.
Figures 1-2 and 1-3 illustrate modeling results that project cross-border WCSB deliveries rising
from 1.2 mbd today to between 2.6 mbd and 3.6 mbd in 2030, depending on the combination of
pipelines assumed to be available.
G. Over the next twenty years, the principal choice for WCSB exporters is between moving
increasing crude oil volumes to the USA or to Asia. Led by China, which has already bought
heavily into oil sands production, Asia constitutes the major region for future petroleum product
demand and refining capacity growth and offers Canada diversification of markets. In addition,
costs for transporting WCSB crudes to major markets in northeast Asia (China, Japan, South
Korea, Taiwan) via pipeline and tanker are lower than to transport the same crudes via pipeline
to the U.S. Gulf Coast. Projections from this study, which are supported by third party
information, indicate that Asian markets are attractive and, if the access routes are developed,
could absorb at least 1 mbd of WCSB crudes, potentially significantly more; this versus the less
than 50,000 bpd of WCSB crude that moves to Asia today.
H. Variations in WCSB import volumes into the U.S. will lead to equivalent offsetting variations in
crude oil imports from other foreign sources. Model projections are that, when increased
volumes of WCSB crudes move to Asia instead of the U.S., the “gap” would be filled by
offsetting increases in crude oil imports from other foreign sources, especially the Middle East
(as the primary balancing supplier).
I. In all scenarios considered, increases of Canadian crude oil imports into the U.S. correspondingly
reduce U.S. imports of foreign oil from sources outside of North America and the scale of
“wealth transfers” to those sources for the import costs of the crude oils.
J. Under any given pipeline scenario, reducing U.S. oil demand would result in reduction of oil
imports from non-Canadian foreign sources, especially the Middle East, with no material
reduction in imports of WCSB crude.
K. Together, growing Canadian oil sands imports and U.S. demand reduction have the potential to
very substantially reduce U.S. dependency on non-Canadian foreign oil, including from the
Middle East.
L. Canadian oil sands imports do not change significantly under the low-demand outlook.
EnSys Keystone XL Assessment - Final Report Dec 23rd 2010
7
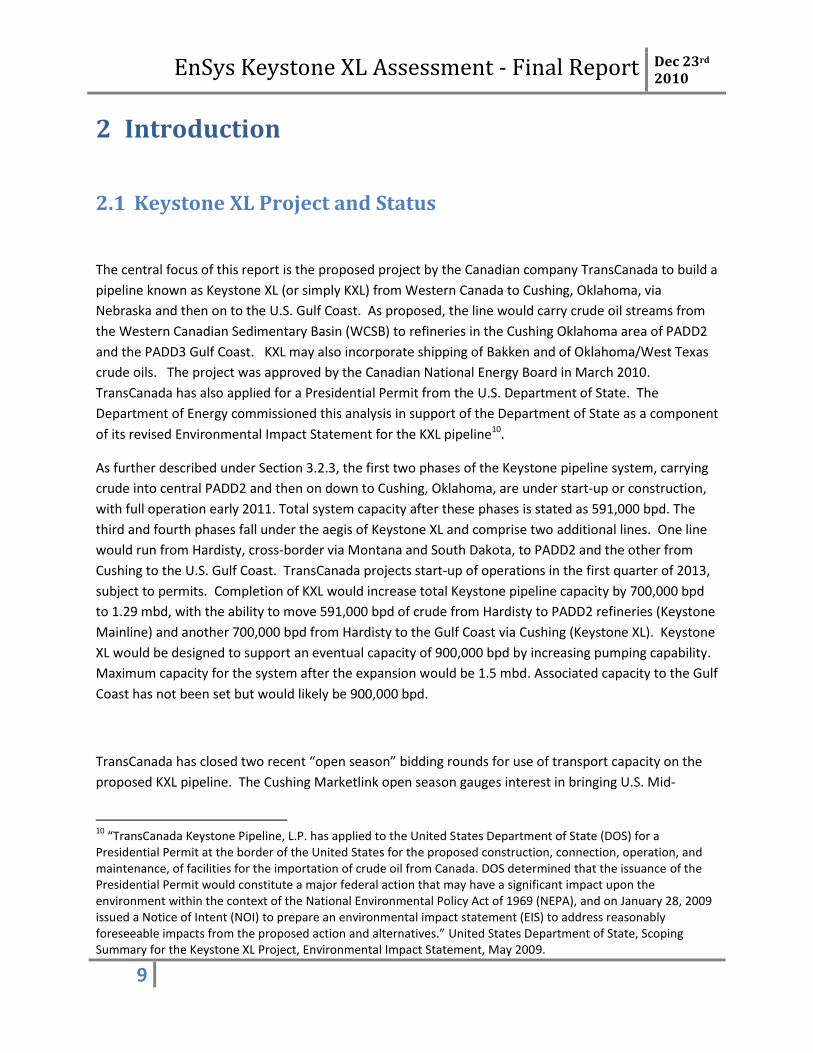
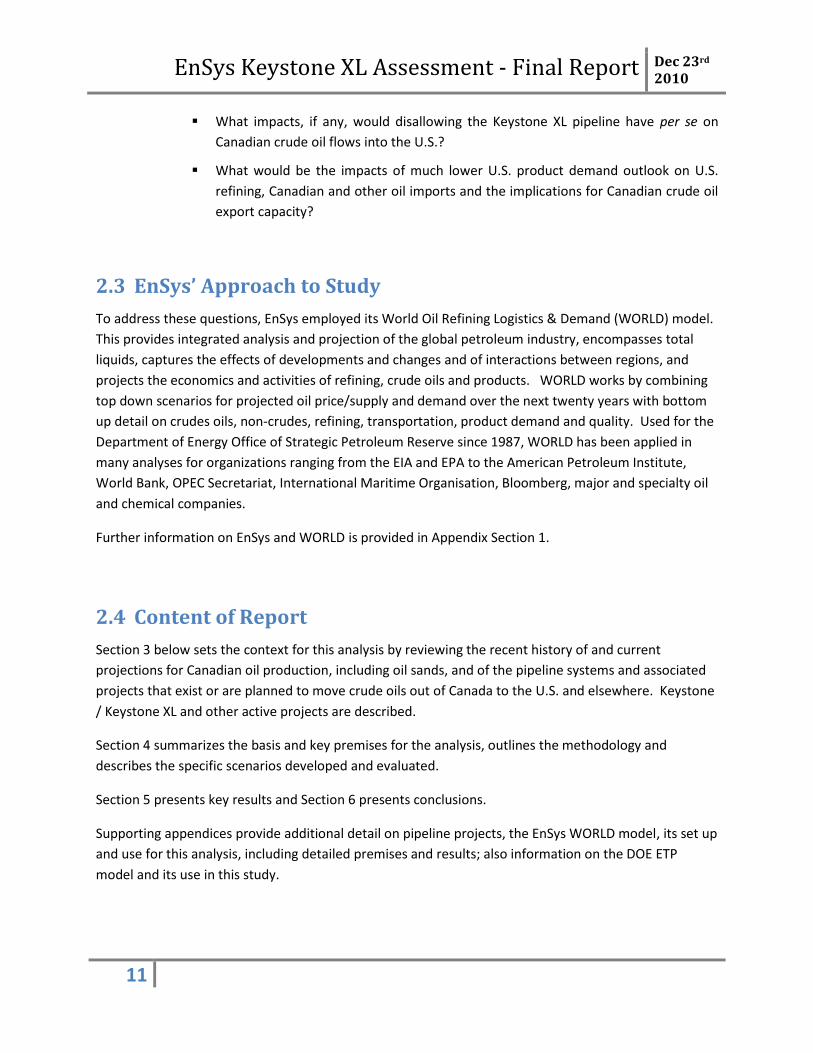
M. The only scenario studied that resulted in a significant reduction of WCSB oil sands production
assumed (a) a total moratorium on WCSB pipeline expansions in Canada to any destination and
(b) no expansion of pipeline capacity between PADD2 and PADD3, and (c) restriction of
rail/barge modes. Even then, existing available pipeline capacity (up to and including Keystone
Mainline and Extension – but not KXL) is such that any reduction in WCSB production would not
occur until after 2020 (Figures 1-4 and 1-5).
Findings Specific to KXL
N. KXL would add to the cross-border surplus of crude oil pipeline capacity observed in Finding A.
In every scenario studied, with or without KXL, the excess cross-border pipeline capacity persists
until after 2020. In scenarios where high pipeline capacity to the British Columbia coast – and
thence Asia – is assumed built, the excess cross-border capacity into the U.S.A. is projected as
continuing until 2025 or even 2030.
O. If KXL were not built, the scenario analyses show there is a demand for alternative projects to be
implemented that would lead, over time, to crude flows from WCSB to PADD2 and thence from
PADD2 to the PADD3 Gulf Coast broadly similar to those that would be provided by KXL.
P. These crude flows include indicated demand to take over 1.4 mbd of WCSB crude to the U.S.
Gulf Coast by 2030 (on the basis the Transmountain TMX 2 and 3 pipeline expansions to the BC
coast go ahead7). KXL represents a high capacity supply option that could meet early as well as
longer term market demand for crude oil at Gulf Coast refineries as discussed in Finding D8.
Q. KXL would provide increased redundancy for WCSB supply routes into the USA. Potentially, it
could also add capacity to bring U.S. Bakken crudes to market and/or to reduce congestion at
Cushing by increasing capability to take domestic U.S. crudes to the Gulf Coast.
R. The WORLD and DOE Energy Technologies Perspective (ETP) model analyses9 results show no
significant change in total U.S. refining activity, total crude and product import volumes and
costs, in global refinery CO2 and total life-cycle GHG emissions whether KXL is built or not.
The detailed premises and analyses underpinning these conclusions are set out in the body of the report
and in an accompanying Appendix.
7 If TMX 2 and 3 were not built, scenario projections are that WCSB volumes to PADD3 could reach 1.8 mbd by
2030; if Northern Gateway and/or Northern Leg are built as well as TMX 2 and 3, WCSB flows to PADD3 could drop to 1 mbd or lower. 8 At 700,000 bpd, KXL capacity is roughly twice that of the recently proposed Enbridge Monarch project. Reversal
of the Seaway line, which is stated by its owners as constituting only a possibility and not a project at this time, would add around 200,000 bpd of capacity to transport heavy crudes to the Gulf Coast. 9 The WORLD model analysis was performed by EnSys Energy. Supplemental analysis of greenhouse gas emissions
was performed by Brookhaven National Laboratory (BNL) using DOE’s ETP global energy model.
EnSys Keystone XL Assessment - Final Report Dec 23rd 2010
8
Figure 1-4 Figure 1-5
Reference Outlook Low Demand Outlook
-
0.5
1.0
1.5
2.0
2.5
3.0
3.5
4.0
2010 2015 2020 2025 2030
mill
ion
bp
d
Canadian Oil Sands - Total - Refined in USAReference & Scenarios
KXL
KXL+Gway
KXL No TMX
No KXL
No KXL Hi Asia
No Exp
NoExp+P2P3-
0.5
1.0
1.5
2.0
2.5
3.0
3.5
4.0
2010 2015 2020 2025 2030
mill
ion
bp
d
Canadian Oil Sands - Total - Refined in USAReference & Scenarios
KXL
KXL+Gway
KXL No TMX
No KXL
No KXL Hi Asia
No Exp
NoExp+P2P3
Figure 1-2 Figure 1-3
All cases yield the same result except No
Expansion and No Expansion + P2P3
All cases yield the same result except No
Expansion and No Expansion + P2P3
EnSys Keystone XL Assessment - Final Report Dec 23rd 2010
9
2 Introduction
2.1 Keystone XL Project and Status
The central focus of this report is the proposed project by the Canadian company TransCanada to build a
pipeline known as Keystone XL (or simply KXL) from Western Canada to Cushing, Oklahoma, via
Nebraska and then on to the U.S. Gulf Coast. As proposed, the line would carry crude oil streams from
the Western Canadian Sedimentary Basin (WCSB) to refineries in the Cushing Oklahoma area of PADD2
and the PADD3 Gulf Coast. KXL may also incorporate shipping of Bakken and of Oklahoma/West Texas
crude oils. The project was approved by the Canadian National Energy Board in March 2010.
TransCanada has also applied for a Presidential Permit from the U.S. Department of State. The
Department of Energy commissioned this analysis in support of the Department of State as a component
of its revised Environmental Impact Statement for the KXL pipeline10.
As further described under Section 3.2.3, the first two phases of the Keystone pipeline system, carrying
crude into central PADD2 and then on down to Cushing, Oklahoma, are under start-up or construction,
with full operation early 2011. Total system capacity after these phases is stated as 591,000 bpd. The
third and fourth phases fall under the aegis of Keystone XL and comprise two additional lines. One line
would run from Hardisty, cross-border via Montana and South Dakota, to PADD2 and the other from
Cushing to the U.S. Gulf Coast. TransCanada projects start-up of operations in the first quarter of 2013,
subject to permits. Completion of KXL would increase total Keystone pipeline capacity by 700,000 bpd
to 1.29 mbd, with the ability to move 591,000 bpd of crude from Hardisty to PADD2 refineries (Keystone
Mainline) and another 700,000 bpd from Hardisty to the Gulf Coast via Cushing (Keystone XL). Keystone
XL would be designed to support an eventual capacity of 900,000 bpd by increasing pumping capability.
Maximum capacity for the system after the expansion would be 1.5 mbd. Associated capacity to the Gulf
Coast has not been set but would likely be 900,000 bpd.
TransCanada has closed two recent “open season” bidding rounds for use of transport capacity on the
proposed KXL pipeline. The Cushing Marketlink open season gauges interest in bringing U.S. Mid-
10
“TransCanada Keystone Pipeline, L.P. has applied to the United States Department of State (DOS) for a Presidential Permit at the border of the United States for the proposed construction, connection, operation, and maintenance, of facilities for the importation of crude oil from Canada. DOS determined that the issuance of the Presidential Permit would constitute a major federal action that may have a significant impact upon the environment within the context of the National Environmental Policy Act of 1969 (NEPA), and on January 28, 2009 issued a Notice of Intent (NOI) to prepare an environmental impact statement (EIS) to address reasonably foreseeable impacts from the proposed action and alternatives.” United States Department of State, Scoping Summary for the Keystone XL Project, Environmental Impact Statement, May 2009.

EnSys Keystone XL Assessment - Final Report Dec 23rd 2010
10
Continent crudes into Keystone XL at Cushing and thence on to the Gulf Coast. The second open season,
Bakken MarketLink, assesses interest in Bakken producers feeding into the northern KXL line at Baker,
Montana, already a Bakken storage and transmission hub. Final decisions by TransCanada on these
projects are expected in early 2011.
2.2 Department of Energy Study Request
The Department of Energy (DOE) Office of Policy & International Affairs contracted EnSys Energy to
undertake an analysis to evaluate different scenarios through 2030 focused on the Keystone XL project.
The DOE sought to better understand the potential impacts of the presence or absence of the KXL
pipeline on U.S. refining and petroleum imports and also on international markets. Because the
availability of other pipelines is a key uncertainty, the analysis examined key metrics under seven
different scenarios each representing a different combination of available pipelines. Market dynamics
for each pipeline combination were explored for two different projections of U.S. oil demand.
In each of the resulting 14 scenarios requested, the objective of EnSys’ analysis was to assess the U.S.
petroleum refining, supply and price impacts of incremental Canadian oil sand crudes into the U.S. using
a detailed refinery model embodying global downstream petroleum product and crude oil market
activity. DOE sought an analysis that could evaluate oil flows into each of the PADD regions into which
U.S. petroleum infrastructure is divided and which would also project market destinations for Western
Canadian crudes.
The questions DOE requested EnSys to address included:
What is the outlook for the U.S. refining industry’s competitive position - as
measured by U.S. refinery throughputs, utilizations, investments, CO2 emissions,
product import dependency and oil import costs?
How does the level and composition of crude oil imports into the U.S. change with
and without the incremental Canadian oil sands crude transport capacity proposed
by the Keystone XL project?
What are the changes in crude oils that would supply PADD3 refineries with and
without incremental oil sand crudes into PADD3?
What are the changes in world regional demands for incremental Canadian oil sand
crudes with and without the incremental pipeline capacity to U.S. refineries?
What are the U.S. petroleum product supply and price impacts, and also U.S. oil
import bill impacts, with and without the incremental imports of Canadian oil sand
crudes to the U.S.?
EnSys Keystone XL Assessment - Final Report Dec 23rd 2010
11
What impacts, if any, would disallowing the Keystone XL pipeline have per se on
Canadian crude oil flows into the U.S.?
What would be the impacts of much lower U.S. product demand outlook on U.S.
refining, Canadian and other oil imports and the implications for Canadian crude oil
export capacity?
2.3 EnSys’ Approach to Study
To address these questions, EnSys employed its World Oil Refining Logistics & Demand (WORLD) model.
This provides integrated analysis and projection of the global petroleum industry, encompasses total
liquids, captures the effects of developments and changes and of interactions between regions, and
projects the economics and activities of refining, crude oils and products. WORLD works by combining
top down scenarios for projected oil price/supply and demand over the next twenty years with bottom
up detail on crudes oils, non-crudes, refining, transportation, product demand and quality. Used for the
Department of Energy Office of Strategic Petroleum Reserve since 1987, WORLD has been applied in
many analyses for organizations ranging from the EIA and EPA to the American Petroleum Institute,
World Bank, OPEC Secretariat, International Maritime Organisation, Bloomberg, major and specialty oil
and chemical companies.
Further information on EnSys and WORLD is provided in Appendix Section 1.
2.4 Content of Report
Section 3 below sets the context for this analysis by reviewing the recent history of and current
projections for Canadian oil production, including oil sands, and of the pipeline systems and associated
projects that exist or are planned to move crude oils out of Canada to the U.S. and elsewhere. Keystone
/ Keystone XL and other active projects are described.
Section 4 summarizes the basis and key premises for the analysis, outlines the methodology and
describes the specific scenarios developed and evaluated.
Section 5 presents key results and Section 6 presents conclusions.
Supporting appendices provide additional detail on pipeline projects, the EnSys WORLD model, its set up
and use for this analysis, including detailed premises and results; also information on the DOE ETP
model and its use in this study.
EnSys Keystone XL Assessment - Final Report Dec 23rd 2010
12
3 Background to Study
3.1 Recent WCSB Production and Export History
A factor in this study is the potential for the Keystone XL project to add to the excess of capacity to bring
WCSB crudes into the U.S. However, it was concern in Canada over shortages of export pipeline
capacity in the 2006 to 2008 period which, combined with anticipated rapid increases in WCSB crude
supply, led to a series of pipeline projects including Keystone.
By 2005, WCSB total crude oil supply had reached nearly 2.2 mbd. Oil sands streams to market
comprised over 50% and were rising rapidly. In 2007, the Canadian Association of Petroleum Producers
(CAPP) projected that WCSB crude supply could rise to between 4.6 and 5.3 mbd by 2020. (By way of
comparison, the CAPP 2010 supply projection – which is being used in this report - is for 3.8 mbd of total
WCSB supply by 2020 of which 3.2 mbd is oil sands streams.)
At the time, it was evident that the then existing export pipelines were operating at or close to capacity.
There had been instances of capacity restrictions and “allocations” with associated shut-ins of crude
production. The bottlenecks were also causing reductions in the prices obtained for Western Canadian
crudes, especially the heavy grades. Figure 3-1 illustrates how discounts for Canadian Lloydminster
heavy crude widened in 2005 through 2007 versus other marker heavy crude grades, to as much as
$20/bbl versus Mayan and $15/bbl versus Saudi Heavy, far exceeding historical levels in the $0-5/bbl
range11. As a consequence, Canadian producers, shippers and government agencies deriving revenue
from production were all being adversely affected economically. The chart also shows that differentials
returned to the $0-5/bbl range in 2009 but then widened again in mid 2010 driven by shutdowns in the
Enbridge Mainline pipeline system due to leaks. Thus the chart reinforces how sensitive WCSB heavy
crude discounts are to having sufficient export pipeline capacity in operation and the consequences in
lost revenue of periods when capacity is inadequate.
11
The Figure 3-1 chart is based on pricing data taken from the EIA online Petroleum Navigator, World Crude Oil Prices.

EnSys Keystone XL Assessment - Final Report Dec 23rd 2010
13
Figure 3-1
The undesirable situation in 2005 through 2008, combined with the prospect of swiftly growing WCSB
production, led to the perception that significant export pipeline expansions were required. As of early
2008, one analyst estimated 1.1 mbd of new capacity would be needed by 2011, 1.9 mbd by 2015 and
2.7 mbd by 202012. Despite the recession slowing their pace, a number of major projects have
materialized, including the Enbridge Alberta Clipper, TransCanada Keystone and the proposed Keystone
XL and also a first phase of expansion of the Kinder Morgan Transmountain line to Vancouver. In
addition, further projects have been or are being actively considered, as discussed in Section 3.2.3.
The recent history of pipeline capacity bottlenecks, shut-ins and losses of revenue sets a context for the
recent expansion of pipeline capacity and resulting cross-border surplus. Producers, shippers and
government agencies in Canada arguably have no desire to see any repetition of the past restrictions
and are thus predisposed to establishing export capacity that provides redundancy, flexibility, security
and also diversification of markets.
12
“Canadian Oil Imports”, Jeannie Stell, from Oil & Gas Investor, January 2008.
(30.00)
(25.00)
(20.00)
(15.00)
(10.00)
(5.00)
0.00
5.00
10.00
15.00
2000 2001 2002 2003 2004 2005 2006 2007 2008 2009 2010
$ /
bar
rel
Canadian Heavy Crude Price Differentials vs. MarkersSource - EIA World Crude Oil Prices - weekly and 13 week moving averages)
Canadian Lloydminister vs Maya
Canadian Lloydminister vs Arabian Heavy
EnSys Keystone XL Assessment - Final Report Dec 23rd 2010
14
3.2 The WCSB Crude Oil Export System and Projects
3.2.1 Current Flows
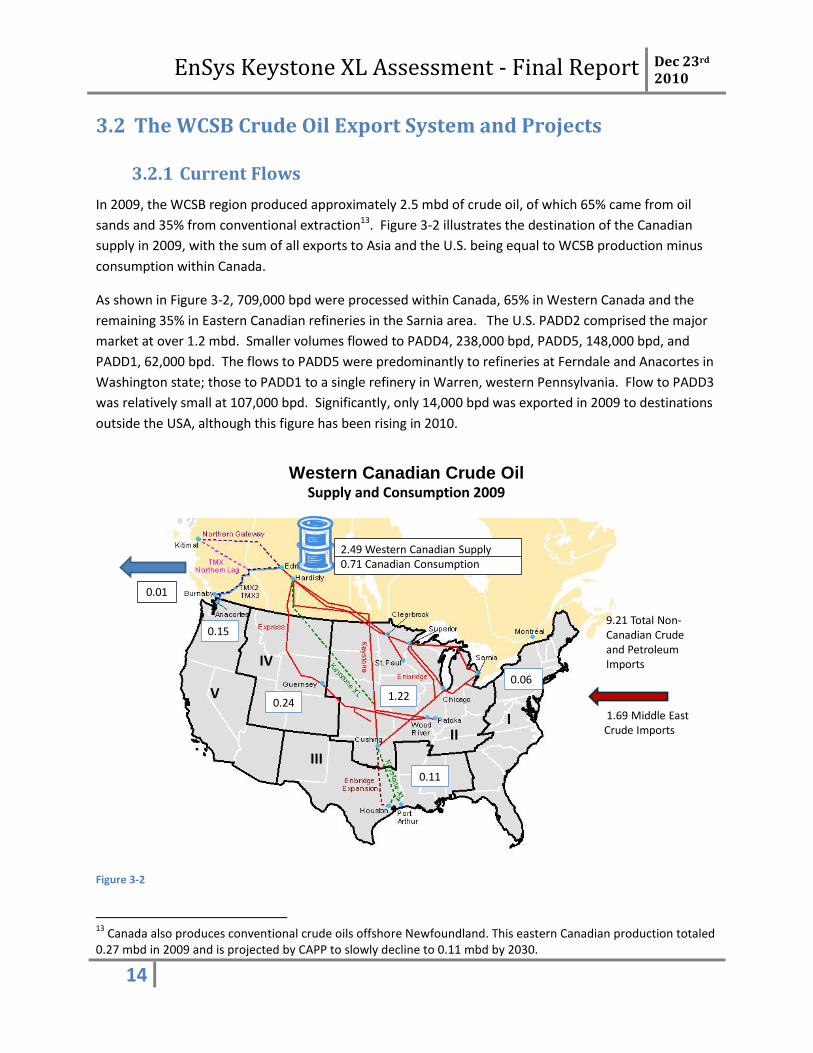
In 2009, the WCSB region produced approximately 2.5 mbd of crude oil, of which 65% came from oil
sands and 35% from conventional extraction13. Figure 3-2 illustrates the destination of the Canadian
supply in 2009, with the sum of all exports to Asia and the U.S. being equal to WCSB production minus
consumption within Canada.
As shown in Figure 3-2, 709,000 bpd were processed within Canada, 65% in Western Canada and the
remaining 35% in Eastern Canadian refineries in the Sarnia area. The U.S. PADD2 comprised the major
market at over 1.2 mbd. Smaller volumes flowed to PADD4, 238,000 bpd, PADD5, 148,000 bpd, and
PADD1, 62,000 bpd. The flows to PADD5 were predominantly to refineries at Ferndale and Anacortes in
Washington state; those to PADD1 to a single refinery in Warren, western Pennsylvania. Flow to PADD3
was relatively small at 107,000 bpd. Significantly, only 14,000 bpd was exported in 2009 to destinations
outside the USA, although this figure has been rising in 2010.
Figure 3-2
13
Canada also produces conventional crude oils offshore Newfoundland. This eastern Canadian production totaled 0.27 mbd in 2009 and is projected by CAPP to slowly decline to 0.11 mbd by 2030.
Supply and Consumption 2009
9.21 Total Non-Canadian Crude and Petroleum Imports
0.24
0.11
0.06
2.49 Western Canadian Supply0.71 Canadian Consumption
0.01
1.22
0.15
V
IV
III
III 1.69 Middle East
Crude Imports
Western Canadian Crude Oil
Source: EnSys Analysis for 2030. All units in millions of barrels per day.
EnSys Keystone XL Assessment - Final Report Dec 23rd 2010
15
3.2.2 Current Export Routes
For such a major producing region, the WCSB crude export system is highly unusual in that it is currently
overwhelmingly land-locked. Domestic and export flows are almost entirely via pipeline, and to the
USA and eastern Canada, as illustrated in Figure 3-2. Waterborne exports are minor and through only
one marine terminal, the Westridge dock, near Vancouver.
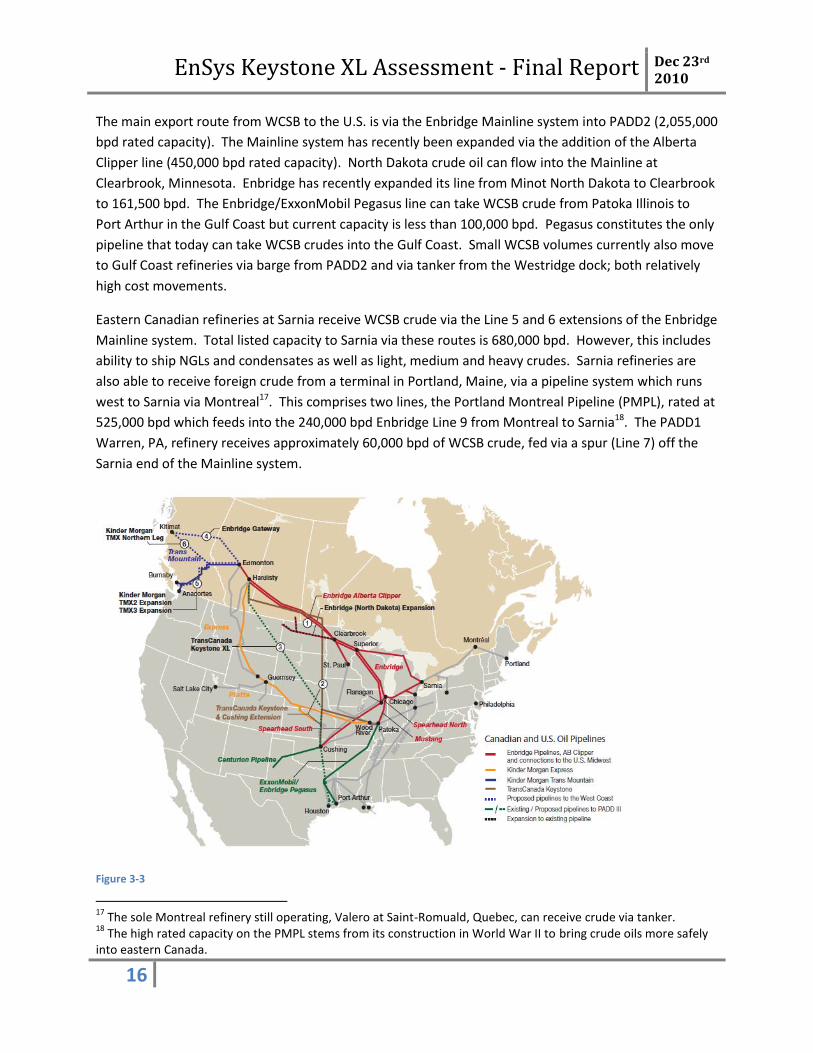
Figure 3-3, taken from the CAPP 2010 Outlook, depicts the extensive network of both existing and
planned major crude pipelines feeding U.S. and Canadian refineries. The solid lines indicate existing
pipelines discussed in this section while the dotted lines indicate proposed pipelines described in the
next section. Essentially all these pipelines can carry heavy crude oil14.
WCSB crudes feed the western Canadian refineries. These are mainly in the Edmonton area, local to the
main sources of WCSB supply in Alberta and neighboring Saskatchewan. The Transmountain pipeline
takes WCSB crudes west from Edmonton to the 55,000 bpd Chevron refinery at Burnaby and a dock at
Westridge, both near Vancouver. The Puget Sound Pipeline is a spur that connects the Transmountain
pipeline to four refineries at Ferndale, Anacortes, and Cherry Point in Washington state. Crude oil can
also be shipped via the Westridge dock by barge or tanker to U.S. refineries in Washington State but,
historically, has mainly been moved to California or even the Gulf Coast and also to Asia. The
Transmountain line also ships refined products from Edmonton refineries to points west in British
Columbia, including the Vancouver area.
Deliveries of crude to the Burnaby refinery have remained stable at around 45,000 bpd while those for
product have slowly declined in recent years, dropping below 50,000 bpd in 2010. Crude deliveries to
the Washington state refineries have slowly increased over time and currently run at just under 130,000
bpd. Crude oil deliveries over the Westridge dock have risen from 25,000 bpd in 2006 to 80,000 bpd in
201015. Of these, volumes moving to Asia have reportedly risen to 20,000 bpd16. The Transmountain
line was reported as operating above its 300,000 bpd rated capacity and over-committed at the time of
this report, indicating strong market demand even with excess pipeline capacity available across the
border to the U.S.
WCSB crudes move to PADD4 in the U.S. via three lines with total capacity of around 485,000 bpd. Of
these, the Express is the largest and has an onward extension, the Platte, into PADD2.
14
The stated capacity of a pipeline is generally rated on an assumed “design basis” proportion of light versus heavy crude moving through the line, e.g. 100,000 bpd with 20% heavy, 80% light crude. Essentially all pipelines can take (additional) heavy crude but at a debit to throughput because of the generally higher viscosity and therefore increased pumping horsepower requirement for the heavy crude. Major new lines out of WCSB, including Alberta Clipper and Keystone (Mainline and XL) are designed for essentially total transport of heavy grades. In the modeling study, account was taken of the higher effective capacity consumption of heavy crudes moving especially through older pipelines that were originally designed for a lighter crude mix. 15
“Firm Service Capacity on the Trans Mountain Pipeline System”, Purvin & Gertz, November 2010. 16
“Oil Patch Sets Course for China”, The Globe and Mail, Toronto, Ontario, July 24, 2010.
EnSys Keystone XL Assessment - Final Report Dec 23rd 2010
16
The main export route from WCSB to the U.S. is via the Enbridge Mainline system into PADD2 (2,055,000
bpd rated capacity). The Mainline system has recently been expanded via the addition of the Alberta
Clipper line (450,000 bpd rated capacity). North Dakota crude oil can flow into the Mainline at
Clearbrook, Minnesota. Enbridge has recently expanded its line from Minot North Dakota to Clearbrook
to 161,500 bpd. The Enbridge/ExxonMobil Pegasus line can take WCSB crude from Patoka Illinois to
Port Arthur in the Gulf Coast but current capacity is less than 100,000 bpd. Pegasus constitutes the only
pipeline that today can take WCSB crudes into the Gulf Coast. Small WCSB volumes currently also move
to Gulf Coast refineries via barge from PADD2 and via tanker from the Westridge dock; both relatively
high cost movements.
Eastern Canadian refineries at Sarnia receive WCSB crude via the Line 5 and 6 extensions of the Enbridge
Mainline system. Total listed capacity to Sarnia via these routes is 680,000 bpd. However, this includes
ability to ship NGLs and condensates as well as light, medium and heavy crudes. Sarnia refineries are
also able to receive foreign crude from a terminal in Portland, Maine, via a pipeline system which runs
west to Sarnia via Montreal17. This comprises two lines, the Portland Montreal Pipeline (PMPL), rated at
525,000 bpd which feeds into the 240,000 bpd Enbridge Line 9 from Montreal to Sarnia18. The PADD1
Warren, PA, refinery receives approximately 60,000 bpd of WCSB crude, fed via a spur (Line 7) off the
Sarnia end of the Mainline system.
Figure 3-3
17
The sole Montreal refinery still operating, Valero at Saint-Romuald, Quebec, can receive crude via tanker. 18
The high rated capacity on the PMPL stems from its construction in World War II to bring crude oils more safely into eastern Canada.
EnSys Keystone XL Assessment - Final Report Dec 23rd 2010
17
3.2.3 Current and Proposed Export Projects
WCSB oil sands growth and the recent history of shut-ins and price discounts have led to a series of
projects to expand export capacity out of western Canada and to access additional markets. These
projects are summarized below, and all are listed with data on size, proposed start date, and project
status in Table 3-3 in Section 3.2.3.5. The sections below cover both future projects (including Keystone
XL) and projects that have come on stream during the course of this study by EnSys or which are under
construction at the time of this report. Specifically included under current projects are the Alberta
Clipper pipeline and Keystone Mainline, both of which have recently started up, and Keystone Cushing
extension which is under construction and due for start-up first quarter 2011.
3.2.3.1 West to British Columbia Coast and Asia
There is considerable interest in Canada in establishing volume water-borne exports, with their
attendant flexibility to diversify markets and to access growth areas, notably in Asia. Nautical distances
from the British Columbia coast to Asian ports are relatively short and a recent study has estimated that
refineries in four north Asian countries, (China, Japan, South Korea, Taiwan), could today process up to
1.75 mbd of Western Canadian (mainly heavy) crudes19. These drivers have led to a series of projects to
expand capacity to move WCSB crudes west to marine terminals in British Columbia.
3.2.3.1.1 TMX 2, 3 and Northern Leg
Kinder Morgan expanded the Transmountain line to 300,000 bpd in 2008 via its TMX1 project. The
company has plans to further expand to first 380,000 (TMX2) and then 700,000 bpd (TMX3). No
decision to go ahead has been taken on either of these projects. This will depend upon level of
commercial interest. But Kinder Morgan indicates potential timing as being in the 2015 to 2020 time
frame. Plans also include upgrading of the Westridge dock and associated work with the Port of
Vancouver so that the facility can load larger tankers and thus take advantage of lower freight rates20.
In addition, in late November 2010, Kinder Morgan applied to the Canadian National Energy Board to
establish longer term “firm service” contracts for WCSB crude oil shipments across the Westridge
Dock21. This reflects the current growing interest in exporting WCSB crudes from Westridge and,
arguably, could comprise a first step toward establishing a commercial basis for later expansion of the
Transmountain line via the TMX 2 and 3 projects. According to a press announcement in late October
2010, the Transmountain pipeline is running at 316,000 bpd, i.e. above nameplate capacity, and is 32%
19
Market Prospects and Benefits Analysis for the Northern Gateway Project, Muse Stancil, January 2010. 20
The Westridge facility can today take AFRAMAX tankers, capacity approx 650,000 bbls. Kinder Morgan’s plan is to enable 1,000,000 bbl SUEZMAX tankers to use the facility. Enabling safe passage of larger tankers under the Lion’s Gate Bridge is one key issue. 21
https://www.neb-one.gc.ca/ll-eng/livelink.exe?func=ll&objId=654331&objAction=browse.
EnSys Keystone XL Assessment - Final Report Dec 23rd 2010
18
over-subscribed for the month of November as of the time of this report22. This tends to reinforce that
there is growing demand for the line’s capacity.
The TMX 2 and 3 expansions would use existing facilities and right of way23. Extensive work would be
required with various organizations, including the NEB, Port Metro Vancouver and First Nation groups
before the projects could go ahead. Permits would be required for expansion. In addition, agreements
with landowners along the route may have to be renegotiated. These requirements could possibly
delay or stop the projects but the view was taken in this study that TMX 2 and 3 may be the most likely
to go ahead of any of the West Coast projects.
Kinder Morgan has further proposed a Northern Leg expansion of the Transmountain line. This would
use the existing Transmountain route part way from Edmonton west and then require construction of a
new spur line running northwest to the port of Kitimat mid-way up the British Columbia coast.
Proposed capacity on the Northern Leg line is 400,000 bpd. It would increase the total Transmountain
system capacity to 1.1 mbd for (i.e. existing Transmountain pipeline + TMX 2 + TMX 3 + Northern Leg).
The Northern Leg expansion is considered by Kinder Morgan to be a longer term project. It also faces
strong opposition from First Nations and environmental groups. An advantage of building a pipeline to
Kitimat is that the port can take VLCC crude tankers, with attendant lower freight rates. The port is also
modestly nearer northeast Asia than is Vancouver.
3.2.3.1.2 Northern Gateway
Enbridge has proposed a 525,000 bpd (initial) capacity line named the Northern Gateway to run from
Edmonton to Kitimat. This would be an entirely new facility, potentially expandable to 800,000 bpd24.
Enbridge’s May 2010 filing to the Canadian National Energy Board (NEB) stated 2016 as the target start-
up year. However, the project is encountering strong resistance from First Nations and environmental
groups, which renders its timing uncertain.
3.2.3.1.3 CN Rail / Altex
CN Rail currently imports condensate, for blending with oil sands bitumen to make DilBit, through
Kitimat. The company has partnered with the Altex group to offer a PipelineOnRail service that would
ship DilBit or other WCSB streams via rail from the Edmonton/Hardisty area to terminals that Altex
would operate and, if required, ship diluent back to Western Canada. PipelineOnRail has the benefit
that it avoids the large fixed investments associated with major pipelines. CN Rail indicates potential
capacity to move “as many as 200,000 bpd or more”25. However, the economics of the system do
appear to hinge partly on claimed diluent valuation benefits for shippers.
22
http://www.reuters.com/article/idAFN2834277720101028?rpc=44. 23
If both TMX 2 and 3 were completed, the resulting system would comprise two lines running parallel. 24
The Northern Gateway proposal also potentially includes a 193,000 bpd diluent import line. 25
http://www.cn.ca/en/shipping-north-america-alberta-pipeline-on-rail.htm.
EnSys Keystone XL Assessment - Final Report Dec 23rd 2010
19
This study did not allow for the expansion of the PipelineOnRail capacity in any scenario because tariffs
for rail are generally not considered attractive relative to pipelines. However, during a period of
constrained pipeline capacity, the PipelineOnRail could compete as an alternative. The potential role of
rail among WCSB export options would require further analysis.
3.2.3.1.4 The China Factor
Chinese oil companies have to date invested several billion dollars buying partial stakes in existing and
planned WCSB oil sands production facilities. Crude oil exports to China via Transmountain are
reported to have been increasing and to have reached 20,000 bpd in 201026. This may represent a small
proportion of potential future equity crude accruing to Petrochina, CNOOC and other Chinese
companies. If these companies follow patterns seen elsewhere, they will aim to repatriate their crude
oil for processing in China, rather than allow it to be sold elsewhere. This could add to pressure for
pipeline expansion to the British Columbia coast.
3.2.3.2 South to PADD4 & Bakken Exports
Currently, no major projects have been identified that would expand pipelines from WCSB into PADD4.
The main activities in the region relate to expanding pipeline and rail capacity to ship out growing
volumes of Bakken crude from North Dakota and secondarily Montana and Saskatchewan. Growing
North Dakota Bakken production surpassed the 200,000 bpd level in mid 2010, and comprised the major
reason total crude production in North Dakota passed the 300,000 bpd mark in June 201027 and
exceeded 340,000 bpd in September 201028. (Eastern Montana crude production stood at 65,000 bpd.)
According to industry reports29, projections by the North Dakota Pipeline Authority are that North
Dakota Bakken production alone could reach 400,000 – 500,000 bpd, implying total in the state of
possibly 500,000 - 600,000 bpd. Some estimates put the potential for total Bakken production (North
and South Dakota, Montana, Saskatchewan30) at 800,000 – 1 million bpd by 201531,32.
26
“Oil Patch Sets Course for China”, The Globe and Mail, Toronto, Ontario, July 24, 2010. 27
EIA Petroleum Navigator, http://www.eia.gov/dnav/pet/pet_crd_crpdn_adc_mbblpd_m.htm. 28
https://www.dmr.nd.gov/pipeline/production.asp. 29
Platt’s Plans First Price Assessments of Bakken Shale Fields Crude, April 6, 2010. 30
As stated elsewhere in the report, the study used the 2010 CAPP Growth Outlook for Canadian crudes. This incorporated the projection that Bakken/Cardium formation crude oils in Saskatchewan would contribute over time to WCSB production of conventional light crude oil. According to one source, total Saskatchewan Bakken/Cardium production could peak at 100,000 bpd. http://www.packersplus.com/pdfs/Canadian%20Business%20Making%20Bakken.pdf 31
“Rockin’ the Bakken” While Reducing the Oil’s Logistical Limitations, The Barrel, Nov 22, 2010. 32
In addition, there is growing interest in the potential of the Tyler formation which lies on top of the Bakken and extends into South Dakota. Current estimates are that the Tyler is one third to one half the size of the Bakken and so could further expand future regional oil and gas output. Source: Officials Find North Dakota’s Tyler Oil Formation Similar to Bakken, Lisa Anne Call, Forum Communications Co. Nov 18, 2010.
EnSys Keystone XL Assessment - Final Report Dec 23rd 2010
20
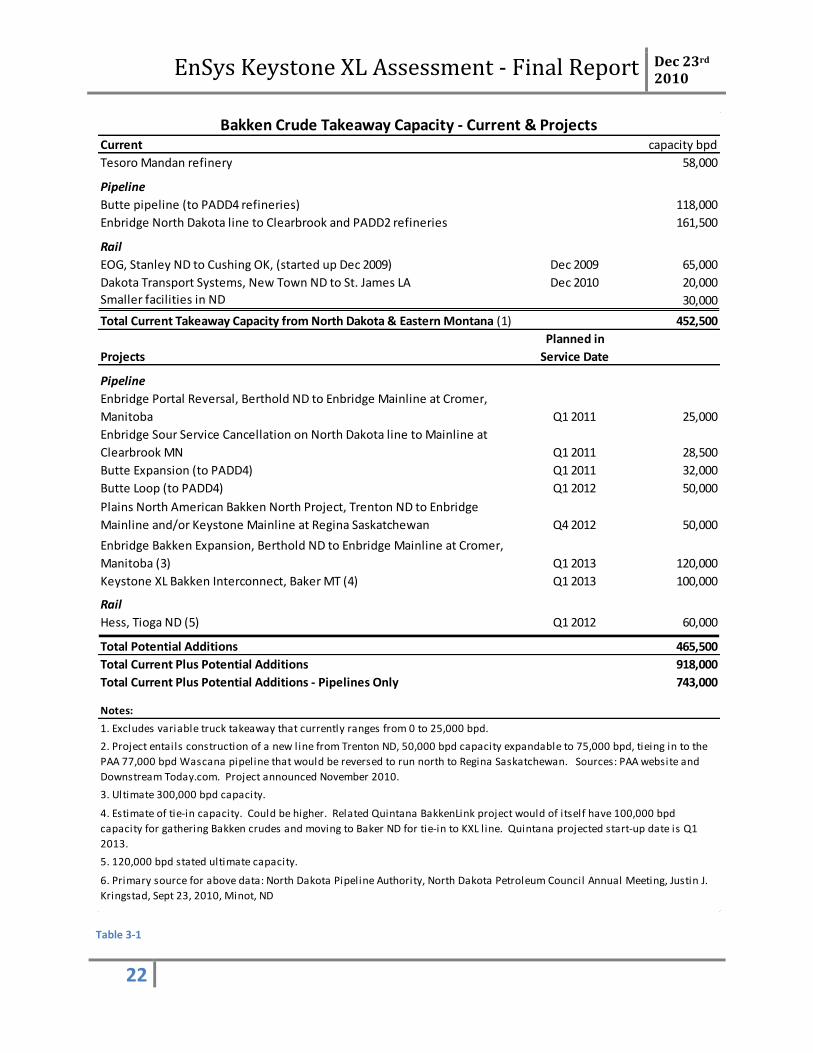
Table 3-1 summarizes existing capacity and potential projects to take crude away from the Bakken
region. Existing pipeline plus rail capacity totals approximately 450,000 bpd. This includes some very
recent start ups and capacity expansions, including the EOG and Dakota Transport rail projects and
expansions to the Enbridge North Dakota and Butte pipelines. Because of recent limited takeaway
capacity, up to 25,000 bpd of Bakken crude has been moving via truck. Future pipeline and rail
expansions are expected to eliminate truck movements, however.
Several companies, notably Enbridge, Plains All American, Butte Pipeline and TransCanada, have
proposed pipeline solutions for bringing additional Bakken crude to market. In addition, Hess has a
project to increase rail “takeaway” capacity. Again these are summarized in Table 3-133. If all listed
projects were to be implemented, combined Bakken pipeline and rail takeaway capacity would double
to over 900,000 bpd. Pipeline capacity alone would total approximately 740,000 bpd.
Enbridge has recently expanded to 161,500 bpd its existing line that runs east from Berthold, North
Dakota, to the Mainline at Clearbrook, Minnesota. Enbridge may also cease routing sour crudes through
the line, increasing effective capacity by 28,500 bpd, and is proposing the reversal of its Portal line so
that it runs north to join the Mainline system at Cromer, Manitoba. In addition, an expansion of the
Butte line south and west to PADD4 refineries has been put forward. These three projects would add a
total of 85,500 bpd of capacity by early 2011. A further Butte expansion, and the Hess Tioga rail project,
would add 110,000 bpd more capacity by early 2012.
In early November, Plains All American, L.P. (PAA) announced a Bakken North project with two pipeline
legs. The first leg would take 55,000 bpd of Bakken crudes, expandable to 75,000 bpd, from Trenton,
North Dakota, to the Canadian border where it would feed in to the second leg, the Wascana line that
would be reversed to run north to Regina, Saskatchewan. There the system could connect into either
Keystone or Enbridge lines to take the crudes to PADD2. Subject to permits, PAA anticipates placing the
Bakken North project into service in late 2012.
The Enbridge Bakken expansion would add a parallel line north along its Portal route to join the Mainline
at Cromer in Manitoba (and thence re-cross the border back into the US). Initial capacity for the line to
Cromer is indicated at 120,000 bpd with start-up first quarter 2013.
In addition, TransCanada is currently assessing market interest in tying Bakken crude into the planned
Keystone XL line that would cut through Montana and South Dakota. The tie-in point would be at Baker,
Montana, directly on the proposed KXL line. Baker is already a hub for Bakken crudes. Third party
gathering and pipeline facilities34 would deliver to three tanks at Baker. Two tanks would also be added
at Cushing. The additional tankage would enable segregated accumulation and delivery of Bakken
33
A number of the projects listed in Table 3-1 have been presented under the name “Bakken 300”. See, inter alia, Rocky Mountain Crude Oil Market Dynamics, Tad True, Belle Fourche & Bridger Pipelines, Wyoming Pipeline Authority, October 26, 2010. 34
The Bakken Marketlink would lift crudes from existing facilities for Bakken crude at Baker, which could be augmented by the development of a third party (Quintana) pipeline system that will gather Bakken crudes in western North Dakota.

EnSys Keystone XL Assessment - Final Report Dec 23rd 2010
21
crude, which is a light, sweet crude with a higher value. The Bakken open season closed November 19th
2010, and a final decision from TransCanada on whether to go ahead with integration of Bakken crude
into the KXL project is not expected until early 2011. TransCanada is targeting a first quarter 2013 start-
up. Especially if the related Quintana project to gather Bakken crude into the KXL at Baker goes ahead,
volumes of Bakken crudes placed into KXL could exceed 100,000 bpd.
Announcements on Bakken production and takeaway projects have been evolving rapidly during the
period in which this study was undertaken. In addition, the status of the various projects varies from
firm to indeterminate. Consequently, some – but not all – of the projects were accounted for in the
modeling analysis. Specifically, capacity approximately equivalent to the Enbridge and Butte projects
was allowed for whereas the potential Bakken MarketLink into Keystone XL was not incorporated. Thus,
in the study cases conducted, Bakken crudes flowed through other lines but not through KXL.
Overall, sufficient capacity was allowed to move projected Bakken production volumes to market.
However, even though EnSys adjusted upward EIA’s AEO projections for Rocky Mountain crude oil
production (which includes the Dakotas and Montana) to better allow for Bakken developments, the
resulting projections used were still conservative considering information now to hand. In addition,
more account could arguably be taken of the rail projects to move Bakken crudes. The assumption
implicit in the study was that, over the longer term, volumes of Bakken crude shipped long distances
would move predominantly via pipelines as these are generally lower cost than rail.
In summary, further analysis could be warranted to evaluate latest available assumptions and
projections relating to the Bakken. A decision by TransCanada to go ahead with the Bakken MarketLink
could raise total crude volumes moving through the KXL pipeline, alter the mix between WCSB and
Bakken crudes with their different characteristics, and/or alter the market destinations for Bakken and
other crude oils.
EnSys Keystone XL Assessment - Final Report Dec 23rd 2010
22
Table 3-1
Current capacity bpd
Tesoro Mandan refinery 58,000
Pipeline
Butte pipeline (to PADD4 refineries) 118,000
Enbridge North Dakota line to Clearbrook and PADD2 refineries 161,500
Rail
EOG, Stanley ND to Cushing OK, (started up Dec 2009) Dec 2009 65,000
Dakota Transport Systems, New Town ND to St. James LA Dec 2010 20,000
Smaller facilities in ND 30,000
Total Current Takeaway Capacity from North Dakota & Eastern Montana (1) 452,500
Projects
Planned in
Service Date
Pipeline
Enbridge Portal Reversal, Berthold ND to Enbridge Mainline at Cromer,
Manitoba Q1 2011 25,000
Enbridge Sour Service Cancellation on North Dakota line to Mainline at
Clearbrook MN Q1 2011 28,500
Butte Expansion (to PADD4) Q1 2011 32,000
Butte Loop (to PADD4) Q1 2012 50,000
Plains North American Bakken North Project, Trenton ND to Enbridge
Mainline and/or Keystone Mainline at Regina Saskatchewan Q4 2012 50,000
Enbridge Bakken Expansion, Berthold ND to Enbridge Mainline at Cromer,
Manitoba (3) Q1 2013 120,000
Keystone XL Bakken Interconnect, Baker MT (4) Q1 2013 100,000
Rail
Hess, Tioga ND (5) Q1 2012 60,000
Total Potential Additions 465,500
Total Current Plus Potential Additions 918,000
Total Current Plus Potential Additions - Pipelines Only 743,000
Notes:
6. Primary source for above data: North Dakota Pipeline Authority, North Dakota Petroleum Council Annual Meeting, Justin J.
Kringstad, Sept 23, 2010, Minot, ND
1. Excludes variable truck takeaway that currently ranges from 0 to 25,000 bpd.
4. Estimate of tie-in capacity. Could be higher. Related Quintana BakkenLink project would of itself have 100,000 bpd
capacity for gathering Bakken crudes and moving to Baker ND for tie-in to KXL l ine. Quintana projected start-up date is Q1
2013.
3. Ultimate 300,000 bpd capacity.
5. 120,000 bpd stated ultimate capacity.
Bakken Crude Takeaway Capacity - Current & Projects
2. Project entails construction of a new line from Trenton ND, 50,000 bpd capacity expandable to 75,000 bpd, tieing in to the
PAA 77,000 bpd Wascana pipeline that would be reversed to run north to Regina Saskatchewan. Sources: PAA website and
Downstream Today.com. Project announced November 2010.
EnSys Keystone XL Assessment - Final Report Dec 23rd 2010
23
3.2.3.3 East and South to PADD2, PADD3
The development of additional pipeline capacity from Western Canada to PADD2 and then on to PADD3
comprises the main area of current project activity.
3.2.3.3.1 Alberta Clipper
The Enbridge Alberta Clipper line came on stream in October 2010. It is designed to carry heavy WCSB
crude oils from Hardisty, Alberta, to Clearbrook, Minnesota, and on to Superior, Wisconsin. Line
capacity is 450,000 bpd, expandable to 800,000 bpd through the addition of pumping facilities35.
Alberta Clipper is being built in conjunction with the Southern Lights pipeline. This runs parallel to
Alberta Clipper but in the opposite direction, taking diluent streams from Manhattan, Illinois, near
Chicago, via northern PADD2 back to Hardisty and Edmonton. Southern Lights initial capacity is 180,000
bpd, expandable to 330,000 bpd. Its purpose is to gather, and to some degree recycle, diluent streams
to be used at Hardisty and Edmonton for blending WCSB bitumen into DilBit.
3.2.3.3.2 Keystone Mainline & Keystone XL
The Keystone XL project that is the primary focus of this report constitutes a major segment of two
phased projects being undertaken by TransCanada under the Keystone/Keystone XL name. The projects
are designed to bring WCSB crudes, including oil sands, from Hardisty, Alberta, to PADD2 and then, via
Cushing to the U.S. Gulf Coast; also, potentially, to transport Bakken and Oklahoma/West Texas crudes
to Gulf Coast markets. Table 3-2 summarizes the phases of Keystone based on information from and
discussion with TransCanada as of mid November 2010. Figure 3-4 illustrates the detail of the pipeline
segments and routings.
Keystone Mainline36, or Phase I, (denoted by the number 2 in Figure 3-3, and the blue line in Figure 3-4),
comprises a pipeline with 30” then 34” then 30” sections that runs east from Hardisty, Alberta, crosses
the border at Haskett, Manitoba, then runs south to Steele City, Nebraska, and from Steele City east to
Wood River and Patoka, Illinois. At Wood River, the line links to the ConocoPhillips/Cenovus WRB joint
venture refinery and at the Patoka terminal to the Plains All American pipeline. This in turn enables
onward delivery to additional refineries in the region37. The WRB Wood River refinery is being revamped
to raise its intake of heavy Canadian crudes from the 164,000 bpd level that obtained in 200938 to
35
Enbridge to Assist Enbridge Energy Partners with U.S. Alberta Clipper Funding, July 20, 2009. 36
TransCanada refers to the “Base” system as “Mainline”. 37
Patoka is also the terminus for the 1.1 mbd Capline crude oil pipeline which originates in St. James, Louisiana and is a hub for other crude oil pipelines. Capline moves imported crudes from the Gulf Coast to the Midwest (PADD2). It includes two docks capable of handling 600,000 bbl tankers and has access to the Louisiana Offshore Oil Port (LOOP) for crude oil supplies. 38
Source: EIA 2009 crude imports data.
EnSys Keystone XL Assessment - Final Report Dec 23rd 2010
24
approximately 240,000 bpd39 from 2011 onward. Keystone Mainline Phase I initial pipeline capacity
from Hardisty to Wood River/Patoka is 435,000 bpd. Phase I started commercial operations in July
2010.
The Keystone Cushing Extension, or Phase II, both raises the capacity of each of the Hardisty to Steele
City and the Steele City to Patoka pipeline legs to 591,000 bpd and adds an extension from Steele City
south to Cushing, Oklahoma (the orange line in Figure 3-4). The leg to Cushing also has a capacity of
591,000 bpd. However, under Phase II, the system will be run in batch mode such that crude shipping
from Steele City will, at any one time, be either east to Wood River/Patoka or south to Cushing. Thus the
upper section of the line down to Steele City will operate continuously while the eastern and southern
legs below Steele City will operate on an either/or basis, depending on where a given batch is routed.
Either or both of these two legs will thus operate, on a monthly average basis, below their rated
capacity. Phase II is completing construction with commercial operation expected in the first quarter of
2011.
The Keystone XL expansion comprises two distinct segments. The segments consist of the new Northern
KXL line which would cut diagonally cross-border from Hardisty to Steele City via Montana and South
Dakota (the green line in Figure 3-4) and a further extension south (the purple line in Figure 3-4) in the
form of a new pipeline from Cushing to the Gulf Coast at Nederland/Port Arthur. Both segments have
stated commercial start dates of first quarter 2013, subject to permits. However, the Cushing to Gulf
Coast extension is being described as Phase III (the “Gulf Coast segment”) and the Northern KXL line as
Phase IV (the “Steele City segment”) since TransCanada anticipates the former may go ahead first.
The scope of coverage of the Presidential Permits TransCanada is seeking is limited to the facilities at the
border up to the first shut-off valve, although the environmental analysis and mitigation measures apply
to the whole pipeline in the U.S. Thus the Presidential Permit does not cover the Cushing to Gulf Coast
segment. It is included in the project description because of National Environmental Policy Act (NEPA)
requirements, not because of the Presidential Permit.
Both pipelines would have a diameter of 36”. Stated initial capacity for both the Northern KXL line
(Steele City Segment) and the Cushing to Gulf Coast segment is 700,000 bpd. The capacity of the Steele
City to Cushing segment would be expanded to deliver 700,000 bpd of capacity from Hardisty to the U.S.
Gulf Coast. The resulting aggregate capacity of the Keystone Mainline and XL lines would be 1.29 mbd.
Unlike under Phase II, the expanded system would run the Steele City to Wood River/Patoka and the
Steele City to Cushing/Gulf Coast segments simultaneously in order to absorb the full inflow from
Hardisty. Following the completion of Phase IV, the Phase II Cushing leg would no longer connect to the
Phase I (Mainline) system. In other words, and referring to Figure 3-4, the blue line from Hardisty to
Wood River/Patoka and the green-orange-purple line from Hardisty to Cushing and the Gulf Coast would
operate separately (even though they both pass through Steele City, Nebraska).
39
http://www.cenovus.com/operations/refineries/wood-river-and-borger.html
EnSys Keystone XL Assessment - Final Report Dec 23rd 2010
25
TransCanada states that it has secured 910,000 bpd of commercial contracts for transit on the Keystone
Mainline and XL pipelines. Of the 910,000 bpd, 375,000 bpd are committed to Wood River/Patoka,
Illinois, 155,000 bpd to (for take-out at) Cushing and 380,000 bpd to the Gulf Coast. Commitments to
Wood River/Patoka and to Cushing are covered by Keystone capacity either started up or under
construction. Commitments to the Gulf Coast are subject to Keystone XL permitting and construction.
The total 910,000 bpd commitment equates to 70% of the 1.29 mbd total Keystone capacity that would
be in operation were KXL built. Committed throughput is 375,000 bpd out of 591,000 bpd capacity
(63.5%) on the Keystone Mainline system from Hardisty through to Wood River/Patoka. On the KXL
segments from Hardisty to Steele City, Nebraska, and on to Cushing, the committed throughput would
be 155,000 bpd for take-out volume at Cushing + 380,000 bpd on to the Gulf Coast = 535,000 bpd out of
700,000 bpd capacity (76.4%). On the segment from Cushing to the Gulf Coast, the committed
throughput would be 380,000 bpd out of 700,000 bpd capacity (54.3%)40.
In designing the Keystone pipeline system, TransCanada has allowed for future increases in pumping
capacity such that eventual capacity across the U.S. border is indicated at 1.5 mbd. Expansion is
expected to be on the green-orange-purple XL line in Figure 3-4, with capacity to the Gulf Coast
potentially increasing from 700,000 to 900,000 bpd.
In addition to the two KXL Phases described above, TransCanada has been running two “open seasons”
labeled Cushing MarketLink and Bakken MarketLink. The purpose of the open seasons is to assess
shipper interest in signing up for contracted shipments on either of these projects, and both open
seasons were offered for operation starting first quarter 2013. The open seasons closed on November
19, 2010. Their results – and consequently whether TransCanada will decide to go ahead with either or
both - will not be known until early 2011.
Cushing Marketlink is a proposed project that would serve market demand for more pipeline exit
capacity from Cushing; this by enabling West Texas/Mid-Continent crudes to feed into KXL at Cushing
and so be routed south to the Gulf Coast. It would use facilities that form part of the Phase III Gulf Coast
Segment. Bakken Marketlink would serve market demand for more pipeline exit capacity from the
Bakken region in Montana and North Dakota. It would constitute a tie-in to the Phase IV northern KXL
line at Baker, Montana, as discussed in Section 3.2.3.2. TransCanada has stated that neither the Bakken
Marketlink nor the Cushing Marketlink are part of the KXL pipeline project, though both are dependent
upon it.
40
Based on information from TransCanada, 100% of the initial capacity of 435,000 bpd on the Keystone Mainline system was offered commercially. The resulting 375,000 bpd of contracts equated to an 86% contracted capacity percentage. The commitment for 155,000 bpd of take-out volume at Cushing provided the incentive to raise the capacity on the Mainline system (to 591,000 bpd) as well as to proceed with the line segment from Steele City to Cushing. On Keystone XL, the intended physical capacity has always been 700,000 bpd. However, in the open season, only 500,000 of the 700,000 bpd total was offered commercially – and led to 380,000 bpd of contracts. 200,000 bpd of capacity was held back to leave room for future operational flexibility and as a reserve to cover presumed growth.
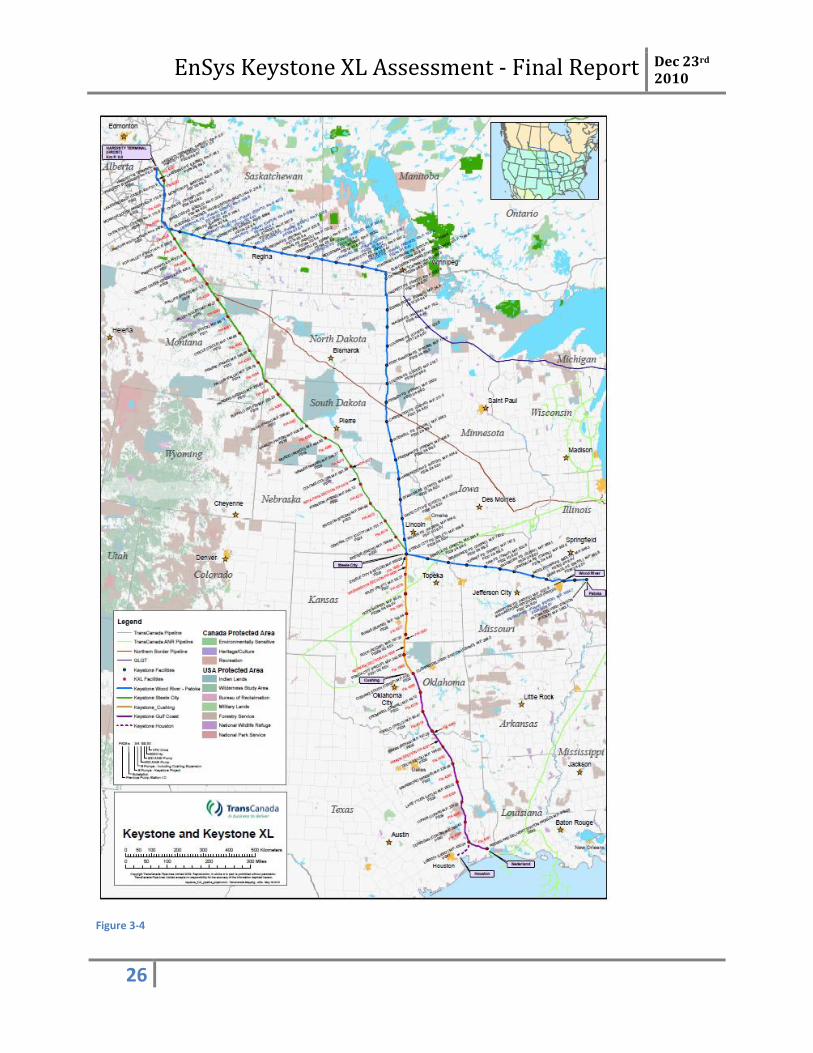
EnSys Keystone XL Assessment - Final Report Dec 23rd 2010
26
Figure 3-4
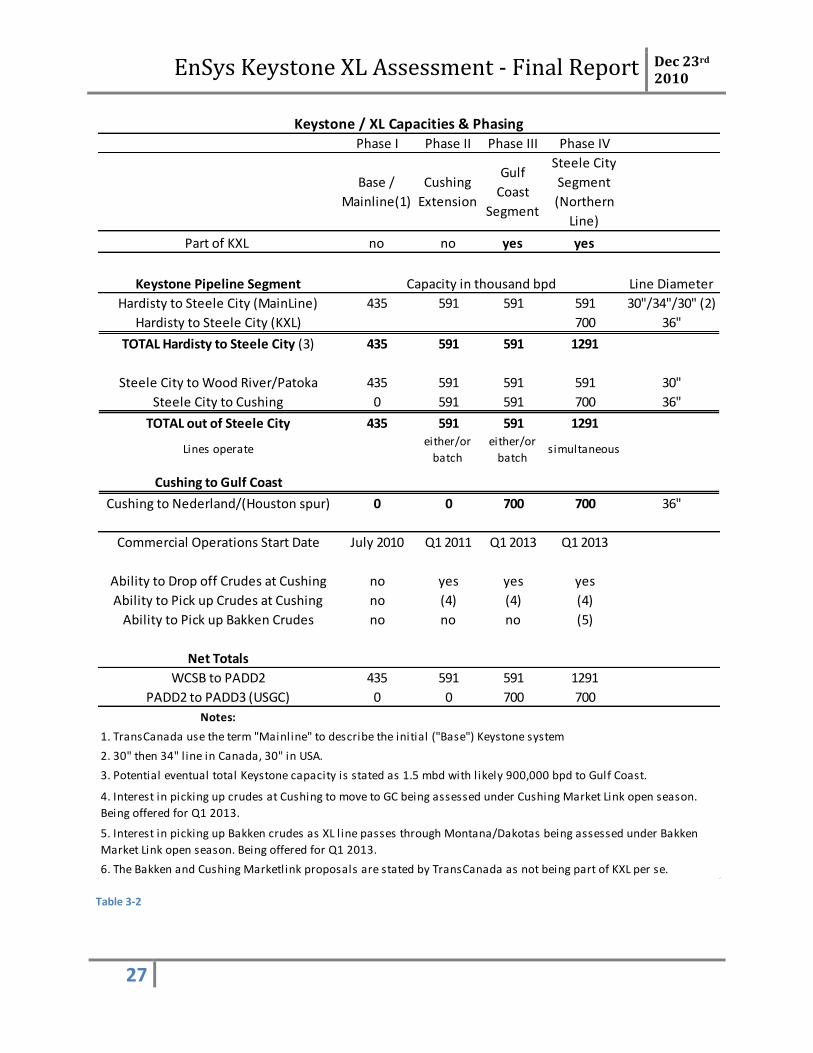
EnSys Keystone XL Assessment - Final Report Dec 23rd 2010
27
Table 3-2
Phase I Phase II Phase III Phase IV
Base /
Mainline(1)
Cushing
Extension
Gulf
Coast
Segment
Steele City
Segment
(Northern
Line)
Part of KXL no no yes yes
Keystone Pipeline Segment
Hardisty to Steele City (MainLine) 435 591 591 591 30"/34"/30" (2)
Hardisty to Steele City (KXL) 700 36"
TOTAL Hardisty to Steele City (3) 435 591 591 1291
Steele City to Wood River/Patoka 435 591 591 591 30"
Steele City to Cushing 0 591 591 700 36"
TOTAL out of Steele City 435 591 591 1291
Lines operateeither/or
batch
either/or
batchsimultaneous
Cushing to Gulf Coast
Cushing to Nederland/(Houston spur) 0 0 700 700 36"
Commercial Operations Start Date July 2010 Q1 2011 Q1 2013 Q1 2013
Ability to Drop off Crudes at Cushing no yes yes yes
Ability to Pick up Crudes at Cushing no (4) (4) (4)
Ability to Pick up Bakken Crudes no no no (5)
Net Totals
WCSB to PADD2 435 591 591 1291
PADD2 to PADD3 (USGC) 0 0 700 700
Notes:
1. TransCanada use the term "Mainline" to describe the initial ("Base") Keystone system
2. 30" then 34" l ine in Canada, 30" in USA.
3. Potential eventual total Keystone capacity is stated as 1.5 mbd with l ikely 900,000 bpd to Gulf Coast.
6. The Bakken and Cushing Marketlink proposals are stated by TransCanada as not being part of KXL per se.
Keystone / XL Capacities & Phasing
Line DiameterCapacity in thousand bpd
4. Interest in picking up crudes at Cushing to move to GC being assessed under Cushing Market Link open season.
Being offered for Q1 2013.
5. Interest in picking up Bakken crudes as XL l ine passes through Montana/Dakotas being assessed under Bakken
Market Link open season. Being offered for Q1 2013.
EnSys Keystone XL Assessment - Final Report Dec 23rd 2010
28
3.2.3.3.3 Other Gulf Coast Projects
As stated in earlier in this Section, pipeline routes for moving crude from PADD2 to the U.S. Gulf Coast
are currently limited to the ExxonMobil Pegasus system, which has a capacity of less than 100,000 bpd.
Small volumes of WCSB crudes have been moving to the Gulf Coast by tanker via the Panama Canal from
the Vancouver Westridge dock and by barge from PADD2.
Pipeline companies other than TransCanada have announced a number of pipeline projects from PADD2
to the U.S. Gulf Coast. Enbridge has previously listed potential projects with both ExxonMobil and BP.
Its latest announcement, in September/October 2010, is referred to as the Monarch project. This would
move light and/or heavy crudes from PADD2 to the Gulf Coast through a new 24” line from Cushing to
the Houston area. Initial stated capacity would be 370,000 bpd of light sweet (or 250,000 bpd of 22
degrees API heavy crude), expandable to 480,000 bpd light, or 325,000 bpd heavy41.
In addition, the 30” Seaway crude oil pipeline runs north from Freeport, Texas, to Cushing. The line is
owned by a 50:50 joint venture of Enterprise Products Partners and ConocoPhillips42. It is rated at
350,000 bpd but is currently reported as underutilized. The partners have reportedly examined the
feasibility and cost of reversing the line such that it would run from north to south. On the basis of
running heavy crudes, and recognizing pipeline wall thickness limitations, the north to south capacity
could be nearer to 200,000 bpd. As of the date of this report, no decision has been taken on the
reversal. A continuing need to move crude volumes north is a factor, although any reduction in the
future in that need could release the line for reversal.
3.2.3.4 Eastern Canada Line 9 Reversal
As crude oil availability from WCSB has grown, refineries at Sarnia have taken in greater volumes from
western Canada. Consequently, throughputs on the Portland Montreal Pipe Line (PMPL )/ Line 9 system
from Portland, Maine to Sarnia have been dropping. Enbridge, the operator of Line 9, has considered
the option of reversing Line 9 and PMPL so that they would carry WCSB crudes east to the New England
coast and thence to markets on the U.S. East Coast, Gulf Coast and potentially elsewhere. This project,
labeled Trailbreaker, was reported as shelved by Enbridge in early 200943.
41
“Infrastructure Solutions for the Bakken and Three Forks”, Mike Moeller, Enbridge Pipelines (North Dakota) LLC, North Dakota Petroleum Council Annual Meeting, Minot, North Dakota, September 23, 2010. 42
ConocoPhillips also owns 100% of the Seaway products line. This 20” line also runs from south to north. 43
PMPL/Line 9 reversal was included as a project in early WORLD model cases. However, the capacity was not utilized, tending to support the view that such a line would be uneconomic. It would constitute a very lengthy and roundabout route to market.

EnSys Keystone XL Assessment - Final Report Dec 23rd 2010
29
3.2.3.5 Summary of Export Projects
Table 3-3 provides a summary of pipelines that would support export and delivery of WCSB crude oils.
Projects to increase takeaway capacity for Bakken crude, which could impact on the effective capacity of
pipelines listed in Table 3-3 to carry WCSB crudes, are discussed in Section 3.2.3.2.
Table 3-3
Pipeline Project DestinationCapacity
bpd
Expansion
Possible
to
Completion as
Listed by
Operator
Status
WCSB West to BC
Kinder Morgan Transmountain TMX1 expansion Vancouver, BC 300,000 Nov 2008 Operational
Kinder Morgan Transmountain TMX2 Expansion Vancouver, BC 80,000 2015/16 On hold pending commercial interest
Kinder Morgan Transmountain TMX3 Expansion Vancouver, BC 320,000 2016/18 On hold pending commercial interest
Kinder Morgan Northern Leg Kitimat, BC 400,000 On hold, longer term proposal
Enbridge Northern Gateway (1) Kitimat, BC 525,000 800,000 2016/17Proposal submitted to NEB Joint
Review Panel May, 2010 - In Review
WCSB Cross Border to US PADD-2
Enbridge Alberta Clipper Clearbrook, MN 450,000 800,000 Oct 2010 Operational Oct 2010
Transcanada Keystone MainLine (Base) Wood River/Patoka, IL 435,000 (2) Jun 2010 Operational July 2010
Transcanada Keystone MainLine (Expansion) Wood River/Patoka, IL 156,000 (2) Q1-2011 Completing pumping upgrades
Transcanada Keystone Cushing Extension Cushing, OK 591,000 (2) Q1-2011 Completing construction
Transcanada Keystone XL - Phase IV (Steele City
Segment)Steele City, NE 700,000 (2) Q1-2013
NEB Approved March 2010 -Pending
Presidential Permit
Domestic Pipelines PADD-2 to PADD-3
TransCanada Keystone XL - Phase III (Gulf Coast
Segment)Port Arthur/Houston, TX 700,000 (2) Q1-2013
NEB Approved March 2010 -Pending
Presidential Permit
Enbridge Monarch Cushing to Gulf (3) Houston, TX 370,000 480,000 2014 Proposed mid 2010
Non-Pipeline Projects
CN Rail/Altex "PipelineOnRail" Rail routes to Kitimat, BC, and to US Gulf Coast being offered - status uncertain
Notes
1. Northern Gateway Project also includes a 193,000 bpd pipeline to import condensate (diluent) from Kitimat to Edmonton
2. Total Keystone/XL system listed as expandable from 1.29 to 1.5 mbd. Resulting total capacity to Gulf Coast expected to be 900,000 bpd
3. Listed capacities are for l ight sweet crude. For 22 API heavy crude, stated capacities are 250,000 bpd initial and 325,000 eventual
Summary of Recently Completed and Proposed Projects Supporting WCSB Exports
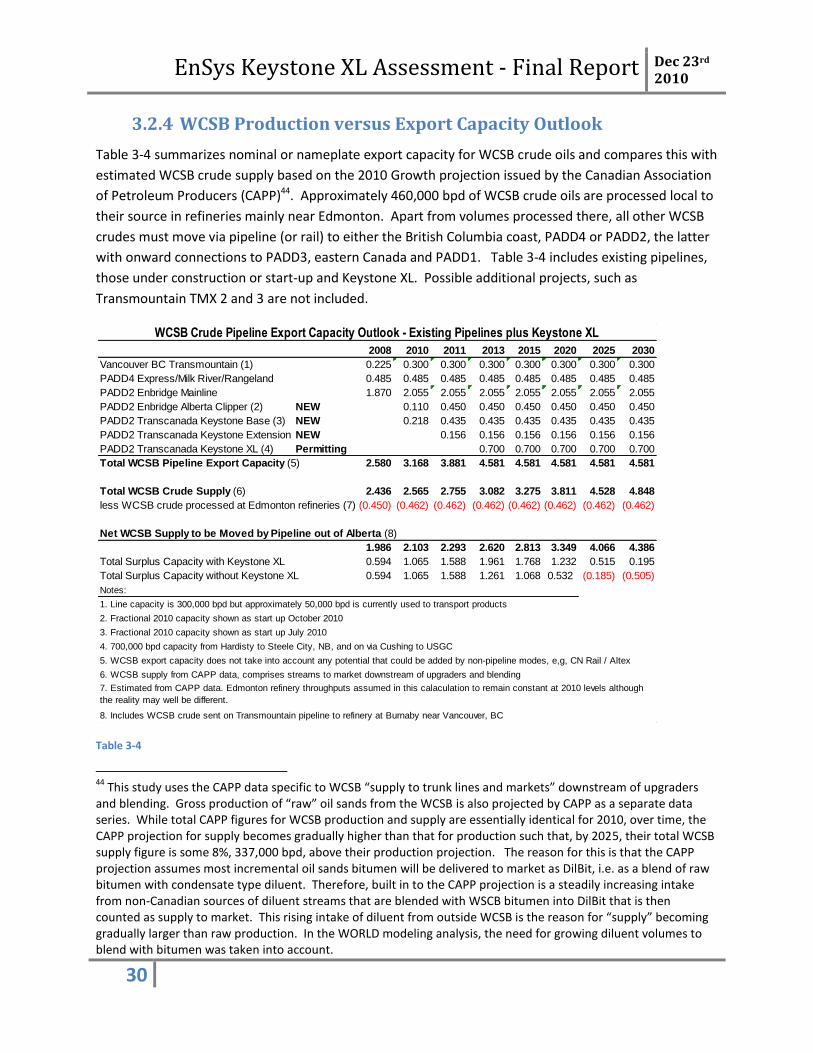
EnSys Keystone XL Assessment - Final Report Dec 23rd 2010
30
3.2.4 WCSB Production versus Export Capacity Outlook
Table 3-4 summarizes nominal or nameplate export capacity for WCSB crude oils and compares this with
estimated WCSB crude supply based on the 2010 Growth projection issued by the Canadian Association
of Petroleum Producers (CAPP)44. Approximately 460,000 bpd of WCSB crude oils are processed local to
their source in refineries mainly near Edmonton. Apart from volumes processed there, all other WCSB
crudes must move via pipeline (or rail) to either the British Columbia coast, PADD4 or PADD2, the latter
with onward connections to PADD3, eastern Canada and PADD1. Table 3-4 includes existing pipelines,
those under construction or start-up and Keystone XL. Possible additional projects, such as
Transmountain TMX 2 and 3 are not included.
Table 3-4
44
This study uses the CAPP data specific to WCSB “supply to trunk lines and markets” downstream of upgraders and blending. Gross production of “raw” oil sands from the WCSB is also projected by CAPP as a separate data series. While total CAPP figures for WCSB production and supply are essentially identical for 2010, over time, the CAPP projection for supply becomes gradually higher than that for production such that, by 2025, their total WCSB supply figure is some 8%, 337,000 bpd, above their production projection. The reason for this is that the CAPP projection assumes most incremental oil sands bitumen will be delivered to market as DilBit, i.e. as a blend of raw bitumen with condensate type diluent. Therefore, built in to the CAPP projection is a steadily increasing intake from non-Canadian sources of diluent streams that are blended with WSCB bitumen into DilBit that is then counted as supply to market. This rising intake of diluent from outside WCSB is the reason for “supply” becoming gradually larger than raw production. In the WORLD modeling analysis, the need for growing diluent volumes to blend with bitumen was taken into account.
2008 2010 2011 2013 2015 2020 2025 2030
Vancouver BC Transmountain (1) 0.225 0.300 0.300 0.300 0.300 0.300 0.300 0.300
PADD4 Express/Milk River/Rangeland 0.485 0.485 0.485 0.485 0.485 0.485 0.485 0.485
PADD2 Enbridge Mainline 1.870 2.055 2.055 2.055 2.055 2.055 2.055 2.055
PADD2 Enbridge Alberta Clipper (2) NEW 0.110 0.450 0.450 0.450 0.450 0.450 0.450
PADD2 Transcanada Keystone Base (3) NEW 0.218 0.435 0.435 0.435 0.435 0.435 0.435
PADD2 Transcanada Keystone Extension NEW 0.156 0.156 0.156 0.156 0.156 0.156
PADD2 Transcanada Keystone XL (4) Permitting 0.700 0.700 0.700 0.700 0.700
Total WCSB Pipeline Export Capacity (5) 2.580 3.168 3.881 4.581 4.581 4.581 4.581 4.581
Total WCSB Crude Supply (6) 2.436 2.565 2.755 3.082 3.275 3.811 4.528 4.848
less WCSB crude processed at Edmonton refineries (7) (0.450) (0.462) (0.462) (0.462) (0.462) (0.462) (0.462) (0.462)
Net WCSB Supply to be Moved by Pipeline out of Alberta (8)
1.986 2.103 2.293 2.620 2.813 3.349 4.066 4.386
Total Surplus Capacity with Keystone XL 0.594 1.065 1.588 1.961 1.768 1.232 0.515 0.195
Total Surplus Capacity without Keystone XL 0.594 1.065 1.588 1.261 1.068 0.532 (0.185) (0.505)
Notes:
1. Line capacity is 300,000 bpd but approximately 50,000 bpd is currently used to transport products
2. Fractional 2010 capacity shown as start up October 2010
3. Fractional 2010 capacity shown as start up July 2010
4. 700,000 bpd capacity from Hardisty to Steele City, NB, and on via Cushing to USGC
5. WCSB export capacity does not take into account any potential that could be added by non-pipeline modes, e,g, CN Rail / Altex
6. WCSB supply from CAPP data, comprises streams to market downstream of upgraders and blending
8. Includes WCSB crude sent on Transmountain pipeline to refinery at Burnaby near Vancouver, BC
WCSB Crude Pipeline Export Capacity Outlook - Existing Pipelines plus Keystone XL
7. Estimated from CAPP data. Edmonton refinery throughputs assumed in this calaculation to remain constant at 2010 levels although
the reality may well be different.

EnSys Keystone XL Assessment - Final Report Dec 23rd 2010
31
Figure 3-5 includes the data from Table 3-4, i.e. the figure is based on nameplate line capacities. The
graph shows that, if no further projects were built between now and 2030 beyond those listed in Table
3-4, then surplus export capacity would exist until around 2024 assuming (a) all pipelines being used at
full “nameplate” capacity and (b) growth in Canadian oil sands production matching the 2010 CAPP
projection. However, it is unrealistic to assume or plan on the basis that all lines would at all times (be
able to) run full. Figure 3-6 illustrates the effect of applying a more conservative long run average
system-wide utilization rate of 90%45. On this basis, additional export capacity would be needed soon
after 2020, still assuming that no other pipeline project is built in the next decade. The implication is
that, while Keystone XL, coming on line in 2013, would add to the excess in export capacity through
2020, its capacity - or an alternative (i.e. other projects in Section 3.2) - would be needed soon after
2020 to sustain WCSB production at the levels projected by CAPP. Figure 3-7 illustrates the net WCSB
export capacity surpluses/deficits assuming both nameplate and effective pipeline capacities.
Any increase in WCSB output versus the CAPP projection would bring that date nearer and vice-versa.
Equally, other pipeline projects coming on-stream in the 2015-2020 time frame, (e.g. TMX 2 and 3,
which would add a total of 400,000 bpd), would push back the date when Keystone XL or other
equivalent export capacity would be needed to avoid shutting in WCSB production.
It is thus clear that recent and current projects (excluding KXL) have led to a surplus in cross-border
export capacity into the USA that would take around ten years to eliminate, assuming (a) the 2010 CAPP
projection for production is realized and (b) no new pipelines from the WCSB to the West Coast are
opened.
However, cross-border capacity alone and associated excess is not the whole story. Key questions also
relate to the onward delivery of WCSB crude oils to refineries within U.S. regions other than PADD2 and
to the potential for export routes that would diversify WCSB destinations outside the U.S. A central goal
of the analysis was to address these and their implications.
45
Recent issues with the Enbridge Mainline system and associated WCSB production shut-ins including into December 2010, (Devon Trims Oil Output, Cites Pipeline Problems, Ryan Dezember, Dow Jones Newswires, Dec 10, 2010), indicate that, even with Alberta Clipper and Keystone Mainline (initial capacity) under start-up, the total system for transporting WCSB crudes into the U.S. is still tight, i.e. that effective capacity may be below nominal. The issues highlight the necessity for redundant nominal capacity.
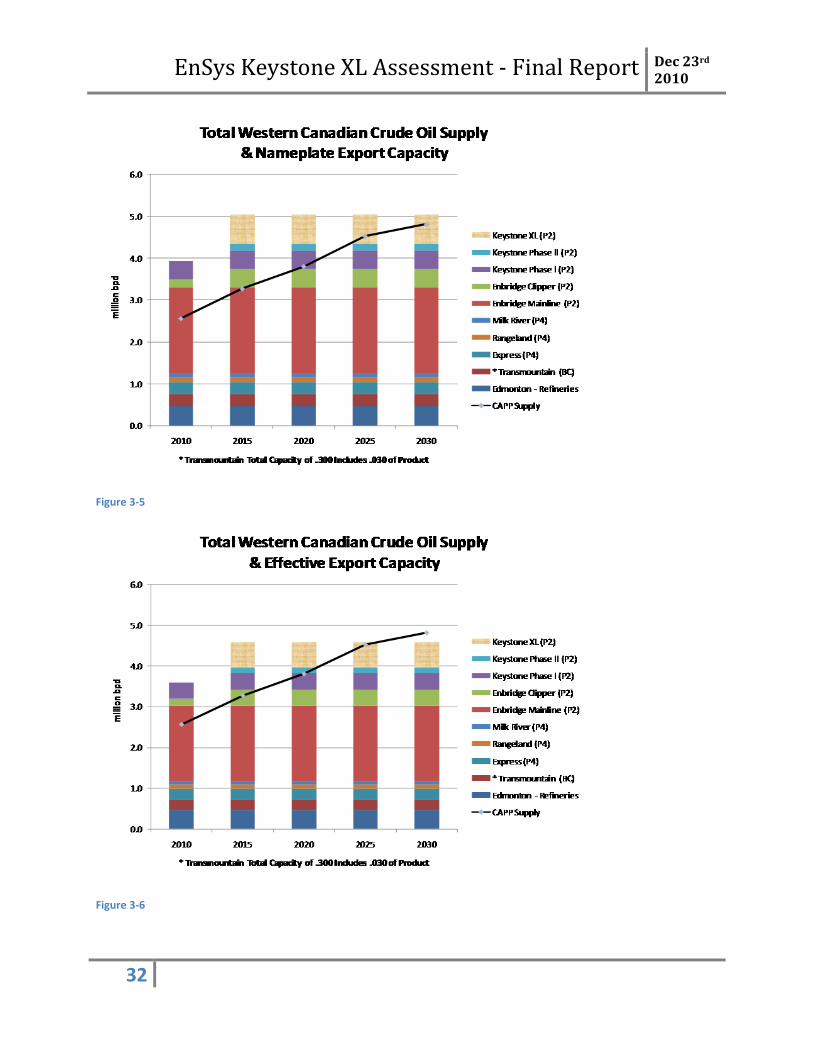
EnSys Keystone XL Assessment - Final Report Dec 23rd 2010
32
Figure 3-5
Figure 3-6
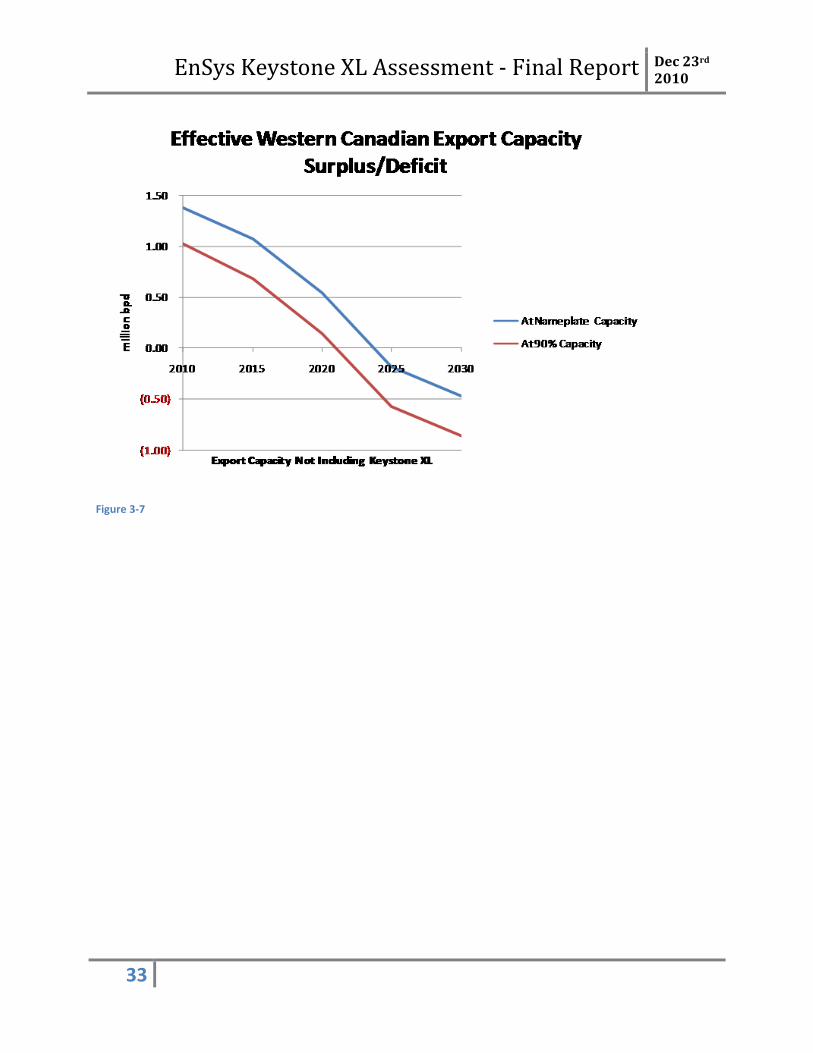
EnSys Keystone XL Assessment - Final Report Dec 23rd 2010
33
Figure 3-7
EnSys Keystone XL Assessment - Final Report Dec 23rd 2010
34
4 Scope & Basis of Analysis
The scope of this analysis centers on addressing the questions set out in Section 2.2 above, exploring the
impacts on the U.S., Canadian and global crude oil and refining systems and markets of (a) building and
(b) not building the Keystone XL pipeline. Because the combination of other available pipelines is a key
uncertainty, the study took the form of scenario analysis, examining seven different pipeline scenarios,
(see Section 4.4), each applied used two different outlooks for U.S. oil demand (see Section 4.3.1). All
scenarios are based on the assumption that Canadian oil production capacity realizes the CAPP 2010
Growth projection (see Section 0). This section also provides a basic overview of the models that
generate results for each scenario and associated calculation of greenhouse gas emissions.
4.1 Methodology/Approach
The study design employed EIA and EPA outlooks for U.S. and global oil supply, demand - and world oil
price - to which were applied sets of assumptions about available pipelines, together with refining and
other bottom up detail. These cases were modeled to gauge crude oil flows, refining activities, market
prices and other parameters under each scenario. The results provided insights into the impacts of the
Keystone XL pipeline on key aspects of the U.S., Canadian and global petroleum sectors.
The methodology centered on the use of EnSys’ WORLD model. This provides an integrated approach
encompassing the U.S., Canadian and global supply systems that:
Encompasses total oil liquids (non-crudes as well as crudes and all petroleum
products) worldwide
Characterizes petroleum market dynamics for 22 world regions with U.S.
breakdown by PADD with sub-PADD refining detail
Provides simulation and projection of the U.S. and Canadian petroleum supply
and refining systems operating within the total global competitive system and
market
Integrates “top down” oil supply/demand/world oil price scenarios with
“bottom up” detail on crudes and non-crudes supply, refining, product type and
quality, transportation and economics
Captures the interactions between regions and the effects of developments in
supply, transportation, refining capacity, product demand and quality on trade,
refining and market activity and economics.
WORLD results generated in this study encompassed the key parameters of the industry with U.S. and
Canadian detail plus other world regions in aggregate, including:
EnSys Keystone XL Assessment - Final Report Dec 23rd 2010
35
Refining throughputs, utilizations, investments
Crude flows into the U.S., from Canada and from other origins; and in aggregate
globally
Product flows into and out of the U.S. and in aggregate globally
Supply costs of crude oil and products imports to the US
Refinery CO2 emissions U.S. and non-U.S.
For more information on WORLD and parameters used for this study, see the Appendix.
To undertake the study, cases were first developed based on the Reference case for the U.S. Energy
Information Administration’s 2010 Annual Energy Outlook (AEO). This comprises an outlook for world oil
price and for global oil supply and demand with regional breakdown, including U.S. detail. . Base
WORLD model cases were established for 2010, 2015, 2020, 2025 and 2030, thereby allowing the broad
U.S. and global evolution of refining, trade and related activities and economics to be examined and
understood. Seven specific scenarios regarding KXL and other potential pipeline developments (or
restrictions) were then applied across the model horizons to examine the impacts of different
assumptions regarding available pipeline capacity.
Outputs from WORLD cases include U.S. and non-U.S. refinery CO2 emissions but not emissions
associated with production of crude oil upstream of the refinery. Using WORLD results as input for the
Energy Technology Perspectives model, the U.S. Department of Energy generated estimates of global
life-cycle GHG emissions for the seven scenarios.
Changes in lifecycle GHG emissions were calculated with the models and methodology used in deriving
indirect impacts of petroleum consumption for the RFS2 program46. Lifecycle GHG emissions for
transportation fuels may be grouped into five general areas: raw material acquisition, raw material
transport, liquid fuel production, product transport and vehicle operation.47 Changes in upstream
emissions (comprising the first two categories listed above) were calculated across scenarios using the
modeled feedstock production changes from ETP and emissions factors for various crude oils as
established by EPA. More information may be found in the Appendix Section 4.
The AEO oil demand outlook was then replaced with a projection of lower U.S. demand for refined
products. The DOE ETP model was used to estimate the impacts that a reduction in U.S. petroleum
demand could be expected to have on world oil price and hence non-U.S. supply and demand, including
WCSB oil sands production. With world oil price, U.S. and non-U.S. supply and demand adjustments in
place, the WORLD model was then rerun for the full suite of seven pipeline scenarios. The DOE ETP
model was then used to generate associated estimates of global life-cycle GHG emissions impacts.
Key premises and results for each scenario are summarized here in the main body of the report and are
detailed in the Appendices.
46
Petroleum Indirect Impacts Analysis (February 1, 2010), EPA-HQ-OAR-2005-0161-3156. 47
DOE/NETL, An Evaluation of the Extraction, Transport and Refining of Imported Crude Oils and the Impact on Life Cycle Greenhouse Gas Emissions, March 27, 2009, DOE/NETL-2009/1362.
EnSys Keystone XL Assessment - Final Report Dec 23rd 2010
36
4.2 Study Exclusions
The study did not explore the sensitivity of results to changes in the initial assumption of Canadian crude
oil production through 2030. In addition, the study limited or excluded the following.
4.2.1 U.S. Climate Policy
Although federal U.S. climate legislation or regulatory action could be enacted during the timeframe of
the study, this assignment excluded consideration of any potential U.S. Federal, regional or state
regulatory or legislative action on climate change. The study did include California’s Law AB32 since this
is in force, but only in so far as the law discourages California refineries from buying Canadian oil sands
crudes. The EU climate regime was incorporated and was projected as moving forward with moderately
increasing carbon costs over time. Potential U.S. policy actions are implicitly assumed in the lower U.S.
demand outlook for refined oil products. EPA described the analysis in which it developed its low
demand outlooks as focused on “the GHG reductions that could be derived directly from the
transportation sector if effective drivers were in place”48.
4.2.2 Oil Sands Upgrading Emissions and Life-Cycle Analysis
The analysis used features built into WORLD to project refinery CO2 emissions by region, U.S. and non-
U.S., by scenario. The WORLD modeling excluded any computation or consideration of carbon
footprints of crude oils and non-crude supply streams, (including the life-cycle/LCFS carbon footprint of
Canadian oil sands), or of the CO2 emissions associated with transportation of oil streams and
combustion of oil products. Specifically, the EnSys analysis did not consider or model oil sands
upgrading processes and technologies but began from and used as inputs oil sands streams as delivered
to market, i.e. those grades and volumes available after blending with diluent and or upgrading.
Further, the study did not consider any variations in the mix of oil sands streams to market, e.g.
variations in the proportions of DilBit, SynBit and fully upgraded synthetic crude oil (SCO). As described
in Section 4.3.2, the latest CAPP projection was used to create a single “reference” outlook for Canadian
crude supply volumes and mix.
Global life-cycle GHG emissions impacts were, however, estimated by the Department of Energy using
results from WORLD and other data in their ETP model. Those results are included in this report.
48
EPA Analysis of the Transportation Sector Greenhouse Gas and Oil Reduction Scenarios, February 10, 2010. http://www.epa.gov/oms/climate/GHGtransportation-analysis03-18-2010.pdf.
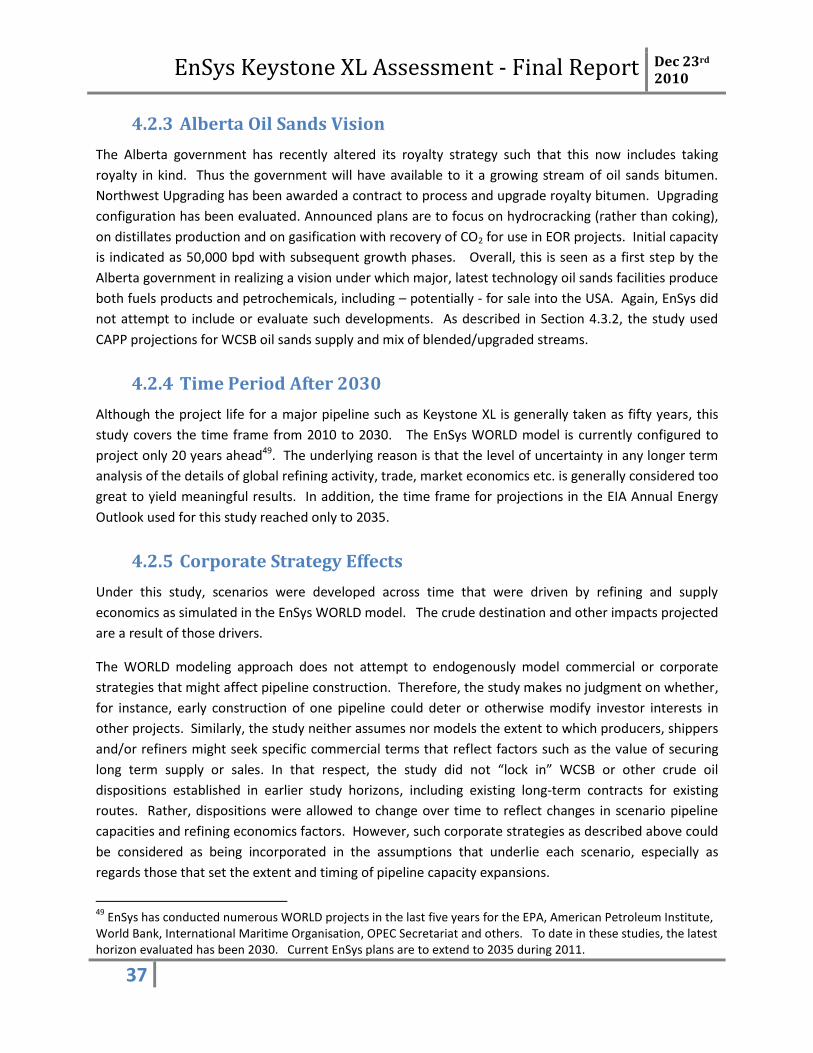
EnSys Keystone XL Assessment - Final Report Dec 23rd 2010
37
4.2.3 Alberta Oil Sands Vision
The Alberta government has recently altered its royalty strategy such that this now includes taking
royalty in kind. Thus the government will have available to it a growing stream of oil sands bitumen.
Northwest Upgrading has been awarded a contract to process and upgrade royalty bitumen. Upgrading
configuration has been evaluated. Announced plans are to focus on hydrocracking (rather than coking),
on distillates production and on gasification with recovery of CO2 for use in EOR projects. Initial capacity
is indicated as 50,000 bpd with subsequent growth phases. Overall, this is seen as a first step by the
Alberta government in realizing a vision under which major, latest technology oil sands facilities produce
both fuels products and petrochemicals, including – potentially - for sale into the USA. Again, EnSys did
not attempt to include or evaluate such developments. As described in Section 4.3.2, the study used
CAPP projections for WCSB oil sands supply and mix of blended/upgraded streams.
4.2.4 Time Period After 2030
Although the project life for a major pipeline such as Keystone XL is generally taken as fifty years, this
study covers the time frame from 2010 to 2030. The EnSys WORLD model is currently configured to
project only 20 years ahead49. The underlying reason is that the level of uncertainty in any longer term
analysis of the details of global refining activity, trade, market economics etc. is generally considered too
great to yield meaningful results. In addition, the time frame for projections in the EIA Annual Energy
Outlook used for this study reached only to 2035.
4.2.5 Corporate Strategy Effects
Under this study, scenarios were developed across time that were driven by refining and supply
economics as simulated in the EnSys WORLD model. The crude destination and other impacts projected
are a result of those drivers.
The WORLD modeling approach does not attempt to endogenously model commercial or corporate
strategies that might affect pipeline construction. Therefore, the study makes no judgment on whether,
for instance, early construction of one pipeline could deter or otherwise modify investor interests in
other projects. Similarly, the study neither assumes nor models the extent to which producers, shippers
and/or refiners might seek specific commercial terms that reflect factors such as the value of securing
long term supply or sales. In that respect, the study did not “lock in” WCSB or other crude oil
dispositions established in earlier study horizons, including existing long-term contracts for existing
routes. Rather, dispositions were allowed to change over time to reflect changes in scenario pipeline
capacities and refining economics factors. However, such corporate strategies as described above could
be considered as being incorporated in the assumptions that underlie each scenario, especially as
regards those that set the extent and timing of pipeline capacity expansions.
49
EnSys has conducted numerous WORLD projects in the last five years for the EPA, American Petroleum Institute, World Bank, International Maritime Organisation, OPEC Secretariat and others. To date in these studies, the latest horizon evaluated has been 2030. Current EnSys plans are to extend to 2035 during 2011.
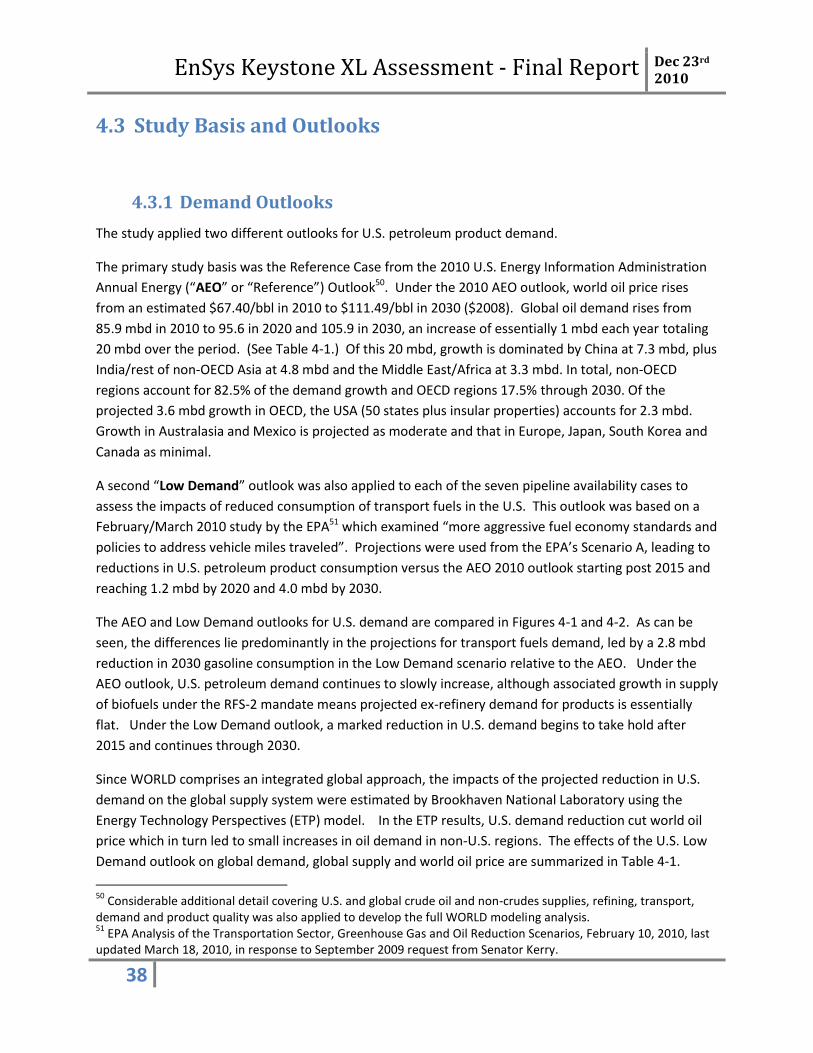
EnSys Keystone XL Assessment - Final Report Dec 23rd 2010
38
4.3 Study Basis and Outlooks
4.3.1 Demand Outlooks
The study applied two different outlooks for U.S. petroleum product demand.
The primary study basis was the Reference Case from the 2010 U.S. Energy Information Administration
Annual Energy (“AEO” or “Reference”) Outlook50. Under the 2010 AEO outlook, world oil price rises
from an estimated $67.40/bbl in 2010 to $111.49/bbl in 2030 ($2008). Global oil demand rises from
85.9 mbd in 2010 to 95.6 in 2020 and 105.9 in 2030, an increase of essentially 1 mbd each year totaling
20 mbd over the period. (See Table 4-1.) Of this 20 mbd, growth is dominated by China at 7.3 mbd, plus
India/rest of non-OECD Asia at 4.8 mbd and the Middle East/Africa at 3.3 mbd. In total, non-OECD
regions account for 82.5% of the demand growth and OECD regions 17.5% through 2030. Of the
projected 3.6 mbd growth in OECD, the USA (50 states plus insular properties) accounts for 2.3 mbd.
Growth in Australasia and Mexico is projected as moderate and that in Europe, Japan, South Korea and
Canada as minimal.
A second “Low Demand” outlook was also applied to each of the seven pipeline availability cases to
assess the impacts of reduced consumption of transport fuels in the U.S. This outlook was based on a
February/March 2010 study by the EPA51 which examined “more aggressive fuel economy standards and
policies to address vehicle miles traveled”. Projections were used from the EPA’s Scenario A, leading to
reductions in U.S. petroleum product consumption versus the AEO 2010 outlook starting post 2015 and
reaching 1.2 mbd by 2020 and 4.0 mbd by 2030.
The AEO and Low Demand outlooks for U.S. demand are compared in Figures 4-1 and 4-2. As can be
seen, the differences lie predominantly in the projections for transport fuels demand, led by a 2.8 mbd
reduction in 2030 gasoline consumption in the Low Demand scenario relative to the AEO. Under the
AEO outlook, U.S. petroleum demand continues to slowly increase, although associated growth in supply
of biofuels under the RFS-2 mandate means projected ex-refinery demand for products is essentially
flat. Under the Low Demand outlook, a marked reduction in U.S. demand begins to take hold after
2015 and continues through 2030.
Since WORLD comprises an integrated global approach, the impacts of the projected reduction in U.S.
demand on the global supply system were estimated by Brookhaven National Laboratory using the
Energy Technology Perspectives (ETP) model. In the ETP results, U.S. demand reduction cut world oil
price which in turn led to small increases in oil demand in non-U.S. regions. The effects of the U.S. Low
Demand outlook on global demand, global supply and world oil price are summarized in Table 4-1.
50
Considerable additional detail covering U.S. and global crude oil and non-crudes supplies, refining, transport, demand and product quality was also applied to develop the full WORLD modeling analysis. 51
EPA Analysis of the Transportation Sector, Greenhouse Gas and Oil Reduction Scenarios, February 10, 2010, last updated March 18, 2010, in response to September 2009 request from Senator Kerry.

EnSys Keystone XL Assessment - Final Report Dec 23rd 2010
39
Demand reductions in the U.S. were projected to lead to reductions in world oil price which in turn
encouraged (small) petroleum product demand increases outside the USA. The resulting Low Demand
world oil price was projected by 2030 to be close to $4.50/bbl below that in the AEO outlook. The net
global oil demand reduction in 2030 was 3.7 mbd, comprised of small demand increases totaling 0.3
mbd in regions outside the U.S. partially offsetting the U.S. product demand reduction of 4.0 mbd. On
the supply side, ETP results indicate the reduction of 3.7 mbd would be met primarily by cuts in OPEC
crude production, notably from the Middle East. ETP results also indicate that there would be small
reductions in U.S., Canadian and other non-OPEC supplies, including those for WCSB conventional and
oil sands crudes. As indicated in Table 4-1, total Canadian oil production was projected to be cut by 0.2
mbd by 2030. This reduction was taken as being entirely in oil sands output.
Table 4-1
2010 2020 2030 2010 2020 2030
World oil price $/bbl (1) 67.40$ 98.14$ 111.49$ 67.40$ 96.80$ 107.00$
Liquids demand
million bpd
USA (50 states) 19.2 20.6 21.5 19.2 19.4 17.5
Canada 2.3 2.4 2.5 2.3 2.4 2.6
other OECD (2) 24.8 25.7 25.8 24.8 25.7 25.9
China 8.5 12.4 15.8 8.5 12.4 15.8
other non-OECD 31.0 34.6 40.3 31.0 34.7 40.4
Global 85.9 95.6 105.9 85.9 94.5 102.2
85.9 95.6 105.9 85.9 94.5 102.1
Canada crude oil supply (3)
Conventional (4) 1.10 0.82 0.54 1.10 0.80 0.51
Oil Sands (5) 1.73 3.22 4.42 1.73 3.15 4.25
Total 2.83 4.04 4.96 2.83 3.95 4.76
Notes:
AEO Outlook (6) Low Demand Outlook (7)
Summary of AEO and Low Demand Projections
7. Basis EPA Analysis of the Transportation Sector, Greenhouse Gas and Oil Reduction Scenarios, February 10,
2010, last updated March 18, 2010
4. Include both Western and Eastern Canada
1. World oil price taken as price of US imported crude oil. Values are constant dollars $ 2008
2. Comprises: Mexico, Europe, Japan, South Korea, Australia, New Zealand
3. Projections to 2025 taken from CAPP 2010 Report Growth projection, 2030 estimates via extrapolation
5. Comprises blended / upgraded supply streams to market not raw production
6. Basis EIA Annual Energy Outlook 2010 Reference Case
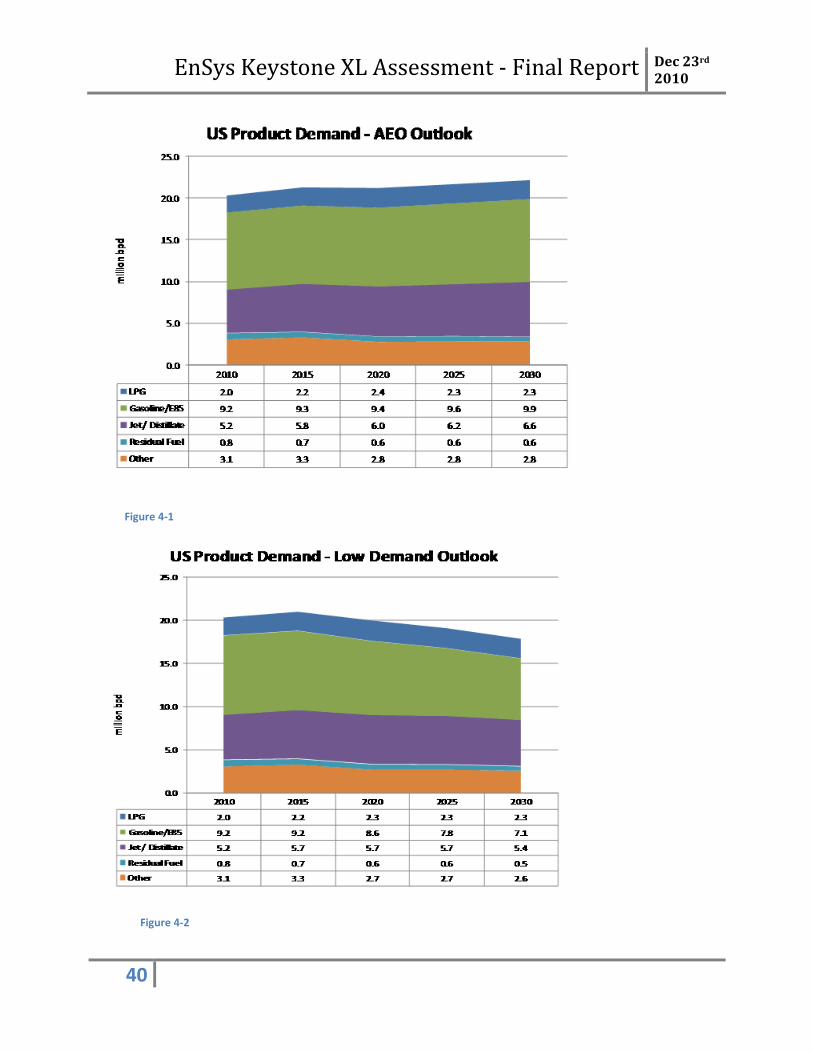
EnSys Keystone XL Assessment - Final Report Dec 23rd 2010
40
Figure 4-1
Figure 4-2
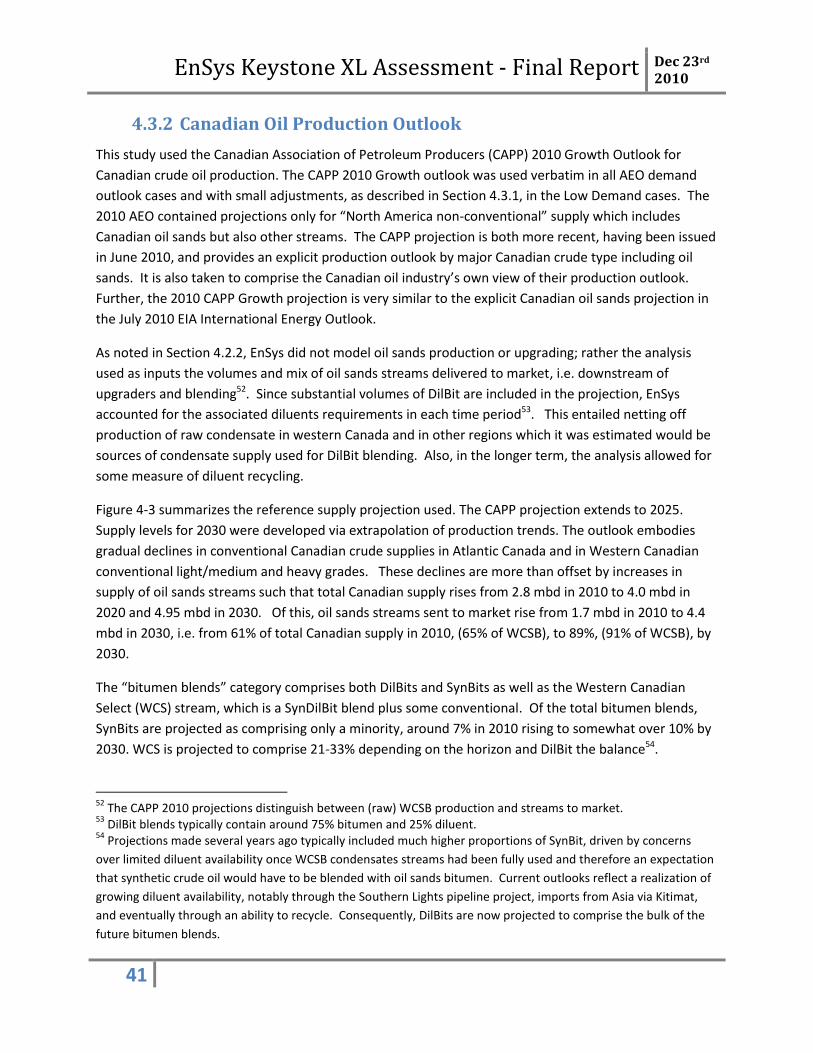
EnSys Keystone XL Assessment - Final Report Dec 23rd 2010
41
4.3.2 Canadian Oil Production Outlook
This study used the Canadian Association of Petroleum Producers (CAPP) 2010 Growth Outlook for
Canadian crude oil production. The CAPP 2010 Growth outlook was used verbatim in all AEO demand
outlook cases and with small adjustments, as described in Section 4.3.1, in the Low Demand cases. The
2010 AEO contained projections only for “North America non-conventional” supply which includes
Canadian oil sands but also other streams. The CAPP projection is both more recent, having been issued
in June 2010, and provides an explicit production outlook by major Canadian crude type including oil
sands. It is also taken to comprise the Canadian oil industry’s own view of their production outlook.
Further, the 2010 CAPP Growth projection is very similar to the explicit Canadian oil sands projection in
the July 2010 EIA International Energy Outlook.
As noted in Section 4.2.2, EnSys did not model oil sands production or upgrading; rather the analysis
used as inputs the volumes and mix of oil sands streams delivered to market, i.e. downstream of
upgraders and blending52. Since substantial volumes of DilBit are included in the projection, EnSys
accounted for the associated diluents requirements in each time period53. This entailed netting off
production of raw condensate in western Canada and in other regions which it was estimated would be
sources of condensate supply used for DilBit blending. Also, in the longer term, the analysis allowed for
some measure of diluent recycling.
Figure 4-3 summarizes the reference supply projection used. The CAPP projection extends to 2025.
Supply levels for 2030 were developed via extrapolation of production trends. The outlook embodies
gradual declines in conventional Canadian crude supplies in Atlantic Canada and in Western Canadian
conventional light/medium and heavy grades. These declines are more than offset by increases in
supply of oil sands streams such that total Canadian supply rises from 2.8 mbd in 2010 to 4.0 mbd in
2020 and 4.95 mbd in 2030. Of this, oil sands streams sent to market rise from 1.7 mbd in 2010 to 4.4
mbd in 2030, i.e. from 61% of total Canadian supply in 2010, (65% of WCSB), to 89%, (91% of WCSB), by
2030.
The “bitumen blends” category comprises both DilBits and SynBits as well as the Western Canadian
Select (WCS) stream, which is a SynDilBit blend plus some conventional. Of the total bitumen blends,
SynBits are projected as comprising only a minority, around 7% in 2010 rising to somewhat over 10% by
2030. WCS is projected to comprise 21-33% depending on the horizon and DilBit the balance54.
52
The CAPP 2010 projections distinguish between (raw) WCSB production and streams to market. 53
DilBit blends typically contain around 75% bitumen and 25% diluent. 54
Projections made several years ago typically included much higher proportions of SynBit, driven by concerns
over limited diluent availability once WCSB condensates streams had been fully used and therefore an expectation
that synthetic crude oil would have to be blended with oil sands bitumen. Current outlooks reflect a realization of
growing diluent availability, notably through the Southern Lights pipeline project, imports from Asia via Kitimat,
and eventually through an ability to recycle. Consequently, DilBits are now projected to comprise the bulk of the
future bitumen blends.
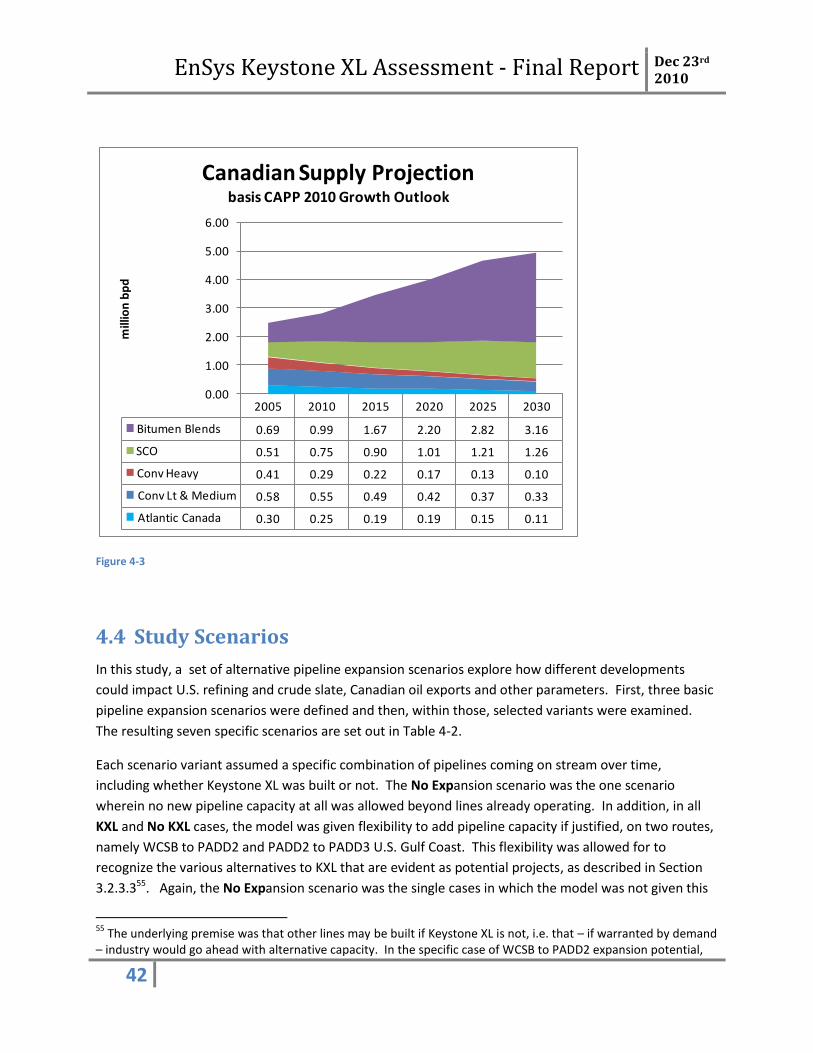
EnSys Keystone XL Assessment - Final Report Dec 23rd 2010
42
Figure 4-3
4.4 Study Scenarios
In this study, a set of alternative pipeline expansion scenarios explore how different developments
could impact U.S. refining and crude slate, Canadian oil exports and other parameters. First, three basic
pipeline expansion scenarios were defined and then, within those, selected variants were examined.
The resulting seven specific scenarios are set out in Table 4-2.
Each scenario variant assumed a specific combination of pipelines coming on stream over time,
including whether Keystone XL was built or not. The No Expansion scenario was the one scenario
wherein no new pipeline capacity at all was allowed beyond lines already operating. In addition, in all
KXL and No KXL cases, the model was given flexibility to add pipeline capacity if justified, on two routes,
namely WCSB to PADD2 and PADD2 to PADD3 U.S. Gulf Coast. This flexibility was allowed for to
recognize the various alternatives to KXL that are evident as potential projects, as described in Section
3.2.3.355. Again, the No Expansion scenario was the single cases in which the model was not given this
55
The underlying premise was that other lines may be built if Keystone XL is not, i.e. that – if warranted by demand – industry would go ahead with alternative capacity. In the specific case of WCSB to PADD2 expansion potential,
2005 2010 2015 2020 2025 2030
Bitumen Blends 0.69 0.99 1.67 2.20 2.82 3.16
SCO 0.51 0.75 0.90 1.01 1.21 1.26
Conv Heavy 0.41 0.29 0.22 0.17 0.13 0.10
Conv Lt & Medium 0.58 0.55 0.49 0.42 0.37 0.33
Atlantic Canada 0.30 0.25 0.19 0.19 0.15 0.11
0.00
1.00
2.00
3.00
4.00
5.00
6.00
mill
ion
bp
d
Canadian Supply Projectionbasis CAPP 2010 Growth Outlook
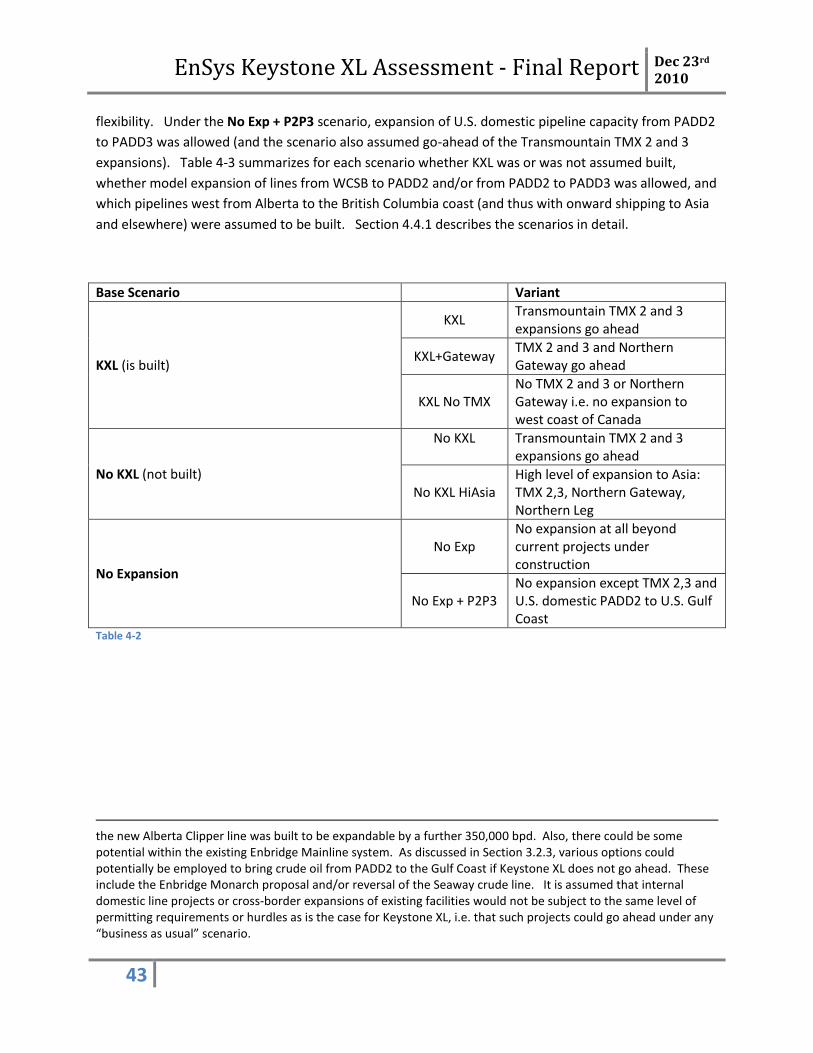
EnSys Keystone XL Assessment - Final Report Dec 23rd 2010
43
flexibility. Under the No Exp + P2P3 scenario, expansion of U.S. domestic pipeline capacity from PADD2
to PADD3 was allowed (and the scenario also assumed go-ahead of the Transmountain TMX 2 and 3
expansions). Table 4-3 summarizes for each scenario whether KXL was or was not assumed built,
whether model expansion of lines from WCSB to PADD2 and/or from PADD2 to PADD3 was allowed, and
which pipelines west from Alberta to the British Columbia coast (and thus with onward shipping to Asia
and elsewhere) were assumed to be built. Section 4.4.1 describes the scenarios in detail.
Base Scenario Variant
KXL (is built)
KXL Transmountain TMX 2 and 3 expansions go ahead
KXL+Gateway TMX 2 and 3 and Northern Gateway go ahead
KXL No TMX
No TMX 2 and 3 or Northern Gateway i.e. no expansion to west coast of Canada
No KXL (not built)
No KXL Transmountain TMX 2 and 3 expansions go ahead
No KXL HiAsia
High level of expansion to Asia: TMX 2,3, Northern Gateway, Northern Leg
No Expansion
No Exp
No expansion at all beyond current projects under construction
No Exp + P2P3
No expansion except TMX 2,3 and U.S. domestic PADD2 to U.S. Gulf Coast
Table 4-2
the new Alberta Clipper line was built to be expandable by a further 350,000 bpd. Also, there could be some potential within the existing Enbridge Mainline system. As discussed in Section 3.2.3, various options could potentially be employed to bring crude oil from PADD2 to the Gulf Coast if Keystone XL does not go ahead. These include the Enbridge Monarch proposal and/or reversal of the Seaway crude line. It is assumed that internal domestic line projects or cross-border expansions of existing facilities would not be subject to the same level of permitting requirements or hurdles as is the case for Keystone XL, i.e. that such projects could go ahead under any “business as usual” scenario.
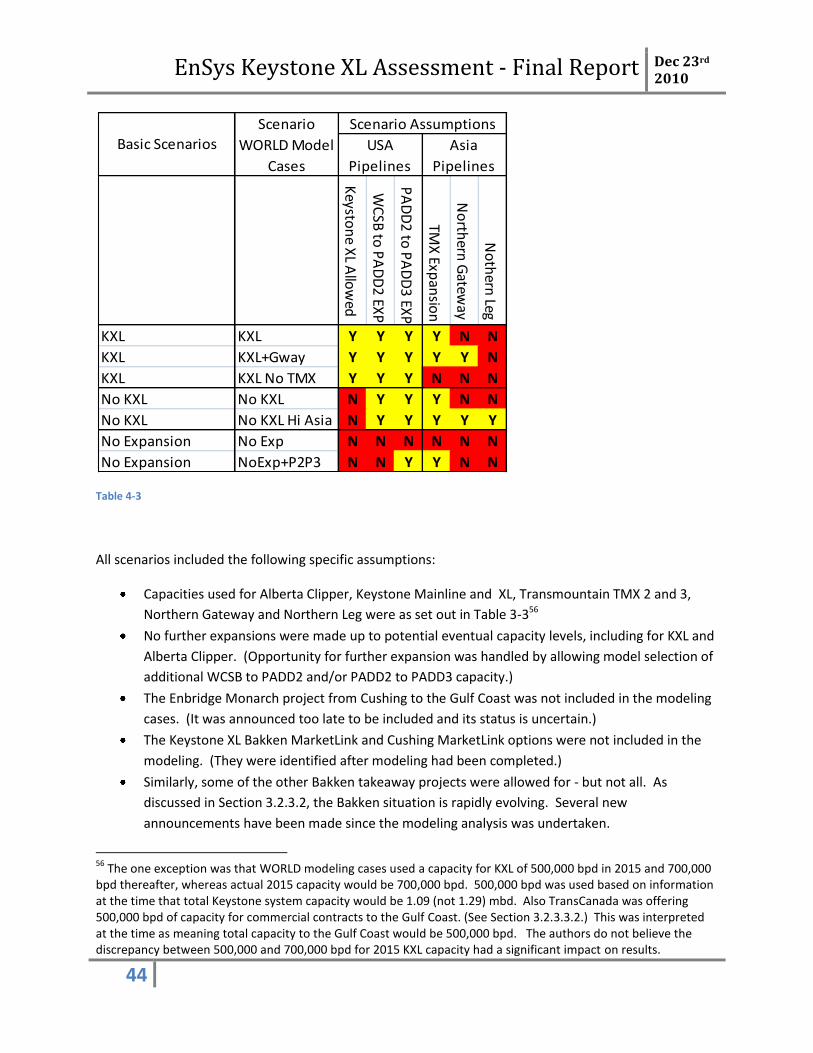
EnSys Keystone XL Assessment - Final Report Dec 23rd 2010
44
Table 4-3
All scenarios included the following specific assumptions:
Capacities used for Alberta Clipper, Keystone Mainline and XL, Transmountain TMX 2 and 3,
Northern Gateway and Northern Leg were as set out in Table 3-356
No further expansions were made up to potential eventual capacity levels, including for KXL and
Alberta Clipper. (Opportunity for further expansion was handled by allowing model selection of
additional WCSB to PADD2 and/or PADD2 to PADD3 capacity.)
The Enbridge Monarch project from Cushing to the Gulf Coast was not included in the modeling
cases. (It was announced too late to be included and its status is uncertain.)
The Keystone XL Bakken MarketLink and Cushing MarketLink options were not included in the
modeling. (They were identified after modeling had been completed.)
Similarly, some of the other Bakken takeaway projects were allowed for - but not all. As
discussed in Section 3.2.3.2, the Bakken situation is rapidly evolving. Several new
announcements have been made since the modeling analysis was undertaken.
56
The one exception was that WORLD modeling cases used a capacity for KXL of 500,000 bpd in 2015 and 700,000 bpd thereafter, whereas actual 2015 capacity would be 700,000 bpd. 500,000 bpd was used based on information at the time that total Keystone system capacity would be 1.09 (not 1.29) mbd. Also TransCanada was offering 500,000 bpd of capacity for commercial contracts to the Gulf Coast. (See Section 3.2.3.3.2.) This was interpreted at the time as meaning total capacity to the Gulf Coast would be 500,000 bpd. The authors do not believe the discrepancy between 500,000 and 700,000 bpd for 2015 KXL capacity had a significant impact on results.
Keysto
ne X
L Allo
wed
WC
SB to
PA
DD
2 EX
P
PA
DD
2 to
PA
DD
3 EX
P
TMX
Expan
sion
No
rthern
Gatew
ay
No
thern
LegKXL KXL Y Y Y Y N N
KXL KXL+Gway Y Y Y Y Y N
KXL KXL No TMX Y Y Y N N N
No KXL No KXL N Y Y Y N N
No KXL No KXL Hi Asia N Y Y Y Y Y
No Expansion No Exp N N N N N N
No Expansion NoExp+P2P3 N N Y Y N N
USA
Pipelines
Asia
Pipelines
Basic Scenarios
Scenario
WORLD Model
Cases
Scenario Assumptions
EnSys Keystone XL Assessment - Final Report Dec 23rd 2010
45
4.4.1 KXL Scenario & Variants
Under this scenario, the KXL pipeline is built. In addition further expansions, to be selected by WORLD if
warranted, are allowed from WCSB to PADD2 and from PADD2 to PADD3 (U.S. Gulf Coast).
Three scenario variants were undertaken in order to assess the impact of different levels of pipeline
expansion from WCSB west to the coast of British Columbia and thus by ship to the Asian market57.
KXL
Assumes the Transmountain TMX 2 and 3 expansions are built and are operational by 2020.
This assumption is consistent with the intent of various entities in Canada to expand and
diversify export routes, and specifically, to access growth markets in Asia, i.e. it reflects a view
that the combination of growing Asian refining capacity, increasing Asian equity interests in oil
sands production and rising WCSB volumes currently being shipped to Asia would be likely to
lead to some degree of pipeline expansion to the BC coast
Assumes that, among all of the proposed projects to the West Coast, TMX 2 and 3 would be the
most likely to be built. The Transmountain line constitutes an existing facility and right of way,
rendering permits for capacity expansions for TMX 2 and 3 easier to obtain and potentially
reducing challenges to completion. The Transmountain line was already reported as operating
above capacity and over-committed at the time of this report, indicating strong market demand
even with excess pipeline capacity available across the border to the U.S.
Although this scenario explicitly assumes it is the TMX 2 and 3 expansions that are built, they
also act as a more general “proxy” to represent a moderate level of expansion from WCSB.
(Overall delivery costs to north Asia are not that different whichever pipeline route to the BC
coast is assumed.)
The scenario also assumes that “business as usual” obtains in that other pipeline expansions are
able to be realized when justified by economics and where data indicate that options to expand
exist. Reflecting these conditions, the options allowed within the WORLD model were to
expand pipelines cross-border from WCSB to PADD2 and/or from PADD2 to PADD3 (U.S. Gulf
Coast)
KXL + Northern Gateway
Same assumptions as KXL case above except this variant also assumes that either the Enbridge
Northern Gateway or the Kinder Morgan Northern Leg goes ahead by 2025. Although the
Northern Gateway project was specifically selected for this scenario, the primary purpose was to
57
WCSB crudes can also be shipped by tanker from British Columbia to the U.S. west and Gulf coasts. In the EnSys study, movements to the Washington state refineries were allowed but movements of oil sands streams to California were not; this reflecting the existence of California Law AB 32.
EnSys Keystone XL Assessment - Final Report Dec 23rd 2010
46
represent a higher level of export capacity west from WCSB beyond the expansion of TMX 2 and
3 already in the KXL case.
KXL – No TMX
Same assumptions as KXL case above except assumes that there is no TMX 2, 3 or other
expansion in lines from WCSB west across the period through 2030. The purpose of this
scenario was to examine the effects of capacity to BC and Asia remaining at present day levels.
In the presentation of results, the KXL scenario is used in the study as a “central” or “reference” case
against which the results of all other scenarios are compared.
4.4.2 No KXL Scenario & Variants
Under this scenario, the KXL pipeline is not built. However, the assumption is that, as in the KXL case,
the situation is otherwise “business as usual”; notably, further expansions are allowed from WCSB to
PADD2 and from PADD2 to PADD3 (U.S. Gulf Coast). Also, the TMX 2 and 3 projects are assumed to be
on-line by 2020.
Two No KXL scenario variants were analyzed, with focus on the effects of different levels of WCSB
expansion to BC and thence Asian markets.
No KXL
Scenario is the same as the KXL “reference” scenario except KXL is assumed not built. TMX 2
and 3 expansions go ahead but no other lines from WCSB west.
No KXL High Asia
TMX 2 and 3, Northern Gateway and Northern Leg are all built with staggered timing that places
them onstream respectively by 2020, 2025 and 2030. This raises the capacity to move WCSB
crudes to and out of British Columbia to 700,000 bpd by 2020 (from 300,000 bpd today), to
1.225 mbd by 2025 and to 1.625 mbd by 2030. Note that the firms proposing these projects
have stated target dates for completion that would bring them on stream earlier than allowed
for in the scenario. A more conservative approach was taken on timing in the analysis to reflect
the potential for opposition to the Northern Gateway and Northern Leg projects in particular to
significantly extend timetables for implementation
EnSys Keystone XL Assessment - Final Report Dec 23rd 2010
47
A primary purpose of this scenario was to examine whether commercial incentives would be
sufficient to fill substantially larger capacity to move WCSB crudes west – and thus to markets
outside the USA – if it were available.
4.4.3 No Expansion Scenario & Variants
This scenario examines a future in which a widespread movement prevents essentially any expansion
beyond existing line capacity. Two scenario variants were analyzed to explore the effects of different
levels of constraint on pipeline expansion.
No Expansion
No expansion is allowed beyond lines that are in operation as of 2010. Thus Alberta Clipper,
Keystone Mainline and Keystone Extension to Cushing are allowed but otherwise there are no
further expansions:
o No KXL
o No PADD2 to PADD3 line expansions
o No TMX 2,3 or other lines WCSB to BC.
No Expansion + TMX 2,3 and PADD2 to PADD3 Allowed
As No Expansion case, except TMX 2 and 3 expansions are assumed to go ahead and domestic
U.S. line expansions from PADD2 to PADD3 are allowed.
4.4.4 Discussion of Scenarios
The scenarios span a range that enables assessment of the need for KXL and other lines under different
circumstances. The KXL and No KXL scenarios enable assessment of the extent and timing for pipeline
capacity needed to support full production of oil sands as projected by CAPP, notably from WCSB to
PADD2 and from PADD2 to PADD3/Gulf Coast refineries. In parallel, the scenarios shed light on the
extent of market incentives for shipping WCSB heavy crudes to Gulf Coast refiners. The KXL vs. No KXL
comparisons also highlight the potential effects of differing levels of WCSB pipeline expansions west,
and thus of the potential competition for WCSB crudes between the USA and Asia.
The KXL and No KXL scenarios enable sufficient pipeline capacity to be built such that production of
WCSB crudes including oil sands streams is always at reference outlook levels. There is no shut-in of
production relative to the 2010 CAPP production outlook used. Conversely, the No Expansion scenarios

EnSys Keystone XL Assessment - Final Report Dec 23rd 2010
48
examines inter alia the extent to which a total or near-total elimination of pipeline expansion could lead
to shutting in as well as re-distribution of WCSB production.
All scenarios enable examination of the implications for U.S. dependency on crude oil imports from the
Middle East and other sources outside Canada; also U.S. refinery throughputs and product imports and
exports. In addition, all seven pipeline scenarios were run against both the AEO Reference outlook and
the Low Demand outlook for U.S. petroleum product consumption to assess the impact of U.S. demand
level on U.S. refinery runs, crude oil import levels and sources, etc.
Outputs from WORLD cases were also used (a) to report U.S. and non-U.S. refinery CO2 emissions and
(b) as inputs to the Department of Energy ETP model which then generated estimates of global life-cycle
GHG emissions, again enabling the effects of different scenarios to be compared.
4.5 Economics of Moving WCSB Crudes to U.S. Gulf Coast versus
Asia
A key factor in the analysis is the comparative transport economics of moving WCSB crudes into the
U.S., especially PADD3 Gulf Coast, versus to Asia. Possibly not immediately apparent is that freight
costs for WCSB crudes to northeast Asia (encompassing the markets of China, Japan, South Korea and
Taiwan) are lower than those to the U.S. Gulf Coast. Figure 4-4 compares freight rates used in the
WORLD cases58. The rates are for transporting a heavy WCSB oil sands stream such as DilBit or WCS.
The pipeline plus tanker cost is via the Transmountain pipeline and then tanker to China59. The
difference in freight cost is estimated at around a $2.50 to $3 per barrel advantage to moving WCSB to
Asia rather than to the Gulf Coast60.
58
As further discussed in Appendix Section 2.3, EnSys escalated both pipeline and tanker (real) freight rates over time. The escalation was driven by the fact that both modes use fuels whose real costs are projected in the EIA AEO to rise over time. Tanker rates are impacted more by crude oil costs (marine bunker fuels) and pipeline costs more by natural gas, electricity and thus also coal prices. With crude oil prices projected to rise more rapidly than those for natural gas, coal or electricity in the AEO, tanker rates were projected to rise in real terms faster than pipeline rates, around 2.2% p.a. and 1.3% p.a. respectively through 2030. 59
Costs for transport via the prospective Northern Gateway line to Kitimat and thence to China are projected to be similar. Broadly, it is expected the Northern Gateway route would have a higher pipeline tariff but a lower tanker freight cost, the latter because of the ability to move VLCC’s out of Kitimat and the port’s slightly shorter nautical distance to China. 60
This difference is in line with recent press articles including a report that Enbridge believes “it can earn $2 to $3 more on every barrel it sells” to Asia, moving crude via Northern Gateway if built. Source: Oil Patch Sets Course for Asia”, Toronto Globe and Mail, July 24
th, 2010.
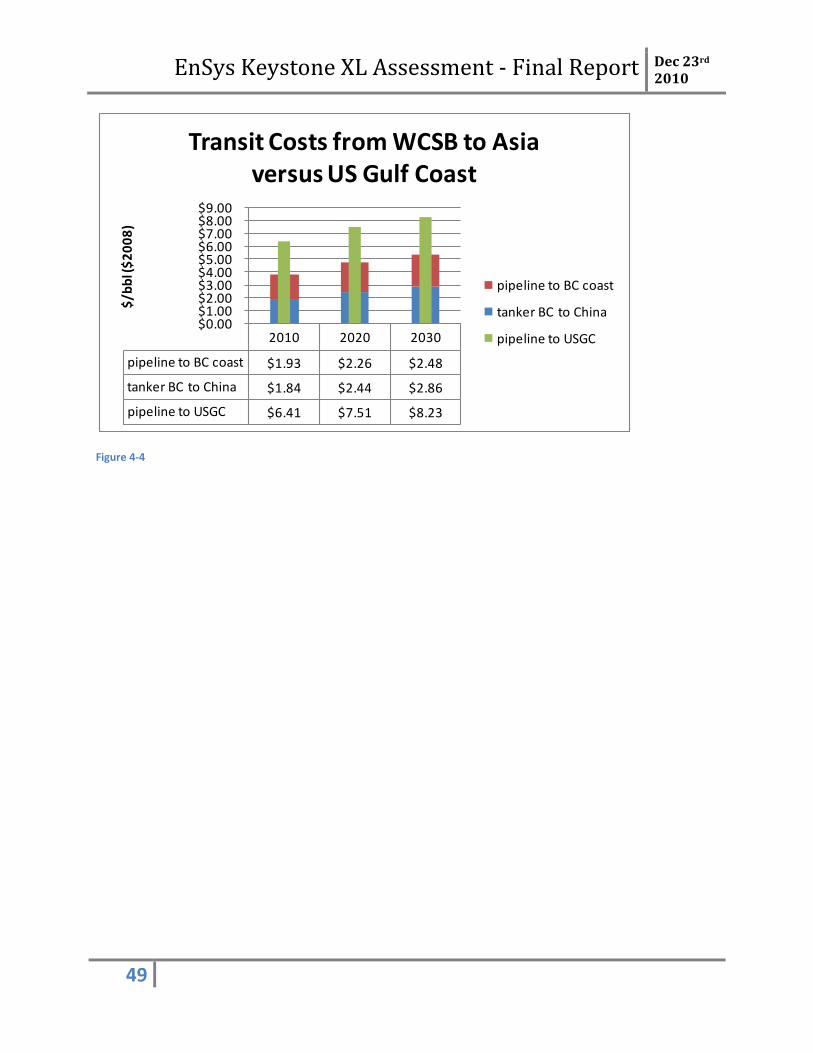
EnSys Keystone XL Assessment - Final Report Dec 23rd 2010
49
Figure 4-4
2010 2020 2030
pipeline to BC coast $1.93 $2.26 $2.48
tanker BC to China $1.84 $2.44 $2.86
pipeline to USGC $6.41 $7.51 $8.23
$0.00 $1.00 $2.00 $3.00 $4.00 $5.00 $6.00 $7.00 $8.00 $9.00
$/b
bl (
$2
00
8)
Transit Costs from WCSB to Asia versus US Gulf Coast
pipeline to BC coast
tanker BC to China
pipeline to USGC
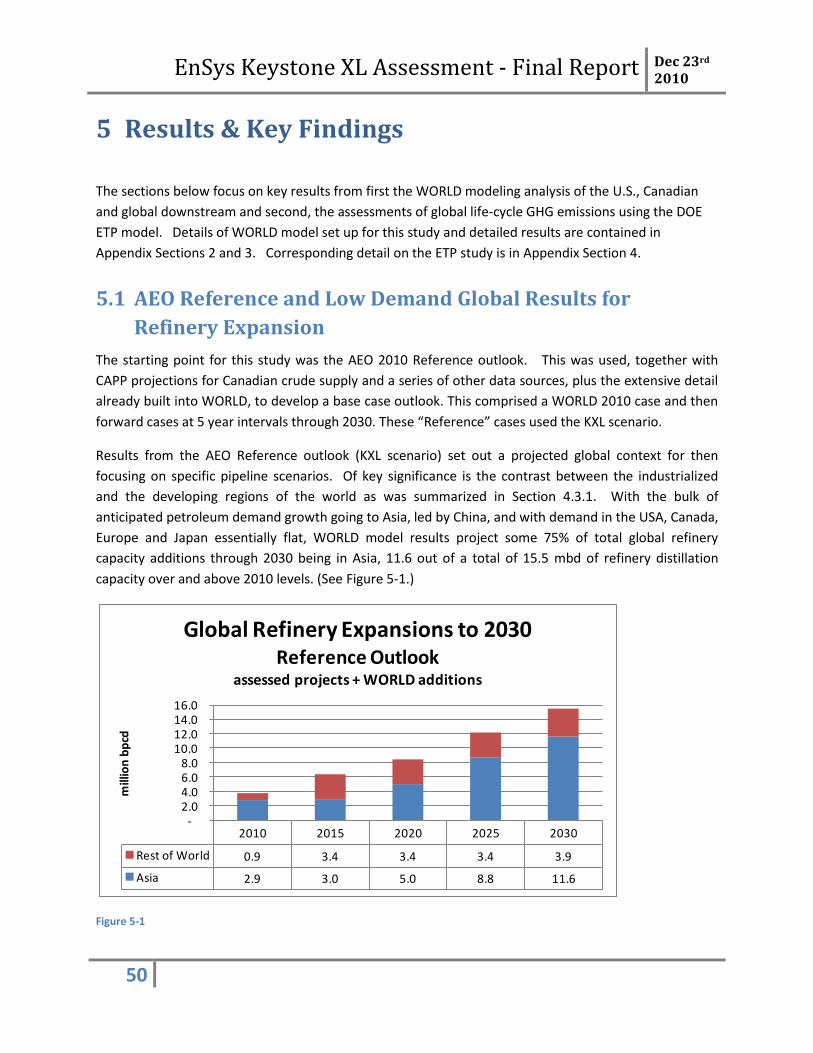
EnSys Keystone XL Assessment - Final Report Dec 23rd 2010
50
5 Results & Key Findings
The sections below focus on key results from first the WORLD modeling analysis of the U.S., Canadian
and global downstream and second, the assessments of global life-cycle GHG emissions using the DOE
ETP model. Details of WORLD model set up for this study and detailed results are contained in
Appendix Sections 2 and 3. Corresponding detail on the ETP study is in Appendix Section 4.
5.1 AEO Reference and Low Demand Global Results for
Refinery Expansion
The starting point for this study was the AEO 2010 Reference outlook. This was used, together with
CAPP projections for Canadian crude supply and a series of other data sources, plus the extensive detail
already built into WORLD, to develop a base case outlook. This comprised a WORLD 2010 case and then
forward cases at 5 year intervals through 2030. These “Reference” cases used the KXL scenario.
Results from the AEO Reference outlook (KXL scenario) set out a projected global context for then
focusing on specific pipeline scenarios. Of key significance is the contrast between the industrialized
and the developing regions of the world as was summarized in Section 4.3.1. With the bulk of
anticipated petroleum demand growth going to Asia, led by China, and with demand in the USA, Canada,
Europe and Japan essentially flat, WORLD model results project some 75% of total global refinery
capacity additions through 2030 being in Asia, 11.6 out of a total of 15.5 mbd of refinery distillation
capacity over and above 2010 levels. (See Figure 5-1.)
Figure 5-1
2010 2015 2020 2025 2030
Rest of World 0.9 3.4 3.4 3.4 3.9
Asia 2.9 3.0 5.0 8.8 11.6
-2.0 4.0 6.0 8.0
10.0 12.0 14.0 16.0
mill
ion
bp
cd
Global Refinery Expansions to 2030Reference Outlook
assessed projects + WORLD additions
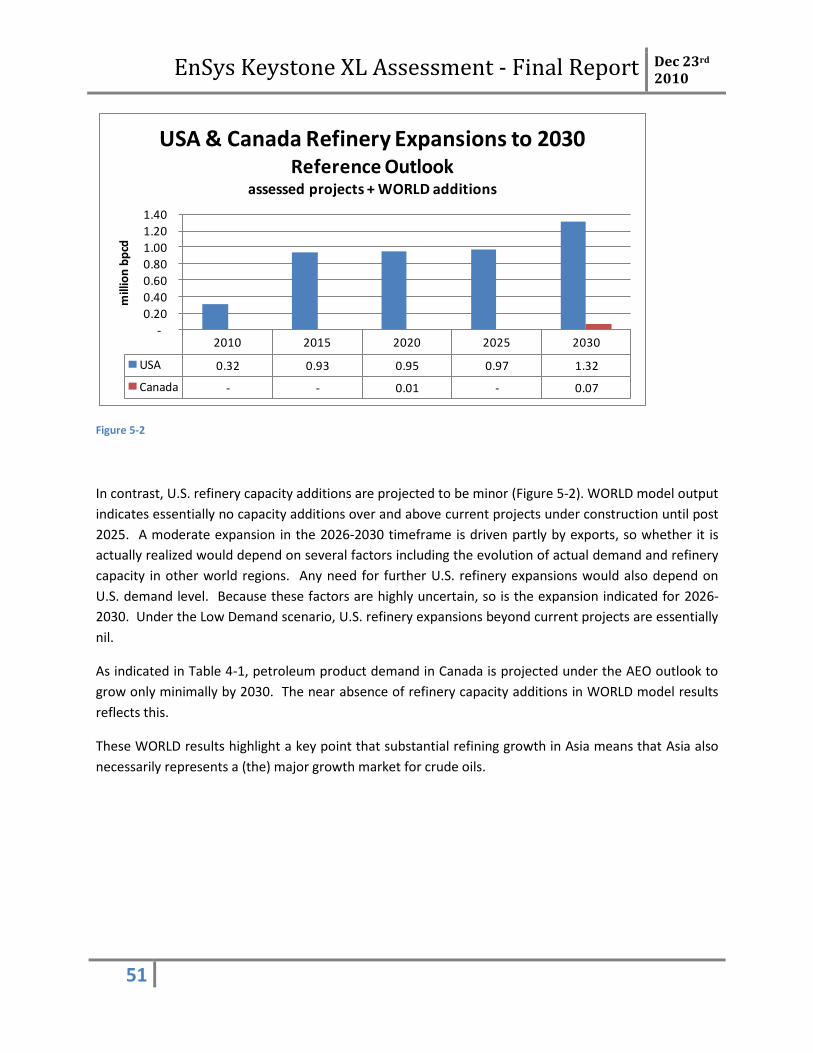
EnSys Keystone XL Assessment - Final Report Dec 23rd 2010
51
Figure 5-2
In contrast, U.S. refinery capacity additions are projected to be minor (Figure 5-2). WORLD model output
indicates essentially no capacity additions over and above current projects under construction until post
2025. A moderate expansion in the 2026-2030 timeframe is driven partly by exports, so whether it is
actually realized would depend on several factors including the evolution of actual demand and refinery
capacity in other world regions. Any need for further U.S. refinery expansions would also depend on
U.S. demand level. Because these factors are highly uncertain, so is the expansion indicated for 2026-
2030. Under the Low Demand scenario, U.S. refinery expansions beyond current projects are essentially
nil.
As indicated in Table 4-1, petroleum product demand in Canada is projected under the AEO outlook to
grow only minimally by 2030. The near absence of refinery capacity additions in WORLD model results
reflects this.
These WORLD results highlight a key point that substantial refining growth in Asia means that Asia also
necessarily represents a (the) major growth market for crude oils.
2010 2015 2020 2025 2030
USA 0.32 0.93 0.95 0.97 1.32
Canada - - 0.01 - 0.07
-
0.20
0.40
0.60
0.80
1.00
1.20
1.40
mill
ion
bp
cd
USA & Canada Refinery Expansions to 2030Reference Outlook
assessed projects + WORLD additions

EnSys Keystone XL Assessment - Final Report Dec 23rd 2010
52
5.2 Scenario Results
5.2.1 Overview
Clearly evident from the suite of WORLD model scenario cases was that the differences between the
pipeline scenarios materially impacted certain aspects of the U.S., Canadian and global refining systems
and crude and product markets but had little effect on other aspects. This is to be expected considering
what was and was not changed from scenario to scenario.
As discussed in Section 4.3.1, the differences between the 2010 AEO demand outlook and the Low
Demand outlook are significant in terms of U.S. product demand but small in terms of effects on non-
U.S. demand, world oil price, OPEC and non-OPEC supply, including that of Canadian oil sands streams.
However, within each set of seven AEO and Low Demand scenario cases, the only input assumptions
changed were those relating to US/Canadian pipeline projects and expansion options. Not changed
within each set were:
U.S. and global product demand and quality
Crudes and non-crudes supply – other than Canadian oil sands supply in the No Expansion cases
Refining base capacities, operating costs (e.g. prices for natural gas, electric power and other
purchased utilities) and the costs of investing in new plant
Transport costs.
There are three primary dimensions of comparison for the scenarios that were evaluated:
1. How results change over time for a single pipeline scenario
2. How results differ between different pipeline scenarios under the same demand outlook
3. How results differ for a given pipeline scenario but under different demand outlooks.
Section 5.2.2 presents observations on results for which little difference was detected in the second
dimension above (i.e. a comparison between pipeline scenarios for a single demand outlook). For
example, the scenario results indicate that industry parameters such as U.S. refinery crude throughputs
or product imports are essentially unaffected by changes in assumptions about pipeline availability.
However, these same results and exhibits still yield valuable insights regarding both developments over
time within a single scenario and the effects of different demand outlooks.
Section 5.2.3 focuses on those aspects of the results where pipeline scenario (the second dimension
above) led to significant differences. The impacts of changes in pipeline availability assumptions are
primarily evident in data for U.S. foreign crude sources and destinations for Canadian crude. Those
changes in scenario results primarily indicate how crude oil was rerouted in WORLD, but all within a
global system with a global demand unaffected by changes to pipeline availability in North America.
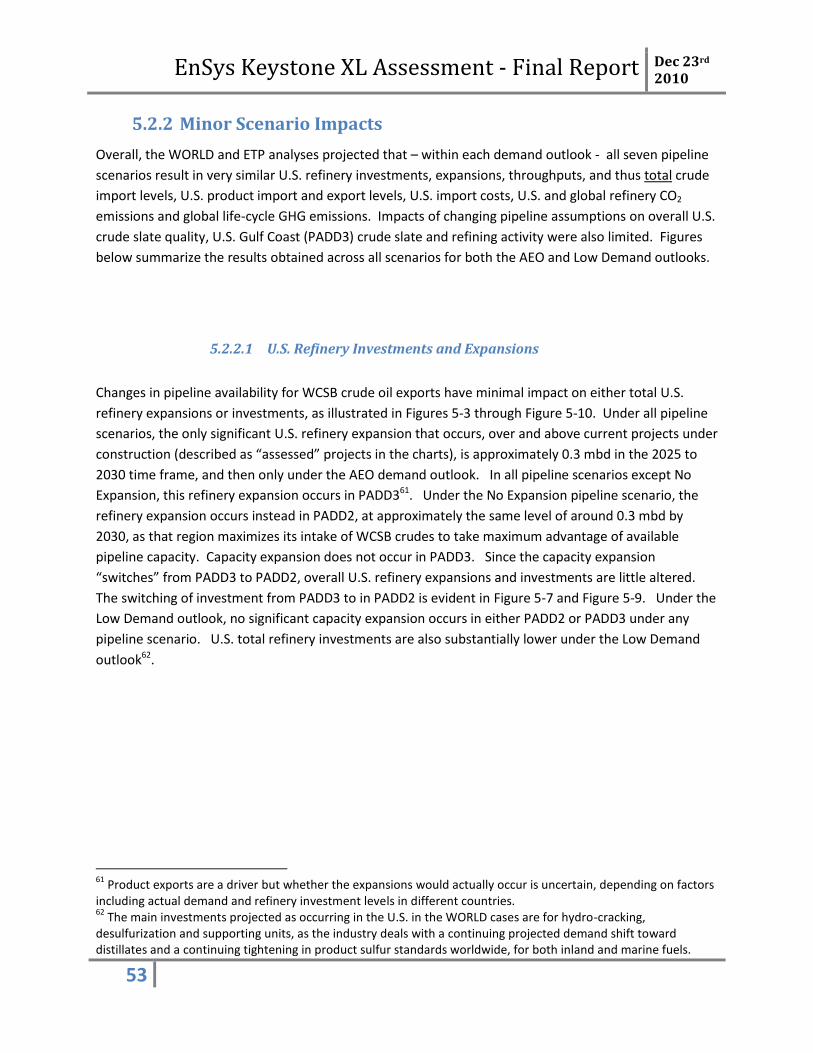
EnSys Keystone XL Assessment - Final Report Dec 23rd 2010
53
5.2.2 Minor Scenario Impacts
Overall, the WORLD and ETP analyses projected that – within each demand outlook - all seven pipeline
scenarios result in very similar U.S. refinery investments, expansions, throughputs, and thus total crude
import levels, U.S. product import and export levels, U.S. import costs, U.S. and global refinery CO2
emissions and global life-cycle GHG emissions. Impacts of changing pipeline assumptions on overall U.S.
crude slate quality, U.S. Gulf Coast (PADD3) crude slate and refining activity were also limited. Figures
below summarize the results obtained across all scenarios for both the AEO and Low Demand outlooks.
5.2.2.1 U.S. Refinery Investments and Expansions
Changes in pipeline availability for WCSB crude oil exports have minimal impact on either total U.S.
refinery expansions or investments, as illustrated in Figures 5-3 through Figure 5-10. Under all pipeline
scenarios, the only significant U.S. refinery expansion that occurs, over and above current projects under
construction (described as “assessed” projects in the charts), is approximately 0.3 mbd in the 2025 to
2030 time frame, and then only under the AEO demand outlook. In all pipeline scenarios except No
Expansion, this refinery expansion occurs in PADD361. Under the No Expansion pipeline scenario, the
refinery expansion occurs instead in PADD2, at approximately the same level of around 0.3 mbd by
2030, as that region maximizes its intake of WCSB crudes to take maximum advantage of available
pipeline capacity. Capacity expansion does not occur in PADD3. Since the capacity expansion
“switches” from PADD3 to PADD2, overall U.S. refinery expansions and investments are little altered.
The switching of investment from PADD3 to in PADD2 is evident in Figure 5-7 and Figure 5-9. Under the
Low Demand outlook, no significant capacity expansion occurs in either PADD2 or PADD3 under any
pipeline scenario. U.S. total refinery investments are also substantially lower under the Low Demand
outlook62.
61
Product exports are a driver but whether the expansions would actually occur is uncertain, depending on factors including actual demand and refinery investment levels in different countries. 62
The main investments projected as occurring in the U.S. in the WORLD cases are for hydro-cracking, desulfurization and supporting units, as the industry deals with a continuing projected demand shift toward distillates and a continuing tightening in product sulfur standards worldwide, for both inland and marine fuels.

EnSys Keystone XL Assessment - Final Report Dec 23rd 2010
54
Figure 5-4
2010 2015 2020 2025 2030
KXL 0.3 0.9 1.0 1.0 1.3
KXL+Gway 0.3 0.9 1.0 1.0 1.3
KXL No TMX 0.3 0.9 1.0 1.0 1.2
No KXL 0.3 0.9 1.0 1.0 1.3
No KXL Hi Asia 0.3 0.9 1.0 1.0 1.3
No Exp 0.3 0.9 1.0 1.0 1.4
NoExp+P2P3 0.3 0.9 1.0 1.0 1.3
-
0.2
0.4
0.6
0.8
1.0
1.2
1.4
1.6
mill
ion
bp
cd
US Refinery Expansionassessed projects + WORLD additions
2010 2015 2020 2025 2030
KXL 0.3 0.9 1.0 1.0 0.9
KXL+Gway 0.3 0.9 1.0 1.0 0.9
KXL No TMX 0.3 0.9 1.0 1.0 0.9
No KXL 0.3 0.9 1.0 1.0 0.9
No KXL Hi Asia 0.3 0.9 1.0 1.0 0.9
No Exp 0.3 0.9 1.0 1.0 1.0
NoExp+P2P3 0.3 0.9 1.0 1.0 0.9
-
0.2
0.4
0.6
0.8
1.0
1.2
1.4
1.6
mill
ion
bpcd
US Refinery Expansionassessed projects + WORLD additions
Figure 5-3
Reference Outlook
Low Demand Outlook
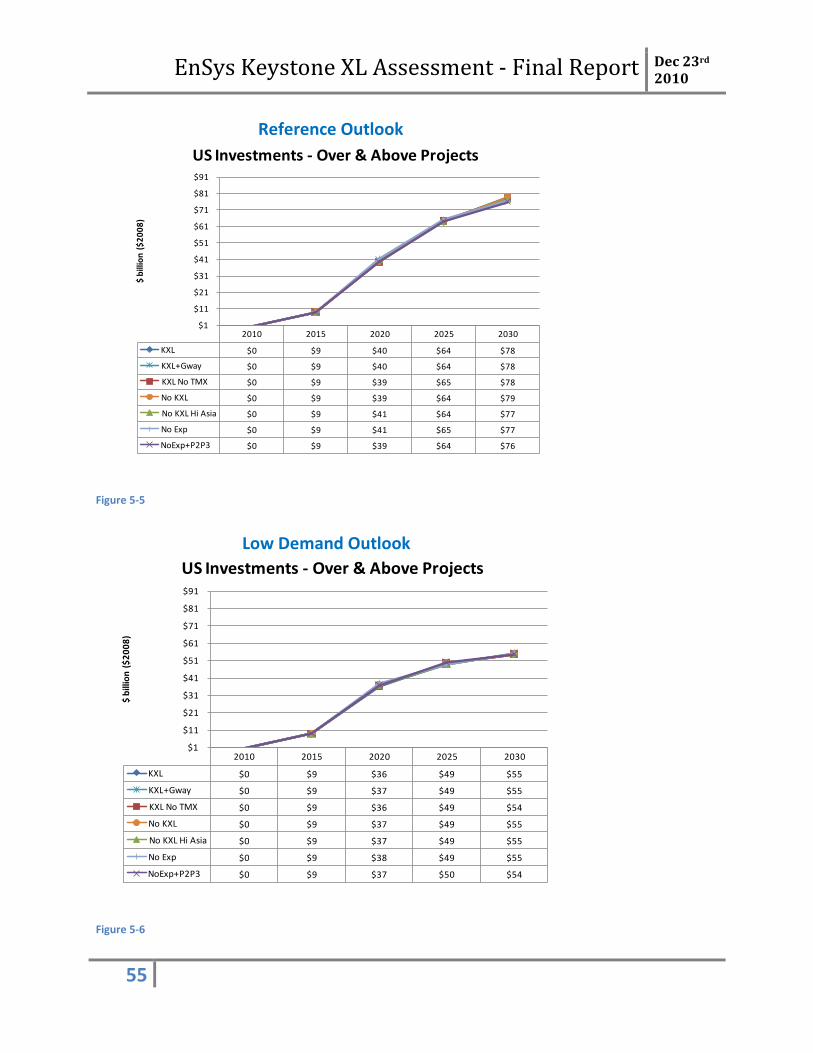
EnSys Keystone XL Assessment - Final Report Dec 23rd 2010
55
Figure 5-5
Figure 5-6
2010 2015 2020 2025 2030
KXL $0 $9 $40 $64 $78
KXL+Gway $0 $9 $40 $64 $78
KXL No TMX $0 $9 $39 $65 $78
No KXL $0 $9 $39 $64 $79
No KXL Hi Asia $0 $9 $41 $64 $77
No Exp $0 $9 $41 $65 $77
NoExp+P2P3 $0 $9 $39 $64 $76
$1
$11
$21
$31
$41
$51
$61
$71
$81
$91
$ b
illio
n (
$2
00
8)
US Investments - Over & Above Projects
2010 2015 2020 2025 2030
KXL $0 $9 $36 $49 $55
KXL+Gway $0 $9 $37 $49 $55
KXL No TMX $0 $9 $36 $49 $54
No KXL $0 $9 $37 $49 $55
No KXL Hi Asia $0 $9 $37 $49 $55
No Exp $0 $9 $38 $49 $55
NoExp+P2P3 $0 $9 $37 $50 $54
$1
$11
$21
$31
$41
$51
$61
$71
$81
$91
$ b
illio
n (
$2
00
8)
US Investments - Over & Above Projects
Reference Outlook
Low Demand Outlook
EnSys Keystone XL Assessment - Final Report Dec 23rd 2010
56
Figure 5-7
Figure 5-8
2010 2015 2020 2025 2030
KXL $0 $1 $3 $9 $12
KXL+Gway $0 $1 $2 $10 $12
KXL No TMX $0 $1 $3 $10 $11
No KXL $0 $1 $3 $10 $11
No KXL Hi Asia $0 $1 $2 $10 $12
No Exp $0 $1 $5 $12 $12
NoExp+P2P3 $0 $1 $3 $9 $9
$-
$2
$4
$6
$8
$10
$12
$14
$ b
illio
n (
$2
00
8)
PADD-2 Investments - Over & Above Projects
2010 2015 2020 2025 2030
KXL $0 $1 $2 $6 $3
KXL+Gway $0 $1 $2 $5 $3
KXL No TMX $0 $1 $3 $6 $3
No KXL $0 $1 $3 $6 $3
No KXL Hi Asia $0 $1 $2 $5 $3
No Exp $0 $1 $4 $7 $4
NoExp+P2P3 $0 $1 $3 $6 $3
$-
$2
$4
$6
$8
$10
$12
$14
$ b
illio
n (
$2
00
8)
PADD-2 Investments - Over & Above Projects
Reference Outlook
Low Demand Outlook
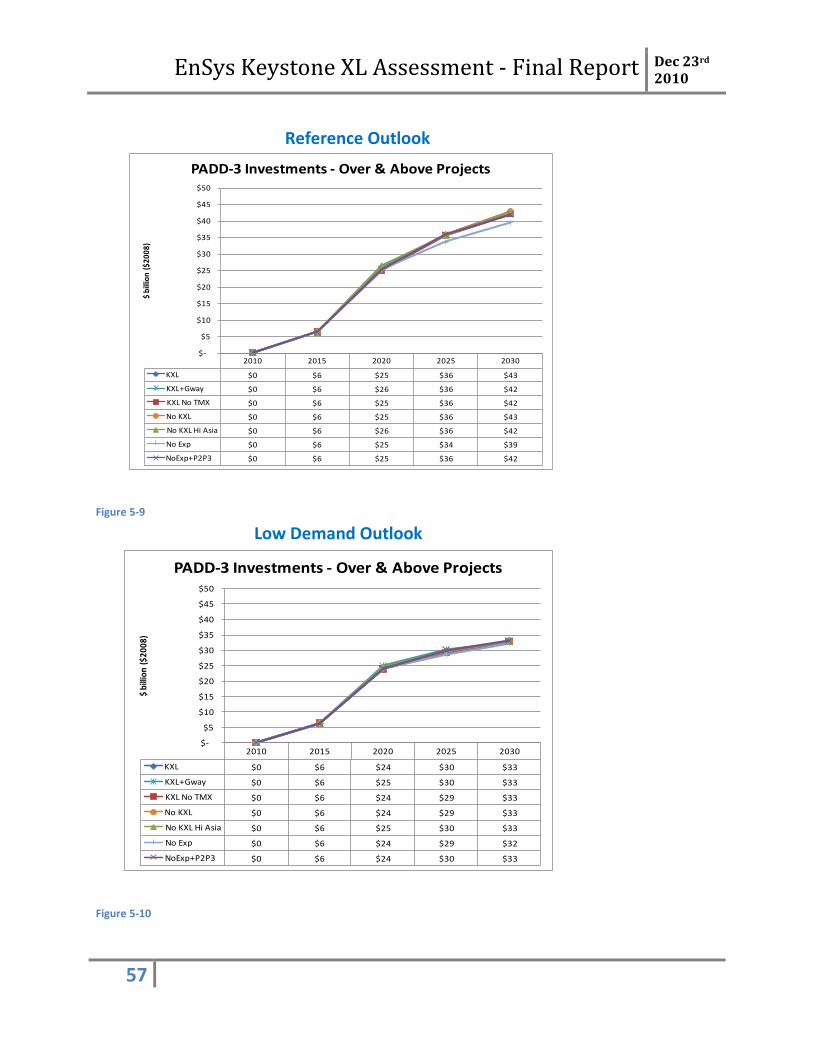
EnSys Keystone XL Assessment - Final Report Dec 23rd 2010
57
Figure 5-9
Figure 5-10
2010 2015 2020 2025 2030
KXL $0 $6 $25 $36 $43
KXL+Gway $0 $6 $26 $36 $42
KXL No TMX $0 $6 $25 $36 $42
No KXL $0 $6 $25 $36 $43
No KXL Hi Asia $0 $6 $26 $36 $42
No Exp $0 $6 $25 $34 $39
NoExp+P2P3 $0 $6 $25 $36 $42
$-
$5
$10
$15
$20
$25
$30
$35
$40
$45
$50
$ b
illio
n (
$2
00
8)
PADD-3 Investments - Over & Above Projects
2010 2015 2020 2025 2030
KXL $0 $6 $24 $30 $33
KXL+Gway $0 $6 $25 $30 $33
KXL No TMX $0 $6 $24 $29 $33
No KXL $0 $6 $24 $29 $33
No KXL Hi Asia $0 $6 $25 $30 $33
No Exp $0 $6 $24 $29 $32
NoExp+P2P3 $0 $6 $24 $30 $33
$-
$5
$10
$15
$20
$25
$30
$35
$40
$45
$50
$ bi
llion
($2
008)
PADD-3 Investments - Over & Above Projects
Reference Outlook
Low Demand Outlook
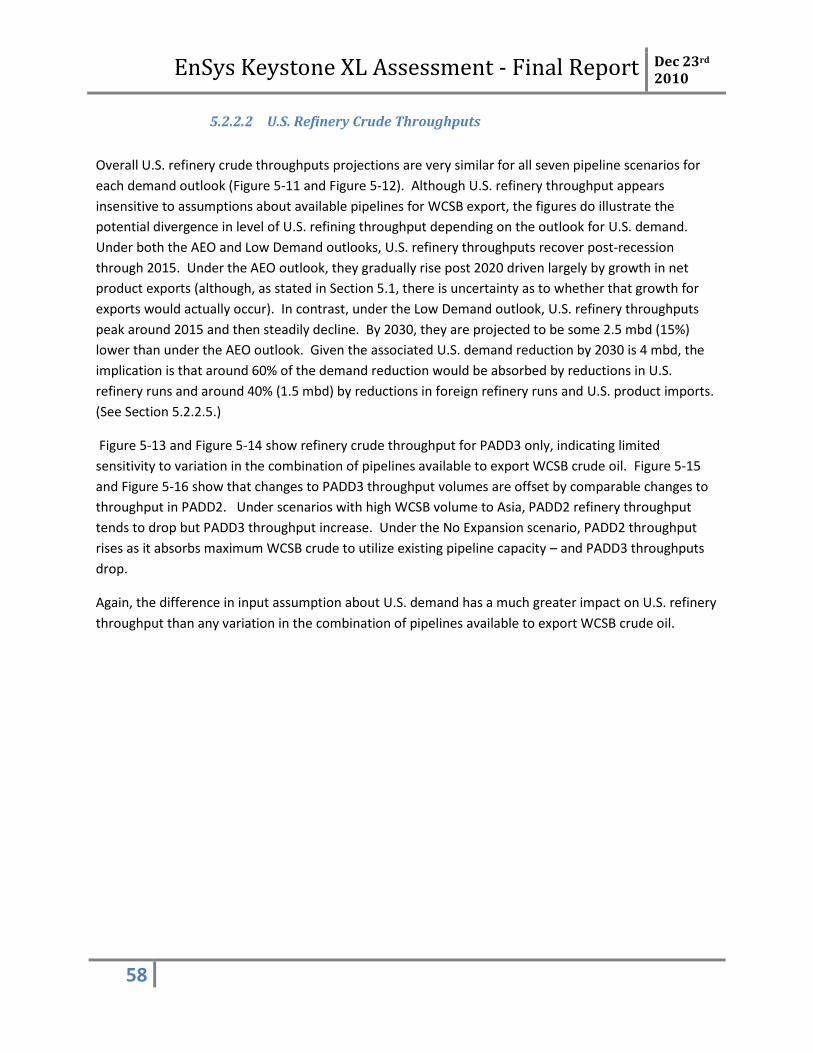
EnSys Keystone XL Assessment - Final Report Dec 23rd 2010
58
5.2.2.2 U.S. Refinery Crude Throughputs
Overall U.S. refinery crude throughputs projections are very similar for all seven pipeline scenarios for
each demand outlook (Figure 5-11 and Figure 5-12). Although U.S. refinery throughput appears
insensitive to assumptions about available pipelines for WCSB export, the figures do illustrate the
potential divergence in level of U.S. refining throughput depending on the outlook for U.S. demand.
Under both the AEO and Low Demand outlooks, U.S. refinery throughputs recover post-recession
through 2015. Under the AEO outlook, they gradually rise post 2020 driven largely by growth in net
product exports (although, as stated in Section 5.1, there is uncertainty as to whether that growth for
exports would actually occur). In contrast, under the Low Demand outlook, U.S. refinery throughputs
peak around 2015 and then steadily decline. By 2030, they are projected to be some 2.5 mbd (15%)
lower than under the AEO outlook. Given the associated U.S. demand reduction by 2030 is 4 mbd, the
implication is that around 60% of the demand reduction would be absorbed by reductions in U.S.
refinery runs and around 40% (1.5 mbd) by reductions in foreign refinery runs and U.S. product imports.
(See Section 5.2.2.5.)
Figure 5-13 and Figure 5-14 show refinery crude throughput for PADD3 only, indicating limited
sensitivity to variation in the combination of pipelines available to export WCSB crude oil. Figure 5-15
and Figure 5-16 show that changes to PADD3 throughput volumes are offset by comparable changes to
throughput in PADD2. Under scenarios with high WCSB volume to Asia, PADD2 refinery throughput
tends to drop but PADD3 throughput increase. Under the No Expansion scenario, PADD2 throughput
rises as it absorbs maximum WCSB crude to utilize existing pipeline capacity – and PADD3 throughputs
drop.
Again, the difference in input assumption about U.S. demand has a much greater impact on U.S. refinery
throughput than any variation in the combination of pipelines available to export WCSB crude oil.
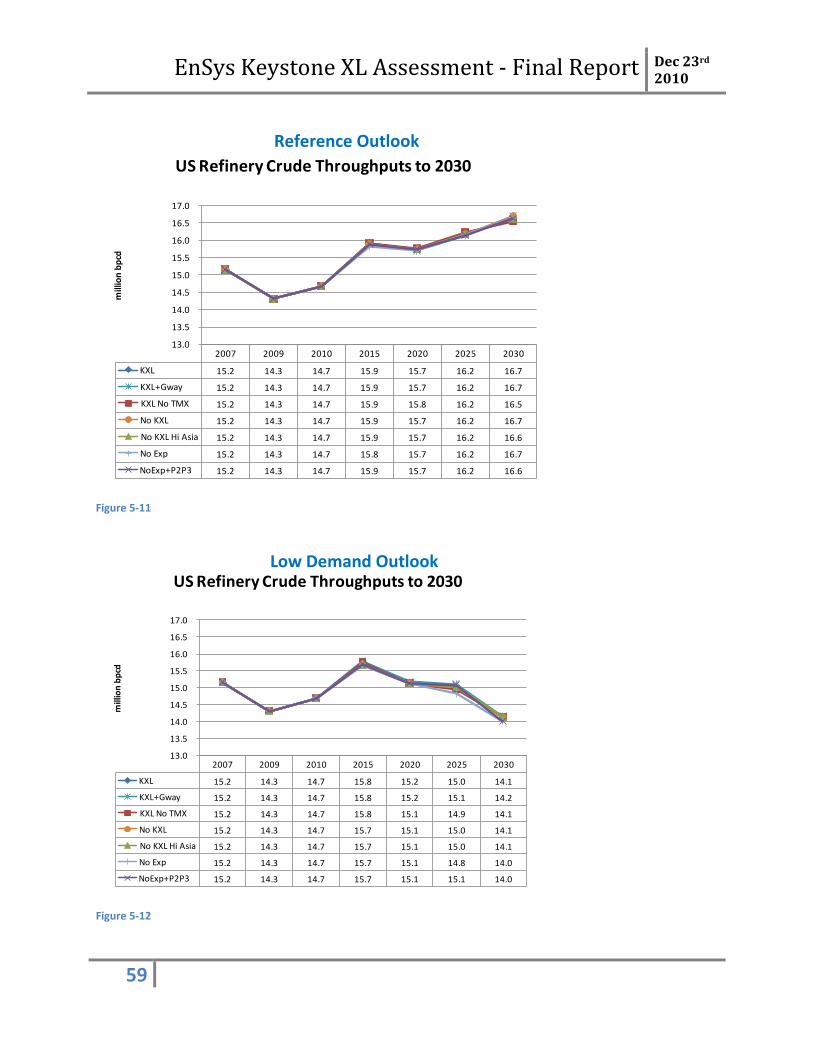
EnSys Keystone XL Assessment - Final Report Dec 23rd 2010
59
Figure 5-11
Figure 5-12
2007 2009 2010 2015 2020 2025 2030
KXL 15.2 14.3 14.7 15.9 15.7 16.2 16.7
KXL+Gway 15.2 14.3 14.7 15.9 15.7 16.2 16.7
KXL No TMX 15.2 14.3 14.7 15.9 15.8 16.2 16.5
No KXL 15.2 14.3 14.7 15.9 15.7 16.2 16.7
No KXL Hi Asia 15.2 14.3 14.7 15.9 15.7 16.2 16.6
No Exp 15.2 14.3 14.7 15.8 15.7 16.2 16.7
NoExp+P2P3 15.2 14.3 14.7 15.9 15.7 16.2 16.6
13.0
13.5
14.0
14.5
15.0
15.5
16.0
16.5
17.0
mill
ion
bp
cd
US Refinery Crude Throughputs to 2030Reference & Scenarios
2007 2009 2010 2015 2020 2025 2030
KXL 15.2 14.3 14.7 15.8 15.2 15.0 14.1
KXL+Gway 15.2 14.3 14.7 15.8 15.2 15.1 14.2
KXL No TMX 15.2 14.3 14.7 15.8 15.1 14.9 14.1
No KXL 15.2 14.3 14.7 15.7 15.1 15.0 14.1
No KXL Hi Asia 15.2 14.3 14.7 15.7 15.1 15.0 14.1
No Exp 15.2 14.3 14.7 15.7 15.1 14.8 14.0
NoExp+P2P3 15.2 14.3 14.7 15.7 15.1 15.1 14.0
13.0
13.5
14.0
14.5
15.0
15.5
16.0
16.5
17.0
mill
ion
bp
cd
US Refinery Crude Throughputs to 2030Reference & Scenarios
Reference Outlook
Low Demand Outlook

EnSys Keystone XL Assessment - Final Report Dec 23rd 2010
60
Figure 5-13
Figure 5-14
2010 2015 2020 2025 2030
KXL 7.1 7.9 8.1 8.2 8.5
KXL+Gway 7.1 7.9 8.1 8.2 8.5
KXL No TMX 7.1 8.0 8.2 8.2 8.3
No KXL 7.1 7.9 8.1 8.2 8.5
No KXL Hi Asia 7.1 7.9 8.1 8.2 8.4
No Exp 7.1 7.8 8.0 8.1 8.2
NoExp+P2P3 7.1 7.9 8.1 8.2 8.4
6.5
7.0
7.5
8.0
8.5
9.0
mill
ion
bp
cd
US PADD-3 Refinery Crude Throughputs to 2030Reference & Scenarios
2010 2015 2020 2025 2030
KXL 7.1 7.9 7.9 7.6 7.2
KXL+Gway 7.1 7.9 8.0 7.9 7.0
KXL No TMX 7.1 7.9 7.9 7.5 7.1
No KXL 7.1 7.8 7.8 7.6 7.2
No KXL Hi Asia 7.1 7.8 7.9 7.7 7.0
No Exp 7.1 7.8 7.8 7.3 7.0
NoExp+P2P3 7.1 7.8 7.8 7.7 7.2
6.5
7.0
7.5
8.0
8.5
9.0
mill
ion
bp
cd
US PADD-3 Refinery Crude Throughputs to 2030Reference & Scenarios
Reference Outlook
Low Demand Outlook
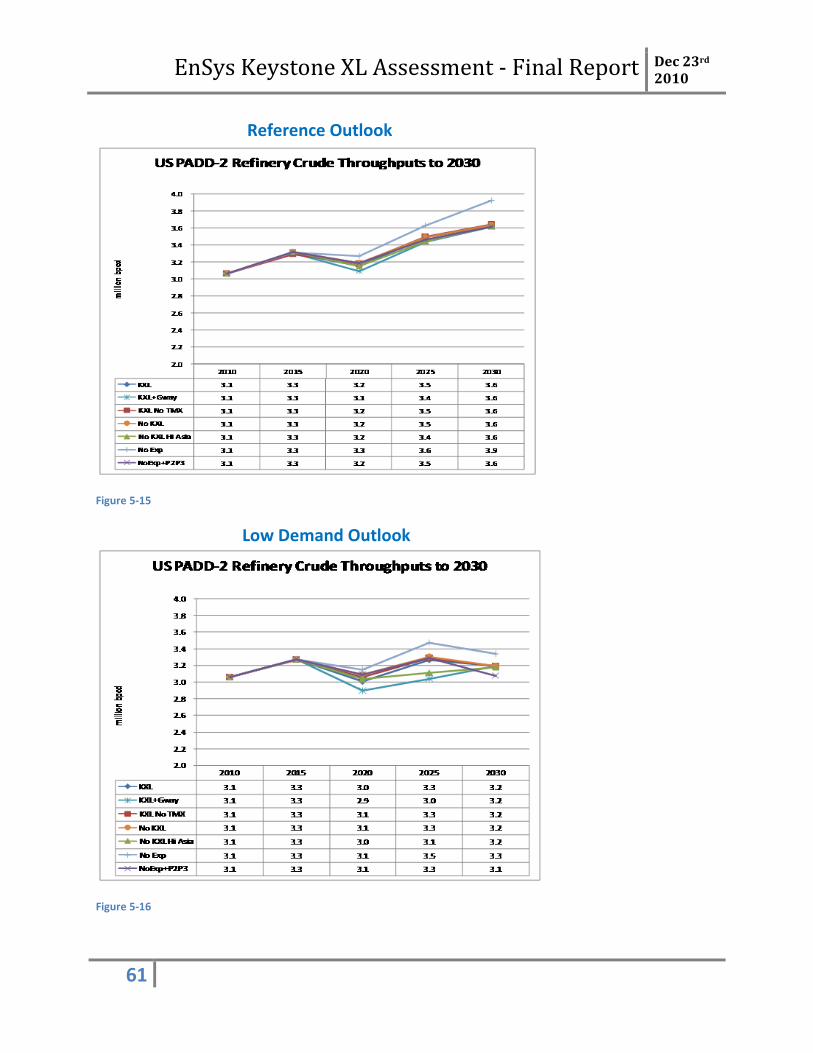
EnSys Keystone XL Assessment - Final Report Dec 23rd 2010
61
Figure 5-15
Figure 5-16
Reference Outlook
Low Demand Outlook
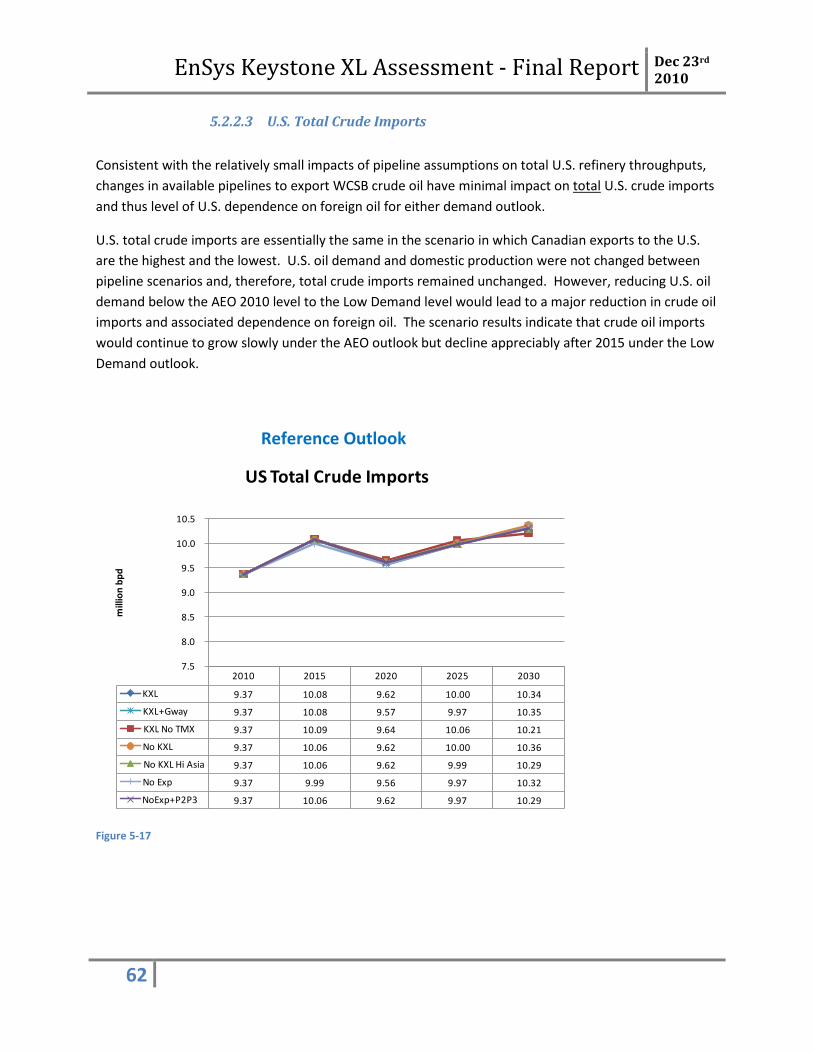
EnSys Keystone XL Assessment - Final Report Dec 23rd 2010
62
5.2.2.3 U.S. Total Crude Imports
Consistent with the relatively small impacts of pipeline assumptions on total U.S. refinery throughputs,
changes in available pipelines to export WCSB crude oil have minimal impact on total U.S. crude imports
and thus level of U.S. dependence on foreign oil for either demand outlook.
U.S. total crude imports are essentially the same in the scenario in which Canadian exports to the U.S.
are the highest and the lowest. U.S. oil demand and domestic production were not changed between
pipeline scenarios and, therefore, total crude imports remained unchanged. However, reducing U.S. oil
demand below the AEO 2010 level to the Low Demand level would lead to a major reduction in crude oil
imports and associated dependence on foreign oil. The scenario results indicate that crude oil imports
would continue to grow slowly under the AEO outlook but decline appreciably after 2015 under the Low
Demand outlook.
Figure 5-17
2010 2015 2020 2025 2030
KXL 9.37 10.08 9.62 10.00 10.34
KXL+Gway 9.37 10.08 9.57 9.97 10.35
KXL No TMX 9.37 10.09 9.64 10.06 10.21
No KXL 9.37 10.06 9.62 10.00 10.36
No KXL Hi Asia 9.37 10.06 9.62 9.99 10.29
No Exp 9.37 9.99 9.56 9.97 10.32
NoExp+P2P3 9.37 10.06 9.62 9.97 10.29
7.5
8.0
8.5
9.0
9.5
10.0
10.5
mill
ion
bp
d
US Total Crude ImportsReference & Scenarios
Reference Outlook

EnSys Keystone XL Assessment - Final Report Dec 23rd 2010
63
Figure 5-18
5.2.2.4 U.S. Crude Slate Quality
Figure 5-19 and Figure 5-20 indicate that U.S. crude slate quality63 would be modestly impacted by
changes in the combination of pipelines assumed to be available for WCSB export. The maximum
difference in any time period across a whole range of scenarios is 0.5 degrees API. Outside the No
Expansion scenarios, U.S. crude slate is projected as lightest in those pipeline scenarios that assume
major pipeline expansions to the BC coast and thence Asia and heaviest when there is limited or no
expansion west. Generally, these two extremes are represented by the No KXL High Asia and the KXL
No TMX scenarios. High volumes of (heavy) WCSB crudes flowing to Asia mean less to the USA which
replaces them with somewhat lighter crudes. When pipeline expansions west are limited, the opposite
occurs; higher volumes of heavy WCSB crudes flow to U.S. refineries.
The results for PADD3 indicate the same effect, namely that lower assumed pipeline availability west to
Asia leads to more WCSB heavy crudes coming into PADD3, hence a heavier crude slate, and vice versa.
63
The portfolio of crude oils refined in a single refinery or the U.S. as a whole is described as the crude slate, and its quality is commonly expressed in terms of API gravity and secondarily sulfur content.
2010 2015 2020 2025 2030
KXL 9.37 9.98 9.10 8.92 7.92
KXL+Gway 9.37 9.98 9.12 9.01 7.97
KXL No TMX 9.37 9.96 9.07 8.85 7.94
No KXL 9.37 9.88 9.08 8.91 7.92
No KXL Hi Asia 9.37 9.88 9.08 8.92 7.95
No Exp 9.37 9.86 9.07 8.72 7.82
NoExp+P2P3 9.37 9.88 9.08 8.97 7.82
7.5
8.0
8.5
9.0
9.5
10.0
10.5
mill
ion
bp
d
US Total Crude ImportsReference & Scenarios
Low Demand Outlook
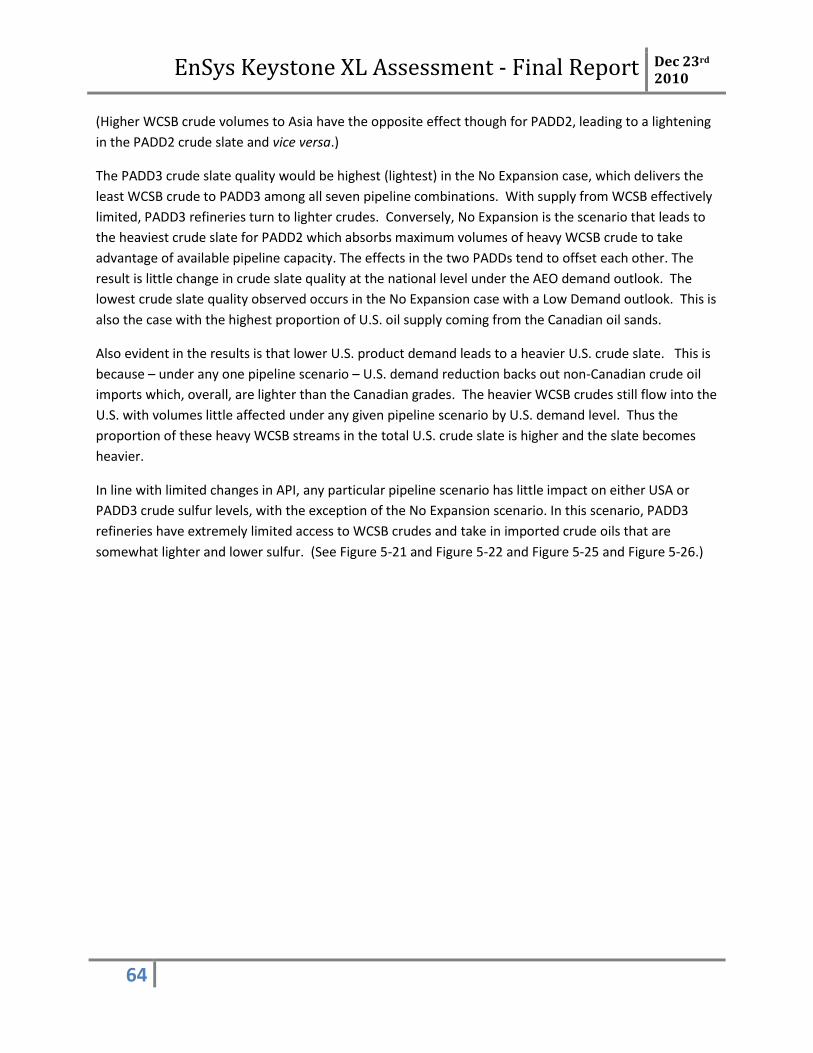
EnSys Keystone XL Assessment - Final Report Dec 23rd 2010
64
(Higher WCSB crude volumes to Asia have the opposite effect though for PADD2, leading to a lightening
in the PADD2 crude slate and vice versa.)
The PADD3 crude slate quality would be highest (lightest) in the No Expansion case, which delivers the
least WCSB crude to PADD3 among all seven pipeline combinations. With supply from WCSB effectively
limited, PADD3 refineries turn to lighter crudes. Conversely, No Expansion is the scenario that leads to
the heaviest crude slate for PADD2 which absorbs maximum volumes of heavy WCSB crude to take
advantage of available pipeline capacity. The effects in the two PADDs tend to offset each other. The
result is little change in crude slate quality at the national level under the AEO demand outlook. The
lowest crude slate quality observed occurs in the No Expansion case with a Low Demand outlook. This is
also the case with the highest proportion of U.S. oil supply coming from the Canadian oil sands.
Also evident in the results is that lower U.S. product demand leads to a heavier U.S. crude slate. This is
because – under any one pipeline scenario – U.S. demand reduction backs out non-Canadian crude oil
imports which, overall, are lighter than the Canadian grades. The heavier WCSB crudes still flow into the
U.S. with volumes little affected under any given pipeline scenario by U.S. demand level. Thus the
proportion of these heavy WCSB streams in the total U.S. crude slate is higher and the slate becomes
heavier.
In line with limited changes in API, any particular pipeline scenario has little impact on either USA or
PADD3 crude sulfur levels, with the exception of the No Expansion scenario. In this scenario, PADD3
refineries have extremely limited access to WCSB crudes and take in imported crude oils that are
somewhat lighter and lower sulfur. (See Figure 5-21 and Figure 5-22 and Figure 5-25 and Figure 5-26.)
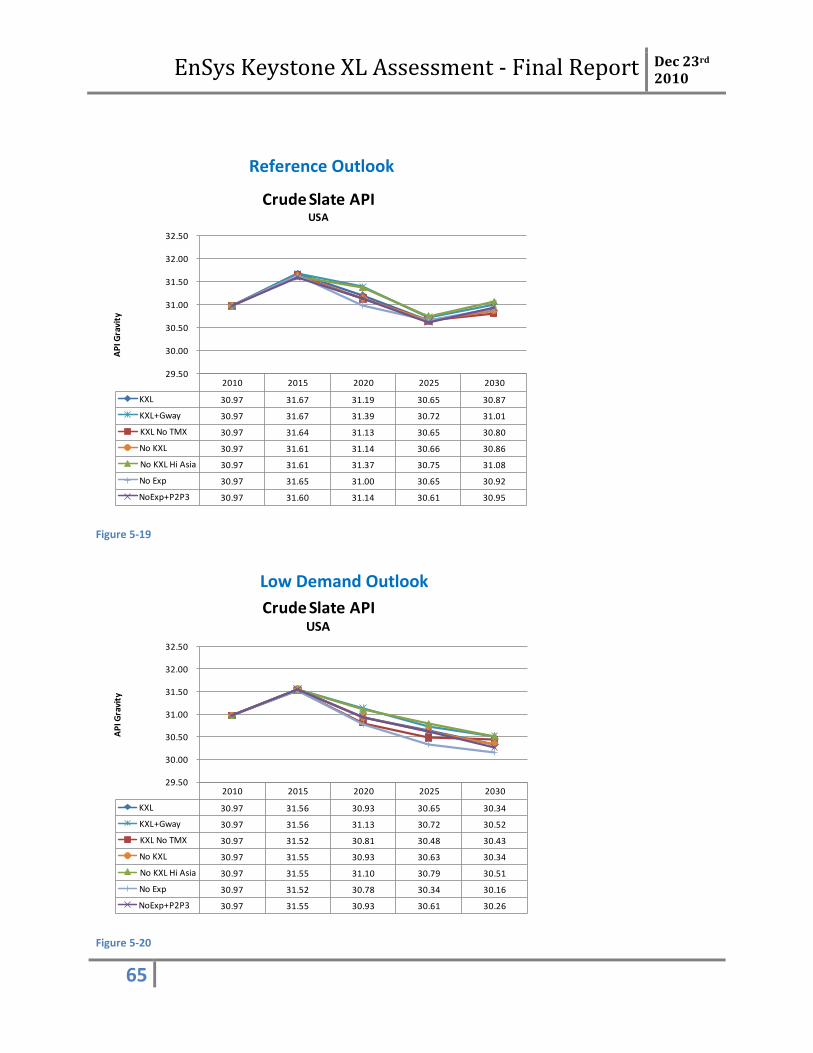
EnSys Keystone XL Assessment - Final Report Dec 23rd 2010
65
Figure 5-19
Figure 5-20
2010 2015 2020 2025 2030
KXL 30.97 31.67 31.19 30.65 30.87
KXL+Gway 30.97 31.67 31.39 30.72 31.01
KXL No TMX 30.97 31.64 31.13 30.65 30.80
No KXL 30.97 31.61 31.14 30.66 30.86
No KXL Hi Asia 30.97 31.61 31.37 30.75 31.08
No Exp 30.97 31.65 31.00 30.65 30.92
NoExp+P2P3 30.97 31.60 31.14 30.61 30.95
29.50
30.00
30.50
31.00
31.50
32.00
32.50
AP
I Gra
vity
Crude Slate APIUSA
2010 2015 2020 2025 2030
KXL 30.97 31.56 30.93 30.65 30.34
KXL+Gway 30.97 31.56 31.13 30.72 30.52
KXL No TMX 30.97 31.52 30.81 30.48 30.43
No KXL 30.97 31.55 30.93 30.63 30.34
No KXL Hi Asia 30.97 31.55 31.10 30.79 30.51
No Exp 30.97 31.52 30.78 30.34 30.16
NoExp+P2P3 30.97 31.55 30.93 30.61 30.26
29.50
30.00
30.50
31.00
31.50
32.00
32.50
AP
I Gra
vity
Crude Slate APIUSA
Reference Outlook
Low Demand Outlook

EnSys Keystone XL Assessment - Final Report Dec 23rd 2010
66
Figure 5-21
Figure 5-22
2010 2015 2020 2025 2030
KXL 1.40% 1.36% 1.37% 1.51% 1.50%
KXL+Gway 1.40% 1.36% 1.36% 1.52% 1.49%
KXL No TMX 1.40% 1.36% 1.36% 1.49% 1.46%
No KXL 1.40% 1.37% 1.38% 1.51% 1.50%
No KXL Hi Asia 1.40% 1.37% 1.35% 1.51% 1.48%
No Exp 1.40% 1.37% 1.38% 1.44% 1.42%
NoExp+P2P3 1.40% 1.37% 1.38% 1.53% 1.50%
1.00%
1.20%
1.40%
1.60%
1.80%
2.00%
Wt
% S
ulp
hu
r
Crude Slate SulphurUSA
2010 2015 2020 2025 2030
KXL 1.40% 1.36% 1.40% 1.49% 1.51%
KXL+Gway 1.40% 1.36% 1.38% 1.49% 1.50%
KXL No TMX 1.40% 1.37% 1.40% 1.48% 1.47%
No KXL 1.40% 1.38% 1.39% 1.49% 1.51%
No KXL Hi Asia 1.40% 1.38% 1.38% 1.49% 1.50%
No Exp 1.40% 1.38% 1.40% 1.50% 1.49%
NoExp+P2P3 1.40% 1.38% 1.39% 1.50% 1.55%
1.00%
1.20%
1.40%
1.60%
1.80%
2.00%
Wt
% S
ulp
hu
r
Crude Slate SulphurUSA
Reference Outlook
Low Demand Outlook

EnSys Keystone XL Assessment - Final Report Dec 23rd 2010
67
Figure 5-23
Figure 5-24
2010 2015 2020 2025 2030
KXL 30.38 31.84 31.89 30.77 30.15
KXL+Gway 30.38 31.84 32.08 30.71 30.52
KXL No TMX 30.38 31.79 31.85 30.81 30.04
No KXL 30.38 31.89 31.98 30.86 30.20
No KXL Hi Asia 30.38 31.89 32.30 30.79 30.59
No Exp 30.38 32.01 32.08 31.60 31.29
NoExp+P2P3 30.38 31.89 31.98 30.74 30.36
29.0
29.5
30.0
30.5
31.0
31.5
32.0
32.5
33.0
AP
I Gra
vity
Crude Slate APIPADD-3
2010 2015 2020 2025 2030
KXL 30.38 31.64 31.75 31.12 29.54
KXL+Gway 30.38 31.64 32.05 31.30 29.95
KXL No TMX 30.38 31.60 31.45 30.86 29.62
No KXL 30.38 31.75 31.81 31.10 29.54
No KXL Hi Asia 30.38 31.75 32.05 31.57 29.90
No Exp 30.38 31.79 31.88 31.45 30.58
NoExp+P2P3 30.38 31.75 31.81 31.05 29.55
29.0
29.5
30.0
30.5
31.0
31.5
32.0
32.5
33.0
AP
I Gra
vity
Crude Slate APIPADD-3
Reference Outlook
Reference Outlook
Low Demand Outlook

EnSys Keystone XL Assessment - Final Report Dec 23rd 2010
68
Figure 5-25
Figure 5-26
2010 2015 2020 2025 2030
KXL 1.67% 1.47% 1.47% 1.72% 1.72%
KXL+Gway 1.67% 1.47% 1.45% 1.73% 1.69%
KXL No TMX 1.67% 1.47% 1.44% 1.67% 1.65%
No KXL 1.67% 1.48% 1.46% 1.72% 1.72%
No KXL Hi Asia 1.67% 1.48% 1.43% 1.72% 1.69%
No Exp 1.67% 1.47% 1.43% 1.55% 1.58%
NoExp+P2P3 1.67% 1.48% 1.46% 1.74% 1.72%
1.00%
1.20%
1.40%
1.60%
1.80%
2.00%
Wt
% S
ulp
hu
r
Crude Slate SulphurPADD-3
2010 2015 2020 2025 2030
KXL 1.67% 1.48% 1.47% 1.62% 1.63%
KXL+Gway 1.67% 1.48% 1.45% 1.60% 1.62%
KXL No TMX 1.67% 1.48% 1.48% 1.61% 1.55%
No KXL 1.67% 1.50% 1.46% 1.63% 1.63%
No KXL Hi Asia 1.67% 1.50% 1.45% 1.59% 1.62%
No Exp 1.67% 1.48% 1.46% 1.57% 1.59%
NoExp+P2P3 1.67% 1.50% 1.46% 1.65% 1.67%
1.00%
1.20%
1.40%
1.60%
1.80%
2.00%
Wt
% S
ulp
hu
r
Crude Slate SulphurPADD-3
Low Demand Outlook
Reference Outlook
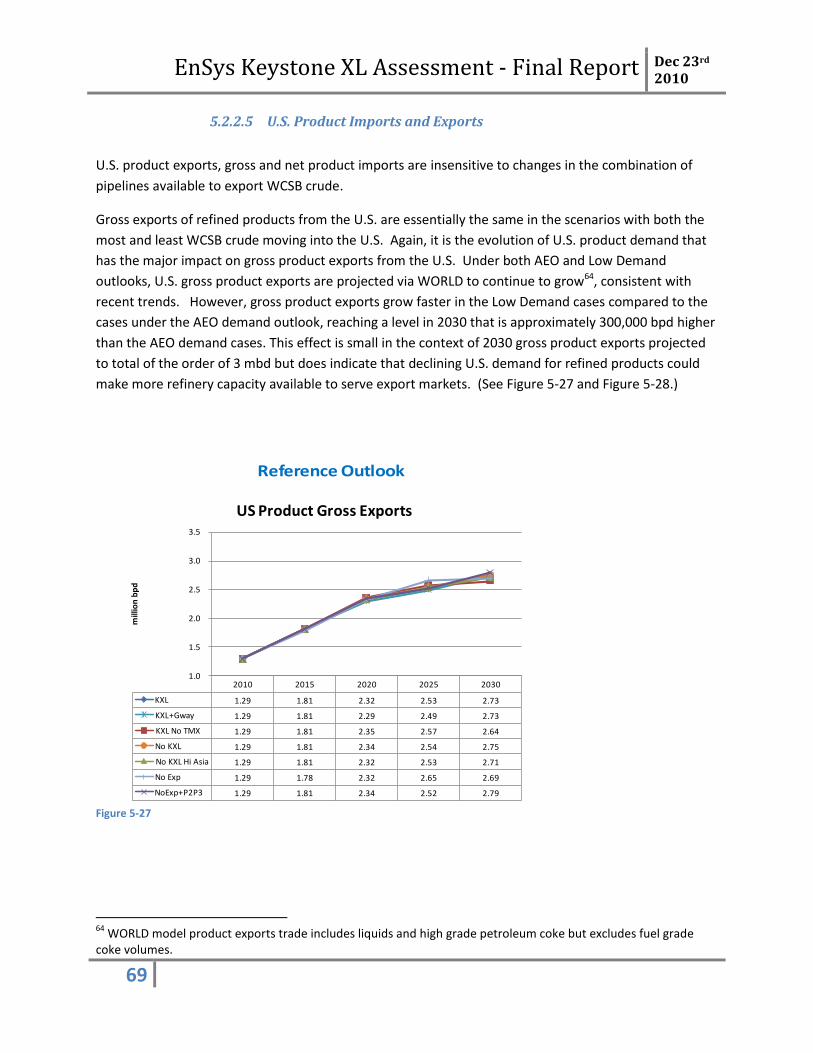
EnSys Keystone XL Assessment - Final Report Dec 23rd 2010
69
5.2.2.5 U.S. Product Imports and Exports
U.S. product exports, gross and net product imports are insensitive to changes in the combination of
pipelines available to export WCSB crude.
Gross exports of refined products from the U.S. are essentially the same in the scenarios with both the
most and least WCSB crude moving into the U.S. Again, it is the evolution of U.S. product demand that
has the major impact on gross product exports from the U.S. Under both AEO and Low Demand
outlooks, U.S. gross product exports are projected via WORLD to continue to grow64, consistent with
recent trends. However, gross product exports grow faster in the Low Demand cases compared to the
cases under the AEO demand outlook, reaching a level in 2030 that is approximately 300,000 bpd higher
than the AEO demand cases. This effect is small in the context of 2030 gross product exports projected
to total of the order of 3 mbd but does indicate that declining U.S. demand for refined products could
make more refinery capacity available to serve export markets. (See Figure 5-27 and Figure 5-28.)
Figure 5-27
64
WORLD model product exports trade includes liquids and high grade petroleum coke but excludes fuel grade coke volumes.
2010 2015 2020 2025 2030
KXL 1.29 1.81 2.32 2.53 2.73
KXL+Gway 1.29 1.81 2.29 2.49 2.73
KXL No TMX 1.29 1.81 2.35 2.57 2.64
No KXL 1.29 1.81 2.34 2.54 2.75
No KXL Hi Asia 1.29 1.81 2.32 2.53 2.71
No Exp 1.29 1.78 2.32 2.65 2.69
NoExp+P2P3 1.29 1.81 2.34 2.52 2.79
1.0
1.5
2.0
2.5
3.0
3.5
mill
ion
bp
d
US Product Gross Exports
Reference Outlook
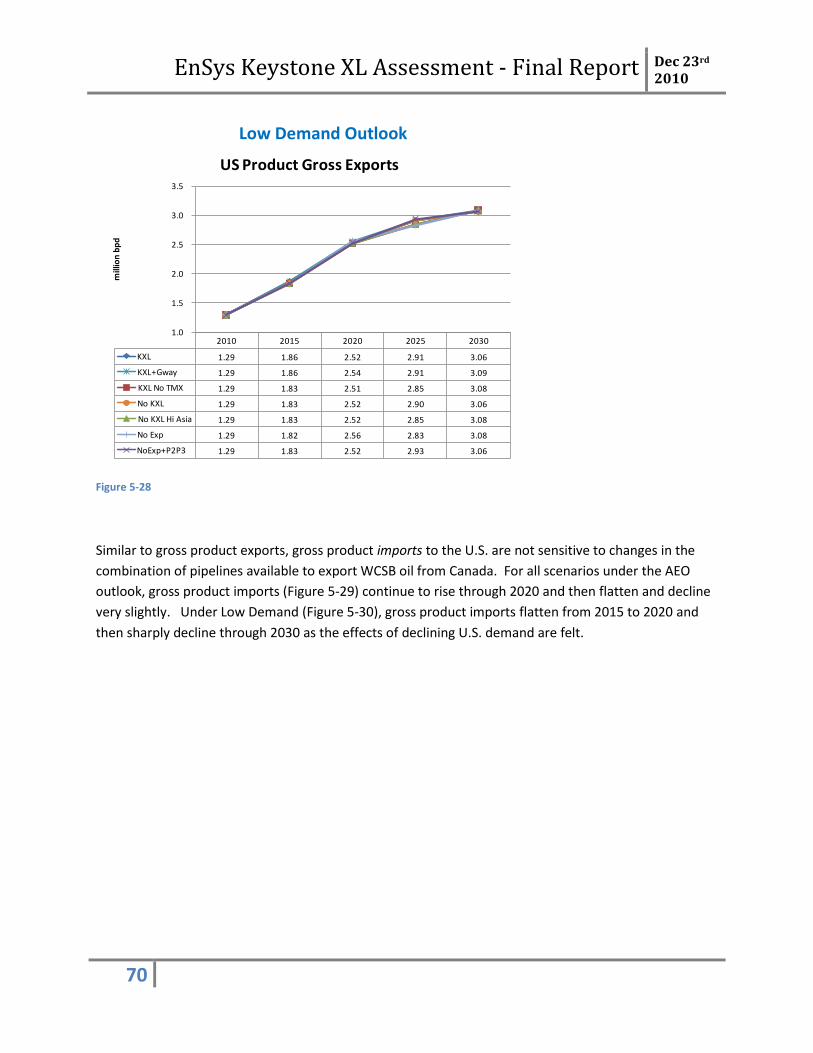
EnSys Keystone XL Assessment - Final Report Dec 23rd 2010
70
Figure 5-28
Similar to gross product exports, gross product imports to the U.S. are not sensitive to changes in the
combination of pipelines available to export WCSB oil from Canada. For all scenarios under the AEO
outlook, gross product imports (Figure 5-29) continue to rise through 2020 and then flatten and decline
very slightly. Under Low Demand (Figure 5-30), gross product imports flatten from 2015 to 2020 and
then sharply decline through 2030 as the effects of declining U.S. demand are felt.
2010 2015 2020 2025 2030
KXL 1.29 1.86 2.52 2.91 3.06
KXL+Gway 1.29 1.86 2.54 2.91 3.09
KXL No TMX 1.29 1.83 2.51 2.85 3.08
No KXL 1.29 1.83 2.52 2.90 3.06
No KXL Hi Asia 1.29 1.83 2.52 2.85 3.08
No Exp 1.29 1.82 2.56 2.83 3.08
NoExp+P2P3 1.29 1.83 2.52 2.93 3.06
1.0
1.5
2.0
2.5
3.0
3.5
mill
ion
bp
d
US Product Gross Exports
Low Demand Outlook
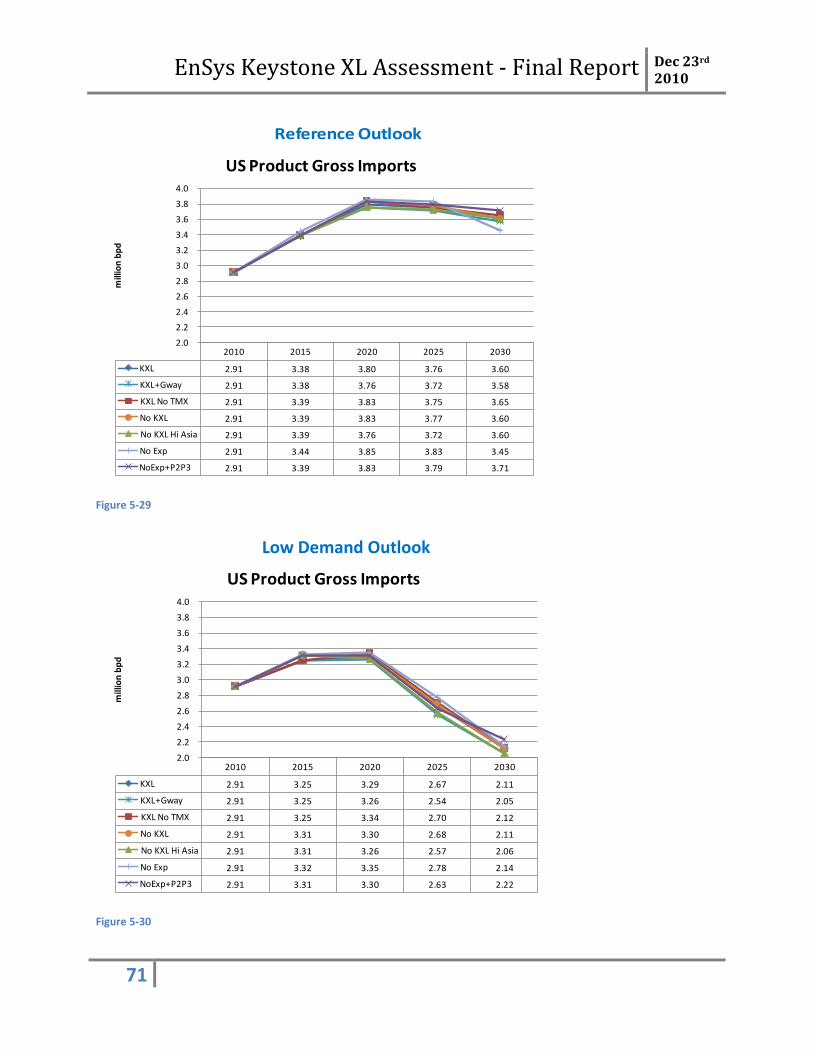
EnSys Keystone XL Assessment - Final Report Dec 23rd 2010
71
Reference Outlook
Figure 5-29
Figure 5-30
2010 2015 2020 2025 2030
KXL 2.91 3.38 3.80 3.76 3.60
KXL+Gway 2.91 3.38 3.76 3.72 3.58
KXL No TMX 2.91 3.39 3.83 3.75 3.65
No KXL 2.91 3.39 3.83 3.77 3.60
No KXL Hi Asia 2.91 3.39 3.76 3.72 3.60
No Exp 2.91 3.44 3.85 3.83 3.45
NoExp+P2P3 2.91 3.39 3.83 3.79 3.71
2.0
2.2
2.4
2.6
2.8
3.0
3.2
3.4
3.6
3.8
4.0
mill
ion
bp
d
US Product Gross Imports
2010 2015 2020 2025 2030
KXL 2.91 3.25 3.29 2.67 2.11
KXL+Gway 2.91 3.25 3.26 2.54 2.05
KXL No TMX 2.91 3.25 3.34 2.70 2.12
No KXL 2.91 3.31 3.30 2.68 2.11
No KXL Hi Asia 2.91 3.31 3.26 2.57 2.06
No Exp 2.91 3.32 3.35 2.78 2.14
NoExp+P2P3 2.91 3.31 3.30 2.63 2.22
2.0
2.2
2.4
2.6
2.8
3.0
3.2
3.4
3.6
3.8
4.0
mill
ion
bp
d
US Product Gross Imports
Low Demand Outlook
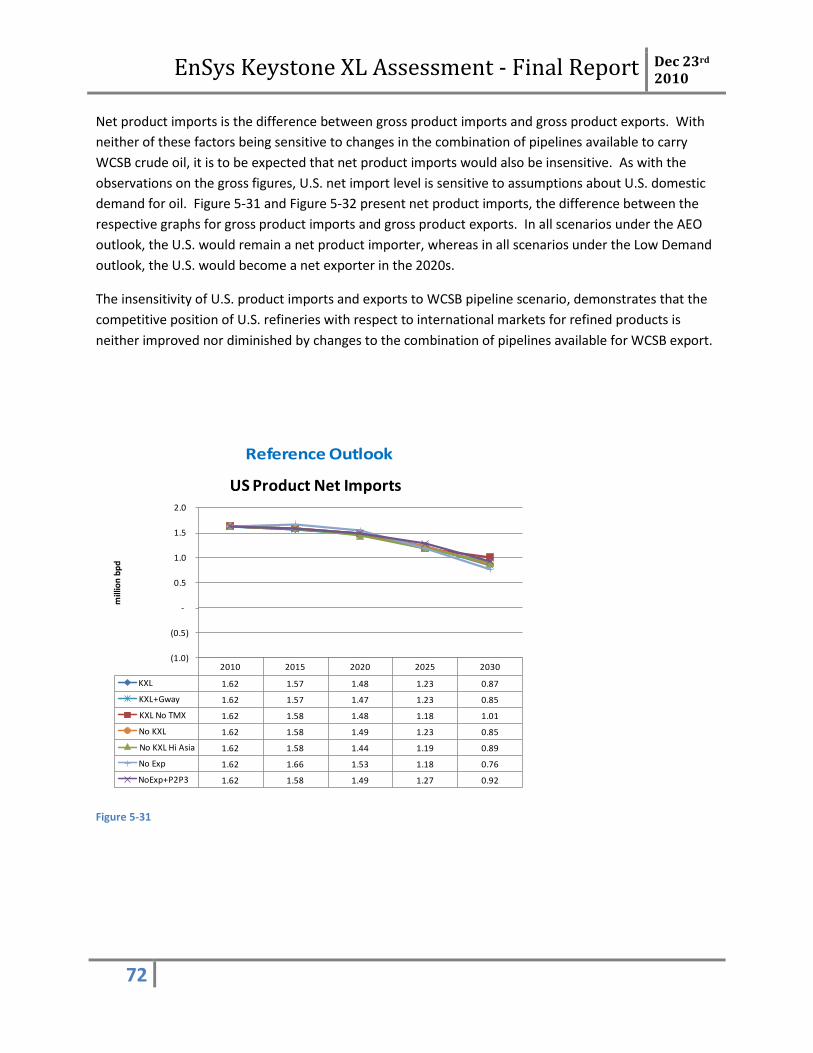
EnSys Keystone XL Assessment - Final Report Dec 23rd 2010
72
Reference Outlook
Net product imports is the difference between gross product imports and gross product exports. With
neither of these factors being sensitive to changes in the combination of pipelines available to carry
WCSB crude oil, it is to be expected that net product imports would also be insensitive. As with the
observations on the gross figures, U.S. net import level is sensitive to assumptions about U.S. domestic
demand for oil. Figure 5-31 and Figure 5-32 present net product imports, the difference between the
respective graphs for gross product imports and gross product exports. In all scenarios under the AEO
outlook, the U.S. would remain a net product importer, whereas in all scenarios under the Low Demand
outlook, the U.S. would become a net exporter in the 2020s.
The insensitivity of U.S. product imports and exports to WCSB pipeline scenario, demonstrates that the
competitive position of U.S. refineries with respect to international markets for refined products is
neither improved nor diminished by changes to the combination of pipelines available for WCSB export.
Figure 5-31
2010 2015 2020 2025 2030
KXL 1.62 1.57 1.48 1.23 0.87
KXL+Gway 1.62 1.57 1.47 1.23 0.85
KXL No TMX 1.62 1.58 1.48 1.18 1.01
No KXL 1.62 1.58 1.49 1.23 0.85
No KXL Hi Asia 1.62 1.58 1.44 1.19 0.89
No Exp 1.62 1.66 1.53 1.18 0.76
NoExp+P2P3 1.62 1.58 1.49 1.27 0.92
(1.0)
(0.5)
-
0.5
1.0
1.5
2.0
mill
ion
bp
d
US Product Net Imports
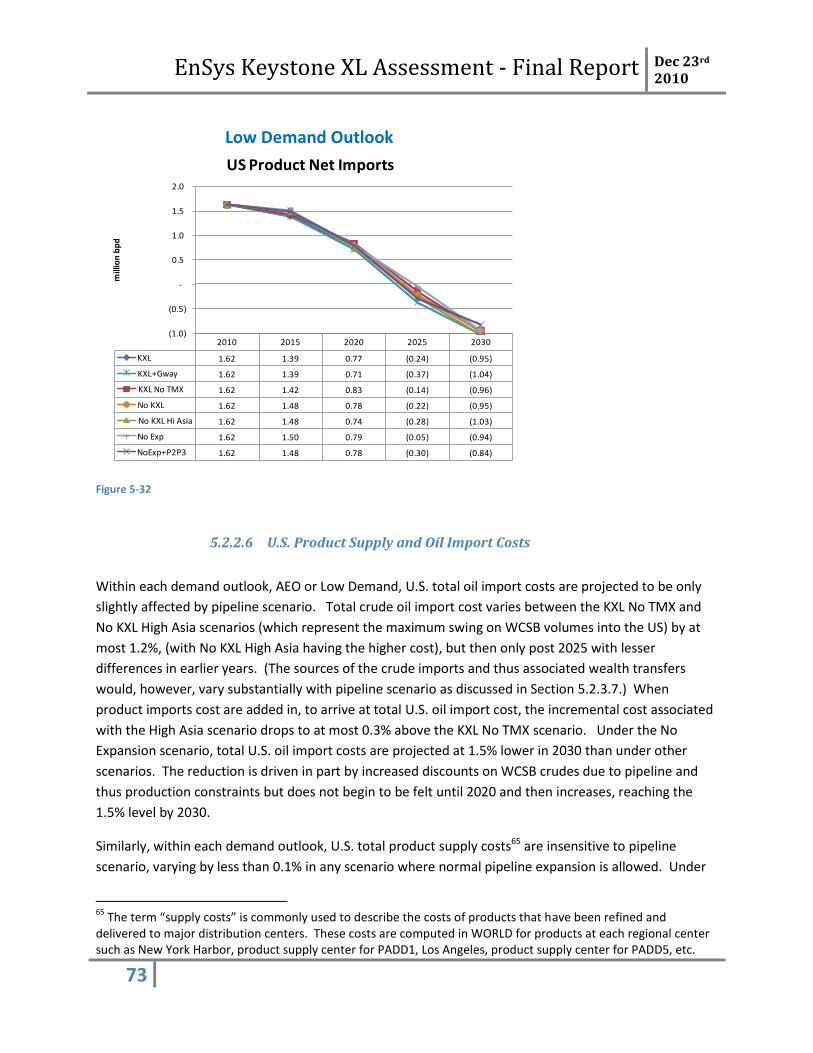
EnSys Keystone XL Assessment - Final Report Dec 23rd 2010
73
Figure 5-32
5.2.2.6 U.S. Product Supply and Oil Import Costs
Within each demand outlook, AEO or Low Demand, U.S. total oil import costs are projected to be only
slightly affected by pipeline scenario. Total crude oil import cost varies between the KXL No TMX and
No KXL High Asia scenarios (which represent the maximum swing on WCSB volumes into the US) by at
most 1.2%, (with No KXL High Asia having the higher cost), but then only post 2025 with lesser
differences in earlier years. (The sources of the crude imports and thus associated wealth transfers
would, however, vary substantially with pipeline scenario as discussed in Section 5.2.3.7.) When
product imports cost are added in, to arrive at total U.S. oil import cost, the incremental cost associated
with the High Asia scenario drops to at most 0.3% above the KXL No TMX scenario. Under the No
Expansion scenario, total U.S. oil import costs are projected at 1.5% lower in 2030 than under other
scenarios. The reduction is driven in part by increased discounts on WCSB crudes due to pipeline and
thus production constraints but does not begin to be felt until 2020 and then increases, reaching the
1.5% level by 2030.
Similarly, within each demand outlook, U.S. total product supply costs65 are insensitive to pipeline
scenario, varying by less than 0.1% in any scenario where normal pipeline expansion is allowed. Under
65
The term “supply costs” is commonly used to describe the costs of products that have been refined and delivered to major distribution centers. These costs are computed in WORLD for products at each regional center such as New York Harbor, product supply center for PADD1, Los Angeles, product supply center for PADD5, etc.
2010 2015 2020 2025 2030
KXL 1.62 1.39 0.77 (0.24) (0.95)
KXL+Gway 1.62 1.39 0.71 (0.37) (1.04)
KXL No TMX 1.62 1.42 0.83 (0.14) (0.96)
No KXL 1.62 1.48 0.78 (0.22) (0.95)
No KXL Hi Asia 1.62 1.48 0.74 (0.28) (1.03)
No Exp 1.62 1.50 0.79 (0.05) (0.94)
NoExp+P2P3 1.62 1.48 0.78 (0.30) (0.84)
(1.0)
(0.5)
-
0.5
1.0
1.5
2.0
mill
ion
bp
d
US Product Net Imports
Low Demand Outlook

EnSys Keystone XL Assessment - Final Report Dec 23rd 2010
74
the No Expansion scenario, in 2030, reductions in crude prices stemming from shut in of WCSB heavy
crudes lead to a reduction in U.S. product supply cost of 0.6% versus the 2030 KXL scenario.
5.2.2.7 WCSB Delivered Crude Prices
Pipeline scenario is projected to have small impacts on crude and product prices. The KXL pipeline
would have the effect of adding short term capacity to move WCSB crudes to the U.S. Gulf Coast – and
thereby also reduce pressure to absorb WCSB crudes in PADD2. Comparison of KXL versus No KXL
WORLD model results reflects this. Under the KXL scenario, delivered prices for WCSB SCO and DilBit
into PADD3 Gulf Coast are lower than under the No KXL case and those for PADD2, higher. The effect is
limited, no more than around $0.70/bbl. It is more marked in the 2015-2020 period than in later
horizons (reflecting the modeling results that the U.S. system would tend to add capacity over time if
KXL were not built that would lead to crude routings similar to those that would obtain were KXL built).
Small reductions in PADD3 product supply costs, of less than $0.10/bbl are evident in the KXL cases.
(PADD2 product supply costs would, however, be higher and estimated net change in U.S. total product
supply cost is projected to be minimal between the two scenarios.) Comparison of pairs of scenarios
illustrates that level of WCSB capacity to the BC coast and thence Asia impacts delivered prices for WCSB
crudes in the U.S.; broadly higher capacity to Asia moderately raises WCSB delivered prices and vice
versa. Under the KXL No TMX scenario, projected PADD2 prices for DilBit are up to $0.60/bbl lower
than those under the KXL scenario (which contains higher capacity to the BC coast in the form of the
TMX 2 and 3 expansions). Under the KXL plus Gateway scenario, PADD2 DilBit prices are projected at
up to $0.86/bbl above those under KXL. Under No KXL High Asia, PADD2 DilBit prices are up to $1/bbl
higher than those under No KXL. Results for PADD3 delivered DilBit prices show directionally the same
impacts but smaller.
5.2.2.8 U.S. Refining Margins
To examine how profit margins for refineries may be sensitive to assumptions about which combination
of pipelines are available to carry WCSB crude,
Figure 5-33 and
Supply costs thus correspond to product spot prices at major centers within each region. Total U.S. product supply cost in WORLD is arrived at by multiplying supply cost in $/bbl for each product by demand for that product for each of the five PADDs and then summing to arrive at the U.S. total.
EnSys Keystone XL Assessment - Final Report Dec 23rd 2010
75
Figure 5-34 compare respectively 3-2-1 and 2-1-1 crack spreads66 for U.S. Gulf Coast refineries for KXL,
No KXL High Asia and No Expansion scenarios under both AEO and Low Demand outlooks. The
differences between the projections for the KXL and the No KXL High Asia cases are small, i.e. refining
crack spreads are projected to be only minimally affected by the extent to which WCSB crudes move to
the USA versus to Asia. As previously explained, this is not surprising since, under the “business as
usual” pipeline scenarios, industry is allowed to adapt and total supply and product demand are not
altered. Therefore, the main effect is partial reallocation of WCSB crude between Asia and the USA,
with attendant re-balancing in movement of Middle East and other crudes. The volume of WCSB crude
being reallocated depending in the pipeline scenario would be at most 7% of the total U.S. crude run67.
The No Expansion scenario, however, does adversely affect margins (by around 10 c/bbl) post 2020,
notably under the AEO demand outlook. This stems from U.S. regions, particularly PADDs 2 and 3,
having to accept non-optimal crude slates under the No Expansion scenario.
The projections do show that demand outlook is likely to have a primary impact on refining margins.
Versus AEO, the Low Demand outlook cuts 3-2-1 (i.e. gasoline oriented) crack spreads by around
$0.50/bbl by 2020, $1/bbl by 2025 and close to $1.75 by 2030 as competition intensifies for the
remaining demand. The projected impact on evenly gasoline/distillate balanced 2-1-1 crack spreads is
somewhat less: around $0.30/bbl by 2020, $0.60/bbl by 2025 and $1.20/bbl by 2030. This is because
gasoline demand is more heavily cut back than distillate demand (diesel, jet fuel) in the Low Demand
outlook. Even in the AEO outlook, gasoline oriented margins are projected to be appreciably lower
than those (for refineries) oriented more toward distillate68.
66
“Crack spreads” are a commonly used set of fairly simple measures of refinery profitability. The 3-2-1 crack spread cited here refers to the difference or margin between the USGC value of 2 barrels of gasoline plus 1 of diesel minus the cost of 3 barrels of WTI crude. It is an approximate measure of the margin that could be expected in a cracking refinery which is heavily oriented to producing gasoline (as are most U.S. refineries). The 2-1-1 crack spread provides a comparison by presenting the margin for 1 barrel of gasoline plus 1 of diesel minus 2 of WTI, i.e. of a refinery oriented to more even yields of gasoline and distillate. 67
Under the KXL No TMX and the No KXL High Asia cases, the difference in WCSB imports in 2030 is 1.0 mbd on a total U.S. crude run of 14 mbd. 68
This reflects the relative U.S. and global gasoline/naptha surplus projected for the future in parallel with distillates representing the primary growth products.
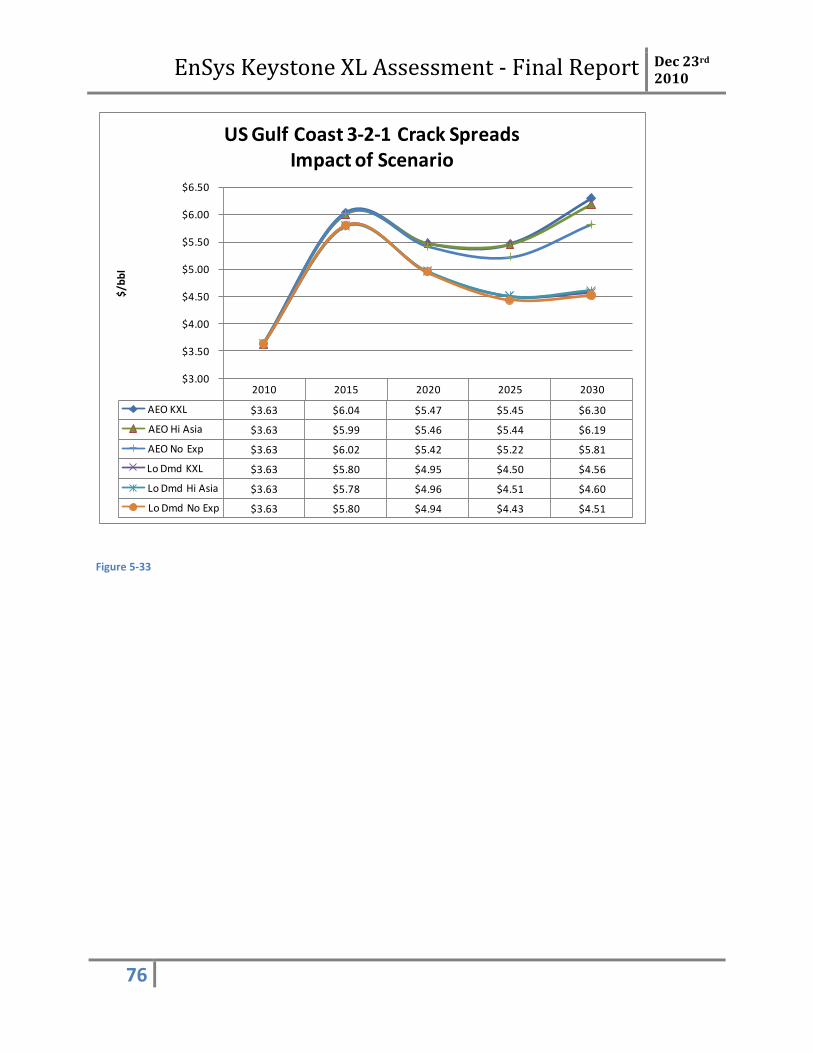
EnSys Keystone XL Assessment - Final Report Dec 23rd 2010
76
Figure 5-33
2010 2015 2020 2025 2030
AEO KXL $3.63 $6.04 $5.47 $5.45 $6.30
AEO Hi Asia $3.63 $5.99 $5.46 $5.44 $6.19
AEO No Exp $3.63 $6.02 $5.42 $5.22 $5.81
Lo Dmd KXL $3.63 $5.80 $4.95 $4.50 $4.56
Lo Dmd Hi Asia $3.63 $5.78 $4.96 $4.51 $4.60
Lo Dmd No Exp $3.63 $5.80 $4.94 $4.43 $4.51
$3.00
$3.50
$4.00
$4.50
$5.00
$5.50
$6.00
$6.50
$/b
bl
US Gulf Coast 3-2-1 Crack SpreadsImpact of Scenario
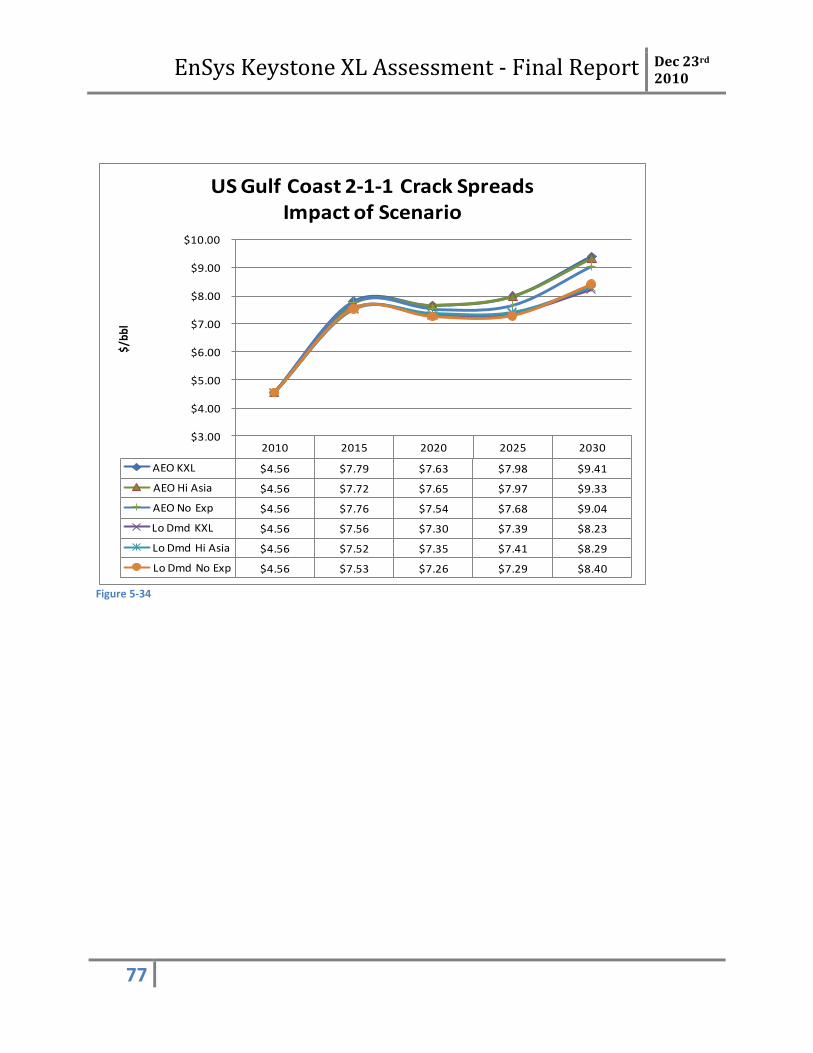
EnSys Keystone XL Assessment - Final Report Dec 23rd 2010
77
Figure 5-34
2010 2015 2020 2025 2030
AEO KXL $4.56 $7.79 $7.63 $7.98 $9.41
AEO Hi Asia $4.56 $7.72 $7.65 $7.97 $9.33
AEO No Exp $4.56 $7.76 $7.54 $7.68 $9.04
Lo Dmd KXL $4.56 $7.56 $7.30 $7.39 $8.23
Lo Dmd Hi Asia $4.56 $7.52 $7.35 $7.41 $8.29
Lo Dmd No Exp $4.56 $7.53 $7.26 $7.29 $8.40
$3.00
$4.00
$5.00
$6.00
$7.00
$8.00
$9.00
$10.00
$/b
bl
US Gulf Coast 2-1-1 Crack SpreadsImpact of Scenario
EnSys Keystone XL Assessment - Final Report Dec 23rd 2010
78
5.2.2.9 Crude Production Value
The value of US crude production is projected as little impacted across any scenario69. Similarly, the
total value of WCSB production is projected to vary little based on whether WCSB production goes more
to the USA or to Asia. However, the No Expansion scenarios lead to lower WCSB production and pricing
discounts – and hence to an appreciable reduction in the value of WCSB crudes to Canadian producers.
Around 2020, No Expansion would result in lower production volume and lower value of WCSB oil sands
crudes. The lack of export pipeline expansion would start to shut in WCSB supply. A glut of heavy crude
would develop in PADD2 as the only region with the pipeline capacity to accept WCSB crudes. In
addition, PADD2 refiners would have to invest in additional equipment to process the WCSB heavy
grades and this would be reflected back in the form of reduced WCSB heavy crude values. In this
scenario, WCSB producer revenue would be 19% less in 2030 in the No Expansion scenario, compared to
any of the KXL or No KXL scenarios, under the AEO demand outlook (Figure 5-35). (As stated above, the
value of WCSB production is minimally impacted by pipeline scenario, i.e. KXL or No KXL and variants,
other than in the No Expansion cases70.) Under the Low Demand outlook (Figure 5-36), the difference
between producer revenue in the No Expansion scenario compared to the KXL scenario would be 24%.
69
The FOB value of total US crude oil production is projected to vary by less than 0.1% between pipeline scenarios that allow pipeline expansion. Under the No Expansion scenario, the 2030 value of US crude production is projected to be around 0.75% below that in the KXL scenario. US crude production was not altered under No Expansion but the value of US crude drops slightly due to competition with WCSB crudes whose prices are discounted because of production capacity being shut in. 70
For that reason, only the KXL and the two No Expansion scenarios are shown in Figure 5-35 and Figure 5-36.
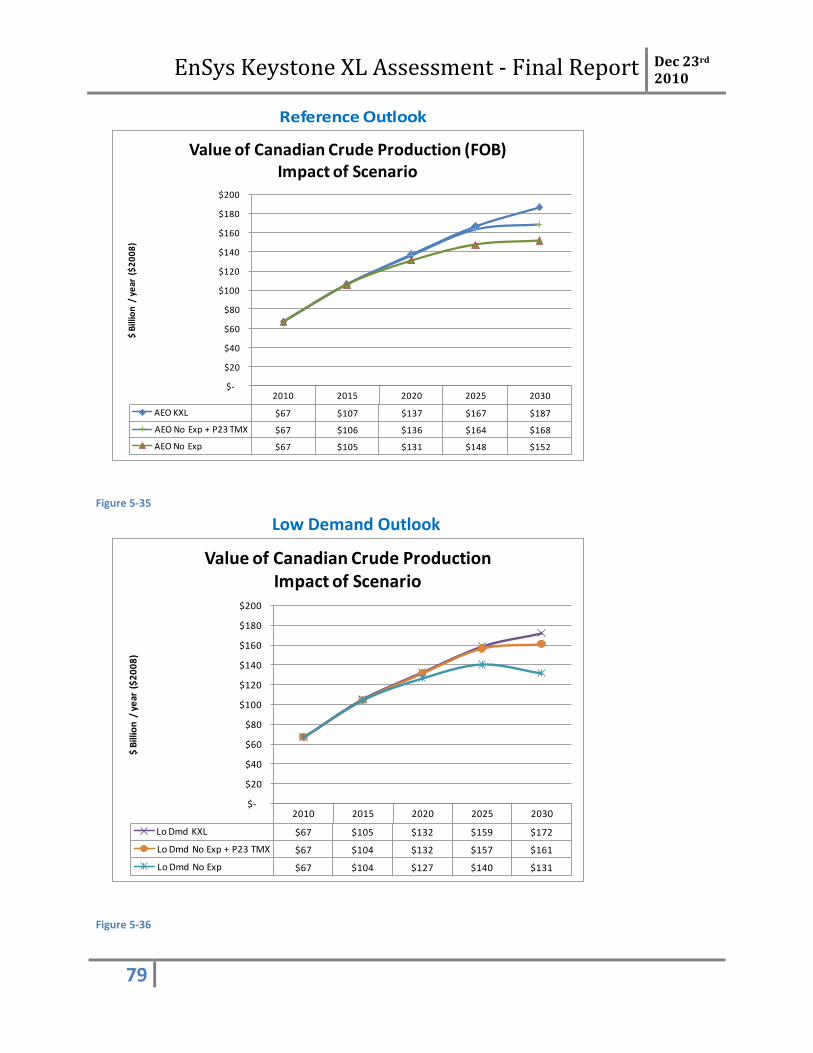
EnSys Keystone XL Assessment - Final Report Dec 23rd 2010
79
Reference Outlook
Figure 5-35
Figure 5-36
Low Demand Outlook
2010 2015 2020 2025 2030
AEO KXL $67 $107 $137 $167 $187
AEO No Exp + P23 TMX $67 $106 $136 $164 $168
AEO No Exp $67 $105 $131 $148 $152
$-
$20
$40
$60
$80
$100
$120
$140
$160
$180
$200
$ B
illio
n /
ye
ar (
$2
00
8)
Value of Canadian Crude Production (FOB)Impact of Scenario
2010 2015 2020 2025 2030
Lo Dmd KXL $67 $105 $132 $159 $172
Lo Dmd No Exp + P23 TMX $67 $104 $132 $157 $161
Lo Dmd No Exp $67 $104 $127 $140 $131
$-
$20
$40
$60
$80
$100
$120
$140
$160
$180
$200
$ B
illio
n /
ye
ar (
$2
00
8)
Value of Canadian Crude ProductionImpact of Scenario
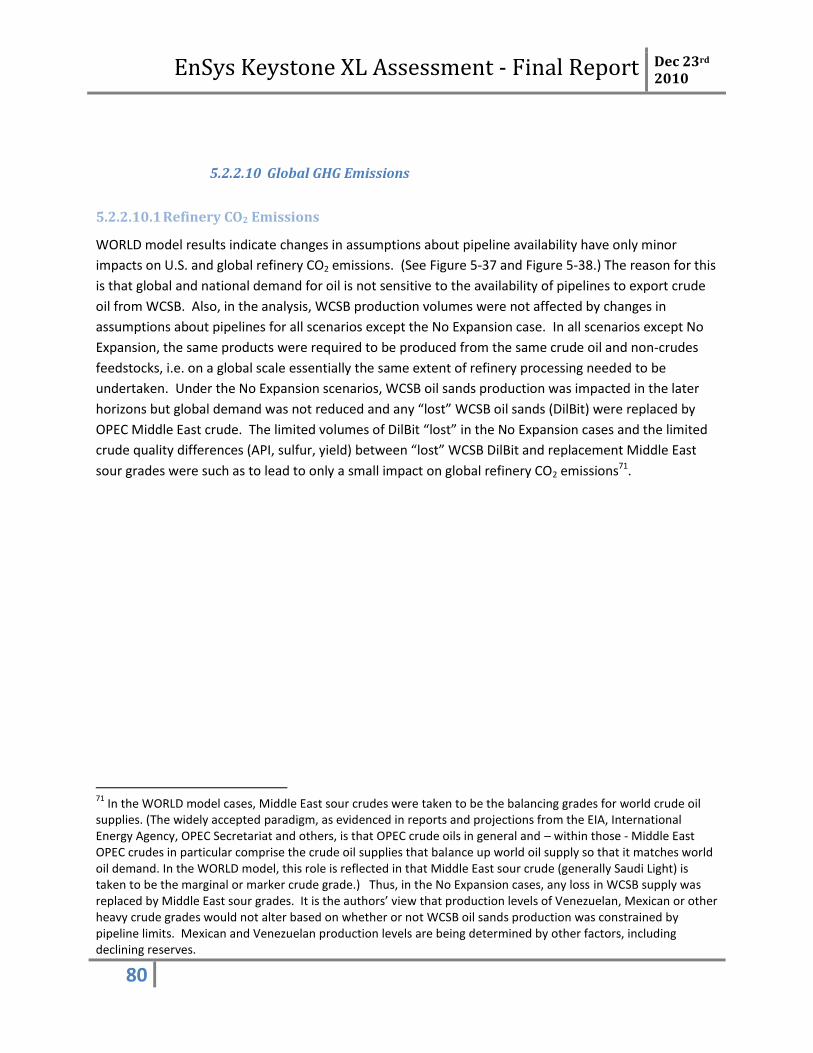
EnSys Keystone XL Assessment - Final Report Dec 23rd 2010
80
5.2.2.10 Global GHG Emissions
5.2.2.10.1 Refinery CO2 Emissions
WORLD model results indicate changes in assumptions about pipeline availability have only minor
impacts on U.S. and global refinery CO2 emissions. (See Figure 5-37 and Figure 5-38.) The reason for this
is that global and national demand for oil is not sensitive to the availability of pipelines to export crude
oil from WCSB. Also, in the analysis, WCSB production volumes were not affected by changes in
assumptions about pipelines for all scenarios except the No Expansion case. In all scenarios except No
Expansion, the same products were required to be produced from the same crude oil and non-crudes
feedstocks, i.e. on a global scale essentially the same extent of refinery processing needed to be
undertaken. Under the No Expansion scenarios, WCSB oil sands production was impacted in the later
horizons but global demand was not reduced and any “lost” WCSB oil sands (DilBit) were replaced by
OPEC Middle East crude. The limited volumes of DilBit “lost” in the No Expansion cases and the limited
crude quality differences (API, sulfur, yield) between “lost” WCSB DilBit and replacement Middle East
sour grades were such as to lead to only a small impact on global refinery CO2 emissions71.
71
In the WORLD model cases, Middle East sour crudes were taken to be the balancing grades for world crude oil supplies. (The widely accepted paradigm, as evidenced in reports and projections from the EIA, International Energy Agency, OPEC Secretariat and others, is that OPEC crude oils in general and – within those - Middle East OPEC crudes in particular comprise the crude oil supplies that balance up world oil supply so that it matches world oil demand. In the WORLD model, this role is reflected in that Middle East sour crude (generally Saudi Light) is taken to be the marginal or marker crude grade.) Thus, in the No Expansion cases, any loss in WCSB supply was replaced by Middle East sour grades. It is the authors’ view that production levels of Venezuelan, Mexican or other heavy crude grades would not alter based on whether or not WCSB oil sands production was constrained by pipeline limits. Mexican and Venezuelan production levels are being determined by other factors, including declining reserves.

EnSys Keystone XL Assessment - Final Report Dec 23rd 2010
81
Reference Outlook
Figure 5-37
Figure 5-38
KXL KXL+Gway
KXL No TMX
No KXL No KXL Hi
Asia No Exp NoExp+P2
P3
Global 1,334.7 1,336.0 1,334.6 1,335.1 1,336.2 1,327.7 1,334.0
800.0
900.0
1,000.0
1,100.0
1,200.0
1,300.0
1,400.0
mill
ion
tp
a
Global Refinery CO2 Emissions - 2030
Low Demand Outlook
KXL KXL+Gway
KXL No TMX
No KXL No KXL Hi
Asia No Exp NoExp+P2
P3
Global 1,264.3 1,266.7 1,263.6 1,264.3 1,267.1 1,261.7 1,264.0
800.0
900.0
1,000.0
1,100.0
1,200.0
1,300.0
1,400.0
mill
ion
tp
a
Global Refinery CO2 Emissions - 2030

EnSys Keystone XL Assessment - Final Report Dec 23rd 2010
82
5.2.2.10.2 Life-cycle GHG Emissions
Evaluation of global life-cycle GHG emissions using the DOE ETP model leads to similar results.
As with refinery CO2 emissions, the absolute level of global life-cycle GHG emissions is impacted by the
demand outlook, but it is not very sensitive to changes in assumptions about available pipelines. The
difference in 2030 global oil demand between AEO and Low Demand was 3.7 mbd out of 105.9 mbd, a
reduction of 3.5%.
Annual global transportation GHG emissions would be approximately 11,000 million tons of CO2e in
2030 under the AEO outlook and a little over 10,400 million tons of CO2e under Low Demand, a
reduction of just over 600 million tons of CO2e. In contrast, the difference in emissions between
pipeline scenarios in 2030 would be at most 26 +/- million tons of CO2e, i.e. around 0.25% of GHG
emissions from the global transportation sector72. (See Figure 5-39 through Figure 5-42. Additional
detailed results are contained in the Appendix Section 4.)
72
In the No Expansion scenario, 2030 global refinery CO2 emissions were 7 million tons of CO2e lower than under the KXL scenario, based on WORLD results; i.e. accounted for approximately 27% of the total life-cycle reduction of 26 million tons of CO2e generated by the ETP model. Under all pipeline scenarios other than No Expansion, the variations in 2030 global refinery CO2 emissions versus the KXL scenario were at most 1.6 million tons of CO2e, or a little over 0.1% of the global level of refinery CO2 emissions of around 1,335 million tons of CO2e.
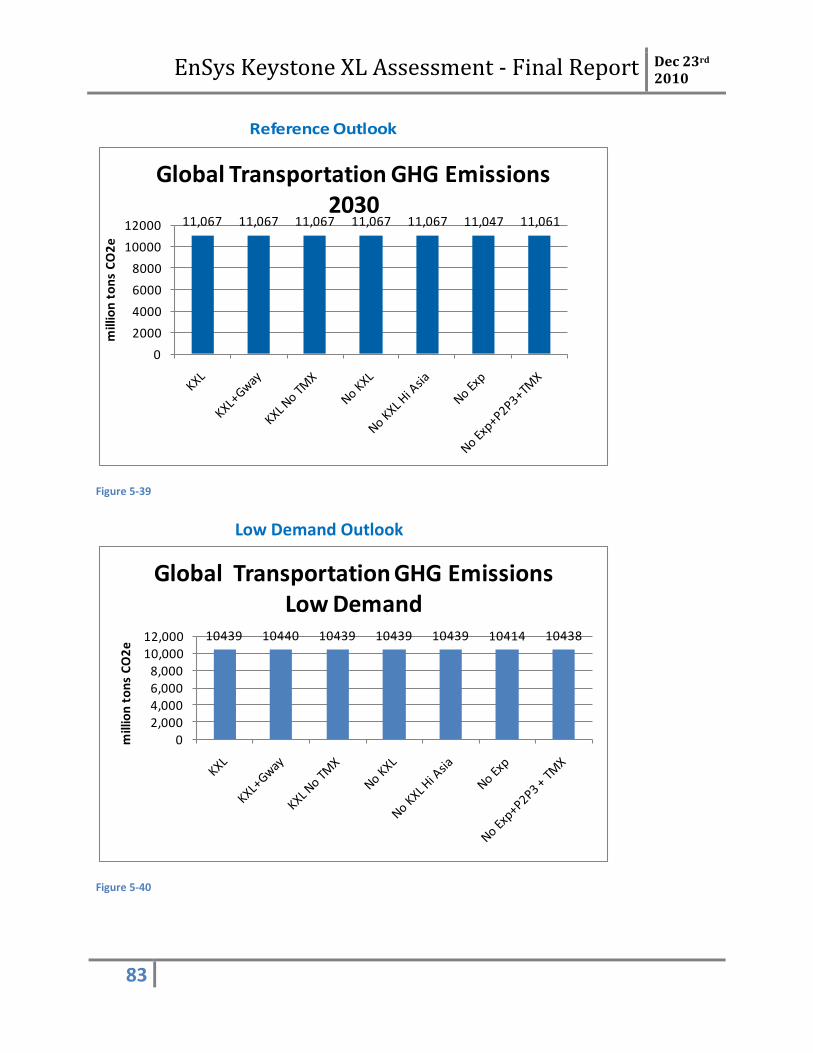
EnSys Keystone XL Assessment - Final Report Dec 23rd 2010
83
Reference Outlook
Figure 5-39
Figure 5-40
11,067 11,067 11,067 11,067 11,067 11,047 11,061
0
2000
4000
6000
8000
10000
12000
mill
ion
to
ns
CO
2e
Global Transportation GHG Emissions 2030
10439 10440 10439 10439 10439 10414 10438
0
2,000
4,000
6,000
8,000
10,000
12,000
mill
ion
to
ns
CO
2e
Global Transportation GHG Emissions Low Demand
Low Demand Outlook
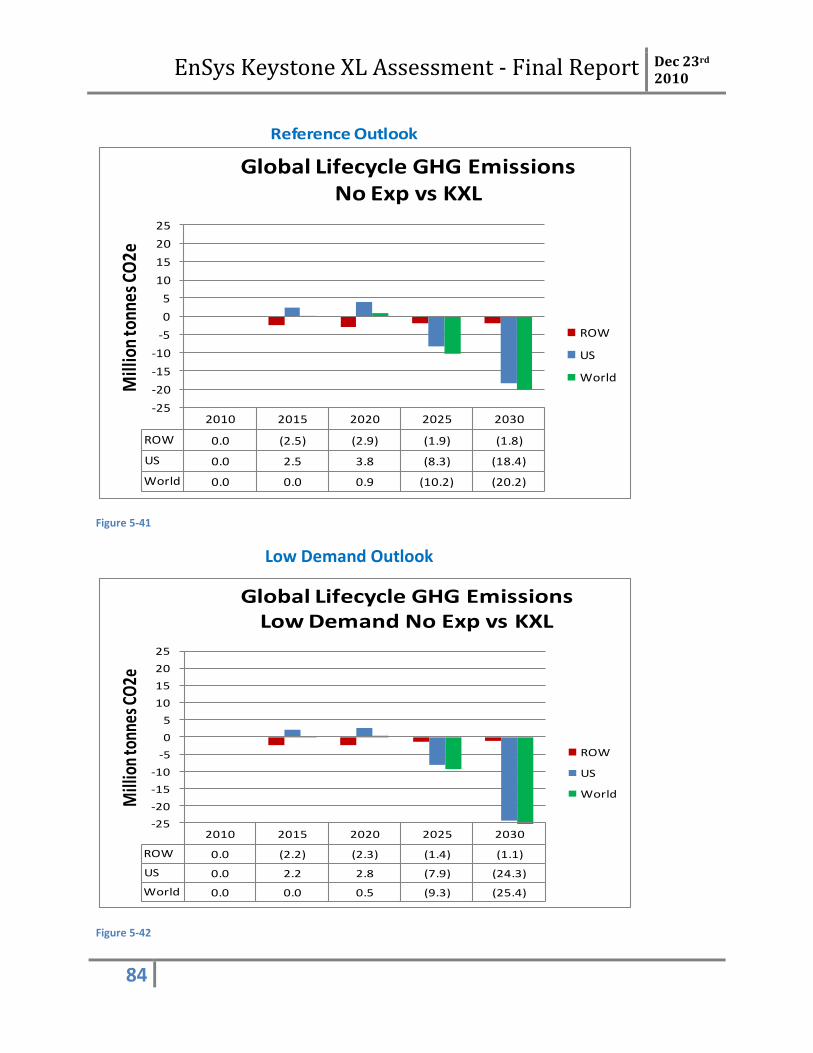
EnSys Keystone XL Assessment - Final Report Dec 23rd 2010
84
Reference Outlook
Figure 5-41
Figure 5-42
2010 2015 2020 2025 2030
ROW 0.0 (2.5) (2.9) (1.9) (1.8)
US 0.0 2.5 3.8 (8.3) (18.4)
World 0.0 0.0 0.9 (10.2) (20.2)
-25
-20
-15
-10
-5
0
5
10
15
20
25
Mill
ion
tonn
es C
O2e
Global Lifecycle GHG EmissionsNo Exp vs KXL
ROW
US
World
2010 2015 2020 2025 2030
ROW 0.0 (2.2) (2.3) (1.4) (1.1)
US 0.0 2.2 2.8 (7.9) (24.3)
World 0.0 0.0 0.5 (9.3) (25.4)
-25
-20
-15
-10
-5
0
5
10
15
20
25
Mill
ion
tonn
es C
O2e
Global Lifecycle GHG EmissionsLow Demand No Exp vs KXL
ROW
US
World
Low Demand Outlook
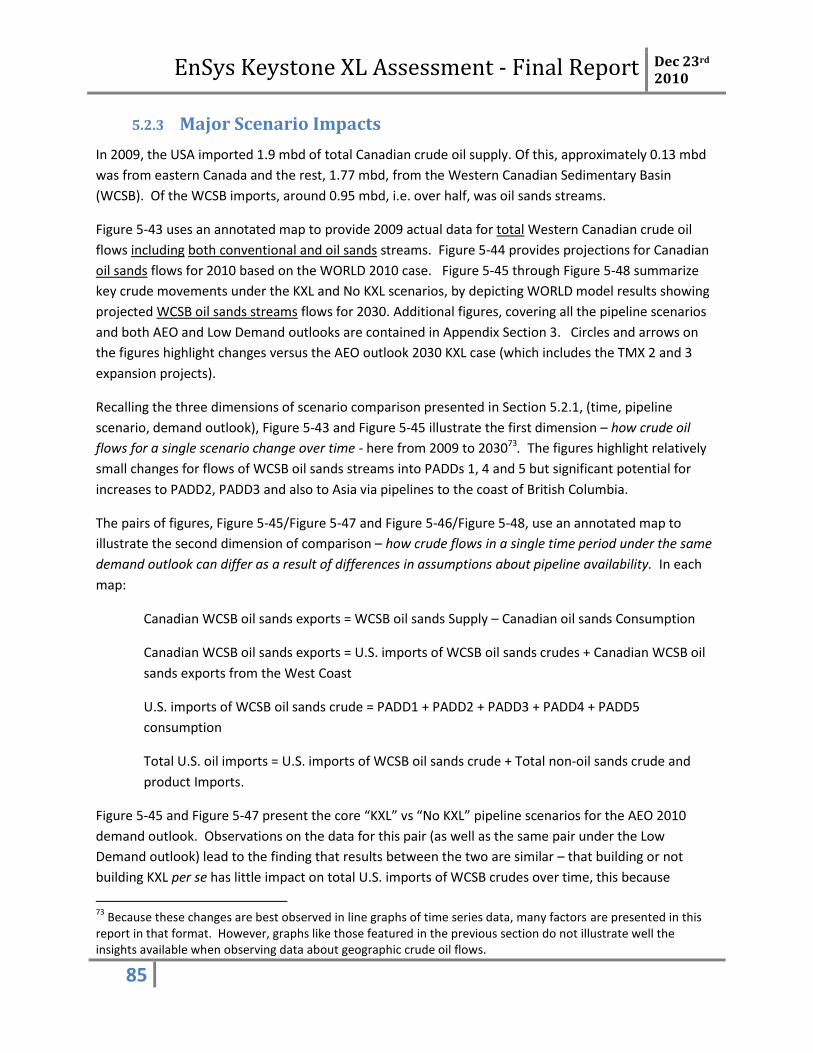
EnSys Keystone XL Assessment - Final Report Dec 23rd 2010
85
5.2.3 Major Scenario Impacts
In 2009, the USA imported 1.9 mbd of total Canadian crude oil supply. Of this, approximately 0.13 mbd
was from eastern Canada and the rest, 1.77 mbd, from the Western Canadian Sedimentary Basin
(WCSB). Of the WCSB imports, around 0.95 mbd, i.e. over half, was oil sands streams.
Figure 5-43 uses an annotated map to provide 2009 actual data for total Western Canadian crude oil
flows including both conventional and oil sands streams. Figure 5-44 provides projections for Canadian
oil sands flows for 2010 based on the WORLD 2010 case. Figure 5-45 through Figure 5-48 summarize
key crude movements under the KXL and No KXL scenarios, by depicting WORLD model results showing
projected WCSB oil sands streams flows for 2030. Additional figures, covering all the pipeline scenarios
and both AEO and Low Demand outlooks are contained in Appendix Section 3. Circles and arrows on
the figures highlight changes versus the AEO outlook 2030 KXL case (which includes the TMX 2 and 3
expansion projects).
Recalling the three dimensions of scenario comparison presented in Section 5.2.1, (time, pipeline
scenario, demand outlook), Figure 5-43 and Figure 5-45 illustrate the first dimension – how crude oil
flows for a single scenario change over time - here from 2009 to 203073. The figures highlight relatively
small changes for flows of WCSB oil sands streams into PADDs 1, 4 and 5 but significant potential for
increases to PADD2, PADD3 and also to Asia via pipelines to the coast of British Columbia.
The pairs of figures, Figure 5-45/Figure 5-47 and Figure 5-46/Figure 5-48, use an annotated map to
illustrate the second dimension of comparison – how crude flows in a single time period under the same
demand outlook can differ as a result of differences in assumptions about pipeline availability. In each
map:
Canadian WCSB oil sands exports = WCSB oil sands Supply – Canadian oil sands Consumption
Canadian WCSB oil sands exports = U.S. imports of WCSB oil sands crudes + Canadian WCSB oil
sands exports from the West Coast
U.S. imports of WCSB oil sands crude = PADD1 + PADD2 + PADD3 + PADD4 + PADD5
consumption
Total U.S. oil imports = U.S. imports of WCSB oil sands crude + Total non-oil sands crude and
product Imports.
Figure 5-45 and Figure 5-47 present the core “KXL” vs “No KXL” pipeline scenarios for the AEO 2010
demand outlook. Observations on the data for this pair (as well as the same pair under the Low
Demand outlook) lead to the finding that results between the two are similar – that building or not
building KXL per se has little impact on total U.S. imports of WCSB crudes over time, this because
73
Because these changes are best observed in line graphs of time series data, many factors are presented in this report in that format. However, graphs like those featured in the previous section do not illustrate well the insights available when observing data about geographic crude oil flows.

EnSys Keystone XL Assessment - Final Report Dec 23rd 2010
86
sufficient alternative pipeline capacity is projected to be deliverable over time to lead to similar WCSB
pipeline flows.
Figure 5-45 and Figure 5-46 (as well as Figure 5-47 and Figure 5-48) illustrate the third dimension of
comparison – how crude oil flows for a single set of pipeline availability assumptions are affected by
different assumptions about future oil demand (AEO 2010 vs Low Demand). Here, the results indicate
that Low versus AEO demand would have little impact on WCSB import levels into the U.S. (other factors
being equal) but would substantially cut U.S. Middle East and total oil imports. Appendix Section 3
provides a full set of these 2030 results covering all scenarios.
The following subsections discuss differences along all three dimensions, (time, pipeline scenario,
demand outlook), with focus on those parameters where major impacts are evident. The purpose of
each subsection is to highlight results relevant to the key study questions presented in Section 2.2.
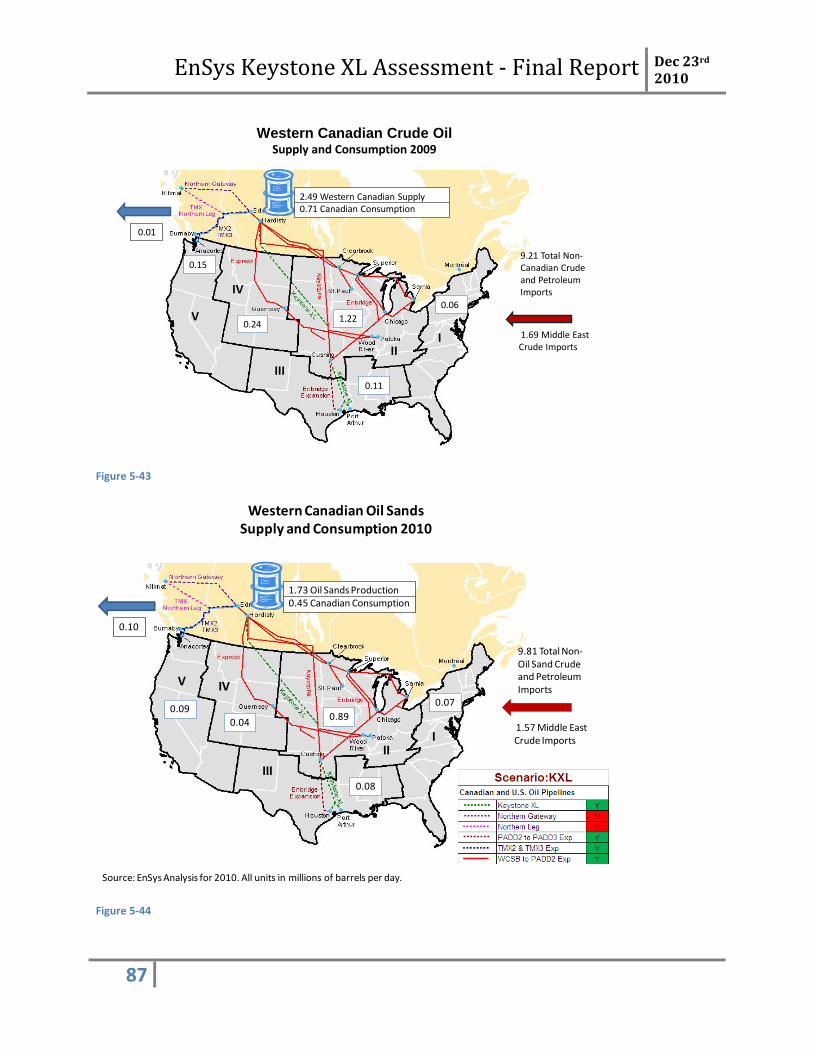
EnSys Keystone XL Assessment - Final Report Dec 23rd 2010
87
Figure 5-43
Figure 5-44
Supply and Consumption 2009
9.21 Total Non-Canadian Crude and Petroleum Imports
0.24
0.11
0.06
2.49 Western Canadian Supply0.71 Canadian Consumption
0.01
1.22
0.15
V
IV
III
III 1.69 Middle East
Crude Imports
Western Canadian Crude Oil
Source: EnSys Analysis for 2030. All units in millions of barrels per day.
Western Canadian Oil SandsSupply and Consumption 2010
9.81 Total Non-Oil Sand Crude and Petroleum Imports
0.04
0.08
0.07
1.73 Oil Sands Production0.45 Canadian Consumption
0.10
0.890.09
Source: EnSys Analysis for 2010. All units in millions of barrels per day.
V IV
III
III
1.57 Middle East Crude Imports
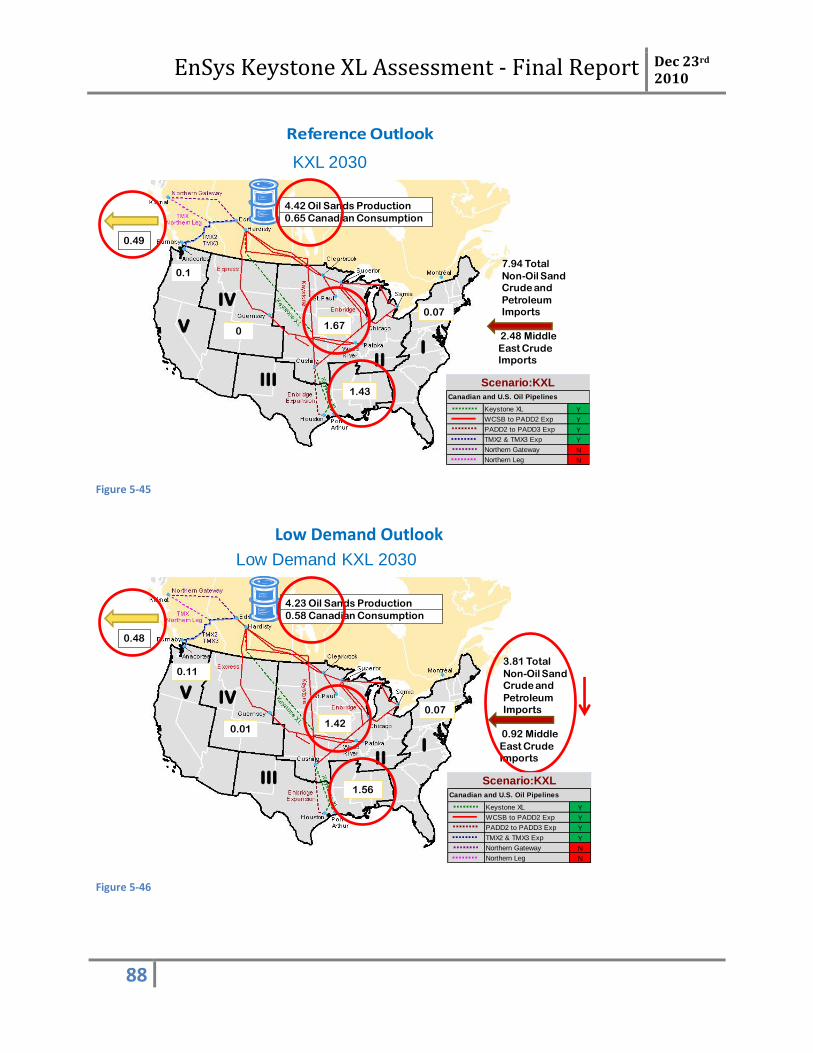
EnSys Keystone XL Assessment - Final Report Dec 23rd 2010
88
Reference Outlook
Figure 5-45
Figure 5-46
KXL 2030
7.94 Total
Non-Oil Sand Crude and
Petroleum Imports
0
1.43
0.07
4.42 Oil Sands Production
0.65 Canadian Consumption
0.49
1.67
0.1
V
IV
IIIII
I2.48 Middle
East Crude Imports
Keystone XL Y
WCSB to PADD2 Exp Y
PADD2 to PADD3 Exp Y
TMX2 & TMX3 Exp Y
Northern Gateway N
Northern Leg N
Scenario:KXLCanadian and U.S. Oil Pipelines
Low Demand KXL 2030
3.81 Total
Non-Oil Sand Crude and
Petroleum Imports
0.01
1.56
0.07
4.23 Oil Sands Production
0.58 Canadian Consumption
0.48
1.42
0.11
V IV
IIIII
I0.92 Middle
East Crude Imports
Keystone XL Y
WCSB to PADD2 Exp Y
PADD2 to PADD3 Exp Y
TMX2 & TMX3 Exp Y
Northern Gateway N
Northern Leg N
Scenario:KXLCanadian and U.S. Oil Pipelines
Low Demand Outlook
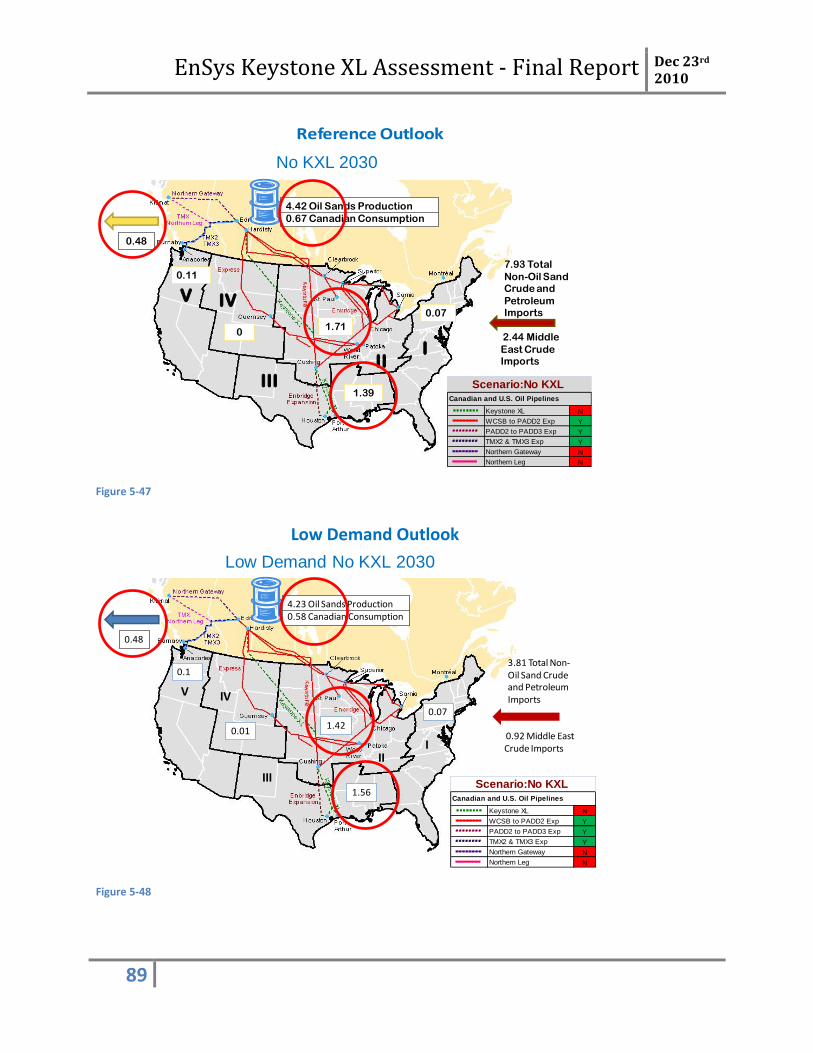
EnSys Keystone XL Assessment - Final Report Dec 23rd 2010
89
Reference Outlook
Figure 5-47
Figure 5-48
No KXL 2030
7.93 Total
Non-Oil Sand Crude and
Petroleum Imports
0
1.39
0.07
4.42 Oil Sands Production
0.67 Canadian Consumption
0.48
1.71
0.11
V IV
IIIII
I2.44 Middle
East Crude Imports
Keystone XL N
WCSB to PADD2 Exp Y
PADD2 to PADD3 Exp Y
TMX2 & TMX3 Exp Y
Northern Gateway N
Northern Leg N
Canadian and U.S. Oil Pipelines
Scenario:No KXL
Low Demand No KXL 2030
3.81 Total Non-Oil Sand Crude and Petroleum Imports
0.01
1.56
0.07
4.23 Oil Sands Production0.58 Canadian Consumption
0.48
1.42
0.1
V IV
III
III
0.92 Middle East Crude Imports
Keystone XL N
WCSB to PADD2 Exp Y
PADD2 to PADD3 Exp Y
TMX2 & TMX3 Exp Y
Northern Gateway N
Northern Leg N
Canadian and U.S. Oil Pipelines
Scenario:No KXL
Low Demand Outlook

EnSys Keystone XL Assessment - Final Report Dec 23rd 2010
90
5.2.3.1 Canadian Imports Growth
All pipeline scenario results indicate a clear potential for a sustained increase in U.S. imports of Canadian
crudes. (See Figures 5-49 and 5-5074 75.) This observation holds under both the AEO 2010 demand
outlook and the Low Demand outlook. For all scenarios, the proportion of WCSB oil sands streams in
U.S. WCSB crude oil imports is projected to steadily increase, from somewhat over 50% in 2009 to
around 90% by 2030.
Under the KXL case, (which also allows for 400,000 bpd of expansion in the Transmountain line to
Vancouver and Asia), total Canadian crude oil imports to the USA are projected to grow from 1.9 mbd in
2009 to 2.7 mbd by 2020 and 3.6 mbd by 203076. The results for the No KXL case are almost identical77.
Sections below further discuss the impacts of KXL versus No KXL, of assumed WCSB capacity to Asia, of
No Expansion of pipelines and of Low Demand on U.S. crude oil imports and WCSB crude oil export
destinations and production level.
74
The pipeline scenario reference “No Exp +P2P3” in fact denotes No Expansion except for allowed expansion of pipelines from PADD2 to PADD3 plus Transmountain TMX 2 and 3 expansions assumed in operation by 2020. 75
These figures show projected volumes of imported WCSB crudes processed in U.S. refineries. In addition, WCSB crudes destined for the Sarnia area will also cross into the U.S. before later exiting to eastern Canada. Total cross-border movements into the USA will therefore be higher than the volumes refined in the U.S. Volumes of WCSB crude processed in Sarnia area refineries are projected at approximately 200,000 bpd. This figure should be added to arrive at total cross-border WCSB crude flows into the U.S. 76
Total Canadian crude oil imports include a little over 0.1 mbd of eastern Canadian. The rest is all from WCSB. 77
The plot line for the KXL case cannot be readily seen in Figures 5-48 and 5-49 because it is directly beneath the No KXL plot line.
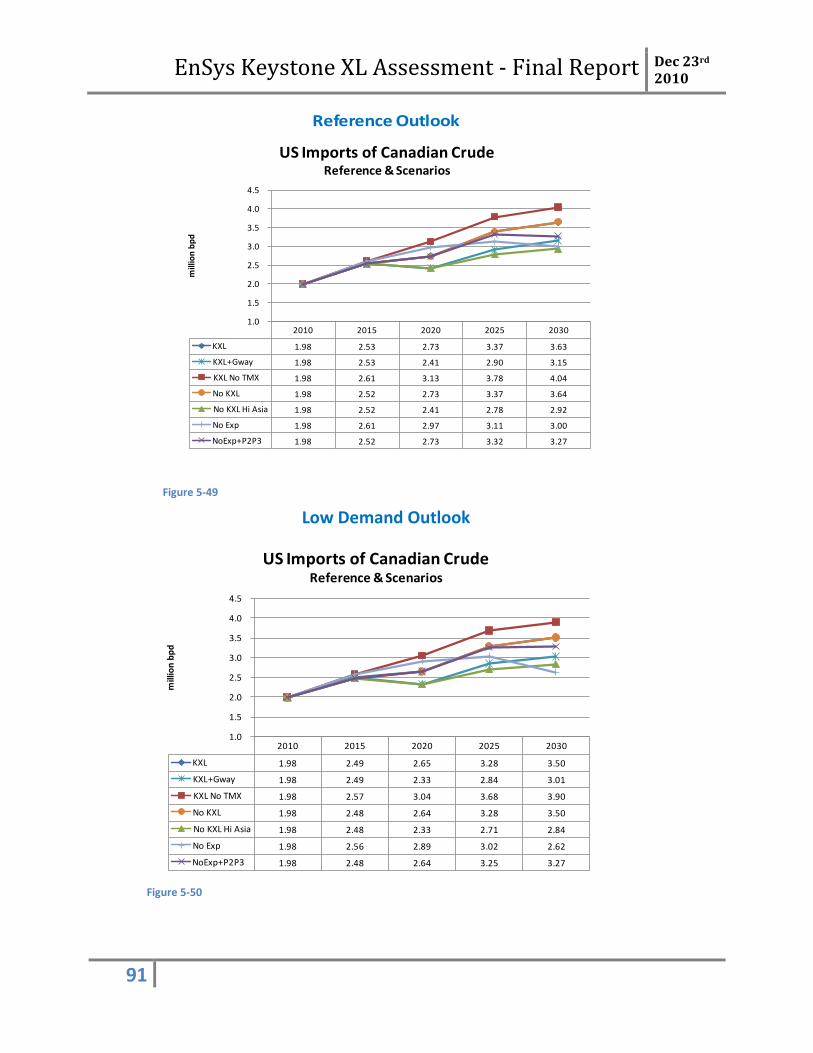
EnSys Keystone XL Assessment - Final Report Dec 23rd 2010
91
Reference Outlook
Figure 5-49
Figure 5-50
2010 2015 2020 2025 2030
KXL 1.98 2.53 2.73 3.37 3.63
KXL+Gway 1.98 2.53 2.41 2.90 3.15
KXL No TMX 1.98 2.61 3.13 3.78 4.04
No KXL 1.98 2.52 2.73 3.37 3.64
No KXL Hi Asia 1.98 2.52 2.41 2.78 2.92
No Exp 1.98 2.61 2.97 3.11 3.00
NoExp+P2P3 1.98 2.52 2.73 3.32 3.27
1.0
1.5
2.0
2.5
3.0
3.5
4.0
4.5 m
illio
n b
pd
US Imports of Canadian CrudeReference & Scenarios
2010 2015 2020 2025 2030
KXL 1.98 2.49 2.65 3.28 3.50
KXL+Gway 1.98 2.49 2.33 2.84 3.01
KXL No TMX 1.98 2.57 3.04 3.68 3.90
No KXL 1.98 2.48 2.64 3.28 3.50
No KXL Hi Asia 1.98 2.48 2.33 2.71 2.84
No Exp 1.98 2.56 2.89 3.02 2.62
NoExp+P2P3 1.98 2.48 2.64 3.25 3.27
1.0
1.5
2.0
2.5
3.0
3.5
4.0
4.5
mill
ion
bp
d
US Imports of Canadian CrudeReference & Scenarios
Low Demand Outlook
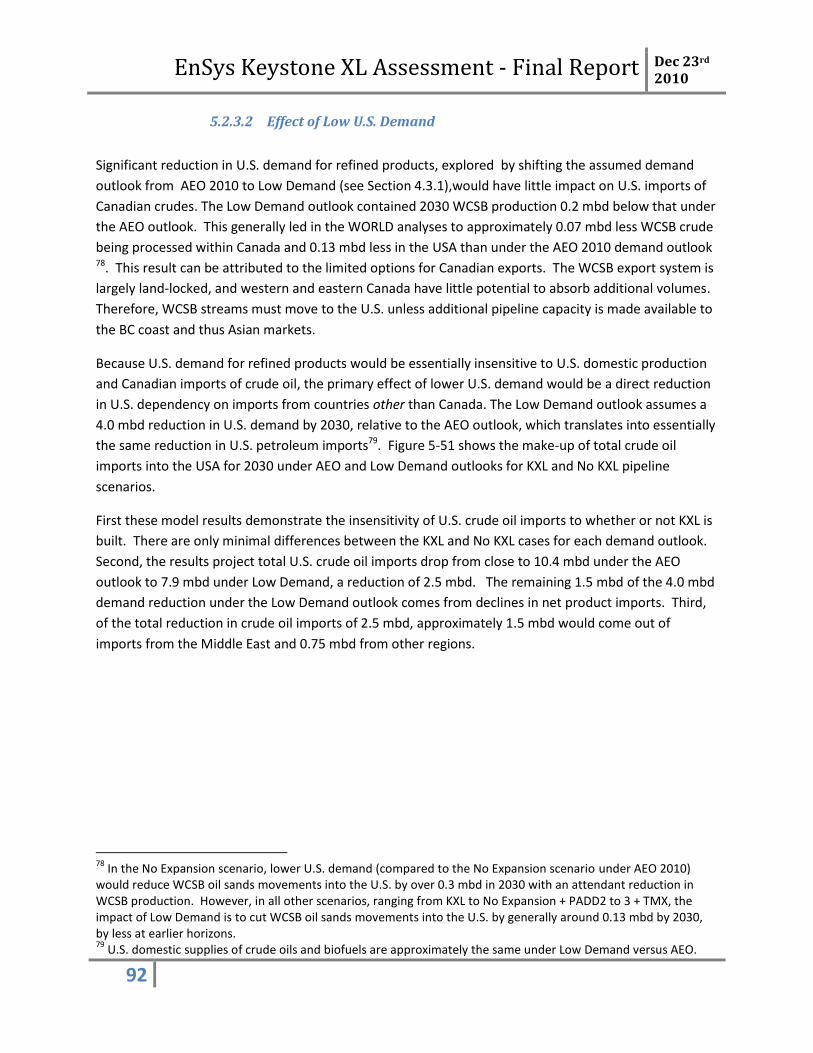
EnSys Keystone XL Assessment - Final Report Dec 23rd 2010
92
5.2.3.2 Effect of Low U.S. Demand
Significant reduction in U.S. demand for refined products, explored by shifting the assumed demand
outlook from AEO 2010 to Low Demand (see Section 4.3.1),would have little impact on U.S. imports of
Canadian crudes. The Low Demand outlook contained 2030 WCSB production 0.2 mbd below that under
the AEO outlook. This generally led in the WORLD analyses to approximately 0.07 mbd less WCSB crude
being processed within Canada and 0.13 mbd less in the USA than under the AEO 2010 demand outlook 78. This result can be attributed to the limited options for Canadian exports. The WCSB export system is
largely land-locked, and western and eastern Canada have little potential to absorb additional volumes.
Therefore, WCSB streams must move to the U.S. unless additional pipeline capacity is made available to
the BC coast and thus Asian markets.
Because U.S. demand for refined products would be essentially insensitive to U.S. domestic production
and Canadian imports of crude oil, the primary effect of lower U.S. demand would be a direct reduction
in U.S. dependency on imports from countries other than Canada. The Low Demand outlook assumes a
4.0 mbd reduction in U.S. demand by 2030, relative to the AEO outlook, which translates into essentially
the same reduction in U.S. petroleum imports79. Figure 5-51 shows the make-up of total crude oil
imports into the USA for 2030 under AEO and Low Demand outlooks for KXL and No KXL pipeline
scenarios.
First these model results demonstrate the insensitivity of U.S. crude oil imports to whether or not KXL is
built. There are only minimal differences between the KXL and No KXL cases for each demand outlook.
Second, the results project total U.S. crude oil imports drop from close to 10.4 mbd under the AEO
outlook to 7.9 mbd under Low Demand, a reduction of 2.5 mbd. The remaining 1.5 mbd of the 4.0 mbd
demand reduction under the Low Demand outlook comes from declines in net product imports. Third,
of the total reduction in crude oil imports of 2.5 mbd, approximately 1.5 mbd would come out of
imports from the Middle East and 0.75 mbd from other regions.
78
In the No Expansion scenario, lower U.S. demand (compared to the No Expansion scenario under AEO 2010) would reduce WCSB oil sands movements into the U.S. by over 0.3 mbd in 2030 with an attendant reduction in WCSB production. However, in all other scenarios, ranging from KXL to No Expansion + PADD2 to 3 + TMX, the impact of Low Demand is to cut WCSB oil sands movements into the U.S. by generally around 0.13 mbd by 2030, by less at earlier horizons. 79
U.S. domestic supplies of crude oils and biofuels are approximately the same under Low Demand versus AEO.
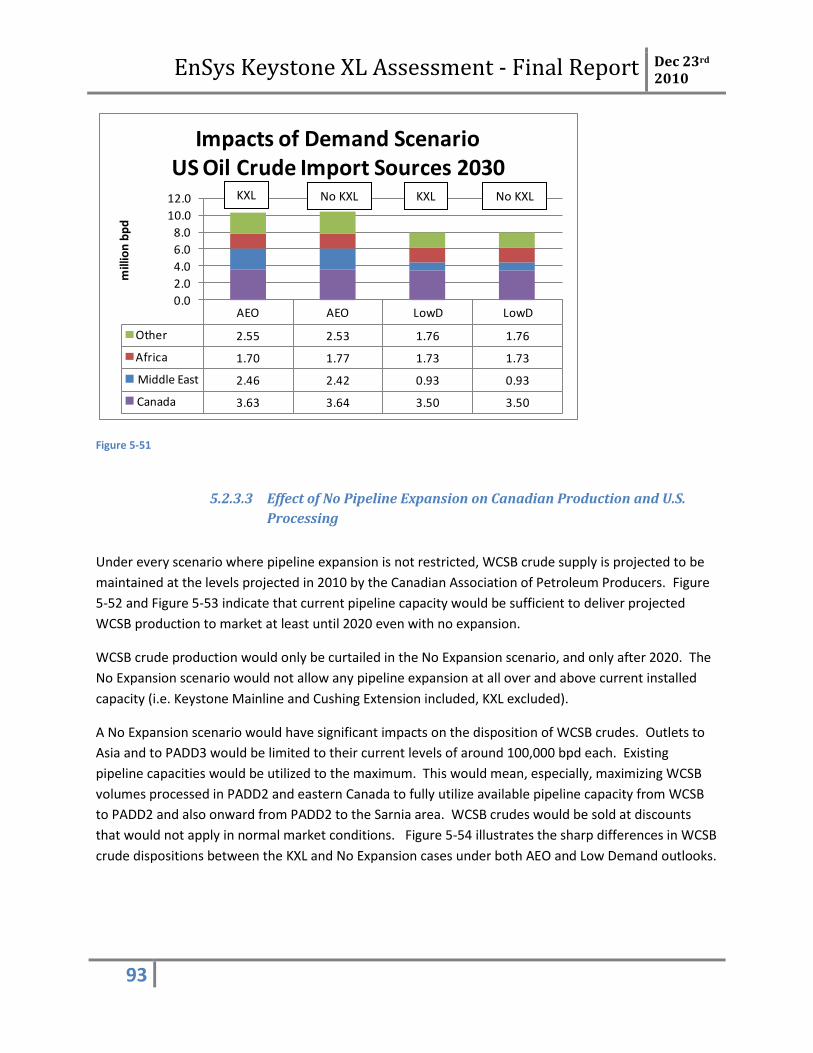
EnSys Keystone XL Assessment - Final Report Dec 23rd 2010
93
Figure 5-51
5.2.3.3 Effect of No Pipeline Expansion on Canadian Production and U.S.
Processing
Under every scenario where pipeline expansion is not restricted, WCSB crude supply is projected to be
maintained at the levels projected in 2010 by the Canadian Association of Petroleum Producers. Figure
5-52 and Figure 5-53 indicate that current pipeline capacity would be sufficient to deliver projected
WCSB production to market at least until 2020 even with no expansion.
WCSB crude production would only be curtailed in the No Expansion scenario, and only after 2020. The
No Expansion scenario would not allow any pipeline expansion at all over and above current installed
capacity (i.e. Keystone Mainline and Cushing Extension included, KXL excluded).
A No Expansion scenario would have significant impacts on the disposition of WCSB crudes. Outlets to
Asia and to PADD3 would be limited to their current levels of around 100,000 bpd each. Existing
pipeline capacities would be utilized to the maximum. This would mean, especially, maximizing WCSB
volumes processed in PADD2 and eastern Canada to fully utilize available pipeline capacity from WCSB
to PADD2 and also onward from PADD2 to the Sarnia area. WCSB crudes would be sold at discounts
that would not apply in normal market conditions. Figure 5-54 illustrates the sharp differences in WCSB
crude dispositions between the KXL and No Expansion cases under both AEO and Low Demand outlooks.
AEO AEO LowD LowD
Other 2.55 2.53 1.76 1.76
Africa 1.70 1.77 1.73 1.73
Middle East 2.46 2.42 0.93 0.93
Canada 3.63 3.64 3.50 3.50
0.0
2.0
4.0
6.0
8.0
10.0
12.0
mill
ion
bp
d
Impacts of Demand ScenarioUS Oil Crude Import Sources 2030
KXL KXL No KXL No KXL
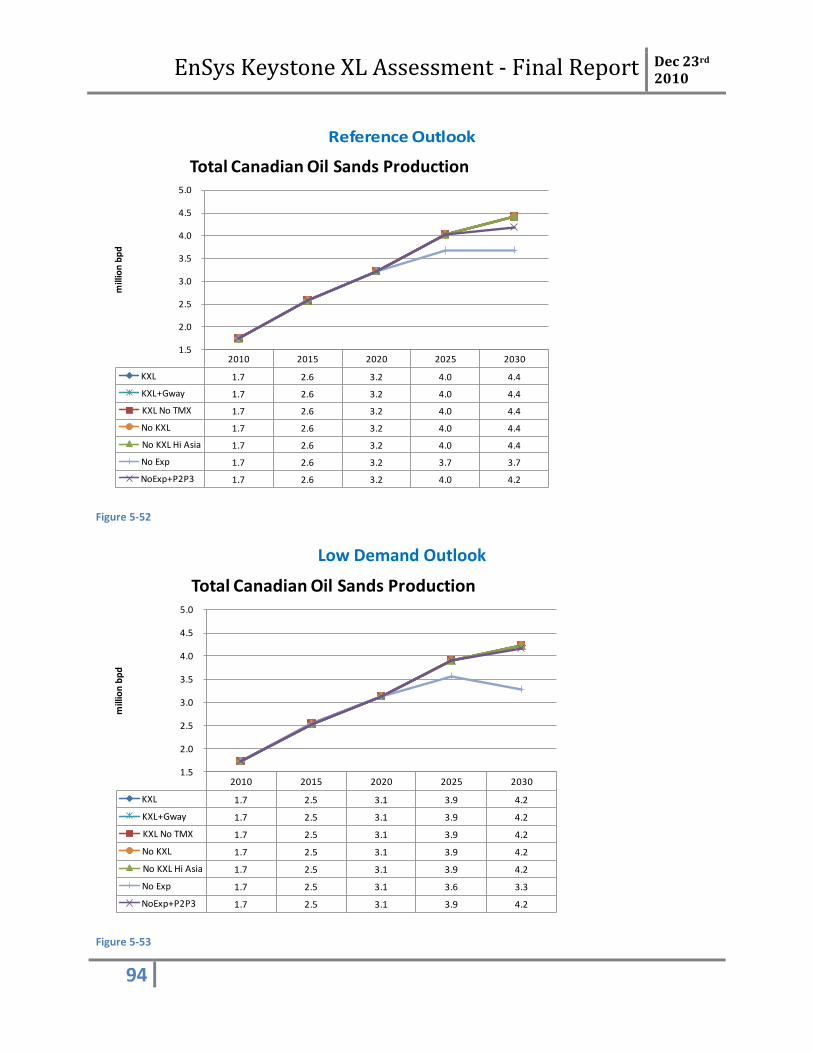
EnSys Keystone XL Assessment - Final Report Dec 23rd 2010
94
Reference Outlook
Figure 5-52
Figure 5-53
2010 2015 2020 2025 2030
KXL 1.7 2.6 3.2 4.0 4.4
KXL+Gway 1.7 2.6 3.2 4.0 4.4
KXL No TMX 1.7 2.6 3.2 4.0 4.4
No KXL 1.7 2.6 3.2 4.0 4.4
No KXL Hi Asia 1.7 2.6 3.2 4.0 4.4
No Exp 1.7 2.6 3.2 3.7 3.7
NoExp+P2P3 1.7 2.6 3.2 4.0 4.2
1.5
2.0
2.5
3.0
3.5
4.0
4.5
5.0
mill
ion
bp
d
Total Canadian Oil Sands Production
2010 2015 2020 2025 2030
KXL 1.7 2.5 3.1 3.9 4.2
KXL+Gway 1.7 2.5 3.1 3.9 4.2
KXL No TMX 1.7 2.5 3.1 3.9 4.2
No KXL 1.7 2.5 3.1 3.9 4.2
No KXL Hi Asia 1.7 2.5 3.1 3.9 4.2
No Exp 1.7 2.5 3.1 3.6 3.3
NoExp+P2P3 1.7 2.5 3.1 3.9 4.2
1.5
2.0
2.5
3.0
3.5
4.0
4.5
5.0
mill
ion
bp
d
Total Canadian Oil Sands Production
Low Demand Outlook
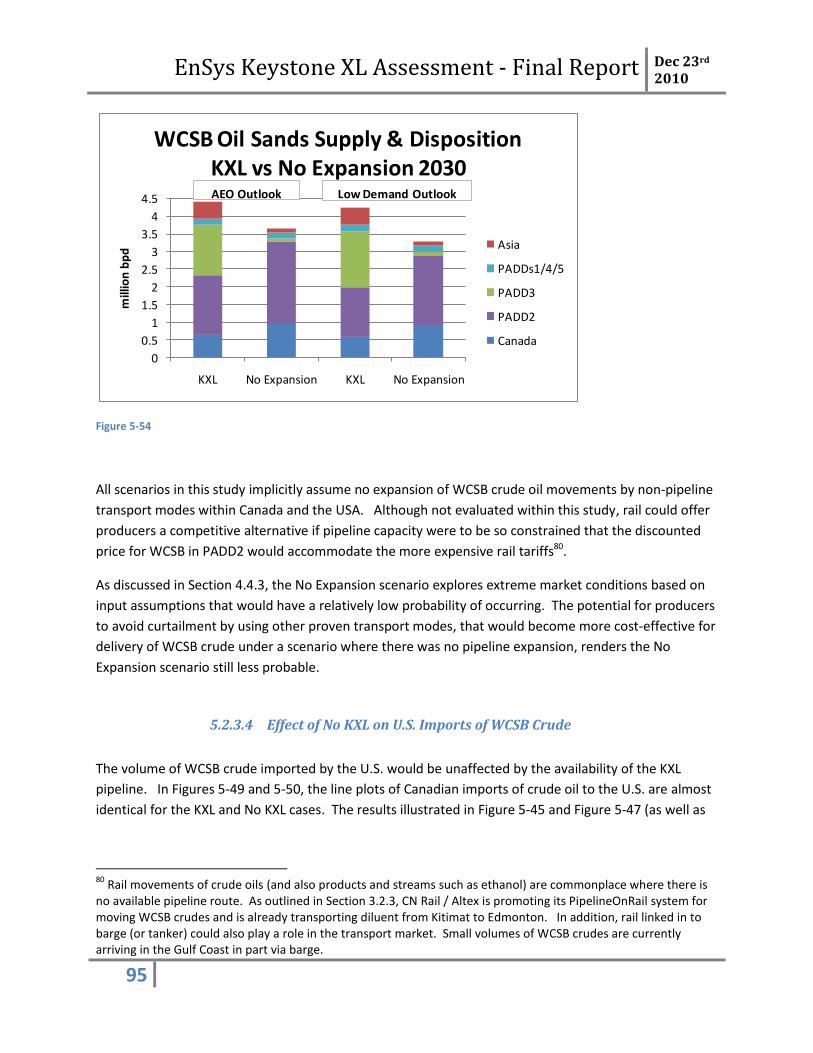
EnSys Keystone XL Assessment - Final Report Dec 23rd 2010
95
Figure 5-54
All scenarios in this study implicitly assume no expansion of WCSB crude oil movements by non-pipeline
transport modes within Canada and the USA. Although not evaluated within this study, rail could offer
producers a competitive alternative if pipeline capacity were to be so constrained that the discounted
price for WCSB in PADD2 would accommodate the more expensive rail tariffs80.
As discussed in Section 4.4.3, the No Expansion scenario explores extreme market conditions based on
input assumptions that would have a relatively low probability of occurring. The potential for producers
to avoid curtailment by using other proven transport modes, that would become more cost-effective for
delivery of WCSB crude under a scenario where there was no pipeline expansion, renders the No
Expansion scenario still less probable.
5.2.3.4 Effect of No KXL on U.S. Imports of WCSB Crude
The volume of WCSB crude imported by the U.S. would be unaffected by the availability of the KXL
pipeline. In Figures 5-49 and 5-50, the line plots of Canadian imports of crude oil to the U.S. are almost
identical for the KXL and No KXL cases. The results illustrated in Figure 5-45 and Figure 5-47 (as well as
80
Rail movements of crude oils (and also products and streams such as ethanol) are commonplace where there is no available pipeline route. As outlined in Section 3.2.3, CN Rail / Altex is promoting its PipelineOnRail system for moving WCSB crudes and is already transporting diluent from Kitimat to Edmonton. In addition, rail linked in to barge (or tanker) could also play a role in the transport market. Small volumes of WCSB crudes are currently arriving in the Gulf Coast in part via barge.
0
0.5
1
1.5
2
2.5
3
3.5
4
4.5
KXL No Expansion KXL No Expansion
mill
ion
bp
d
WCSB Oil Sands Supply & DispositionKXL vs No Expansion 2030
Asia
PADDs1/4/5
PADD3
PADD2
Canada
AEO Outlook Low Demand Outlook
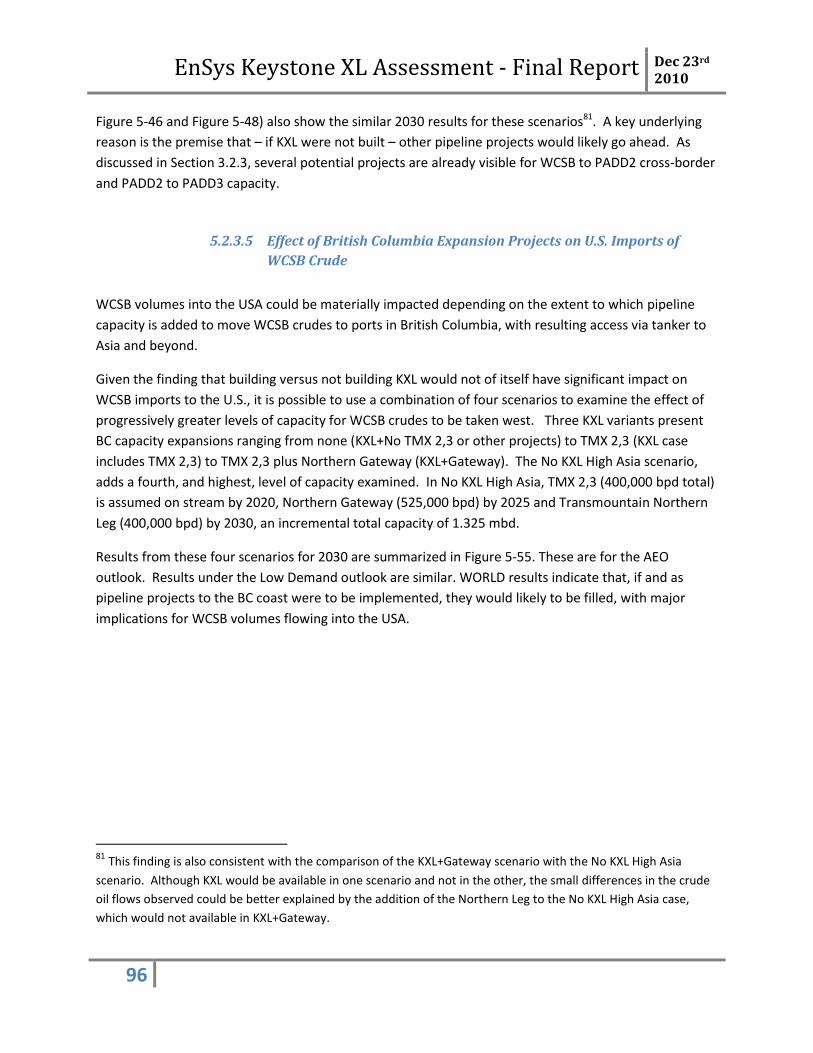
EnSys Keystone XL Assessment - Final Report Dec 23rd 2010
96
Figure 5-46 and Figure 5-48) also show the similar 2030 results for these scenarios81. A key underlying
reason is the premise that – if KXL were not built – other pipeline projects would likely go ahead. As
discussed in Section 3.2.3, several potential projects are already visible for WCSB to PADD2 cross-border
and PADD2 to PADD3 capacity.
5.2.3.5 Effect of British Columbia Expansion Projects on U.S. Imports of
WCSB Crude
WCSB volumes into the USA could be materially impacted depending on the extent to which pipeline
capacity is added to move WCSB crudes to ports in British Columbia, with resulting access via tanker to
Asia and beyond.
Given the finding that building versus not building KXL would not of itself have significant impact on
WCSB imports to the U.S., it is possible to use a combination of four scenarios to examine the effect of
progressively greater levels of capacity for WCSB crudes to be taken west. Three KXL variants present
BC capacity expansions ranging from none (KXL+No TMX 2,3 or other projects) to TMX 2,3 (KXL case
includes TMX 2,3) to TMX 2,3 plus Northern Gateway (KXL+Gateway). The No KXL High Asia scenario,
adds a fourth, and highest, level of capacity examined. In No KXL High Asia, TMX 2,3 (400,000 bpd total)
is assumed on stream by 2020, Northern Gateway (525,000 bpd) by 2025 and Transmountain Northern
Leg (400,000 bpd) by 2030, an incremental total capacity of 1.325 mbd.
Results from these four scenarios for 2030 are summarized in Figure 5-55. These are for the AEO
outlook. Results under the Low Demand outlook are similar. WORLD results indicate that, if and as
pipeline projects to the BC coast were to be implemented, they would likely to be filled, with major
implications for WCSB volumes flowing into the USA.
81 This finding is also consistent with the comparison of the KXL+Gateway scenario with the No KXL High Asia
scenario. Although KXL would be available in one scenario and not in the other, the small differences in the crude
oil flows observed could be better explained by the addition of the Northern Leg to the No KXL High Asia case,
which would not available in KXL+Gateway.
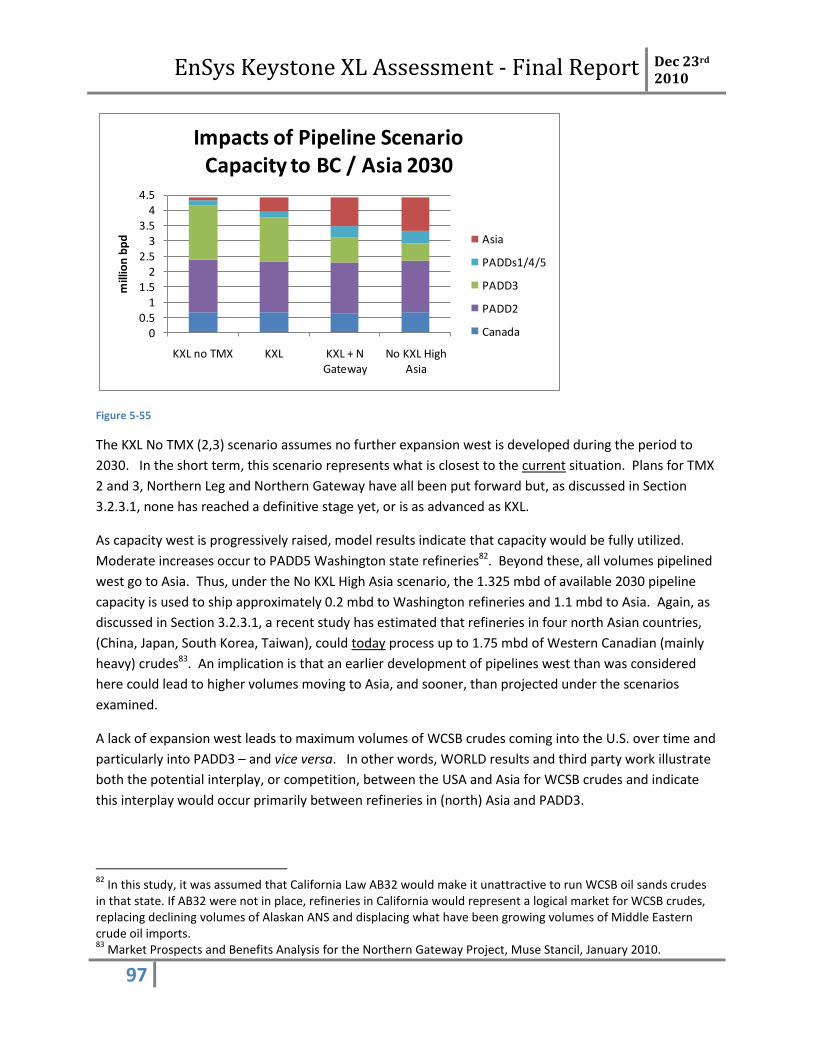
EnSys Keystone XL Assessment - Final Report Dec 23rd 2010
97
Figure 5-55
The KXL No TMX (2,3) scenario assumes no further expansion west is developed during the period to
2030. In the short term, this scenario represents what is closest to the current situation. Plans for TMX
2 and 3, Northern Leg and Northern Gateway have all been put forward but, as discussed in Section
3.2.3.1, none has reached a definitive stage yet, or is as advanced as KXL.
As capacity west is progressively raised, model results indicate that capacity would be fully utilized.
Moderate increases occur to PADD5 Washington state refineries82. Beyond these, all volumes pipelined
west go to Asia. Thus, under the No KXL High Asia scenario, the 1.325 mbd of available 2030 pipeline
capacity is used to ship approximately 0.2 mbd to Washington refineries and 1.1 mbd to Asia. Again, as
discussed in Section 3.2.3.1, a recent study has estimated that refineries in four north Asian countries,
(China, Japan, South Korea, Taiwan), could today process up to 1.75 mbd of Western Canadian (mainly
heavy) crudes83. An implication is that an earlier development of pipelines west than was considered
here could lead to higher volumes moving to Asia, and sooner, than projected under the scenarios
examined.
A lack of expansion west leads to maximum volumes of WCSB crudes coming into the U.S. over time and
particularly into PADD3 – and vice versa. In other words, WORLD results and third party work illustrate
both the potential interplay, or competition, between the USA and Asia for WCSB crudes and indicate
this interplay would occur primarily between refineries in (north) Asia and PADD3.
82
In this study, it was assumed that California Law AB32 would make it unattractive to run WCSB oil sands crudes in that state. If AB32 were not in place, refineries in California would represent a logical market for WCSB crudes, replacing declining volumes of Alaskan ANS and displacing what have been growing volumes of Middle Eastern crude oil imports. 83
Market Prospects and Benefits Analysis for the Northern Gateway Project, Muse Stancil, January 2010.
00.5
11.5
22.5
33.5
44.5
KXL no TMX KXL KXL + N Gateway
No KXL High Asia
mill
ion
bp
d
Impacts of Pipeline ScenarioCapacity to BC / Asia 2030
Asia
PADDs1/4/5
PADD3
PADD2
Canada

EnSys Keystone XL Assessment - Final Report Dec 23rd 2010
98
5.2.3.6 Effect of Pipeline Availability on U.S. Non-Canadian Crude Oil
Imports
Strongly evident from WORLD results is the interplay and inverse relationship between WCSB and non-
Canadian foreign crude imports into the USA independent of KXL availability. As illustrated in Figures 5-
56 and 5-57, WCSB oil sands imports into the USA are projected to be significantly affected by pipeline
scenario, varying by up to 0.6 mbd by 2020 and over 1 mbd by 2030. Within this, the variability is
projected to be primarily in the DilBit blends, more so than fully upgraded synthetic crude oil. Again,
these volumes and variability are little impacted by U.S. product demand level.
Conversely, imports from non-Canadian sources into the USA, depend on both the pipeline scenario and
the U.S. demand level - with two specific exceptions. Since Western Canada, Mexico and Venezuela are
all major producers of heavy crudes and are all three major exporters of same into the USA, one could, a
priori, expect that lower WCSB imports into the U.S. would lead to higher imports from Mexico and/or
Venezuela and vice versa. This is not, however, projected to be the case. Crude oil imports into the USA
from Mexico and Venezuela have been the subject of a steady decline in recent years. According to EIA
statistics84, crude oil imports from Venezuela have dropped from 1.3 mbd in 2004 to 0.95 mbd in 2009
and those from Mexico from 1.6 mbd in 2004 to 1.09 mbd in 2009, in total a decline from 2.9 mbd in
2004 to 2.14 mbd in 2009.
Mexico is suffering from rapid production declines, especially of its key heavy Mayan crude, much of
which is purchased by refineries on the Gulf Coast. A continuing decline in Mexican production, led by
Mayan, is widely expected by industry analysts85. Further, PEMEX has a project under way to upgrade
one of its refineries (Minatitlan) so that it can process Mayan crude, thereby taking yet more Mayan
volumes off export markets. The net effect is that imports to the USA of Mayan crude are projected in
the WORLD cases to drop sharply by 2020.
In Venezuela, production of conventional crudes has been flat to declining. Production and upgrading
of the massive extra heavy Orinoco oil reserves has been relatively static. Although volumes of
Venezuelan production and exports are expected to gradually increase over time, EnSys took the view
that inter-company deals and geopolitical interests would lead to a continuation of the trend of moving
84
http://www.eia.gov/dnav/pet/pet_move_impcus_a2_nus_epc0_im0_mbblpd_a.htm. 85
A law was signed by President Calderon in Mexico that would allow foreign companies to participate in Mexican crude oil production. PEMEX’ June 2010 business plan, http://www.pemex.com/files/content/business_plan_100712.pdf, page 39, projects crude oil production recovering from under 2.6 mbd in 2010 to 3.3 mbd by 2024. However, this projection is considered optimistic. For this study, EnSys used the projection for Mexican crude oil production in the EIA 2010 International Energy Outlook. The IEO projection, which we believe is broadly in line with other current projections, has the decline rate for total Mexican crude production slowing from over 7% p.a. 2007 through 2009 to under 4% p.a. average for 2010 through 2030. The decline rate for heavy Mexican crude is projected at over 6% p.a. average, (versus 12.2% p.a. average 2007 – 2009), thus both the volume and the proportion of heavy (Mayan type) crude decline progressively over time. The slowing of the projected decline rates versus recent history arguably is a reflection of assumed benefits arising from increased foreign participation in Mexico’s production.
EnSys Keystone XL Assessment - Final Report Dec 23rd 2010
99
crudes to markets outside the USA, notably Asia, thereby removing potential for any significant upward
reversal in exports to the U.S.
Consequently, combined U.S. import volumes of Mexican plus Venezuelan crudes are projected in all
scenarios to drop from around 2 mbd today to around 0.9 mbd in 2020 and slightly less beyond 2020, as
illustrated in Figure 5-58 and Figure 5-59. This development is only minimally affected by availability of
pipelines delivering imported WCSB crude oil.
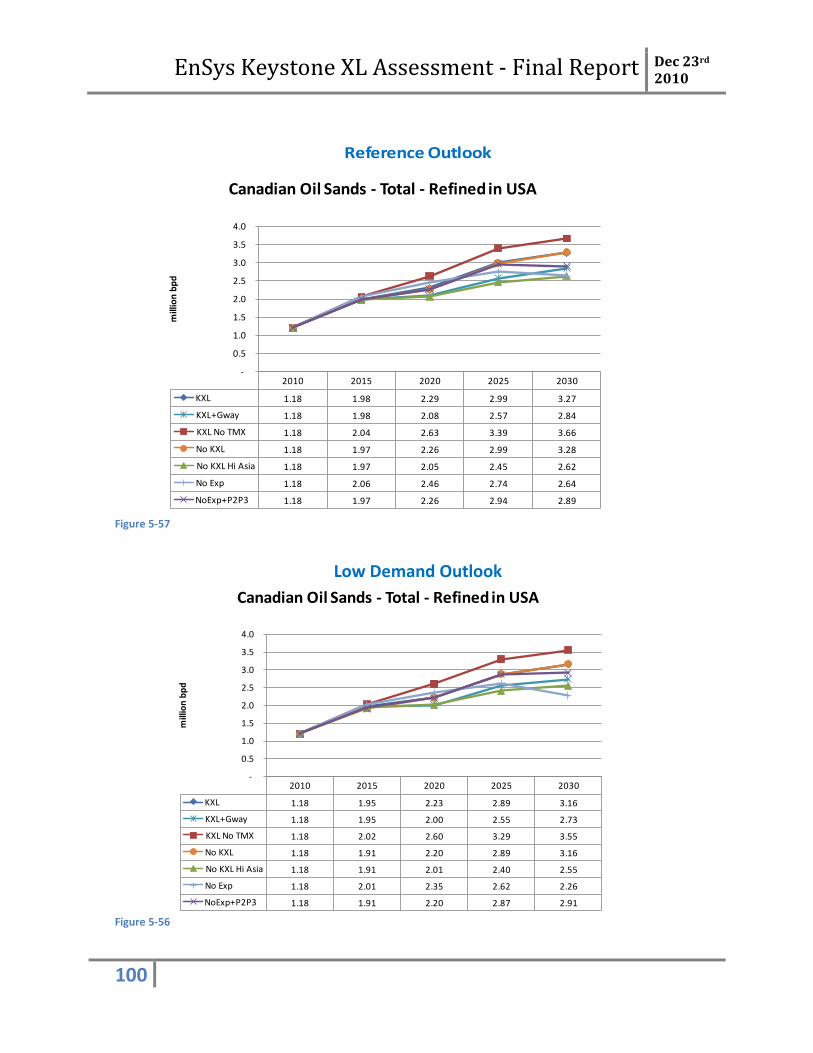
EnSys Keystone XL Assessment - Final Report Dec 23rd 2010
100
Reference Outlook
2010 2015 2020 2025 2030
KXL 1.18 1.95 2.23 2.89 3.16
KXL+Gway 1.18 1.95 2.00 2.55 2.73
KXL No TMX 1.18 2.02 2.60 3.29 3.55
No KXL 1.18 1.91 2.20 2.89 3.16
No KXL Hi Asia 1.18 1.91 2.01 2.40 2.55
No Exp 1.18 2.01 2.35 2.62 2.26
NoExp+P2P3 1.18 1.91 2.20 2.87 2.91
-
0.5
1.0
1.5
2.0
2.5
3.0
3.5
4.0
mill
ion
bp
d
Canadian Oil Sands - Total - Refined in USAReference & Scenarios
2010 2015 2020 2025 2030
KXL 1.18 1.98 2.29 2.99 3.27
KXL+Gway 1.18 1.98 2.08 2.57 2.84
KXL No TMX 1.18 2.04 2.63 3.39 3.66
No KXL 1.18 1.97 2.26 2.99 3.28
No KXL Hi Asia 1.18 1.97 2.05 2.45 2.62
No Exp 1.18 2.06 2.46 2.74 2.64
NoExp+P2P3 1.18 1.97 2.26 2.94 2.89
-
0.5
1.0
1.5
2.0
2.5
3.0
3.5
4.0
mill
ion
bp
d
Canadian Oil Sands - Total - Refined in USAReference & Scenarios
Figure 5-57
Figure 5-56
Low Demand Outlook

EnSys Keystone XL Assessment - Final Report Dec 23rd 2010
101
Reference Outlook
Figure 5-58
Figure 5-59
2010 2015 2020 2025 2030
KXL 1.86 1.50 0.91 0.74 0.74
KXL+Gway 1.86 1.50 0.87 0.81 0.76
KXL No TMX 1.86 1.49 0.94 0.70 0.75
No KXL 1.86 1.45 0.98 0.74 0.74
No KXL Hi Asia 1.86 1.45 0.87 0.82 0.76
No Exp 1.86 1.45 0.93 0.89 0.89
NoExp+P2P3 1.86 1.45 0.98 0.72 0.76
-
0.20
0.40
0.60
0.80
1.00
1.20
1.40
1.60
1.80
2.00
mill
ion
bp
d
US Crude Imports from Mexico & VenezuelaReference and Scenario
2010 2015 2020 2025 2030
KXL 1.86 1.49 0.93 0.67 0.80
KXL+Gway 1.86 1.49 0.92 0.68 0.84
KXL No TMX 1.86 1.49 0.97 0.66 0.80
No KXL 1.86 1.46 0.99 0.67 0.80
No KXL Hi Asia 1.86 1.46 0.91 0.70 0.86
No Exp 1.86 1.47 0.97 0.86 0.96
NoExp+P2P3 1.86 1.46 0.99 0.68 0.78
-
0.20
0.40
0.60
0.80
1.00
1.20
1.40
1.60
1.80
2.00
mill
ion
bp
d
US Crude Imports from Mexico & VenezuelaReference and Scenario
Low Demand Outlook
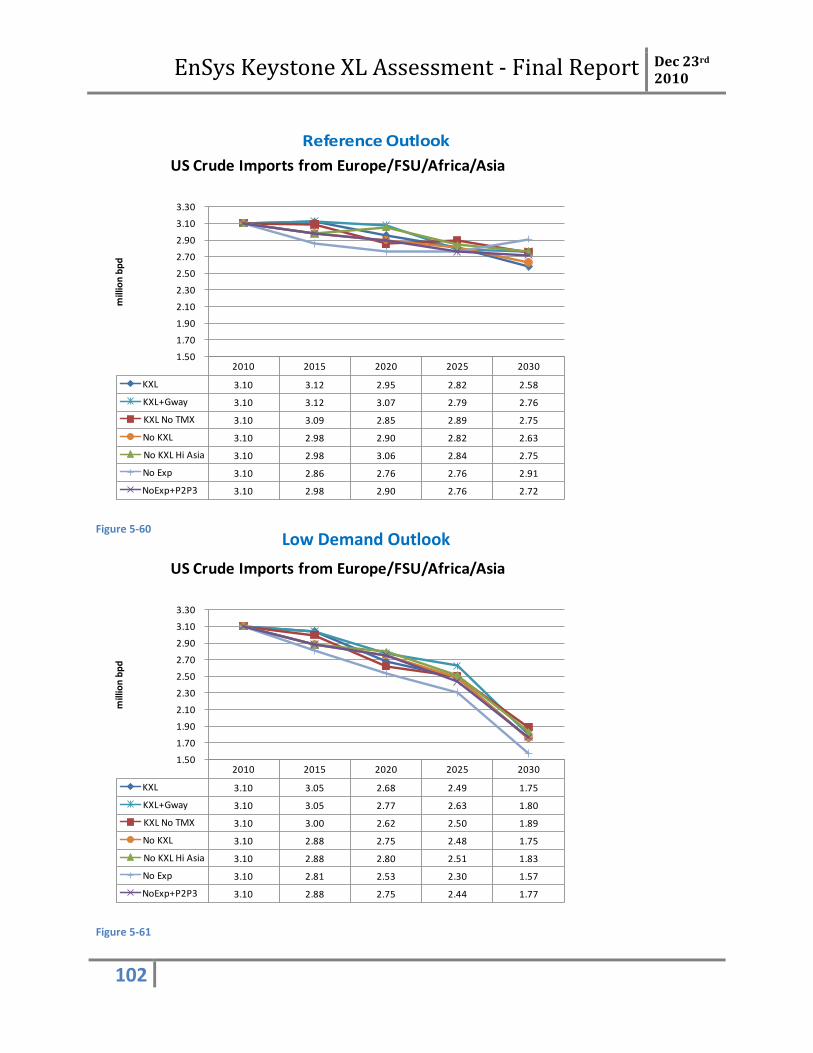
EnSys Keystone XL Assessment - Final Report Dec 23rd 2010
102
Reference Outlook
Reference Outlook
Reference Outlook
Figure 5-60
Figure 5-61
2010 2015 2020 2025 2030
KXL 3.10 3.12 2.95 2.82 2.58
KXL+Gway 3.10 3.12 3.07 2.79 2.76
KXL No TMX 3.10 3.09 2.85 2.89 2.75
No KXL 3.10 2.98 2.90 2.82 2.63
No KXL Hi Asia 3.10 2.98 3.06 2.84 2.75
No Exp 3.10 2.86 2.76 2.76 2.91
NoExp+P2P3 3.10 2.98 2.90 2.76 2.72
1.50
1.70
1.90
2.10
2.30
2.50
2.70
2.90
3.10
3.30
mill
ion
bp
d
US Crude Imports from Europe/FSU/Africa/AsiaReference and Scenario
2010 2015 2020 2025 2030
KXL 3.10 3.05 2.68 2.49 1.75
KXL+Gway 3.10 3.05 2.77 2.63 1.80
KXL No TMX 3.10 3.00 2.62 2.50 1.89
No KXL 3.10 2.88 2.75 2.48 1.75
No KXL Hi Asia 3.10 2.88 2.80 2.51 1.83
No Exp 3.10 2.81 2.53 2.30 1.57
NoExp+P2P3 3.10 2.88 2.75 2.44 1.77
1.50
1.70
1.90
2.10
2.30
2.50
2.70
2.90
3.10
3.30
mill
ion
bp
d
US Crude Imports from Europe/FSU/Africa/AsiaReference and Scenario
Low Demand Outlook

EnSys Keystone XL Assessment - Final Report Dec 23rd 2010
103
Reference Outlook
The main balancing sources for crude supplies into the U.S. are projected as Africa and especially the
Middle East. Figure 5-60 and Figure 5-61 illustrate that crude imports from Europe/FSU/Africa/Asia are
projected to vary moderately depending on pipeline scenario. The main variability within this group
relates to crudes from Africa. The figures also show that imports from these regions are sensitive to
and drop with lower U.S. product demand. Versus very slowly declining under the AEO outlook, from
around 3 mbd in the 2010-2015 timeframe to around 2.7 mbd by 2030, import levels drop significantly
under Low Demand, to 1.9 mbd by 2030.
Middle East crude oil imports are also projected as being impacted by both pipeline scenario and U.S.
demand level (Figure 5-62 and Figure 5-63). Pipeline scenario is projected as affecting Middle East
imports to the U.S. by as much as 0.5 mbd by 2020 and 1 mbd by 2030. Essentially, the more WCSB
crude moves to Asia, the more Middle East crude (displaced from Asia) moves into the USA. Shifting
from the AEO to the Low Demand outlook for U.S. consumption turns a projected slow growth in Middle
East crude imports (around +1 mbd by 2030) into a significant decline post 2015. By 2030, the Low
Demand outlook is projected as lowering Middle East imports by around 1.5 mbd versus the AEO
outlook.
Figure 5-62
2010 2015 2020 2025 2030
KXL 1.57 1.96 1.93 2.08 2.46
KXL+Gway 1.57 1.96 2.13 2.46 2.68
KXL No TMX 1.57 1.92 1.70 1.70 1.73
No KXL 1.57 2.13 1.99 2.08 2.42
No KXL Hi Asia 1.57 2.13 2.20 2.49 2.79
No Exp 1.57 2.09 1.88 2.01 2.49
NoExp+P2P3 1.57 2.13 1.99 2.18 2.62
-
0.5
1.0
1.5
2.0
2.5
3.0
3.5
4.0
mill
ion
bp
d
US Imports of Middle East CrudeReference & Scenarios
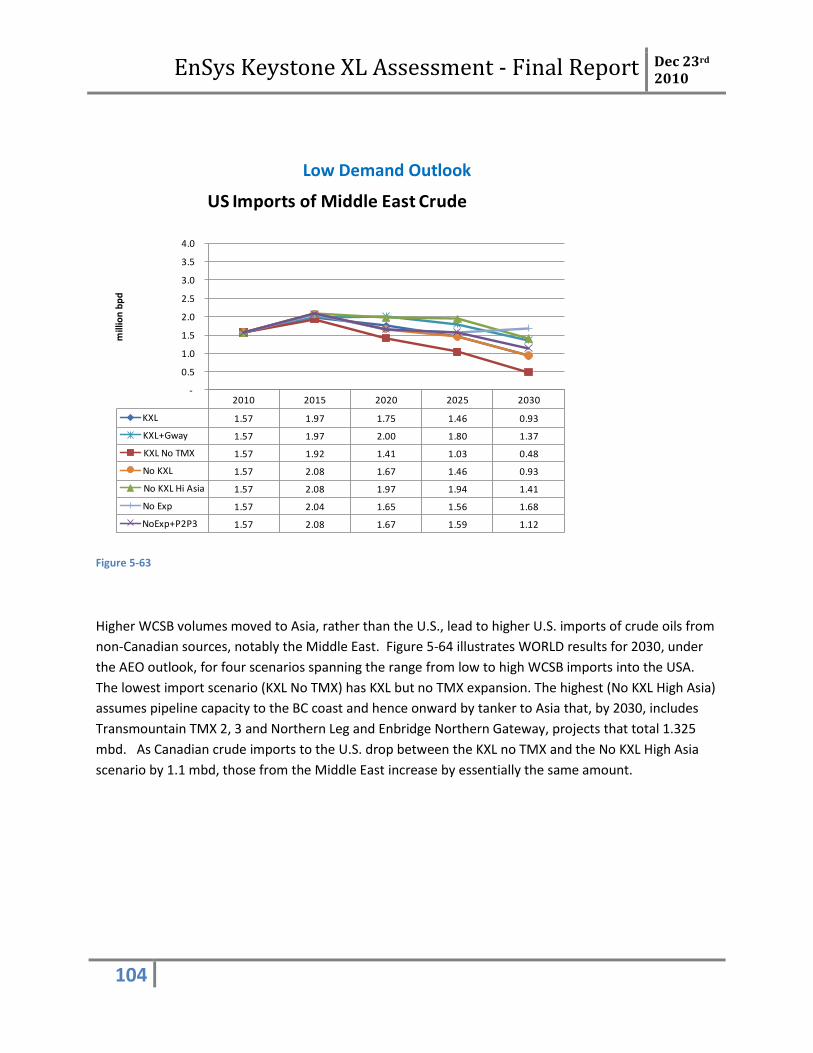
EnSys Keystone XL Assessment - Final Report Dec 23rd 2010
104
Figure 5-63
Higher WCSB volumes moved to Asia, rather than the U.S., lead to higher U.S. imports of crude oils from
non-Canadian sources, notably the Middle East. Figure 5-64 illustrates WORLD results for 2030, under
the AEO outlook, for four scenarios spanning the range from low to high WCSB imports into the USA.
The lowest import scenario (KXL No TMX) has KXL but no TMX expansion. The highest (No KXL High Asia)
assumes pipeline capacity to the BC coast and hence onward by tanker to Asia that, by 2030, includes
Transmountain TMX 2, 3 and Northern Leg and Enbridge Northern Gateway, projects that total 1.325
mbd. As Canadian crude imports to the U.S. drop between the KXL no TMX and the No KXL High Asia
scenario by 1.1 mbd, those from the Middle East increase by essentially the same amount.
2010 2015 2020 2025 2030
KXL 1.57 1.97 1.75 1.46 0.93
KXL+Gway 1.57 1.97 2.00 1.80 1.37
KXL No TMX 1.57 1.92 1.41 1.03 0.48
No KXL 1.57 2.08 1.67 1.46 0.93
No KXL Hi Asia 1.57 2.08 1.97 1.94 1.41
No Exp 1.57 2.04 1.65 1.56 1.68
NoExp+P2P3 1.57 2.08 1.67 1.59 1.12
-
0.5
1.0
1.5
2.0
2.5
3.0
3.5
4.0
mill
ion
bp
d
US Imports of Middle East CrudeReference & Scenarios
Low Demand Outlook
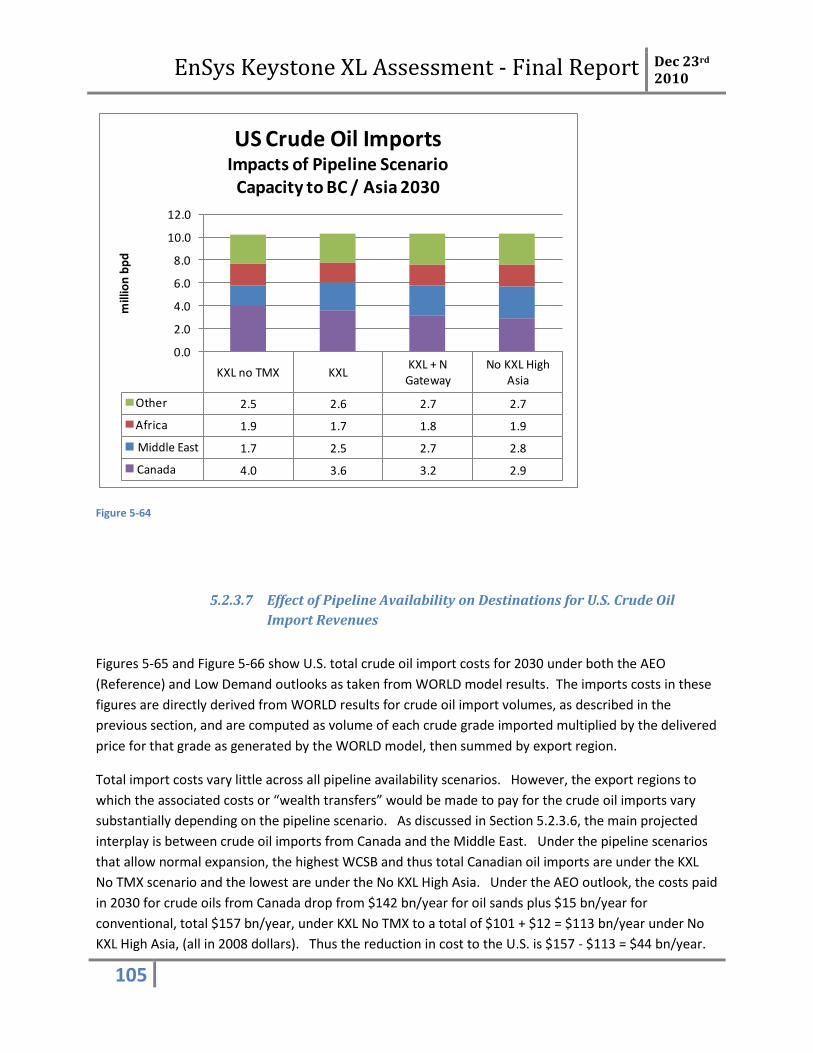
EnSys Keystone XL Assessment - Final Report Dec 23rd 2010
105
Figure 5-64
5.2.3.7 Effect of Pipeline Availability on Destinations for U.S. Crude Oil
Import Revenues
Figures 5-65 and Figure 5-66 show U.S. total crude oil import costs for 2030 under both the AEO
(Reference) and Low Demand outlooks as taken from WORLD model results. The imports costs in these
figures are directly derived from WORLD results for crude oil import volumes, as described in the
previous section, and are computed as volume of each crude grade imported multiplied by the delivered
price for that grade as generated by the WORLD model, then summed by export region.
Total import costs vary little across all pipeline availability scenarios. However, the export regions to
which the associated costs or “wealth transfers” would be made to pay for the crude oil imports vary
substantially depending on the pipeline scenario. As discussed in Section 5.2.3.6, the main projected
interplay is between crude oil imports from Canada and the Middle East. Under the pipeline scenarios
that allow normal expansion, the highest WCSB and thus total Canadian oil imports are under the KXL
No TMX scenario and the lowest are under the No KXL High Asia. Under the AEO outlook, the costs paid
in 2030 for crude oils from Canada drop from $142 bn/year for oil sands plus $15 bn/year for
conventional, total $157 bn/year, under KXL No TMX to a total of $101 + $12 = $113 bn/year under No
KXL High Asia, (all in 2008 dollars). Thus the reduction in cost to the U.S. is $157 - $113 = $44 bn/year.
KXL no TMX KXLKXL + N
GatewayNo KXL High
Asia
Other 2.5 2.6 2.7 2.7
Africa 1.9 1.7 1.8 1.9
Middle East 1.7 2.5 2.7 2.8
Canada 4.0 3.6 3.2 2.9
0.0
2.0
4.0
6.0
8.0
10.0
12.0
mill
ion
bp
d
US Crude Oil ImportsImpacts of Pipeline Scenario
Capacity to BC / Asia 2030
EnSys Keystone XL Assessment - Final Report Dec 23rd 2010
106
Against this, the costs of Middle East crude oil imports rise from $72 bn/year under KXL No TMX to $115
bn/year under No KXL High Asia, an increase of $43 bn/year. This shift relates to just over 10% of the
total 2030 U.S. crude oil import cost of around $415 bn/year.
Under the Low Demand outlook, the corresponding projections are for the costs of Canadian crude oil
imports to be $40 bn /year lower under No KXL High Asia and the costs of Middle East crude oil imports
$37 bn/year higher. This shift in revenues is close in $bn / year to that under the AEO demand outlook.
However, the percentage shift is larger, around 12%, since the total U.S. crude oil import bill is lower at
$306 bn /year.
Under the AEO demand outlook, KXL No TMX pipeline scenario, Canadian crude oils comprise 38% of
total U.S. crude oil import costs in 2030. Under the same pipeline scenario but Low Demand outlook,
the proportion rises to 48%.
The data in Figures 5-65 and Figure 5-66 also reinforce how demand outlook has limited impact on the
cost to the USA of crude oil imports from Canada but a substantial impact on costs of imports from (and
thus potential “wealth transfer” to) regions other than Canada. As discussed in Section 5.2.3.5, EnSys’
projections were that crude oil imports from Mexico and Venezuela would change little across any
scenario or demand outlook. The cost of imports from those two countries is consequently projected
as changing little. Conversely, the cost of crude oil imports from Europe/FSU/Asia, Africa and especially
the Middle East are projected to be substantially lower under Low Demand than under the AEO
Reference outlook.
The charts reiterate the minimal differences anticipated between the KXL and No KXL scenarios by 2030.
They also illustrate how oil sands would dominate US crude oil imports from Canada by 2030 and how
the value of those imports would be cut under the No Expansion scenario.
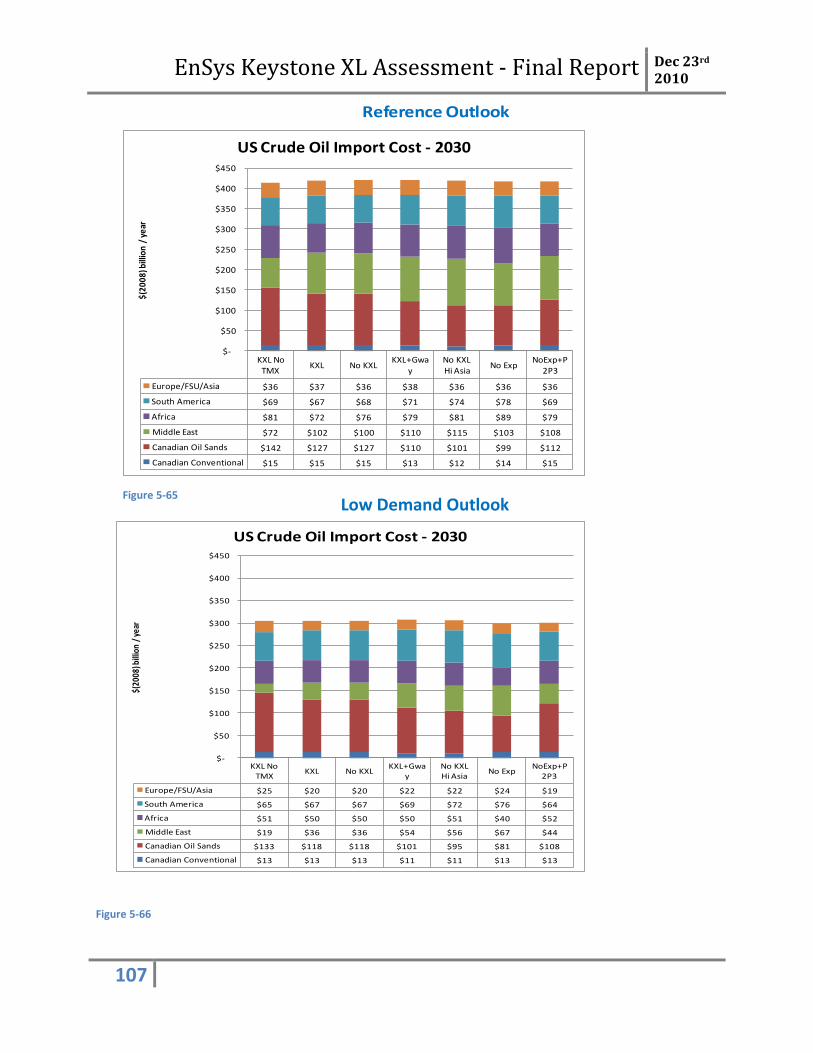
EnSys Keystone XL Assessment - Final Report Dec 23rd 2010
107
Reference Outlook
Reference Outlook
Reference Outlook
Figure 5-66
KXL No TMX
KXL No KXLKXL+Gwa
yNo KXL Hi Asia
No ExpNoExp+P
2P3
Europe/FSU/Asia $25 $20 $20 $22 $22 $24 $19
South America $65 $67 $67 $69 $72 $76 $64
Africa $51 $50 $50 $50 $51 $40 $52
Middle East $19 $36 $36 $54 $56 $67 $44
Canadian Oil Sands $133 $118 $118 $101 $95 $81 $108
Canadian Conventional $13 $13 $13 $11 $11 $13 $13
$-
$50
$100
$150
$200
$250
$300
$350
$400
$450
$(20
08) b
illio
n /
year
US Crude Oil Import Cost - 2030
KXL No TMX
KXL No KXLKXL+Gwa
yNo KXL Hi Asia
No ExpNoExp+P
2P3
Europe/FSU/Asia $36 $37 $36 $38 $36 $36 $36
South America $69 $67 $68 $71 $74 $78 $69
Africa $81 $72 $76 $79 $81 $89 $79
Middle East $72 $102 $100 $110 $115 $103 $108
Canadian Oil Sands $142 $127 $127 $110 $101 $99 $112
Canadian Conventional $15 $15 $15 $13 $12 $14 $15
$-
$50
$100
$150
$200
$250
$300
$350
$400
$450
$(20
08) b
illio
n /
year
US Crude Oil Import Cost - 2030
Figure 5-65 Low Demand Outlook
EnSys Keystone XL Assessment - Final Report Dec 23rd 2010
108
5.2.3.8 U.S. & Canada Regional Potential to Absorb WCSB Crude Oils
WORLD results show that, in considering potential destinations for WCSB crudes within the USA and
Canada, it is necessary to consider the very different opportunities offered by different regions. Broadly,
the results show limited potential for increased volumes to be refined in western and eastern Canada,
PADDs 1, 4 and 5 and significant potential in PADD2 and especially PADD3.
Western Canadian refineries already rely totally on WCSB crude oils. Given projected flat Canadian oil
demand growth, and recognizing this study did not include any “vision” scenario under which WCSB
crude upgrading and refining would extend to developing significant product exports and
petrochemicals, (see Section 4.2.3), western Canadian refineries are projected to have little additional
ability to absorb WCSB crudes.
Eastern Canadian refineries today process a mix of WCSB and foreign crude oils. WORLD projections
are for the mix to stay relatively stable over time. This avoids eastern Canadian refineries having to
undertaken major investments to take in heavy WCSB streams.
Crude oils from WCSB are currently processed in only one small PADD1 refinery in Warren, western
Pennsylvania. Given that refinery’s relatively isolated location, it was assumed that its ability to expand
and to take in additional WCSB volumes would be minor.
PADD4 refineries take in WCSB crudes today but also represent one outlet for growing Bakken crude
production. As discussed in Section 3.2.3.2, expansions of the Butte pipeline from the Bakken area to
PADD4 are planned. Study results showed increases in Bakken crudes being run in PADD4 with
resulting flat to reduced levels of WCSB crudes86.
PADD5 refineries comprise two main groups, those in Washington state and those in California.
Washington refineries were projected as able to take additional WCSB crudes under scenarios where
pipeline capacity to BC is expanded. However, volumes are projected to be modest. The group’s
refinery capacity totals some 623,000 bpd but ANS crude comprises a primary intake. Even with
continuing declines in ANS production, these refineries are projected to continue to take in appreciable
proportions of ANS crude, thereby offering opportunities for WCSB crudes but limited in scale.
In contrast, California refineries include some 1.8 mbd of capacity comprising large, highly complex
facilities that run a high proportion of heavy crudes. These refineries have been taking in growing
volumes of Middle Eastern grades in recent years as production from California’s own fields and from
Alaska has declined87. In principle therefore, the California refineries represent a significant potential
market for WCSB crude oils and a good fit with heavy grades, both to replace declining domestic
production and to displace imports. This study, however, was undertaken on the basis that California
86
In 2009, PADD4 refineries processed 540,000 bpd of crude, of which 231,000 bpd was from Canada. 87
PADD5 refineries in total processed around 50,000 bpd Middle East crudes in the mid 1990’s. The level then rose progressively to 400,000 bpd by 2004. Since then, imports have remained in a 400,000 – 500,000 bpd range. Source: http://www.eia.gov/dnav/pet/hist/LeafHandler.ashx?n=pet&s=mcripp5pg2&f=a.
EnSys Keystone XL Assessment - Final Report Dec 23rd 2010
109
Law AB32 would be in place88 and that this would effectively prevent the processing of any WCSB oil
sands in the state (while still allowing conventional WCSB crudes). Consequently, the potential market
for WCSB oil sands crudes in California was not examined.
As shown by the WORLD results across a range of scenarios, PADDs 2 and 3 represent the key areas with
the potential to take in significant additional volumes of WCSB crudes.
WORLD results for PADD2 are summarized in Figure 5-67 and Figure 5-68. Under the KXL scenario,
PADD2 refinery processing of WCSB oil sands streams roughly doubles from today’s levels to around 1.7
mbd post 2020. PADD2 oil sands volumes processed are sensitive to the assumed capacity of pipelines
west to BC and thence by tanker to Asia. Introducing more such capacity reduces WCSB flows into
PADD2 and vice-versa. WCSB volumes processed in PADD2 are projected to be highest under the No
Expansion scenario. Constraining pipeline capacity to today’s levels severely limits ability to move WCSB
crudes to Asia or into PADD3 and creates economic incentives to maximize use of existing pipeline cross-
border capacity into PADD2 (also onward to eastern Canada) so as to minimize production shut-in of
WCSB crudes. AEO or Low Demand outlook makes little difference to WCSB volumes processed in
PADD2 under any one pipeline scenario, except from 2025 to 2030 when volumes processed are lower
under the Low Demand outlook.
A number of projects have been implemented or are under way in PADD2 to increase refinery intakes of
heavy WCSB crudes, including oil sands. These projects have generally comprised high cost refinery
upgrades entailing installation of cokers and other major processing units. They were included in the
total capacity for PADD2 assumed to be on stream before 2015 and are a major factor in the increases
projected for PADD2 processing of WCSB crudes89. PADD2 refining capacity totals 3.6 mbd. Other than
in the No Expansion scenario, WORLD results indicate a potential for PADD2 to process up to 2 mbd of
oil sands crudes90. Based purely on transport economics, the economic logic would be to process all
available WCSB supply in PADD2 before sending any on to PADD3. This is because taking WCSB crudes
into PADD2 backs out crude imports which are shipped in from the Gulf Coast up the Capline and other
systems. Taking WCSB down to PADD3 while import crudes still flow up to PADD2 would mean incurring
a double transportation cost as the two sets of crudes would pass each other. However, neither crude
oils nor refinery configurations and processing capabilities are uniform. They vary widely and not all
PADD2 refineries are amenable to being economically upgraded to process WCSB heavy streams while,
at the same time, there is substantial existing capacity in the PADD3 Gulf Coast designed for heavy
crudes. This reality leads to projections which combine a significant – but economically limited - degree
of upgrading of PADD2 refineries with transporting WCSB streams down to the Gulf since refiners there
have configurations able to take them.
88
California Proposition 23 to over-turn Law AB32, Global Warming Solutions Act of 2006, was defeated in the November 2
nd, 2010 elections.
89 Firm PADD2 projects included 250,000 bpd of crude distillation capacity and 170,000 bpd of coking.
90 In the No Expansion scenario, the lack of alternative outlets leads to incentives to invest to further increase
PADD2 WCSB processing, which consequently reaches a peak in the range of 2.3 – 2.4 mbd.
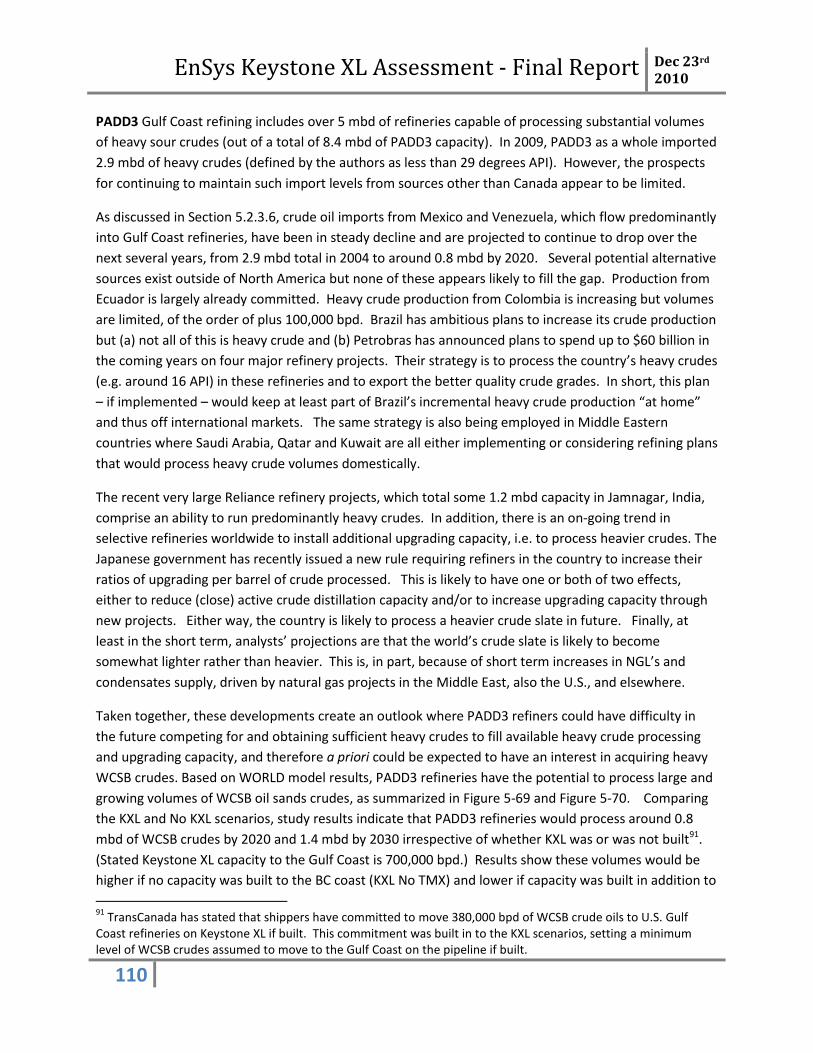
EnSys Keystone XL Assessment - Final Report Dec 23rd 2010
110
PADD3 Gulf Coast refining includes over 5 mbd of refineries capable of processing substantial volumes
of heavy sour crudes (out of a total of 8.4 mbd of PADD3 capacity). In 2009, PADD3 as a whole imported
2.9 mbd of heavy crudes (defined by the authors as less than 29 degrees API). However, the prospects
for continuing to maintain such import levels from sources other than Canada appear to be limited.
As discussed in Section 5.2.3.6, crude oil imports from Mexico and Venezuela, which flow predominantly
into Gulf Coast refineries, have been in steady decline and are projected to continue to drop over the
next several years, from 2.9 mbd total in 2004 to around 0.8 mbd by 2020. Several potential alternative
sources exist outside of North America but none of these appears likely to fill the gap. Production from
Ecuador is largely already committed. Heavy crude production from Colombia is increasing but volumes
are limited, of the order of plus 100,000 bpd. Brazil has ambitious plans to increase its crude production
but (a) not all of this is heavy crude and (b) Petrobras has announced plans to spend up to $60 billion in
the coming years on four major refinery projects. Their strategy is to process the country’s heavy crudes
(e.g. around 16 API) in these refineries and to export the better quality crude grades. In short, this plan
– if implemented – would keep at least part of Brazil’s incremental heavy crude production “at home”
and thus off international markets. The same strategy is also being employed in Middle Eastern
countries where Saudi Arabia, Qatar and Kuwait are all either implementing or considering refining plans
that would process heavy crude volumes domestically.
The recent very large Reliance refinery projects, which total some 1.2 mbd capacity in Jamnagar, India,
comprise an ability to run predominantly heavy crudes. In addition, there is an on-going trend in
selective refineries worldwide to install additional upgrading capacity, i.e. to process heavier crudes. The
Japanese government has recently issued a new rule requiring refiners in the country to increase their
ratios of upgrading per barrel of crude processed. This is likely to have one or both of two effects,
either to reduce (close) active crude distillation capacity and/or to increase upgrading capacity through
new projects. Either way, the country is likely to process a heavier crude slate in future. Finally, at
least in the short term, analysts’ projections are that the world’s crude slate is likely to become
somewhat lighter rather than heavier. This is, in part, because of short term increases in NGL’s and
condensates supply, driven by natural gas projects in the Middle East, also the U.S., and elsewhere.
Taken together, these developments create an outlook where PADD3 refiners could have difficulty in
the future competing for and obtaining sufficient heavy crudes to fill available heavy crude processing
and upgrading capacity, and therefore a priori could be expected to have an interest in acquiring heavy
WCSB crudes. Based on WORLD model results, PADD3 refineries have the potential to process large and
growing volumes of WCSB oil sands crudes, as summarized in Figure 5-69 and Figure 5-70. Comparing
the KXL and No KXL scenarios, study results indicate that PADD3 refineries would process around 0.8
mbd of WCSB crudes by 2020 and 1.4 mbd by 2030 irrespective of whether KXL was or was not built91.
(Stated Keystone XL capacity to the Gulf Coast is 700,000 bpd.) Results show these volumes would be
higher if no capacity was built to the BC coast (KXL No TMX) and lower if capacity was built in addition to
91
TransCanada has stated that shippers have committed to move 380,000 bpd of WCSB crude oils to U.S. Gulf Coast refineries on Keystone XL if built. This commitment was built in to the KXL scenarios, setting a minimum level of WCSB crudes assumed to move to the Gulf Coast on the pipeline if built.
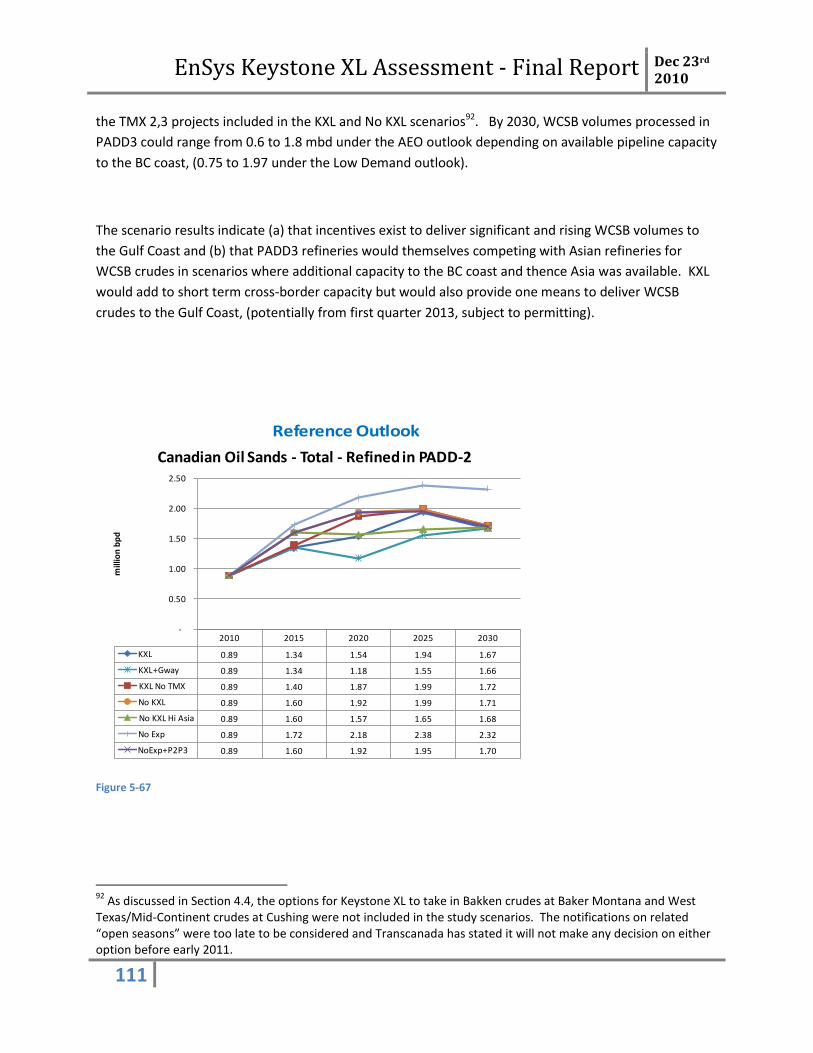
EnSys Keystone XL Assessment - Final Report Dec 23rd 2010
111
Reference Outlook
the TMX 2,3 projects included in the KXL and No KXL scenarios92. By 2030, WCSB volumes processed in
PADD3 could range from 0.6 to 1.8 mbd under the AEO outlook depending on available pipeline capacity
to the BC coast, (0.75 to 1.97 under the Low Demand outlook).
The scenario results indicate (a) that incentives exist to deliver significant and rising WCSB volumes to
the Gulf Coast and (b) that PADD3 refineries would themselves competing with Asian refineries for
WCSB crudes in scenarios where additional capacity to the BC coast and thence Asia was available. KXL
would add to short term cross-border capacity but would also provide one means to deliver WCSB
crudes to the Gulf Coast, (potentially from first quarter 2013, subject to permitting).
Figure 5-67
92
As discussed in Section 4.4, the options for Keystone XL to take in Bakken crudes at Baker Montana and West Texas/Mid-Continent crudes at Cushing were not included in the study scenarios. The notifications on related “open seasons” were too late to be considered and Transcanada has stated it will not make any decision on either option before early 2011.
2010 2015 2020 2025 2030
KXL 0.89 1.34 1.54 1.94 1.67
KXL+Gway 0.89 1.34 1.18 1.55 1.66
KXL No TMX 0.89 1.40 1.87 1.99 1.72
No KXL 0.89 1.60 1.92 1.99 1.71
No KXL Hi Asia 0.89 1.60 1.57 1.65 1.68
No Exp 0.89 1.72 2.18 2.38 2.32
NoExp+P2P3 0.89 1.60 1.92 1.95 1.70
-
0.50
1.00
1.50
2.00
2.50
mill
ion
bp
d
Canadian Oil Sands - Total - Refined in PADD-2
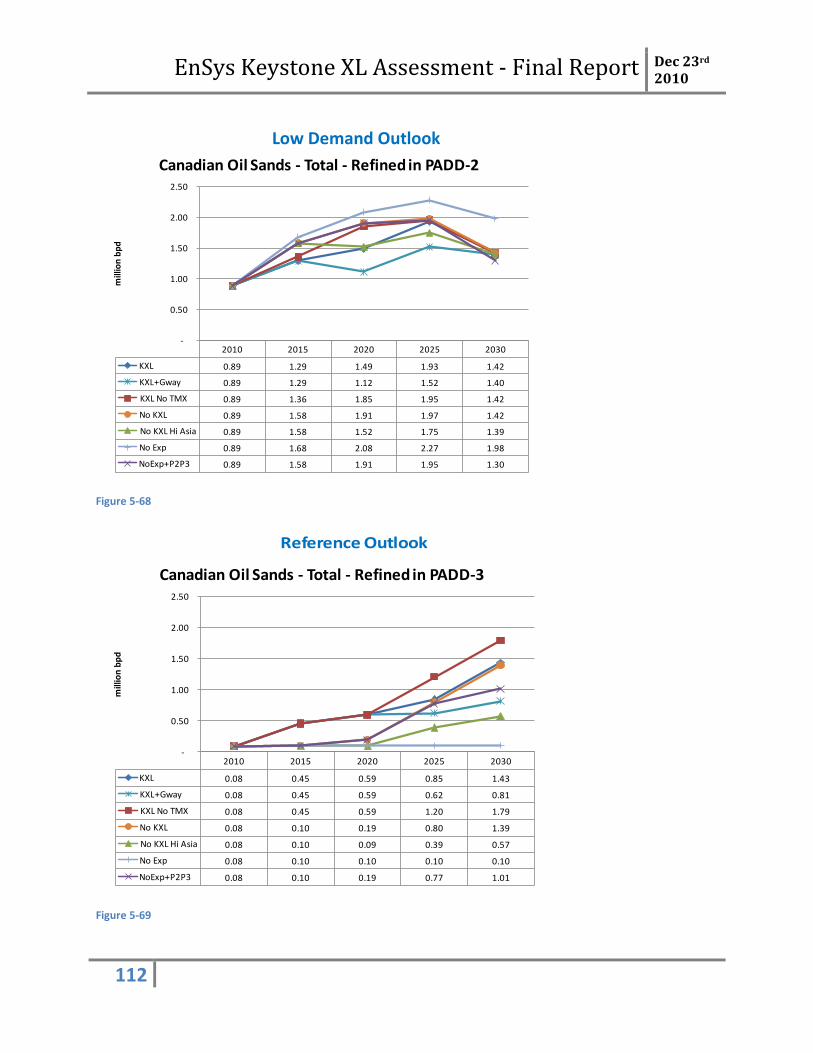
EnSys Keystone XL Assessment - Final Report Dec 23rd 2010
112
Reference Outlook
Figure 5-68
Figure 5-69
2010 2015 2020 2025 2030
KXL 0.89 1.29 1.49 1.93 1.42
KXL+Gway 0.89 1.29 1.12 1.52 1.40
KXL No TMX 0.89 1.36 1.85 1.95 1.42
No KXL 0.89 1.58 1.91 1.97 1.42
No KXL Hi Asia 0.89 1.58 1.52 1.75 1.39
No Exp 0.89 1.68 2.08 2.27 1.98
NoExp+P2P3 0.89 1.58 1.91 1.95 1.30
-
0.50
1.00
1.50
2.00
2.50
mill
ion
bp
d
Canadian Oil Sands - Total - Refined in PADD-2
2010 2015 2020 2025 2030
KXL 0.08 0.45 0.59 0.85 1.43
KXL+Gway 0.08 0.45 0.59 0.62 0.81
KXL No TMX 0.08 0.45 0.59 1.20 1.79
No KXL 0.08 0.10 0.19 0.80 1.39
No KXL Hi Asia 0.08 0.10 0.09 0.39 0.57
No Exp 0.08 0.10 0.10 0.10 0.10
NoExp+P2P3 0.08 0.10 0.19 0.77 1.01
-
0.50
1.00
1.50
2.00
2.50
mill
ion
bp
d
Canadian Oil Sands - Total - Refined in PADD-3
Low Demand Outlook

EnSys Keystone XL Assessment - Final Report Dec 23rd 2010
113
Figure 5-70
5.2.3.9 Effect on PADD3 Crude Oil Sources
Increases in crude imports from Western Canada to PADD3 predominantly offset imports from the
Middle East. As shown in Figure 5-69 and Figure 5-70, the KXL No TMX and the No KXL High Asia
scenarios represent the extremes of respectively high and low WCSB volumes into PADD3 (and the USA
as a whole). If WCSB crudes move to Asia instead of the U.S., it is somewhat lighter crudes – notably
Middle Eastern medium and heavy sour grades as the balancing crude supply – that fill their place93.
Figure 5-71 and Figure 5-72 highlight the changes in PADD3 crude slate between KXL No TMX and No
KXL High Asia scenarios under both AEO and Low Demand outlooks. By 2030, the difference between
the KXL No TMX and the No KXL High Asia scenarios is an increase of 1.25 mbd Canadian crude imports
and a reduction of 1 mbd in Middle Eastern crude imports. Comparing results for the same pipeline
scenario and time frame (2020 or 2030) for AEO versus Low Demand outlook illustrates how U.S.
demand reduction in turn reduces U.S. imports of Middle Eastern crude oils. Under the Low Demand
93
Figures set out in Section 5.2.2.3 show some variation in PADD3 crude slate quality – by up to around 0.5 degrees API – depending on the scenario. Broadly, projected PADD3 crude slate is at its heaviest under scenarios which maximize WCSB crudes into the region and vice versa.
Low Demand Outlook
2010 2015 2020 2025 2030
KXL 0.08 0.44 0.59 0.78 1.56
KXL+Gway 0.08 0.44 0.55 0.62 0.91
KXL No TMX 0.08 0.45 0.59 1.13 1.97
No KXL 0.08 0.09 0.15 0.74 1.56
No KXL Hi Asia 0.08 0.09 0.09 0.19 0.75
No Exp 0.08 0.10 0.10 0.10 0.10
NoExp+P2P3 0.08 0.09 0.15 0.73 1.44
-
0.50
1.00
1.50
2.00
2.50
mill
ion
bp
d
Canadian Oil Sands - Total - Refined in PADD-3
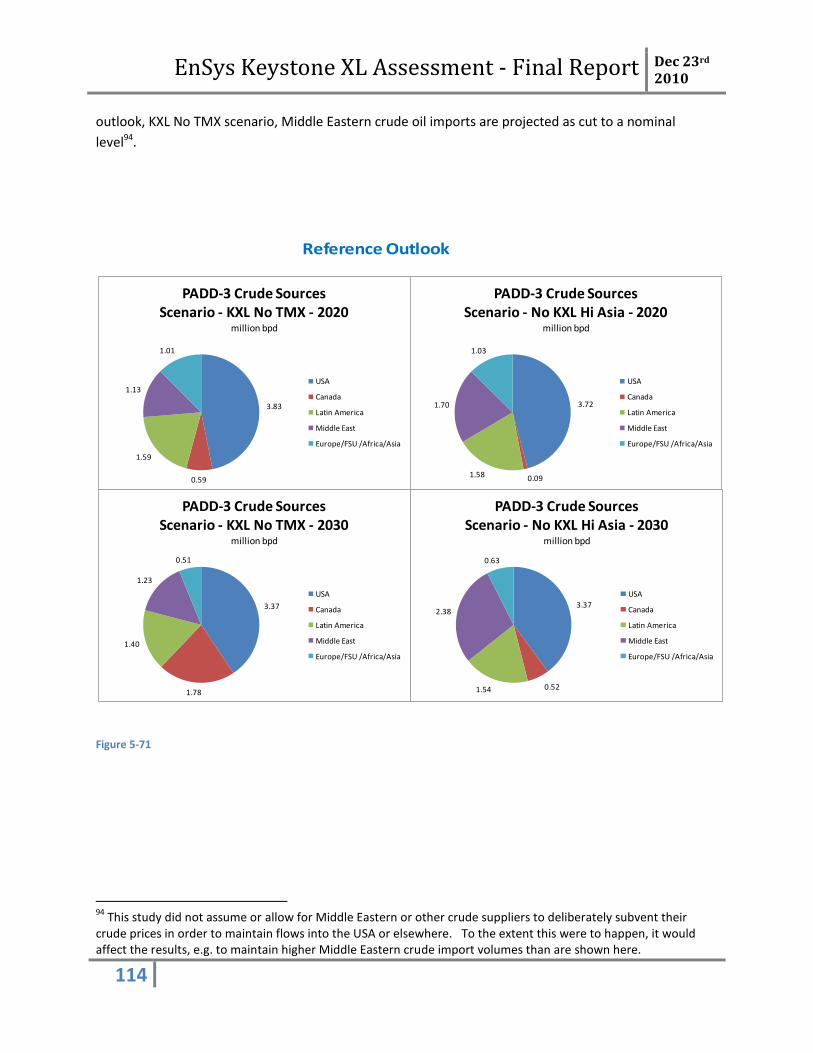
EnSys Keystone XL Assessment - Final Report Dec 23rd 2010
114
Reference Outlook
outlook, KXL No TMX scenario, Middle Eastern crude oil imports are projected as cut to a nominal
level94.
Figure 5-71
94
This study did not assume or allow for Middle Eastern or other crude suppliers to deliberately subvent their crude prices in order to maintain flows into the USA or elsewhere. To the extent this were to happen, it would affect the results, e.g. to maintain higher Middle Eastern crude import volumes than are shown here.
3.83
0.59
1.59
1.13
1.01
PADD-3 Crude SourcesScenario - KXL No TMX - 2020
million bpd
USA
Canada
Latin America
Middle East
Europe/FSU /Africa/Asia
3.37
1.78
1.40
1.23
0.51
PADD-3 Crude SourcesScenario - KXL No TMX - 2030
million bpd
USA
Canada
Latin America
Middle East
Europe/FSU /Africa/Asia
3.72
0.09 1.58
1.70
1.03
PADD-3 Crude SourcesScenario - No KXL Hi Asia - 2020
million bpd
USA
Canada
Latin America
Middle East
Europe/FSU /Africa/Asia
3.37
0.52 1.54
2.38
0.63
PADD-3 Crude SourcesScenario - No KXL Hi Asia - 2030
million bpd
USA
Canada
Latin America
Middle East
Europe/FSU /Africa/Asia
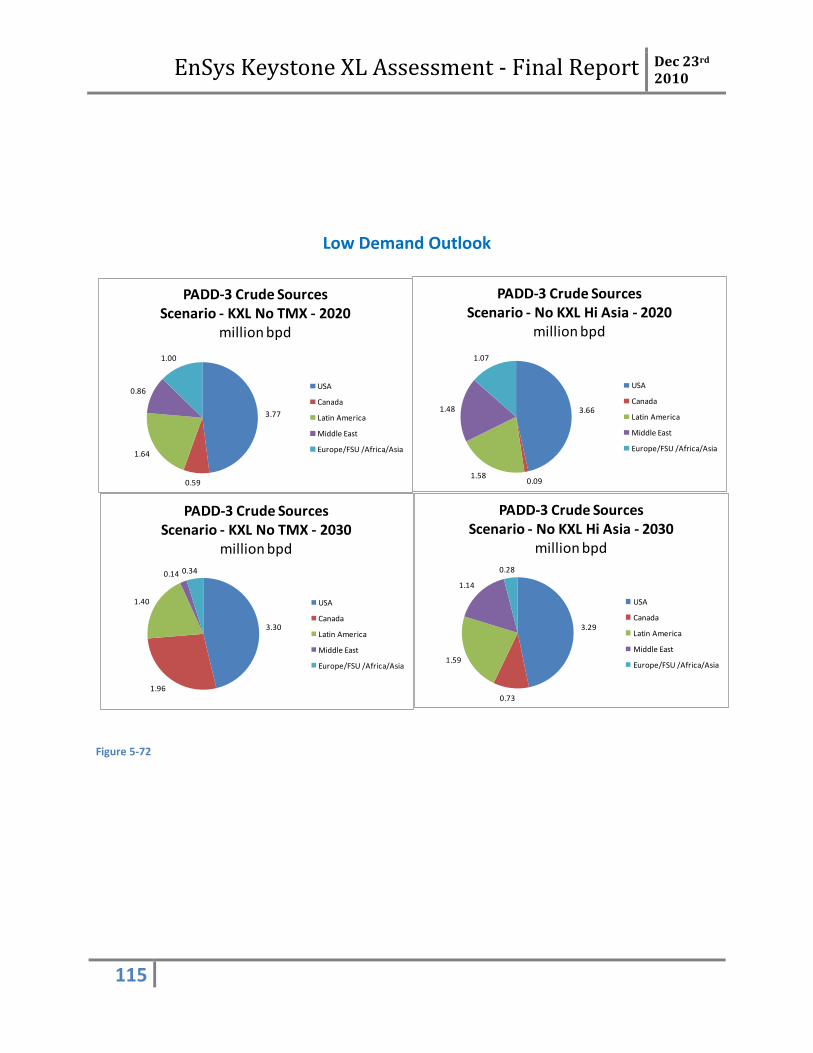
EnSys Keystone XL Assessment - Final Report Dec 23rd 2010
115
Figure 5-72
Low Demand Outlook
3.77
0.59
1.64
0.86
1.00
PADD-3 Crude SourcesScenario - KXL No TMX - 2020
million bpd
USA
Canada
Latin America
Middle East
Europe/FSU /Africa/Asia
3.30
1.96
1.40
0.14 0.34
PADD-3 Crude SourcesScenario - KXL No TMX - 2030
million bpd
USA
Canada
Latin America
Middle East
Europe/FSU /Africa/Asia
3.66
0.09 1.58
1.48
1.07
PADD-3 Crude SourcesScenario - No KXL Hi Asia - 2020
million bpd
USA
Canada
Latin America
Middle East
Europe/FSU /Africa/Asia
3.29
0.73
1.59
1.14
0.28
PADD-3 Crude SourcesScenario - No KXL Hi Asia - 2030
million bpd
USA
Canada
Latin America
Middle East
Europe/FSU /Africa/Asia
EnSys Keystone XL Assessment - Final Report Dec 23rd 2010
116
6 Conclusions
This study has considered and presented the projected impacts out to 2030 of Keystone XL, and of other
potential WCSB export pipelines, on U.S. refining, oil markets and import dependency. The study has
taken into consideration the effects of alternative U.S. product demand scenarios, as could be driven by
legislative agendas focused on the environment and/or energy security, but has not considered either
the potential consequences of any U.S. climate legislation, of life-cycle or other emissions aspects of
Canadian oil sands or consequences for the U.S. or Canadian economy. Such considerations were not
within EnSys’ mandate from the Department of Energy.
The Keystone Mainline pipeline system now under start-up will have the capacity as of early 2011 to
take 591,000 bpd of heavy WCSB crudes, including oil sands, from Hardisty Alberta to Steele City
Nebraska and then onward to either Wood River/Patoka Illinois or to Cushing. Keystone XL would add a
further 700,000 bpd of pipeline capacity to bring WCSB crudes to Cushing and thence south to Gulf
Coast refineries. The project could also potentially (a) enable Bakken crudes in North Dakota and
Montana to be linked in to KXL and taken to Cushing and the Gulf Coast and (b) enable U.S. crudes in the
Cushing area to be taken into the line and transported to the Gulf Coast, subject in part to the volumes
of WCSB crudes offloaded at Cushing.
WORLD and ETP studies indicate that building versus not building Keystone XL would not of itself have
any significant impact on: U.S. total crude runs, total crude and product import levels or costs, global
refinery CO2 or life-cycle GHG emissions. This is because changing WCSB crude export routes would not
alter either U.S., Canadian or total global crude supply, (other than a small impact under a No Expansion
scenario), or U.S. and global product demand and quality. The same slate of crude oils would have to be
refined even if reallocated geographically.
The combination of existing spare cross-border capacity with opportunities to provide alternative
capacity over time, including several already-defined potential projects both cross-border and from
PADDII to PADDIII, would enable industry to respond to KXL not being built, with the projected result
that crude export dispositions from Western Canada and levels of WCSB imports to the USA would be
similar to those which would obtain if KXL were built95 Put differently, scenario results indicate that – if
KXL were not built – there would be market demand to put in place broadly similar capacity, including to
the U.S. Gulf Coast.
Production levels of oil sands crudes would not be affected by whether or not KXL was built. WCSB
production would only be impacted (relative to the CAPP 2010 projection used in the study) if there
were no further pipeline expansion out of WCSB and within the USA beyond projects currently under
construction. Even then, because of existing available line capacity, oil sands production would not
95
This unless KXL not being built led to expansions of pipelines to take WCSB crude to the British Columbia coast, thence Asia, instead of broadly similar capacity to bring WCSB crudes into the U.S.
EnSys Keystone XL Assessment - Final Report Dec 23rd 2010
117
begin to be curtailed until after 2020. Versus the base projections, WCSB production would be curtailed
by approximately 0.8 mbd by 2030. Since, to occur, such a scenario would have to entail no expansion
of (a) pipelines entirely within Canada that could take WCSB crudes from Alberta to the British Columbia
coast, (b) existing cross-border lines from WCSB to the U.S., (c) existing internal domestic U.S. pipelines
that could take WCSB crudes to market within the U.S. - and to eastern Canada and (d) alternative
proven transport modes, namely rail possibly supported by barge, the scenario is considered unlikely.
Keystone XL would increase the cross-border capacity surplus such that it would then persist until 2020
or later. However, the 2005 through 2008 shortages in WCSB export pipeline capacity, and the Summer
2010 forced shutdown of over 650,000 bpd of capacity on the Enbridge Mainline/Lakehead system due
to a spill, each led to adverse consequences including, production shut-ins, high price discounts on
WCSB heavy grades and resulting loss of revenues to Canadian producers, shippers and government
agencies; also difficulties for U.S. refiners. KXL would provide increased redundancy that would reduce
the likelihood of such occurrences. KXL could also provide an additional means to bring Bakken crudes
to market and/or to help relieve congestion at Cushing by allowing flexibility to ship locally available
barrels to the Gulf Coast96.
Study results indicate that the ability of KXL – or otherwise alternative projects - to transport heavy
WCSB crudes to the Gulf Coast would satisfy incentives for Gulf Coast refiners to maintain supplies of
heavy crudes at a time when volumes from traditional suppliers, notably Mexico and Venezuela, are
continuing to decline. Volume commitments claimed by TransCanada for KXL indicate that firm interest
from U.S. refiners does exist to bring at least 380,000 bpd of WCSB crudes to the Gulf Coast.
A central finding from this study is that the U.S. has the potential to take in substantially increasing
volumes of crude oil from Canada over time, albeit with a steadily rising proportion of oil sands streams
which would reach close to 90% by 2030. Study results indicate U.S. refining of Canadian crudes could
rise from 1.9 mbd in 2009 to 4 mbd by 2030. Associated oil sands streams imports would rise from
under 1 mbd in 2009 to over 3.6 mbd by 2030. This projected increase would curb dependency on crude
oils from other sources notably the Middle East and Africa.
U.S. imports of WCSB crudes rise under all scenarios considered. However, the study shows that WCSB
crude volumes into the U.S. are sensitive to the development of pipelines within Canada to the British
Columbia coast and thence to markets in Asia, the region which will constitute 75% of the world’s
refining capacity growth between now and 2030. The Kinder Morgan TMX 2 and 3 projects would entail
expansion along the existing Transmountain pipeline right of way. The Kinder Morgan Northern Leg
would use partly existing, partly new facilities and rights of way and the Enbridge Northern Gateway
entirely new facilities and right of way. The Northern Leg and Northern Gateway projects in particular
face significant hurdles. However, construction of TMX 2 and 3 would add 0.4 mbd of capacity west to
the BC coast and construction of all three projects would result in a total capacity of over 1.3 mbd.
96
Congestion and high inventories at Cushing over the last two years, caused in part by the recession, have led inter alia to discontinuities in prices for West Texas Intermediate benchmark crude and a consequent diminution in WTI’s role. Several major producers have replaced WTI with the new Argus Sour Crude Index (ASCI).
EnSys Keystone XL Assessment - Final Report Dec 23rd 2010
118
Implementing one or more of these projects would increase WCSB export capacity, move the system
away from being almost entirely land-locked and diversify markets for WCSB crudes.
The evidence from the WORLD model cases is that, if pipeline projects to the BC coast are built, they are
likely to be utilized. This is because of the relatively short marine distances to major northeast Asia
markets, future expected growth there in refining capacity and increasing ownership interests by
Chinese companies especially in oil sands production. Such increased capacity would alter global crude
trade patterns. WCSB crudes would be “lost” from the USA, going instead to Asia. There they would
displace the world’s balancing crude oils, Middle Eastern and African predominantly OPEC grades, which
would in turn move to the USA. The net effect would be substantially higher U.S. dependency on crude
oils from those sources versus scenarios where capacity to move WCSB crudes to Asia was limited.
Instead of reaching 3.6 mbd by 2030, WCSB oil sands volumes into the U.S. could be 2.6 mbd, possibly
lower still and Middle East/African crude imports correspondingly higher.
The study has shown that reduction in U.S. petroleum product demand would not appreciably cut WCSB
crude flows into the U.S. Rather, a low U.S. demand outlook would substantially reduce U.S.
dependency on foreign (non-Canadian) crudes and products. A combination of increased Canadian
crude imports and reduced U.S. product demand could essentially eliminate Middle East crude imports
longer term. Low U.S. demand is also projected to reduce U.S. net product imports and potentially turn
the USA into a net product exporter after 2020.