KEY PURCHASING DETERMINANTS AND THEIR IMPACT ON …
105
KEY PURCHASING DETERMINANTS AND THEIR IMPACT ON BRAND EQUITY OF THE TOOTHPASTE MARKET IN SRI LANKA: AN EMPIRICAL STUDY Madakotuwe Wijesinghe Mudiyanselage Wasantha Wijesinghe (128963K) Degree of Master of Science Department of Mathematics University of Moratuwa Sri Lanka May 2016
Transcript of KEY PURCHASING DETERMINANTS AND THEIR IMPACT ON …

KEY PURCHASING DETERMINANTS AND THEIR
IMPACT ON BRAND EQUITY OF THE TOOTHPASTE
MARKET IN SRI LANKA: AN EMPIRICAL STUDY
Madakotuwe Wijesinghe Mudiyanselage Wasantha Wijesinghe
(128963K)
Degree of Master of Science
Department of Mathematics
University of Moratuwa
Sri Lanka
May 2016

KEY PURCHASING DETERMINANTS AND THEIR
IMPACT ON BRAND EQUITY OF THE TOOTHPASTE
MARKET IN SRI LANKA: AN EMPIRICAL STUDY
Madakotuwe Wijesinghe Mudiyanselage Wasantha Wijesinghe
(128963K)
Dissertation submitted in partial fulfillment of the requirements for the degree Master
of Science in Business Statistics
Department of Mathematics
University of Moratuwa
Sri Lanka
May 2016

i
DECLARATION OF THE CANDIDAT AND SUPERVISOR
I declare that this is my own work and this dissertation does not incorporate without
acknowledgement any material previously submitted for a Degree or Diploma in any other
University or institute of higher learning and to the best of my knowledge and belief it
does not contain any material previously published or written by another person except
where the acknowledgement is made in the text.
Also, I hereby grant to University of Moratuwa the non-exclusive right to reproduce and
distribute my dissertation, in whole or in part in print, electronic or other medium. I retain
the right to use this content in whole or part in future works (such as articles or books).
……………………… ……………………
Signature: Date:
The above candidate has carried out research for the Masters Dissertation under my
supervision.
……………………….. ……………………..
Prof. T. S. G. Peiris Date:
Professor in Applied Statistics
Faculty of Engineering
University of Moratuwa
Sri Lanka.

ii
ABSTRACT
This study was carried out to determine the benefits of consumers seek from toothpaste and impact
of key purchasing determinants on brand equity of the toothpaste market in Sri Lanka. The tooth
paste industry in Sri Lanka is highly competitive. Marketing mix and many factors frequently
create meaningful differences in a brand’s performance. This study analyzed the factors that
affecting to develop new products and proper advertisement campaign. Survey was conducted
with a random sample size of 200 customers from the selected three key supermarkets in Colombo
district during March in 2014. The sampling method was purposive random sampling. The data
collected through a structured questionnaire were analyzed using factor analysis and 2-way
frequency tables. Reliability of data were confirmed by Cronbach’s Alpha test. Results found that
three factors: (i) health conscious or health beneficiary, (ii) social beneficiary and (iii) specialized
beneficiary impact the purchase of toothpaste. Furthermore, it was found that key purchasing
determinants: prevent cavity, shiny teeth, strengthen gum, freshness of breath, strengthen of
enamel and attractive teeth significantly influence (p<0.05) the brand equity of products.
Furthermore, it was found that company image and price do not significantly influence the brand
equity of products. The findings in this study has practical implications, especially for the decision
makers of new product development and advertisement campaign development for toothpaste
industry to maximize benefits from investments. The study also revealed that when introducing
new products to toothpaste industry it needs to be more focused on oral hygiene habits of people.
Keywords: Factor Analysis, Key Purchasing Determinants, Marketing Mix, Oral Hygiene,
Toothpaste industry.

iii
DEDICATION
This thesis is dedicated to my beloved parents and my loving wife who never failed to aid
me with the financial and moral support when required instilling the importance of hard
work and higher studies and teaching me that the best kind of knowledge to have is that
which is learned for its own sake.

iv
ACKNOELEDGEMENT
First of all I would like to convey my gratitude to my supervisor, Prof. T. S. G. Peiris,
Professor in Applied Statistics and Head of the Department of Mathematics, Faculty of
Engineering, University of Moratuwa and the course coordinator of the Degree Program
in M.Sc in Business Statistics, for the encouragement, guidance and support extended
throughout the project. He provided me encouragements, guidance and support in various
ways which inspired me to make this research reality. I gratefully acknowledge all the
lectures for their advisees and instructions during the course. At the same time I would
like to thank non-academic staff of the Department of Mathematics, University of
Moratuwa for their invaluable help.
I would also like to thank all my family members, friends, well-wishers and all others who
helped me in numerous ways in completing the project to fruition. I was able to complete
this research successfully due to the all above devoted supports and if not this could be an
impossible task. So again I would like to thank of them.
M.W.M. Wasantha Wijesinghe

v
TABLE OF CONTENT
Declaration of the Candidate and Supervisor…………………………………..…………i
Declaration……………………………………………………………………….………ii
Acknowledgment………………………………………………………………………..iii
Abstract………………………………………………………………………………….iv
Table of Content…………………………………………………….……………………v
List of Figure………………………………………………………….………………….x
List of Table…………………………………………………………….…………….....xi
List of Abbreviations……………..……………………………………….……………xiii
List of Appendices………………………………………………………….………….xiv
CHAPTER 1…………………………………………………………………...…………1
INTRODUCTION.......................................................................................................…...1
1.1 Back Ground of the Study……………………..………….………………….1
1.2 Industry Overview of Toothpaste Market………………..….……………….2
1.2.1 Global toothpaste industry……………………………..………………..3
1.2.2 Toothpaste Industry in Sri Lanka………………………….…………….4
1.3 Brand…………………………………………………...……………………7
1.4 Brand Equity…………………………………………………………………8
1.5 Importance of Brand Equity…………………………………………………9
1.6 Brand Equity Dimensions………………………………..…………………11
1.7 Key Purchasing Determinants (KPD)…………………..…………………..12
1.8 Problem Statement………………………………………………………….12
1.9 Objectives…………………………………………………………………..13

vi
1.10 Significance of the Study…………………………...………………………13
1.11 Organization of Chapters……………………………….….……………….14
CHAPTER 2…………………………………………………………….………………16
LITERATURE REVIEW…………………………………………….…………………16
2.1 Introduction……………………………………………….………………...16
2.2 Conceptual Back Ground of Brand Equity…………………..……………...16
2.2.1 Introduction of brand…………………………………..………………..16
2.2.2 History of brand………………………………………..………………..17
2.2.3 Evolution of brand……………………………………..………………..18
2.2.4 Definition of brand branding…………………………..………………..19
2.3 Role of Brand in Marketing Practice………………………….……………..21
2.4 Importance of Brand……………………………………….………………...22
2.5 Brand Equity………………………………………………….……………...24
2.5.1 Background of brand equity…………………………………………….24
2.5.2 Definition of brand equity………………………………………………25
2.5.3 Consumer based brand equity…………………………………………..25
2.5.4 Research related to brand equity………………………………………..27
2.5.5 Dimensions of brand equity…………………………………………….28
2.5.5.1 Brand loyalty…………………………………………………….29
2.5.5.2 Brand awareness…………………………………..……………. 30
2.5.5.3 Perceived quality………………………………..……………….31
2.5.5.4 Brand associations………………………………………...……..32
2.6 Consumer Buying Behavior ………………………………………………...33
2.7 Consumer Buying Decision Process………………………………………..34
2.8 Key Purchasing Determinants (KPD)………………………...…………….35
2.9 Chapter Summary………………………………………...…………………36
CHAPTER 3…………………………………………………………………….………37

vii
METHODOLOGY…………………………………………………...…………………37
3.1 Introduction..............................................................................................…...37
3.2 Conceptual Framework……………..……………………………………….37
3.3 Operationalization of the Study…………...…………………………………38
3.4 Methodological Choice…………...…………………………………………42
3.4.1 Primary data ……………………………………………...…………….42
3.4.2 Secondary data…………………………………………………….……42
3.4.3 Sampling design……………………………………...…………………43
3.4.4 Data collection instrument……………………………………………...43
3.5 Statistical Method…………………………………………………………..44
CHAPTER 4……………………………………………………………………………47
DATA ANALYSIS & DISCUSSION…………………………………………….........47
4.1 Introduction…………………………………………………………..……...47
4.2 Response Rate……………………………………………………………….47
4.3 Analysis of Demographic Variables……………………………….………..47
4.3.1 Distribution of gender……………………………………………….….47
4.3.2 Distribution of marital status……………………………………………48
4.3.3 Age group……………………………………………………………….49
4.3.4 Distribution of educational level………………………………………..49
4.3.5 Distribution of monthly income level…………..………………………50
4.3.6 Distribution of employments…………………………….……….…….50
4.3.7 Distribution of daily habit of using toothpaste………….……………....51
4.4 Association among Attributes ………………………….…………………..52
4.5 Validation of Data for Factor Analysis……………………………..……….53
4.5.1 Identification of factors…………………………………………...…….54
4.5.2 Reconfirmation of 3 factors…………………………………………….58

viii
4.5.3 Naming factors………………………………………………………….59
4.6 Association among variables and variables identified for KPD……….…….60
4.6.1 Association between prevent cavity and brand equity of toothpaste...…60
4.6.2 Association between shiny teeth and brand equity of toothpaste……….61
4.6.3 Association between strength gum and brand equity of toothpaste…….62
4.6.4 Relationship between freshness and brand equity of toothpaste…..……63
4.6.5 Association between strengthen of enamel and brand equity….......…...65
4.6.6 Association between attractive teeth and brand equity of toothpaste…...66
4.6.7 Relationship between company image and brand equity……………….66
4.6.8 Association between price of toothpaste and brand equity….………….67
4.7 Chapter Summary……………………………………………………………69
CHAPTER 5………………………………………………………………………….…70
CONCLUTION AND RECOMMENDATIONS...……………………………………..70
5.1 Introduction...………………………………………………………………...70
5.2 Conclusions..…………………………………………………………………70
5.3 Recommendations…...……………………………………………………….71
5.4 Suggestions…………..……………………………………………………….72
REFERENCE LIST………………….………………………………………………….73
APPENDIX 1: Letter to Customer……………………..……………………………….84
APPENDIX 2: Questionnaire Survey…………………………………………………..85

ix
LIST OF FIGURES
Figure 1.1 Per capita toothpaste consumption in the selected countries….....................4
Figure 1.2 Toothpaste market share by volume in Sri Lanka…….................................6
Figure 1.3 Integrated parts of brand…….………………………………………….…..7
Figure 1.4 Aakers’s Brand Equity Dimensions……………………………………….11
Figure 2.1 Customer – Based Brand Equity model…. ……………….……………...27
Figure 2.2 Customer – Aaker’s Brand Equity Model………………….……………..29
Figure 2.3 Brand Pyramid……………………………….…………….……………...30
Figure 2.4 Buying decision process…….……………….…………….……………...34
Figure 3.1 Conceptual frameworks........................................................................…...38
Figure 4.1 Male vs. female percentage of respondents…………..……………………48

x
LIST OF TABLES
Table 1.1 Toothpaste market share by volume and value in Sri Lanka…….…..........6
Table 3.1 Operationalized Table…………………………………………….……...40
Table 4.1 Marital status of respondents……………………………………….…....48
Table 4.2 Distribution of age………………………………………………….…....49
Table 4.3 Educational back ground of respondents…….…………………………..49
Table 4.4 Monthly income level of respondents……………………………….…...50
Table 4.5 Distribution of employments of the respondents………………………....51
Table 4.6 Daily habit of using toothpaste............................................................…...51
Table 4.7 Correlation matrix among attributes of toothpaste………………….…...52
Table 4.8 Results of KMO and Bartlett’s Test Data………………………………...53
Table 4.9 Results of the Initial eigenvalue analysis for the standardize data…….....54
Table 4.10 Factor scores of the 3-factor model extracted via PCF method…….…….55
Table 4.11 Factor score of the 3- factor extracted via PCF and rotated by Varimax...56
Table 4.12 Factor score of the 3- factor - PC and rotated by Quartimax...............…...57
Table 4.13 Factor score of the 3- Factor - PC and rotated by Equamax…….……….57
Table 4.14 Summary of the main results under three rotations…………….………...58
Table 4.15 Communalities of the observed variables………………………………...59
Table 4.16: Factor score coefficient of the selected 3-factor model…….……………59
Table 4.17 Results of prevent cavity vs brand equity cross tabulation..................…...61
Table 4.18 Results of shiny teeth and brand equity cross tabulation....................…...62
Table 4.19 Cross tabulation results of strengthen of gum and brand………..….……63

xi
Table 4.20 Cross tabulation results of freshness of breath and brand equity…….…...64
Table 4.21 Cross tabulation results of strengthen of enamel and brand equity………65
Table 4.22 Cross tabulation results of attractive teeth and brand equity….…………..66
Table 4.23 Cross tabulation results of company image and brand equity….………....67
Table 4.24 Cross tabulation results of price of toothpaste and brand equity…..…….68
Table 4.25 Summary table of significance ….………………..………………………….68

xii
LIST OF ABBREVIATIONS
Abbreviation Description
KPD Key Purchasing Determinants
AMA American Marketing Association
FMCG Fast Moving Consumer Goods
SWOT Strengths, Weaknesses, Opportunities & Threats
KMO Kaiser-Meyer-Olkin
FA Factor Analysis
PCA Principle Component Analysis
EFA Exploratory Factor Analysis
CFA Confirmatory Factor Analysis
PCF Principle Component Factor
ME Marketing Environment

xiii
LIST OF APPENDICES
Appendix 1: Letter to Customer
Appendix 2: Questionnaire Survey

1
CHAPTER 1
INTRODUCTION
1.1 Background of the Study
Today living standard of human being is greatly improved as a result of rapid
development of modern economy and the increasing incomes. Therefore, the
demands of variety of daily necessities have begun to rise strictly. Essential
household item, toothpaste, is one of the major shares in the global market. The most
of toothpaste brands that may be marketed by multinational or domestic toothpaste
manufactures in Sri Lanka become very competitive. Different toothpaste
manufactures have their own different market strategies, such as products for
different ages, targeting the purchasing power of consumers for different products,
products for different regions, product for different physiological functions etc
(Ameer, 2013).
When considering the new product development for any organization new products
are life blood for all their business (Aaker, 1996). Investing in their new products
development is very crucial to business growth and profitability. Therefore, a lot of
market researches and feasibility studies are carried out prior to develop any new
product to reach consumers expectation (Steele, 2000). Otherwise invested money
will get in vain. Most of organizations they have internal product development teams
and research and development department. Some organizations obtain external
support for data collection and analysis to develop their products (Kotler and Keller,
2008).
Consumers have different characteristics and when developing new products they
need to correlate with those characteristics and finally lead to wide range of brands
of toothpaste. Also, the market segmentation is increased evidently. People‟s demand
for oral hygiene products is constantly upgraded because the oral health is now
recognized as equally important in relation to general health (Blackstone, 1995).
Factors like education, income, information from media advertisements and personal

2
choices like taste, flavor, color, appearance have effect on choice of an oral hygiene
product by people (Thomas, 2010). On the other hand as a competitive nature of
toothpaste market in Sri Lanka toothpaste manufactures are developing branding
strategies to develop unique brand image and attracting customers towards their
brands. Most of tooth paste brands emphasize different product characteristics impact
on their key purchasing determinants (KPD). However, there is no proper
understanding of marketing practitioners regarding the benefits of consumer seek
from toothpaste and association between KPD and brand equity of toothpaste market
(Bhasin, 2006).
1.2 Industry Overview of Toothpaste Market
The global toothpaste market is on the threshold of a new phase with the advent of
new biotechnologies that help curb problems of sensitivity and enable the re-growth
of teeth (Blackstone, 1995). Oral care is undergoing significant changes with
innovative and fresh products motivating people to alter their oral hygiene habits.
Purchase of toothpaste is mainly driven by individual habits, inclination towards
particular flavor and familiarity with the product. The toothpaste market is generally
not price sensitive and brand loyalty plays an important role in majority of the
customers (Toussaint, 2009). Currently nearly 97% of the population in developed
countries uses at least one variety of toothpaste. This gives marketers virtually no
space to expand the market with new users. Consequently, adding or increasing value
to the product is the preferred alternative. Technological progress made in recent
years altered the toothpaste segment into one that offers additional benefits such as
fresher breath, healthier gums and whiter teeth, besides just fighting cavities (Joes,
2008).
Dental health of human has improved dramatically in recent past. At the same time
trend that oral care products like toothpaste manufactures in multibillion dollar
business have to exploit (Steele, 2000). These days a lot of toothpaste products can
be seen in market that has different attributes or combinations of attributes like
products include whiteners and fluorides, product for tartar control and sensitivity etc
(Smith & Whan, 2005). According to numerous studies that related to oral
3
epidemiological revealed that people are keeping their teeth longer than ever before
in this century (Schwarz and Wong, 1998).
1.2.1 Global toothpaste industry
Toothpaste is not a relatively modern phenomenon. It has history as long ago as
3000-5000 BC. According to history Egyptians made dental cream by mixing
powdered ashes of oxen hooves with burned egg shells pumice and water (Schwarz,
and Wong, 1998). In eighteenth century in England toothpaste introduce to market
was packed in a ceramic pot. At the end of the twentieth century pure plastic tube
was used to store tooth paste. At present several well-known brands of international
and domestic can be seen in the market. Based on Global industry analysts‟
incorporation that was published in 2013, global industry of toothpaste market will
reach US$ 12.6 billion by the year 2015. It is also highlighted that the growth of the
toothpaste market was related to different criteria such as whitening toothpastes,
product innovates, rising population and greater awareness about tooth oral hygiene
(Roper et al, 2006). Toothpaste market is not price sensitive product and brand
loyalty plays an important role in most of the customers. Currently nearly 97% of the
population in developed countries uses at least one variety of toothpaste (San, 2012).
This gives marketers virtually no space to expand the market with new users.
Therefore, value addition to the product is the one of the preferred alternative to
capture the market share.
The world toothpaste industry comprises of several big players medium scale and
domestic players competing each other in highly crowded and fragmented market
place. There is a large presence of both international brands and local brands.
Leading market participants include Church & Dwight, Colgate-Palmolive
Company, Colgate-Palmolive Gmbh, Colgate-Palmolive (India) Limited, Gaba
Holding AG, GlaxoSmithKline, Henkel AG & Co. KgaA, Johnson and Johnson,
Procter & Gamble Company, Unilever N.V., and Hindustan Unilever Limited
(Sharma, 2012).
In term of oral hygiene in the world, majority of population are still not able to
access modern dental care and relying on substance like coal ash and different types

4
of tooth powders that made in domestically (San, 2012). In some countries like India
penetration level of toothpaste is 55% and only 15% of those using brush twice a day
(Prasad and Dev, 2000).
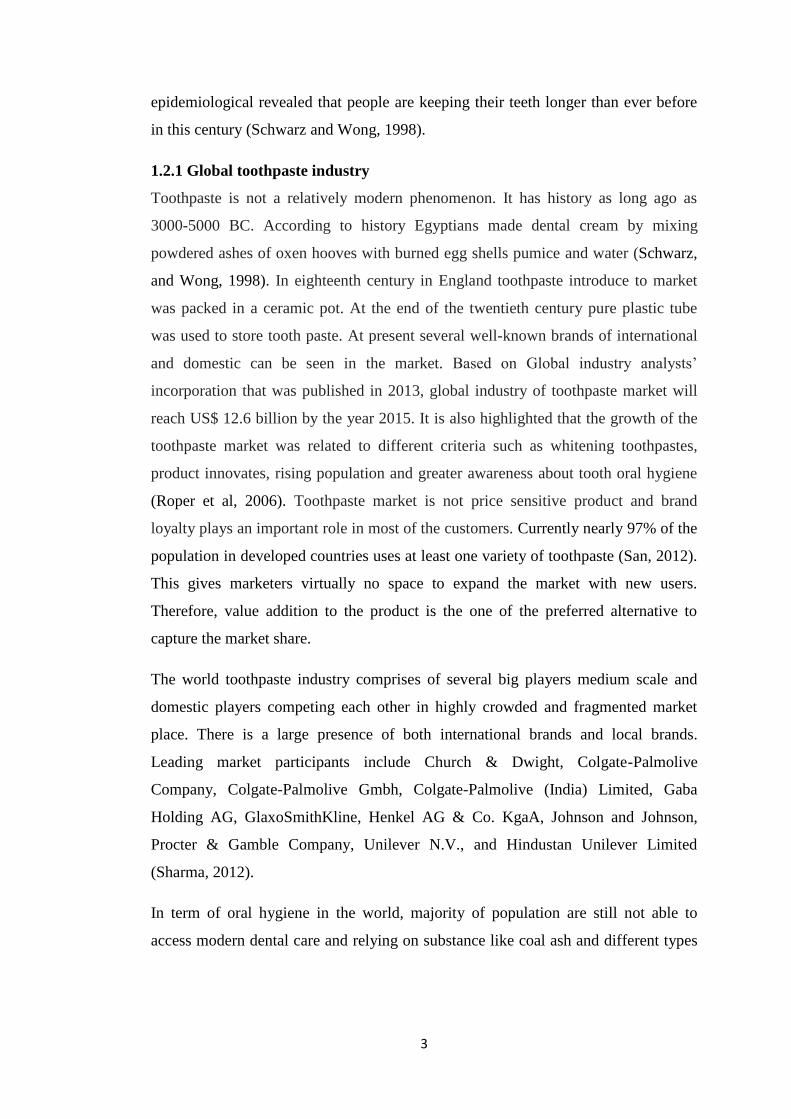
The highest per capita toothpaste consumption show in USA and it is at 542 g/year
(Fig 1.1). Also, India‟s per capita consumption is less than half of the other emerging
markets and almost 1/4 th
the amount of consumption in U.S. It is one of the lowest
in world. Given the low per capita consumption and penetration rates, toothpaste
demand is mainly being driven by the overall market growth of 8-10 % (Sharma,
2012).
Figure 1.1: Per capita toothpaste consumption in the selected six countries.
(Source: http://www.sanasecurities.com/future-prospect-indian-oral-care-industry)
1.2.2 Toothpaste industry in Sri Lanka
In Sri Lanka‟s toothpaste market is mainly consists of herbal toothpaste market and
multinational brands like Signal, SR, and Close up etc. According to recent market
researches (Dona, 2013) it is revealed that brands that are marketed by multinational
companies are rapidly being threatened by a range of local herbal brands that are
produced by small and medium scale indigenous producers. Industry analysts
542
304
255 250 244
127
0
100
200
300
400
500
600
USA Malaysia China Sri Lanka Philippines India
Per Capita Toothpaste Consmption in Selected Countries
(in grams/per year)

5
(Perera, 2013) highlighted that this was mainly one reason where local producers are
holding their own against giant conglomerates and targeting to capture market share.
It is a tremendous achievement on the part of local producers in this field particularly
in the context of globalization and international marketing. The toothpaste market in
Sri Lanka, earlier driven by whiter teeth and cavity protection values, is now facing a
situation where such values and beliefs are losing ground to ayurvedic and herbal
oral care.
Oral care is a highly practicing health habit in all over the world. In Sri Lanka it may
have once been a narrow market segment but today it represents a
flourishing sector with several sub segments. It has a high degree of
penetration with in the country through tooth paste and tooth powder. There are
channel for products that address gum diseases, cavities, plaque and tartar build up,
sensitive teeth etc. Toothpaste and toothpowder have a combined house hold
penetration of 89% in 2005. It has been estimated this market to be worth 2.5 billion
Rupees with annual volume of approximately 4,500 metric tons (Dona, 2013).
Highest sales volume in Sri Lanka shows in the Western province that includes
Colombo, Gampaha & Kalutara districts. Sri Lankan market is dominated by two
brands: (i) Signal with volume share of 47% marketed by Unilevers Company Sri
Lanka and (ii) Clogard with 23% volume share marketed by Hemas group. Current
market value of tooth paste market in Sri Lanka is Rupees 2.5 billion. It also
estimated for 2015 as 3.5 billion rupees (Perera, 2013). When considering toothpaste
market in Sri Lanka, oral market has high degree of penetration through toothpaste
and tooth powder products. It also identified that market growth for 2012 is around
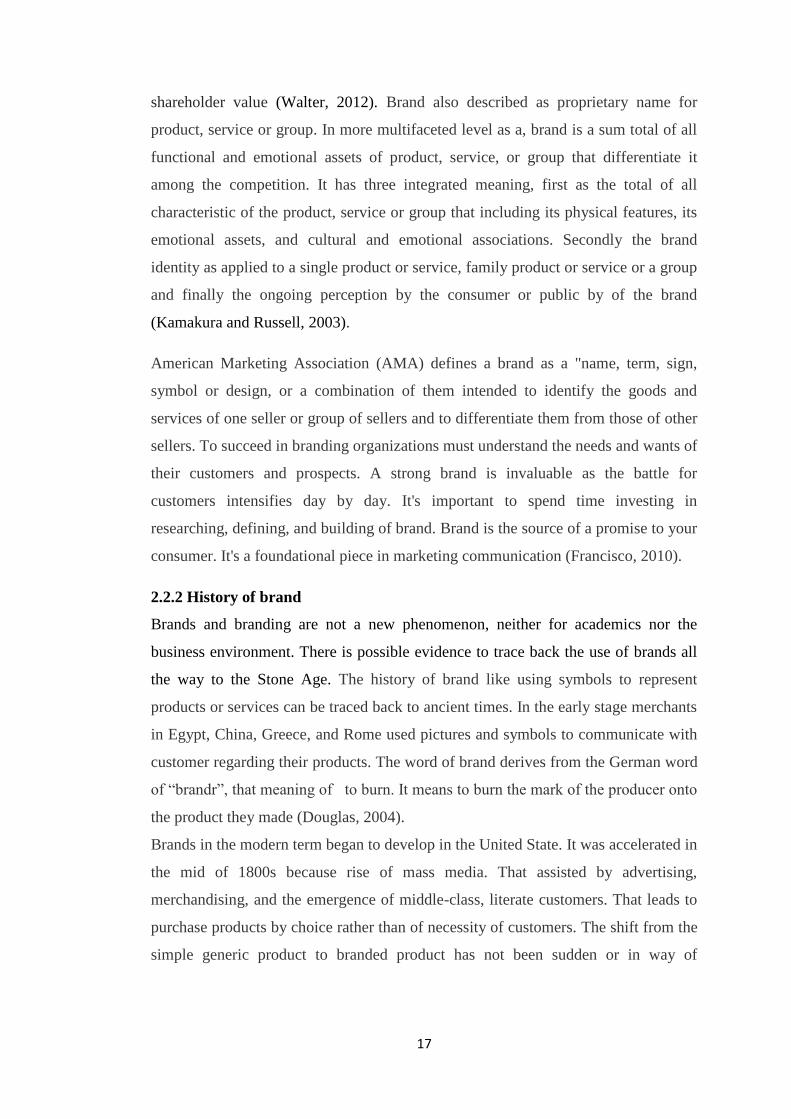
8% compared to 2011 (Perera, 2013). The market shares in sales volume and value
for leading brands are shown in Figure 1.2 Table 1.1 respectively.

6
Figure 1.2: Toothpaste market share by volume in Sri Lanka (2013 up to Quarter 3)
(Source: Daily Financial Times, 2013)
Table 1.1: Toothpaste market share by volume and value in Sri Lanka (up to 3 rd
quarter in 2013)
Brands Market share by volume Market share by value
Signal 47% 45%
Clogard 23% 19%
Sudantha 11% 12%
Supiriwicky 10% 9%
T&G 3% 2%
Closeup 2% 6%
Sensodine 2% 5%
Others 2% 2%
(Source: Daily Financial Times, 2013)
47%
23%
11%
10%
3% 2% 2% 2%
Toothpaste Market Share by Volume-2013
Signal
Clogard
Sudantha
Supirieicky
T&G
Closeup
Sensodine
Others

7
1.3 Brand
In a simple way a brand can be described as proprietary name for product, service or
group (Kotler, 2000). Brand also describes in more multifaceted level as a, brand is a
sum total of all functional and emotional assets of product, service, or group that
differentiate it among the competition. It also has following three integrated meaning
as depicted in Figure 1.3.
The total of all characteristic of the product, service or group that including
its physical features, its emotional assets, and cultural and emotional
associations.
The brand identity as applied to a single product or service, family product or
service or a group.
The ongoing perception by the consumer or public by of the brand.
Figuer1.3: Integrated parts of brand
(Source: http://www.investopedia.com/terms/b/brandequity.asp?header_alt=a)
When considering the all characteristics of brand each product or a service has
functionalities, features or capabilities which may or may not be unique to the
product or service category. Also, each product or service owns its heritage, parent
company, logo, visual identity, advertising, and audience perception (Walter, 2012).

8
American Marketing Association (AMA) defines a brand as a "name, term, sign,
symbol or design, or a combination of them intended to identify the goods and
services of one seller or group of sellers and to differentiate them from those of other
sellers”. To succeed in branding, organizations must understand the needs and wants
of their customers and prospects. A strong brand is invaluable as the battle for
customers intensifies day by day. It's important to spend time investing in
researching, defining, and building of brand. Brand is the source of a promise to your
consumer. It's a foundational piece in marketing communication (Francisco, 2010). A
traditional definition of a brand was the name that associated with one or more items
in the product line, which is used to identify the source of character of the items
(Kotler, 2000).
1.4 Brand Equity
Brand equity means the value premium that a company realizes from a product with
a recognizable name as compared to its generic equivalent. Companies can create
brand equity for their products by making them memorable, easily recognizable and
superior in quality and reliability. Mass marketing campaigns can also help to create
brand equity. Brand equity has aroused intense interest among business strategists
from a wide variety of industries as brand equity is closely related with brand loyalty
and brand extensions. Besides, successful brands provide competitive advantages
that are critical to the success of companies (Francisco, 2010).
According to the branding expert Aaker (1996) brand equity define as “a set of assets
and liabilities linked to a brand, its name and symbol, which adds to or subtracts
from the value provided by a product or service to a firm and / or to that firm‟s
customers.” Positive brand equity can help a company in a variety of ways. The
most common is the financial benefit which enables a company to charge a price
premium for that brand (Francisco, 2010). Furthermore, positive brand equity can
also help to expand a company through successful brand extensions and expansions
(Kotler, 2000). And not only can brand equity help increase sales and revenues, but it
can also help reduce costs. For example, there is little need for awareness promotions
for a brand that has deep, positive equity. Marketing budgets can be more

9
strategically invested in initiatives that will drive short-term results. A company with
strong brand equity is also positioned for long-term success because consumers are
more emotional connections and loyalties to a brand. Positive brand equity helps a
company navigate through macro-environmental challenges far more easily than
brands with little or negative brand equity can (Aaker, 1996).
According to Susan (2013) brand equity is typically the result of brand loyalty.
Brand loyalty leads to increased market share. Further, he emphasize that there are
five stages of brand experience that lead to positive brand equity such as:
i. Brand awareness: consumers are aware of the brand.
ii. Brand recognition: consumers recognize the brand and know what it offers
versus competitors.
iii. Brand trial: consumers have tried the brand.
iv. Brand preference: consumers like the brand and become repeat purchasers.
They begin to develop emotional connections to the brand.
v. Brand loyalty: consumers demand the brand and will travel distances to find
it. As loyalty increases so do emotional connections until there is no adequate
substitute for the brand in the consumer‟s mind.
Higher brand value or brand with high brand equity, means that the brand has the
ability to create some sort of positive differential response in the marketing
environment. This can mean that brand is easily recognizable when encountered in
advertising or seen on a yard sign. Obviously, brand equity is an intangible asset,
meaning that it is something that is not easily accounted and it is not listed on any
specific line in a firm‟s financial statements. It is reflected in earnings and in stock
price (Susan, 2013).
1.5 Importance of Brand Equity
Brand equity is built up by any organization overtime by building awareness, having
a well-known name or a clear identity, consistent communications, marketing to the
consumer, acting socially responsible, and spending on advertising and promoting
the brand. It is important because the products associated with the brand command a

10
premium price in the market and are perceived to be higher quality when compared
to the similar generic unbranded products. Brand equity also offers competitive
advantages by reducing the marketing costs to firms. Because of high brand
awareness and loyalty brand equity enhances their earnings. Brand equity is created
over a long period of time by using various tools like advertising, public relations,
sponsorships, events, social causes etc. Once the brand equity has been created it is
also important to carefully manage and overtime grow the equity of the brand
employing the same tools mentioned above (Laxmi, 2006).
Brand equity also describe as a marketing term that used to refer the marketing
impact of a given product in association with a brand name. It helps to examine how
a given product or service will perform in the market if it did not have the privilege
of that brand name. Therefore, the basis for brand equity and its impact on a
business is based on the knowledge of the customer about that product or services.
Brand plays a vital role in helping build that knowledge and awareness in business
environment, as well as the choices they make based on that knowledge. Brand
equity reinforces the significance of a brand‟s value and produces that positive type
of recall in the mind of consumers. Marketing research has revealed that brand equity
is one of the most important assets to any organization to achieve their continuous
growth. As an intangible asset, brand equity only gets its meaning out of the
perceived quality and associations made by a consumer on a given product (Wood,
2000).
When consider the benefits of a powerful brand equity it provides several benefits to
the company. Establishes a more reliable stream of income, companies are also able
to increase their profits through increased market share and premium pricing for less
promotional costs. Those are just some of the helpful benefits that a company can
gain from brand equity. It is also very important of handling & enhancing the brand
Equity. It involves the introduction of a product or services of a given brand into the
market. It must establish a certain standard for that brand to be able to launch
products in the future that will sell in the market (Kotler, 2000). Aim of the
organization should be to produce a positive response from the consumer to build

11
trust among consumers. Produce a brand or services need to be unique and yet
memorable. The attitude of any brand must be accessible to consumers and must also
provide benefits to satisfy its users. Consistency is one of the key criteria. Message
must be synchronized with the company‟s overall image and reinforce the value
espoused by the organization. This is one of the most successful ways to make strong
brand equity (Hooker, 2010).
1.6 Brand Equity Dimensions
Today‟s competitive business environment, the concept of brand equity is an
important area for strategic intelligence for marketers. Brand equity dimensions is
important for any organization to enhance purchase intentions of customers,
maximize profits and share returns, maintain market power, sustainable competitive
advantages, brand extension and consumer‟s willingness to pay premium prices.
Brand equity dimensions facilitates in the effectiveness of brand extensions and
brand introductions. This is because consumers who trust and display loyalty toward
a brand are willing to try to adopt brand extensions (Johnson & Bruwer, 2007).
While there have been methods to measure the financial value of brand equity,
measurement of customer-based brand equity has been lacking. The customer-based
brand equity scale is developed based on the five underlying dimensions of brand
equity: performance, value, social image, trustworthiness and commitment (Wood,
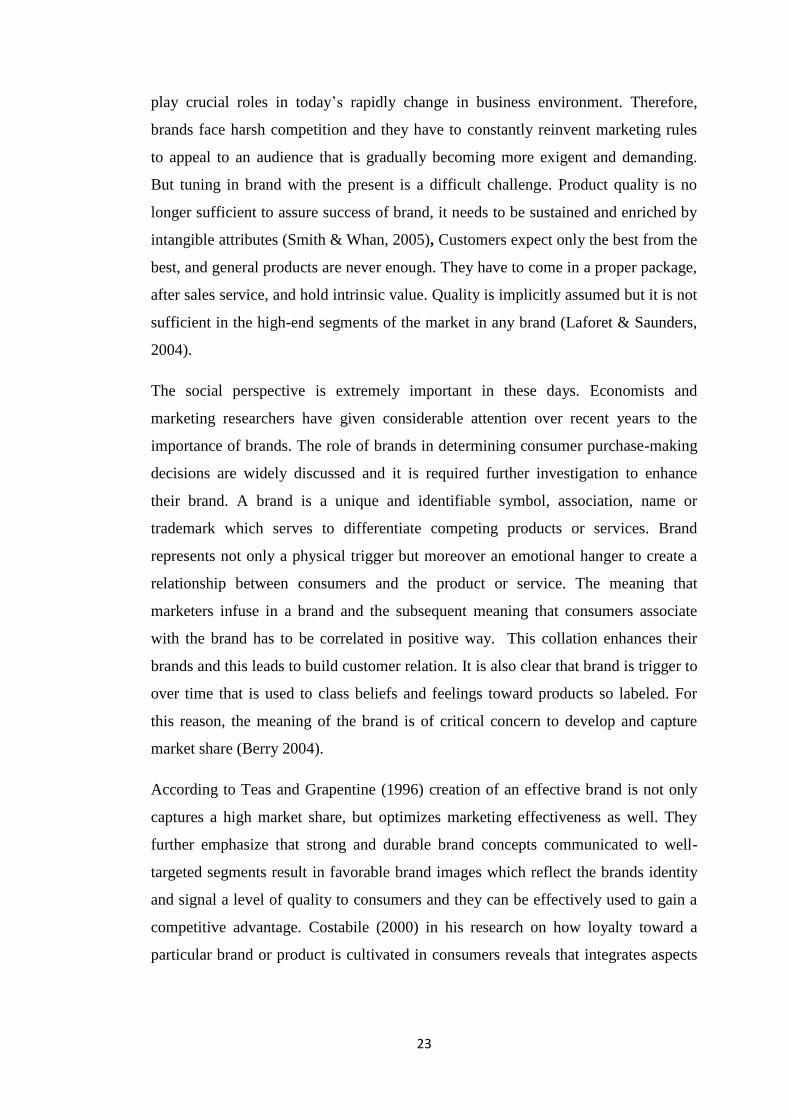
2000). According to the model suggested by Aaker (1996) brand equity has four
dimensions (Fig 1.4). Those are brand awareness, brand association, perceived
quality and brand loyalty.
Figure 1.4: Aaker‟s Brand Equity Dimensions Model

12
1.7 Key Purchasing Determinants (KPD).
Customer satisfaction is widely recognized as key influences in the formation of
consumers' purchase intentions or KPD. Customer satisfaction is a term frequently
used in marketing. It is a measure of how products and services supplied by a
company meet or surpass customer expectation. Customer satisfaction provides a
leading indicator of KPD. In today‟s business environment consumer satisfaction is
identified as main feature in decision making that is the cores of marketing programs
for each organization (Toussaint, 2009). Customer satisfaction is established when
brand fulfills the needs and desires of customers. Customer satisfaction makes the
customers loyal to any organization that provides goods or service.
Previous researchers have found that the satisfaction of the customers can help the
brands to build long and profitable relationships with their customers (Eshghi,
Haughton and Topi, 2007). Though it is costly to generate satisfied and loyal
customers but that would prove profitable in a long run for a firm (Anderson, Fornell
and Mazvancheryl, 2004). Therefore, a firm should concentrate on the improvement
of quality and charge appropriate fair price in order to satisfy their customers who
would ultimately help the firm to retain its customers and enhance the brand equity
(Griffin et al, 2007).
According to the past studies discussed above, researchers have introduced several
KPD‟s of toothpaste market in different socio cultural context. However, there is no
common agreement among them. Furthermore the influence of KPD‟s on brand
equity can be varied in different context. Based on this it was noted that significant
gap in the respective field.
1.8 Problem Statement
Previous researchers in marketing have investigated regarding KPD‟s in different
consumer products (Kotler, 2000), but some researchers specially focus on
toothpaste market (Bader, Shugars & Bonito, 2009). According to Chalmers (2005)
most of the customers are used to consider product attributes in purchasing branded
toothpastes. Furthermore, Aaker (1996) noted that product attributes are associated

13
with the brand values and perceived quality. However, in his model brand awareness,
brand association, perceived quality and brand loyalty were altogether considered as
brand equity. Therefore, it can be postulated that KPD‟s may have significant impact
on brand equity towards the toothpaste market.
However, there are no sufficient empirical studies conducted by previous researches
to determine the benefits of consumer seek from the purchase of toothpaste and
understand the association between KPD and brand equity of toothpaste market.
Furthermore, in Sri Lankan context there is no comprehensive study conducted in
this area.
1.9 Objectives
On view of the above description the objective of this study are:
To determine the factors that influence the purchase of toothpaste by
consumers.
To identify how these factors apply for new product development.
To investigate KPD of toothpaste market in Sri Lanka.
To investigate brand equity of leading toothpaste brands in the Sri Lankan
market.
To recommend strategies to develop brand equity of toothpaste manufactures.
1.10 Significance of the Study
The industrial sector makes significant contribution to any economy in the world. In
the Sri Lankan context, industrial sector generate jobs to labour force in the country.
At the same time industry becomes very competitive and they have to openly
compete with industries in world market. With this background management of
industry sector in Sri Lanka should adapt to new systems of improving their business
performance by identifying criteria like KPD to satisfy their customer base.
The toothpaste industry in Sri Lanka is very competitive and most of leading brands
are marketed by multinational companies. It can be seen that new product
developments and different types of advertisement campaign to capture toothpaste

14
market in Sri Lanka by increasing their budgeted investment for research and
development projects. However, some new products are not satisfied by customers
and therefor the real benefits of the investments are not achieved the target as
expected.
Therefore, outcome of this research will assist to different fields in today‟s business
environment. Findings will help to brand managers, advertising agents, new package
developments and new product developments. This will also benefit to researchers to
continue research related to toothpaste market. Furthermore, oral hygiene factors
related to human being will benefit to health ministry promotional activities of oral
hygiene. Thus there is a vacuum of studies relevant to this field. Also, the researcher
was able to achieve the objectives through better understanding and fill up the gap.
At the end of this study appropriate suggestions are given based on key findings. The
suggestions will assist to stake holders of toothpaste industry to make further
improvement of their products and sustain in business with competitive manner. In
academic point of view, this study would create further research questions to
investigate into KPD of toothpaste industry. As a whole the findings of the study
would help to the manufacturing sector to make a great contribution to the economic
well-being.
1.11 Organization of chapters
This dissertation consists of five chapters namely Introduction, Literature Review,
Methodology, Data Analysis & Discussion and Conclusion & Recommendations.
Focused areas of each chapter are briefly described in below.
Chapter 1: This chapter presents introduction about the study, toothpaste industry,
research problem, objectives, research questions, significant of the study,
methodology, limitation of the study.
Chapter 2: This is encloses the literature review part. The aim of the second chapter
is to theoretical background and explores the relevant literature.
Chapter 3: This chapter covers the theories and the fundamentals that are required in
analysing the data collected in the research. This chapter also emphasis conceptual

15
framework, operationalization and discuss the hypotheses to be tested in detail.
Also, present the Research Methodology with sampling, data collection and data
analysis.
Chapter 4: This chapter analyse the data that collected through the self-structured
questionnaire using appropriate presentation techniques and the findings of the study
will be presented using statistical tools.
Chapter 5: This chapter is entailed with the finding and the conclusions derived
using the results. Also this chapter provides recommendation for the tooth paste
manufacturing industry of and resents suggestions for the further research work
related to this area.

16
CHAPTER 2
LITERATURE REVIEW
2.1 Introduction
The purpose of this chapter is to give an in-depth analysis of this topic. This chapter
aims to review the critical points of current knowledge on this topic, considering the
variables which have been taken based on previous studies and the availability of
data. Thus, this literature review chapter deals with the review of literature related to
the brand equity, key purchasing determinants and their impact on brand equity.
2.2 Conceptual Background of Brand Equity
Today brand equity concept has become very important topic in business
environment. There are two main general motivations for studying brand equity. It
can be described as financial based motivation and strategy based motivation to
improve marketing productivity (Laforet & Saunders, 2004). When consider on
financial based motivation it focus to estimate value of brand more accurately and
precisely for accounting purpose like asset valuation in balance sheet, mergers,
acquisition or divest purpose. Strategy based motivation mainly considers cost,
competition, flatten demand in many markets and finally firms seek to increase their
market share by increasing productivity of their marketing expenses. In recent days
much attention has been given for concept of brand equity. Brand equity has been
described in different perspectives (Manoj & Vithala 1996).
2.2.1 Introduction of brand
A vast body of knowledge exists regarding brand and its definitions. Kottler (2000)
stated a traditional definition of a brand as the name that associated with one or more
items in the product line, which is used to identify the source of character of the
items. In the modern business environment word of brand can be considered as an
important to their sustainability. In a simple way brand is the name, symbol, term,
design, or any other feature that identifies one seller's product different from those of
other sellers. Valuation of brand is an important management criterion that ascribes a
monetary value to brand that is very important in marketing investments to maximize
17
shareholder value (Walter, 2012). Brand also described as proprietary name for
product, service or group. In more multifaceted level as a, brand is a sum total of all
functional and emotional assets of product, service, or group that differentiate it
among the competition. It has three integrated meaning, first as the total of all
characteristic of the product, service or group that including its physical features, its
emotional assets, and cultural and emotional associations. Secondly the brand
identity as applied to a single product or service, family product or service or a group
and finally the ongoing perception by the consumer or public by of the brand
(Kamakura and Russell, 2003).
American Marketing Association (AMA) defines a brand as a "name, term, sign,
symbol or design, or a combination of them intended to identify the goods and
services of one seller or group of sellers and to differentiate them from those of other
sellers. To succeed in branding organizations must understand the needs and wants of
their customers and prospects. A strong brand is invaluable as the battle for
customers intensifies day by day. It's important to spend time investing in
researching, defining, and building of brand. Brand is the source of a promise to your
consumer. It's a foundational piece in marketing communication (Francisco, 2010).
2.2.2 History of brand
Brands and branding are not a new phenomenon, neither for academics nor the
business environment. There is possible evidence to trace back the use of brands all
the way to the Stone Age. The history of brand like using symbols to represent
products or services can be traced back to ancient times. In the early stage merchants
in Egypt, China, Greece, and Rome used pictures and symbols to communicate with
customer regarding their products. The word of brand derives from the German word
of “brandr”, that meaning of to burn. It means to burn the mark of the producer onto
the product they made (Douglas, 2004).
Brands in the modern term began to develop in the United State. It was accelerated in
the mid of 1800s because rise of mass media. That assisted by advertising,
merchandising, and the emergence of middle-class, literate customers. That leads to
purchase products by choice rather than of necessity of customers. The shift from the
simple generic product to branded product has not been sudden or in way of

18
haphazard. It had happened in step by step, that means it grew out of the
standardization of quality products for consumers in the middle of the 20th century.
Popularity of branded products required companies to find a new way to differentiate
themselves from their competitors. In the 1950s, multinational companies like
Procter and Gamble, General Foods and Unilever developed the discipline of brand
management process separately to focus on branded products. That leads to
distinguished product or services from competitors (Joe, 2012). This evolution of
branded product was perceived to offer superior value to its competitors, the
company offering the brand could charge a little more for its products.
2.2.3 Evolution of brand
Brand and branding concepts have evolved over time. It is possible to trace back the
use of brands in early stage of human being that way back to the Stone Age. Burk &
James (1996) stated that during the 16th century brands similar to those see today in
business environment have started to take shape. They further emphasize that since
the 18th-century England and France, there have been a massive development of the
knowledge, procedures, and theories with related to brand and branding.
According to the Farquhar & Peter (1995) contemporary theories related to brand
and branding has their origin and evolutionary starting in the mid-20th century. This
is mainly due to the development of commercials in mass media. For a long time, an
uncertainty existed as how companies should emphasize their brands and how much
the average customer focuses about those brands. Therefore it became vital for
marketers to establish through research how important brands were in the key
activities like new product development and capturing of market share.
Smith & Wendell (1996) founded the concept of segmentation in marketing as early
as in the 1950s, and this has become an important milestone for develop brand and
branding of products in marketing environment. The segmentation variables mainly
focus to socio-economic variables such as consumers‟ working situation, income,
education, demographic variables such as age, life cycle, and civil status. Those
variables were played vital role in evolution of different kind of brands. During

19
1970s, the field of branding was primarily associated with mass production and mass
advertisements. Most of companies principally used brand commercials to
differentiate their products from other products (Roper & Parker, 2006).
Another important factor in the evolution of branding is the concept of positioning.
Kotler (2000) argued that positioning is about the target group. The main aim of
marketers is to put the product into the mind of the customers. When outlaying the
positioning strategy it needs to be concentrated on the surrounding elements of the
product. It also highlighted that to positioning of product company could choose to
make alterations to the price strategy, product name, or the package. In the 1970s and
1980s that branding was further developed and more firmly established in the
business environment. In this era brand, branding and brand equity became an
important area within the entire discipline of marketing (Moore & Reid 2008).
Consequently it is very important for companies to prove that customers had a need
for branded products and that a brand added an extra value to the product. In the
most of literature review shown that the development of the society influences the
development of marketing. Hence, to predict the development of market share for
any business it has to look into their brands in rationally (Blumenthal et al. 2003).
2.2.4 Definitions of brand and branding
There are many definitions can be seen for the brand in today‟s dynamic marketing
landscape. Roper et al. (2006) argue that concept of the brand in business
environment as a multidimensional construct that matching a firm's functional and
emotional values with the performance and psychosocial needs of consumers.
According to the Kotler (2000) simple traditional definition of a brand can be
described as the name that associated with one or more items in the product line it is
used to identify the source of character of the item.
Further, vast body of knowledge exists regarding definitions of brand in past
literature. Hunt & Burnett (1982) define a brand as that represents an organization
and reflects its heritage, values, culture, people, and strategy. Also he emphasized
brand may identify one item, a family of items, or all items of that seller. If used for

20
the firm as a whole, the preferred term is trade name. Donna (2013) stated that brand
is an identity of any organization in terms of what products and services they offer
but also the essence of what the company stands for in terms of service and other
emotional, intangible consumer aspects. Brand describe the company stands whether
it is most economical, does it stands for superior service, is it an environmental
friendly or responsible service or product. Another way of describing a brand is a
shorthand marketing messages that make emotional bonds with consumers.
Brands are composed of intangible elements related to its specific aptitude, character,
and positioning and tangible components having identifiable representation including
logos, graphics, colours and sounds. A brand creates perceived value for consumers
through its personality in a way that makes it stand out from other similar products.
Brand also describe as identity of a product or service. It may be the name, the logo,
the design, or a combination of those that customers use to identify, and differentiate,
one product from another. A good brand must be delivered a clear message, provide
credibility, connect with customers emotionally, motivate the buyer, and create user
loyalty in business environment (Gini, 2010).
In today‟s business environment it is clear that customers are controlled business
based on their satisfactions. Marketers may be investing huge money to build
a brand. According to Charlene and Josh (2006) brand is the emotional relationship
between the consumer and the product, there for marketers need to focus with
consumers and build positive brand associations. The deeper the relationship, the
more market share exists. Branding can be described as ongoing process of focusing
organization past and present then creating a cohesive personality for the
organization and its product going forward. For this SWOT (Strengths, Weaknesses,
opportunities & Threats) analysis is done and go through all benefits like real and
emotional that the product or services fulfills their customers. It has been found that
vast body of knowledge discussed branding in marketing management.
According to the Kerpan (2007) branding is the representation of the organization as
a personality. Branding is differentiates one from another and it is defined

21
personality of a product, service, company, organization or individual. Using survey
data Sigeal et al (2002) argue that successful branding requires delivering
consistently positive experiences for organization‟s constituents. It comes from
keeping promises to customers and earning their trust that brand will do its best at
every point of contact to deliver on what they want and expect from the brand. This
trust leads to their choosing brand again. Successful brands never take their
constituents for granted. Customer never forget that most important to constituents
are what‟s in it for them, that constituents are distracted, and organization must earn
their attention.
Based on above discussion it is clear that there are many definitions for brand and
branding. Although marketers‟ definitions of brand may differ, it‟s consistent is the
importance of building brand as a competitive marketing tool. Brands retain their
power in today‟s evolving social media ecosystem and device indifferent information
consumption because they provide communication that breaks through the ever-
increasing message-laden environment (Sigeal et al, 2002).
2.3 Role of Brand in Marketing Practice
Modern marketing as it derive from economics advance, view the firm and the
customer as separate and discrete entity. The customer is exogenous to the firm and
recipients of the firm‟s active value creation efforts. One of the main role of the
brand is close this gap between firm and customer. A strong brand name in today‟s
business environment allows for greater success in implementing a strategic plan,
remaining consistent in messaging and putting the firm in a better position for cross-
selling in market place (Kotler, 2000).
When consider the role of brand a successful brand differentiates itself from its
competition either in quality, price or uniqueness. Brands can be positioned in their
market in three single ways, which should never be mixed among each other. First
way can be selected as brand differentiator. That means differentiates itself from its
competition though quality, functionality, availability and design. Second way is the
cost leader. It differentiates itself from its competition through a lower price.
Therefore, it is obvious it belonging in a low budget category and consumer is aware

22
of the abundance of one or more of the differentiator‟s values. Finally, role of market
is considering in niche market. It has no perceived competition in its market and can
theoretically be priced very high, targeting mainly Innovators and early adopters.
When the connection between the customer and the product is strong then brand
becomes a motivator for the customer to continue buying products continually and
increase loyalty even if they have never used that exact product before (Stuart, 1993).
2.4 Importance of Brand
The time is tough in the marketing world. Business is not running as smoothly as
before due to changing customer requirements and fast developing information
technology that can be easily accessed. The competitive landscape in the business
environment is fairly differentiated. Product or technology-based advantages and
their developments are difficult to maintain. Today‟s most products are becoming
more alike, but intangible attributes like brand, branding and brand equity take the
reign in marketing environment (Dobson, 2009).
As technology evolved in day by day, the market has slowly shifted from a seller‟s
playground to a consumer-dominated territory. The consumer-king concept has
become a reality that taking commercial competition to the next level. Consumer
insights are very important in the designing of efficient branding programs. Markets
are competing in highly unstable environment in these days and most components
modify rapidly in day to day business. Every day brings a new technological
discovery that immensely threatening to completely change the customer
requirements and that lead to change the characteristics of brand. Therefore,
companies need to focus on their brands in proactive way to sustain in the business
(Bolmback & Axelsson, 2007).
At the same time a different lifestyle and high living standards have imposed changes
in habits and attitudes. Therefore, products and services has transcend their
functional nature and now become to pure experiences. The key to success in this
competitive marketing context intangible attribute like branding is one of the
powerful tools in today‟s business environment (Berry, 2004). Prior research
suggests that one of the main reasons is technological progress and social dynamics
23
play crucial roles in today‟s rapidly change in business environment. Therefore,
brands face harsh competition and they have to constantly reinvent marketing rules
to appeal to an audience that is gradually becoming more exigent and demanding.
But tuning in brand with the present is a difficult challenge. Product quality is no
longer sufficient to assure success of brand, it needs to be sustained and enriched by
intangible attributes (Smith & Whan, 2005), Customers expect only the best from the
best, and general products are never enough. They have to come in a proper package,
after sales service, and hold intrinsic value. Quality is implicitly assumed but it is not
sufficient in the high-end segments of the market in any brand (Laforet & Saunders,
2004).
The social perspective is extremely important in these days. Economists and
marketing researchers have given considerable attention over recent years to the
importance of brands. The role of brands in determining consumer purchase-making
decisions are widely discussed and it is required further investigation to enhance
their brand. A brand is a unique and identifiable symbol, association, name or
trademark which serves to differentiate competing products or services. Brand
represents not only a physical trigger but moreover an emotional hanger to create a
relationship between consumers and the product or service. The meaning that
marketers infuse in a brand and the subsequent meaning that consumers associate
with the brand has to be correlated in positive way. This collation enhances their
brands and this leads to build customer relation. It is also clear that brand is trigger to
over time that is used to class beliefs and feelings toward products so labeled. For
this reason, the meaning of the brand is of critical concern to develop and capture
market share (Berry 2004).
According to Teas and Grapentine (1996) creation of an effective brand is not only
captures a high market share, but optimizes marketing effectiveness as well. They
further emphasize that strong and durable brand concepts communicated to well-
targeted segments result in favorable brand images which reflect the brands identity
and signal a level of quality to consumers and they can be effectively used to gain a
competitive advantage. Costabile (2000) in his research on how loyalty toward a
particular brand or product is cultivated in consumers reveals that integrates aspects

24
of cognitive, behavioral, and emotional constructs into a cyclical relationship. He
further argue that a feeling of trust, accompanied by anticipated satisfaction,
confirmation or disconfirmation following purchase and the importance of the brand
is emphasized by the fact that customers tend to generalize their positive or negative
experiences with a brand to all products that share the brand name. Branding has
been recognized as the key to success in nowadays business. It provides value to the
consumer through the buying process and thereby assures value to the company by
attracting consumers and stimulating loyalty. The complex and versatile branding
principle has imposed itself as the new business paradigm. It is implemented
virtually across all markets and categories. Vast body of researches underlines the
relational aspects of brand that emphasizing trust and dependability between
consumers and the company (Chow & Holden, 2005).
2.5 Brand Equity
Brand equity is one of the critical parts in building a today‟s business and
companies that successfully build brand equity understand just how important it is to
the bottom line. However, development of brand equity is not a simple task. It takes
time, patience, and a great deal of effort to build positive brand equity and its
sustainability.
2.5.1 Background of brand equity
Brand equity concept devoted much attention recently and it has been viewed from
different perspectives. The existing of the brand equity among the customers assists
any organization to develop brand reputation and dominate in a competitive
marketing environment (Aaker, 1996). Brand equity also triggers the brand extension
within and across the product category at it has been as an appropriate matric
evaluating the effectiveness of marketing communication and service performance
(Kellar, 1993). Improvement of brand equity is considered an important part of brand
building process in today‟s competitive business environment. Cobb, Beal and
Donthu (1995) have explained brand equity is supposed to bring several advantages
to a firm to sustain in business. For example, high brand equity levels are known to
lead to higher consumer preferences and purchase intentions that leads to high

25
customer relations. Many researchers identified that firms with high brand equity are
also known to have high stock returns.
2.5.2 Definitions of brand equity
In the field of marketing the word “brand equity” is associated with myriad words to
try to define things that people regard as distinct from others. There is a consensus
that brand equity is sum of all the mental associations of customers that have about a
particular brand in abundance of brands. There are vast body of knowledge prevail
regarding definitions of brand equity in past studies.
According to Leuthesser and Jones (1988) brand equity defined as the added value
with which a given brand endows a product or a product is something that offers a
functional benefit. Further Joseph (1975) argued that brand equity consists of the
long term brand perceptions and associations in the minds of consumers. The
stronger of perceptions like coherent, motivating will assist to influence purchase
decisions and add value to a business. He also emphasized that brand equity is
derived from the total brand experience like product, packaging, design, price, store
presence, and controlled and uncontrolled communications and this runs contrary to
the belief that brand equity should be all about the desire created by its marketing not
the attractiveness of its more tangible assets.
According to the David Aaker (1991) brand equity defined as “A set of assets and
liabilities linked to a brand, its name and symbol that adds to or subtracts from the
value provided by a product or service to a firm and/or to that firm‟s customers.”
Keller (1993) described brand equity as “differential effect of brand knowledge on
consumer response to the marketing of brand”. Brand equity also defined as “the
enhancement in the perceived utility and desirability a brand name confers on a
product” (Mackay, 2001). According to the American Marketing Association brand
equity is defined as “the value of a brand. From a consumer perspective, brand equity
is based on consumer attitudes about positive brand attributes and favorable
consequences of brand use.”

26
2.5.3 Consumer based brand equity
The customer-based brand equity is identified as evaluating the value of a brand in
customers' minds. As proper branding can be increased profitability in large and
small-scale businesses by filling in gaps in customers' knowledge and by offering
their requirements. Therefore, nowadays consumer based brand equity has become
an important topic in the business world. Keller (1993) argued that success of brand
is related to what resides in the heart and minds of consumers. He described
customer based brand equity as “the differential effect of brand knowledge on
consumer response to the marketing of brand”.
When consider on consumer-based brand equity measures it is important in several
reasons. Main reason is consumer-based measures allow the assessment of brand
equity at the brand level. Second, there is lot of published research in marketing uses
these types of measures. Third, marketing managers are highly familiar with
consumer-based measures that use data commonly collected in research studies and
will thus use the information to enhance their brand further (Simon and Sullivan,
1993). Any organizations are interested in building brands with great equity but it is
not easy task. Therefore, to build brand organizations must star in proper way to get
what makes a brand strong. Keller (1993) developed a model that is called customer
– based brand equity model which maps brand equity and how it should be best to be
built, manage and measured.
According to Keller‟s customer based brand equity model consist of series of steps
for blinding strong brand as (I) establish a proper brand (II) creating of appropriate
brand meaning (II) elicit a right brand responses and (IV) forge appropriate brand
relationship with customers. According to Keller‟s customer based brand equity
model also depends on six brand buildings blocks namely salience, performance,
imagery, judgment, feeling and resonance that leads to the foundation for successful
brand development. It is depicted in Figure 2.1.

27
Figure 2.1: Customer – Based Brand Equity Model
Source: Keller (1993)
2.5.4 Research related to brand equity
Vast body of researches are available that related to brand equity (Leuthesser and
Jones, 1988; Mackay, 2001: Keller, 1993). Based on those brand equity has been
formulated from different perspective in studies that investigate for the widely
different propose. According to Franzen (1999) brand equity can be measured at the
firm level and consumer level or combination of both. He also stated that firm based
approach to brand equity for financial and evaluation purpose and there is also brand
equity at individual customer level.
According to Barwise et al (1990) firm level measure of brand as a financial asset
and brand equity as an intangible asset displayed in variety of forms of in the
financial statement. The brand equity bestows long term return on company through
the creation of loyal customers. Preliminary research related to brand equity help for
companies to develop an effective brand strategy, and a strategy that is custom-
tailored to the company. There are many ways in which brand equity studies go
hand-in-hand with strategy development in today‟s business environment.

28
2.5.5 Dimensions of brand equity
Today‟s in competitive business environment, the concept of brand equity is an
important area for strategic intelligence for marketers (Keller, 1993). Brand equity
dimensions is important for any organization to enhance purchase intentions of
customers, maximize profits and share returns, maintain market power, sustainable
competitive advantages, brand extension and consumer‟s willingness to pay premium
prices (Franzen, 1999). Brand equity dimensions facilitates in the effectiveness of
brand extensions and brand introductions. This is because consumers who trust and
display loyalty toward a brand are willing to try to adopt brand extensions. While
there have been methods to measure the financial value of brand equity,
measurement of customer-based brand equity has been lacking. The customer-based
brand equity scale is developed based on the five underlying dimensions of brand
equity: performance, value, social image, trustworthiness and commitment (Wood,
2000). Even though various researches available in brand equity through the past
years there is considerable debate regarding the definition of brand equity and its
measurements. Numbers of dimensions have been used to examine consumer based
brand equity (Yoo and Donthu, 2001).
These measures may be direct or indirect. Direct measure are determined the
potential source of inherent characteristics of the brand equity. Indirect measures
attempt to identify the concrete aspect influence the brand association in the minds of
customers (Keller, 1993). In simply, brand equity is accepted as the overall utility
that customers place in a brand (Vazquez at el, 2002). The definitions of brand equity
can be classified into main two perspectives. The first perspective of brand equity is
from a financial point of view where the asset value of a brand is evaluated.
Nowadays in business environment brand equity has increasingly been defined in
customer-based perspectives, which defines brand equity as the value of a brand to
the customer. Brand equity defines by Aaker (1991) as “a set of brand assets and
liabilities linked to a brand, its name and symbol that add to or subtract from the
value provided by a product or service to a firm and/or to that firms‟ customers”.
Keller (1999) stated that the strength of a brand lies in the minds of the customers. It
is depend on what customers have experienced and learned about the brand over
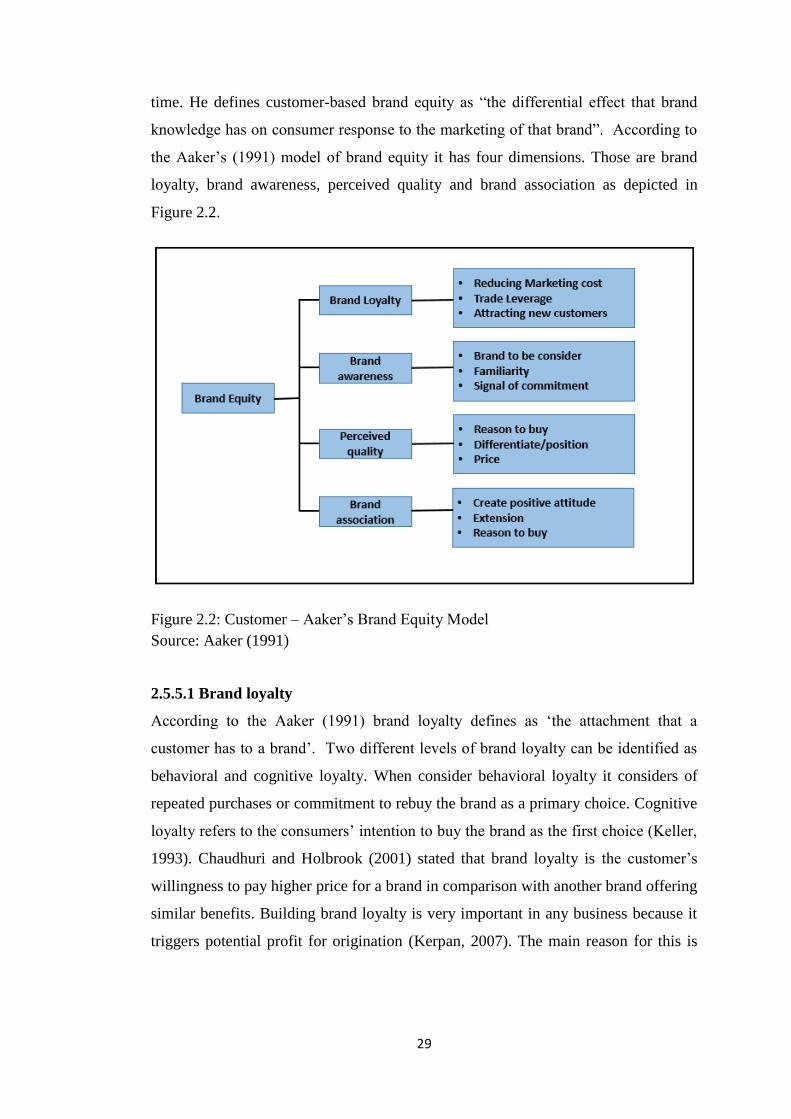
29
time. He defines customer-based brand equity as “the differential effect that brand
knowledge has on consumer response to the marketing of that brand”. According to
the Aaker‟s (1991) model of brand equity it has four dimensions. Those are brand
loyalty, brand awareness, perceived quality and brand association as depicted in
Figure 2.2.
Figure 2.2: Customer – Aaker‟s Brand Equity Model
Source: Aaker (1991)
2.5.5.1 Brand loyalty
According to the Aaker (1991) brand loyalty defines as „the attachment that a
customer has to a brand‟. Two different levels of brand loyalty can be identified as
behavioral and cognitive loyalty. When consider behavioral loyalty it considers of
repeated purchases or commitment to rebuy the brand as a primary choice. Cognitive
loyalty refers to the consumers‟ intention to buy the brand as the first choice (Keller,
1993). Chaudhuri and Holbrook (2001) stated that brand loyalty is the customer‟s
willingness to pay higher price for a brand in comparison with another brand offering
similar benefits. Building brand loyalty is very important in any business because it
triggers potential profit for origination (Kerpan, 2007). The main reason for this is

30
cost of recruiting new customers are much higher than the cost of retaining existing
customers. Furthermore loyal customers are more likely to pay price premiums and
less likely to be price sensitive. The brand pyramid that was explained by Millward
(2010) is one of the useful tools that can be used to identify customer‟s journey
towards the brand loyalty as depicted in Figure 2.3.
Figure 2.3: Brand Pyramid
Source: Millward (2010)
Brand Pyramid shows that five key stages for customers go through as they build
loyalty to a brand, product, or service. The five stages are namely, presence,
relevance, performance, advantage and bonding. (Millward, 2010).
.
2.5.5.2 Brand awareness
Brand awareness can be considers as the first steps of building brand equity among
individual customer level. Aaker (1991) described brand awareness as “the ability of
a potential buyer to recognize or recall that brand is a member of a certain product
31
category”. He further stated that brand awareness stimulate the memory of customer
to give them a certain sense of familiarity with the brand in putting together their
considerations. Basically brand awareness functions to reveal to uncover customers‟
ability to identify a brand in memory increase the likelihood of brand name without
outside. Brand awareness also measures how familiar people are with a product or
services. Recognition of product‟s name has an advantage over brands that don‟t
recognize. Brand awareness indicates the health of a brand and it can be used as a
tool to measure the effectiveness of advertising aid (Franzen, 1999).
Brand awareness plays a major role in a consumer‟s purchasing decision process.
Therefore maintaining of brand awareness is a very important aspect in marketing.
The eventual goal of most businesses is maximize profits and increase sales. Thus
every business intends to increase their consumer pool and encourage repeat
purchases. When consider the brand awareness it affects consumer decision making
by influencing the formation and strength of brad association and this leads to
enhance the brand loyalty among the customers (Kamakura and Russel, 2003).
2.5.5.3 Perceived quality
Perceived quality cannot objectively determine. Because it is a perception and
judgments about what is important to customers are involved. In simple way
perceived quality can be defined as the customer's perception of the overall quality or
superiority of a product or service. Perceived quality is also measure with respect to
its intended purpose and relative to alternatives. Perceived quality is, generate in
customers‟ insight. Perceived quality is an intangible, it express overall feeling
about a brand (Johonson and Bruwer, 2007). Aaker (1991) described perceived
quality as “customer‟s perceptions of the overall quality or superiority of a product or
service with respect to its intended purpose, relative to alternatives”. According to
the Zeithaml (1998) perceived quality defined as a customer‟s judgment about the
superiority, esteem or excellence of a brand in relative terms. Holbrook and Corfman
(1985) stated that perceived quality is differed from objective quality that involves a
subjective response and evaluation of product or service. Further, they argued that
the dimensions underlying perceived quality depend upon the characteristics of the
product or service. Customers evaluate the perceived quality of brands on their

32
understanding of service delivery and performance. Hosted (1985) argued that
perceived quality can be considered as a key strategic variable for most of the firms.
Total quality management that popular in past decade has been central to many firms
for the enhance quality and reduction of cost and finally perceived quality is usually
the end goal of total quality management programs. Cobb et al. (1995) proved that in
his research there is a positive relation between the amounts spent on advertising and
brand awareness. Further Aaker and Joachimsthaler (2000) observed that there is a
positive relationship between advertising spending and perceived quality. These
findings are also supported by Kirmani and Wright (1989).
2.5.5.4 Brand association.
Brand association seated in customer‟s mind about the brand. When a brand is
associated with something positive then customers are relate it to being positive.
Brand associations are also the attributes of brand which come into consumers mind
when the brand is talked about. It is related with the implicit and explicit meanings
which a consumer associates with a specific brand name. Brand association can also
be defined as the degree to which a specific product recognized within its product
category (Mackay, 2001).
Based on a literature review it can be identified two types of brand association. One
is product association. The other one is organizational association that including
corporate ability association and corporate social responsibility association. It also
found that in past research the number of brand association and total association have
significant relationships with brand equity. But the core of the brand association,
instead of total association, is the key factor of driving brand equity building. The
greater the numbers of the core brand association, the higher the brand equity
(Netemeyer et al, 2004).
According to Aaker (1991) brand association is another dimension of consumer-
based brand equity. He also defined brand association as “anything link in the
memory to brand”. The association may be linked to product (Bullmore, 1984),
country of origin, company (Blomback & Axelsson, 2007), competitor (Biel, 1993),
retailer, lifestyle or demographic (Engel et al, 1998). Vast bodies of researches have

33
explored that brand image in an effort to understand the brand associations (Biel,
1993), brand personality (Kotler & Keller, 2008) and brand meaning (Berry, 2000).
According to Keller (1993) brand image defined as “perceptions about a brand as
reflected by the brand association held in the consumer memory” and described
brand associations as any informational node linked to the memory of brand that has
a comprehensive meaning for the customer. Brand association is very important for
devolving a favorable, strong and unique brand image (Keller, 1993) and creating
conceivable and reliable meaning for customers through the differentiation of the
characteristic and personalities of the brand (Berry, 2000).
2.6 Consumer Buying Behavior
Consumer buying behavior is one of the extensively studied areas by researchers and
marketers in the past. There are different reasons why consumer behavior has been
topic for many researches. One factor is the consumer behavior has become a direct
impact of overall business performance (Kotler & Keller, 2008). Another view
suggests consumer behavior is crucial because of fierce competition in worldwide
business environment (Laing et al, 2002).
Kottler and Keller (2008) stated that as a part of the marketing, buying behavior of
consumer is very important area to study. They further emphasized in their studies
regarding way how the individuals, groups or organizations choose, buy use and
dispose the goods with the factors that effecting to purchasing decision such as their
previous experience, taste, price and branding. They also show that personal habits
and previous experience of the consumers have a direct impact on the purchasing
decision of the consumers. They also stated that the image of the product has a vital
impact on the purchasing decision of the consumer. Further they recommended that
the product image should continuously be improved in order to encourage the
purchasing decisions of consumers. It has been identified that in many researches,
the consumer buying behavior is the outcome of the needs and wants of the
consumer and they purchase to satisfy their needs and wants. It also clear that needs
of human being depends on the personal factors such as age, psychology and
personality.

34
Also there are some other external factors which are broad and beyond the control by
consumer. Large numbers of researches have been carried out by academics and
scholars on identifying and analyzing factors affecting the consumers‟ buying
behavior. Those studies identified various types of factors that effect for the
consumer behavior. These factors have been classified into different types and
categories in different ways by different researchers. Laing et al, (2002) classified
them into internal and external factor. On the other hand, Lassar et al (1995) divided
these factors into social, personal and psychological. Despite the fact that they have
been classified into different groups by different researchers they are similar in scope
and purpose (Berry, 2000).
2.7 Consumer Buying Decision Process
Purchase can be considered as only the visible part of a more complex decision
process created by the consumer for each buying decision. But what happens before
and after these purchases have to consider in more broadly. The Factors influencing
the choice of product purchased by the consumer are very important to capture
market in further. Engel, Blackwell and Kollat (1998) developed a model for
consumer buying decision process. It consist of five steps namely need recognition,
information search, evaluation of alternative, purchase and post purchase evaluation
as depicted in Figure 2.4.
Figure 2.4: Buying decision process
Source: Engel, Blackwell and Kollat (1998)
35
The first and most important step in the buying process is need recognition or
problem awareness. Purchase depends on need and if there is no need, there is no
purchase in market place. Recognition happens when there is a gap between the
consumer‟s actual situation and desired situation. However, all the needs are not end
up as a buying behavior. It requires that the lag between the two situations is quite
important.
Second step of buying decision process is seeking information about possible
solutions to the problem. Customer will search more information depending on the
complexity of the choices to be made. Customers also consider his level of
involvement in this step. The consumer will be able to evaluate the different
alternatives with proper information. Then evaluate the most suitable product or
service that fulfills customer‟s need. After evaluating the different solutions and
products available for respond to need, customer will be able to choose the product
or brand that seems most appropriate to their needs. Then proceed to the actual
purchases that represent fourth steps of the buying decision process. After purchased
and used of the product, the consumers will eventually evaluate the adequacy with
their original needs (Engel, Blackwell and Kollat, 1998).
2.8 Key Purchasing Determinants (KPD)
Most of the industries are trying to expand their market worldwide in this era. For
this purpose they need to study their respective market and identify the factors that
will steer them to success. Thus, the identification of KPD is very important and
factors which influence KPD should be identified in order to success in the fast-
moving consumer goods (FMCG) industry in worldwide. When consider the KPD
customer satisfaction is widely recognized as key influences in the formation of
consumers' purchase intentions because it is one of the main factors in making
purchasing decision. Some studies have highlighted concepts such as Brand Equity
(Aaker, 2003), Customer Equity (Laing et al, 2002) enhance the purchasing
determinants of customers.

36
Furthermore, some researchers have investigated the impact of other factors on key
purchasing determinates. As example the impact of consumer perception on green
purchasing product influence of packaging on consumer purchasing decision for
FMCG (Biel, 1993). Bullmore (1984) carried out study to focuses on the facts that
affect the consumers purchasing decision making process on purchasing of imported
health food products, in particular demographic effects such as gender, education,
income and marital status. The researcher employed questionnaire method in order to
reach the objectives of the research. His analysis reveals that impact of family
members on the consumer decision making process of purchasing imported health
food products was significant.
According to the literature given in this chapter KPD has direct impact on brand
equity dimensions. However, the relations impact on KPD can be varied based on the
industry and socio economic context. Further, influence of the KPD may not have
same impact on each dimensions of the brand equity. This situation becomes further
complex when it comes to developing countries due to majority of customers are not
brand conscious. Therefore, the association between KPD and brand equity in the
toothpaste market did not hugely consider by previous researchers. Further, this
research issue did not significantly address by previous researches in Sri Lankan
context. Therefore, it can be identified significant literature gap. Accordingly, this
study mainly focus on fulfill that literature gap.
2.9 Chapter Summary
There were various studies related to determine the benefits of consumer seek from
product and impact of KPD on brand equity on varies products including toothpaste
by various countries. However, in Sri Lanka not much studies were reported on this
aspect in particularly for toothpaste. Nevertheless various aspect and analyses carried
out by various authors are immensely useful to this study.

37
CHAPTER 3
METHODOLOGY
3.1 Introduction
This chapter mainly focuses how research problem has been developed into a
conceptual model that can be investigated using statistical analysis. Also the
statistical methods used are briefly discussed.
3.2 Conceptual Framework
Literature reviewed by the researcher has helped in conceptualizing the research
problem. The research problem at hand is to determine the benefits of consumer seek
from toothpaste and impact of KPD on brand equity of toothpaste market in Sri
Lanka. In conceptualizing the study, researcher has attempted to build relationship
between independent variables and dependent variable. It is also necessary to
examine the relationship between two key variables and other variables influenced
on dependent variable. This would enable the researcher to interpret the findings in a
more comprehensive manner. As per the literature review several KPD‟s were
identified in toothpaste market in different perspective.
For instance it highlights various factors affecting purchase of toothpaste like price
(Zeithaml, 1988), prevent cavity (Steele, 2000), shiny teeth (Heinjnbrok & Vander,
2007), strengthen gum (Mojon & Baehni, 1998), freshness, strengthen of enamel,
attractive teeth (Griffin et al, 2007) company image and advertising (Simoes & Dibb,
2001.). Based on those dimensions researcher developed the conceptual model for
the study and it is depicted in Figure 3.1.

38
Figure 3.1: Conceptual framework
3.3 Operationalization of the Study
The focus of this research is to determine the benefits of consumer seek from
toothpaste and impact of KPD on brand equity of toothpaste market in Sri Lanka
Therefore, concepts defined in the conceptual framework need to be operationalized
to testable levels, in order to establish the focus of the research. To determine the
benefits of consumer seek from toothpaste self-administration questioners with five
point likert scale were included. This part included in questioner with focus of eight
areas of consumer seek from purchase of toothpaste. These eight areas are given
below.
Prevent Cavity
Advertising
Company Image
Shiny Teeth
Attractive Teeth
Strengthen enamel
Strengthen gum
Freshness
Brand equity

39
X1 : Purpose of toothpaste is preventing cavity.
X2 : Preferred to purchase toothpaste gives shiny teeth
X3 : Toothpaste should be helped to strengthen gum.
X4 : Freshness of breath is important
X5 : Strengthen of enamel
X6 : Attractive teeth is very important
X7 : Company image is consider when purchasing toothpaste
X8 : Price of the toothpaste is consider when purchasing toothpaste
The concepts appearing in the hypotheses were reduced to operational terms and
each variables of the conceptual framework has been operationalized based on
literature survey described in Chapter 2 and shown in Table 3.1. The identified two
concepts are KPD and brand equity. For each concepts, many variables have been
identified and for each variable different indicator were identified (Table 3.1).

40
Table 3.1: Operationalized Table
Concept Variable Measurement Indicator
KPD
Prevent Cavity
Customer awareness and importance of prevent
cavity
Facing Problem with prevent cavity in oral
hygiene Current satisfaction level of prevent cavity in
toothpaste that use
How far consider of prevent cavity in teeth in oral
hygiene
Shiny Teeth
How far importance of shiny teeth in oral
hygiene
Current satisfaction level of shiny teeth in
toothpaste that use
Extent of importance in shiny teeth
Strengthen gum
How far strengthen of gum importance in oral
hygiene
What extent currently use toothpaste assist to
strengthen gum
Current satisfaction level of strengthen of gum in
tooth past
Freshness
Customer awareness and importance of freshness
in toothpaste products
Facing Problem with prevent cavity in oral
hygiene Current satisfaction level of freshness in
toothpaste that use
How far consider freshness in teeth in oral
hygiene
Strengthen of
enamel How far consider regarding strengthen of enamel
in oral hygiene
What extent currently use toothpaste focus to
strengthen enamel
Current satisfaction level for attribute strengthen
of enamel
Attractive Teeth
How far importance of attractive teeth in oral
hygiene
Current satisfaction level of attractive teeth in
toothpaste that use

41
Concept Variable Measurement Indicator
KPD
Attractive Teeth
What extent of importance in attractive teeth
Company Image
How far company image impact on selecting
toothpaste
Which extent company image assist to make
change in customer base
How far company image reflect the quality of
product
Advertising
How extent advertising campaign enhance the
brand equity of tooth paste
What extent advertising assist to get information
regarding tooth paste products
Customers can be changed by advertising
campaigns
Brand
equity
Brand Awareness
How far one brand can identify among other
competing brands
What extent symbol of favorite brand keep in
memory
Brand association
Current feeling of brand selection and it
association level
How far get excitement using tooth paste brand
that use
Preferential level of the company which makes
tooth paste brand
What extent trust the company which makes tooth
past
Perceived quality
Level of quality offers in tooth paste product
Consistent level of quality offers in tooth paste
product
Assurance level reliability in tooth paste product
Brand loyalty
What extent consider consumer loyal to tooth
paste brand
Any priority of selection to choose tooth paste
brand
How far recommend your tooth paste brand to
others
Table 3.1: Operationalized Table (Continued)

42
3.4 Methodological Choice
The main purpose of this study is to determine the benefits of consumer seek from
toothpaste and impact of KPD on brand equity of toothpaste market in Sri Lanka
through a self-administered questionnaire. Accordingly, both qualitative and
quantitative statistical methods were carried out. Under this context, deductive
research approach was also employed.
3.4.1 Primary data
Collecting data directly from the practical field is called primary source of data.
Among the methods of collecting primary data main methods include:
questionnaires, interviews, focus group, observation, case-studies, diaries, critical
incidents, portfolios (Mohommad 2010) etc. However, there are several factors to be
considered in collecting this data. It is important to look into the time structure,
resource availability nature of the research when choosing a particular method of
data collection (Saunders et al 2003). Due to the time and resource availability of the
research, a structural questionnaire was designed to collect the primary data from
customers with the self-administrated questionnaire.
3.4.2 Secondary data
Secondary data is data that has already been collected by someone else for a different
purpose. For example, this could mean using: data collected by a hotel on its
customers through its guest history system, data supplied by a marketing
organization, annual company reports, and government statistic (Mohommad 2010).
The secondary data gathered will help to strength the primary data analysis and to
give a better understanding the results. The secondary data need for the study when
selecting the research variables and the sample for the survey. In the process of
selecting the research variables, the published documents such as research articles,
journals of marketing, annual reports, Internet, newsletters of local and foreign
companies, various brochures on the products offered by toothpaste manufactures
were utilized.

43
3.4.3 Sampling design
Cooper & Schindler (2003) have identified many compelling reasons for sampling:
lower cost, greater accuracy of results, greater speed of data collection and
availability of population elements. Saunders et al (2003) stated that the major task in
sampling is to select the sample from the defined population which will ensure that
sample will represent the population and is unbiased as far as possible. The primary
target population for this research would be the tooth paste users in Sri Lankan fast
moving consumer goods (FMCG) sector. Based on research available it was decide
to carry out the survey in main supermarkets in Colombo. Reason for selecting
Colombo district is highest consumption of toothpaste in 2013 recorded in this
district. Due to various constraints sample size was limited to 200 and sampling
design was purposive random sampling.
3.4.4 Data collection instrument
The main tool of the study is self-administrative questionnaire which was designed in
order to check several aspects. The design of the questionnaire was based on benefits
of consumer seek from the toothpaste and key purchasing determinates of tooth paste
industry and brand equity. The questionnaire consisted of four parts. The first part
consisted of general information pertaining to the respondent's awareness. The
second part was based on to measure benefits of consumer seek from the purchase of
tooth paste. Part three consider the respondent‟s expectations and perceptions of key
purchasing determinants of toothpaste market. This part was important because it
measured the respondent's attitude, opinion, perception and knowledge about key
purchasing determents. Final part of the questionnaire included demographic
information. According to Malhotra and Satyabhusan (2010), this survey approach is
the most common method of primary data collection in marketing research and the
advantages are simple administration and data consistency. A sample of
questionnaire is shown in Annexure 1.

44
3.5 Statistical Methods
The statistical techniques used in this study are factor analysis and 2- way chi- square
table.
Factor Analysis (FA)
The concept of factor analysis is to identify the reasons for the correlation among
observed variables. That is, FA detects relationship between correlated variables by
examine variances and covariance of the system consist of several variables (Johnson
& Wichern, 2007). Further, Johnson and Wichern argued that its modern beginning
lie in early 1900‟s with Charles Spearmen‟s interest in human ability and his
development of the two factor theory. This leads to burgeoning of work on theories
and mathematical principals of factor analysis (Harman, 1976).
Factor analysis an intricate representation of the covariance structure of a set of data.
According to the Johnson and Wichern (2007), FA is considered as an extension of
principle component analysis (PCA). Therefore, FA can be described as a statistical
technique used for finding common factor that explains the correlation among the
observed variables. The main difference between PCA and FA was discussed by
Johnson and Wichern (2007). The main difference is in PCA, it is attempting to
explain the variability of system using fewer dimension of the orthogonal
components. In FA, it is attempting to identify few factors (latent factors) to explain
covariance of the original system using unobservable factors.
There are two methods of factor analysis: (i) Exploratory Factor Analysis (EFA) and
(II) Confirmatory Factor Analysis (CFA). EFA does not require any prior knowledge
of about number of factors. CFA is commonly used for testing the identified FA
model. In this study EFA is used. Main requirements for EFA are given below.
I. High correlation among variables indicate that the observations can be
grouped in to homogeneous group (cluster) and the partial correlations
controlling other variables should be small compared to the original variables.

45
II. The significance of the correlation matrix is testing by using Bartlett‟s test
spheracity. The null hypothesis, H0 : population correlation matrix, ∑ = Ip vs
H1 ≠ Ip
III. KMO statistics is a measure of sampling adequacy of variables and it
indicates the extent in which the new indicators belong together. The
following criteria can be applied for factor analysis.
KMO Indicator Recommendation
> 0.9 Highly recommended
> 0.8 Recommended
> 0.6 Reasonable to consider
< 0.6 Not recommended
The basic idea underlying factor analysis is that p observed random variables (X1,
X2, X3…..Xp) can be expressed, as linear function of m (< p) unobserved variable
(common factors). That is if X1, X2, X3…..Xp are the variables and F1, F2, F3….Fm
are the factors. Therefore, the factor analysis model can be written as:
X1 = λ11 F1 + λ12 F2 + …………+ λ1m Fm + ε1
X2 = λ21 F1 + λ22 F2 + …………+ λ2m Fm + ε2
…….
Xp = λp1 F1 + λp2 F2 + …………+ λpm Fm + εp
Where, λjk , j = 1, 2, 3…,p ; k = 1, 2, 3,….,m are the factor loadings, and εj , j =1, 2,
3…p are unique factors. There are number of assumptions associated with factor
models are:
(i) E(ε) = E(F) = E(X) = 0
(ii) E[εἑ ] = Ψ (diagonal)
(iii) E[Fἑ ] = 0 (a matrix of zeroes)
(iv) E[FF`] = Im (an identity matrix)

46
Number of factors to be retained
Several methods have been proposed for determining number of factor that should be
retained for factor analysis. The most common and popular method is dropping
factors whose eigenvalues are less than one since they produce less information.
However, in general it makes sure to that the selected factors account for about 70-
80% of the variance of the initial system.
Factor Rotation
Once the factor model has been extracted, it might be difficult to name the factors on
the basis of factor loadings. Most variables have high loadings on the most important
factors and small loadings on all other factors (Herman, 1976). Thus interpretation of
factors can be difficult. Solution from either principle component analysis or
maximum likelihood method can be rotated in order to simplify the interpretation of
factors (Hostae, 1985). Factor rotation redistributes variances among factors and
make it easier to interpret factors by investigating factor loadings (Herman, 1976).
There are number of orthogonal rotation methods such as Varimax, Quartimax,
Equamax and Orthomax. Among these rotation methods, according to the Habing
(2003), Varimax and Quartimax methods are the most popular orthogonal rotation
methods. Both Varimax and Quartimax methods maximize the sums of the squared
factor loadings, wherea Varimax focuses on the columns and quartimax focuses on
rows.
Chi-square test
Chi-square test serve both as a goodness of fit test, where the data are categorized
along one dimensions, and as a test for the more common contingency table, in
which categorization is across two or more dimensions. Chi- Square statistics is used
to investigate whether distributions of categorical variables differ from one another.

47
CHAPTER 4
DATA ANALYSIS AND DISCUSSION
4.1 Introduction.
This chapter describes the statistical analysis of the collected data and interpretation
of the results with regarding benefits of consumer seeks from toothpaste and key
purchasing determinant and their impact on brand equity of the toothpaste market in
Sri Lanka. In order to create a clear understanding of data analyses some graphical
representation and tabular form are used.
4.2 Response Rate
To collect quantitative data for this research surveyor method was applied in key
super markets in Colombo district. The sampling unit was a customer in a super
market. Of two hundred customers only 183 (93%) were responded. Among this 183,
12 (6%) respondents were rejected due to incomplete information. Therefore,
information of 171 was included for data analysis. Thus the effective response rate is
considered as 85.5%.
4.3 Analysis of Demographic Variables
As the sample consist of different demographical categories, different job categories,
different age & education levels etc, initial analyses was carried out to find the
distribution of demographic variables.
4.3.1 Distribution of gender
Frequency distribution was taken to get classification for gender percentage of
sample profile. Figure 4.1 are included the details related to percentage of males and
females in the sample.

48
Figure 4.1: Male vs. female percentage of respondents
Figure 4.1 indicates that the majority of the respondents were females (77%). This
shows that when considering the demographic profile high percentage of females
purchased fast moving consumer goods (FMCG) like toothpaste in their daily routing
habits. Although the number of females is more, an impartial feedback can be
gathered from both perspectives.
4.3.2 Distribution of marital status
Frequency distribution information for marital status of sample profile is shown in
Table 4.1.
Table 4.1: Marital status of respondents
Marital status Frequency Percentage (%)
Married 117 68
Unmarried 54 32
Total 171 100
According to results in Table 4.1 it is clear that 32% of the respondents are single
and 68% of the respondents are married.
23%
77%
Gender Precentage
Male
Female
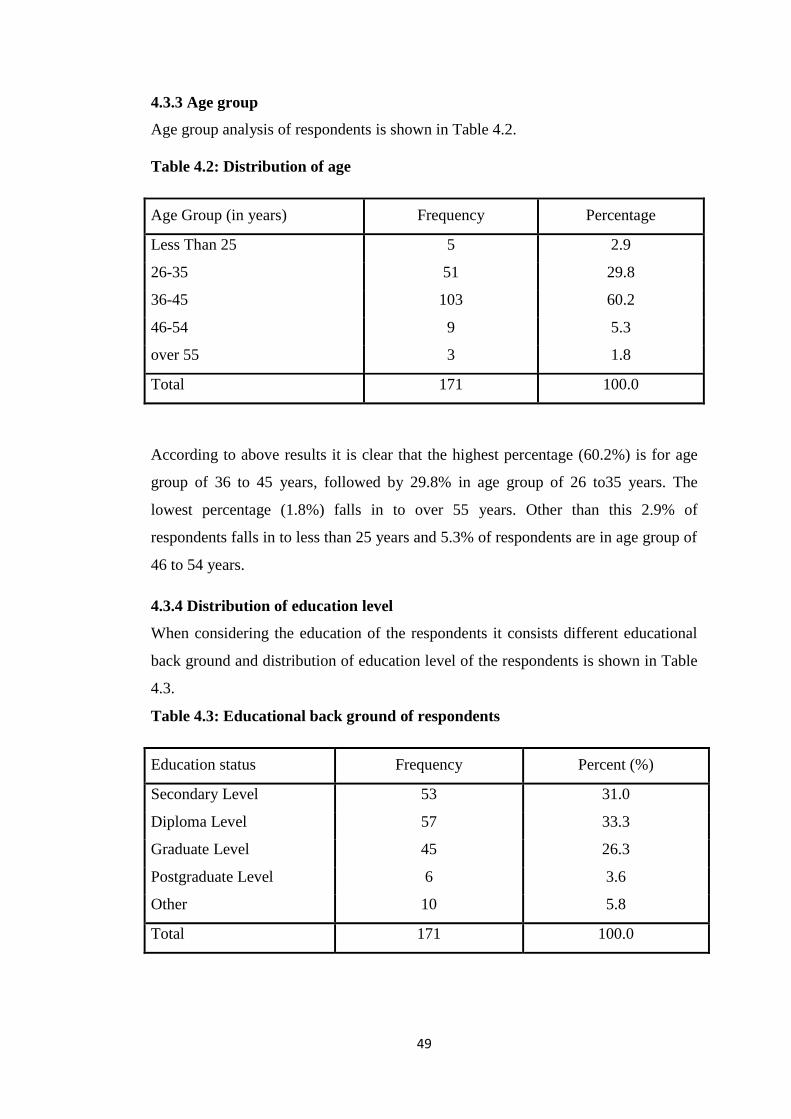
49
4.3.3 Age group
Age group analysis of respondents is shown in Table 4.2.
Table 4.2: Distribution of age
Age Group (in years) Frequency Percentage
Less Than 25 5 2.9
26-35 51 29.8
36-45 103 60.2
46-54 9 5.3
over 55 3 1.8
Total 171 100.0
According to above results it is clear that the highest percentage (60.2%) is for age
group of 36 to 45 years, followed by 29.8% in age group of 26 to35 years. The
lowest percentage (1.8%) falls in to over 55 years. Other than this 2.9% of
respondents falls in to less than 25 years and 5.3% of respondents are in age group of
46 to 54 years.
4.3.4 Distribution of education level
When considering the education of the respondents it consists different educational
back ground and distribution of education level of the respondents is shown in Table
4.3.
Table 4.3: Educational back ground of respondents
Education status Frequency Percent (%)
Secondary Level 53 31.0
Diploma Level 57 33.3
Graduate Level 45 26.3
Postgraduate Level 6 3.6
Other 10 5.8
Total 171 100.0

50
Based on the results in Table 4.3 it is clear that the education level of the respondents
is high. Highest percentage of 33.3% is for diploma level and second highest
percentage of 31% is for secondary educational level. Degree level percentage is
26.3% and master degree holders percentage is 3.5%.
4.3.5 Distribution of monthly income level
Sample profile is consisted with different monthly income levels. Frequency
distribution information for income level of sample profile is shown in Table 4.4.
Table 4.4: Monthly income level of respondents
Monthly Income Frequency Percentage (%)
less than 7,500 3 1.8
7,500 to 14,999 6 3.5
25,000 to 40,000 51 29.8
More than 40,000 111 64.9
Total 171 100.0
According to Table 4.4, out of 171 respondents 111 (64.9%) respondents have
monthly income greater than Rs. 40,000. Percentage between Rs.25000 to Rs.40,
000 is 29.8% of the population. This shows that the income level of the respondents
were fairly good.
4.3.6 Distribution of employment
Sample profile consists with different category of employee. They are categorized in
to unemployed, executives, senior management and others. Their frequency
distribution of those groups are given in Table 4.5.
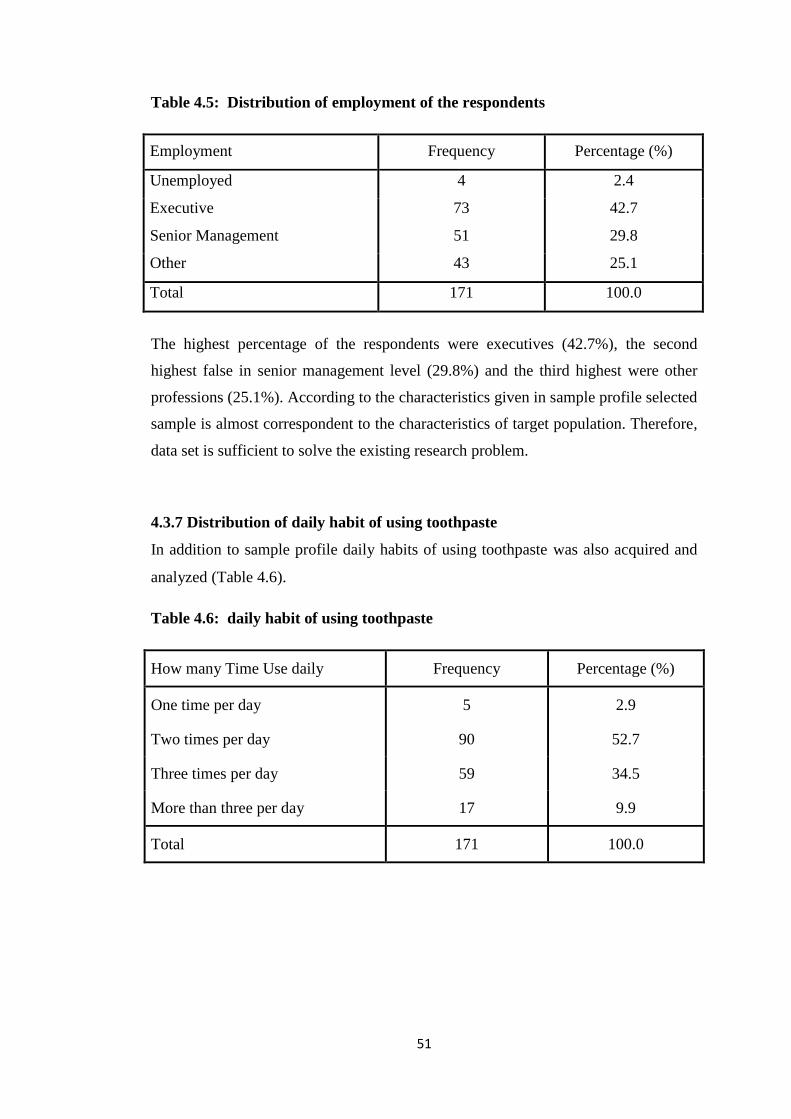
51
Table 4.5: Distribution of employment of the respondents
Employment Frequency Percentage (%)
Unemployed 4 2.4
Executive 73 42.7
Senior Management 51 29.8
Other 43 25.1
Total 171 100.0
The highest percentage of the respondents were executives (42.7%), the second
highest false in senior management level (29.8%) and the third highest were other
professions (25.1%). According to the characteristics given in sample profile selected
sample is almost correspondent to the characteristics of target population. Therefore,
data set is sufficient to solve the existing research problem.
4.3.7 Distribution of daily habit of using toothpaste
In addition to sample profile daily habits of using toothpaste was also acquired and
analyzed (Table 4.6).
Table 4.6: daily habit of using toothpaste
How many Time Use daily Frequency Percentage (%)
One time per day 5 2.9
Two times per day 90 52.7
Three times per day 59 34.5
More than three per day 17 9.9
Total 171 100.0

52
According to the results in Table 4.6, it is clear that highest percentage (52.6%) used
toothpaste two times per day. Another 34.5% is used toothpaste three times a day and
9.9% used more than three times a day. Least percentage (2.9%) used tooth paste one
time per day.
4.4 Association among Attributes
In order to find the association between pairs of each attributes correlation analysis
was carried out (Table 4.7).
Table 4.7: Correlation matrix among attributes of toothpaste
Prevent
cavity
Shiny
teeth
Strengthen
of
gum
Freshness Strengthen
of enamel
Attractive
teeth
Company
image
Shiny
teeth
-0.160
(0.035)
1
Strengthen
of
gum
0.915
(0.000)
-0.295
(0.000)
1
Freshness -0.155
(0.042)
0.705
(0.000)
-0.299
(0.000)
1
Strengthen
of enamel
-0.863
(0.000)
0.015
(0.843)
-0.787
(0.000)
-0.120
(0.119)
1
Attractive
teeth
-0.171
(0.026)
0.720
(0.000)
-0.235
(0.002)
0.763
(0.000)
-0.079
(0.304)
1
Company
image
0.053
(0.494)
0.127
(0.099)
0.002
(0.981)
0.201
(0.008)
-0.139
(0.071)
0.118
(0.124)
1
Price 0.047
(0.545)
0.117
(0.129)
0.005
(0.948)
0.175
(0.022)
-0.119
(0.121)
0.104
(0.174)
0.971
(0.000)
(Parenthesis indicates the p- value of the significance of the correlations)
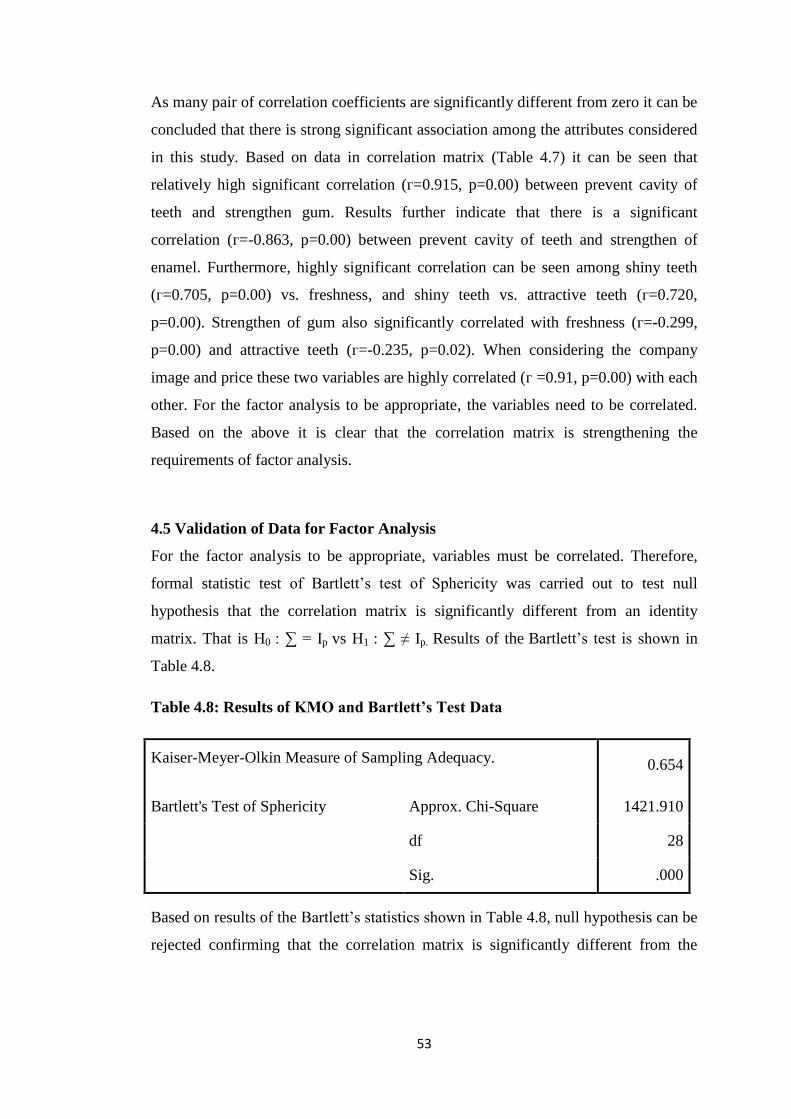
53
As many pair of correlation coefficients are significantly different from zero it can be
concluded that there is strong significant association among the attributes considered
in this study. Based on data in correlation matrix (Table 4.7) it can be seen that
relatively high significant correlation (г=0.915, p=0.00) between prevent cavity of
teeth and strengthen gum. Results further indicate that there is a significant
correlation (г=-0.863, p=0.00) between prevent cavity of teeth and strengthen of
enamel. Furthermore, highly significant correlation can be seen among shiny teeth
(г=0.705, p=0.00) vs. freshness, and shiny teeth vs. attractive teeth (г=0.720,
p=0.00). Strengthen of gum also significantly correlated with freshness (г=-0.299,
p=0.00) and attractive teeth (г=-0.235, p=0.02). When considering the company
image and price these two variables are highly correlated (г =0.91, p=0.00) with each
other. For the factor analysis to be appropriate, the variables need to be correlated.
Based on the above it is clear that the correlation matrix is strengthening the
requirements of factor analysis.
4.5 Validation of Data for Factor Analysis
For the factor analysis to be appropriate, variables must be correlated. Therefore,
formal statistic test of Bartlett‟s test of Sphericity was carried out to test null
hypothesis that the correlation matrix is significantly different from an identity
matrix. That is H0 : ∑ = Ip vs H1 : ∑ ≠ Ip. Results of the Bartlett‟s test is shown in
Table 4.8.
Table 4.8: Results of KMO and Bartlett’s Test Data
Kaiser-Meyer-Olkin Measure of Sampling Adequacy. 0.654
Bartlett's Test of Sphericity Approx. Chi-Square 1421.910
df 28
Sig. .000
Based on results of the Bartlett‟s statistics shown in Table 4.8, null hypothesis can be
rejected confirming that the correlation matrix is significantly different from the

54
identity matrix. The observed KMO (0.654) statistics is larger than the recommended
critical value of KMO (0.6).It is confirmed that data set is suitable for factor analysis.
4.5.1 Identification of factors
In order to select the number of factors, principle component analysis was carried out
for the standardized data and results are shown in Table 4.9.
Table 4.9: Results of the eigenvalue analysis for the standardized data
Component
Details of the eigenvalues
Eigenvalues
% of Variance
explained
Cumulative % of
variance explained
1 3.0 37.8 37.8
2 2.5 31.2 69.1
3 1.7 21.3 90.4
4 0.3 4.1 94.4
5 0.3 3.1 97.5
6 0.1 1.4 98.9
7 0.06 0.8 99.7
8 0.02 0.4 100.0
The general rule to decide the number of factor is the component having eigenvalue
greater than one. This is the most widely used criterion to retain (Franzen, 1999)
factors. Based on this criteria and the results in Table 4.9 it can be identified three
components. The percentage of cumulative variance in Table 4.9 indicates that these
three components are capable to explain about 90.4 % of the total variability of the
initial system. The component 1 accounts for 37. 8% of the total variance. The
second component accounts for 31.2% and third component accounts for 21.3% of
the total variance. Thus, it can be confirmed that 8-D initial system can be reduced to
3-D system. Thus, only 3 factors can be considered for the factor analysis. The

55
factor score (factor loading) of the 3-factor model extracted using principle
component factor (PCF) method without rotation is shown in Table 4.10.
Table 4.10: Factor scores of the 3-factor model extracted via PCF method
Variable
Factor
1 2 3
Prevent cavity -.787 .530 -.223
Shiny teeth .666 .459 -.361
Strengthen of gum -.853 .412 -.176
Freshness .654 .550 -.331
Strengthen of enamel .590 -.696 .289
Attractive teeth .642 .506 -.411
Company Image .153 .639 .744
Price .146 .622 .759
It can be seen that the factor scores (Table 4.10) are not capable to isolate variables
within factors. Thus factors were rotated, using orthogonal rotations so that new
factors are still uncorrelated. Further, the rotation is used to avoid the each variable
loads mainly on one factor. Thus the variables can be considered to the relatively
pure measure of the selected factors. Factors extracted using principle component
factoring method were rotated using varimax rotation and the results are shown in
Table 4.11.

56
Table 4.11: Factor score of the 3- factor model extracted via PCF and rotated by
Varimax
Variable
Factor
1 2 3
Prevent cavity .967 -.117 .022
Shiny teeth -.102 .879 .049
Strengthen of gum .931 -.250 -.015
Freshness -.047 .907 .124
Strengthen of enamel -.943 -.140 -.086
Attractive teeth -.041 .913 .032
Company Image .043 .093 .987
Price .033 .073 .989
The factor score in the above Table 4.11 clearly indicate that there are three possible
meaningful factors, because it can isolate few variables within the factors. Factor one
has significantly high coefficient with variables of prevent cavity, strengthen gum
and strengthen of enamel compared with the scores corresponding to other variables.
At the same time factor two has high factor score values for variables of shiny teeth,
freshness and attractive teeth. Factor three also has very high scores for the variables
company image and price. Therefore, it is clear that three meaningful factors can be
identified based on the results of the above analysis. Other significant feature is no
common variable is loaded to any factor.
In order to test whether the identified factors are independent of the type of rotation,
the original factors were rotated using Quartimax and Equamax methods. The
corresponding factor scores are shown in Table 4.12 and Table 4.13 respectively.

57
Table 4.12: Factor score of the 3- factor model extracted via PCF and rotated by
Quartimax
Variable
Factor
1 2 3
Prevent cavity .967 -.119 .019
Shiny teeth -.100 .879 .039
Strengthen of gum .930 -.252 -.016
Freshness -.045 .908 .113
Strengthen of enamel -.943 -.139 -.081
Attractive teeth -.039 .914 .022
Company Image .048 .105 .986
Price .038 .084 .988
Table 4.13: Factor score of the 3- factor model extracted via PCF and rotated by
Equamax
Variable
Factor
1 2 3
Prevent cavity .967 -.116 .023
Shiny teeth -.103 .878 .054
Strengthen of gum .931 -.249 -.015
Freshness -.048 .906 .129
Strengthen of enamel -.942 -.140 -.089
Attractive teeth -.042 .913 .038
Company Image .041 .088 .988
Price .031 .067 .990
Comparing of results in Table 4.11, 4.12 and 4.13, it can be concluded that the
identified 3 factors are independent of the type of rotation. Summary of results are
shown in Table 4.14.

58
Table 4.14: Summary of the main results under three rotations
Rotation
Method
Variable captured by
Factor 1 Factor 2 Factor 1
Varimax Prevent cavity
Strengthen of gum
Strengthen of enamel
Shiny teeth
Freshness
Attractive teeth
Company image
Price
Quartimax Prevent cavity
Strengthen of gum
Strengthen of enamel
Shiny teeth
Freshness
Attractive teeth
Company image
Price
Equamax Prevent cavity
Strengthen of gum
Strengthen of enamel
Shiny teeth
Freshness
Attractive teeth
Company image
Price
Results in the table 4.14 clearly confirm that same variables have been identified for
each factor by all three rotations, confirming identified factors are invariant by the
type of orthogonal rotation.
4.5.2 Reconfirmation of 3 factors
As Varimax is the most common and popular rotation in factor analysis, the
communalities of the identified factors only under Varimax were considered (Table
4.15). The communality of a variable is the amount of variance on a variable
accounted for by the selected three factors.

59
Table 4.15: Communalities of the observed variables
Variable Communalities based on 3- factor model
Prevent cavity .950
Shiny teeth .785
Strengthen of gum .929
Freshness .840
Strengthen of enamel .916
Attractive teeth .837
Company Image .986
Price .985
Result in the Table 4.15 indicates that all communalities are close to one and thus, it
can be confirmed that 3-factor model is sufficient to explain the variance, covariance
maintain of the original system.
4.5.3 Naming factors
In order to define the three factors, factor score coefficient were obtained (Table
4.16)
Table 4.16: Factor score coefficient of the selected 3-factor model.
Variable Factor 1 Factor 2 Factor 3
Prevent cavity (X1) 0.36 0.01 -0.02
Shiny teeth (X2) 0.01 0.35 -0.04
Strengthen of gum (X3) 0.34 -0.05 -0.03
Freshness (X4) 0.03 0.36 -0.01
Strengthen of enamel (X5) -0.36 -0.11 0.01
Attractive teeth (X6) 0.04 0.37 -0.05
Company Image (X7) -0.02 -0.04 0.51
Price (X8) -0.02 -0.05 0.51

60
Based on the results in Table 4.16 three factors can be defined as below.
Factor 1 : Health conscious or health beneficiary factor
This factor 1 has high coefficient for variables of prevent of cavity, strengthen gum
and strengthen of enamel. Therefore tis factors can be named as health conscious or
health beneficiary factors that influence the purchase of toothpaste.
Factor 1 = 0.36Z1 +0.34Z3-0.36Z5.
Factor 2 : Social beneficiary factor
Factor 2 is highly correlated with variable shiny teeth, freshness and attractive teeth.
Thus factor two may be labeled as social beneficiary factor.
Factor 2 = 0.35Z2 +0.34Z4-0.36Z6.
Factor 3 : Specialized beneficiary factor
Factor 3 is highly correlated with variable company image and price of toothpaste.
Therefore this factor can be named as a specialized beneficiary factor that impact the
purchase of toothpaste
Factor 3 = 0.51Z7 +0.51Z8.
Where Zi is the corresponding standardized value of Xi
4.6 Association among variables and variables identified for KPD
In order to study the association among the variables on brand equity and variables
identified for KPD s, 2-way cross tables and Chi – Square test were carried out for
each pair separately. Results are shown below.
4.6.1 Association between prevent cavity and brand equity of toothpaste
The results of the Chi-Square test to test null hypothesis, H0: There is no relationship
between preventing cavity and brand equity of tooth paste, is shown in Table 4.7

61
Table 4.17: Results of prevent cavity vs brand equity cross tabulation
Brand Equity
Total No Yes
Prevent cavity
Disagreed
31 0 31
100.0% 0.0% 100.0%
Agreed
0 69 69
0.0% 100.0% 100.0%
Highly agreed
23 48 71
32.4% 67.6% 100.0%
Total 54 117 171
31.6% 68.4% 100.0%
Likelihood Ratio Test X2
= 123.8 (p = 0.000)
According to results in Table 4.17, there is very strong evidence of a significance
association between brand equity and prevent cavity of tooth paste products
(X2=123.8, p= 0.000). The percentage of customers claimed that the importance of
enhance the brand equity is 68.4%, irrespective of the response the prevent cavity. It
is interested to note that 100% of those who disagreed for prevent cavity don‟t like
brand equity. Further it can be seen that the percentage of customers like brand
equity among those who agreed prevent cavity is 100%.The corresponding
percentage among highly agreed is 67.6%. These results clearly indicate the
importance of brand equity especially among those who at least agree for prevent
cavity.
4.6.2 Association between shiny teeth and brand equity of toothpaste
The results of chi-square test to test the null hypothesis, H0: There is no association
between shiny teeth and brand equity of tooth paste is shown in Table 4.18.

62
Table 4.18: Results of shiny teeth and brand equity cross tabulation
Brand Equity
Total No Yes
Shiny Teeth
Disagreed
23 0 23
100.0% 0.0% 100.0%
Agreed
0 77 77
0.0% 100.0% 100.0%
Highly Agreed
31 40 71
43.7% 56.3% 100.0%
Total 54 117 171
31.6% 68.4% 100.0%
Likelihood Ratio Test X2
= 116.0 (p = 0.000)
Based on data in Table 4.18 it can be concluded that there is a significant association
between shiny teeth attributes of toothpaste and brand equity (X2=116.0, p= 0.000).
According to the results given in Table 4.18, percentage of customers claimed that
the importance of enhance the brand among those who agreed for shiny teeth is
100% and the corresponding percentage among that who highly agreed is 56.3%.
This results again confirm the importance of brand equity especially among those at
least agree for shiny teeth.
4.6.3 Association between strength gum and brand equity of toothpaste
The results of chi-square test to the null hypothesis, H0: There is no association
between strengthen of gum and brand equity of tooth paste is shown in Table 4.19.

63
Table 4.19: Cross tabulation results of strengthen of gum and brand equity
Brand Equity
Total No Yes
Strengthen of Gum
Highly Disagreed
16 0 16
100.0% .0% 100.0%
Disagreed
38 15 53
71.7% 28.3% 100.0%
Agreed
0 16 16
0.0% 100.0% 100.0%
Highly Agreed
0 86 86
0.0% 100.0% 100.0%
Total 54 117 171
31.6% 68.4% 100.0%
Likelihood Ratio Test X2
= 150.1 (p = 0.000)
Null hypothesis can be rejected based on the results in Table 4.19 (X2=150.1, p=
0.000). Furthermore, it can be seen that who agreed for strengthen gum is 100% and
highly agreed percentage also 100%. Based on these results it is confirmed that
strengthen gum claim the importance of brand equity.
4.6.4 Relationship between freshness of breath and brand equity of toothpaste
The results of the chi-square test to test the null hypothesis, H0: There is no
relationship between freshness of breath and brand equity of tooth paste is shown in
Table 4.20.

64
Table 4.20: Cross tabulation results of freshness of breath and brand equity
Brand Equity
Total No Yes
Freshness
Highly Disagreed
14 0 14
100.0% .0% 100.0%
Disagreed
38 15 53
71.7% 28.3% 100.0%
Agreed
0 39 39
.0% 100.0% 100.0%
Highly Agreed
2 63 65
3.1% 96.9% 100.0%
Total 54 117 171
31.6% 68.4% 100.0%
Likelihood Ratio Test X2
= 132.3 (p = 0.000)
According to data in above Table 4.20, there is sufficient evidence (X2 =132.3, p=
0.000) to state that there is a significant relationship between freshness and brand
equity of tooth paste. Based on the results given in Table 4.20, percentage of
customers claimed that the importance of enhance the brand among those who
agreed for freshness is 100% and the corresponding percentage among that who
highly agreed is 96.9%. This results again confirm the importance of brand equity
especially among those at least agree for freshness.

65
4.6.5 Association between strengthen of enamel and brand equity of toothpaste
The results of chi square test to test the null hypothesis, H0: There is no relationship
between strengthen of enamel brand equity of tooth paste is shown in Table 4.21.
Table 4.21: Cross tabulation results of strengthen of enamel and brand equity
Brand Equity
Total No Yes
Strengthen of enamel
Highly Disagreed
0 31 31
.0% 100.0% 100.0%
Disagreed
23 40 63
36.5% 63.5% 100.0%
Agreed
16 0 16
100.0% 0.0% 100.0%
Highly Agreed
15 46 61
24.6% 75.4% 100.0%
Total 54 117 171
31.6% 68.4% 100.0%
Likelihood Ratio Test X2
= 62.5 (p = 0.000)
Based on results in Table 4.21, null hypothesis can be rejected (X2 =62.5, p= 0.000)
and there is sufficient evidence to state that there is a relationship between strengthen
of enamel and brand equity of tooth paste. Furthermore, according to the results in
table 4.21 those who highly disagreed for prevention of decay is 100% and the
corresponding percentage among who disagreed is 65.5%. This results emphasize the
importance of brand equity and decays of teeth.

66
4.6.6 Association between attractive teeth and brand equity of toothpaste
The results of chi-square test to the null hypothesis, H0: There is no relationship
between attractive teeth and brand equity of tooth paste is shown in Table 4.22.
Table 4.22: Cross tabulation results of attractive teeth and brand equity
Brand Equity
Total No Yes
Attractive teeth Disagreed
23 0 23
100.0% 0.0% 100.0%
Agreed
8 85 93
8.6% 91.4% 100.0%
Highly Agreed
23 32 55
41.8% 58.2% 100.0%
Total 54 117 171
31.6% 68.4% 100.0%
Likelihood Ratio Test X2
= 83.9 (p = 0.000)
Based on results in Table 4.22 it can be concluded that there is a significant
association between attractive teeth attributes of toothpaste and brand equity
(X2=83.9, p= 0.000). According to the results given in Table 4.22, percentage of
customers claimed that the importance of enhance the brand among those who
agreed for attractive teeth is 91.4% and the corresponding percentage among that
who highly agreed is 58.2%. This results further confirm the importance of brand
equity especially among those at least agree for attractive teeth.
4.6.7 Relationship between company image and brand equity of toothpaste
The results of chi- square test to test the null hypothesis, H0: There is no relationship
between company image and brand equity of tooth paste is shown in Table 4.23.
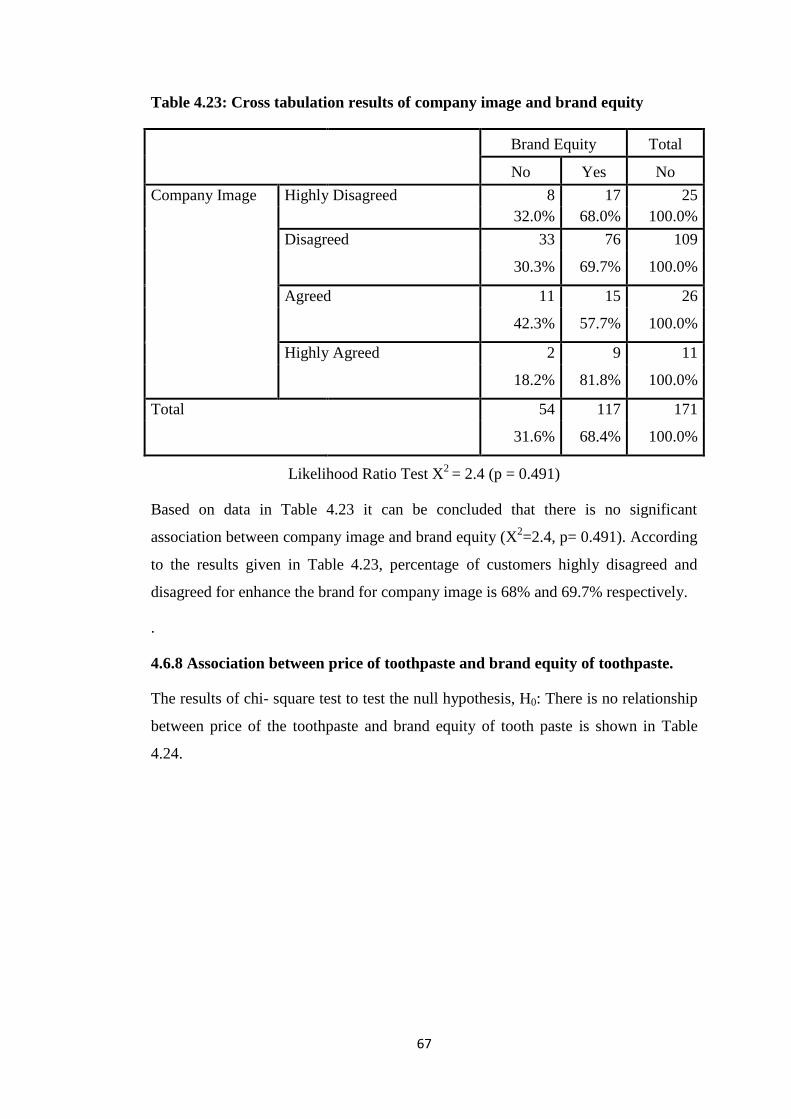
67
Table 4.23: Cross tabulation results of company image and brand equity
Brand Equity Total
No Yes No
Company Image Highly Disagreed
8 17 25
32.0% 68.0% 100.0%
Disagreed
33 76 109
30.3% 69.7% 100.0%
Agreed
11 15 26
42.3% 57.7% 100.0%
Highly Agreed
2 9 11
18.2% 81.8% 100.0%
Total 54 117 171
31.6% 68.4% 100.0%
Likelihood Ratio Test X2
= 2.4 (p = 0.491)
Based on data in Table 4.23 it can be concluded that there is no significant
association between company image and brand equity (X2=2.4, p= 0.491). According
to the results given in Table 4.23, percentage of customers highly disagreed and
disagreed for enhance the brand for company image is 68% and 69.7% respectively.
.
4.6.8 Association between price of toothpaste and brand equity of toothpaste.
The results of chi- square test to test the null hypothesis, H0: There is no relationship
between price of the toothpaste and brand equity of tooth paste is shown in Table
4.24.

68
Table 4.24: Cross tabulation results of price of toothpaste and brand equity
Brand Equity Total
No Yes No
Price Highly Disagreed
4 5 9
44.4% 55.6% 100.0%
Disagreed
9 32 41
22.0% 78.0% 100.0%
Agreed
35 57 92
38.0% 62.0% 100.0%
Highly Agreed
6 23 29
20.7% 79.3% 100.0%
Total
54 117 171
31.6% 68.4% 100.0%
Likelihood Ratio Test X2
= 5.9 (p = 0.113)
Based on results in Table 4.24 it can be concluded that there is no significant
association between price of the toothpaste and brand equity (X2
=5.973, p= 0.113).
Furthermore, results given in Table 4.24 clearly shows that percentage of customers
claimed that the importance of enhance the brand among those who highly disagreed
and disagreed for price of the toothpaste is 55.6% and 78.0% respectively.

69
According to above analysis below Table 4.25 includes summary of significance and
non-significance variables
Table 4.25: Summary table of significance.
Variable State of Significance
Prevent Cavity Significant
Shiny Teeth Significant
Strength of Gum Significant
Freshness Significant
Strengthen of enamel Significant
Attractive Teeth Significant
Image of Company Not significant
Price Not significant
Based on above analysis (Table 4.25) it is identified that KPD of toothpaste like
prevent cavity, shiny teeth, strengthen gum, freshness, strengthen of enamel and
attractive teeth influence the brand equity of products. Further, this study mainly
emphasizes that image of company and price is not significantly influence the brand
equity.
4.7 Chapter Summary
It was found that three factors namely: (i) Health conscious or health beneficiary
factor, (ii) Social beneficiary factor and (iii) Specialized beneficiary factor are
sufficient to explain the variability of the eight variable namely prevent cavity, shiny
teeth, strengthen of gum, freshness, strengthen of enamel, attractive teeth, company
Image and price. Furthermore, it was found that only the six variables: prevent
cavity, shiny teeth, strengthen of gum, freshness, strengthen of enamel and attractive
teeth significant with brand equity of toothpaste. The two variables such as company
image and price do not significantly associate with brand equity.

70
CHAPTER 5
CONCLUTIONS AND RECOMENDATIONS
5.1 Introduction.
As main objective of this research is to determine the benefits of consumers seek
from toothpaste and impact of key purchasing determinants on brand equity of the
toothpaste market in Sri Lanka. This chapter comprehends the research findings and
recommendations based on the analysis of the results. Furthermore, some
suggestions are highlighted for the benefits of the toothpaste industry.
5.2 Conclusions.
The analyses of the correlation matrix confirmed that there are relatively high
significant correlations among prevents of cavity, strong gum and strengthen of
enamel. It was also identified that there are highly significant correlations between
shiny teeth, fresh breath and attractive teeth and company image and price of the
toothpaste. The results of factor analysis carried out for the eight variables namely:
prevent cavity, shiny teeth, strengthen of gum, freshness, prevention of decay,
attractive teeth, company image and price found that three factors namely: health
conscious or health beneficiary factor, social beneficiary factor and specialized
beneficiary factor are sufficient to explain the variability of those eight variables.
Factor 1 has highly correlated with for variables of prevent of cavity, strong gum and
strengthen of enamel. Therefore, these three factors can be named as health
conscious or health beneficiary factors that influence the purchase of toothpaste.
Factor 2 is highly correlated with variable shiny teeth, fresh breath and attractive
teeth. Those attributes are more related to social benefits of the society. Thus factor
two may be labeled as social beneficiary factor. Factor 3 is highly correlated with
variable company image and price of toothpaste. Those two attributes are more
related to niche market product or specialized product in marketing environment.
Thus factor three may be labeled as specialized beneficiary factor. Therefore, it can
be concluded that to determine benefits of consumers seek from the purchase of tooth
paste can be reduced for three factors namely factor (i) health beneficiary factors
then factor (ii) social beneficiary factors and (iii) specialized beneficiary factor.

71
When consider the association among variables to identify relationships between
KPD and brand equity of toothpaste following relationships were identified. KPD s
are significantly association with prevent cavity, shiny teeth, strengthen of gum,
freshness of breath, prevention of decay and attractive teeth. It also can be concluded
that price of the tooth paste and image of the company are not significantly
association with KPD. Further, identified factors and relationship between KPD and
brand equity can be applied for positive sales growth and profit maximization. The
findings of the study would help the manufacturing sector of the toothpaste to make a
great contribution to the economic well-being.
5.3 Recommendations.
The research findings of the present study have important implication especially for
the decision makers of new product development and advertisements campaign
development of toothpaste industry. Toothpaste has come a long way since the late
1800s when developers sold tasteless toothpaste in a jar. Tubes of toothpastes are
formulated to meet our every dental need and come in many flavors. Therefore,
research findings will assist to product development, marketing, sales and cost
effective new product launch in toothpaste industry and consequently identified
factors and relationship between KPD and brand equity can be applied for positive
sales growth and profit maximization.
Outcome of this research assist to different fields in today‟s business environment.
Findings help to brand managers, advertising agents, new package developments and
new product developments. This also benefit to researchers to continue research
related to toothpaste market. Furthermore, oral hygiene factors related to human
being will benefit to health ministry promotional activities of oral hygiene.
5.4 Suggestions.
This research provides an initial work for further research and industrial application
paying attention on the benefits of consumers seeks from toothpaste and impact of
72
key purchasing determinants on its brand equity. Hence the followings suggestions
are made.
When introducing new products to toothpaste market it needs to be more
focus on oral hygiene.
To obtain maximum benefits of advertisement, necessary to more focus on
oral hygiene habits of people.
When developing advertisement or new products it better to concentrate of
market segmentation for social beneficiary customers and specialized
beneficiary customers.
The identified KPD s of toothpaste market in Sri Lanka are attribute of
prevent cavity, shiny teeth, strengthen of gum, freshness of breath and
attractive teeth and thus any marketing campaign or sales promotions need to
be more focus on those KPD of toothpaste products to improve their
profitable sales growth.

73
REFERENCE LIST
Aaker, D.A., 1991.Managing Brand Equity. California Marketing Management
Review. Vol 31. : 47 -56.
Aaker, D. A., 1996. Measuring Brand Equity across Products and Markets. Journal
of Marketing: Vol. 80: 102-120.
Aaker, D. A., & Joachimsthaler, E., 2000. The financial information content of
perceived quality. Journal of Marketing Research, Vol.2: 191-201.
Aaker, D., 2003. The power of the branded differentiator. MIT Sloan Management
Review. Vol. 45: 83-7.
Agrawal, M.K., & Rao, V.R. ,1996. An empirical comparison of consumer based
measures of brand equity. Journal of Marketing. Vol. 7: 237-247.
Ameer, A., 2013. Herbal Toothpaste eat into multinational market, Financial Times,
July 8, 2013.
Anderson, E.W., Fornell, C., and Mazvancheryl, S.K., 2004, Customer Satisfaction
and Shareholder Value, Journal of Marketing, Vol. 68: 172–185.
Bader, J.D., Shugars, D.A. & Bonito, A.J., 2009. A systematic review of selected
caries prevention and management methods. Community Dentistry Oral
Epidemiology. Vol 29 : 399–411.
Bailey, R., & Ball, S., 2006. An exploration of the meanings of brand equity. The
service industry journal. Vol. 26:15-35.
Barwise, P., Higson, C., Likierman, A., & Marsh, P., 1990. Brand as seperable
assets. Business Strategy Review. Vol. 2: 43:59.
Berry, L.L., 2000. Cultivating service brand equity. Journal of the Academic of
Marketing Science. Vol.28:128-137.
74
Berry, L. L., 2004. The Theory of the Business. Harvard Business Review Vol. 72:
95-104
Bhasin, H., 2006. Personal factors affecting consumer buying behavior. The Journal
of American Academy of Business, Vol. 16: 34 -40.
Biel, A.L. 1993. Converting image into equity. Brand equity and advertising.
Intrnational Journal of marketing. Vol.7 :67-88.
Blackstone, M., 1995. The qualitative dimensions of brand equity. Journal of
Advertising Research. Vol. 35: 2-7.
Blomback, A., & Axelsson, B., 2007. The role of corporate brand image in the
selection of new subcontractors. Journal of Bossiness & Industrial Marketing. Vol.
22:418-430.
Blumenthal,W., Dannielle,S., & Bergstrom,T., Alan J., 2003. Brand councils that
care: Towards the convergence of branding and corporate social responsibility.
Journal of Brand Management. Vol.10: 327-342.
Bolmback,A., & Axelsson,B.,2007. The role of corporate brand image in the dection
of new subcontractor. Journal of Business and Industrial Marketing. Vol . 22:428-
430.
Bullmore, J., 1984. The brand and its image- revisited. International Journal of
Advertising. Vol. 3: 235-238.
Burk, D., James.S., 1996. Satisfied customers by focusing Brand. Scientific
American. Vol. 27: 116-119.
Chalmers, J.M., 2005. Behavior management and communication strategies for
dental professionals when caring for patients with dementia. American Journal of
Dentistry. Vol .20 : 147–154.

75
Charlene, L. and Josh, B., 2006. Defining, Measuring, and Managing Brand Equity:
Journal of Marketing. Vol.31: 12-18.
Cobb-Walgren, C. J., Rubel, C.A., & Dinthu,N., 1995. Brand equity, brand prference
and purchase intent. Journal of Advertising. Vol.24:25-40.
Dobson, S., 2009. Consumers seeking 'citizen brands'. Journal of Marketing. Vol.
108: 2-4.
Cobb,W., C.J., Beal, C. and Donthu, N., 1995. Brand equity, brand preferences, and
purchase intent. Journal of Advertising, Vol. 24: 25-40.
Costabile, M., 2000. How loyalty toward a particular brand or product is cultivated in
consumers. Journal of Managerial Issues, Vol. 9:275-304.
Chaudhuri, A., & Holbrook, M. B., 2001. The Chain of Effects from Brand Trust and
Brand Effect to Brand Performance: The Role of Brand Loyalty, Journal of
Marketing.Vol. 65 : 81-93.
Chow, S., & Holden, R., 2005. Toward an Understanding of Loyalty: The
Moderating Role of Trust. Journal of Managerial Issues. Vol. 9: 275-304.
Cooper, D., & Schindler, P. ,2003. Business Research Methods. New Delhi :Hill
Publishing company Limited.
Davies, R. M. & Jhon, G. M. , 2008. High fluoride toothpastes: their potential role in
a caries prevention programme. Journal of Dental Research,Vol. 35: 320-323.
Dona, A., 2013. Branding Definitions-Heidi Cohen: Actionable marketing Guide
http://heidicohen.com/30-branding-definitions/ (Accessed May 11, 2014).
Douglas, B., 2004. How Brands Become Icons: The Principles of Cultural Branding.
Journal of Marketing. Vol. 9: 34-39.

76
Dreinzen, S., Brown, L. R., Daly, T. E. & Drane, J. B. ,2005. Prevention of cavity
related dental caries in irradiated cancer patients. Journal of Dental Research,
Vol.56: 99-104.
Ellis, A. G. ,1999. Geriatric dentistry in long-term-care facilities: Current status and
future implications. Special Care in Dentistry.Vol. 19: 139-142.
Engel,S., Blackwell,G.W and Kollat,T., 1998. Consumer Behavior .The Journal of
American Academy of Business, Vol. 16: 34 -40.
Eshghi, A., Haughton, D., and Topi, H., 2007. Determinants of customer loyalty in
the skin care products. Vol. 31: 93-106.
Farquhar, H., Peter, W., 1995. Strategic Challenges for Branding. Journal of
Marketing Management. Vol.3: 8-15.
Francisco, S., 2010. Brand-building in the 2005 s. Journal of Consumer Marketing.
Vol. 8: 43-52.
Franzen, G., 1999. Brand equity: How advertising effectiveness influence brand
equity. Henly –on – Thames: Admap Publication: 98-117.
Gini, P.A., 2010. Oral health status and treatment needs of Canadian adults. Special
Care in Dentistry. Vol.18 : 164–169.
Griffin , S.O., Regnier, E., Griffin, P.M., Huntley, V.,2007. Effectiveness of fluoride
in preventing caries in adults. American Journal of Dentistry. Vol 86: 410−415.
Heinjnbrok, M., & Vander, W.G.A., 2007. Flooride intervention for toothpaste
market. . Journal of Marketing, Vol.5: 146-152.
Hofested, A., Hoof, J.V., Walenberg, N., & Jong, M. ,2007. Projective techniques for
brand image research. Qualitative Market Research. Vol.10: 300-308.

77
Hong, B.K., and Woo,G.K., 2007. The relationship between brand equity and firms
Image. International Journal of Marketing Management, Vol. 26: 37-47.
Hooker,S., 2010. Importance of Brand Equity to growth of company sales volume
and profit. http://hookeruk.com/wordpress/importance-of-brand-equity.html.
(Accessed April 22, 2014).
Hendon, D.W., & Williams, E.L.,2002. Winning the battle for your customer.
Journal of Consumer Marketing. Vol. 2:65-75.
Habing, T.K., 2003. Measuring and managing customer based brand equity. Journal
of Marketing. Vol 57:1-22.
Harman, A.E., 1976. Focusing on Factor Analysis. The Journal of Product and Brand
Management. Vol.5: 48-61.
Holbrook, M.B. & Corfman, K.P, 1985. Quality and value in the consumption
experience : Journal of product and brand management, Vol. 17: 6-18.
Hostae, G.M., 1985. Quality Control in a Service Business. Harvard Business
Review. Vol. 53: 98-106.
Hunt, D., and Burnett, J. J., 1982. The Macro marketing/Micro marketing
Dichotomy: A Taxonomical Model. Journal of Marketing, Vol. 46: 45-57.
Jensen, D.A., & Kohout,G.,1988. The effect of a fluoridated dentifrice on root and
coronal caries in an older adult population. The Journal of Dental Association ,
Vol.6: 148-154.
Joe, P., 2012. The History of Content Marketing – How Brands Have Become
Important. http://contentmarketinginstitute.com/2012/02/history-content-marketing-
storytelling/ (Accessed May 5, 2014).
Joes, W., 2008. Towards an identity – based brand equity model. Journal of product
and brand management, Vol. 17: 4-12.

78
Johonson, R. and Bruwer , J.,2007. Regional Brand Image and Perceived Quality:
The consumer perspective . Journal of Marketing and Management. Vol. 14: 143-
155.
Jhoson, D.,Wichern,S.,(2007). An assessment of relationship between service quality
and customer satisfaction, Journal of Marketing, Vol.3 62-66.
Joseph, A., 1975. "Shift from Brand to Product Line Marketing. Harvard Business
Review. Vol. 53: 56-64.
Kamakura, W. A., and Russel, G. J,. 2003. Measuring Brand Value with Scanner
Data. International Journal of Research in Marketing. Vol. 10: 9-22.
Keller, K. L., 1993. Conceptualizing, measuring and managing customer based brand
equity. Journal of Marketing. Vol 57:1-22.
Keller, K.L., 1999. Managing brands for the long run: brand reinforcement and
revitalization strategies. California Management Review, Vol. 41: 102-4.
Keller, K.L. 2005. Choosing the right brand elements and leveraging secondary
associations will help marketers build brand equity. Marketing Management.Vol. 14:
19-23.
Kotler, P., Keller, K.L., 2008. Marketing Management. Therteen Ed, New Delhi,
Vol.7: 45 -55.
Kerpan, K.A, 2007 . Building brand commitment: a behavioral approach to internal
brand management. Journal of Brand Management. Vol.12:279–300.
Kim, W.G., Jin-Sun,B., & Kim, H.J.,2008. Multidimentional Custome- Based brand
equity and its cosequences in midpriced hotels. Journal of Hospitality & Tourism
Research. Vol. 32:235-254.

79
Kirmani, A., and Wright, P., 1989. Money Talks: Perceived Advertising
Expenditures and Expected Product Quality. Journal of Consumer Research, Vol.5:
344-353.
Kotler, P., 2000. Marketing Management. The Millennium Edition, Upper Saddle
River, Prentice Hall. Vol.5: 45 -55.
Kotler, P., and Keller, K.L., 2008. Marketing Management. Therteen Ed, New
Delhi, Vol.7: 45 -55.
Laforet, S., & Saunders, J., 2004, Managing Brand Portfolios: How the Leaders Do
It, Journal of Advertising Research, Vol. 34: 64-88.
Lane,V., & Jacobson,R.,1995. Stock market reactions to brand extention
announcement : The effects of brand attitude and familiarity. Journal of Marketing.
Vol. 63 :63-77.
Laing, A., Lewis, B., Foxall, G. and Hogg, G., 2002. Predicting a diverse future:
directions and issues in the marketing of services. European Journal of Marketing.
Vol. 36 : 478-97.
Lassar,W., Mittal. B., & Sharma, A. ,1995. Measuring customer – based brand
equity. Journal of Consumer Marketing. Vol.12: 11-19.
Laxmi, G.V.,2006. Brand Equity and why it is important to Marketing environment.
http://goutham.wordpress.com/2006/12/11/brand-equity-and-why-its-important to
mar/ (Accessed April 22, 2014).
Leuthesser, L., & Jones, P., 1988. Defining, Measuring, and Managing Brand Equity:
A Conference Summary, Marketing Science Institute. Cambridge, Vol. 12: 88-104.
Mackay, M. M., 2001. Evaluation of Brand Equity Measures: Further Empirical
Results. The Journal of Product and Brand Management. Vol.: 38-51.

80
Malhotra, N. K., & Satyabhusan, D. ,2010. Marketing reserch an
appliedorientation.New Delhi: Pearson Education Inc.
Manoj , K.A. and Vithala, R.R. ,1996. An Empirical Comparison of Consumer-
Based Measures of Brand Equity. International Journal of Marketing Management,
Vol. 73: 237-247.
Mackay, M. M., 2001. Evaluation of Brand Equity Measures: Further Empirical
Results. The Journal of Product and Brand Management. Vol.: 38-51.
Machleit K. A., Wilson R. D.,1988..Emotional Feelings and Attitude Toward the
Advertisement: The Roles of Brand Familiarity and Repetition. Journal of
Advertising. Vol. 17: 27-35
Millward, R., 2010. The Variability of Attitudinal Repeat-Rates. International
Journal of Research in Marketing. Vol. 14: 437-50.
Mohommad, M. ,2010. Customer Satisfaction on line purchasing : A case study of
FMCG sector in Uk. International Journal of Marketing Management, Vol. 15: 47-
47.
Moore, K., & Reid, S., 2008. The birth of brand: 4000 years of branding. Business
History. Vol .5: 419-432.
Mojon, P. & Baehni, P. C., 1998. Effects of an oral health program on selected
clinical parameters and salivary bacteria in a long-term care facility. European
Journal of Oral Science. Vol. 106 : 827-834.
Morgan, R. P. ,2000. A consumer – oriented framework of brand equity and loyalty .
International Journal of marketing Research. Vol. 42: 65-78.
Netemeyer, R. G., Krishnan, B., Pullig, C., Wang, G., Yagci, M., Dean, D., Ricks, J.
& Wirth, F., 2004. Developing and Validating Measures of Facets of Customer-
based Brand Equity. Journal of Business Research. Vol. 57: 209-224.

81
Nunn, J., Morris, J., Pine, C., Pitts, N. B., Bradnock, G. & Steele, J.2000. The
condition of teeth in the UK in 1998 and implications for the further. British Dental
Journal, Vol. 189: 639-644.
Prasad, K., & Dev, C.S. (2000). Managing Brand Equity : A customer centric
framework for assessing performance. Journal of Marketing. Vol. 3:22-31.
Parck, C. S., & Sirinivasan, V. ,1994. A Survey-based method for measuring and
understanding brand equity and its extendibility. Journal of Marketing Research. Vol.
31: 271-288.
Perera, T., 2013. Toothpaste industry in Sri Lanka, Daily Financial Times, October
11.
Peiris, T.S.G., 2013. Factor Analysis – Exploratory Factor Analysis and
Confirmatory Factor Analysis, April 06.
Pike, S., 2007. Consumer – based brand equity for destinations: Practical
performance measures. Journal of travel & tourism Marketing. Vol.22:51-61.
Reed, M. W., 2006. Clinical evaluation of three concentrations of sodium fluoride in
dentifrices. The Journal of the American Dental Association, Vol.87: 1401-1403.
Roper, S., & Parker, C., 2006. Evolution of Branding Theory and Its Relevance to
the Independent Retail Sector. The Marketing Review. Vol. 6: 55-71
Roper,T.F, Stuart ,V, Parker,R and Cathy,D.A., 2006. Evolution of Branding Theory
and Its Relevance to the Independent Retail Sector. The Marketing Review. Vol.6:
55-71.
San, J., 2012. Global Toothpaste Market to Reach US$12.6 Billion by 2015,
According to New Report by Global Industry Analysts, Inc.
http://www.prweb.com/releases/toothpaste_oral_care/whitening_regular/prweb46619
14.htm. (Accessed April 2, 2014).

82
Saunders, M., Lewis, P., & Thornhill, A. (2000).Reserch methods for business
students. 3 rd ed.Harlow : prentice Hall.
Schwarz, E. and Wong, M.C., 1998. Prevention of early childhood caries – result of a
fluoride toothpaste demonstration trial on Chinese preschool children after three
years. Journal of Public Health Dentistry, Vol. 58: 12-18.
Sharma, R., 2012. Future Prospect of Indian Oral Care Industry.
http://www.sanasecurities.com/top-story/future-prospect-indian-oral-care-industry. .
(Accessed April 7, 2014).
Sharma, A., Krishnan, R., & Grewal, D. 2007. Value creation in markets: A critical
area of focus for business to business markets. Industrial Marketing Management.
Vol. 30: 391−402.
Sigeal, J., T. Erdem, J. Louviere, and C. Dubelaar 2002. The Equalization Price: A
Measure of Consumer-Perceived Brand Equity. International Journal of Research in
Marketing. Vol. 10 : 23-45.
Simon, C.J., and Sullivan,W.M., 1993. "The Measurement and Determinants of
Brand Equity: A Financial Approach." Marketing Science. Vol. 12: 28-52.
Simoes, D. and Dibb, S., 2001. Rethinking the brand concept: new brand orientation,
Journal of Marketing, Vol. 6: 217-24
Smith, D., & Whan, P., 2005, The Effects of Branding on Market Share and
Advertising Efficiency . Journal of Marketing Research. Vol. 29 : 296-314.
Smith, R., Wendell, P., 1996. Product Differentiation and Market Segmentation as
Alternative Market Strategies. Journal of Marketing. Vol.21: 3-8
Steele, J. G., 2000. Total tooth loss in the United Kingdom in 1998 and implications
for the future. British Dental Journal,Vol. 189: 598-603.
83
Stuart, W.G., The Role of Brands in Consumer Markets.
http://www.fee.org/the_freeman/detail/the-role-of-brands-in-consumer-markets/
(Accessed May 15, 2014).
Susan, G., 2013. What is Brand Equity? https://aytm.com/blog/research-
junction/brand-equity-basics-1/ (Accessed April 20, 2014).
Teas, R., & Grapentine, T.H., 1996. "Demystifying brand equity", Marketing
Research: A Magazine of Management & Applications. Vol. 8: 25-9.
Thomas, R., 2010. History of Toothpaste. http://www.toothpast.com/toothpaste-
history/history-of- toothpaste. (Accessed February 7, 2014).
Toussaint, J., 2009. A purchasing decision. Think value, not cost, in health-plan
decisions. Journal of Marketing Research, Vol.6: 39-48.
Vázquez, R., Río, A. B. D.,Thomas, R., & Iglesias, V., 2002. Consumer-based Brand
Equity: Development and Validation of a Measurement Instrument. Journal of
Marketing Management. Vol. 18: 27-48.
Walter, L. (2012). Products are made in the factory Brand are creating in the mind.
http://communications.webalue.com/2009/08/10/branding-quotes-products-are-
made-in-the-factory-but-brands-are-created-in-the-mind-walter-landor/ (Accessed
April 5, 2014).
Wood, L., 2000. Brands & Brand Equity: Definition and Management, Journal of
Management Decision, Vol.4:662-669.
Yasin, N.M., Noor, M.N., & Mohamad, O., 2007. Does image of country-of-origin
matter to brand equity? Journal of product and Brand Management. Vol.16:38-48.
Yoo, B., & Donthu, N., 2001. Developing and Validating a Multidimensional
Consumer-based Brand Equity Scale. Journal of Business Research. Vol.52 : 1-14.

84
APPENDIX 1: Letter to Customer
A survey on “Identifying key purchasing determinants and their
impact on brand equity of the tooth paste market in Sri Lanka”
Dear Sir / Madam,
This survey is carried out to identify the factors influencing with regard to key
purchasing determinants and their impact on brand equity of the tooth paste market
in Sri Lanka. I would appreciate if you could respond to all statements given in the
survey.
There are no right [or wrong] answers to these statements. What is needed is to state
your sincere opinion for the statements given. I assure you that your responses will
only be used for data analysis of the research and will be treated as strictly
confidential.
Thank you very much for your time and I value your participation very much.
Wasasntha Wijesinghe
St No: 128963K
MSc Student
University of Moratuwa.

85
APPENDIX 2: Questionnaire Survey
Part A
General information
(Please tick the appropriate place which best express your perception on the given
attribute)
1) How many times per day do you use toothpaste as a daily habit
One Time per day
Two Times per day
Three times per day
More Than Three times
2) Do you loyal to the particular brand of toothpaste
Yes
No
Part B
Benefits of consumer seek from purchase of toothpaste
3) Please mark degree of agreement for following statements (1= Strongly
Disareed,5= Strongly Agreed)
Preventing cavity of tooth paste is very important
Strongly Disagree-----------------------------------------------------------Strongly Agreed
1 2 3 4 5
Like to purchase toothpaste that gives shiny teeth
Strongly Disagree-----------------------------------------------------------Strongly Agreed
1 2 3 4 5
Toothpaste should be helped to strengthen gum
Strongly Disagree-----------------------------------------------------------Strongly Agreed

86
1 2 3 4 5
Freshness of breath is one of main attribute of toothpaste
Strongly Disagree-----------------------------------------------------------Strongly Agreed
1 2 3 4 5
Strengthen of enamel is important when selecting toothpaste
Strongly Disagree-----------------------------------------------------------Strongly Agreed
1 2 3 4 5
Attractive teeth is very important
Strongly Disagree-----------------------------------------------------------Strongly Agreed
1 2 3 4 5
Company image is consider when purchasing toothpaste
Strongly Disagree-----------------------------------------------------------Strongly Agreed
1 2 3 4 5
Price of the tooth paste is consider when purchasing toothpaste
Strongly Disagree-----------------------------------------------------------Strongly Agreed
1 2 3 4 5

87
Part C
Key purchasing Determinant of Tooth Paste & Brand Equity
Following statements are formulated in order to obtain your perceptions on fey
purchasing determinants on tooth paste brands based on brand equity. Please
indicate how far you agree [or disagree] with these statements with the tick mark in
appropriate box.
1) Do you consider branded (High brand equity) product of toothpaste in market
when purchasing?
Yes No
1.1) Preventing cavity attribute of tooth paste is mainly enhance the brand
equity
Highly Disagreed Disagree Agree Highly Agreed
1.2) Attribute of shiny teeth mainly effect for increase brand equity
Highly Disagreed Disagree Agree Highly Agreed
1.3) Brand equity will growth with attribute of strengthen gum in teeth
Highly Disagreed Disagree Agree Highly Agreed
1.4) Attribute of freshness of breath will enhance the brand equity
Highly Disagreed Disagree Agree Highly Agreed

88
1.5) Strengthen of enamel is important attribute assist to improve brand equity
Highly Disagreed Disagree Agree Highly Agreed
1.6) Attribute of attractive teeth is very important to enhance brand equity
Highly Disagreed Disagree Agree Highly Agreed
1.7) Company image is impact on brand equity
Highly Disagreed Disagree Agree Highly Agreed
1.8) Price of the tooth paste has relationship with brand equity
Highly Disagreed Disagree Agree Highly Agreed

89
Part D
Demographic Variables
Please mark with a [x] appropriately.
1). Gender
2). Marital status
3). Age Group
- Male - Female
- Married - Unmarried
- less than 25 - 26-35 - 36-45 - 46-54
- over 55
3). Education -Secondary -Diploma -Degree - Master
- Other
4). Monthly Income - less than 7,500
- 7,500 to 14,999
- 15,000 to 24,999
- 25,000 to 40,000
- More than 40,000
5). Profession -Unemployed
-Non Executive
-Executive
- Senior Management
- Other
THANK YOU

90